Embed Size (px)
Citation preview

O l k f C l fO l k f C l fAn Outlook for California An Outlook for California Specialty CropsSpecialty Crops in the Global in the Global
EEp y pp y p
EconomyEconomy
March 1, 2010March 1, 2010
William A. MatthewsU i i f C lif i A i l l I C dUniversity of California Agricultural Issues Center and
Agricultural and Resource Economics, UC, Davis

Export of California agriculture.p g
Current and future projections ofCurrent and future projections of the global economy.
Future trade potential for pCalifornia agriculture.
Value of California Exports
Destination for Exports
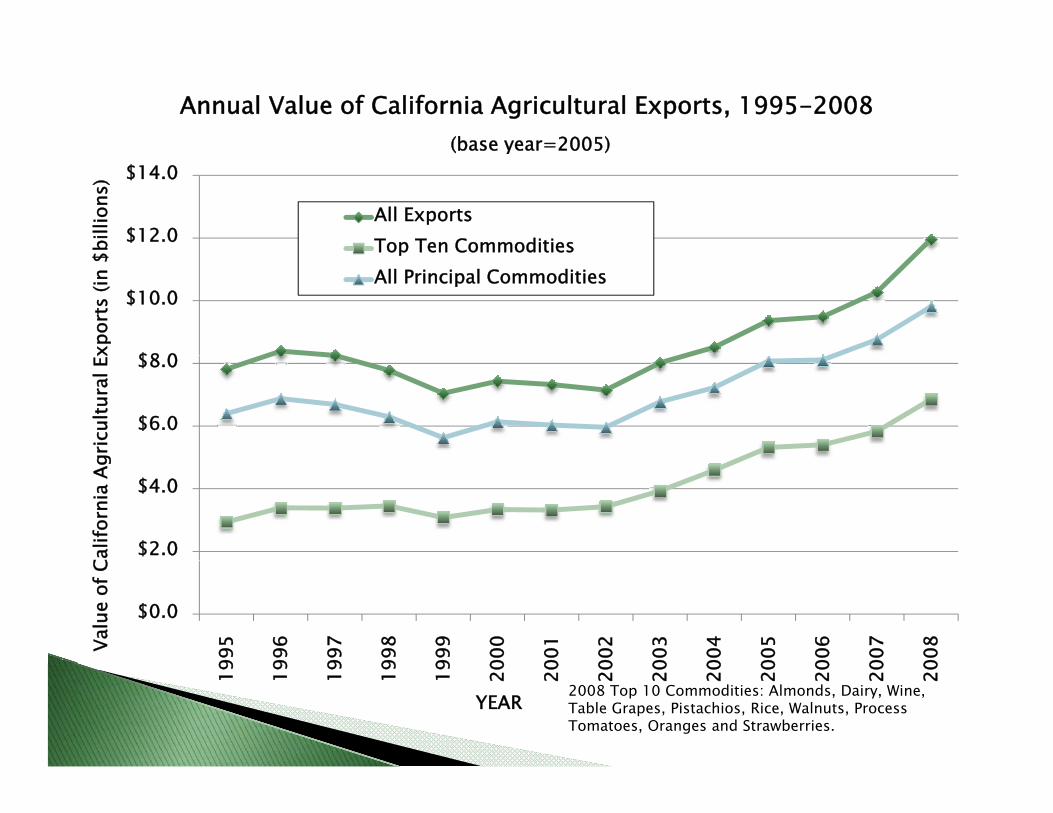
Annual Value of California Agricultural Exports, 1995-2008 (base year=2005)
$12.0
$14.0
billi
ons)
(base year 2005)
All ExportsTop Ten Commodities
$8 0
$10.0
xpor
ts (i
n $ p
All Principal Commodities
$6.0
$8.0
gric
ultu
ral E
x
$2.0
$4.0
Calif
orni
a Ag
$0.0
995
996
997
998
999
000
001
002
003
004
005
006
007
008Va
lue
of C
19 19 19 19 19 20 20 20 20 20 20 20 20 20
YEAR 2008 Top 10 Commodities: Almonds, Dairy, Wine, Table Grapes, Pistachios, Rice, Walnuts, Process Tomatoes, Oranges and Strawberries.
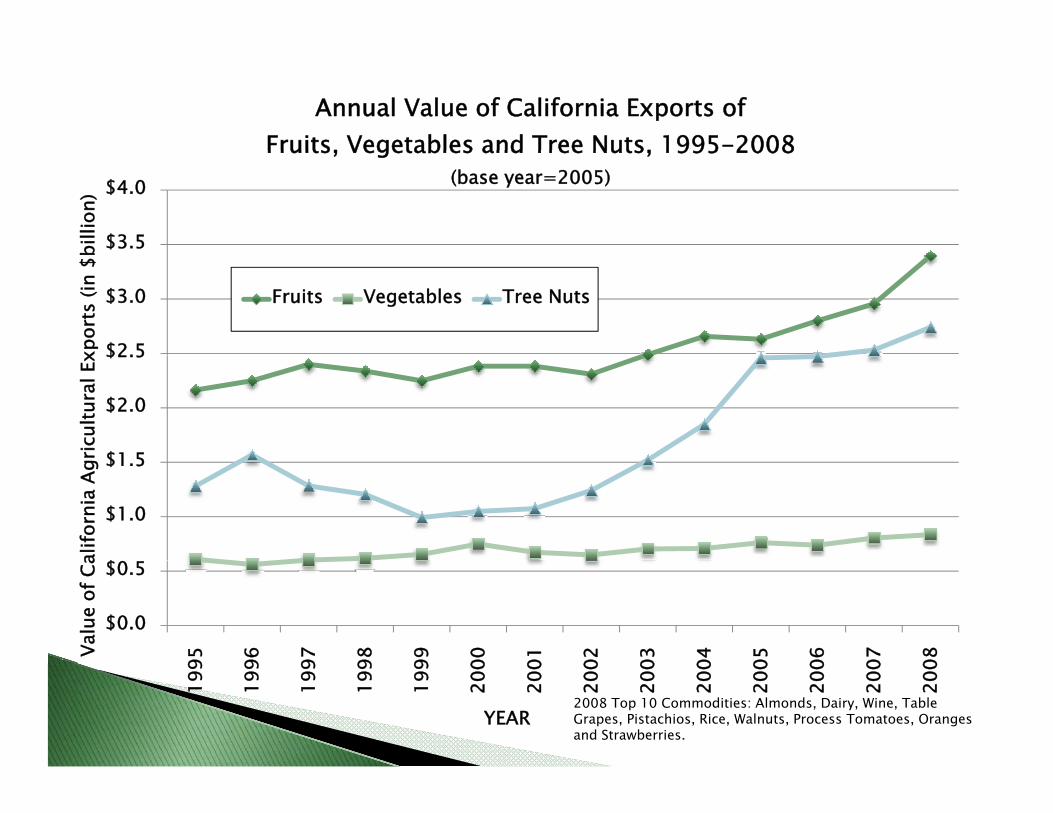
Annual Value of California Exports of Fruits, Vegetables and Tree Nuts, 1995-2008
$3.5
$4.0
billi
on)
Fruits, Vegetables and Tree Nuts, 1995 2008 (base year=2005)
$2.5
$3.0
xpor
ts (i
n $b
Fruits Vegetables Tree Nuts
$1 5
$2.0
$2.5
ricul
tura
l Ex
$
$1.0
$1.5
alifo
rnia
Ag
$0.0
$0.5
95 96 97 98 99 00 01 02 03 04 05 06 07 08
Valu
e of
Ca
199
199
199
199
199
200
200
200
200
200
200
200
200
200
YEAR2008 Top 10 Commodities: Almonds, Dairy, Wine, Table Grapes, Pistachios, Rice, Walnuts, Process Tomatoes, Oranges and Strawberries.

Share of Annual California Tree Nut Export Values by Variety
80%
90%
100%
e
60%
70%
80%
Expo
rt V
alue
40%
50%
f Tre
e N
ut E
20%
30%
Perc
ent o
f
0%
10%
95 96 97 98 99 00 01 02 03 04 05 06 07 08
199
199
199
199
199
200
200
200
200
200
200
200
200
200
YEARAlmonds Pistachios Walnuts
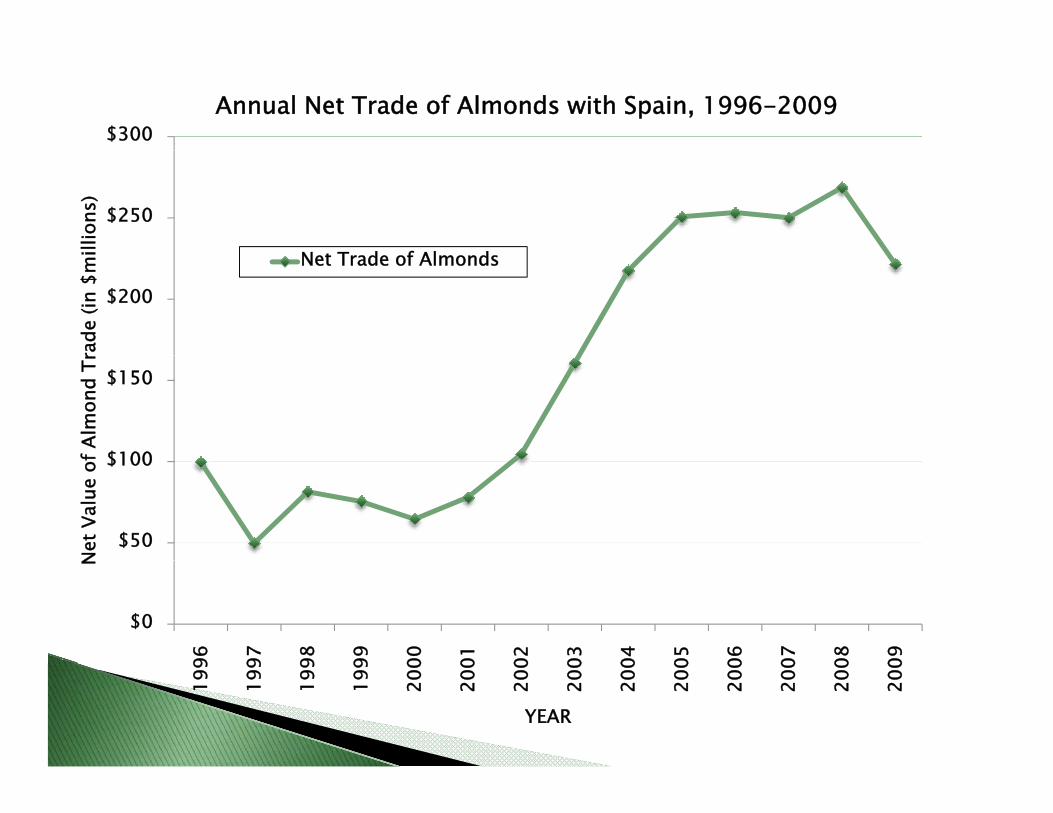
$300Annual Net Trade of Almonds with Spain, 1996-2009
$250
illio
ns)
N T d f Al d
$200
rade
(in
$mi Net Trade of Almonds
$100
$150
f Alm
ond
Tr
$50
$100
Net
Val
ue o
f
$0
96 97 98 99 00 01 02 03 04 05 06 07 08 09
N
199
199
199
199
200
200
200
200
200
200
200
200
200
200
YEAR

$900
Value of California Fruit Exports by Crop, 1995-2008 (base year=2005)
$
$800
$900
mill
ions
)
(base year 2005)
Table Grapes Oranges Strawberries Rasins WIne
$600
$700
port
s (in
$m
$400
$500
nia
Frui
t Exp
$200
$300
e of
Cal
iforn
$0
$100
5 6 7 8 9 0 1 2 3 4 5 6 7 8
Valu
e
199
199
199
199
199
200
200
200
200
200
200
200
200
200
YEAR
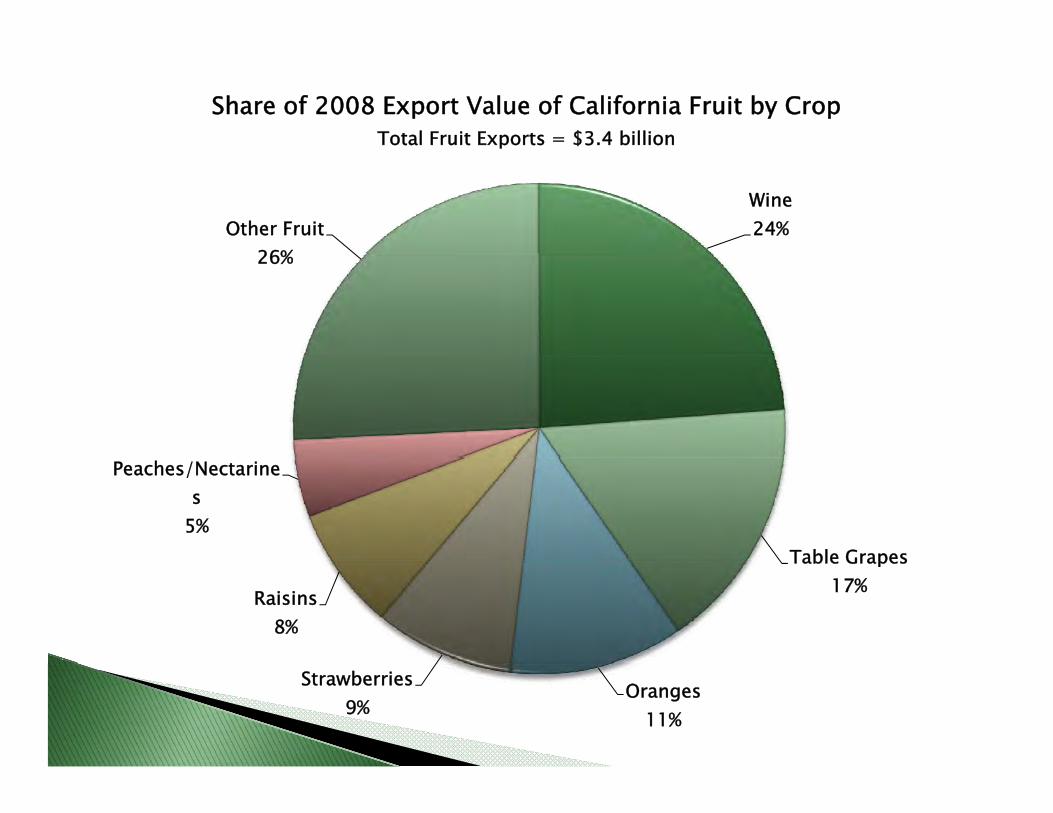
Share of 2008 Export Value of California Fruit by CropTotal Fruit Exports = $3.4 billion
Wine24%Other Fruit
26%26%
Table Grapes
Peaches/Nectarines
5%Table Grapes
17%Raisins8%
Oranges11%
Strawberries9%
$350
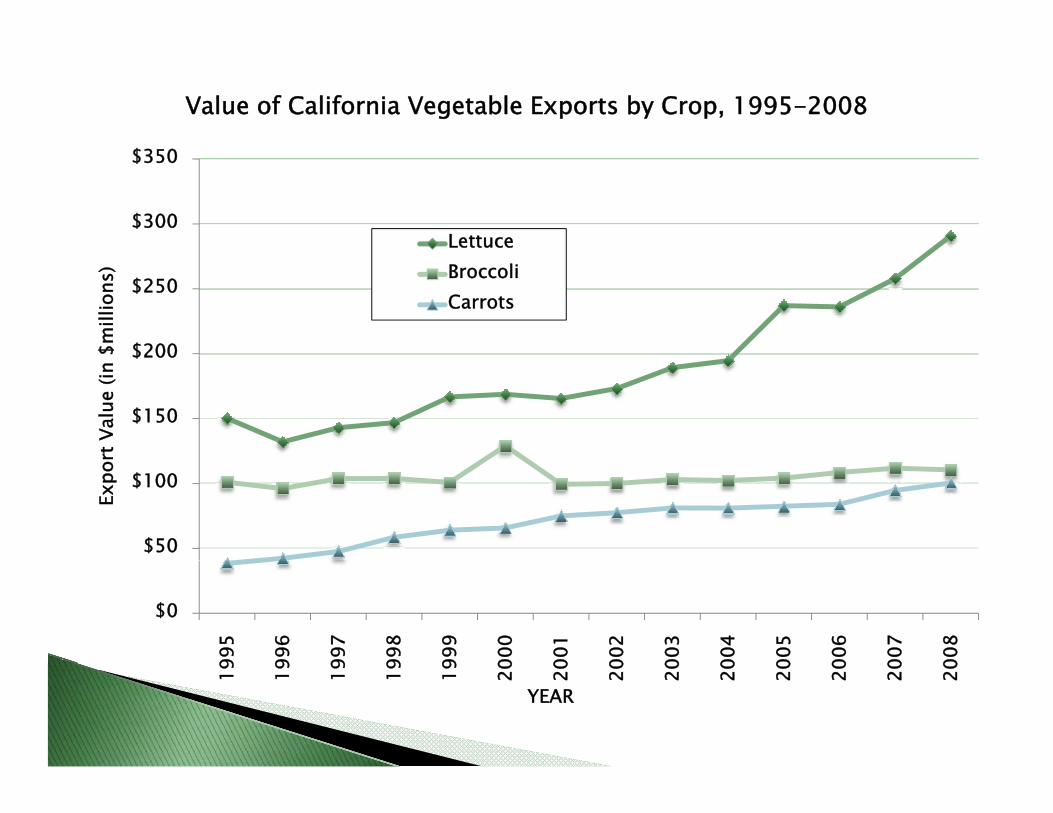
Value of California Vegetable Exports by Crop, 1995-2008
$300
$350
Lettuce
$200
$250
$mill
ions
) BroccoliCarrots
$150
$200
rt V
alue
(in
$50
$100
Expo
r
$0
995
996
997
998
999
000
001
002
003
004
005
006
007
008
19 19 19 19 19 20 20 20 20 20 20 20 20 20
YEAR

Share of 2008 Export Value of California Vegetables by CropTotal Vegetable Exports = $835 million
Other Vegetables25%
Lettuce35%
25%
Celery7%
Tomatoes, Fresh8%
Broccoli13%
Carrots12%
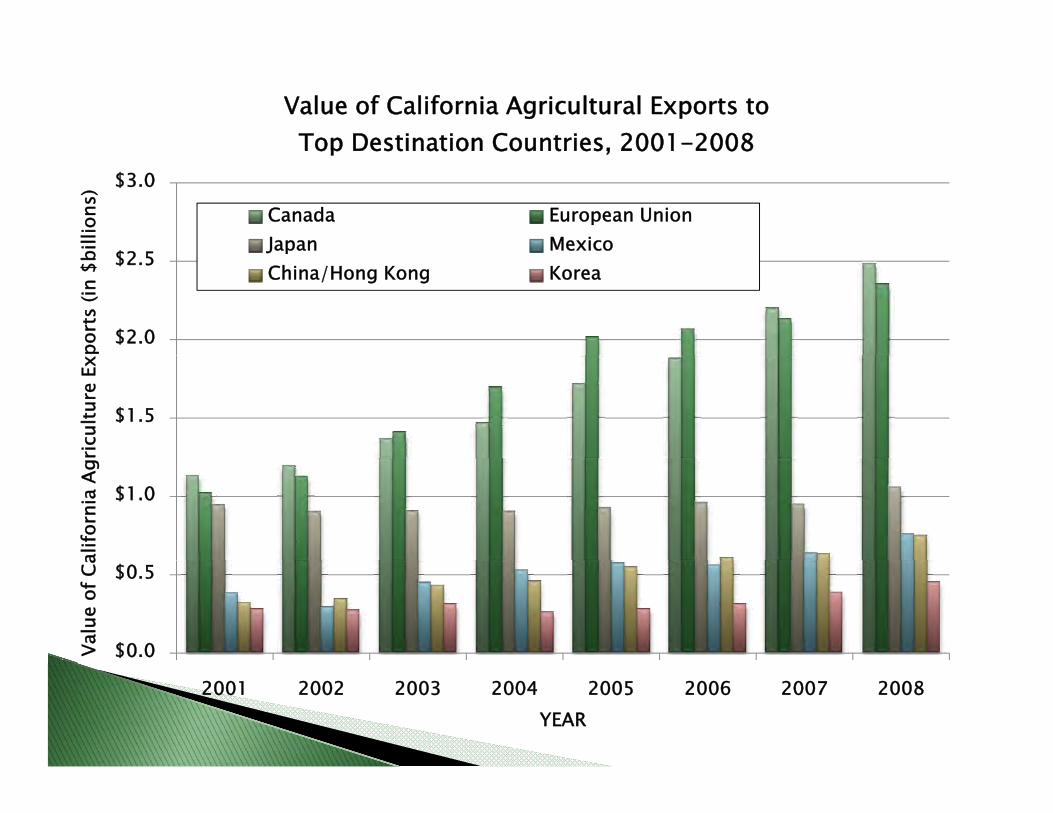
Value of California Agricultural Exports to Top Destination Countries, 2001-2008
$2 5
$3.0
billi
ons)
Top Destination Countries, 2001 2008
Canada European UnionJapan Mexico
$2.0
$2.5
port
s (in
$b J p
China/Hong Kong Korea
$1.5
ricul
ture
Ex
$1.0
alifo
rnia
Ag
$0.0
$0.5
Valu
e of
Ca
2001 2002 2003 2004 2005 2006 2007 2008YEAR

2007Product Category
European Union Canada JapanValue
($million)% Value
($million)% Value
($million)%
Animal Products $50.51 2.4% $115.29 5.2% $90.57 9.5%Field Crops $54.73 2.6% $196.31 8.8% $260.78 27.2%Fruits $213.42 10.0% $864.99 38.9% $308.17 32.2%Tree Nuts $1366.61 64.0% $199.36 9.0% $181.87 19.0%$ $ $Vegetables $15.71 0.7% $640.88 28.8% $58.80 6.1%Flowers and Nursery $9.20 0.4% $22.54 1.0% $1.90 0.2%Wine $423.90 19.9% $182.14 8.2% $55.12 5.8%
2008Product Category
European Union Canada JapanValue
($million)% Value
($million)% Value
($million)%
Animal Products $49.9 2.1% $140.6 5.6% $127.9 12.0%
Field Crops $127.9 5.4% $256.7 10.3% $330.5 31.0%
Fruits $303.4 12.9% $988.6 39.7% $317.5 29.8%
Tree Nuts $1,414.5 60.0% $196.1 7.9% $173.8 16.3%
Vegetables $14.4 0.6% $677.5 27.2% $57.6 5.4%
Flowers and Nursery $7.9 0.3% $24.1 1.0% $3.2 0.3%
Wine $437.6 18.6% $206.9 8.3% $54.6 5.1%


2008 2009 2010 projection 2011 projection
World 3 ‐0.8 3.9 4.3
Developed economies 0.5 ‐3.2 2.1 2.4
United States 0.4 ‐2.5 2.7 2.4
Euro area 0.6 ‐3.9 1 1.6
Japan ‐1.2 ‐5.3 1.7 2.2
Developing economies 6.1 2.1 6 6.3
Source: International Monetary Fund World Economic Outlook database, January 2010.

Annual GDP growth rates and projections for selected countries, 2003- 2011
4
6
GD
P
,
2
nsta
nt p
rice
2
0
2003
2004
2005
2006
2007
2008
2009
2010
2011
chan
ge, c
on
-4
-2
perc
enta
ge c
United States
Canada
Germany
-6
Annu
al p Japan
Mexico
-8Source: International Monetary Fund, World Economic Outlook Database, January 2010

Nominal exchange-rate indexes for largest trading partners, monthly January 2004 to February 2010
110
115
120monthly January 2004 to February 2010
100
105
110
00
90
95
Jan
2004
=1
75
80
85
J
Canada Eurozone Japan China
70
75
-04
-04
-05
-05
-06
-06
-07
-07
-08
-08
-09
-09
-10
Canada Eurozone Japan China
Jan- Jul-
Jan- Jul-
Jan- Jul-
Jan- Jul-
Jan- Jul-
Jan- Jul-
Jan-
Source: ERS

1.20Annual nominal and real exchange rates , 1990 - 2010
(Euro/$)
1.10
(Euro/$)
1.00
0.80
0.90
0.70Nominal exchange rate
0.60
990
992
994
996
998
000
002
004
006
008
010
Nominal exchange rate
19 19 19 19 19 20 20 20 20 20 20
Source: USDA ERS "Nominal Annual Country Exchange Rates" and "Real Annual Country Exchange Rates." Feb 17, 2010. http://www.ers.usda.gov/Data/ExchangeRates/Note: local currency per $US

Trade-weighted export exchange-rate indexes, monthly January 1999 to February 2010
120
130monthly January 1999 to February 2010
Almonds Grapes Lettuce
100
110
00
Almonds Grapes Lettuce
90
100
Jan-
99=
1
70
80
60
an-9
9pr
-99
ul-9
9ct
-99
an-0
0pr
-00
ul-0
0ct
-00
an-0
1pr
-01
ul-0
1ct
-01
an-0
2pr
-02
ul-0
2ct
-02
an-0
3pr
-03
ul-0
3ct
-03
an-0
4pr
-04
ul-0
4ct
-04
an-0
5pr
-05
ul-0
5ct
-05
an-0
6pr
-06
ul-0
6ct
-06
an-0
7pr
-07
ul-0
7ct
-07
an-0
8pr
-08
ul-0
8ct
-08
an-0
9pr
-09
ul-0
9ct
-09
an-1
0
Ja Ap Ju Oc Ja Ap Ju Oc Ja Ap Ju Oc Ja Ap Ju Oc Ja Ap Ju Oc Ja Ap Ju Oc Ja Ap Ju Oc Ja Ap Ju Oc Ja Ap Ju Oc Ja Ap Ju Oc Ja Ap Ju Oc Ja
Source: Export data from FAS, exchange-rate data from ERS

In 2 generations Korea’s economy went through changes that took 100 years in the U.S. and Europe.
In 1970 Korea Agriculture = 30% of Korea Economy In 2007 Agriculture = 3% KoreaEconomy. In 2007 Agriculture = 3% Korea Economy.

Source: Lee , H. and D.A. Sumner. 2007. The Prospective Free Trade Agreement with Korea: Background, Analysis and Perspectives for California Agriculture.

f Tar
iff
t Sha
re o
fPe
rcen
tLi
nes
T iff RTariff Rate BracketSource: Lee , H. and D.A. Sumner. 2007. The Prospective Free Trade Agreement with Korea:
Background, Analysis and Perspectives for California Agriculture.

Average Agricultural Tariff in Korea = 62%Average Agricultural Tariff applied by U.S. = 12%I i l i fIn many cases, potential imports from California agriculture face tariffs of more than 30 percent30 percent.◦ Table grapes, Almonds, Lettuce tariff rates = 45%-
50%

California Agricultural Exports to Korea 2001 2008
$450
$500
Exports to Korea, 2001-2008
All Agriculture Trade
$350
$400
$450
MIL
LIO
N) Fruits
$250
$300
PORT
S (IN
$
$100
$150
$200
ALUE
OF
EXP
$0
$50
$100
VA
2001 2002 2003 2004 2005 2006 2007 2008
YEAR

Commodity Rank Share of Export Value
Oranges 2 22%Grape Juice 2 41%Grapefruit 3 12%Grapefruit 3 12%Walnuts 4 9%Cherries 5 8%Lemons 5 5%Lemons 5 5%
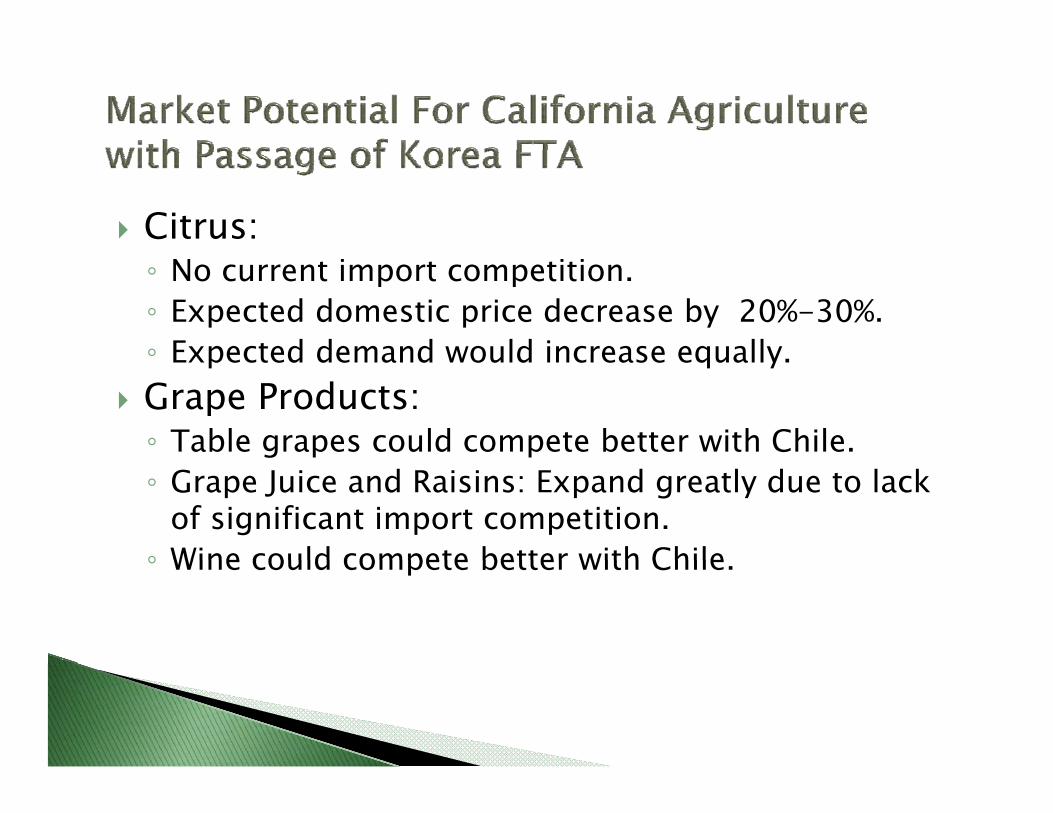
Citrus:◦ No current import competition. ◦ Expected domestic price decrease by 20%-30%.◦ Expected demand would increase equally◦ Expected demand would increase equally.Grape Products:◦ Table grapes could compete better with Chile.◦ Grape Juice and Raisins: Expand greatly due to lack
of significant import competition. ◦ Wine could compete better with Chile◦ Wine could compete better with Chile.

Fruits and Berries◦ Currently stone fruits and cherries are not a
significant part of Korean market.◦ Elimination of 24%-50% tariff would greatly expandElimination of 24% 50% tariff would greatly expand
market potential. Canned peaches are big part of Korean diet. Elimination of 50% tariff would allow CaliforniaElimination of 50% tariff would allow California peaches a significant price advantage over current imports from South Africa, Greece, and China. Same for PearsSame for Pears.

Vegetables◦ Even with 45% tariff Korea still imports Lettuce from
CaliforniaCalifornia.◦ Elimination of tariff could expand greatly the export
of lettuce and other leafy greens to Korean Market. Tree Nuts ◦ Already big presence in Korea market, could
potentially expand rapidly with elimination ofpotentially expand rapidly with elimination of tariffs.

“For agricultural products, the FTA would immediately eliminate or phase out tariffs and quotas on a broad range of products withquotas on a broad range of products, with almost two-thirds (by value) of Korea's agriculture imports from the United States becoming duty free upon entry into force.”
California continues to be competitive in international agricultural trade.
D i i i h fDespite recent economic issues, the future for California exports remains positive.
Ratification of Korea FTA could have significant economic impact for Californiasignificant economic impact for California agriculture.