Embed Size (px)
Citation preview
Zurich Open Repository andArchiveUniversity of ZurichMain LibraryStrickhofstrasse 39CH-8057 Zurichwww.zora.uzh.ch
Year: 2013
An off-center density peak in the Milky Way’s dark matter halo?
Kuhlen, Michael ; Guedes, Javiera ; Pillepich, Annalisa ; Madau, Piero ; Mayer, Lucio
Abstract: We show that the position of the central dark matter (DM) density peak may be expectedto differ from the dynamical center of the Galaxy by several hundred parsecs. In Eris, a high-resolutioncosmological hydrodynamics simulation of a realistic Milky-Way-analog disk galaxy, this offset is 300-400pc ( 3 gravitational softening lengths) after z = 1. In its dissipationless DM-only twin simulation ErisDark,as well as in the Via Lactea II and GHalo simulations, the offset remains below one softening length formost of its evolution. The growth of the DM offset coincides with a flattening of the central DM densityprofile in Eris inward of 1 kpc, and the direction from the dynamical center to the point of maximumDM density is correlated with the orientation of the stellar bar, suggesting a bar-halo interaction as apossible explanation. A DM density offset of several hundred parsecs greatly affects expectations of theDM annihilation signals from the Galactic center. It may also support a DM annihilation interpretationof recent reports by Weniger and Su Finkbeiner of highly significant 130 GeV gamma-ray line emissionfrom a region 1.°5 ( 200 pc projected) away from Sgr A* in the Galactic plane.
DOI: https://doi.org/10.1088/0004-637X/765/1/10
Posted at the Zurich Open Repository and Archive, University of ZurichZORA URL: https://doi.org/10.5167/uzh-90712Journal ArticleAccepted Version
Originally published at:Kuhlen, Michael; Guedes, Javiera; Pillepich, Annalisa; Madau, Piero; Mayer, Lucio (2013). An off-centerdensity peak in the Milky Way’s dark matter halo? Astrophysical Journal, 765(1):10.DOI: https://doi.org/10.1088/0004-637X/765/1/10
Draft version February 6, 2013Preprint typeset using LATEX style emulateapj v. 5/2/11
AN OFF-CENTER DENSITY PEAK IN THE MILKY WAY’S DARK MATTER HALO?
Michael Kuhlen1, Javiera Guedes2, Annalisa Pillepich3, Piero Madau3, and Lucio Mayer4
1Theoretical Astrophysics Center, University of California Berkeley, Hearst Field Annex, Berkeley, CA 947202ETH Zurich, Institute for Astronomy, Wolfgang-Pauli-Strasse 27, Zurich 8049, Switzerland
3Department of Astronomy & Astrophysics, University of California Santa Cruz, 1156 High St., Santa Cruz, CA 950644University of Zurich, Institute for Theoretical Physics, Zurich 8057, Switzerland
Draft version February 6, 2013
ABSTRACT
We show that the position of the central dark matter density peak may be expected to differ fromthe dynamical center of the Galaxy by several hundred parsec. In Eris, a high resolution cosmologicalhydrodynamics simulation of a realistic Milky-Way-analog disk galaxy, this offset is 300 - 400 pc (∼ 3gravitational softening lengths) after z = 1. In its dissipationless dark-matter-only twin simulationErisDark, as well as in the Via Lactea II and GHalo simulations, the offset remains below one softeninglength for most of its evolution. The growth of the DM offset coincides with a flattening of the centralDM density profile in Eris inwards of ∼ 1 kpc, and the direction from the dynamical center to thepoint of maximum DM density is correlated with the orientation of the stellar bar, suggesting a bar-halo interaction as a possible explanation. A dark matter density offset of several hundred parsecgreatly affects expectations of the dark matter annihilation signals from the Galactic Center. It mayalso support a dark matter annihilation interpretation of recent reports by Weniger (2012) and Su &Finkbeiner (2012) of highly significant 130 GeV gamma-ray line emission from a region 1.5◦ (∼ 200parsec projected) away from Sgr A* in the Galactic plane.
1. INTRODUCTION
Dissipationless (dark matter only) N-body simulationspredict a nearly universal density profile of dark matter(DM) halos, the so-called NFW profile (Navarro et al.1997), which features a central 1/r density cusp. If thecooling and condensation of gas inside these halos (White& Rees 1978; Fall & Efstathiou 1980) is gradual, then so-called “adiabatic contraction” (Blumenthal et al. 1986;Gnedin et al. 2004) will pull DM into the central regions,thereby increasing the central DM density and furthersteepening the slope of its density profile. It is thus nat-ural to expect the maximum of the DM density to occurat the dynamical center of a galaxy, the lowest point ofits gravitational potential. This expectation has madethe Galactic Center (GC) a preferred target for indirectDM detection efforts searching for an annihilation sig-nal (Bergstrom et al. 1998; Gondolo & Silk 1999; Aha-ronian et al. 2006; Baltz et al. 2008; Danninger & theIceCube collaboration 2012).As data from the Fermi Gamma-ray Space Telescope
(Atwood et al. 2009) has been accumulating, the numberof studies reporting gamma-ray “excesses” or “anoma-lies” from the GC, that could be interpreted as a DMannihilation signal, has steadily grown (see e.g. Good-enough & Hooper 2009; Hooper & Goodenough 2011;Hooper & Linden 2011; Abazajian & Kaplinghat 2012).These analyses have searched for the broad gamma-raycontinuum signal thought to arise from the decay andhadronization of DM annihilation products (Bergstromet al. 1998). While this is expected to be the dominantDM annihilation signature, it is unfortunately difficultto distinguish it from conventional sources (e.g. milli-second pulsars, Abazajian 2011, or cosmic-ray interac-tions with molecular clouds, Yusef-Zadeh et al. 2012),
and at present a purely astrophysical explanation of thesesignals cannot be excluded.More recently, however, there have been surprising
reports of a highly statistically significant line-like fea-ture at ∼ 130 GeV in Fermi data from the GC (Bring-mann et al. 2012; Weniger 2012; Su & Finkbeiner 2012).Although such a DM annihilation line should be loop-suppressed by a factor ∼ 102 − 104 compared to the ex-pected continuum gamma-ray production in typical DMmodels, the fact that it is difficult to produce such ahigh energy line with astrophysical processes (however,see Aharonian et al. 2012) has motivated further ex-ploration of the DM annihilation explanation. In fact,DM particle physics models do exist in which the contin-uum is suppressed with respect to the line emission (e.g.Cline 2012; Buckley & Hooper 2012; Bergstrom 2012;Dudas et al. 2012; Chalons et al. 2012). In the analy-sis of Su & Finkbeiner (2012), the line’s significance ismaximized at Galactic coordinates (ℓ, b) = (1.5◦, 0◦), i.e.displaced from Sgr A*, the presumed dynamical centerof the Galaxy, by about 200 projected parsec in the diskplane (see also Tempel et al. 2012). This offset has beenviewed as a strike against a DM annihilation interpre-tation of the line signal. It is possible that the offset issimply due to small number statistics (Yang et al. 2012),but nevertheless it is commonly viewed as a strike againsta DM annihilation interpretation of the line signal.On the other hand, the GC is a dynamically and ener-
getically complex region (Genzel et al. 2010). It harborsa supermassive black hole (SMBH) (Ghez et al. 2008;Gillessen et al. 2009), which may have been active as re-cently as 10 Myr ago, if the giant Fermi bubbles (Dobleret al. 2010; Su et al. 2010) are interpreted as resultingfrom a black hole accretion event; it is rich in massiveyoung stars (Bartko et al. 2009), which likely formed ina single star burst event 6± 2 Myr ago (Paumard et al.
arX
iv:1
208.
4844
v2 [
astr
o-ph
.GA
] 5
Feb
201
3
2
2006); it hosts plenty of highly energetic compact objectsradiating in X-rays and gamma-rays (Muno et al. 2003,2005; Abazajian 2011); and on ∼kpc scales, its gravi-tational potential is non-axisymmetric due to the pres-ence of a stellar bar and a boxy bulge (Blitz & Spergel1991; Martinez-Valpuesta & Gerhard 2011). Given thatour Galaxy is baryon-dominated inwards of ∼ 5 − 10kpc (Klypin et al. 2002), one might expect astrophysicalprocesses to modify the underlying DM distribution insignificant ways. In principle these processes may evendisplace the maximum of the DM density away from thedynamical center, thus greatly affecting the expected DMannihilation signal from the GC.In isolated galaxy simulations, resonant interactions
between the stellar bar and the DM halo have been shownto alter the shape of DM halos reducing their triaxiality(Berentzen et al. 2006; Machado & Athanassoula 2010),and to flatten a central cusp into a core (Weinberg &Katz 2002; Athanassoula 2003; Holley-Bockelmann et al.2005; Weinberg & Katz 2007). The latter results remaincontroversial, however, since other numerical studies donot see such strong effects (Sellwood 2003; Valenzuela& Klypin 2003; Colın et al. 2006). Regarding an off-center DM density peak, these interactions are interest-ing because they may also induce a “dark bar” and othernon-axisymmetric perturbations in the DM (Athanas-soula 2002; Ceverino & Klypin 2007; McMillan & Dehnen2005).External gravitational perturbations, for example dur-
ing a merger or a near passage of a satellite galaxy, coulddisplace the tightly-bound baryonic component from thecenter of the overall mass distribution (the DM halo).Such offsets have been measured in galaxy clusters (Allen1998), in which separations between the center of the X-ray emitting gas and the gravitational center determinedfrom strong lensing can be as large as ∼ 30 kpc for re-laxed clusters (Shan et al. 2010). A study of THINGSgalaxies by Trachternach et al. (2008) found that offsetsbetween the photometric and dynamical centers were lessthan one radio beam width (∼ 10′′ or 150 − 700 pc) for13 out of 15 galaxies with well-constrained photometriccenters. However, two galaxies in their sample, NGC3627 (a barred Sb galaxy showing signs of a recent in-teraction) and NGC 6946 (a barred Scd galaxy), exhibitmoderate offsets between one and two beam widths.An offset DM density peak may be a reflection of an in-
trinsic lopsidedness in the Galaxy (Saha et al. 2009). Infact, disk galaxies commonly exhibit substantial asym-metry in the central regions of their light distribution(for a review, see Jog & Combes 2009). The origin ofthese asymmetries is not fully understood, with tidal en-counters, gas accretion, and a global gravitational in-stability being some of the physical mechanisms underconsideration. The central regions of advanced galaxymergers often show long-lived unsettled sloshing behav-ior (Schweizer 1996; Jog & Maybhate 2006), and even inisolated galaxies the dynamical center can remain unre-laxed for many dynamical times (Miller & Smith 1992),especially in systems with a cored mass distribution.Supernova- or AGN-driven gas outflows may rapidly
and non-adiabatically alter the potential in the centralregions of proto-galaxies, prior to the formation of thebulk of their stars. Repeated episodes of such impulsiveoutflows, followed by slow adiabatic re-accretion of gas,
may irreversibly transfer energy to the DM, flatteningthe central cusp in the process (Read & Gilmore 2005;Pontzen & Governato 2012). Although this effect maynot by itself produce an off-center DM density peak, theresulting cored density profile will be more susceptible toperturbations.Lastly, the presence of a SMBH has been argued to
lead to the formation of a steep cusp of DM (Gondolo &Silk 1999; Gnedin & Primack 2004) in the inner parseccentered on the SMBH. This would obviously precludeany significant offset between the peak in DM annihila-tion signal and Sgr A*.In this work we report on the search for the presence of
an offset between the dynamical center and the maximumDM density in the Eris simulation (Guedes et al. 2011),one of the highest resolution and most realistic cosmo-logical simulations of the formation of a Milky-Way-likebarred spiral galaxy. We find evidence for such an off-set, at a scale of 300− 400 pc, consistent with the offsetseen by Su & Finkbeiner (2012). Since such an offset isonly seen in the dissipational hydrodynamic simulations,and not in our collisionless pure-DM runs, we suggestthat baryonic physics is in some way responsible for itsformation. We examine a number of different physicalmechanisms, but the limited resolution of this study doesnot allow us to conclusively settle on a single preferredexplanation. At this stage, we wish to draw attention tothe possibility of the maximum DM density (and henceannihilation luminosity) not being coincident with thedynamical center of our Galaxy, commonly associatedwith Sgr A*. We hope that our results will stimulatefuture work, examining other high resolution hydrody-namic galaxy formation simulations, and investigating inmore detail the physical mechanisms that can give riseto an offset DM density peak.The remainder of this paper is organized as follows. In
Section 2 we describe the numerical simulations that wehave analyzed. In Section 3 we present the evidence fora DM offset in the Eris simulation. In Section 4 we goover several possible formation mechanisms and confronteach of them with data from the simulations. In Section5 we discuss implications for indirect detection searchestowards the GC, and finally in Section 6 we present ourconclusions.
2. SIMULATIONS
Our analysis makes use of four cosmological zoom-insimulations of the formation and evolution of a Milky-Way-analog galaxy: one DM+hydrodynamics simula-tion, “Eris” (Guedes et al. 2011); and three pure-DMdissipationless simulations, “ErisDark” (Pillepich et al.,in prep.), “Via Lactea II” (Diemand et al. 2008), and“GHalo” (Stadel et al. 2009). Details of these simula-tions are presented in the listed references, and we onlybriefly summarize their salient features here. Eris and itsDM-only twin ErisDark were run with the N-body+SPHcode Gasoline (Wadsley et al. 2004), but only Eris uti-lized the SPH hydrodynamics. Eris resolves the forma-tion and evolution of a galaxy with 1.3 × 10⁷ high res-olution DM particles of mass 9.8 × 10⁴ M⊙ and a simi-lar number of SPH gas particles with an initial mass of1.2.1 × 104 M⊙. Gravitational interactions are softenedusing a cubic spline density kernel of length ǫsoft = 124
Kuhlen et al. 3
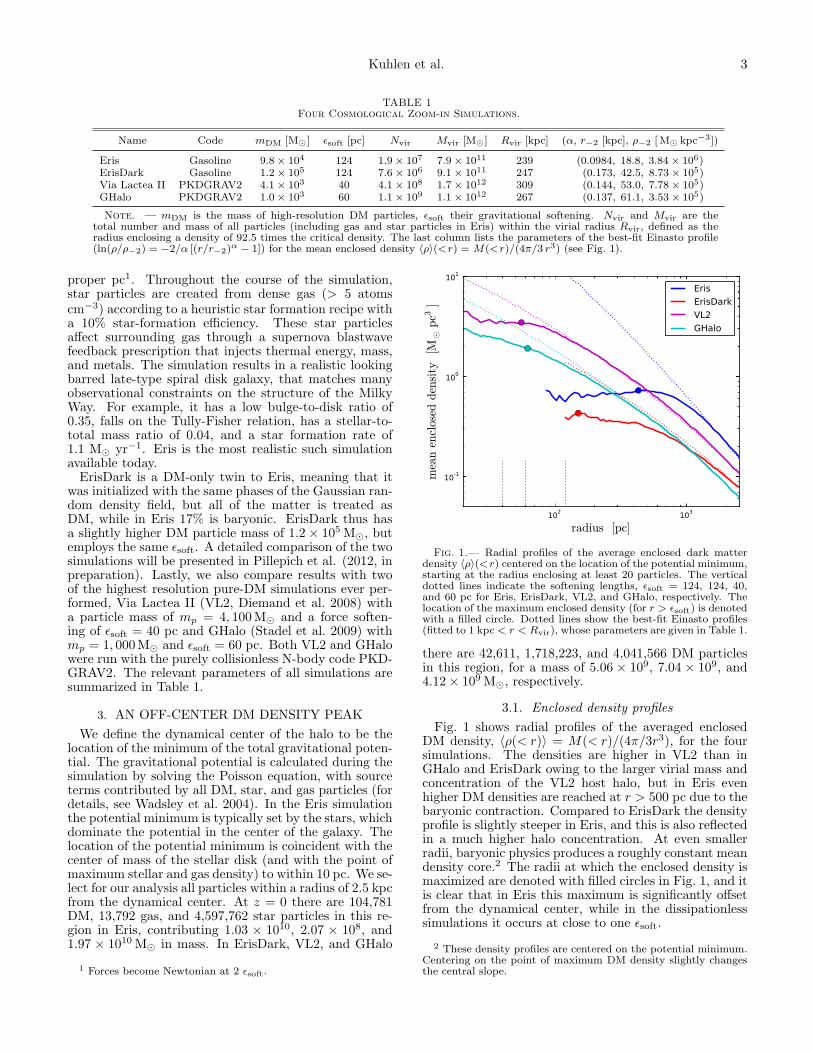
TABLE 1Four Cosmological Zoom-in Simulations.
Name Code mDM [M⊙] ǫsoft [pc] Nvir Mvir [M⊙] Rvir [kpc] (α, r−2 [kpc], ρ−2 [M⊙ kpc−3])
Eris Gasoline 9.8× 10⁴ 124 1.9× 10⁷ 7.9× 10¹¹ 239 (0.0984, 18.8, 3.84× 10⁶)ErisDark Gasoline 1.2× 10⁵ 124 7.6× 10⁶ 9.1× 10¹¹ 247 (0.173, 42.5, 8.73× 10⁵)Via Lactea II PKDGRAV2 4.1× 10³ 40 4.1× 10⁸ 1.7× 10¹² 309 (0.144, 53.0, 7.78× 10⁵)GHalo PKDGRAV2 1.0× 10³ 60 1.1× 10⁹ 1.1× 10¹² 267 (0.137, 61.1, 3.53× 10⁵)
Note. — mDM is the mass of high-resolution DM particles, ǫsoft their gravitational softening. Nvir and Mvir are thetotal number and mass of all particles (including gas and star particles in Eris) within the virial radius Rvir, defined as theradius enclosing a density of 92.5 times the critical density. The last column lists the parameters of the best-fit Einasto profile(ln(ρ/ρ−2) = −2/α [(r/r−2)α − 1]) for the mean enclosed density 〈ρ〉(<r) = M(<r)/(4π/3 r3) (see Fig. 1).
proper pc1. Throughout the course of the simulation,star particles are created from dense gas (> 5 atomscm−3) according to a heuristic star formation recipe witha 10% star-formation efficiency. These star particlesaffect surrounding gas through a supernova blastwavefeedback prescription that injects thermal energy, mass,and metals. The simulation results in a realistic lookingbarred late-type spiral disk galaxy, that matches manyobservational constraints on the structure of the MilkyWay. For example, it has a low bulge-to-disk ratio of0.35, falls on the Tully-Fisher relation, has a stellar-to-total mass ratio of 0.04, and a star formation rate of1.1 M⊙ yr−1. Eris is the most realistic such simulationavailable today.ErisDark is a DM-only twin to Eris, meaning that it
was initialized with the same phases of the Gaussian ran-dom density field, but all of the matter is treated asDM, while in Eris 17% is baryonic. ErisDark thus hasa slightly higher DM particle mass of 1.2× 10⁵ M⊙, butemploys the same ǫsoft. A detailed comparison of the twosimulations will be presented in Pillepich et al. (2012, inpreparation). Lastly, we also compare results with twoof the highest resolution pure-DM simulations ever per-formed, Via Lactea II (VL2, Diemand et al. 2008) witha particle mass of mp = 4, 100M⊙ and a force soften-ing of ǫsoft = 40 pc and GHalo (Stadel et al. 2009) withmp = 1, 000M⊙ and ǫsoft = 60 pc. Both VL2 and GHalowere run with the purely collisionless N-body code PKD-GRAV2. The relevant parameters of all simulations aresummarized in Table 1.
3. AN OFF-CENTER DM DENSITY PEAK
We define the dynamical center of the halo to be thelocation of the minimum of the total gravitational poten-tial. The gravitational potential is calculated during thesimulation by solving the Poisson equation, with sourceterms contributed by all DM, star, and gas particles (fordetails, see Wadsley et al. 2004). In the Eris simulationthe potential minimum is typically set by the stars, whichdominate the potential in the center of the galaxy. Thelocation of the potential minimum is coincident with thecenter of mass of the stellar disk (and with the point ofmaximum stellar and gas density) to within 10 pc. We se-lect for our analysis all particles within a radius of 2.5 kpcfrom the dynamical center. At z = 0 there are 104,781DM, 13,792 gas, and 4,597,762 star particles in this re-gion in Eris, contributing 1.03 × 10¹⁰, 2.07 × 10⁸, and1.97 × 1010 M⊙ in mass. In ErisDark, VL2, and GHalo
1 Forces become Newtonian at 2 ǫsoft.
102 103
radius [pc]
10-1
100
101
meanen
closed
den
sity
[M⊙pc3
]
ErisErisDarkVL2GHalo
Fig. 1.— Radial profiles of the average enclosed dark matterdensity 〈ρ〉(<r) centered on the location of the potential minimum,starting at the radius enclosing at least 20 particles. The verticaldotted lines indicate the softening lengths, ǫsoft = 124, 124, 40,and 60 pc for Eris, ErisDark, VL2, and GHalo, respectively. Thelocation of the maximum enclosed density (for r > ǫsoft) is denotedwith a filled circle. Dotted lines show the best-fit Einasto profiles(fitted to 1 kpc < r < Rvir), whose parameters are given in Table 1.
there are 42,611, 1,718,223, and 4,041,566 DM particlesin this region, for a mass of 5.06 × 10⁹, 7.04 × 10⁹, and4.12× 109 M⊙, respectively.
3.1. Enclosed density profiles
Fig. 1 shows radial profiles of the averaged enclosedDM density, 〈ρ(< r)〉 = M(< r)/(4π/3r3), for the foursimulations. The densities are higher in VL2 than inGHalo and ErisDark owing to the larger virial mass andconcentration of the VL2 host halo, but in Eris evenhigher DM densities are reached at r > 500 pc due to thebaryonic contraction. Compared to ErisDark the densityprofile is slightly steeper in Eris, and this is also reflectedin a much higher halo concentration. At even smallerradii, baryonic physics produces a roughly constant meandensity core.2 The radii at which the enclosed density ismaximized are denoted with filled circles in Fig. 1, and itis clear that in Eris this maximum is significantly offsetfrom the dynamical center, while in the dissipationlesssimulations it occurs at close to one ǫsoft.
2 These density profiles are centered on the potential minimum.Centering on the point of maximum DM density slightly changesthe central slope.
4
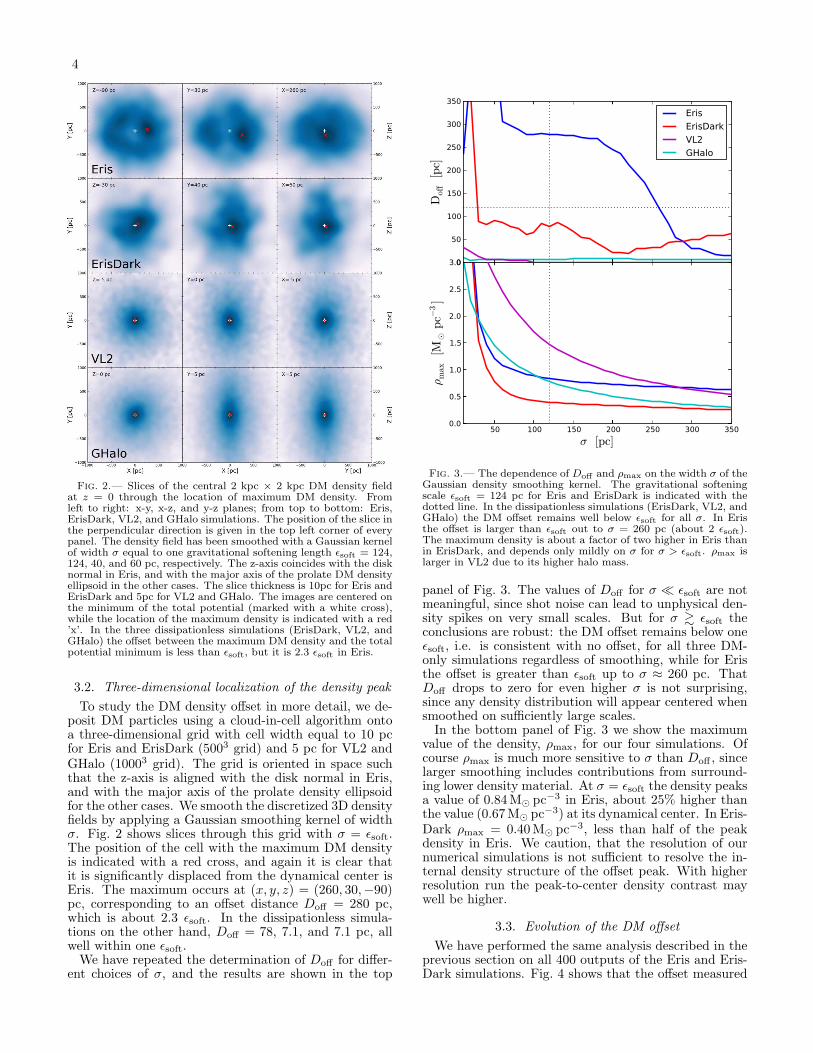
Fig. 2.— Slices of the central 2 kpc × 2 kpc DM density fieldat z = 0 through the location of maximum DM density. Fromleft to right: x-y, x-z, and y-z planes; from top to bottom: Eris,ErisDark, VL2, and GHalo simulations. The position of the slice inthe perpendicular direction is given in the top left corner of everypanel. The density field has been smoothed with a Gaussian kernelof width σ equal to one gravitational softening length ǫsoft = 124,124, 40, and 60 pc, respectively. The z-axis coincides with the disknormal in Eris, and with the major axis of the prolate DM densityellipsoid in the other cases. The slice thickness is 10pc for Eris andErisDark and 5pc for VL2 and GHalo. The images are centered onthe minimum of the total potential (marked with a white cross),while the location of the maximum density is indicated with a red’x’. In the three dissipationless simulations (ErisDark, VL2, andGHalo) the offset between the maximum DM density and the totalpotential minimum is less than ǫsoft, but it is 2.3 ǫsoft in Eris.
3.2. Three-dimensional localization of the density peak
To study the DM density offset in more detail, we de-posit DM particles using a cloud-in-cell algorithm ontoa three-dimensional grid with cell width equal to 10 pcfor Eris and ErisDark (5003 grid) and 5 pc for VL2 andGHalo (10003 grid). The grid is oriented in space suchthat the z-axis is aligned with the disk normal in Eris,and with the major axis of the prolate density ellipsoidfor the other cases. We smooth the discretized 3D densityfields by applying a Gaussian smoothing kernel of widthσ. Fig. 2 shows slices through this grid with σ = ǫsoft.The position of the cell with the maximum DM densityis indicated with a red cross, and again it is clear thatit is significantly displaced from the dynamical center isEris. The maximum occurs at (x, y, z) = (260, 30,−90)pc, corresponding to an offset distance Doff = 280 pc,which is about 2.3 ǫsoft. In the dissipationless simula-tions on the other hand, Doff = 78, 7.1, and 7.1 pc, allwell within one ǫsoft.We have repeated the determination of Doff for differ-
ent choices of σ, and the results are shown in the top
0
50
100
150
200
250
300
350
Doff
[pc]
ErisErisDarkVL2GHalo
50 100 150 200 250 300 350σ [pc]
0.0
0.5
1.0
1.5
2.0
2.5
3.0
ρmax
[M⊙pc−
3]
Fig. 3.— The dependence of Doff and ρmax on the width σ of theGaussian density smoothing kernel. The gravitational softeningscale ǫsoft = 124 pc for Eris and ErisDark is indicated with thedotted line. In the dissipationless simulations (ErisDark, VL2, andGHalo) the DM offset remains well below ǫsoft for all σ. In Eristhe offset is larger than ǫsoft out to σ = 260 pc (about 2 ǫsoft).The maximum density is about a factor of two higher in Eris thanin ErisDark, and depends only mildly on σ for σ > ǫsoft. ρmax islarger in VL2 due to its higher halo mass.
panel of Fig. 3. The values of Doff for σ ≪ ǫsoft are notmeaningful, since shot noise can lead to unphysical den-sity spikes on very small scales. But for σ & ǫsoft theconclusions are robust: the DM offset remains below oneǫsoft, i.e. is consistent with no offset, for all three DM-only simulations regardless of smoothing, while for Eristhe offset is greater than ǫsoft up to σ ≈ 260 pc. ThatDoff drops to zero for even higher σ is not surprising,since any density distribution will appear centered whensmoothed on sufficiently large scales.In the bottom panel of Fig. 3 we show the maximum
value of the density, ρmax, for our four simulations. Ofcourse ρmax is much more sensitive to σ than Doff , sincelarger smoothing includes contributions from surround-ing lower density material. At σ = ǫsoft the density peaksa value of 0.84M⊙ pc−3 in Eris, about 25% higher thanthe value (0.67M⊙ pc−3) at its dynamical center. In Eris-Dark ρmax = 0.40M⊙ pc−3, less than half of the peakdensity in Eris. We caution, that the resolution of ournumerical simulations is not sufficient to resolve the in-ternal density structure of the offset peak. With higherresolution run the peak-to-center density contrast maywell be higher.
3.3. Evolution of the DM offset
We have performed the same analysis described in theprevious section on all 400 outputs of the Eris and Eris-Dark simulations. Fig. 4 shows that the offset measured
Kuhlen et al. 5
0 2 4 6 8 10 12 13.7Age of Universe [Gyr]
0
100
200
300
400
500
DM o
ffset
[pc]
ErisErisDark
4 2 1 0.5 0Redshift
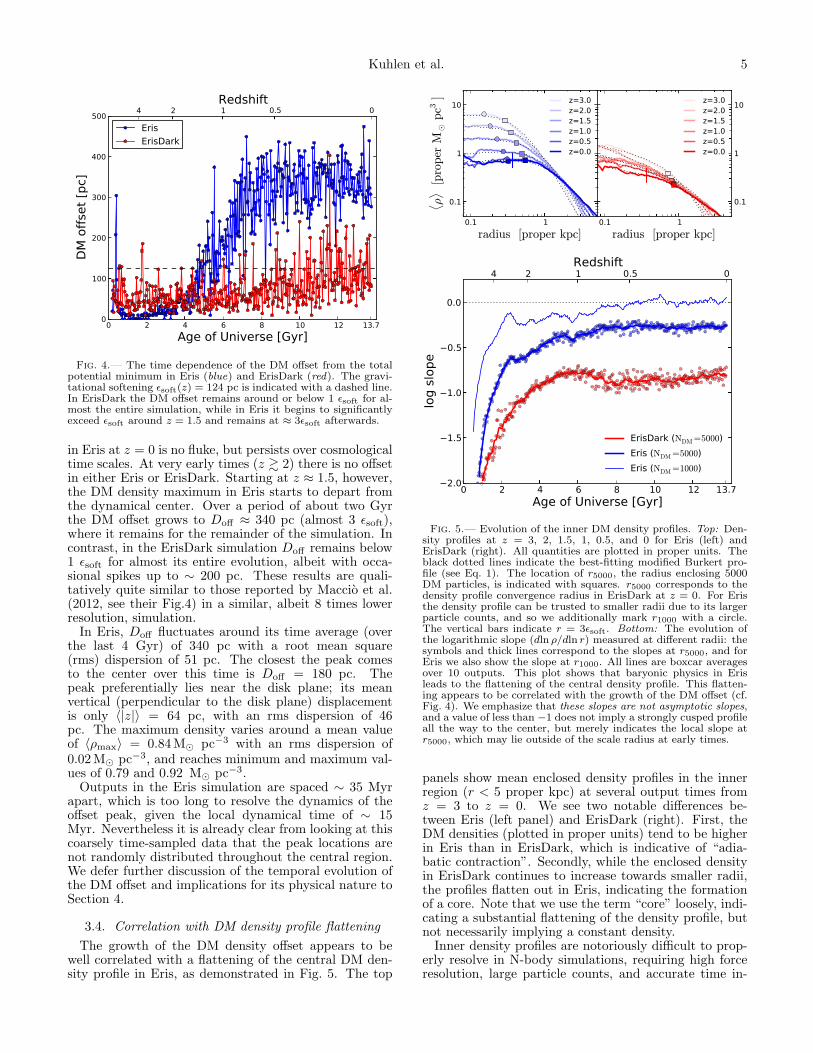
Fig. 4.— The time dependence of the DM offset from the totalpotential minimum in Eris (blue) and ErisDark (red). The gravi-tational softening ǫsoft(z) = 124 pc is indicated with a dashed line.In ErisDark the DM offset remains around or below 1 ǫsoft for al-most the entire simulation, while in Eris it begins to significantlyexceed ǫsoft around z = 1.5 and remains at ≈ 3ǫsoft afterwards.
in Eris at z = 0 is no fluke, but persists over cosmologicaltime scales. At very early times (z & 2) there is no offsetin either Eris or ErisDark. Starting at z ≈ 1.5, however,the DM density maximum in Eris starts to depart fromthe dynamical center. Over a period of about two Gyrthe DM offset grows to Doff ≈ 340 pc (almost 3 ǫsoft),where it remains for the remainder of the simulation. Incontrast, in the ErisDark simulation Doff remains below1 ǫsoft for almost its entire evolution, albeit with occa-sional spikes up to ∼ 200 pc. These results are quali-tatively quite similar to those reported by Maccio et al.(2012, see their Fig.4) in a similar, albeit 8 times lowerresolution, simulation.In Eris, Doff fluctuates around its time average (over
the last 4 Gyr) of 340 pc with a root mean square(rms) dispersion of 51 pc. The closest the peak comesto the center over this time is Doff = 180 pc. Thepeak preferentially lies near the disk plane; its meanvertical (perpendicular to the disk plane) displacementis only 〈|z|〉 = 64 pc, with an rms dispersion of 46pc. The maximum density varies around a mean valueof 〈ρmax〉 = 0.84M⊙ pc−3 with an rms dispersion of0.02M⊙ pc−3, and reaches minimum and maximum val-ues of 0.79 and 0.92 M⊙ pc−3.Outputs in the Eris simulation are spaced ∼ 35 Myr
apart, which is too long to resolve the dynamics of theoffset peak, given the local dynamical time of ∼ 15Myr. Nevertheless it is already clear from looking at thiscoarsely time-sampled data that the peak locations arenot randomly distributed throughout the central region.We defer further discussion of the temporal evolution ofthe DM offset and implications for its physical nature toSection 4.
3.4. Correlation with DM density profile flattening
The growth of the DM density offset appears to bewell correlated with a flattening of the central DM den-sity profile in Eris, as demonstrated in Fig. 5. The top
0.1 1radius [proper kpc]
0.1
1
10
⟨ ρ⟩ [p
roper
M⊙pc3
] z=3.0z=2.0z=1.5z=1.0z=0.5z=0.0
0.1 1radius [proper kpc]
0.1
1
10z=3.0z=2.0z=1.5z=1.0z=0.5z=0.0
0 2 4 6 8 10 12 13.7Age of Universe [Gyr]
2.0
1.5
1.0
0.5
0.0
log
slop
e
4 2 1 0.5 0Redshift
ErisDark (NDM=5000)Eris (NDM=5000)Eris (NDM=1000)
Fig. 5.— Evolution of the inner DM density profiles. Top: Den-sity profiles at z = 3, 2, 1.5, 1, 0.5, and 0 for Eris (left) andErisDark (right). All quantities are plotted in proper units. Theblack dotted lines indicate the best-fitting modified Burkert pro-file (see Eq. 1). The location of r5000, the radius enclosing 5000DM particles, is indicated with squares. r5000 corresponds to thedensity profile convergence radius in ErisDark at z = 0. For Eristhe density profile can be trusted to smaller radii due to its largerparticle counts, and so we additionally mark r1000 with a circle.The vertical bars indicate r = 3ǫsoft. Bottom: The evolution ofthe logarithmic slope (dln ρ/dln r) measured at different radii: thesymbols and thick lines correspond to the slopes at r5000, and forEris we also show the slope at r1000. All lines are boxcar averagesover 10 outputs. This plot shows that baryonic physics in Erisleads to the flattening of the central density profile. This flatten-ing appears to be correlated with the growth of the DM offset (cf.Fig. 4). We emphasize that these slopes are not asymptotic slopes,and a value of less than −1 does not imply a strongly cusped profileall the way to the center, but merely indicates the local slope atr5000, which may lie outside of the scale radius at early times.
panels show mean enclosed density profiles in the innerregion (r < 5 proper kpc) at several output times fromz = 3 to z = 0. We see two notable differences be-tween Eris (left panel) and ErisDark (right). First, theDM densities (plotted in proper units) tend to be higherin Eris than in ErisDark, which is indicative of “adia-batic contraction”. Secondly, while the enclosed densityin ErisDark continues to increase towards smaller radii,the profiles flatten out in Eris, indicating the formationof a core. Note that we use the term “core” loosely, indi-cating a substantial flattening of the density profile, butnot necessarily implying a constant density.Inner density profiles are notoriously difficult to prop-
erly resolve in N-body simulations, requiring high forceresolution, large particle counts, and accurate time in-
6
tegration with sufficiently small timesteps (Power et al.2003; Zemp et al. 2007; Diemand et al. 2008; Dubinskiet al. 2009). In Pillepich et al. (in preparation) we in-vestigate the influence of baryons on the full shape ofthe density profiles in more detail, including convergencestudies. We find a convergence radius for the z = 0density profile in ErisDark of 0.9 kpc, corresponding to∼ 5000 enclosed particles. The square symbols in the toppanel of Fig. 5 indicate r5000 (the radius enclosing 5000DM particles) for the different outputs. Note that r5000is significantly farther out than 3 ǫsoft (indicated with thevertical bars), a commonly used “rule of thumb” for howfar in density profiles can be trusted. For Eris, r5000 isprobably overly conservative, since the potential is domi-nated by baryons and many more than 5000 gas and starparticles are found inside of r5000. As an intermediatecase we also mark with circles r1000, the radius enclosing1000 DM particles.3
In the bottom panel of Fig. 5 we show the evolutionof the logarithmic slope dln ρ/dln r, measured at theseradii. We obtained these slopes by first fitting the en-closed density profiles inwards of 5 kpc to a modifiedBurkert profile,
〈ρ〉(r) =ρ0 r
βc
rα (r2 + r2c )(β−α)/2
, (1)
and then evaluating its logarithmic slope at the radii ofinterest,
dln〈ρ〉
dln r= −α+
α− β
1 + (rc/r)2. (2)
This functional form describes the central enclosed den-sity profile in Eris and ErisDark much better than aconstant power law or Einasto profile. Note, however,that this fitting function is designed to track the encloseddensity profile all the way down to ǫsoft, so way beyondthe convergence radius. We wish to emphasize that wemerely use this fit to evaluate the logarithmic slope atradii outside of 3 ǫsoft, and do not attach any physicalmeaning to the asymptotic inner slopes α preferred bythe fits.Fig. 5 clearly shows that Eris develops a cored density
profile, in the sense that it has a much shallower loga-rithmic slope at r5000 than ErisDark. Measured at r5000the log slope in Eris becomes progressively shallower un-til it stabilizes at a value of ∼ −0.3 at z ≈ 1. Note thatr5000 is larger than Doff(z) at all redshifts. Measured atr1000 the profile even flattens out completely with a logslope of ∼ 0. In ErisDark, on the other hand, the slope atr5000 remains close to the NFW value of −1 after z = 1.5.Comparison with Fig. 4 shows that the onset and timescale of the core formation in Eris is remarkably well cor-related with the growth of the DM density offset. This isa strong hint that whatever baryonic process drives thecore formation may also be responsible for the offset DMdensity peak.
4. NATURE AND ORIGIN OF THE OFFSET PEAK
The existence of a well defined offset to the peak ofthe DM distribution in Eris is unexpected, and its phys-ical nature not immediately apparent. Some possibilities
3 At z = 0, there are over a million star particles within r5000and more than 400,000 within r1000.
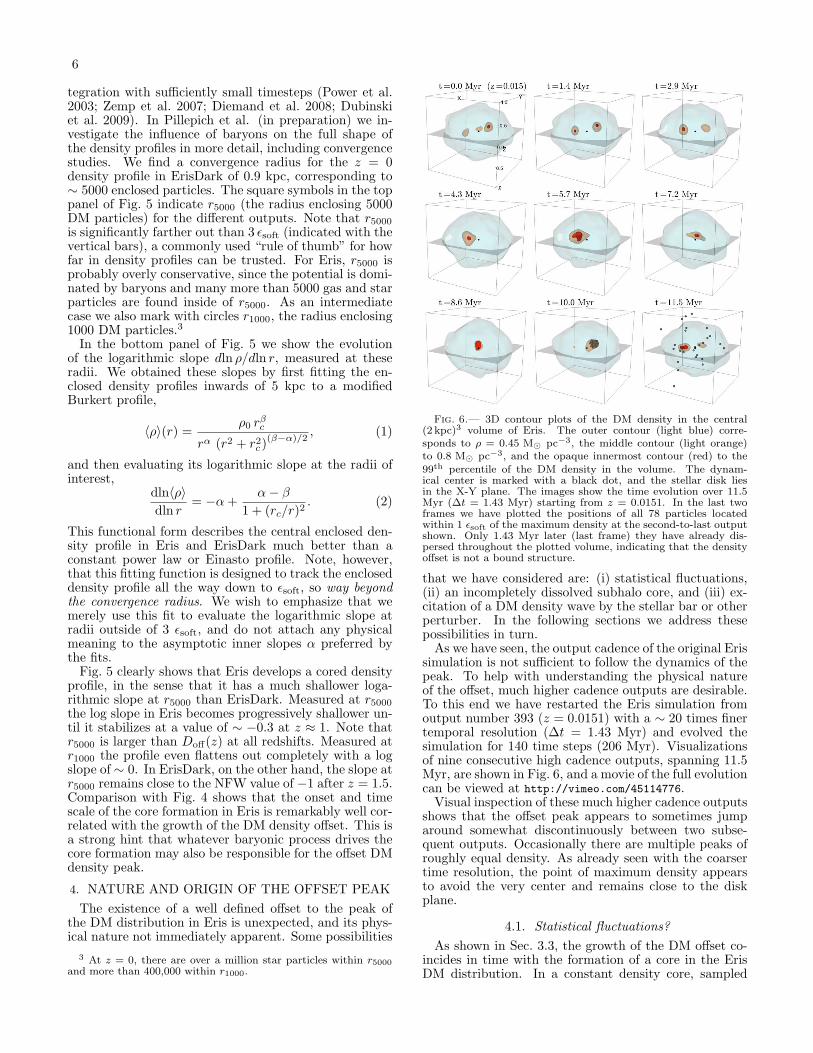
Fig. 6.— 3D contour plots of the DM density in the central(2 kpc)3 volume of Eris. The outer contour (light blue) corre-sponds to ρ = 0.45 M⊙ pc−3, the middle contour (light orange)to 0.8 M⊙ pc−3, and the opaque innermost contour (red) to the99th percentile of the DM density in the volume. The dynam-ical center is marked with a black dot, and the stellar disk liesin the X-Y plane. The images show the time evolution over 11.5Myr (∆t = 1.43 Myr) starting from z = 0.0151. In the last twoframes we have plotted the positions of all 78 particles locatedwithin 1 ǫsoft of the maximum density at the second-to-last outputshown. Only 1.43 Myr later (last frame) they have already dis-persed throughout the plotted volume, indicating that the densityoffset is not a bound structure.
that we have considered are: (i) statistical fluctuations,(ii) an incompletely dissolved subhalo core, and (iii) ex-citation of a DM density wave by the stellar bar or otherperturber. In the following sections we address thesepossibilities in turn.As we have seen, the output cadence of the original Eris
simulation is not sufficient to follow the dynamics of thepeak. To help with understanding the physical natureof the offset, much higher cadence outputs are desirable.To this end we have restarted the Eris simulation fromoutput number 393 (z = 0.0151) with a ∼ 20 times finertemporal resolution (∆t = 1.43 Myr) and evolved thesimulation for 140 time steps (206 Myr). Visualizationsof nine consecutive high cadence outputs, spanning 11.5Myr, are shown in Fig. 6, and a movie of the full evolutioncan be viewed at http://vimeo.com/45114776.Visual inspection of these much higher cadence outputs
shows that the offset peak appears to sometimes jumparound somewhat discontinuously between two subse-quent outputs. Occasionally there are multiple peaks ofroughly equal density. As already seen with the coarsertime resolution, the point of maximum density appearsto avoid the very center and remains close to the diskplane.
4.1. Statistical fluctuations?
As shown in Sec. 3.3, the growth of the DM offset co-incides in time with the formation of a core in the ErisDM distribution. In a constant density core, sampled
Kuhlen et al. 7
0.5 0.6 0.7 0.8 0.9 1.0ρmax [M⊙ pc−3 ]
0
5
10
15
20
25
30
35PDF(ρ
max)[(M⊙pc−
3)−
1]
ErisRandom
0 200 400 600 800 1000Dmax [pc]
0.000
0.001
0.002
0.003
0.004
0.005
0.006
0.007
0.008
PDF(D
max)
[pc−
1]
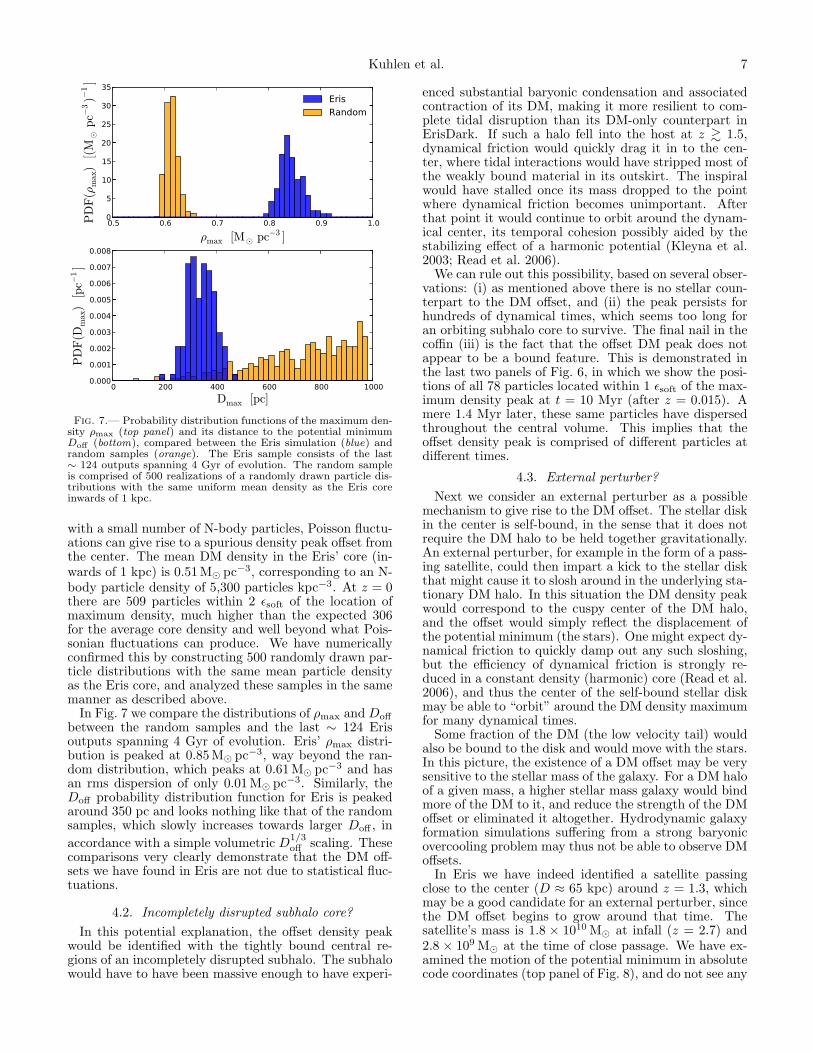
Fig. 7.— Probability distribution functions of the maximum den-sity ρmax (top panel) and its distance to the potential minimumDoff (bottom), compared between the Eris simulation (blue) andrandom samples (orange). The Eris sample consists of the last∼ 124 outputs spanning 4 Gyr of evolution. The random sampleis comprised of 500 realizations of a randomly drawn particle dis-tributions with the same uniform mean density as the Eris coreinwards of 1 kpc.
with a small number of N-body particles, Poisson fluctu-ations can give rise to a spurious density peak offset fromthe center. The mean DM density in the Eris’ core (in-wards of 1 kpc) is 0.51M⊙ pc−3, corresponding to an N-body particle density of 5,300 particles kpc−3. At z = 0there are 509 particles within 2 ǫsoft of the location ofmaximum density, much higher than the expected 306for the average core density and well beyond what Pois-sonian fluctuations can produce. We have numericallyconfirmed this by constructing 500 randomly drawn par-ticle distributions with the same mean particle densityas the Eris core, and analyzed these samples in the samemanner as described above.In Fig. 7 we compare the distributions of ρmax and Doff
between the random samples and the last ∼ 124 Erisoutputs spanning 4 Gyr of evolution. Eris’ ρmax distri-bution is peaked at 0.85M⊙ pc−3, way beyond the ran-dom distribution, which peaks at 0.61M⊙ pc−3 and hasan rms dispersion of only 0.01M⊙ pc−3. Similarly, theDoff probability distribution function for Eris is peakedaround 350 pc and looks nothing like that of the randomsamples, which slowly increases towards larger Doff , in
accordance with a simple volumetric D1/3off scaling. These
comparisons very clearly demonstrate that the DM off-sets we have found in Eris are not due to statistical fluc-tuations.
4.2. Incompletely disrupted subhalo core?
In this potential explanation, the offset density peakwould be identified with the tightly bound central re-gions of an incompletely disrupted subhalo. The subhalowould have to have been massive enough to have experi-
enced substantial baryonic condensation and associatedcontraction of its DM, making it more resilient to com-plete tidal disruption than its DM-only counterpart inErisDark. If such a halo fell into the host at z & 1.5,dynamical friction would quickly drag it in to the cen-ter, where tidal interactions would have stripped most ofthe weakly bound material in its outskirt. The inspiralwould have stalled once its mass dropped to the pointwhere dynamical friction becomes unimportant. Afterthat point it would continue to orbit around the dynam-ical center, its temporal cohesion possibly aided by thestabilizing effect of a harmonic potential (Kleyna et al.2003; Read et al. 2006).We can rule out this possibility, based on several obser-
vations: (i) as mentioned above there is no stellar coun-terpart to the DM offset, and (ii) the peak persists forhundreds of dynamical times, which seems too long foran orbiting subhalo core to survive. The final nail in thecoffin (iii) is the fact that the offset DM peak does notappear to be a bound feature. This is demonstrated inthe last two panels of Fig. 6, in which we show the posi-tions of all 78 particles located within 1 ǫsoft of the max-imum density peak at t = 10 Myr (after z = 0.015). Amere 1.4 Myr later, these same particles have dispersedthroughout the central volume. This implies that theoffset density peak is comprised of different particles atdifferent times.
4.3. External perturber?
Next we consider an external perturber as a possiblemechanism to give rise to the DM offset. The stellar diskin the center is self-bound, in the sense that it does notrequire the DM halo to be held together gravitationally.An external perturber, for example in the form of a pass-ing satellite, could then impart a kick to the stellar diskthat might cause it to slosh around in the underlying sta-tionary DM halo. In this situation the DM density peakwould correspond to the cuspy center of the DM halo,and the offset would simply reflect the displacement ofthe potential minimum (the stars). One might expect dy-namical friction to quickly damp out any such sloshing,but the efficiency of dynamical friction is strongly re-duced in a constant density (harmonic) core (Read et al.2006), and thus the center of the self-bound stellar diskmay be able to “orbit” around the DM density maximumfor many dynamical times.Some fraction of the DM (the low velocity tail) would
also be bound to the disk and would move with the stars.In this picture, the existence of a DM offset may be verysensitive to the stellar mass of the galaxy. For a DM haloof a given mass, a higher stellar mass galaxy would bindmore of the DM to it, and reduce the strength of the DMoffset or eliminated it altogether. Hydrodynamic galaxyformation simulations suffering from a strong baryonicovercooling problem may thus not be able to observe DMoffsets.In Eris we have indeed identified a satellite passing
close to the center (D ≈ 65 kpc) around z = 1.3, whichmay be a good candidate for an external perturber, sincethe DM offset begins to grow around that time. Thesatellite’s mass is 1.8 × 10¹⁰ M⊙ at infall (z = 2.7) and2.8 × 109 M⊙ at the time of close passage. We have ex-amined the motion of the potential minimum in absolutecode coordinates (top panel of Fig. 8), and do not see any
8
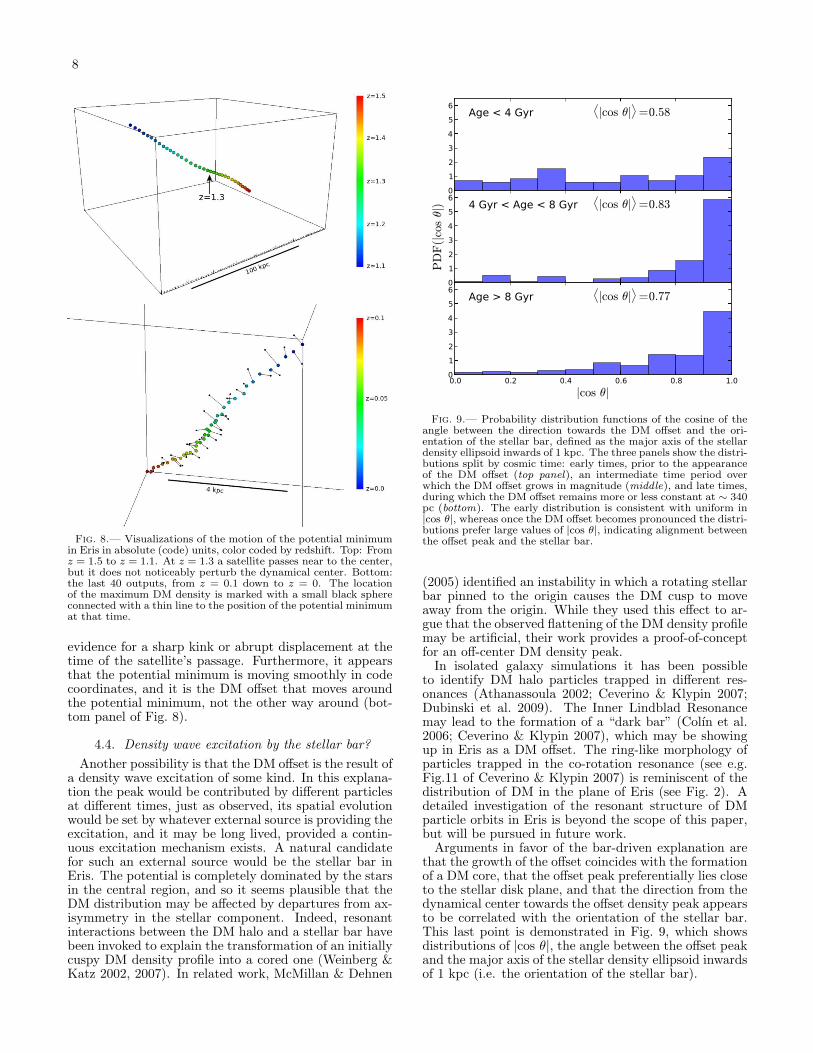
Fig. 8.— Visualizations of the motion of the potential minimumin Eris in absolute (code) units, color coded by redshift. Top: Fromz = 1.5 to z = 1.1. At z = 1.3 a satellite passes near to the center,but it does not noticeably perturb the dynamical center. Bottom:the last 40 outputs, from z = 0.1 down to z = 0. The locationof the maximum DM density is marked with a small black sphereconnected with a thin line to the position of the potential minimumat that time.
evidence for a sharp kink or abrupt displacement at thetime of the satellite’s passage. Furthermore, it appearsthat the potential minimum is moving smoothly in codecoordinates, and it is the DM offset that moves aroundthe potential minimum, not the other way around (bot-tom panel of Fig. 8).
4.4. Density wave excitation by the stellar bar?
Another possibility is that the DM offset is the result ofa density wave excitation of some kind. In this explana-tion the peak would be contributed by different particlesat different times, just as observed, its spatial evolutionwould be set by whatever external source is providing theexcitation, and it may be long lived, provided a contin-uous excitation mechanism exists. A natural candidatefor such an external source would be the stellar bar inEris. The potential is completely dominated by the starsin the central region, and so it seems plausible that theDM distribution may be affected by departures from ax-isymmetry in the stellar component. Indeed, resonantinteractions between the DM halo and a stellar bar havebeen invoked to explain the transformation of an initiallycuspy DM density profile into a cored one (Weinberg &Katz 2002, 2007). In related work, McMillan & Dehnen
0123456 Age < 4 Gyr
⟨|cos θ|
⟩=0.58
0123456
PDF(|c
osθ|) 4 Gyr < Age < 8 Gyr
⟨|cos θ|
⟩=0.83
0.0 0.2 0.4 0.6 0.8 1.0|cos θ|
0123456 Age > 8 Gyr
⟨|cos θ|
⟩=0.77
Fig. 9.— Probability distribution functions of the cosine of theangle between the direction towards the DM offset and the ori-entation of the stellar bar, defined as the major axis of the stellardensity ellipsoid inwards of 1 kpc. The three panels show the distri-butions split by cosmic time: early times, prior to the appearanceof the DM offset (top panel), an intermediate time period overwhich the DM offset grows in magnitude (middle), and late times,during which the DM offset remains more or less constant at ∼ 340pc (bottom). The early distribution is consistent with uniform in|cos θ|, whereas once the DM offset becomes pronounced the distri-butions prefer large values of |cos θ|, indicating alignment betweenthe offset peak and the stellar bar.
(2005) identified an instability in which a rotating stellarbar pinned to the origin causes the DM cusp to moveaway from the origin. While they used this effect to ar-gue that the observed flattening of the DM density profilemay be artificial, their work provides a proof-of-conceptfor an off-center DM density peak.In isolated galaxy simulations it has been possible
to identify DM halo particles trapped in different res-onances (Athanassoula 2002; Ceverino & Klypin 2007;Dubinski et al. 2009). The Inner Lindblad Resonancemay lead to the formation of a “dark bar” (Colın et al.2006; Ceverino & Klypin 2007), which may be showingup in Eris as a DM offset. The ring-like morphology ofparticles trapped in the co-rotation resonance (see e.g.Fig.11 of Ceverino & Klypin 2007) is reminiscent of thedistribution of DM in the plane of Eris (see Fig. 2). Adetailed investigation of the resonant structure of DMparticle orbits in Eris is beyond the scope of this paper,but will be pursued in future work.Arguments in favor of the bar-driven explanation are
that the growth of the offset coincides with the formationof a DM core, that the offset peak preferentially lies closeto the stellar disk plane, and that the direction from thedynamical center towards the offset density peak appearsto be correlated with the orientation of the stellar bar.This last point is demonstrated in Fig. 9, which showsdistributions of |cos θ|, the angle between the offset peakand the major axis of the stellar density ellipsoid inwardsof 1 kpc (i.e. the orientation of the stellar bar).
Kuhlen et al. 9
10-1 100 101 102 103
ω/2π [Gyr−1 ]
0.8
1.0
1.2
1.4
1.6
1.8
2.0
2.2
R2
13.0 13.1 13.2 13.3 13.4 13.5 13.6 13.7Age of Universe [Gyr]
π/2
−π/4
0
π/4
π/2
θ off
[deg
rees]
0.05 0Redshift
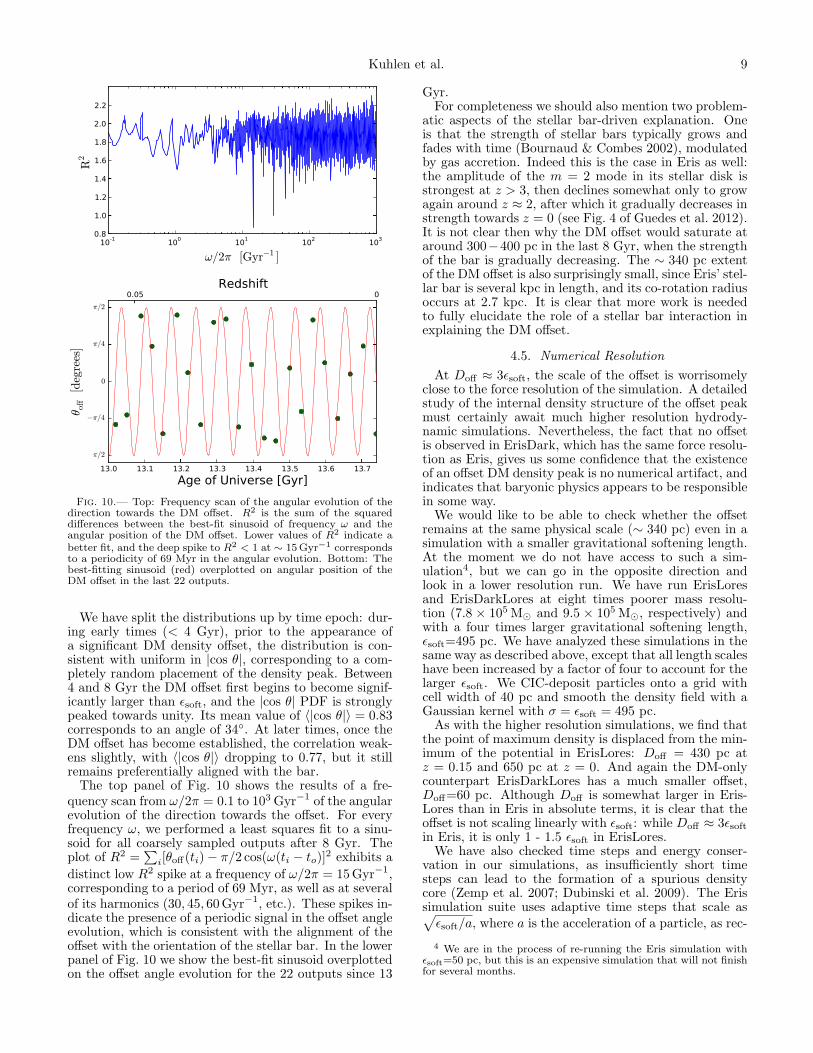
Fig. 10.— Top: Frequency scan of the angular evolution of thedirection towards the DM offset. R2 is the sum of the squareddifferences between the best-fit sinusoid of frequency ω and theangular position of the DM offset. Lower values of R2 indicate abetter fit, and the deep spike to R2 < 1 at ∼ 15Gyr−1 correspondsto a periodicity of 69 Myr in the angular evolution. Bottom: Thebest-fitting sinusoid (red) overplotted on angular position of theDM offset in the last 22 outputs.
We have split the distributions up by time epoch: dur-ing early times (< 4 Gyr), prior to the appearance ofa significant DM density offset, the distribution is con-sistent with uniform in |cos θ|, corresponding to a com-pletely random placement of the density peak. Between4 and 8 Gyr the DM offset first begins to become signif-icantly larger than ǫsoft, and the |cos θ| PDF is stronglypeaked towards unity. Its mean value of 〈|cos θ|〉 = 0.83corresponds to an angle of 34◦. At later times, once theDM offset has become established, the correlation weak-ens slightly, with 〈|cos θ|〉 dropping to 0.77, but it stillremains preferentially aligned with the bar.The top panel of Fig. 10 shows the results of a fre-
quency scan from ω/2π = 0.1 to 103 Gyr−1 of the angularevolution of the direction towards the offset. For everyfrequency ω, we performed a least squares fit to a sinu-soid for all coarsely sampled outputs after 8 Gyr. Theplot of R2 =
∑
i[θoff(ti)− π/2 cos(ω(ti − to)]2 exhibits a
distinct low R2 spike at a frequency of ω/2π = 15Gyr−1,corresponding to a period of 69 Myr, as well as at severalof its harmonics (30, 45, 60Gyr−1, etc.). These spikes in-dicate the presence of a periodic signal in the offset angleevolution, which is consistent with the alignment of theoffset with the orientation of the stellar bar. In the lowerpanel of Fig. 10 we show the best-fit sinusoid overplottedon the offset angle evolution for the 22 outputs since 13
Gyr.For completeness we should also mention two problem-
atic aspects of the stellar bar-driven explanation. Oneis that the strength of stellar bars typically grows andfades with time (Bournaud & Combes 2002), modulatedby gas accretion. Indeed this is the case in Eris as well:the amplitude of the m = 2 mode in its stellar disk isstrongest at z > 3, then declines somewhat only to growagain around z ≈ 2, after which it gradually decreases instrength towards z = 0 (see Fig. 4 of Guedes et al. 2012).It is not clear then why the DM offset would saturate ataround 300−400 pc in the last 8 Gyr, when the strengthof the bar is gradually decreasing. The ∼ 340 pc extentof the DM offset is also surprisingly small, since Eris’ stel-lar bar is several kpc in length, and its co-rotation radiusoccurs at 2.7 kpc. It is clear that more work is neededto fully elucidate the role of a stellar bar interaction inexplaining the DM offset.
4.5. Numerical Resolution
At Doff ≈ 3ǫsoft, the scale of the offset is worrisomelyclose to the force resolution of the simulation. A detailedstudy of the internal density structure of the offset peakmust certainly await much higher resolution hydrody-namic simulations. Nevertheless, the fact that no offsetis observed in ErisDark, which has the same force resolu-tion as Eris, gives us some confidence that the existenceof an offset DM density peak is no numerical artifact, andindicates that baryonic physics appears to be responsiblein some way.We would like to be able to check whether the offset
remains at the same physical scale (∼ 340 pc) even in asimulation with a smaller gravitational softening length.At the moment we do not have access to such a sim-ulation4, but we can go in the opposite direction andlook in a lower resolution run. We have run ErisLoresand ErisDarkLores at eight times poorer mass resolu-tion (7.8 × 10⁵ M⊙ and 9.5 × 10⁵ M⊙, respectively) andwith a four times larger gravitational softening length,ǫsoft=495 pc. We have analyzed these simulations in thesame way as described above, except that all length scaleshave been increased by a factor of four to account for thelarger ǫsoft. We CIC-deposit particles onto a grid withcell width of 40 pc and smooth the density field with aGaussian kernel with σ = ǫsoft = 495 pc.As with the higher resolution simulations, we find that
the point of maximum density is displaced from the min-imum of the potential in ErisLores: Doff = 430 pc atz = 0.15 and 650 pc at z = 0. And again the DM-onlycounterpart ErisDarkLores has a much smaller offset,Doff=60 pc. Although Doff is somewhat larger in Eris-Lores than in Eris in absolute terms, it is clear that theoffset is not scaling linearly with ǫsoft: while Doff ≈ 3ǫsoftin Eris, it is only 1 - 1.5 ǫsoft in ErisLores.We have also checked time steps and energy conser-
vation in our simulations, as insufficiently short timesteps can lead to the formation of a spurious densitycore (Zemp et al. 2007; Dubinski et al. 2009). The Erissimulation suite uses adaptive time steps that scale as√
ǫsoft/a, where a is the acceleration of a particle, as rec-
4 We are in the process of re-running the Eris simulation withǫsoft=50 pc, but this is an expensive simulation that will not finishfor several months.
10
ommended by Power et al. (2003). This results in timesteps as small as 0.16 Myr at low redshift, which is threetimes smaller than the fixed time step that Dubinski et al.(2009) employed in a simulation with comparable ǫsoft(their model m100K) and which they found to be shortenough to avoid the formation of an artificial core.These checks give us further confidence that the DM
offset we have observed in Eris cannot be attributedsolely to insufficient numerical resolution or timestep-ping. On the other hand, we cannot claim to havefully resolved Doff either – higher resolution studies areneeded.
4.6. The role of the central DM core
It is clear that the central DM core plays an importantrole for the formation of an off-center DM density peak.Without a flattened central density profile it may be dif-ficult to excite an offset peak, since any non-central den-sity enhancement would be overwhelmed by the steeplyrising central cusp. Indeed, as we have seen above, thegrowth of the DM offset temporally coincides with theformation of such a core. We have not yet determinedwhat physical processes led to the formation of this corein Eris.A core formation mechanism that has recently been
suggested is the repeated removal of large amounts of gasfrom the central regions through the action of violent su-pernovae explosions (Read & Gilmore 2005; Pontzen &Governato 2012). If these baryonic outflows abruptly al-ter the potential, the DM may respond by flowing out ofthe center, transforming the cusp into a core in the pro-cess. Perhaps this DM redistribution could also createan offcenter DM density peak. Note, however, that thecentral potential in the Eris galaxy is already dominatedby its stellar component by the time the core formationbegins at z ∼ 2. Even though Eris does experience astar burst triggered by a merger at z ≃ 1, the associatedsupernovae feedback is therefore unlikely to substantiallyalter the central potential. Furthermore, this is a singlestar formation event, while the mechanism of Pontzen &Governato (2012) requires multiple application of violentoutflows followed by gradual re-accretion of gas.To further check the role of SN feedback on the forma-
tion of a DM density core and peak offset, we have ana-lyzed the last output (z = 0.7) of the ErisLT run, which isidentical to Eris except that it uses a lower star formationthreshold (0.1 cm−3). This lower SF threshold reducesthe efficiency of the supernova-driven gas blowout andresults in a disk galaxy with a larger bulge-to-disk ratioand a more compact stellar configuration (see Guedeset al. 2011). The DM distribution, however, appears notto have been affected as dramatically. The DM densityprofile in ErisLT is almost identical to the one in Eris atz = 0.7, both exhibiting a core with radius ∼ 1 kpc, withDoff=350 pc in ErisLT and Doff=360 pc in Eris.The absence of a dependence in the DM distribution on
the star formation threshold suggests that SN-driven out-flows are not the only core formation mechanism, high-lighting a possible important difference between the evo-lution of Milky-Way sized galaxies and that of the dwarfgalaxies described by Governato et al. (2010, 2012). In-stead, perhaps the stellar bar may be responsible forthis transformation, through resonant angular momen-tum exchange between the bar and the DM as suggested
1000 500 0 500 1000X [pc]
1000
500
0
500
1000
Z [p
c]
100
200
300
400
500
600
700
800
[M2⊙ pc−5 ]
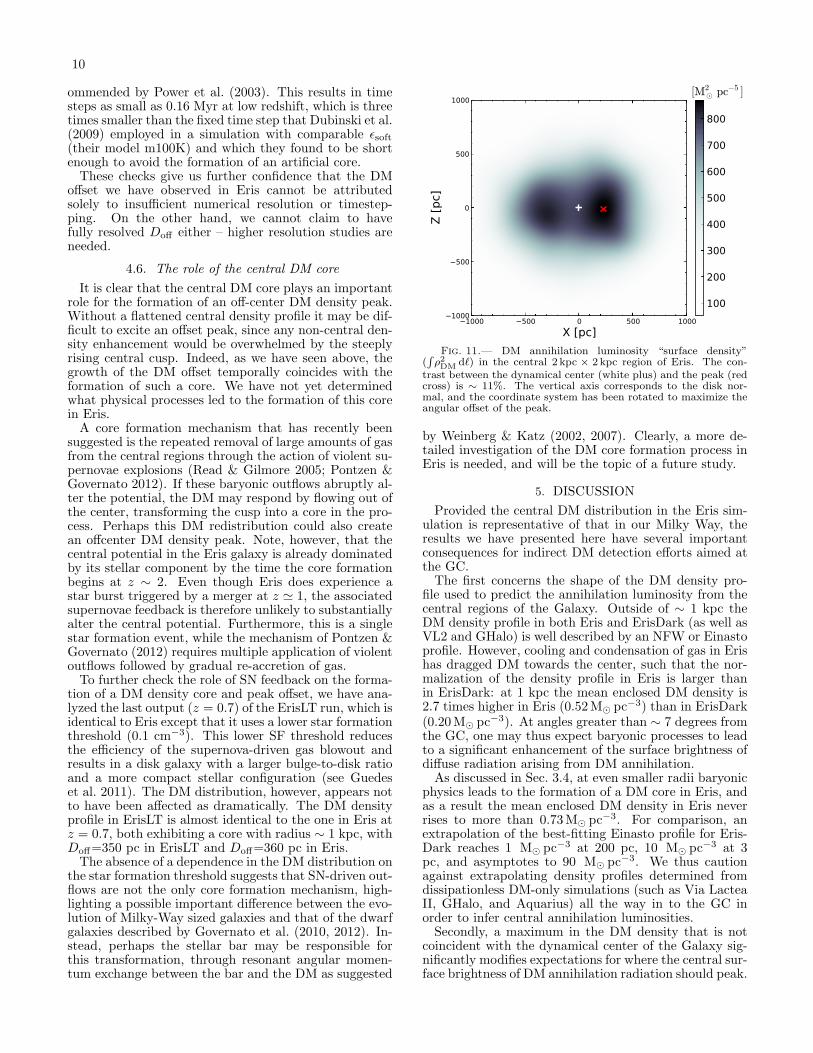
Fig. 11.— DM annihilation luminosity “surface density”(∫ρ2DM
dℓ) in the central 2 kpc × 2 kpc region of Eris. The con-trast between the dynamical center (white plus) and the peak (redcross) is ∼ 11%. The vertical axis corresponds to the disk nor-mal, and the coordinate system has been rotated to maximize theangular offset of the peak.
by Weinberg & Katz (2002, 2007). Clearly, a more de-tailed investigation of the DM core formation process inEris is needed, and will be the topic of a future study.
5. DISCUSSION
Provided the central DM distribution in the Eris sim-ulation is representative of that in our Milky Way, theresults we have presented here have several importantconsequences for indirect DM detection efforts aimed atthe GC.The first concerns the shape of the DM density pro-
file used to predict the annihilation luminosity from thecentral regions of the Galaxy. Outside of ∼ 1 kpc theDM density profile in both Eris and ErisDark (as well asVL2 and GHalo) is well described by an NFW or Einastoprofile. However, cooling and condensation of gas in Erishas dragged DM towards the center, such that the nor-malization of the density profile in Eris is larger thanin ErisDark: at 1 kpc the mean enclosed DM density is2.7 times higher in Eris (0.52M⊙ pc−3) than in ErisDark(0.20M⊙ pc−3). At angles greater than ∼ 7 degrees fromthe GC, one may thus expect baryonic processes to leadto a significant enhancement of the surface brightness ofdiffuse radiation arising from DM annihilation.As discussed in Sec. 3.4, at even smaller radii baryonic
physics leads to the formation of a DM core in Eris, andas a result the mean enclosed DM density in Eris neverrises to more than 0.73M⊙ pc−3. For comparison, anextrapolation of the best-fitting Einasto profile for Eris-Dark reaches 1 M⊙ pc−3 at 200 pc, 10 M⊙ pc−3 at 3pc, and asymptotes to 90 M⊙ pc−3. We thus cautionagainst extrapolating density profiles determined fromdissipationless DM-only simulations (such as Via LacteaII, GHalo, and Aquarius) all the way in to the GC inorder to infer central annihilation luminosities.Secondly, a maximum in the DM density that is not
coincident with the dynamical center of the Galaxy sig-nificantly modifies expectations for where the central sur-face brightness of DM annihilation radiation should peak.
Kuhlen et al. 11
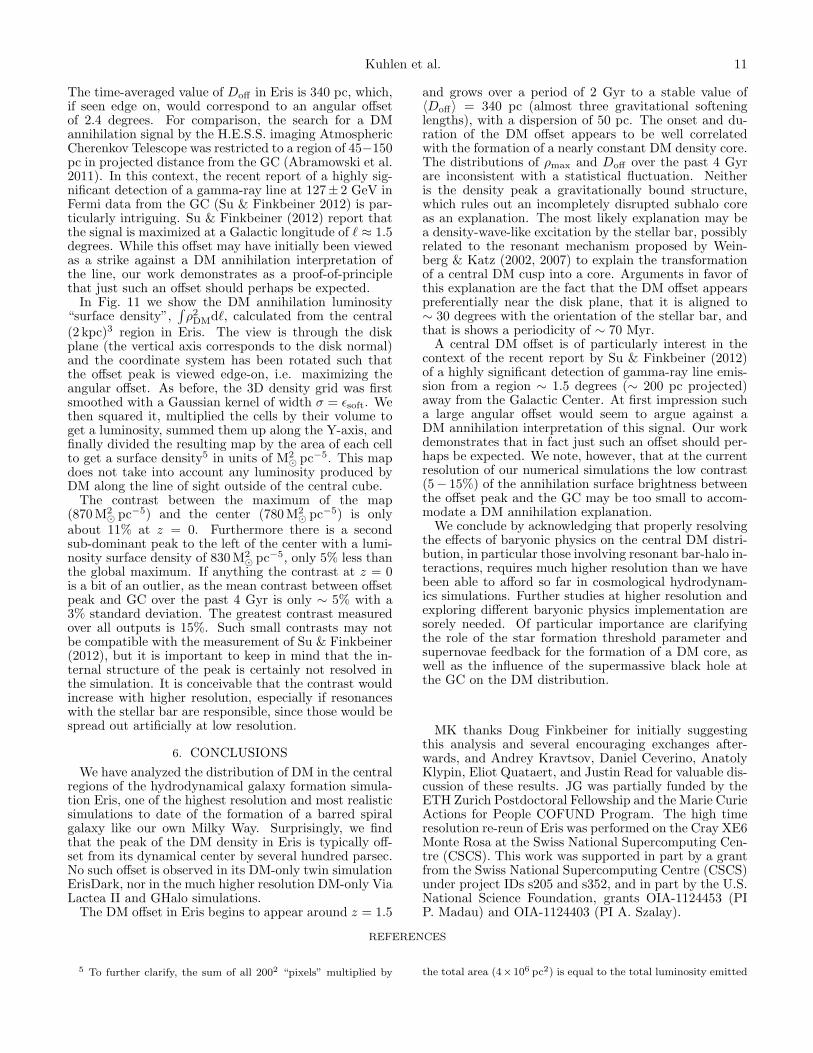
The time-averaged value of Doff in Eris is 340 pc, which,if seen edge on, would correspond to an angular offsetof 2.4 degrees. For comparison, the search for a DMannihilation signal by the H.E.S.S. imaging AtmosphericCherenkov Telescope was restricted to a region of 45−150pc in projected distance from the GC (Abramowski et al.2011). In this context, the recent report of a highly sig-nificant detection of a gamma-ray line at 127± 2 GeV inFermi data from the GC (Su & Finkbeiner 2012) is par-ticularly intriguing. Su & Finkbeiner (2012) report thatthe signal is maximized at a Galactic longitude of ℓ ≈ 1.5degrees. While this offset may have initially been viewedas a strike against a DM annihilation interpretation ofthe line, our work demonstrates as a proof-of-principlethat just such an offset should perhaps be expected.In Fig. 11 we show the DM annihilation luminosity
“surface density”,∫
ρ2DMdℓ, calculated from the central(2 kpc)3 region in Eris. The view is through the diskplane (the vertical axis corresponds to the disk normal)and the coordinate system has been rotated such thatthe offset peak is viewed edge-on, i.e. maximizing theangular offset. As before, the 3D density grid was firstsmoothed with a Gaussian kernel of width σ = ǫsoft. Wethen squared it, multiplied the cells by their volume toget a luminosity, summed them up along the Y-axis, andfinally divided the resulting map by the area of each cellto get a surface density5 in units of M2
⊙ pc−5. This mapdoes not take into account any luminosity produced byDM along the line of sight outside of the central cube.The contrast between the maximum of the map
(870M2⊙ pc−5) and the center (780M2
⊙ pc−5) is onlyabout 11% at z = 0. Furthermore there is a secondsub-dominant peak to the left of the center with a lumi-nosity surface density of 830M2
⊙ pc−5, only 5% less thanthe global maximum. If anything the contrast at z = 0is a bit of an outlier, as the mean contrast between offsetpeak and GC over the past 4 Gyr is only ∼ 5% with a3% standard deviation. The greatest contrast measuredover all outputs is 15%. Such small contrasts may notbe compatible with the measurement of Su & Finkbeiner(2012), but it is important to keep in mind that the in-ternal structure of the peak is certainly not resolved inthe simulation. It is conceivable that the contrast wouldincrease with higher resolution, especially if resonanceswith the stellar bar are responsible, since those would bespread out artificially at low resolution.
6. CONCLUSIONS
We have analyzed the distribution of DM in the centralregions of the hydrodynamical galaxy formation simula-tion Eris, one of the highest resolution and most realisticsimulations to date of the formation of a barred spiralgalaxy like our own Milky Way. Surprisingly, we findthat the peak of the DM density in Eris is typically off-set from its dynamical center by several hundred parsec.No such offset is observed in its DM-only twin simulationErisDark, nor in the much higher resolution DM-only ViaLactea II and GHalo simulations.The DM offset in Eris begins to appear around z = 1.5
and grows over a period of 2 Gyr to a stable value of〈Doff〉 = 340 pc (almost three gravitational softeninglengths), with a dispersion of 50 pc. The onset and du-ration of the DM offset appears to be well correlatedwith the formation of a nearly constant DM density core.The distributions of ρmax and Doff over the past 4 Gyrare inconsistent with a statistical fluctuation. Neitheris the density peak a gravitationally bound structure,which rules out an incompletely disrupted subhalo coreas an explanation. The most likely explanation may bea density-wave-like excitation by the stellar bar, possiblyrelated to the resonant mechanism proposed by Wein-berg & Katz (2002, 2007) to explain the transformationof a central DM cusp into a core. Arguments in favor ofthis explanation are the fact that the DM offset appearspreferentially near the disk plane, that it is aligned to∼ 30 degrees with the orientation of the stellar bar, andthat is shows a periodicity of ∼ 70 Myr.A central DM offset is of particularly interest in the
context of the recent report by Su & Finkbeiner (2012)of a highly significant detection of gamma-ray line emis-sion from a region ∼ 1.5 degrees (∼ 200 pc projected)away from the Galactic Center. At first impression sucha large angular offset would seem to argue against aDM annihilation interpretation of this signal. Our workdemonstrates that in fact just such an offset should per-haps be expected. We note, however, that at the currentresolution of our numerical simulations the low contrast(5− 15%) of the annihilation surface brightness betweenthe offset peak and the GC may be too small to accom-modate a DM annihilation explanation.We conclude by acknowledging that properly resolving
the effects of baryonic physics on the central DM distri-bution, in particular those involving resonant bar-halo in-teractions, requires much higher resolution than we havebeen able to afford so far in cosmological hydrodynam-ics simulations. Further studies at higher resolution andexploring different baryonic physics implementation aresorely needed. Of particular importance are clarifyingthe role of the star formation threshold parameter andsupernovae feedback for the formation of a DM core, aswell as the influence of the supermassive black hole atthe GC on the DM distribution.
MK thanks Doug Finkbeiner for initially suggestingthis analysis and several encouraging exchanges after-wards, and Andrey Kravtsov, Daniel Ceverino, AnatolyKlypin, Eliot Quataert, and Justin Read for valuable dis-cussion of these results. JG was partially funded by theETH Zurich Postdoctoral Fellowship and the Marie CurieActions for People COFUND Program. The high timeresolution re-reun of Eris was performed on the Cray XE6Monte Rosa at the Swiss National Supercomputing Cen-tre (CSCS). This work was supported in part by a grantfrom the Swiss National Supercomputing Centre (CSCS)under project IDs s205 and s352, and in part by the U.S.National Science Foundation, grants OIA-1124453 (PIP. Madau) and OIA-1124403 (PI A. Szalay).
REFERENCES
5 To further clarify, the sum of all 2002 “pixels” multiplied by the total area (4×10⁶ pc2) is equal to the total luminosity emitted
12
Abazajian, K. N. 2011, Journal of Cosmology and Astro-ParticlePhysics, 03, 010
Abazajian, K. N., & Kaplinghat, M. 2012, ArXiv e-print1207.6047
Abramowski, A., Acero, F., Aharonian, F., et al. 2011, PhysicalReview Letters, 106, 161301
Aharonian, F., Khangulyan, D., & Malyshev, D. 2012, ArXive-print 1207.0458
Aharonian, F., Akhperjanian, A. G., Bazer-Bachi, A. R., et al.2006, Physical Review Letters, 97, 221102
Allen, S. W. 1998, Monthly Notices of the Royal AstronomicalSociety, 296, 392
Athanassoula, E. 2002, The Astrophysical Journal Letters, 569,L83
—. 2003, Monthly Notices of the Royal Astronomical Society,341, 1179
Atwood, W. B., Abdo, A. A., Ackermann, M., et al. 2009, TheAstrophysical Journal, 697, 1071
Baltz, E. A., Berenji, B., Bertone, G., et al. 2008, Journal ofCosmology and Astro-Particle Physics, 07, 013
Bartko, H., Martins, F., Fritz, T. K., et al. 2009, TheAstrophysical Journal, 697, 1741
Berentzen, I., Shlosman, I., & Jogee, S. 2006, The AstrophysicalJournal, 637, 582
Bergstrom, L. 2012, Physical Review D, 86, 103514Bergstrom, L., Ullio, P., & Buckley, J. H. 1998, Astroparticle
Physics, 9, 137Blitz, L., & Spergel, D. N. 1991, The Astrophysical Journal, 379,
631Blumenthal, G. R., Faber, S. M., Flores, R., & Primack, J. R.
1986, The Astrophysical Journal, 301, 27Bournaud, F., & Combes, F. 2002, Astronomy and Astrophysics,
392, 83Bringmann, T., Huang, X., Ibarra, A., Vogl, S., & Weniger, C.
2012, Journal of Cosmology and Astro-Particle Physics, 07, 054Buckley, M. R., & Hooper, D. 2012, Physical Review D, 86, 43524Ceverino, D., & Klypin, A. 2007, Monthly Notices of the Royal
Astronomical Society, 379, 1155Chalons, G., Dolan, M. J., & McCabe, C. 2012, ArXiv e-prints,
1211, 5154Cline, J. M. 2012, Physical Review D, 86, 15016Colın, P., Valenzuela, O., & Klypin, A. 2006, The Astrophysical
Journal, 644, 687Danninger, M., & the IceCube collaboration. 2012, Journal of
Physics: Conference Series, 375, 012038Diemand, J., Kuhlen, M., Madau, P., et al. 2008, Nature, 454, 735Dobler, G., Finkbeiner, D. P., Cholis, I., Slatyer, T., & Weiner, N.
2010, The Astrophysical Journal, 717, 825Dubinski, J., Berentzen, I., & Shlosman, I. 2009, The
Astrophysical Journal, 697, 293Dudas, E., Mambrini, Y., Pokorski, S., & Romagnoni, A. 2012,
Journal of High Energy Physics, 10, 123Fall, S. M., & Efstathiou, G. 1980, Monthly Notices of the Royal
Astronomical Society, 193, 189Genzel, R., Eisenhauer, F., & Gillessen, S. 2010, Reviews of
Modern Physics, 82, 3121Ghez, A. M., Salim, S., Weinberg, N. N., et al. 2008, The
Astrophysical Journal, 689, 1044Gillessen, S., Eisenhauer, F., Trippe, S., et al. 2009, The
Astrophysical Journal, 692, 1075Gnedin, O. Y., Kravtsov, A. V., Klypin, A. A., & Nagai, D. 2004,
The Astrophysical Journal, 616, 16Gnedin, O. Y., & Primack, J. R. 2004, Physical Review Letters,
93, 61302Gondolo, P., & Silk, J. 1999, Physical Review Letters, 83, 1719Goodenough, L., & Hooper, D. 2009, ArXiv e-print 0910.2998Governato, F., Brook, C., Mayer, L., et al. 2010, Nature, 463, 203Governato, F., Zolotov, A., Pontzen, A., et al. 2012, Monthly
Notices of the Royal Astronomical Society, 422, 1231Guedes, J., Callegari, S., Madau, P., & Mayer, L. 2011, The
Astrophysical Journal, 742, 76
Guedes, J., Mayer, L., Carollo, M., & Madau, P. 2012, ArXive-prints 1211.1713
Holley-Bockelmann, K., Weinberg, M., & Katz, N. 2005, MonthlyNotices of the Royal Astronomical Society, 363, 991
Hooper, D., & Goodenough, L. 2011, Physics Letters B, 697, 412Hooper, D., & Linden, T. 2011, Physical Review D, 84, 123005Jog, C. J., & Combes, F. 2009, Physics Reports, 471, 75Jog, C. J., & Maybhate, A. 2006, Monthly Notices of the Royal
Astronomical Society, 370, 891Kleyna, J. T., Wilkinson, M. I., Gilmore, G., & Evans, N. W.
2003, The Astrophysical Journal Letters, 588, L21
Klypin, A., Zhao, H., & Somerville, R. S. 2002, AstrophysicalJournal, 573, 597
Maccio, A. V., Stinson, G., Brook, C. B., et al. 2012, TheAstrophysical Journal Letters, 744, L9
Machado, R. E. G., & Athanassoula, E. 2010, Monthly Notices ofthe Royal Astronomical Society, 406, 2386
Martinez-Valpuesta, I., & Gerhard, O. 2011, The AstrophysicalJournal Letters, 734, L20
McMillan, P. J., & Dehnen, W. 2005, Monthly Notices of theRoyal Astronomical Society, 363, 1205
Miller, R. H., & Smith, B. F. 1992, The Astrophysical Journal,393, 508
Muno, M. P., Pfahl, E., Baganoff, F. K., et al. 2005, TheAstrophysical Journal Letters, 622, L113
Muno, M. P., Baganoff, F. K., Bautz, M. W., et al. 2003, TheAstrophysical Journal, 589, 225
Navarro, J. F., Frenk, C. S., & White, S. D. M. 1997, TheAstrophysical Journal, 490, 493
Paumard, T., Genzel, R., Martins, F., et al. 2006, TheAstrophysical Journal, 643, 1011
Pontzen, A., & Governato, F. 2012, Monthly Notices of the RoyalAstronomical Society, 421, 3464
Power, C., Navarro, J. F., Jenkins, A., et al. 2003, MonthlyNotices of the Royal Astronomical Society, 338, 14
Read, J. I., & Gilmore, G. 2005, Monthly Notices of the RoyalAstronomical Society, 356, 107
Read, J. I., Goerdt, T., Moore, B., et al. 2006, Monthly Notices ofthe Royal Astronomical Society, 373, 1451
Saha, K., Levine, E. S., Jog, C. J., & Blitz, L. 2009, TheAstrophysical Journal, 697, 2015
Schweizer, F. 1996, The Astronomical Journal, 111, 109Sellwood, J. A. 2003, The Astrophysical Journal, 587, 638Shan, H., Qin, B., Fort, B., et al. 2010, Monthly Notices of the
Royal Astronomical Society, 406, 1134Stadel, J., Potter, D., Moore, B., et al. 2009, Monthly Notices of
the Royal Astronomical Society, 398, L21Su, M., & Finkbeiner, D. P. 2012, ArXiv e-print 1206.1616Su, M., Slatyer, T. R., & Finkbeiner, D. P. 2010, The
Astrophysical Journal, 724, 1044Tempel, E., Hektor, A., & Raidal, M. 2012, ArXiv e-print
1205.1045Trachternach, C., de Blok, W. J. G., Walter, F., Brinks, E., &
Kennicutt, R. C. 2008, The Astronomical Journal, 136, 2720Valenzuela, O., & Klypin, A. 2003, Monthly Notices of the Royal
Astronomical Society, 345, 406Wadsley, J. W., Stadel, J., & Quinn, T. 2004, New Astronomy, 9,
137Weinberg, M. D., & Katz, N. 2002, The Astrophysical Journal,
580, 627—. 2007, Monthly Notices of the Royal Astronomical Society,
375, 425Weniger, C. 2012, ArXiv e-print 1204.2797White, S. D. M., & Rees, M. J. 1978, Monthly Notices of the
Royal Astronomical Society, 183, 341Yang, R., Yuan, Q., Feng, L., Fan, Y., & Chang, J. 2012, ArXiv
e-print 1207.1621Yusef-Zadeh, F., Hewitt, J. W., Wardle, M., et al. 2012, ArXiv
e-print 1206.6882Zemp, M., Stadel, J., Moore, B., & Carollo, C. M. 2007, Monthly
Notices of the Royal Astronomical Society, 376, 273
from the (2 kpc)3 cube.