Embed Size (px)
Citation preview

An Ocean Coupling Potential Intensity (OC_PI) Index for Tropical Cyclones
Lin et al. GRL 2013; Pun et al. PIO 2013
I-I Lin*, Peter Black+; Jim Price^, Shu-Yi Chen# , Pat Harr!, C-C Wu*,Iam-Fei Pun^, Eric D’Asaro~ et al.
*Dept. of Atmospheric Sciences, National Taiwan University, Taipei, Taiwan+Naval Research Laboratory, USA
^ Woods Hole Oceanographic Inst. USA# Univ. of Miami, USA
!Naval Postgraduate School~ University of Washington, USA

• OC_PI (Emanuel 1988; Holland 1997; Bister and Emanuel 2002)
• Recent subsurface ocean warming in the WNP- hiatus (Kosaka and Xie, Nature 2013)- mega La Nina (Wang et al. PNAS 2013)

Motivation:
Proposed an improved PI (Potential Intensity) Index to include
ocean’s subsurface contribution,
as current PI (Emanuel 1988; Holland 1997) only use
SST to represent ocean
Acknowledgements: K. Emanuel (MIT)


Intensification of cyclones (e.g. Gray 1979; Emanuel 1999)
• Ambient ocean (SST + subsurface condition)
• Ambient atmosphere (wind shear etc.)
• Cyclone structure


ocean pre-condition SST (℃) D26 (m) UOHC (Kj/cm2) T100 (℃)
Megi 29.5↔30 84↔128 93↔146 27.9↔29.4
Fanapi 29.1↔29.6 53↔91 54↔98 26.6↔28
Malakas 29.5↔30 41↔47 41↔60 24.6↔25.8
Lin et al. in review 2012


Fanapi
Warmer ocean
Colder atmosphere
colder ocean
warmer atmosphere
Flux direction
SST > Ta
SST ≈ Ta
SST < Ta
Qs > Qa
Qs ~ Qa

Warmer, moister ocean
Colder, dryer atmosphere
Megi (deep subsurface ocean warm layer, fast
moving & small size)
Flux direction
SST > Ta Qs > Qa

Consider only SST is not fair for them….need more complete ocean information

T_mix is determined by
a. Before-TC thermal structure, b. Translation speed,
c. TC size, d. wind speed.
Emanuel 1988; Bister and Emanuel 1998
Price 2009


Recent global warming hiatus
(Kosaka and Xie, Nature 2013)
Mega La Nina events (Wang et al. PNAS 2013
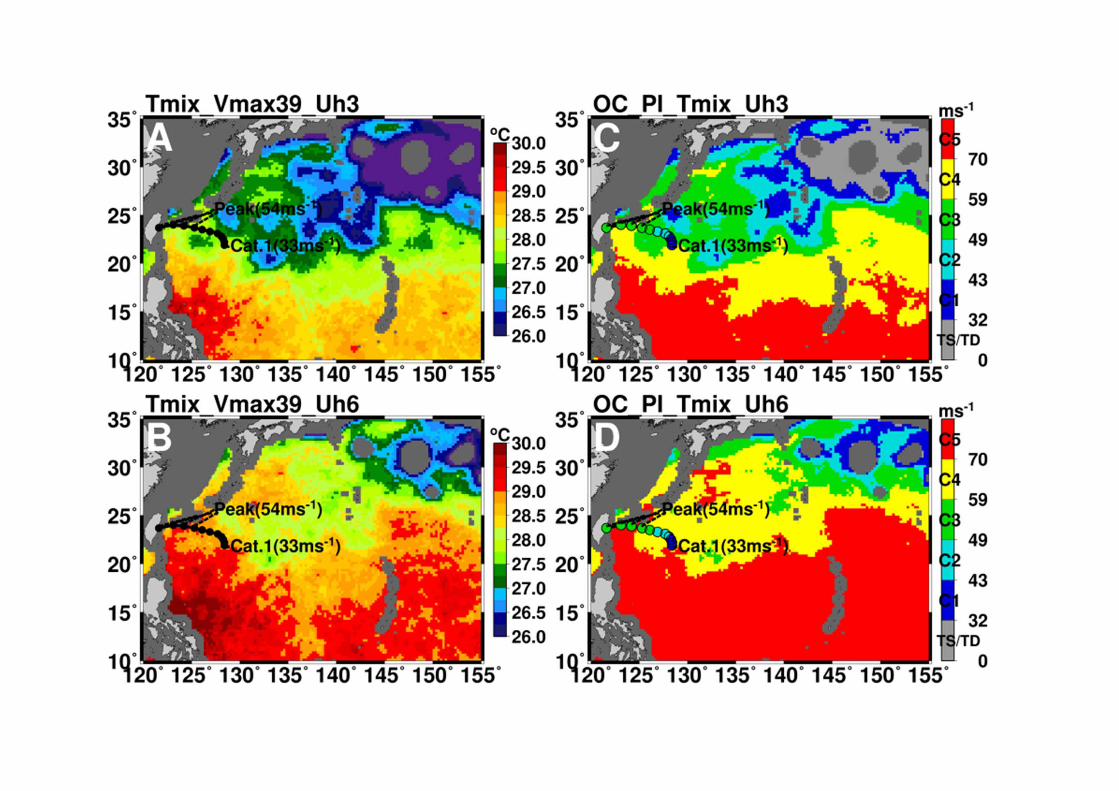
Peduzzi et al. Nat. C.C. 2012

Pun et al. in review 2013a
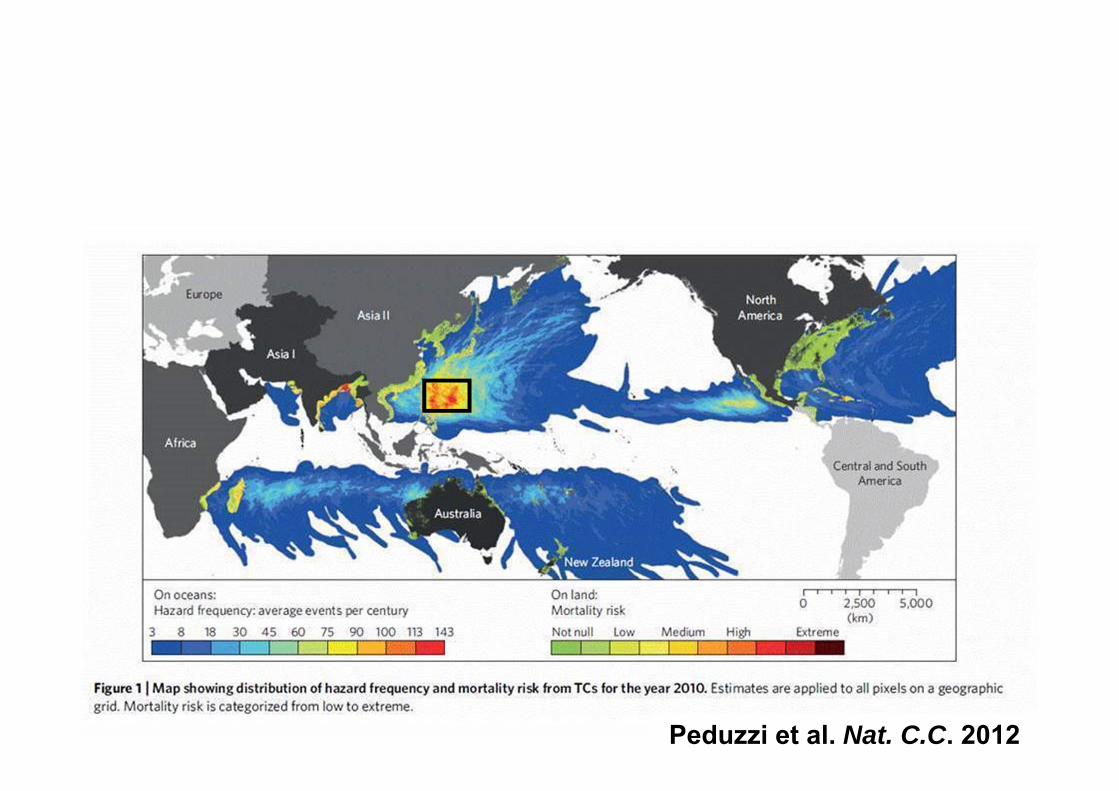
Pun et al. GRL 2013

Lin et al. MWR 2008

Pun et al. GRL 2013
D26 > 110 m area (for category-5 typhoons) increased by 15% as compared to 90’s

FIGURE 9 | (a) Spatial trend patterns in altimetry‐based sea level over 1993–2009 withrespect to the global mean rise (a uniform mean trend of 3.3 mm/year has been removed).
After Cazenave and Remy 2011

• OCPI: not only SST, but to include the coupling effect(ocean’s subsurface information, translation speed …) to obtain a more realistic potential intensity (Lin et al. GRL 2013).
• Recent warming in the WNP TC MDR, high heat content (i.e. > 100 kj/cm2 region) increase by 13%(Pun et al. GRL 2013). Potential to favour supertyphoons.- links to recent global warming hiatus or mega La Nina.
Conclusions


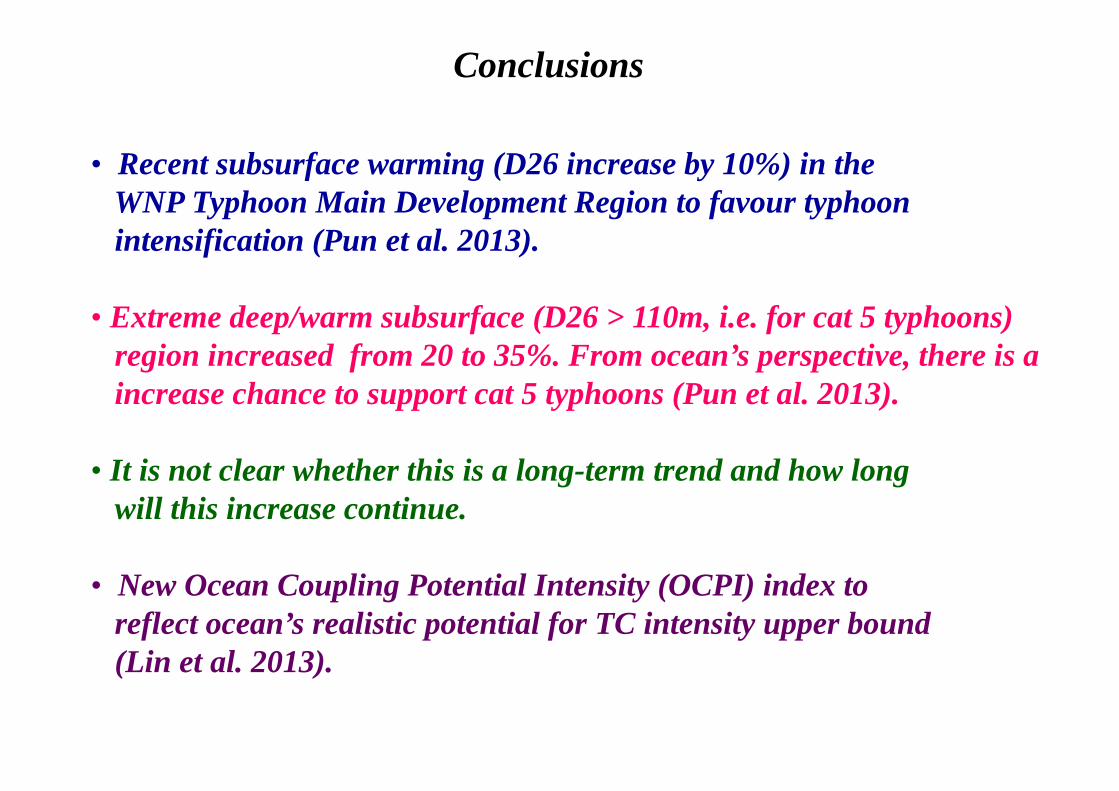
• Recent subsurface warming (D26 increase by 10%) in the WNP Typhoon Main Development Region to favour typhoon intensification (Pun et al. 2013).
• Extreme deep/warm subsurface (D26 > 110m, i.e. for cat 5 typhoons) region increased from 20 to 35%. From ocean’s perspective, there is aincrease chance to support cat 5 typhoons (Pun et al. 2013).
• It is not clear whether this is a long-term trend and how longwill this increase continue.
• New Ocean Coupling Potential Intensity (OCPI) index to reflect ocean’s realistic potential for TC intensity upper bound(Lin et al. 2013).
Conclusions

• WNP is a complex ocean with large subsurface variability,strong control on intensity (Lin et al. 2005; 2008; 2009a; 2009b; 2012).
• Advancement in satellite altimetry has bringcon us to a new era thatocean subsurface information can now be accurately obtained.(Pun et al. 2007; 2011; 2013).
• Revision of Emanuel’s MPI theory (1988) through inclusion of ocean’s subsurface information. 50% reduction in over-estimation error is achieved. OCPI representing ocean’s ‘realistic potential’ (Lin et al. GRL 2013).
Conclusion

• WNP has complex subsurface variability (> 100%) but uniform SSTthus not SST but subsurface ocean differentiates energy supply for TC intensification (Lin et al. 2005; 2008; 2009; 2013).
• OCPI – Ocean Coupling PI to include Ocean’s subsurface informationto reflect ocean’s realistic potential’ (Lin et al. 2013).
• Extreme deep/warm subsurface (D26 > 110 m) region increased from 15 to 35%. From ocean’s perspective, there is an increasechance to support cat 5 super typhoons.
• It is not clear whether this is a long-term trend and how longwill this increase continue.
Conclusions

• WNP is a complex ocean with large subsurface variability,strong control on intensity (Lin et al. 2005; 2008; 2009a; 2009b; 2012).
• Advancement in satellite altimetry has bringcon us to a new era thatocean subsurface information can now be accurately obtained.(Pun et al. 2007; 2011; 2013).
• Revision of Emanuel’s MPI theory (1988) through inclusion of ocean’s subsurface information. 50% reduction in over-estimation error is achieved. OCPI representing ocean’s ‘realistic potential’ (Lin et al. GRL 2013).
Conclusion

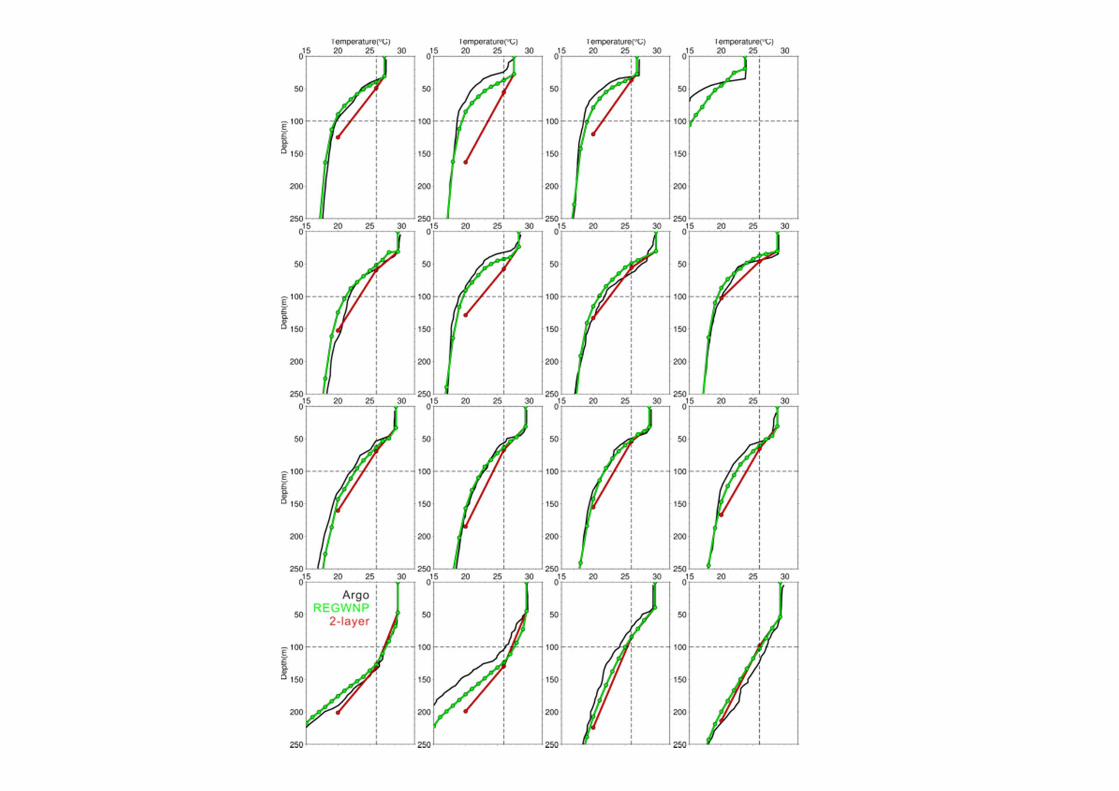
Argo is not enough, because each grid needs a profile operationally

All Summer Argo Profiles from 2000-2011

Current method by NOAA as TC forecast reference (Shay et al. 2000;
Goni et al. 2009)
New method
Pun et al. PIO in revision 2013b

Pun et al. PIO in revision 2013b

NEW version? Remove the error % lines


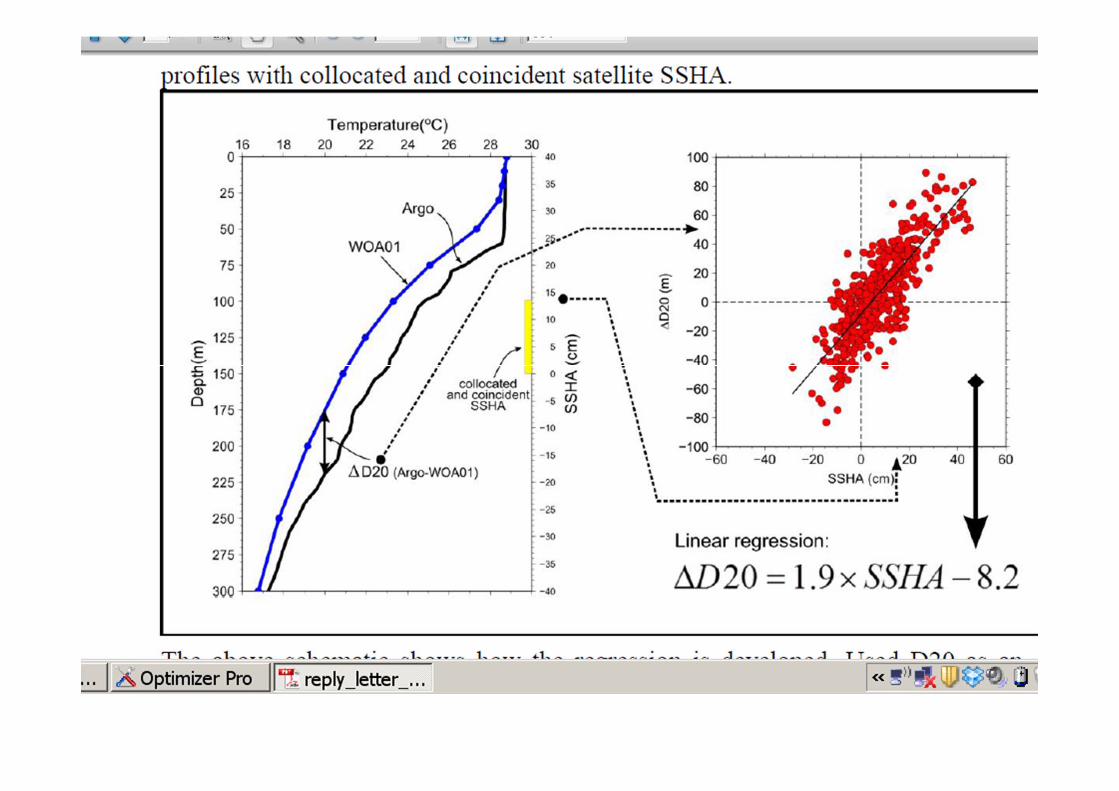
η’ = Sea surface height anomaly (SSHA)
SSHA and UOTS
http://www.aoml.noaa.gov/phod/cyclone/data/method.html
estimate
Altimeter
UOTST-profiles