Embed Size (px)
Citation preview

An-Najah National UniversityEngineering Faculty
Civil Engineering DepartmentGraduation Project II Presentation
Kinetic Analysis and Design for High Strength Municipal Wastewater
Prepared By: Ahmad Bitar Ahmad Domaidi
Osama Khader
Under the Supervision of: Abdel Fattah Hasan, Ph.D.
23/5/2012

Part A

Outline
• Objectives• Background• Methodology• Experiment Setup• Running the Experiment• Experiment Results• Data Analysis and Design
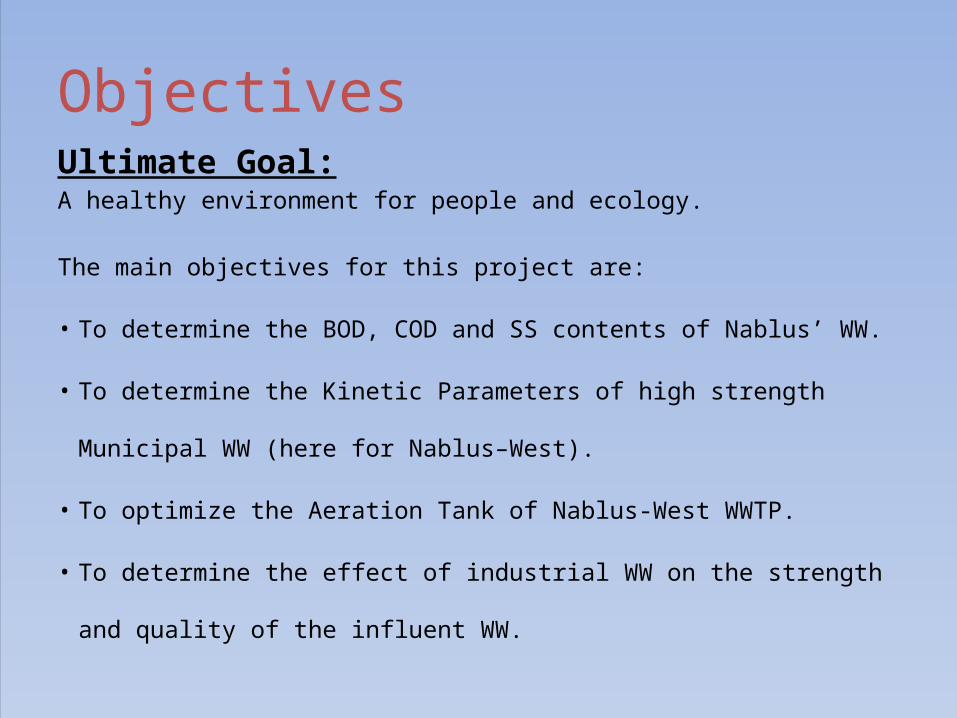
ObjectivesUltimate Goal:A healthy environment for people and ecology.
The main objectives for this project are:
• To determine the BOD, COD and SS contents of Nablus’ WW.
• To determine the Kinetic Parameters of high strength Municipal WW (here
for Nablus–West).
• To optimize the Aeration Tank of Nablus-West WWTP.
• To determine the effect of industrial WW on the strength and quality of
the influent WW.

Background
• Nablus is one of the major cities in North of the West Bank.• Our main concern will be the west of Nablus area.

Background
• Nablus’ produced wastewater used to be discharged into Wadi Zimar to the West & Wadi Badan to the East.
• Nablus-West will be the first WWTP to directly serve the western area of Nablus.
• Nablus WWTP is under construction.• Original design was done by Lahmeyer, Dr.
Beitelsmann and Hijjawi.

Background
• For the design, two methods stand out:
1) Mass Loads Design.
2) Kinetic Constants Design.
These are used for the design of the secondary treatment process.

Background
Preliminary treatment
Typically biologicaltreatment
Thickening
Background
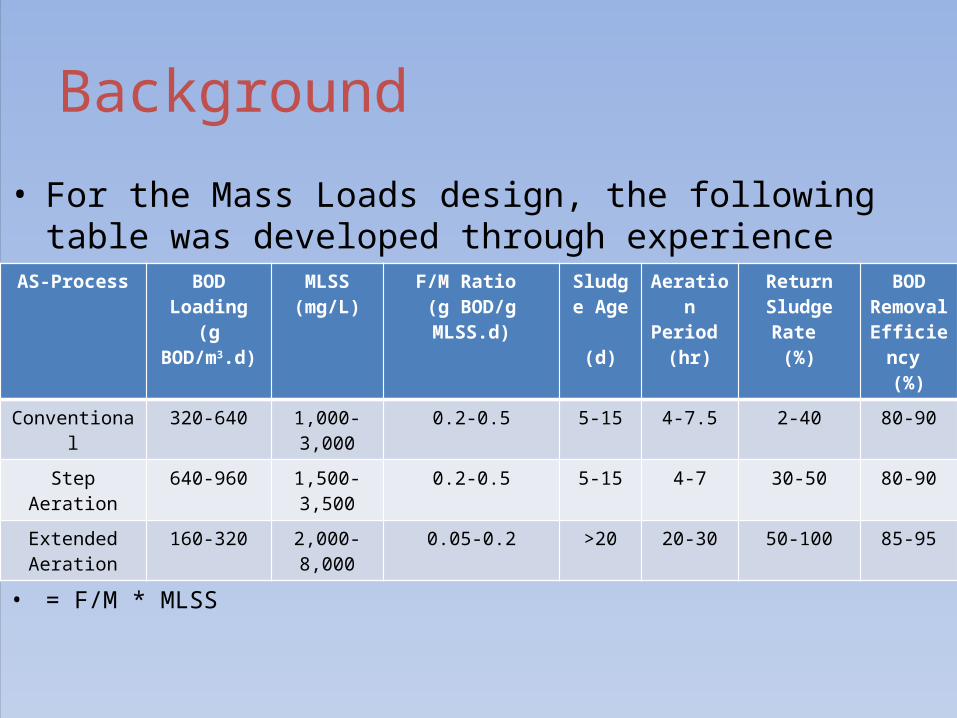
• For the Mass Loads design, the following table was developed through experience which is used for the design process:
• = F/M * MLSS
AS-Process BOD Loading (g BOD/m3.d)
MLSS (mg/L)
F/M Ratio (g BOD/g MLSS.d)
Sludge Age (d)
Aeration Period
(hr)
Return Sludge Rate
(%)
BOD Removal
Efficiency (%)
Conventional 320-640 1,000-3,000 0.2-0.5 5-15 4-7.5 2-40 80-90
Step Aeration 640-960 1,500-3,500 0.2-0.5 5-15 4-7 30-50 80-90
Extended Aeration
160-320 2,000-8,000 0.05-0.2 >20 20-30 50-100 85-95

Background

Background
• As for the Kinetic Constants design, it was developed since it more closely represents the actual kinetic behavior of the microorganisms.
• Kinetic Constants give a more conservative design for the aeration tank in the activated sludge treatment system design.

Background
• In short, Kinetic Constants depend on the type of bacteria as well as the concentration of BOD in the wastewater.
• The effect of industry (main producer of COD), which has a significant presence in Nablus, should be considered as well.

Background
The four Kinetic Parameters that need to be determined for the design are:
• Y= growth yield, in mg VSS/mg BOD (or mg COD).
• kd= microbial decay coefficient, in d-1.
• Ks= saturation constant, in mg/L of BOD (or COD).
• k= maximum rate of substrate utilization per unit
mass of biomass, in d-1.
Background
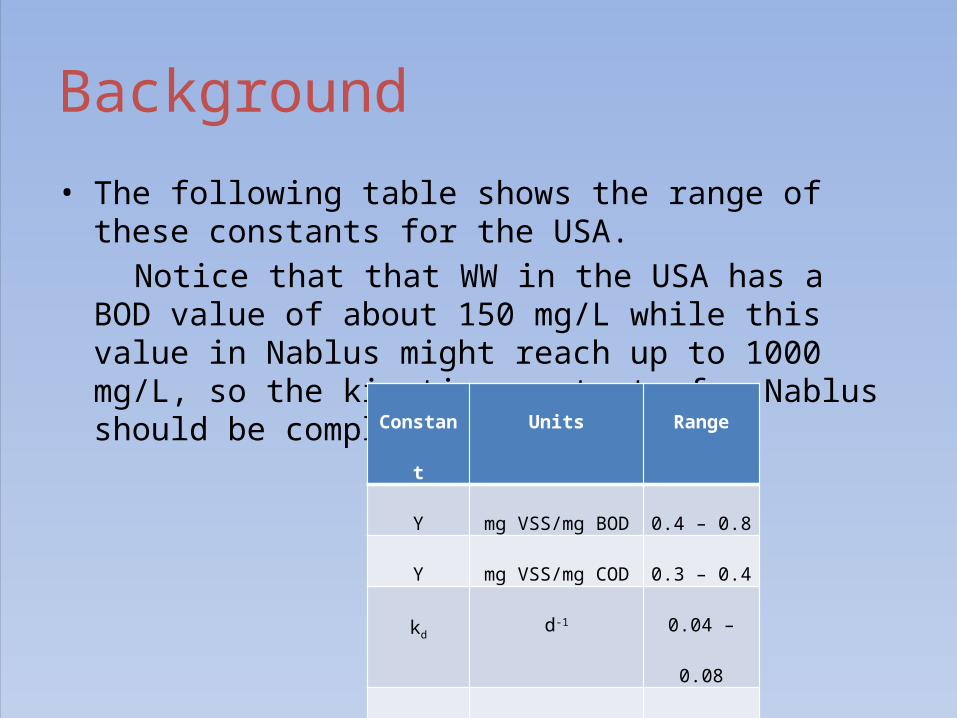
• The following table shows the range of these constants for the USA.
Notice that that WW in the USA has a BOD value of about 150 mg/L while this value in Nablus might reach up to 1000 mg/L, so the kinetic constants for Nablus should be completely different.
Constant Units Range
Y mg VSS/mg BOD 0.4 – 0.8
Y mg VSS/mg COD 0.3 – 0.4
kdd-1 0.04 – 0.08
Ksmg/L of BOD 25 – 100
Ksmg/L of COD 25 – 100
k d-1 4 - 8
Background
• We are caught between two minds, should we design based on the Kinetic Constants or the Mass Loads?

Methodology
• Design Period was set for 30 years.• The Population and Hydraulic Loads were
determined through two approaches:

Methodology
• Approach (I):Population, assuming a 2.22% growth rate, will be 449,722 in 2042.
• Design Population will be: 450,000.• Assuming a 100 L/c.d water consumption rate,
the following values will be used for design:
Water Consumption Per Day (m3) 45,000
Equivalent Flow from Industry Per Day (m3) 10,000
Estimated Infiltration Per Day (m3) 5,000
Total Design Flow Per Day (m3) 60,000

Methodology
• Approach (II):Taking the values for the population and hydraulic loads from the estimations of the original design team (Lahmeyer, Dr. Beitelsmann and Hijjawi) the following table was created:
Stage 1 (2020) First Extension Final Extension (2035)
Population Equivalents 150,000 225,000 300,000
Average Flow (m3/d)14,860 19,707 27,377
Peak Flow (m3/d)19,037 24,607 34,239

Methodology
The four Kinetic Parameters that need to be determined for the design are:
• Y= growth yield, in mg VSS/mg BOD (or mg COD).
• kd= microbial decay coefficient, in d-1.
• Ks= saturation constant, in mg/L of BOD (or COD).
• k= maximum rate of substrate utilization per unit
mass of biomass, in d-1.

Methodology• Using the Kinetic Parameters we found, the following
equation will be used to determine the volume of the Aeration tank:
where:
• θc: mean cell residence time, in time.
• Q: rate of influent flow.
• S0: concentration of substrate in influent flow ( soluble BOD or COD ).
• Se: concentration of substrate in effluent flow, recirculating sludge, and aeration tank ( soluble BOD or COD ).
• X: concentration of biomass in aeration tank (MLVSS).
• U: specific substrate utilization rate, in time -1.

Methodology• And those two equations will be used to find
the remaining terms:

Methodology
• From the two following curves, the Kinetic Constants can be determined:
0 5 10 15 20 25
-4
-2
0
2
4
6
8
10
U (1/day)
1/θc
(1/d
ay)
Slope = Y
kd= (1/day)

Methodology
0 5 10 15 20 250
2
4
6
8
10
12
14
16
1/Se (1/ {mg/L of BOD})
1/U
(day
) Slope = Ks/k
1/k (day)

Experimental Setup Primary Sedimentation
TankBuffer Tank
Aerators
Aeration Tank

Experimental Setup
Air Diffusers
Aeration
Tank
Magnetic Stirrers
InflowOutflow
Sludge Removal
Experimental Setup
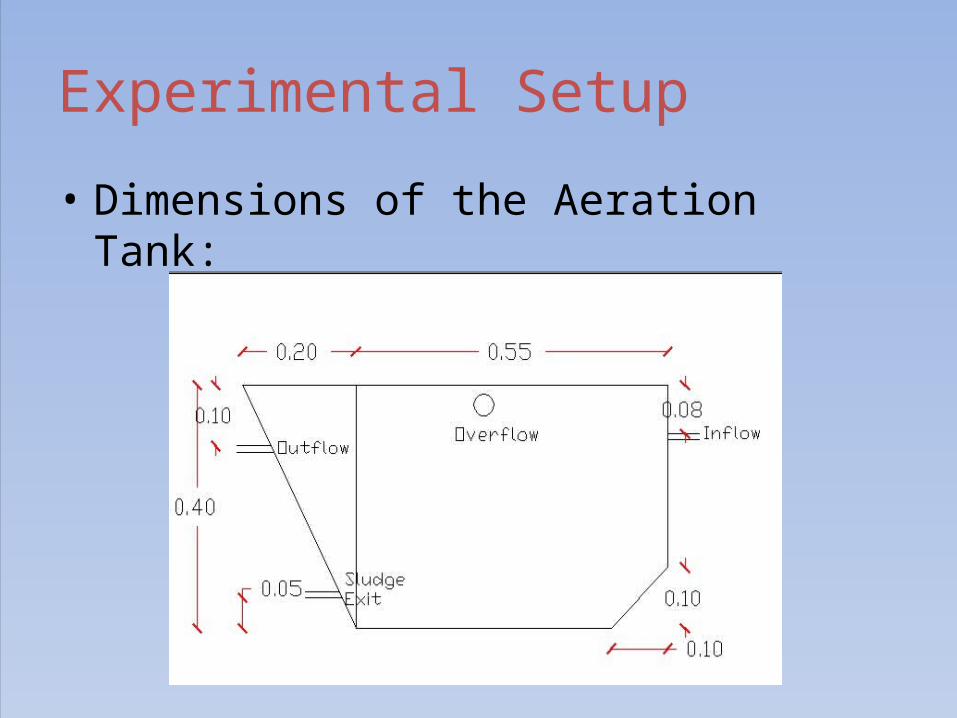
• Dimensions of the Aeration Tank:

Experimental Setup
Experimental Setup
• The system was checked to make sure it provides complete mixing and it has no “dead zones”, and provides complete drainage for the whole system.

Experimental Setup

Experimental Setup

Experimental Setup

Experimental Setup
Experimental Setup

Experimental Setup

Running the Experiment
• Samples were taken on a daily basis, during the period from Mar, 19th to April, 12th.
• Those samples were used to feed the previously illustrated system to make sure that a continuous flow of 3-8 L/h was maintained.

Sampling Location
• About 500 m to the west of Shaghoor Swimming Resort.

Collecting the Samples
• About 100 L were collected daily.

Collecting the Samples

Packing

Collecting Samples from the SystemSamples were poured into the PST. After settling, they were discharged into the rest of the system.
The following day, samples from the inflow and outflow were taken to determine their COD content.
Samples from three places in the AT were taken the following day as well to find the Avg. SS content

Experiment Results
• DO values:Measurements for the DO were carried out daily. The following graph shows the obtained values:
22-Mar 27-Mar 1-Apr 6-Apr 11-Apr 16-Apr 21-Apr 26-Apr0
2
4
6
8
10
12
DO Concentration (ppm)
Date
Conc
entr
ation
(ppm
)

Experiment Results
16-Mar
18-Mar
20-Mar
22-Mar
24-Mar
26-Mar
28-Mar
30-Mar
1-Apr
3-Apr
5-Apr
7-Apr
9-Apr
11-Apr
13-Apr
15-Apr
17-Apr
19-Apr
21-Apr
23-Apr
25-Apr
1500
2000
2500
3000
3500
4000
4500
5000
5500
6000
6500
7000
Suspended Solids Concentration (after Primary Sedimentation) (ppm)
Date
Conc
entr
ation
(ppm
)
Avg. Value for Design:4000 ppm

Experiment Results
19-Mar
20-Mar
21-Mar
22-Mar
23-Mar
24-Mar
25-Mar
26-Mar
27-Mar
28-Mar
29-Mar
30-Mar
31-Mar
1-Apr
2-Apr
3-Apr
4-Apr
5-Apr
6-Apr
7-Apr
8-Apr
9-Apr
10-Apr
11-Apr
12-Apr
0
500
1000
1500
2000
2500
COD Influent & Effluent Concentration (ppm)
Date
Conc
entr
ation
(ppm
)
Avg. Inflow COD concentration:682 ppm
Experiment Results
0.0
10.0
20.0
30.0
40.0
50.0
60.0
70.0
80.0
90.0
100.0
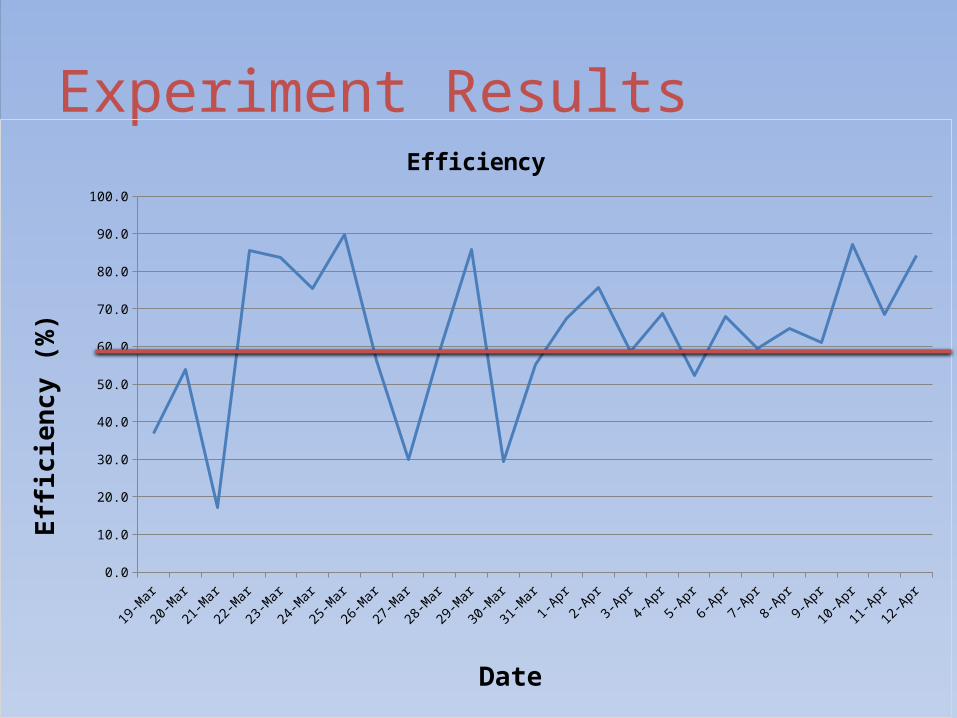
Efficiency
Date
Effici
ency
(%)

Experiment Results
• BOD:Using a conversion factor of 0.7 the value used for design for the inflow BOD will be equal to:0.7*680= 480 ppm
Experiment Results
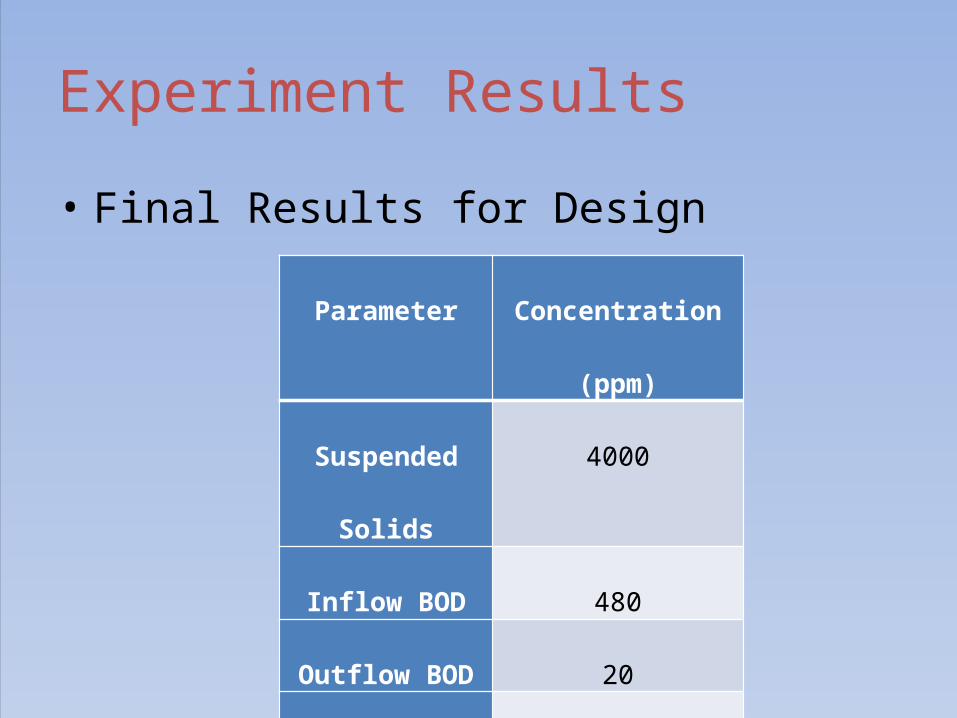
• Final Results for Design
Parameter Concentration (ppm)
Suspended Solids 4000
Inflow BOD 480
Outflow BOD 20
Outflow SS 30

Finding the Kinetic Constants
• After Properly organizing and interpreting the results, the following two graphs were obtained:
0.1 0.15 0.2 0.25 0.3 0.35 0.4 0.45 0.5 0.550
2
4
6
8
10
12f(x) = NaN x + NaNR² = 0
U (per day)
1/SR
T (p
er d
ay)

Experiment Results
• From the graphs, the following results were obtained:
* COD: *BOD(using a conversion factor of 0.7):
Y 0.26 mg VSS/mg BOD
Ks660 mg BOD/L
k 2.56 d-1
kd0 d-1
Y 0.18 mg VSS/mg COD
Ks940 mg COD/L
k 2.56 d-1
kd0 d-1

Design Based on Mass Loads
• The following table shows the limitations for this type of design:
Process BOD Load (g/m3.d) Aeration Period (h) Maximum Inflow BOD (ppm)
Conventional Lower Limit 320 4 53
Upper Limit 640 7.5 200
Step Aeration Lower Limit 640 4 107
Upper Limit 960 7 280
Extended Lower Limit 160 20 133
Upper Limit 320 30 400

Design Based on Mass Loads
• Using the following two equations, the volumes for the Aeration Tank will be obtained:

Design Based on Mass Loads
• Approach (I):Process BOD Load (g/m3.d) Volume (m3) HRT (h)
Conventional Lower Limit 320 90,000 36
Upper Limit 640 45,000 18
Average 480 60,000 24
Step Aeration Lower Limit 640 45,000 18
Upper Limit 960 30,000 12
Average 800 36,000 14.4
Extended Lower Limit 160 180,000 72
Upper Limit 320 90,000 36
Average 240 120,000 48
HRT values don’t apply

Design Based on Mass Loads
• Approach (II):
Stage I
Process BOD Load (g/m3.d) Volume (m3) HRT (h)
Conventional Lower Limit 320 28,555.5 11 Upper Limit 640 14,277.8 6 Average 480 19,037 8Step Aeration Lower Limit 640 14,277.8 6 Upper Limit 960 9,518.5 4 Average 800 11,422.2 5Extended Lower Limit 160 57,111 23 Upper Limit 320 28,555.5 11 Average 240 38,074 15

Design Based on Mass Loads
• Approach (II):Extension I
Process BOD Load (g/m3.d) Volume (m3) HRT (h)
Conventional Lower Limit 320 36,910.5 15 Upper Limit 640 18,455.3 7 Average 480 24,607 10Step Aeration Lower Limit 640 18,455.3 7 Upper Limit 960 12,303.5 5 Average 800 14,764.2 6Extended Lower Limit 160 73,821 30 Upper Limit 320 36,910.5 15 Average 240 49,214 20

Design Based on Mass Loads
• Approach (II):Extension II
Process BOD Load (g/m3.d) Volume (m3) HRT (h)
Conventional Lower Limit 320 51,358.5 21 Upper Limit 640 25,679.3 10 Average 480 34,239 14Step Aeration Lower Limit 640 25,679.3 10 Upper Limit 960 17,119.5 7 Average 800 20,543.4 8Extended Lower Limit 160 102,717 41 Upper Limit 320 51,358.5 21 Average 240 68,478 27

Design Based on Kinetic Constants
• Approach (I):Using the following equations, the volume for the Aeration Tank will be obtained:
Y 0.26 mg VSS/mg BOD
Ks660 mg BOD/L
k 2.56 d-1
kd0 d-1
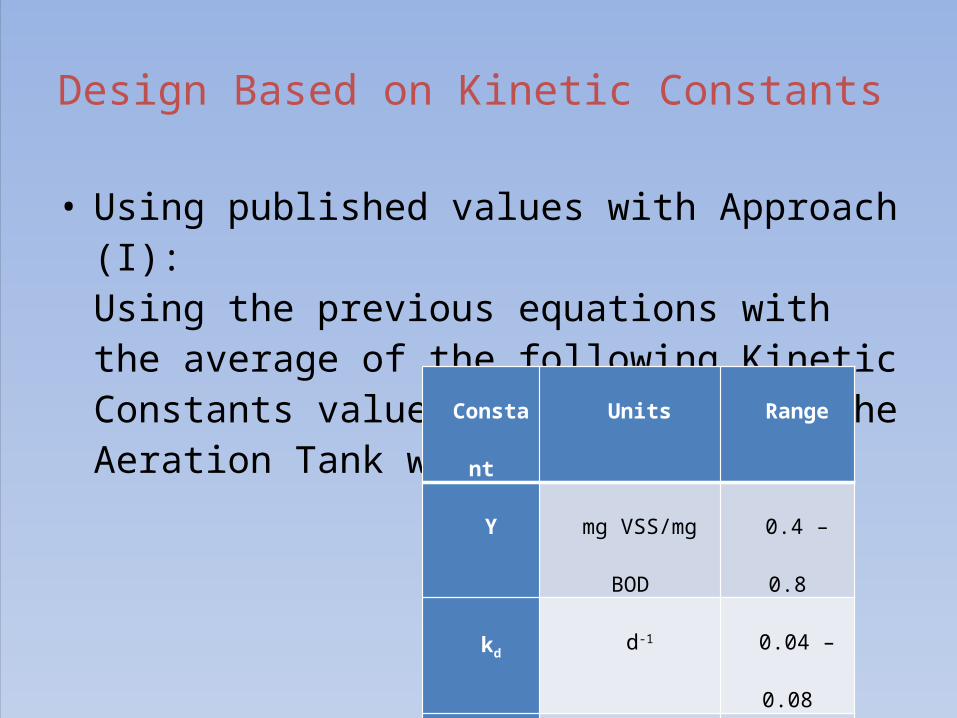
Design Based on Kinetic Constants
• Using published values with Approach (I):Using the previous equations with the average of the following Kinetic Constants values, the volume for the Aeration Tank will be obtained:
Constant Units Range
Y mg VSS/mg BOD 0.4 – 0.8
kdd-1 0.04 – 0.08
Ksmg/L of BOD 25 – 100
k d-1 4 - 8

Design Based on Kinetic Constants
• Approach (II):• Stage 1:
• Extension I:
• Extension II:

Steady Modeling Program
• Several runs were carried out using Steady Modeling Program.
• Steady is a program for WWTP modeling.
• It was created by Professors Luis Aburto-Garnica and Gerald E. Speitel Jr. of the Civil Engineering Department at the University of Texas (Austin).

Steady Modeling Program
Steady Modeling Program
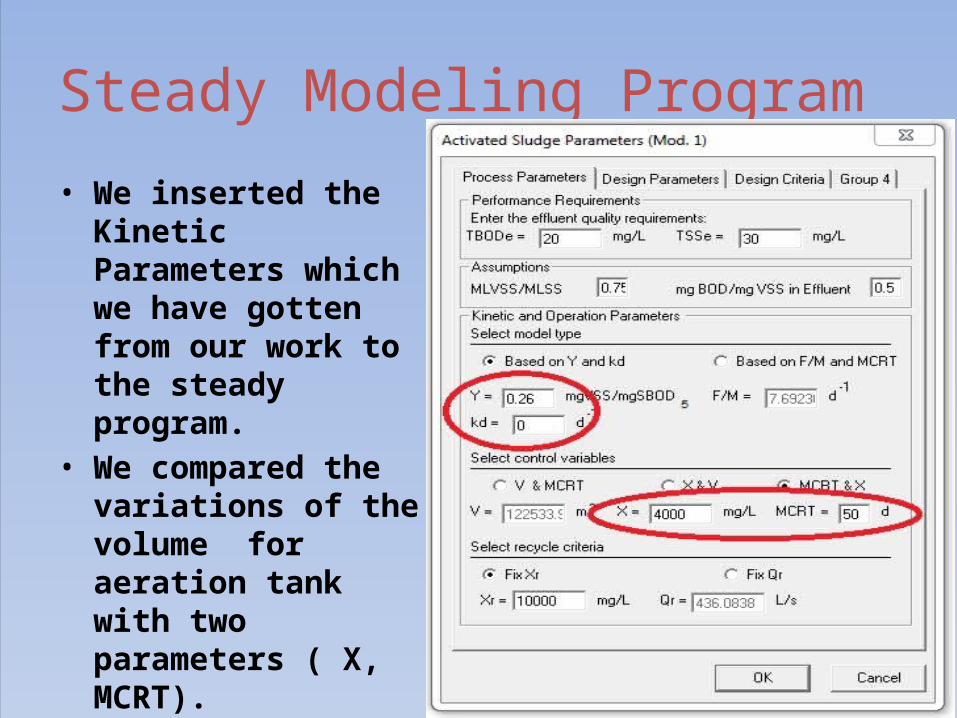
• We inserted the Kinetic Parameters which we have gotten from our work to the steady program.
• We compared the variations of the volume for aeration tank with two parameters ( X, MCRT).
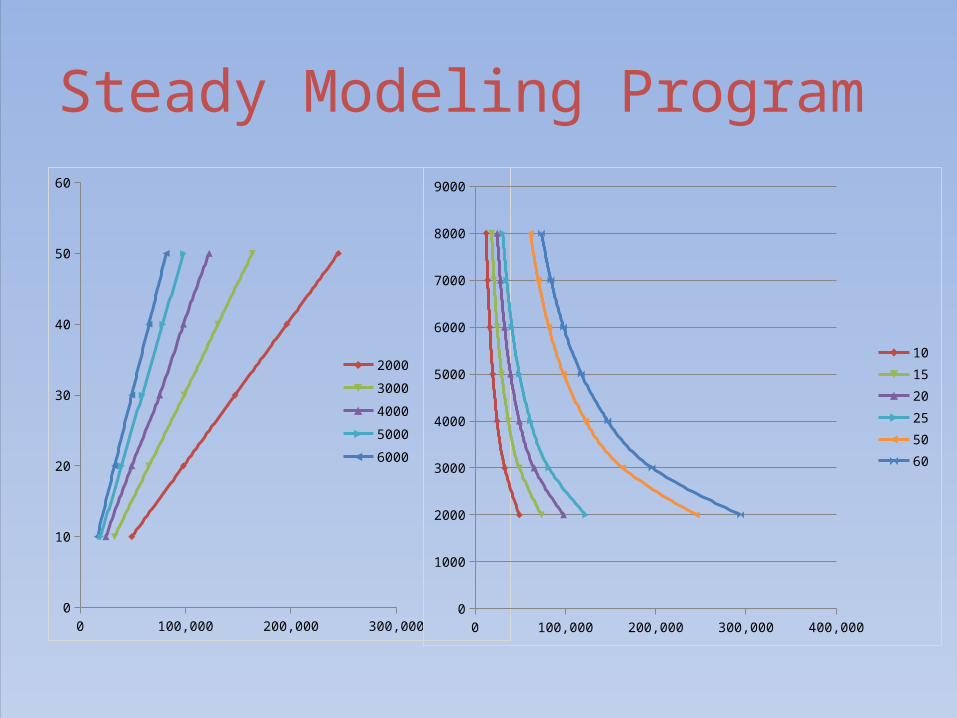
Steady Modeling Program
0 50,000 100,000 150,000 200,000 250,000 300,0000
10
20
30
40
50
60
2000
3000
4000
5000
6000
0 50,000 100,000 150,000 200,000 250,000 300,000 350,0000
1000
2000
3000
4000
5000
6000
7000
8000
9000
101520255060

DESIGN CHART FOR AT OF NABLUS WEST
Q= 2500 m3/h

GENERAL DESIGN CHART FOR AT OF HIGH STRENGHT MUNICIPAL WW
Q= 1 m3/h

Part B
Industrial Wastewater in Nablus
City

sub objective:
• Determine the amounts of industrial wastewater for a sample of factories .
WHY?• Industrial wastewater usually is low flow
compare to domestic wastewater flow but contains high contamination(BOD,COD,SS).

Water resources in Nablus:

Traditional IndustriesSoap Industry:

Vegetable oil:

Stone Crushing:

Furniture Industry:

The Tuhineh:
sweet industries:

Methodology

Methodology
Collecting data

Data collection
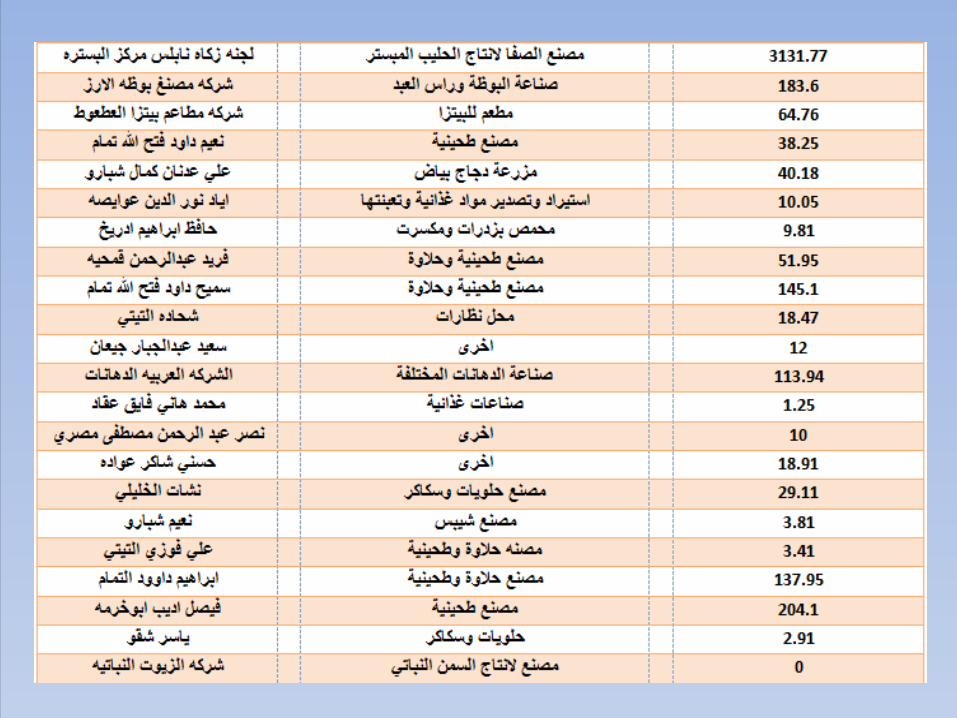
From municipality of Nablus and chamber of commerce and industry we get:1. Main industries2. Water consumption for each one


Methodology
Collecting data
Analyzing data
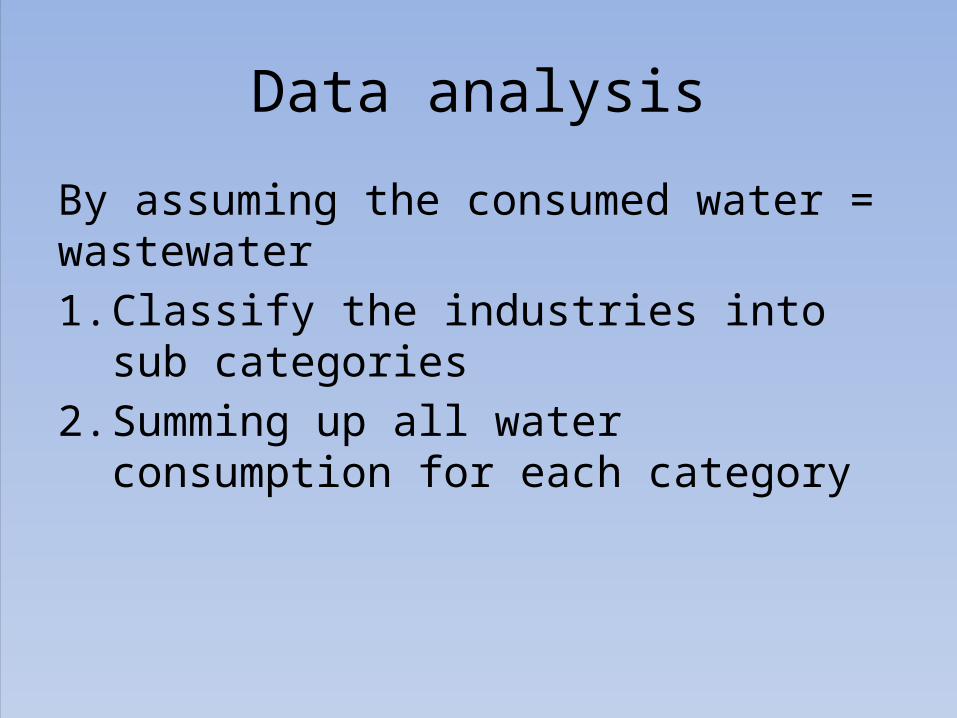
Data analysis
By assuming the consumed water = wastewater1. Classify the industries into sub categories2. Summing up all water consumption for each
category

Results of data analysis
From this results we can see that the largest amount of waste water comes from the ( food industries ) high BOD and ( stone crushing ) high SS.
Industry Quantity (m3/month)
Constructions, Queries 2500
Tahenah, Halawah1100
Sweets1100
Food 4000
Chemicals550
Leather, Glass, Plastic, Textile370
Service Industries580
Other650

Methodology
Collecting data
Analyzing data
Final results

BOD, COD, SS, P, N in Wastewater :
Industry Quantity (m3/month)
BOD COD SS N P
Constructions, Queries 2500
Tahenah, Halawah1100
Sweets1100
Food 4000
Chemicals550
Leather, Glass, Plastic, Textile
370
Service Industries580
Other650

Nablus city
west east
domestic industrial domestic industrial
BOD: 55 g/c.dCOD: 75 g/c.dSS: 80 g/c.dN: 50 g/c.dP: 2 g/c.d
TO WWTP
Work for another group

Benefits
• Political: treating wastewater using Nablus-West WWTP will deprive the Israelis of the revenues they generate through treating Palestinian WW.
• Economical: building and running the WWTP will provide job opportunities on the medium and long term for local workforce.

Benefits
• Social: through building the sewer line that reaches the plant to the west of the city, the unsavory sight of flowing WW would be eliminated.It will be replaced by the view of treated WW flowing in the wadi after the WWTP instead.
• Health: many pathogens that originate from WW would not be exposed anymore, resulting in better health for residents of the nearby area.

Benefits
• Environmental:1) Providing water for irrigation purposes in the nearby agricultural areas.2) Using excess water for groundwater recharge.3) Dried sludge can be used for fertilizing.