Embed Size (px)
Citation preview
MOVING THINK INGFORWARD
“An Iterative Capacity Constrained Parking Methodology for Ridership Forecasts for BART Extension Stations”
Mike AronsonMay 19, 2015
15th TRB National Transportation Planning Applications Conference
MOVING THINK INGFORWARD2
Presentation Overview
1. BART Livermore extension2. Available modeling tools3. Problems encountered4. Parking constraint approach5. Next time!
MOVING THINK INGFORWARD3
Disclaimer
• Incremental retrofit to address key issues– Fit schedule and budget constraints
• This is not a recommended start-to-finish approach• However, components could be applied to other
studies
MOVING THINK INGFORWARD
1. BART to Livermore Extension
MOVING THINK INGFORWARD5
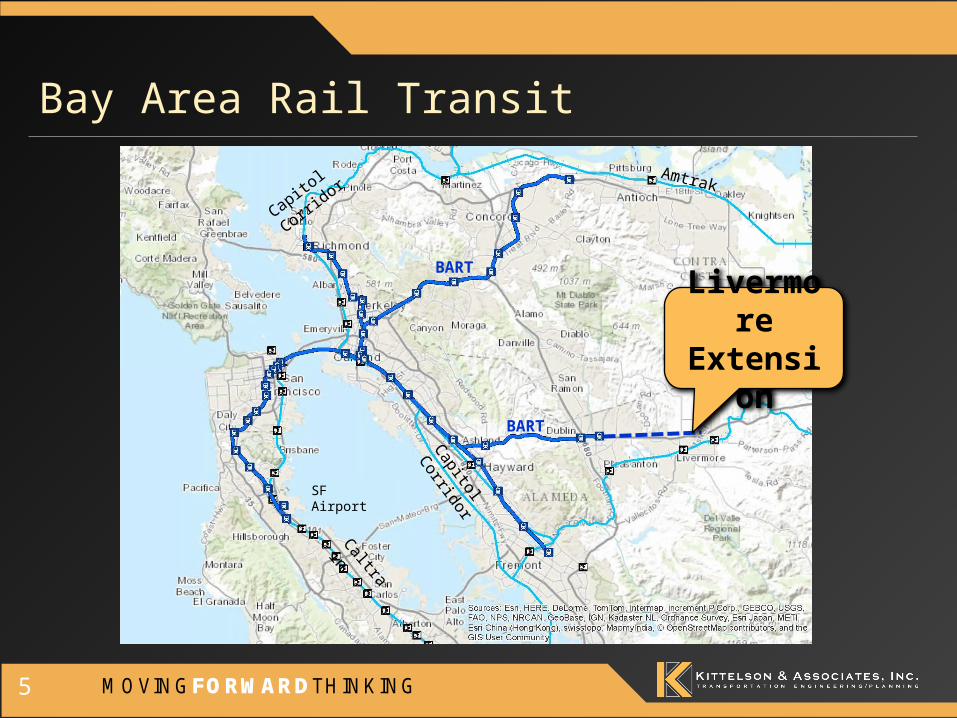
Bay Area Rail TransitAmtrak
ACE Commuter
Rail
Caltrain
Capitol Corridor
Capitol Corrid
or
BART
BART
SF Airport
Livermore Extension
MOVING THINK INGFORWARD6
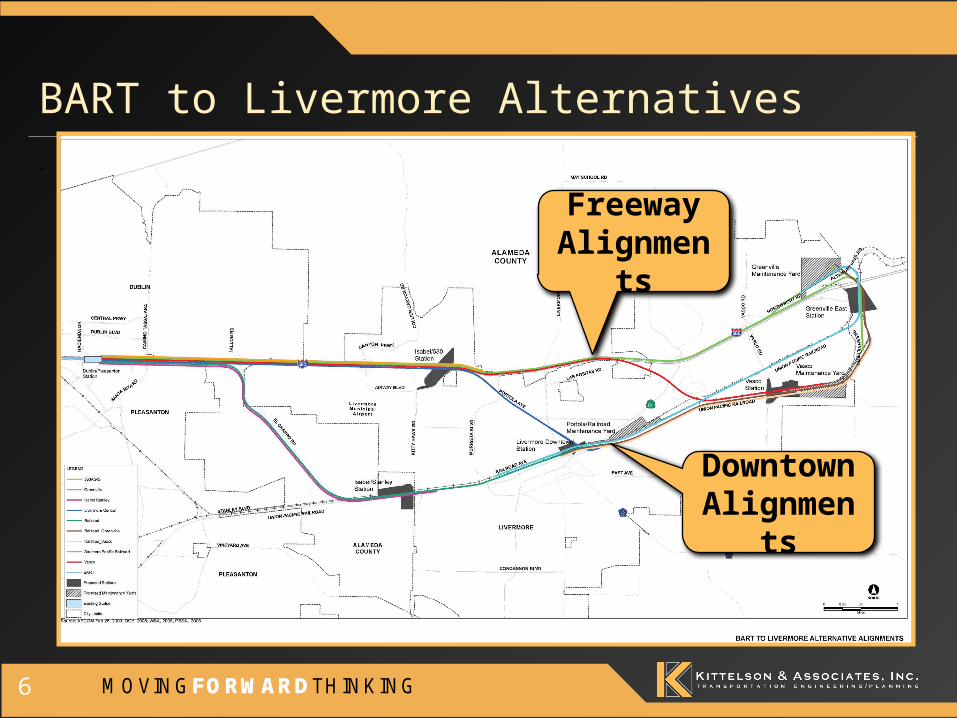
BART to Livermore Alternatives• San Jose
Freeway Alignments
Downtown Alignments
MOVING THINK INGFORWARD
2. Available Modeling Tools
MOVING THINK INGFORWARD8
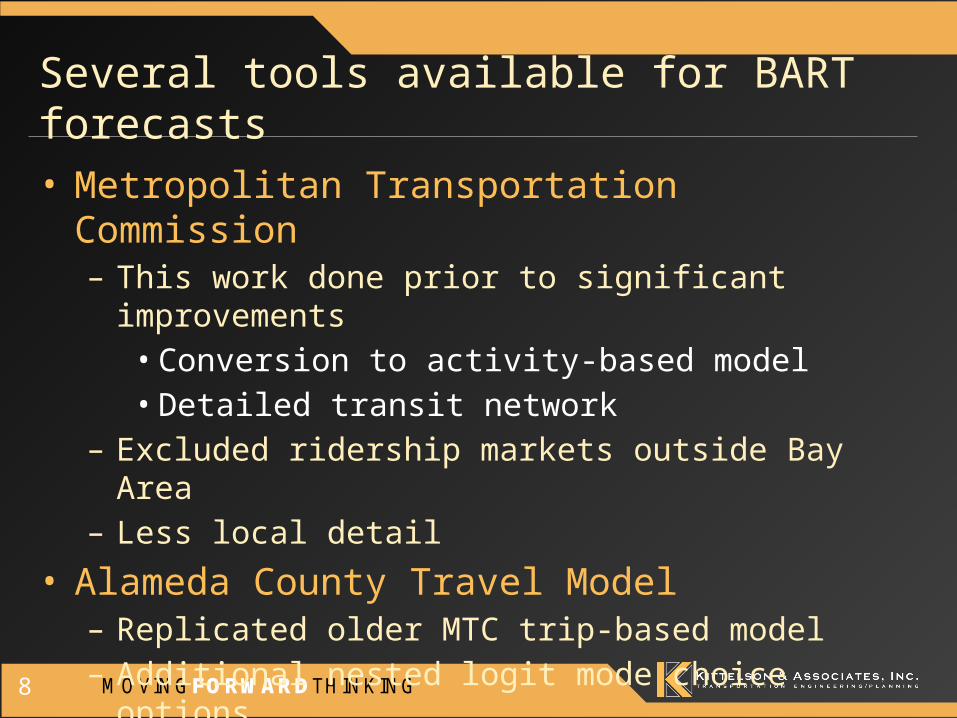
Several tools available for BART forecasts
• Metropolitan Transportation Commission– This work done prior to significant improvements• Conversion to activity-based model• Detailed transit network
– Excluded ridership markets outside Bay Area– Less local detail
• Alameda County Travel Model– Replicated older MTC trip-based model– Additional nested logit mode choice options– Includes adjacent county
MOVING THINK INGFORWARD9
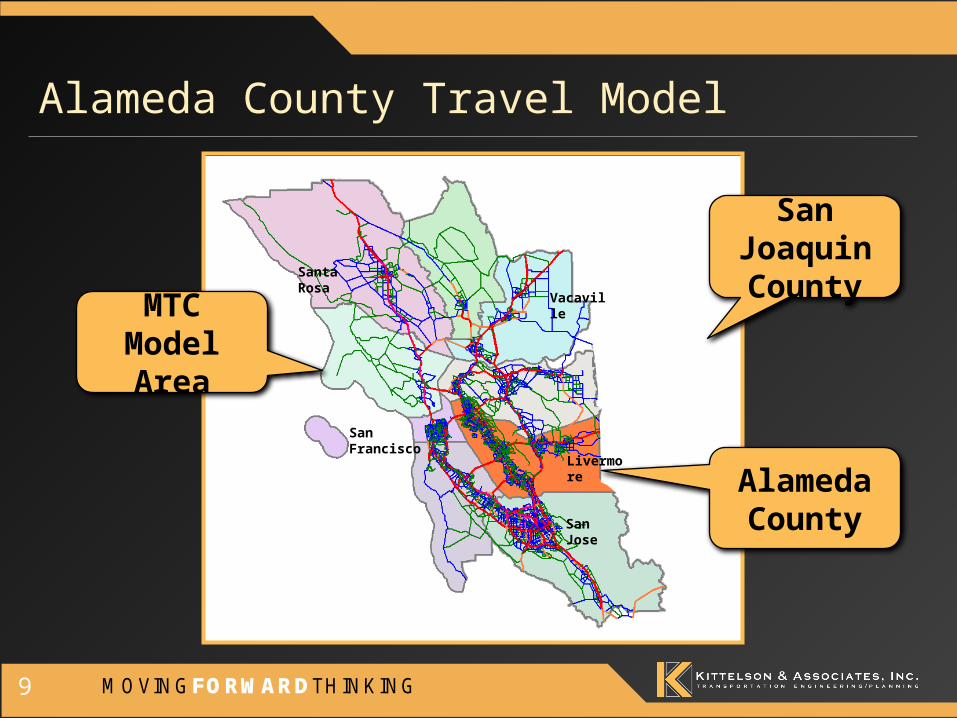
Alameda County Travel Model
San Francisco
San Jose
Stockton
Santa Rosa
Vacaville
MTC Model Area
Livermore
San Joaquin County
Alameda County
MOVING THINK INGFORWARD10
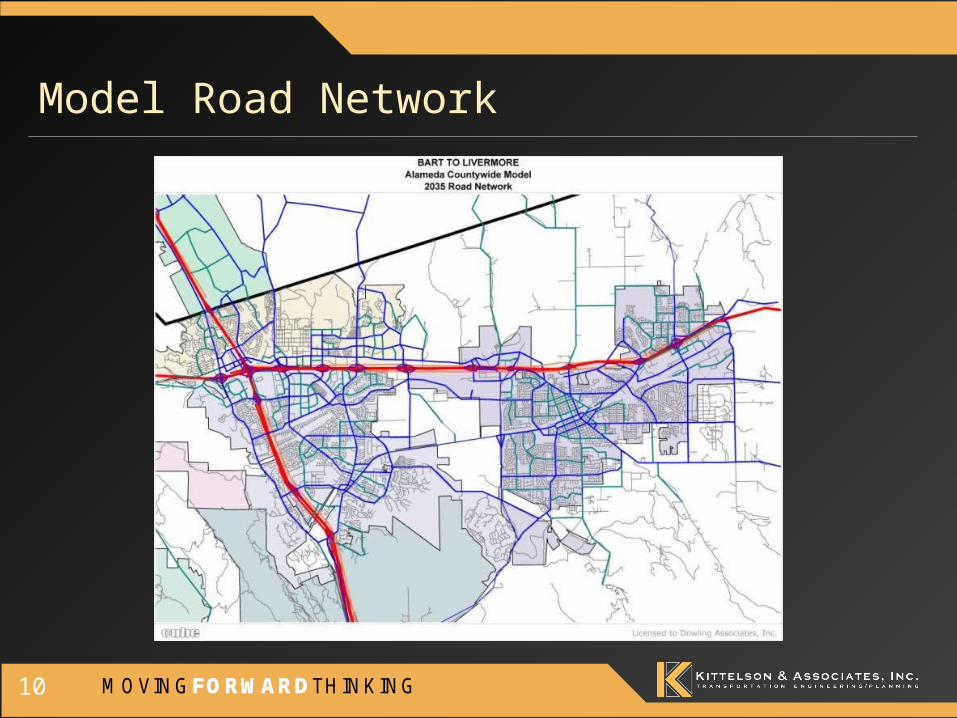
Model Road Network

MOVING THINK INGFORWARD11
Model Transit Network

MOVING THINK INGFORWARD
3. Problems Encountered
MOVING THINK INGFORWARD13
BART Extension Ridership Issues
• “Build” vs. “No Build”– Minimal increase
• Unrealistic station parking demands• Transit assignment– “All or nothing” park-and-ride
• Auto assignment– No park-and-ride vehicles included
MOVING THINK INGFORWARD14
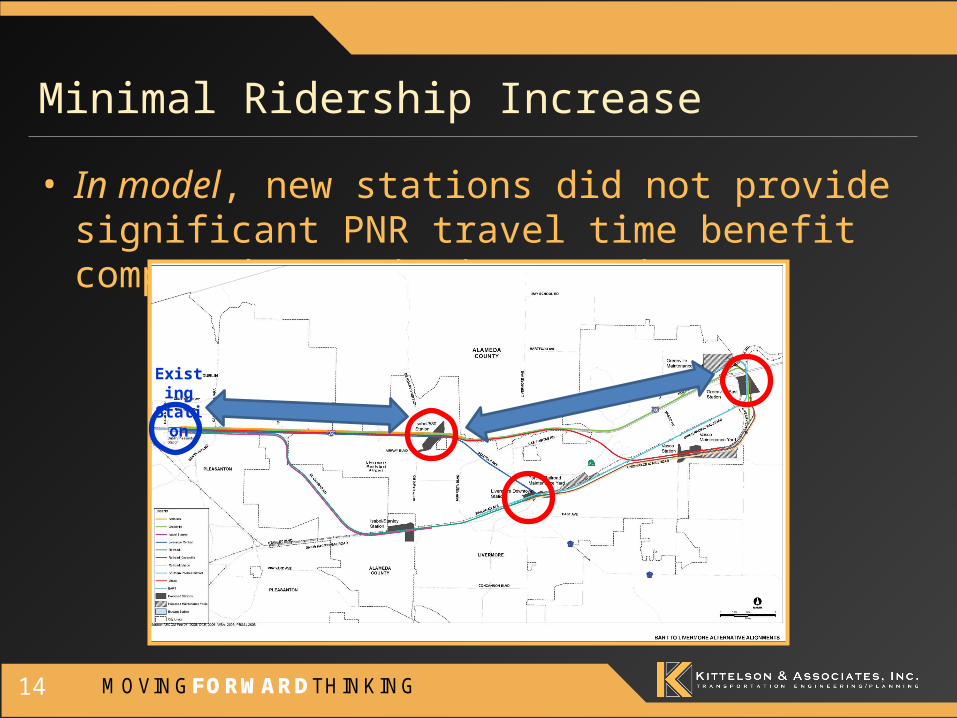
Minimal Ridership Increase
• In model, new stations did not provide significant PNR travel time benefit compared to existing stations
Existing Station
MOVING THINK INGFORWARD15
Excess Park-and-Ride Demand
• Standard model used fixed park-and-ride access time– 2 to 8 minutes based on existing calibration
• “Best path” transit park-and-ride calculations assign all demand from San Joaquin County to same station– Parking demand >10,000 for maximum 4,500 spaces
• Manual adjustments to parking access time only moved problem from one station to another
MOVING THINK INGFORWARD
4. Parking Constraint Approach
MOVING THINK INGFORWARD17
Iterative Transit Parking Approach
• Dynamic parking access times– Time between vehicle at station and passenger on platform– Increase based on demand
• Mode Choice– Equilibrate to parking access time
• “Dynamic” park-and-ride assignment– 10 increments reacting to parking access times
• Divert remaining excess parking demand– Shift trips back to auto mode for assignment
MOVING THINK INGFORWARD18
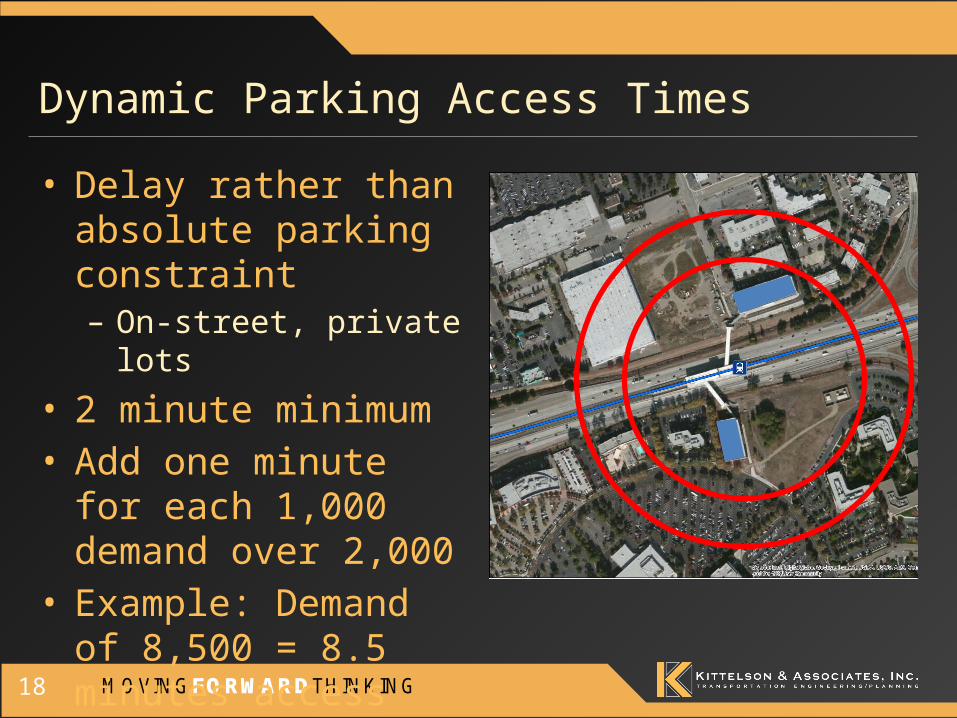
Dynamic Parking Access Times
• Delay rather than absolute parking constraint– On-street, private lots
• 2 minute minimum• Add one minute for each
1,000 demand over 2,000• Example: Demand of
8,500 = 8.5 minutes access time
MOVING THINK INGFORWARD19
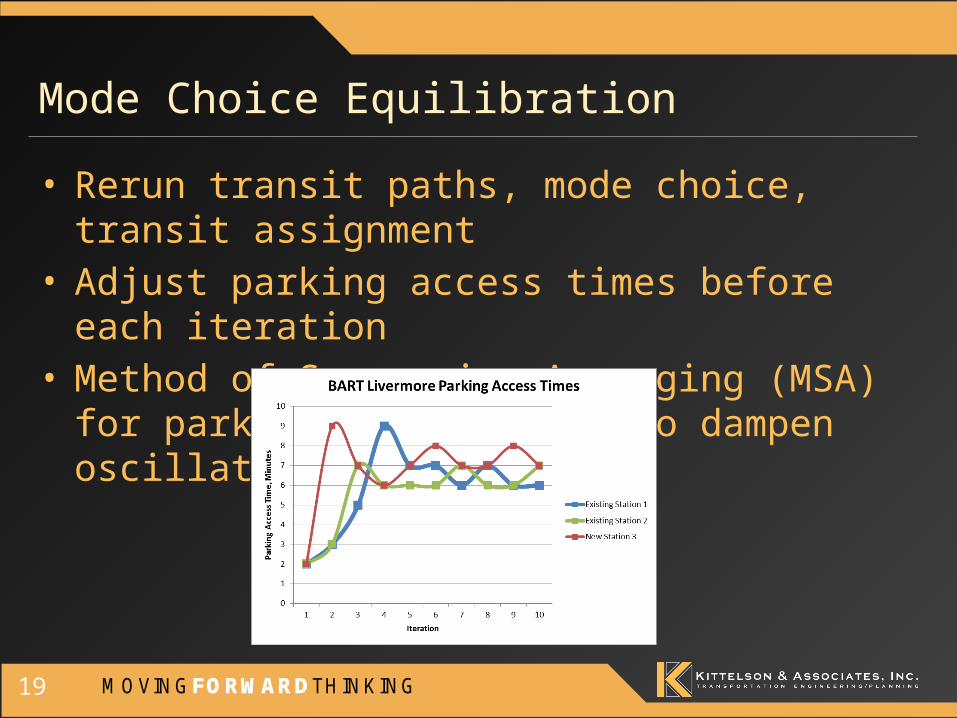
Mode Choice Equilibration
• Rerun transit paths, mode choice, transit assignment• Adjust parking access times before each iteration• Method of Successive Averaging (MSA) for parking
access times to dampen oscillations
MOVING THINK INGFORWARD20
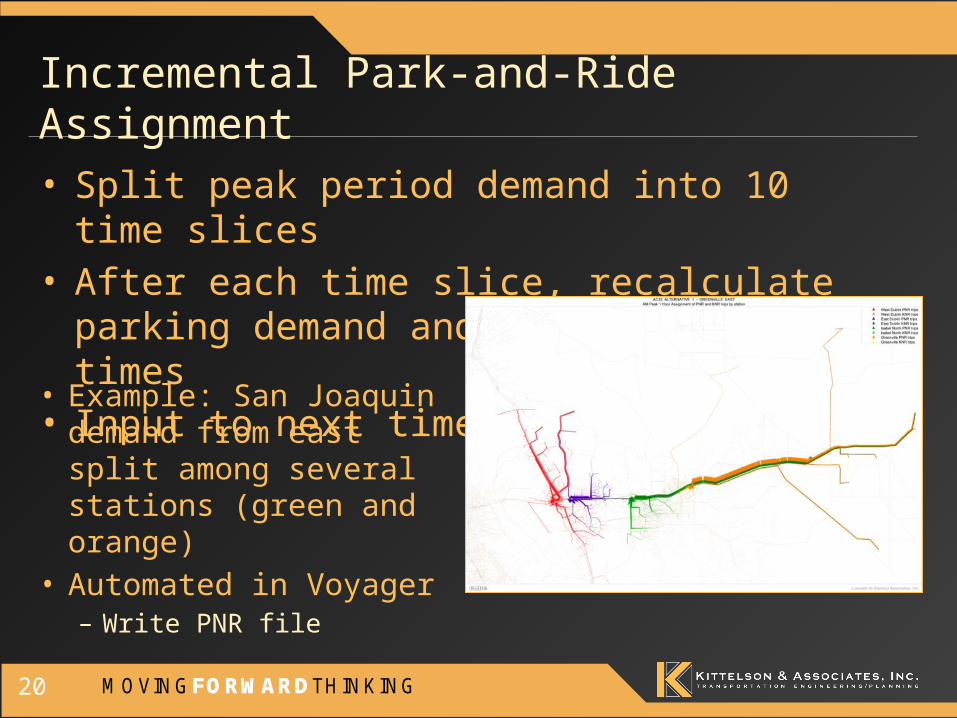
Incremental Park-and-Ride Assignment
• Split peak period demand into 10 time slices• After each time slice, recalculate parking demand and
parking access times• Input to next time slice
• Example: San Joaquin demand from east split among several stations (green and orange)
• Automated in Voyager– Write PNR file
MOVING THINK INGFORWARD21
Account for all auto trips
• Retrofit model to convert transit park-and-ride access trips to assignable vehicle trips
• Certain stations would have absolute parking constraints– Excess parking demand converted to vehicle trips from
origin to ultimate destination– Added to vehicle trip assignment
• Accounting for all auto trips made a difference in VMT comparison of alternatives

MOVING THINK INGFORWARD
5. Next Time!
MOVING THINK INGFORWARD23
What we would do differently next time
• Improve dynamic parking access time calculation– Collect data on parking time vs. demand– Customize curve for each station area
• Integrate mode choice equilibration and incremental parking assignment in same run
• Test multi-path transit assignment– Still may need equilibration
MOVING THINK INGFORWARD24
Acknowledgments
• Client: BART• Prime Consultant: CDM Smith– Bill Hurrell, Project Manager
• Key Staff– Completed as Dowling Associates prior to merger with KAI– Neelita Mopati, model programming– Antonios Garefalakis (now DKS Associates), model runs– Damian Stefanakis, Project Principal