Embed Size (px)
Citation preview
11
AN ISOLATED SMALL WIND TURBINE EMULATOR
Md. Arifujjaman
Graduate Student Seminar: Master of Engineering
Faculty of Engineering and Applied ScienceMemorial University of NewfoundlandSt. John’s , NL, Canada A1B 3X5
22
Outline
Introduction
Control Objectives of a Wind Turbine
Control Strategy Selection Principle
Modeling of the Small Wind Energy Conversion System
Simulation Results
Implementation of the Small Wind Turbine Emulator
Structure of the Maximum Power Point Controller
Test Results
Conclusions
33
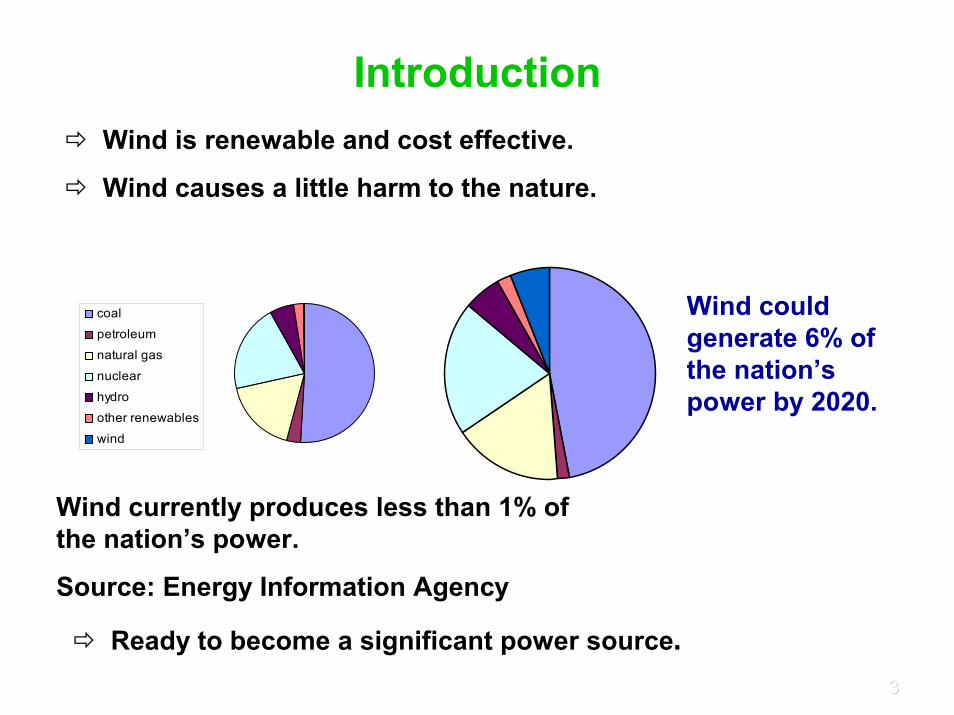
Introduction
coal
petroleum
natural gas
nuclear
hydro
other renewables
wind
Wind could generate 6% of the nation’s power by 2020.
Wind currently produces less than 1% of the nation’s power.
Source: Energy Information Agency
Wind is renewable and cost effective.
Wind causes a little harm to the nature.
Ready to become a significant power source.
44
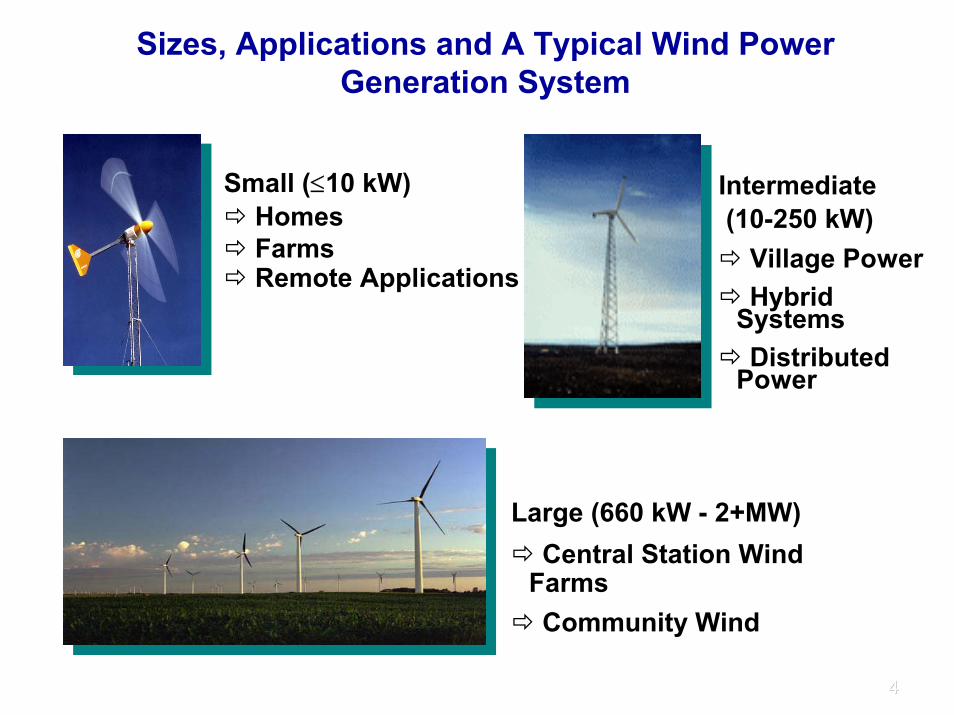
Small (≤10 kW)HomesFarmsRemote Applications
Intermediate(10-250 kW)
Village PowerHybrid
SystemsDistributed
Power
Large (660 kW - 2+MW)Central Station Wind
FarmsCommunity Wind
Sizes, Applications and A Typical Wind Power Generation System
55
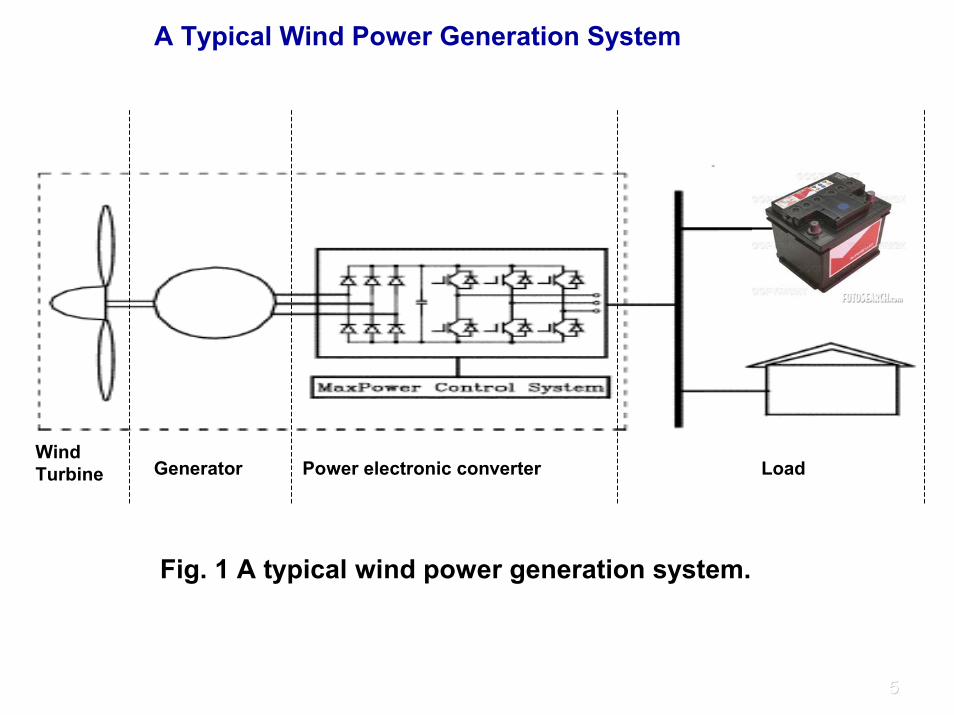
A Typical Wind Power Generation System
Wind Turbine Generator Power electronic converter Load
Fig. 1 A typical wind power generation system.
66
Control Objectives of a Wind Turbine
So
Limit the power input to the turbine so that all the mechanical and electrical components of the wind turbine are able to handle.
Extraction of the maximum power.
Maximize the energy capture.
Stabilize the system under all operating conditions.
Control the grid voltage and power by regulating the output of the wind turbine.
Reduce the drive train dynamics.
77
Control Objectives of a Wind Turbine
So
Limit the power input to the turbine so that all the mechanical and electrical components of the wind turbine are able to handle.
Extraction of the maximum power.
Maximize the energy capture.
Stabilize the system under all operating conditions.
Assuming that the wind turbine will be operated in an isolatedmode.
Assuming that the wind turbine system is of a direct drive system
88
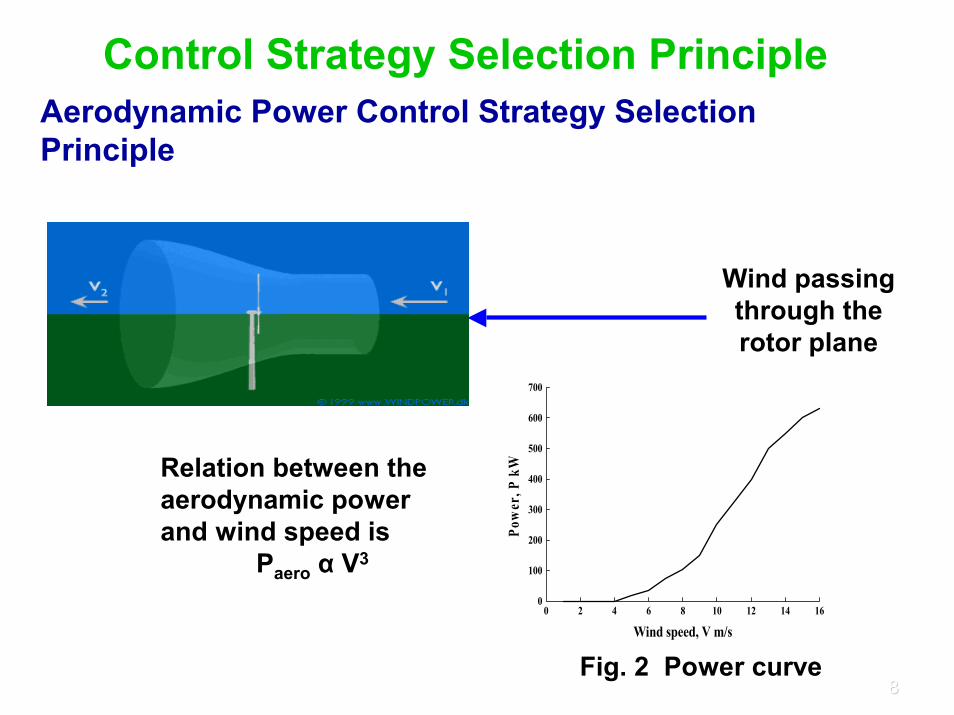
Relation between the aerodynamic power and wind speed is
Paero α V3
Fig. 2 Power curve
Wind passing through the rotor plane
Aerodynamic Power Control Strategy Selection Principle
Control Strategy Selection Principle
0 2 4 6 8 10 12 14 160
100
200
300
400
500
600
700
Pow
er, P
kW
Wind speed, V m/s
99
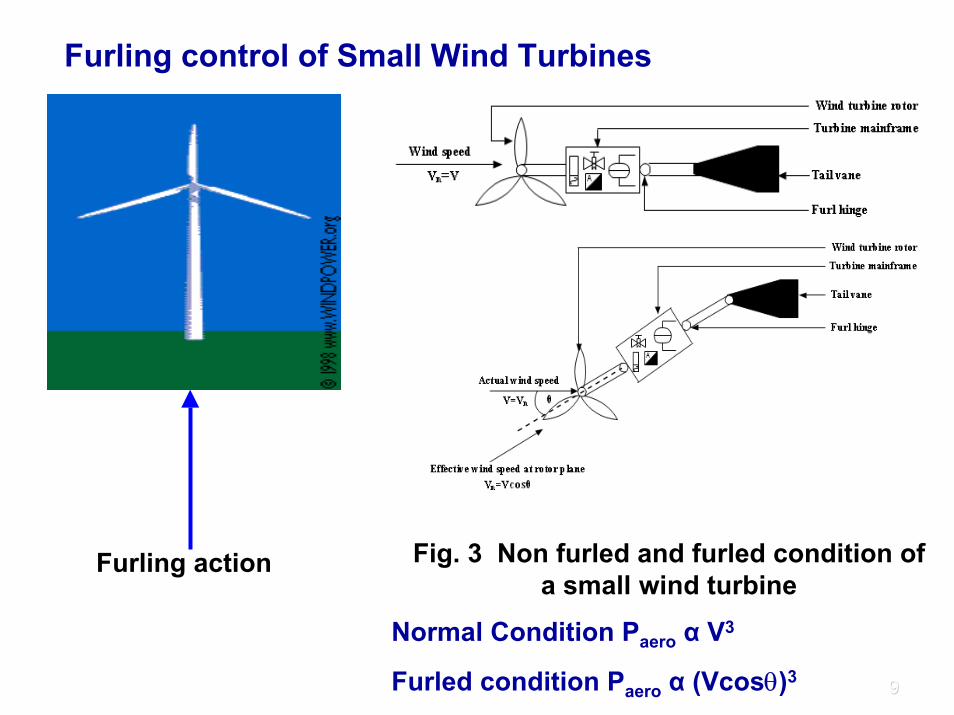
Furling control of Small Wind Turbines
Fig. 3 Non furled and furled condition of a small wind turbine
Normal Condition Paero α V3
Furled condition Paero α (Vcosθ)3
Furling action
1010
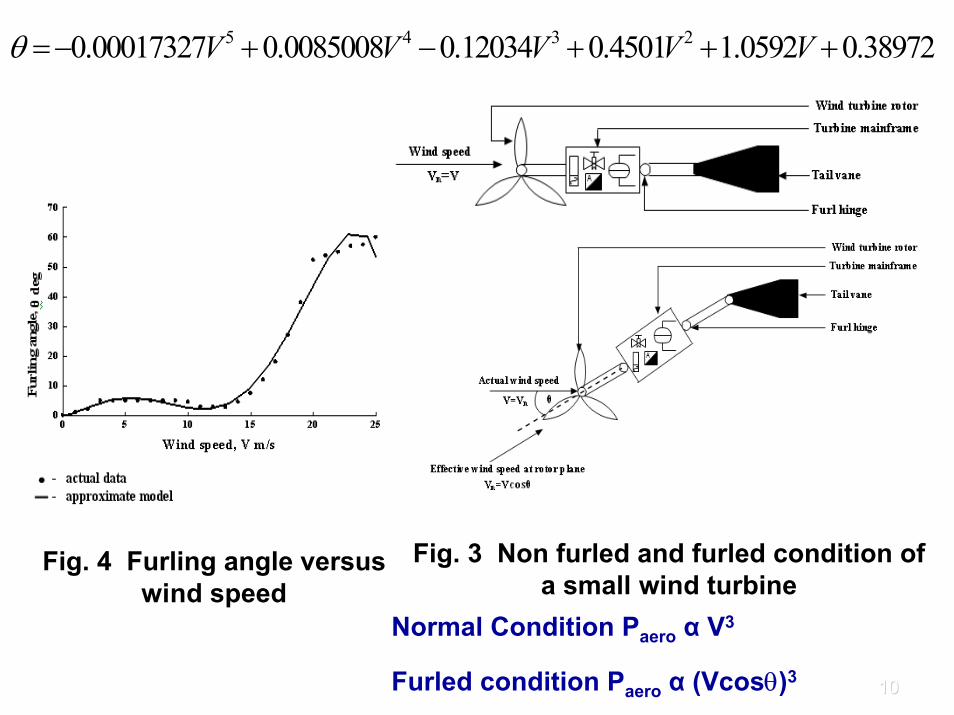
Fig. 3 Non furled and furled condition of a small wind turbine
Normal Condition Paero α V3
Furled condition Paero α (Vcosθ)3
Fig. 4 Furling angle versus wind speed
5 4 3 20.00017327 0.0085008 0.12034 0.4501 1.0592 0.38972V V V V Vθ =− + − + + +
1111
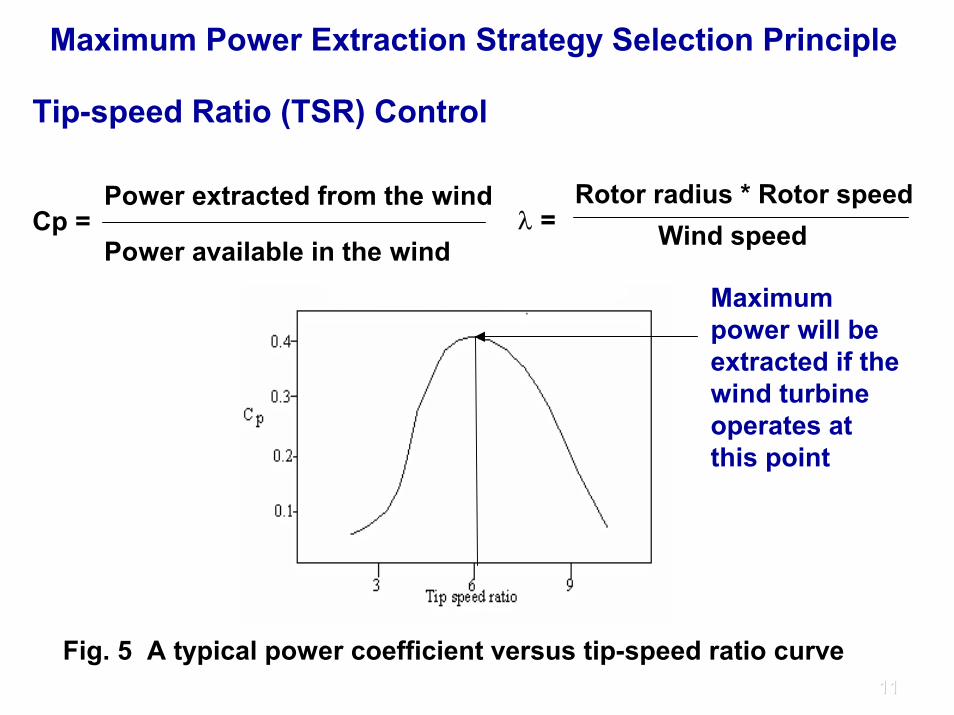
Cp =Power extracted from the wind
Power available in the wind
Maximum Power Extraction Strategy Selection Principle
λ =Rotor radius * Rotor speed
Wind speed
Fig. 5 A typical power coefficient versus tip-speed ratio curve
Tip-speed Ratio (TSR) Control
Maximum power will be extracted if the wind turbine operates at this point
1212
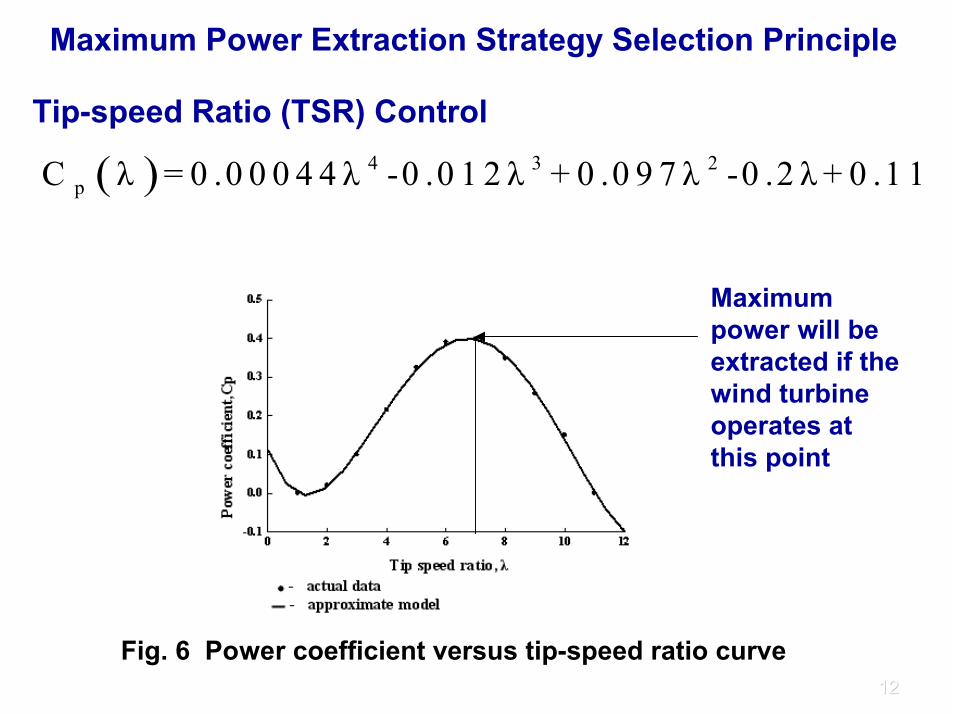
Maximum Power Extraction Strategy Selection Principle
Fig. 6 Power coefficient versus tip-speed ratio curve
Tip-speed Ratio (TSR) Control
Maximum power will be extracted if the wind turbine operates at this point
( ) 4 3 2pC λ = 0 .0 0 0 4 4 λ -0 .0 1 2 λ + 0 .0 9 7 λ -0 .2 λ + 0 .1 1
1313
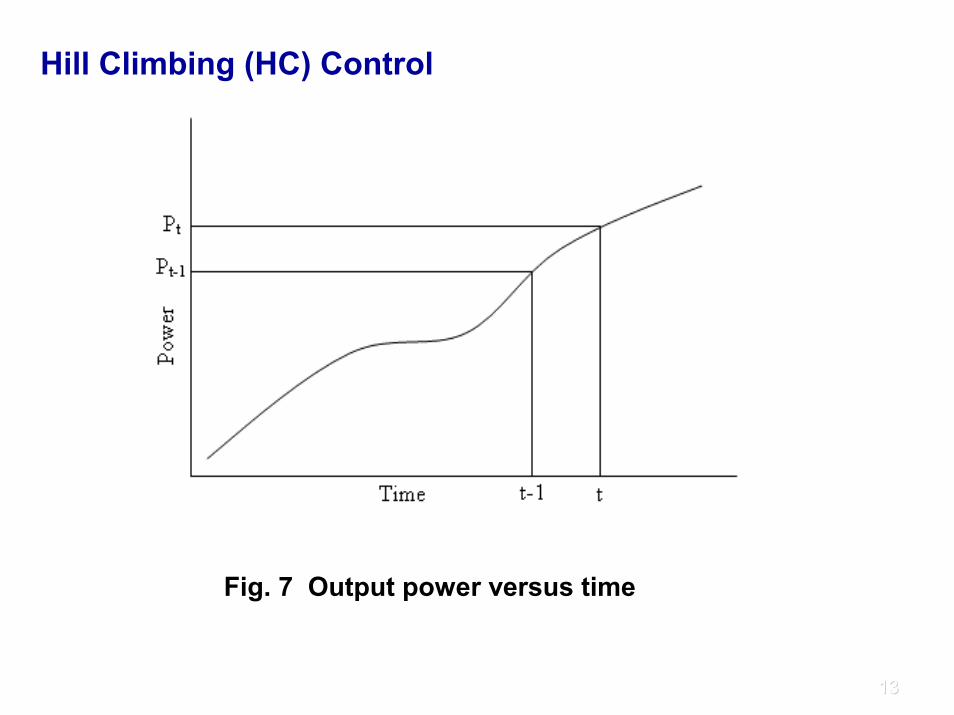
Hill Climbing (HC) Control
Fig. 7 Output power versus time
1414
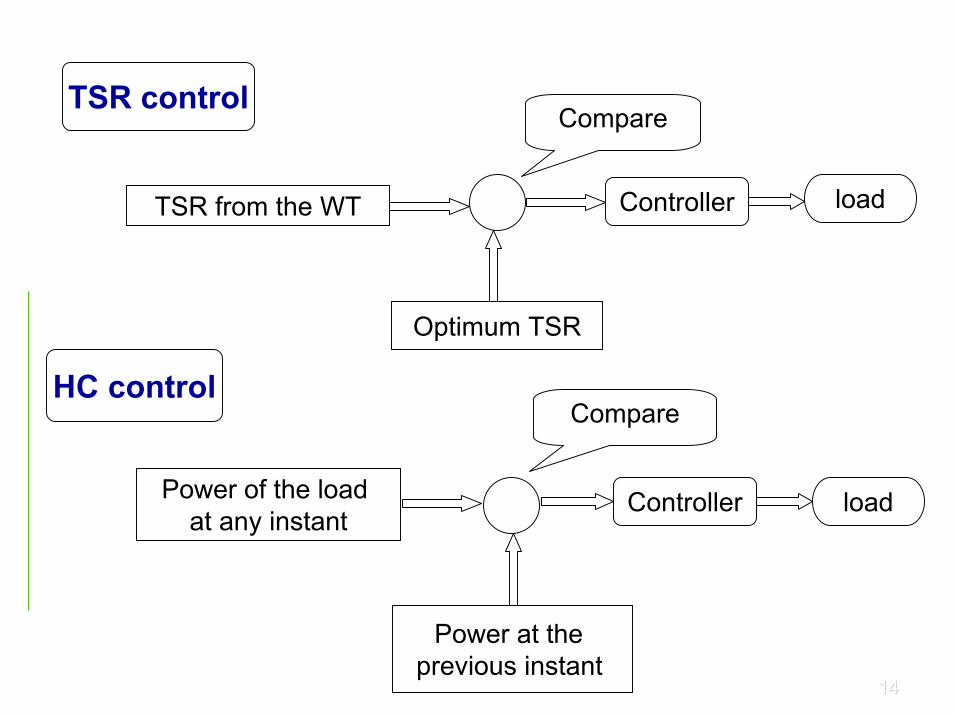
TSR controlCompare
Optimum TSR
load
TSR from the WT
Power at the previous instant
Compare
Power of the load at any instant
HC control
Controller load
Controller
1515
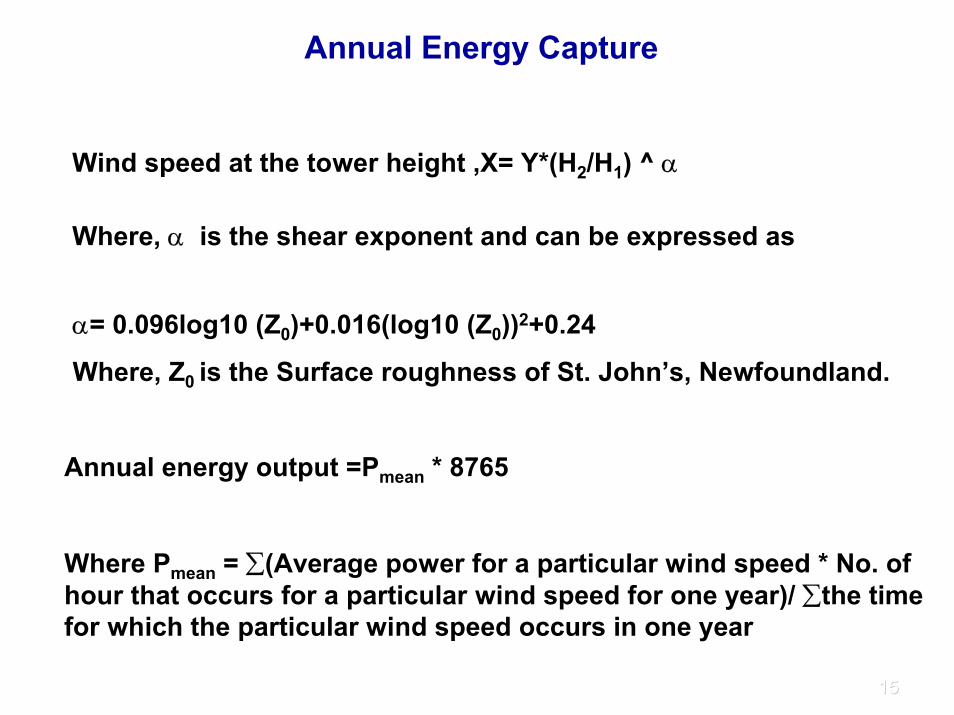
Annual Energy Capture
Wind speed at the tower height ,X= Y*(H2/H1) ^ α
α= 0.096log10 (Z0)+0.016(log10 (Z0))2+0.24
Where, Z0 is the Surface roughness of St. John’s, Newfoundland.
Where, α is the shear exponent and can be expressed as
Annual energy output =Pmean * 8765
Where Pmean = ∑(Average power for a particular wind speed * No. of hour that occurs for a particular wind speed for one year)/ ∑the time for which the particular wind speed occurs in one year
1616
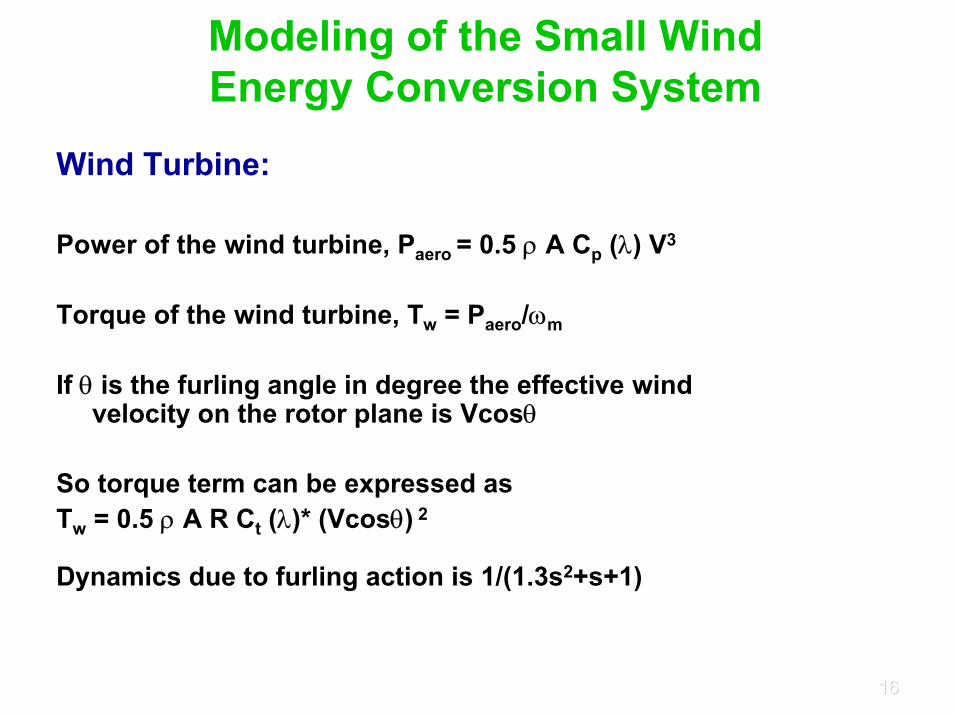
Modeling of the Small Wind Energy Conversion System
Wind Turbine:
Power of the wind turbine, Paero = 0.5 ρ A Cp (λ) V3
Torque of the wind turbine, Tw = Paero/ωm
If θ is the furling angle in degree the effective wind velocity on the rotor plane is Vcosθ
So torque term can be expressed as Tw = 0.5 ρ A R Ct (λ)* (Vcosθ) 2
Dynamics due to furling action is 1/(1.3s2+s+1)
1717
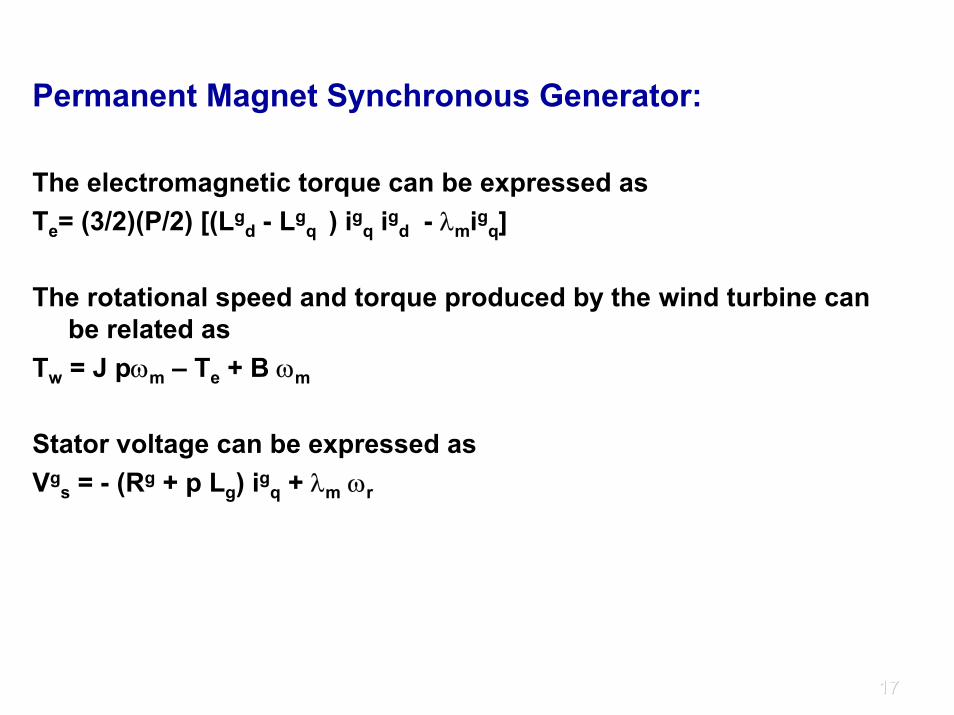
Permanent Magnet Synchronous Generator:
The electromagnetic torque can be expressed asTe= (3/2)(P/2) [(Lg
d - Lgq ) igq igd - λmigq]
The rotational speed and torque produced by the wind turbine canbe related as
Tw = J pωm – Te + B ωm
Stator voltage can be expressed asVg
s = - (Rg + p Lg) igq + λm ωr
1818
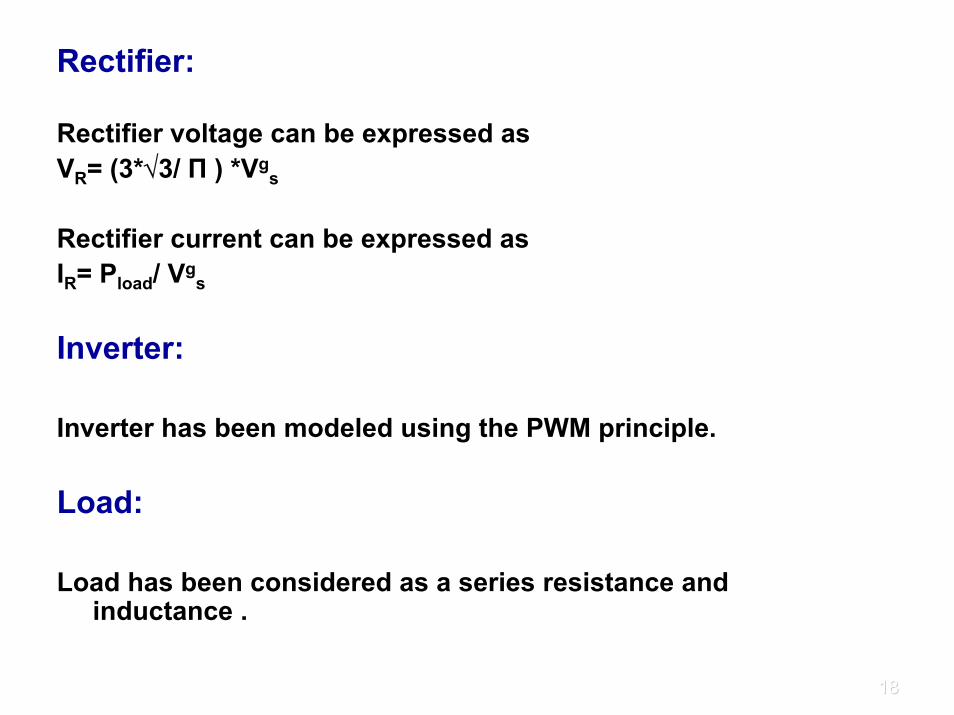
Rectifier:
Rectifier voltage can be expressed as VR= (3*√3/ Π ) *Vg
s
Rectifier current can be expressed asIR= Pload/ Vg
s
Inverter:
Inverter has been modeled using the PWM principle.
Load:
Load has been considered as a series resistance and inductance .
1919
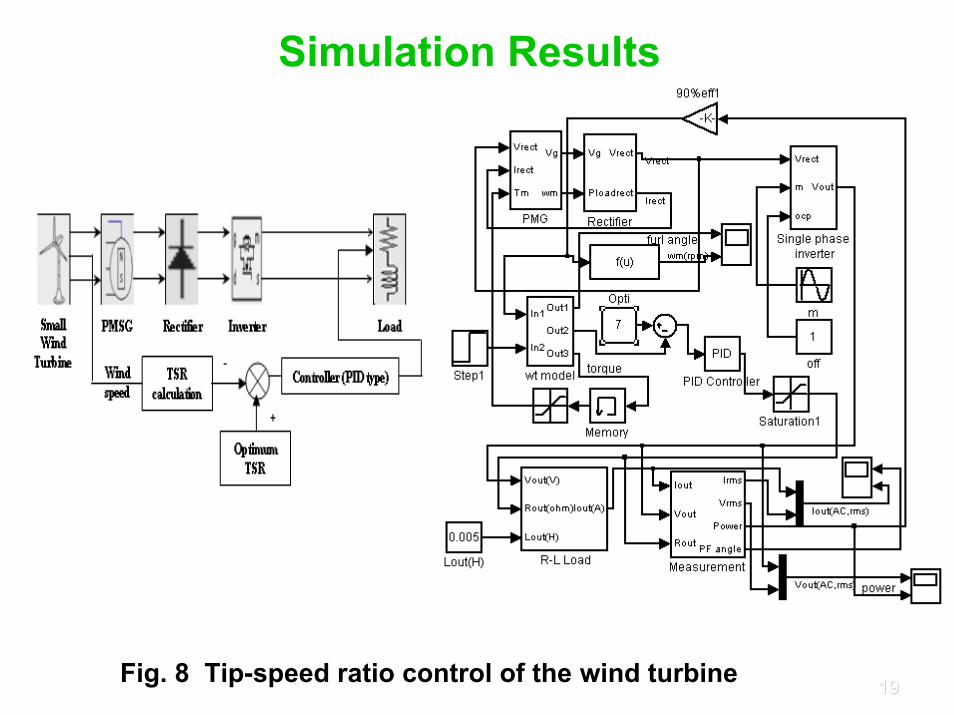
Simulation Results
Fig. 8 Tip-speed ratio control of the wind turbine
2020
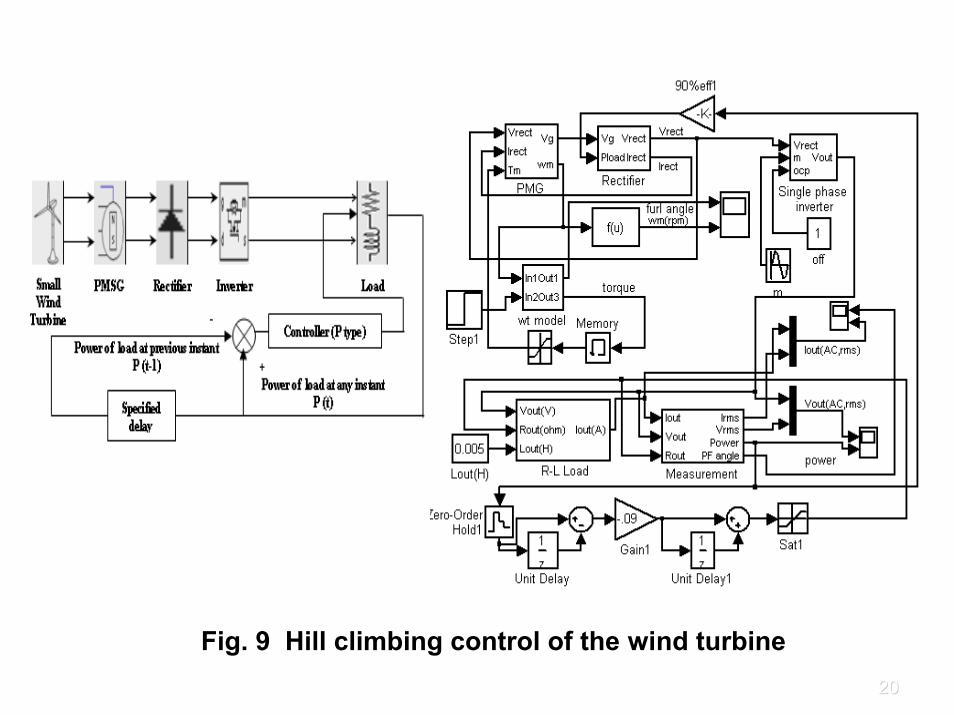
Fig. 9 Hill climbing control of the wind turbine
2121
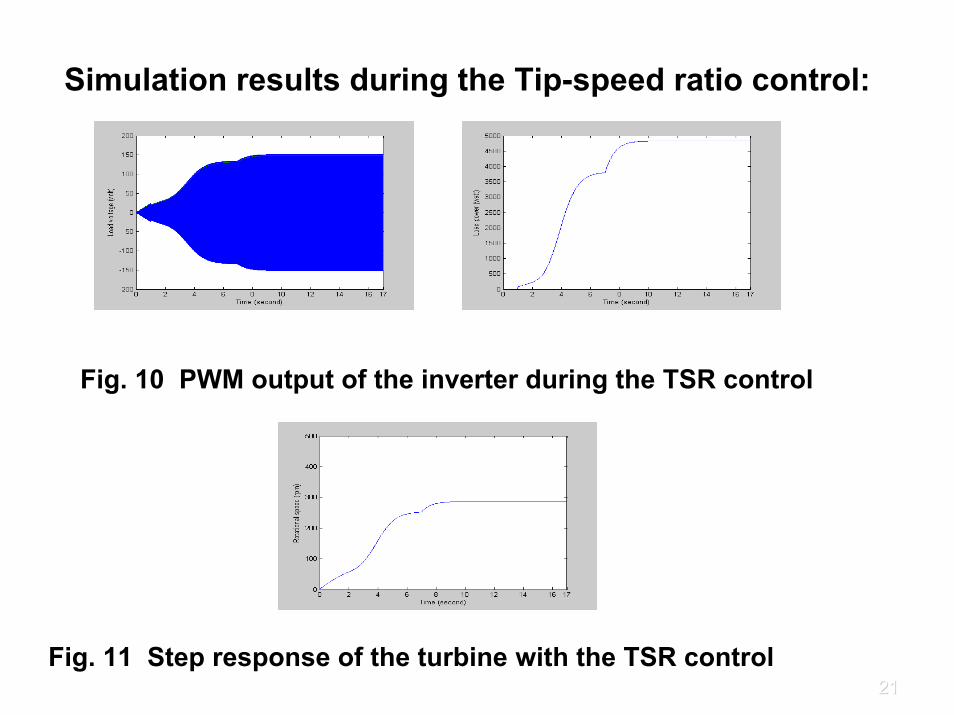
Simulation results during the Tip-speed ratio control:
Fig. 10 PWM output of the inverter during the TSR control
Fig. 11 Step response of the turbine with the TSR control
2222
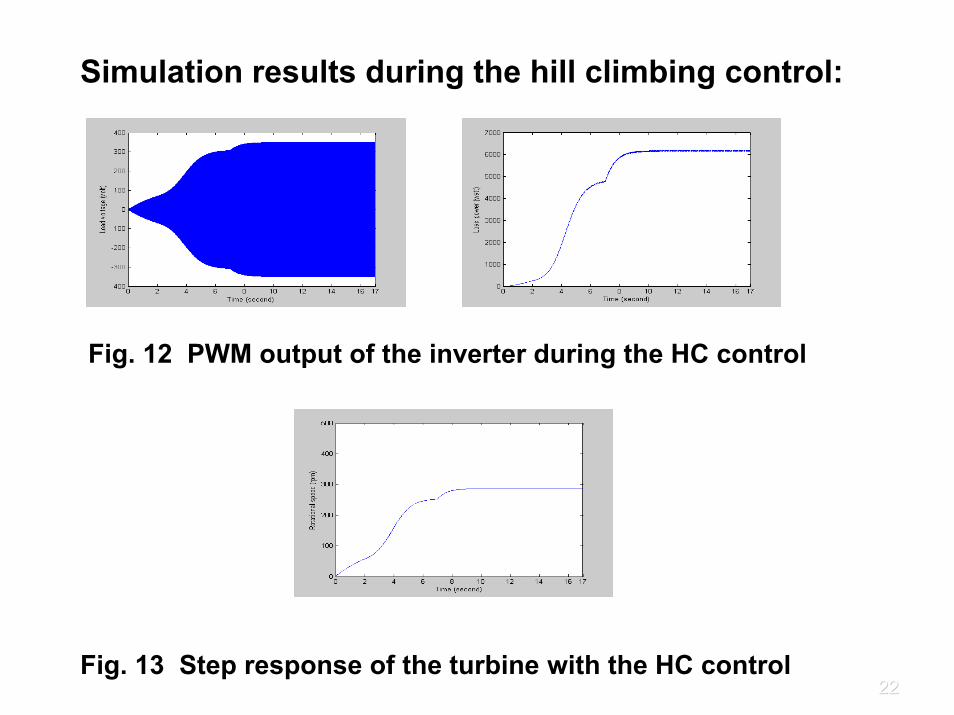
Simulation results during the hill climbing control:
Fig. 12 PWM output of the inverter during the HC control
Fig. 13 Step response of the turbine with the HC control
2323
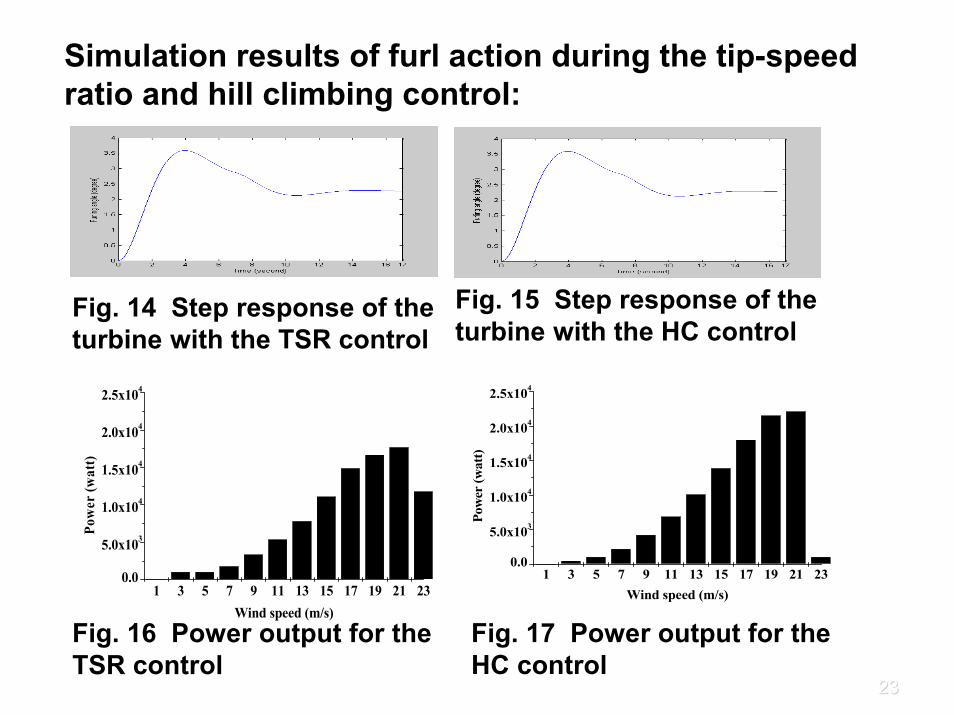
Simulation results of furl action during the tip-speed ratio and hill climbing control:
Fig. 15 Step response of the turbine with the HC control
Fig. 14 Step response of the turbine with the TSR control
Fig. 17 Power output for the HC control
1 3 5 7 9 11 13 15 17 19 21 230.0
5.0x10³
1.0x10⁴
1.5x10⁴
2.0x10⁴
2.5x10⁴
Pow
er (w
att)
Wind speed (m/s)
Fig. 16 Power output for the TSR control
1 3 5 7 9 11 13 15 17 19 21 230.0
5.0x10³
1.0x10⁴
1.5x10⁴
2.0x10⁴
2.5x10⁴
Pow
er (w
att)
Wind speed (m/s)
2424
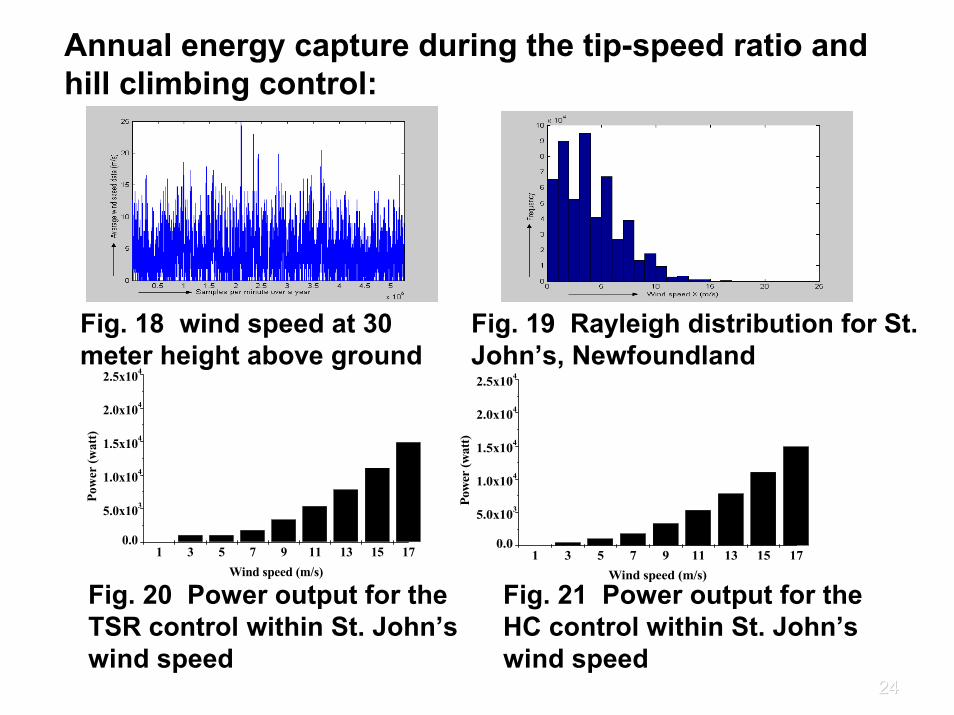
Annual energy capture during the tip-speed ratio and hill climbing control:
Fig. 18 wind speed at 30 meter height above ground
Fig. 19 Rayleigh distribution for St. John’s, Newfoundland
Fig. 20 Power output for the TSR control within St. John’s wind speed
Fig. 21 Power output for the HC control within St. John’s wind speed
1 3 5 7 9 11 13 15 170.0
5.0x10³
1.0x10⁴
1.5x10⁴
2.0x10⁴
2.5x10⁴
Pow
er (w
att)
Wind speed (m/s)1 3 5 7 9 11 13 15 17
0.0
5.0x10³
1.0x10⁴
1.5x10⁴
2.0x10⁴
2.5x10⁴
Pow
er (w
att)
Wind speed (m/s)
2525
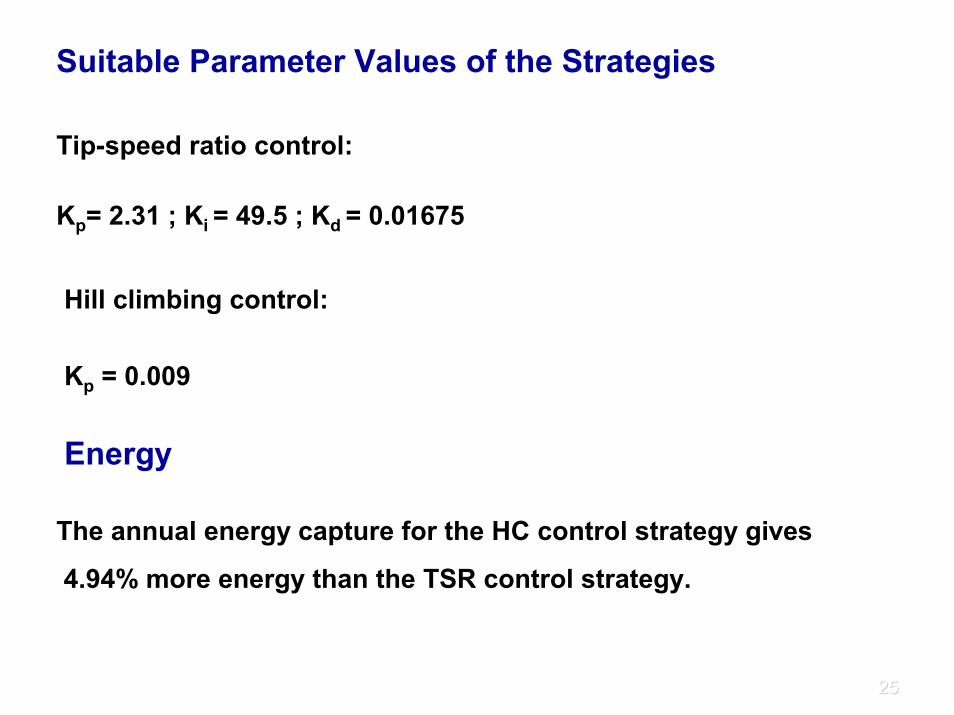
Suitable Parameter Values of the Strategies
Tip-speed ratio control:
Kp= 2.31 ; Ki = 49.5 ; Kd = 0.01675
Hill climbing control:
Kp = 0.009
Energy
The annual energy capture for the HC control strategy gives
4.94% more energy than the TSR control strategy.
2626
Summary
• A PMSG based small wind turbine with furling dynamics has been modeled.
• A PID controller has been designed to control the load during the tip-speed ratio control.
• A Proportional controller has been designed to control the load during the hill climbing control.
• Annual energy capture has been calculated using the Bin’s power curve method and found that the hill climbing control strategy leads to a more energy capture than the tip-speed ratio control strategy.
2727
Implementation of the Small Wind Turbine Emulator
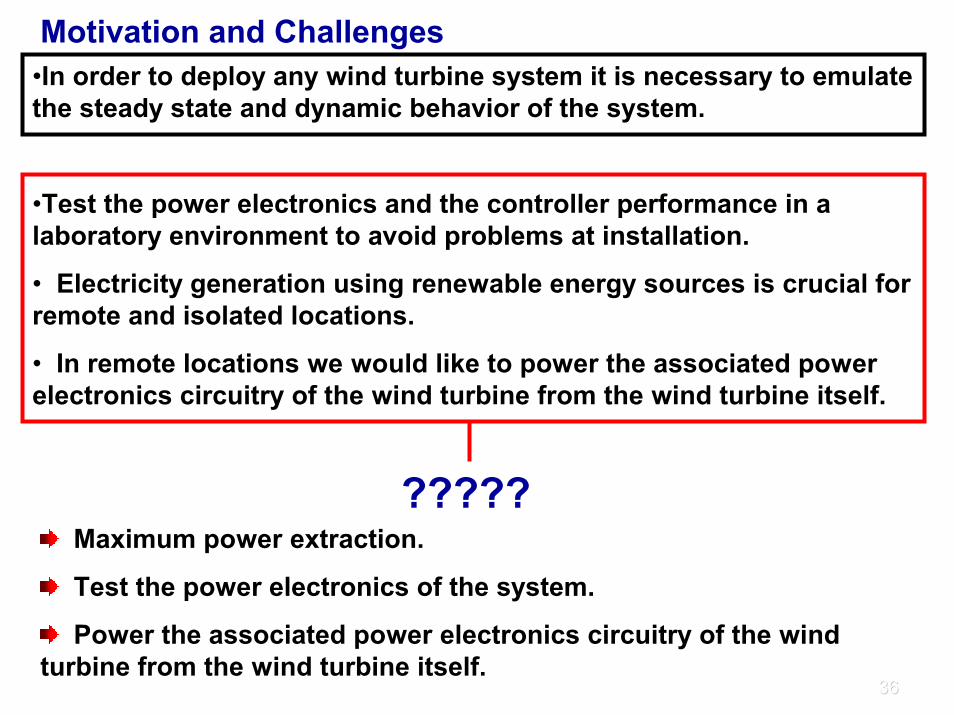
Motivation and Challenges
In order to deploy any wind turbine system it is necessary to emulate the steady state and dynamic behavior of the system.
Test the power electronics and the controller performance in a laboratory environment to avoid problems at installation.
Electricity generation using renewable energy sources is crucial for remote and isolated locations.
In remote locations we would like to power the associated power electronics circuitry of the wind turbine from the wind turbine itself.
Wind Turbine Emulator can be a strong platform to deal with the above issues
2828
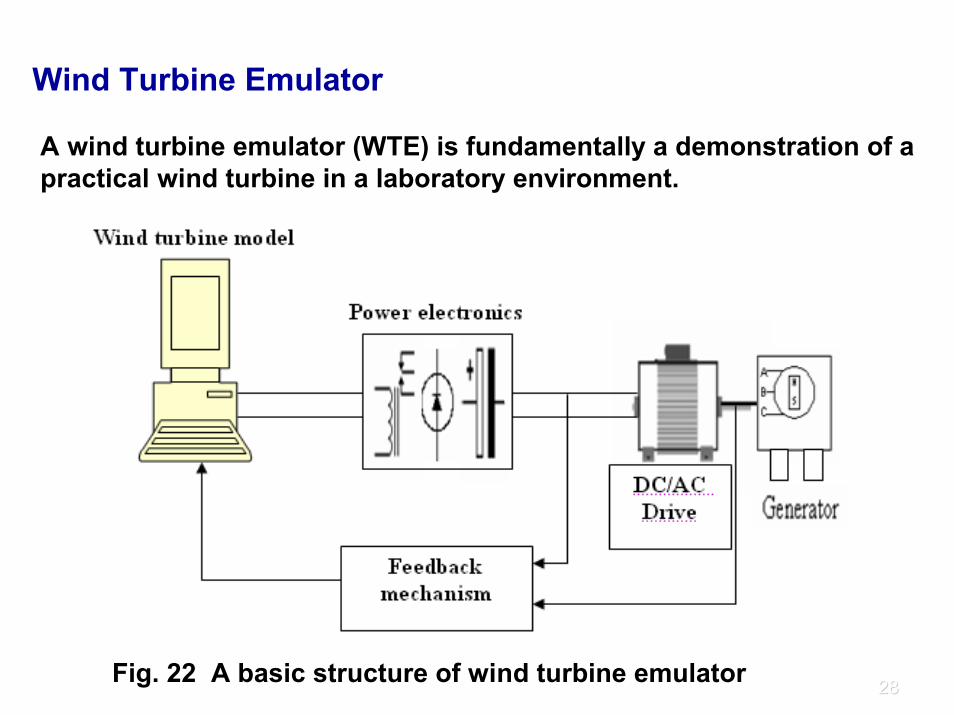
Wind Turbine Emulator
A wind turbine emulator (WTE) is fundamentally a demonstration of a practical wind turbine in a laboratory environment.
Fig. 22 A basic structure of wind turbine emulator
2929
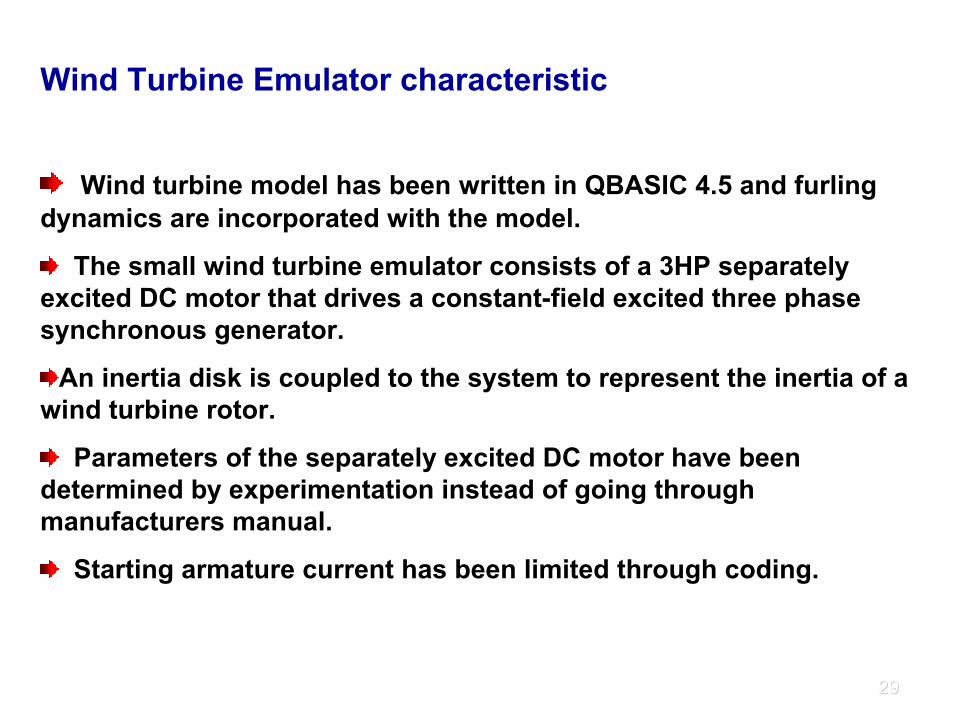
Wind Turbine Emulator characteristic
Wind turbine model has been written in QBASIC 4.5 and furling dynamics are incorporated with the model.
The small wind turbine emulator consists of a 3HP separately excited DC motor that drives a constant-field excited three phase synchronous generator.
An inertia disk is coupled to the system to represent the inertia of a wind turbine rotor.
Parameters of the separately excited DC motor have been determined by experimentation instead of going through manufacturers manual.
Starting armature current has been limited through coding.
3030
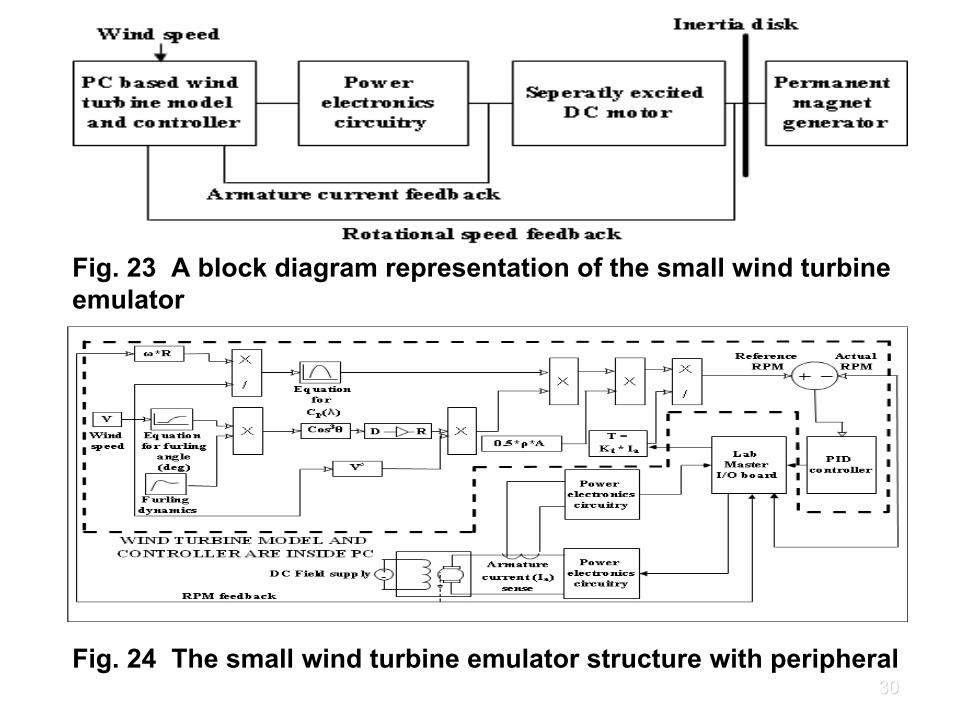
Fig. 23 A block diagram representation of the small wind turbine emulator
Fig. 24 The small wind turbine emulator structure with peripheral
3131
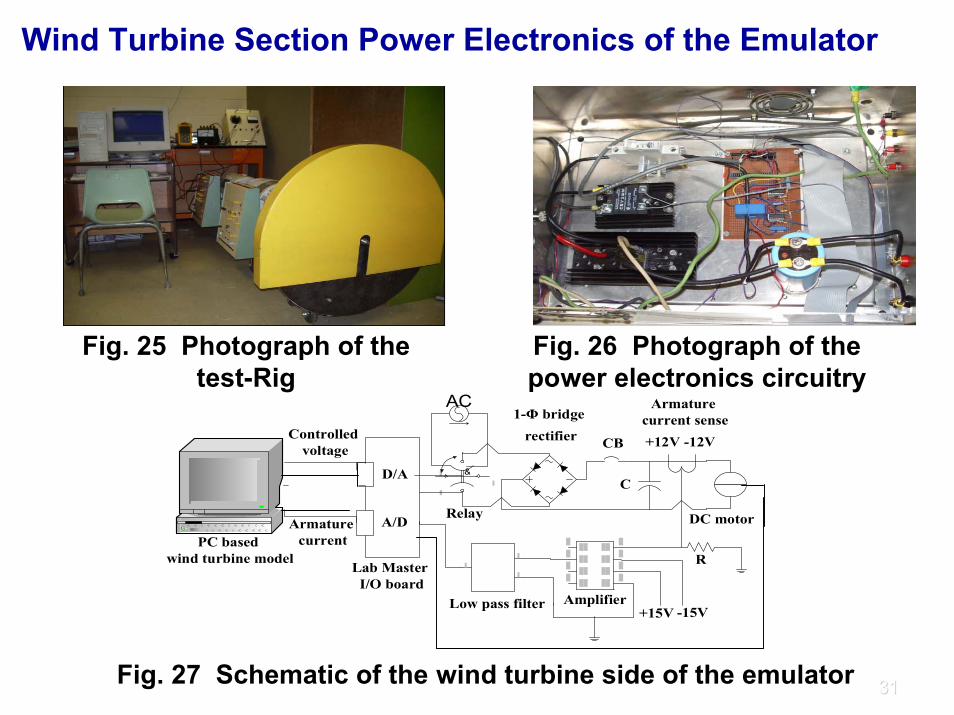
Fig. 25 Photograph of the test-Rig
Fig. 26 Photograph of the power electronics circuitry
RPM feedback
&
PC based wind turbine model
AC
Lab Master I/O board
Controlled voltage
Armature current
Low pass filter Amplifier+15V -15V
Armature current sense
CB
1-Φ bridge rectifier
Relay DC motor
D/A
A/D
R
C
+12V -12V
RPM
Fig. 27 Schematic of the wind turbine side of the emulator
Wind Turbine Section Power Electronics of the Emulator
3232
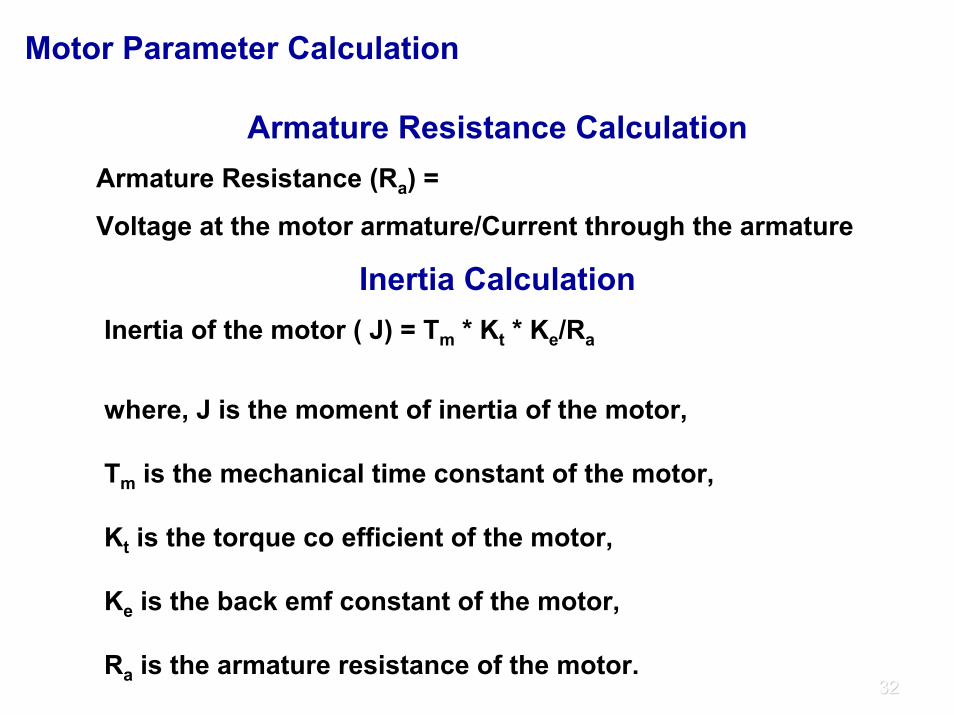
Motor Parameter Calculation
Armature Resistance CalculationArmature Resistance (Ra) =
Voltage at the motor armature/Current through the armature
Inertia CalculationInertia of the motor ( J) = Tm * Kt * Ke/Ra
where, J is the moment of inertia of the motor,
Tm is the mechanical time constant of the motor,
Kt is the torque co efficient of the motor,
Ke is the back emf constant of the motor,
Ra is the armature resistance of the motor.
3333
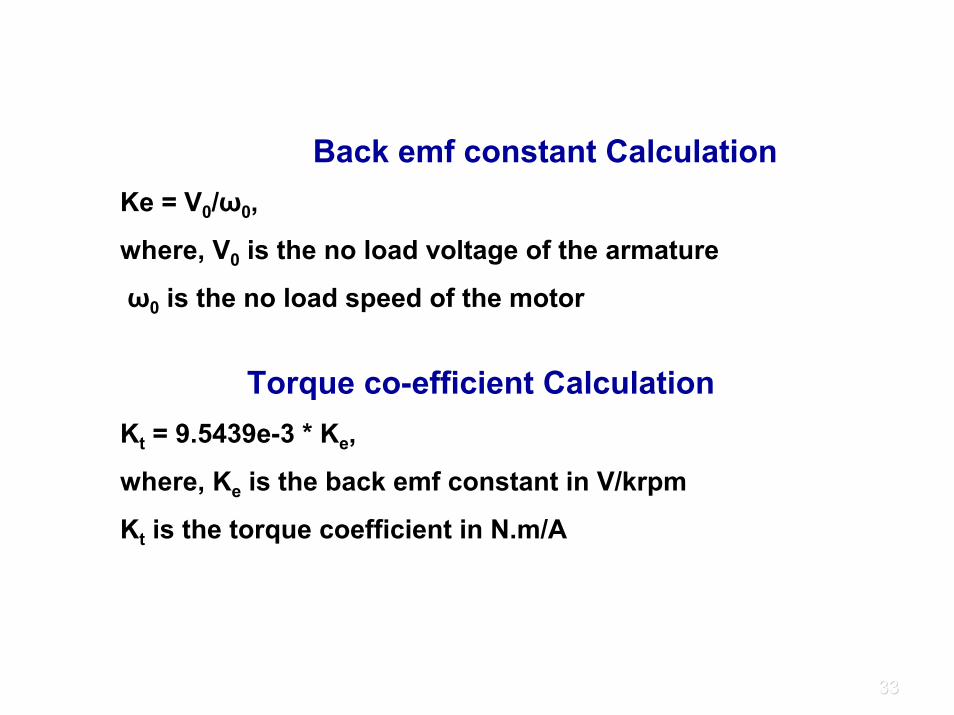
Back emf constant CalculationKe = V0/ω0,
where, V0 is the no load voltage of the armature
ω0 is the no load speed of the motor
Torque co-efficient CalculationKt = 9.5439e-3 * Ke,
where, Ke is the back emf constant in V/krpm
Kt is the torque coefficient in N.m/A
3434
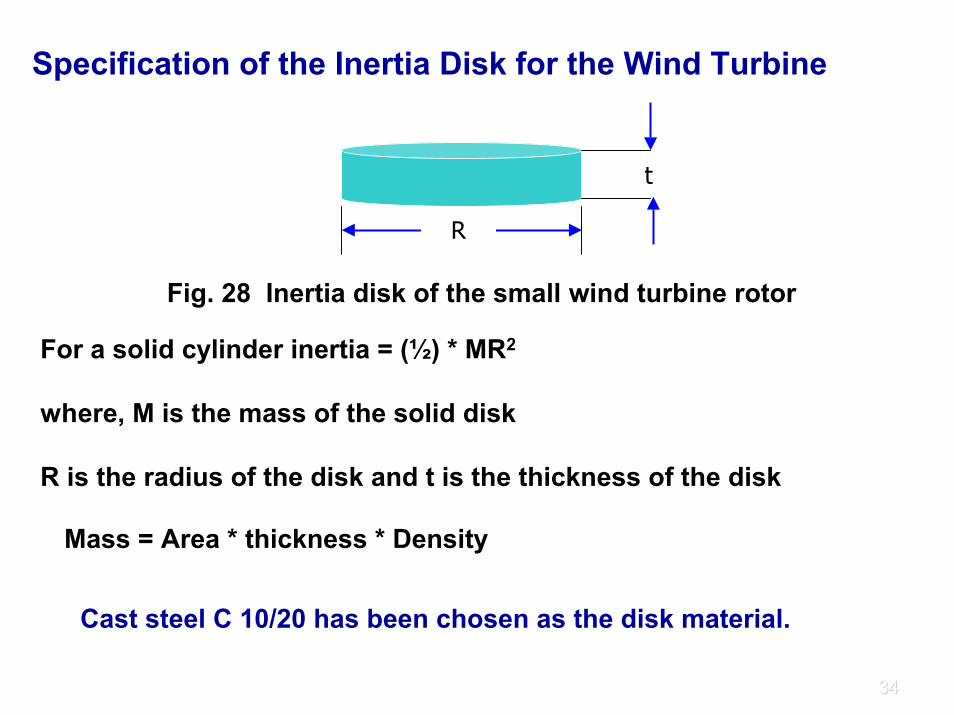
Specification of the Inertia Disk for the Wind Turbine
R
t
Fig. 28 Inertia disk of the small wind turbine rotor
For a solid cylinder inertia = (½) * MR2
where, M is the mass of the solid disk
R is the radius of the disk and t is the thickness of the disk
Mass = Area * thickness * Density
Cast steel C 10/20 has been chosen as the disk material.
3535
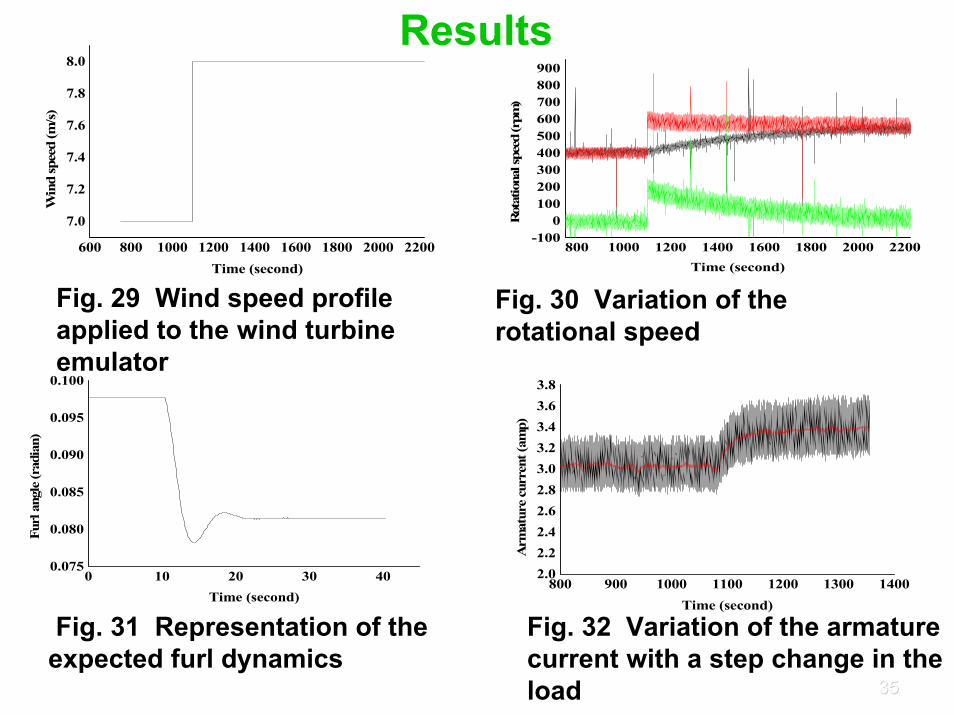
Results
600 800 1000 1200 1400 1600 1800 2000 2200
7.0
7.2
7.4
7.6
7.8
8.0W
ind
spee
d (m
/s)
Time (second)800 1000 1200 1400 1600 1800 2000 2200
-1000
100200300400500600700800900
Rot
atio
nal s
peed
(rpm
)
Time (second)
0 10 20 30 400.075
0.080
0.085
0.090
0.095
0.100
Furl
ang
le (r
adia
n)
Time (second)800 900 1000 1100 1200 1300 1400
2.02.22.42.62.83.03.23.43.63.8
Arm
atur
e cu
rren
t (am
p)
Time (second)
Fig. 29 Wind speed profile applied to the wind turbine emulator
Fig. 30 Variation of the rotational speed
Fig. 31 Representation of the expected furl dynamics
Fig. 32 Variation of the armature current with a step change in the load
3636
•In order to deploy any wind turbine system it is necessary to emulate the steady state and dynamic behavior of the system.
•Test the power electronics and the controller performance in a laboratory environment to avoid problems at installation.
• Electricity generation using renewable energy sources is crucial for remote and isolated locations.
• In remote locations we would like to power the associated power electronics circuitry of the wind turbine from the wind turbine itself.
Motivation and Challenges
?????Maximum power extraction.
Test the power electronics of the system.
Power the associated power electronics circuitry of the wind turbine from the wind turbine itself.
3737
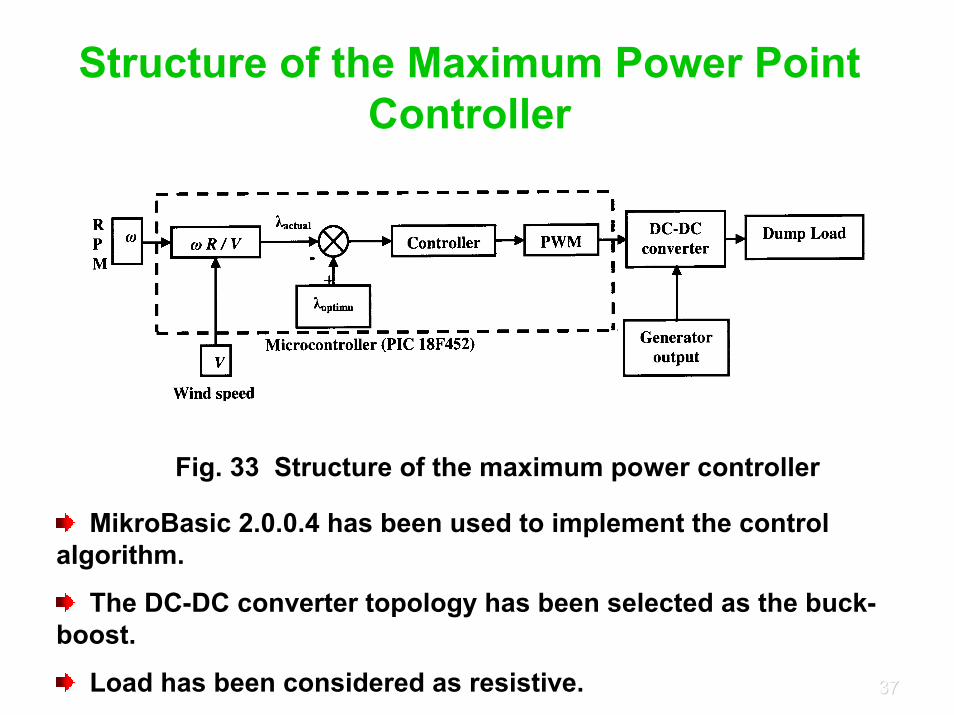
Structure of the Maximum Power Point Controller
Fig. 33 Structure of the maximum power controller
MikroBasic 2.0.0.4 has been used to implement the control algorithm.
The DC-DC converter topology has been selected as the buck-boost.
Load has been considered as resistive.
3838
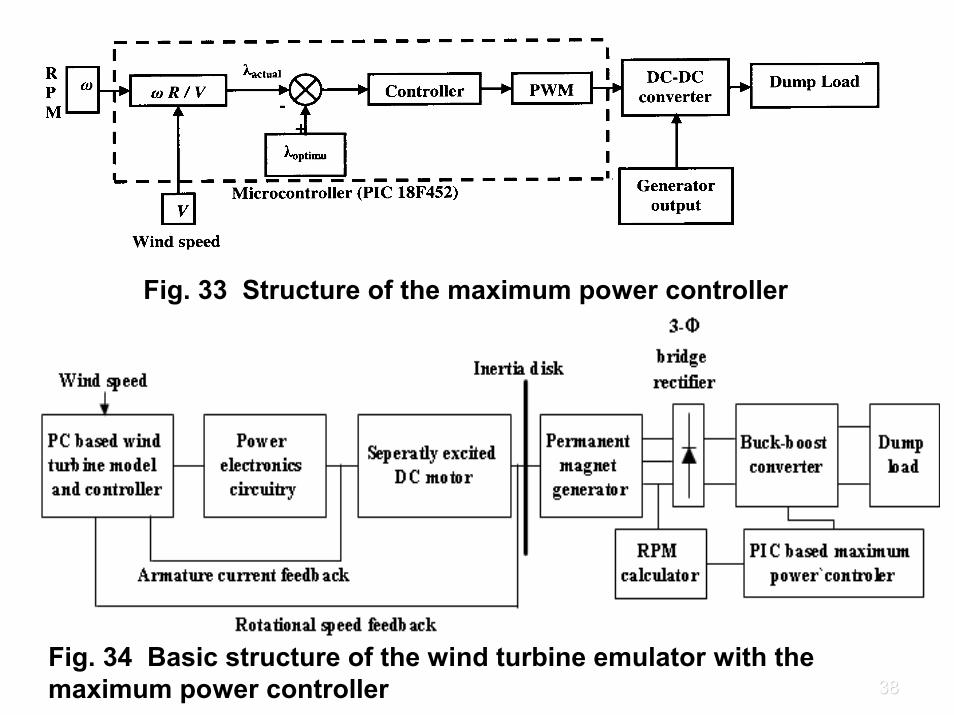
Fig. 33 Structure of the maximum power controller
Fig. 34 Basic structure of the wind turbine emulator with the maximum power controller
3939
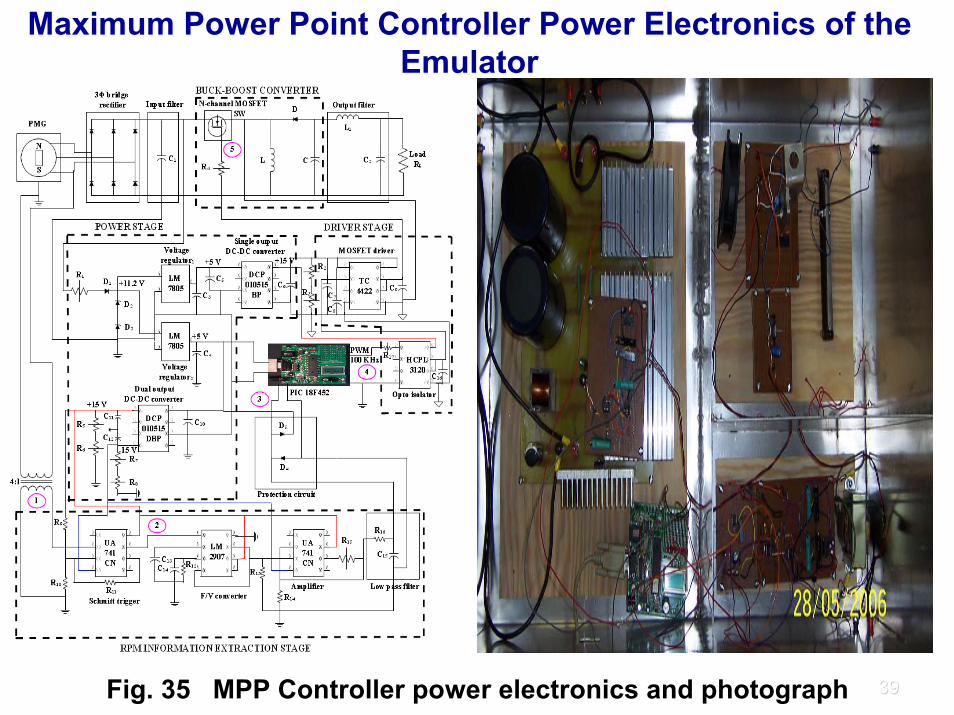
Maximum Power Point Controller Power Electronics of the Emulator
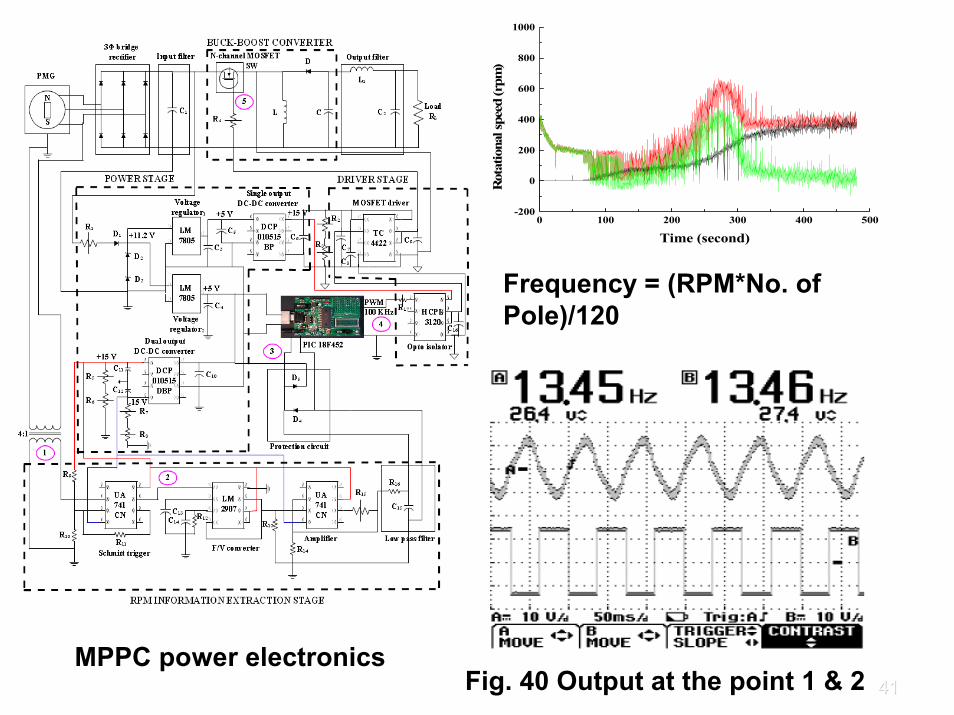
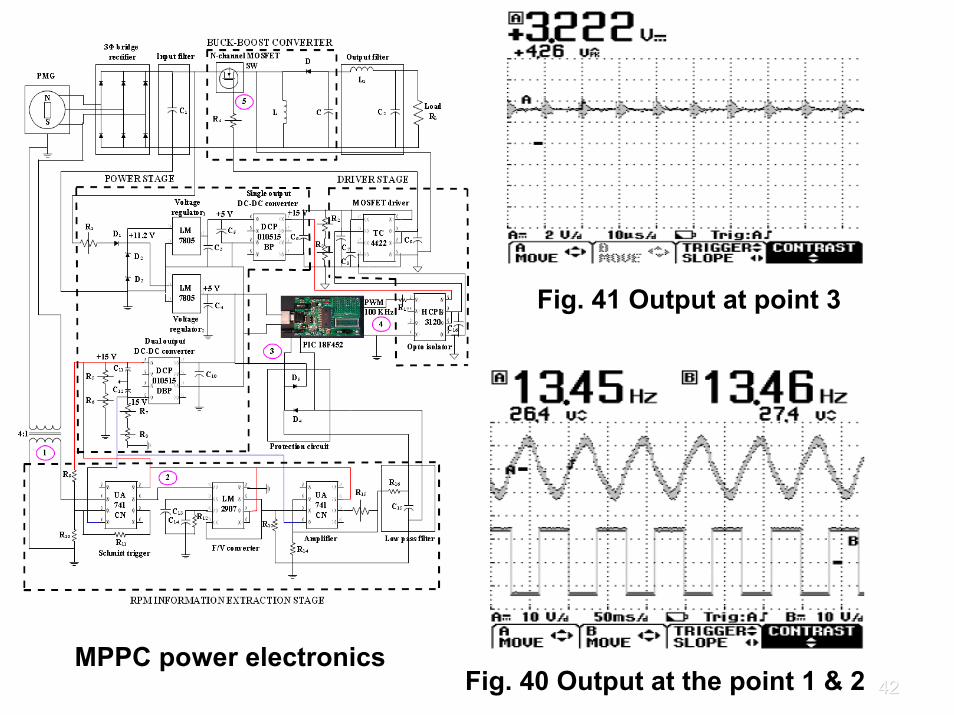
Fig. 35 MPP Controller power electronics and photograph
4040
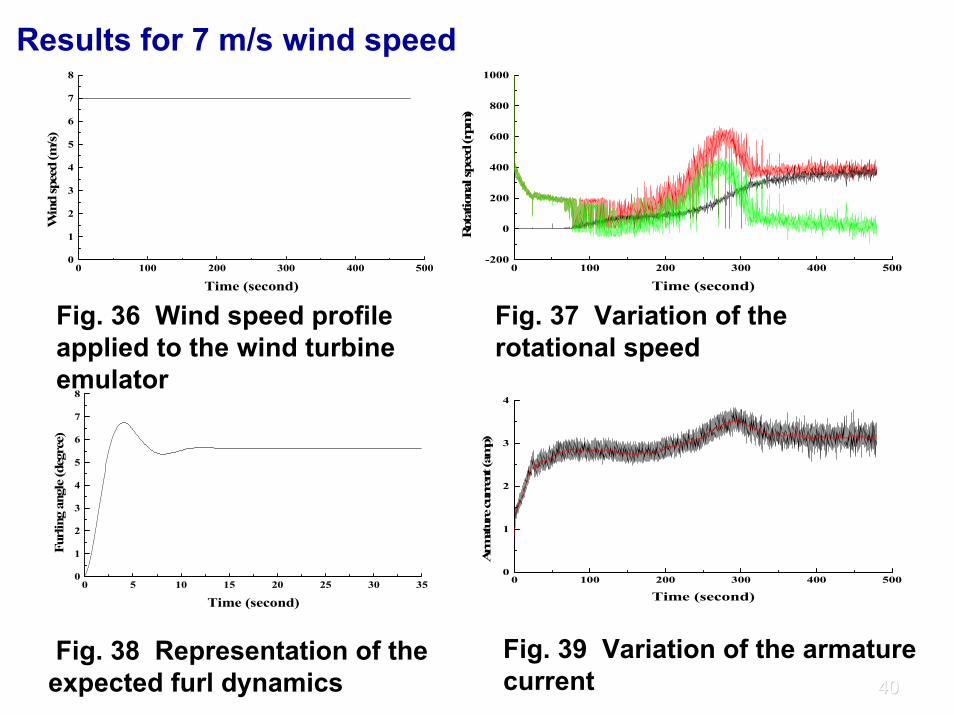
Results for 7 m/s wind speed
Fig. 36 Wind speed profile applied to the wind turbine emulator
Fig. 37 Variation of the rotational speed
Fig. 38 Representation of the expected furl dynamics
0 100 200 300 400 5000
1
2
3
4
5
6
7
8
Win
d sp
eed
(m/s
)
Time (second)0 100 200 300 400 500
-200
0
200
400
600
800
1000
Rot
atio
nal s
peed
(rpm
)
Time (second)
0 5 10 15 20 25 30 350
1
2
3
4
5
6
7
8
Furl
ing
angl
e (d
egre
e)
Time (second)
0 100 200 300 400 5000
1
2
3
4
Arm
atur
e cu
rren
t (am
p)
Time (second)
Fig. 39 Variation of the armature current
4141
0 100 200 300 400 500-200
0
200
400
600
800
1000
Rot
atio
nal s
peed
(rpm
)
Time (second)
Frequency = (RPM*No. of Pole)/120
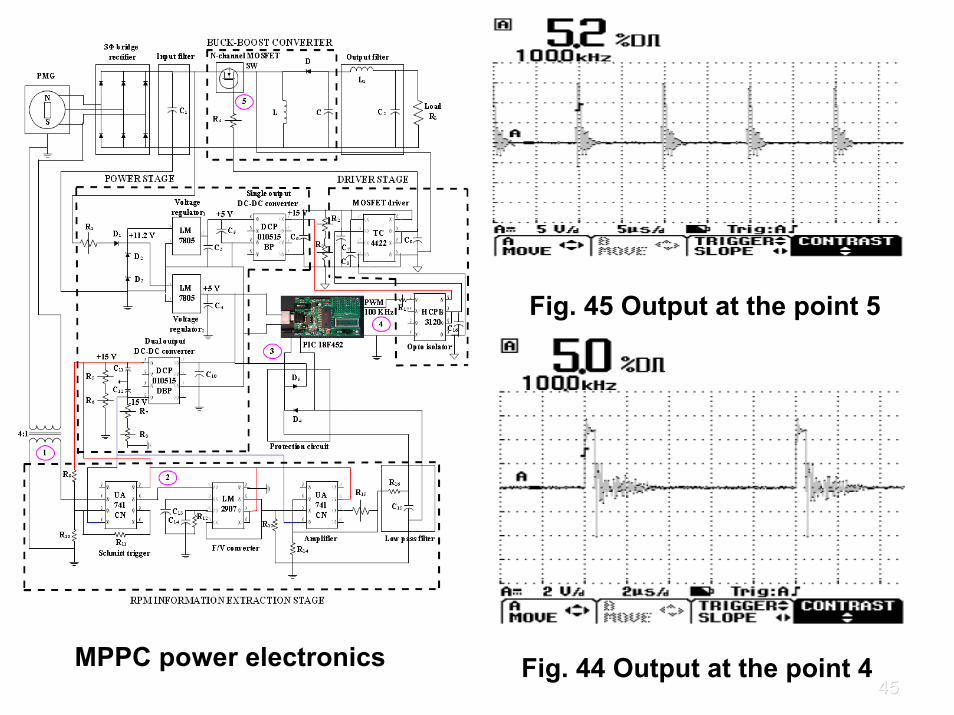
MPPC power electronicsFig. 40 Output at the point 1 & 2
4242
Fig. 41 Output at point 3
MPPC power electronicsFig. 40 Output at the point 1 & 2
4343
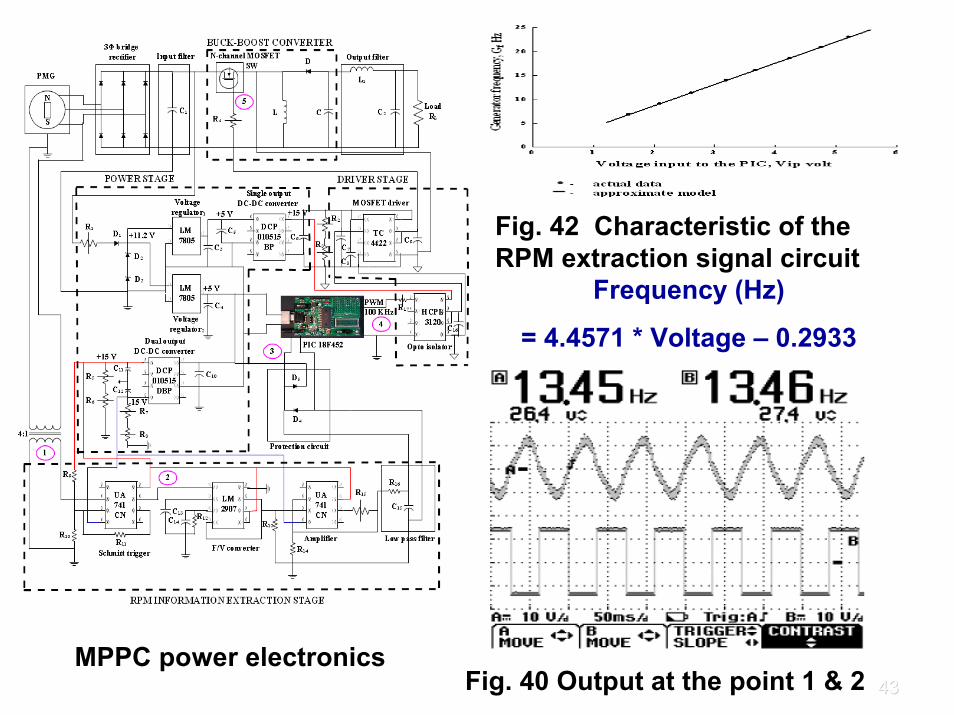
Frequency (Hz)
= 4.4571 * Voltage – 0.2933
Fig. 42 Characteristic of the RPM extraction signal circuit
MPPC power electronicsFig. 40 Output at the point 1 & 2
4444
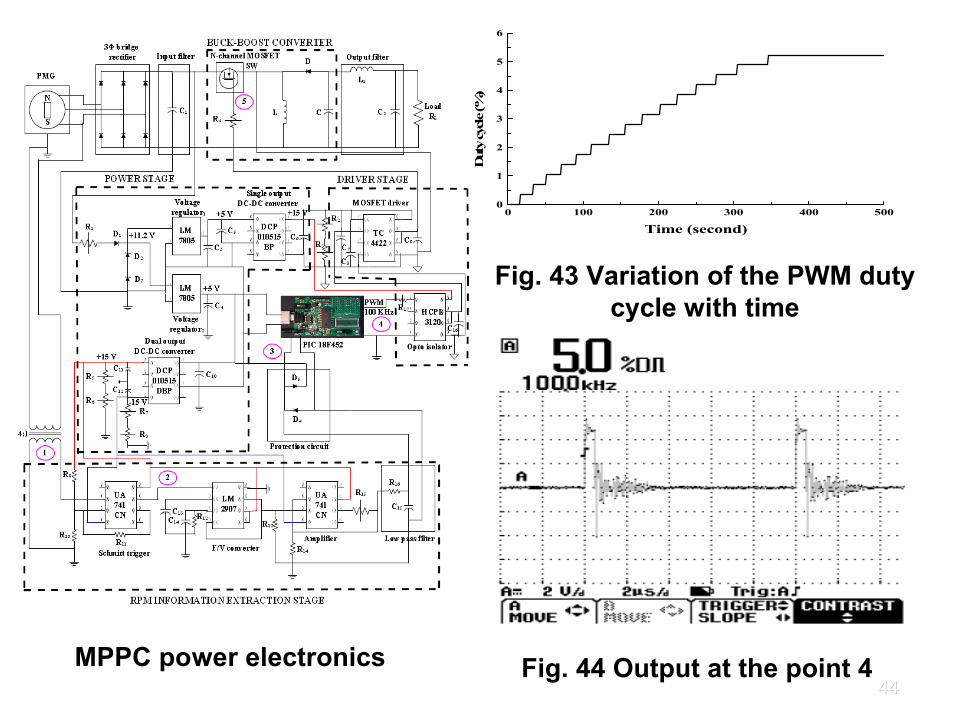
0 100 200 300 400 5000
1
2
3
4
5
6
Dut
y cy
cle (%
)
Time (second)
Fig. 43 Variation of the PWM duty cycle with time
MPPC power electronics Fig. 44 Output at the point 4
4545
Fig. 45 Output at the point 5
MPPC power electronics Fig. 44 Output at the point 4
4646
0 100 200 300 400 5000
1
2
3
4
5
6
7
8
Tip
spee
d ra
tioTime (second)
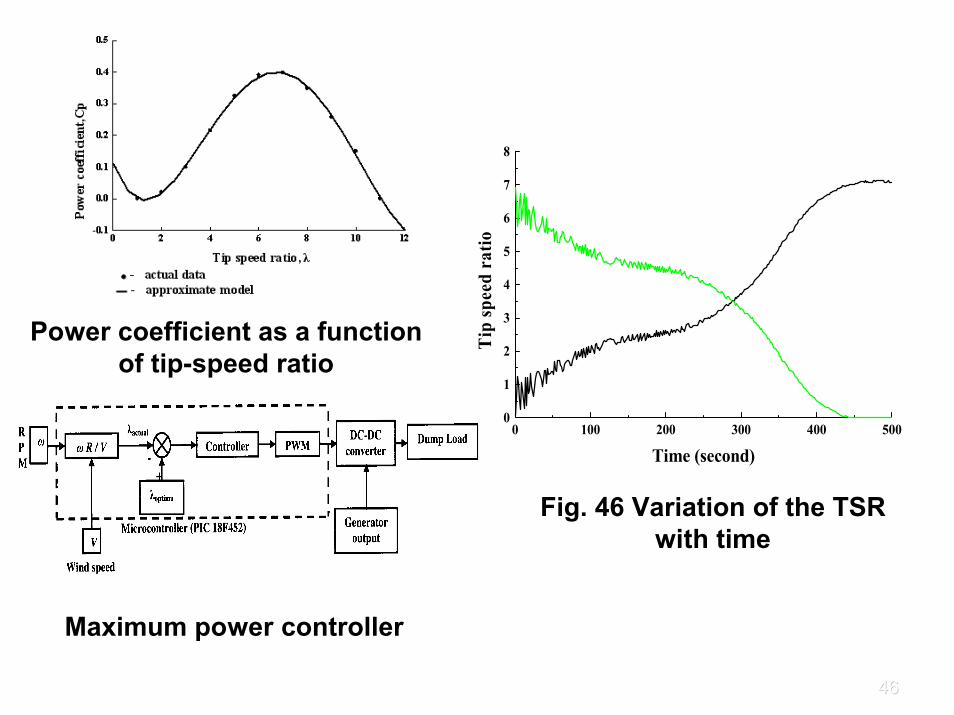
Fig. 46 Variation of the TSR with time
Power coefficient as a function of tip-speed ratio
Maximum power controller
4747
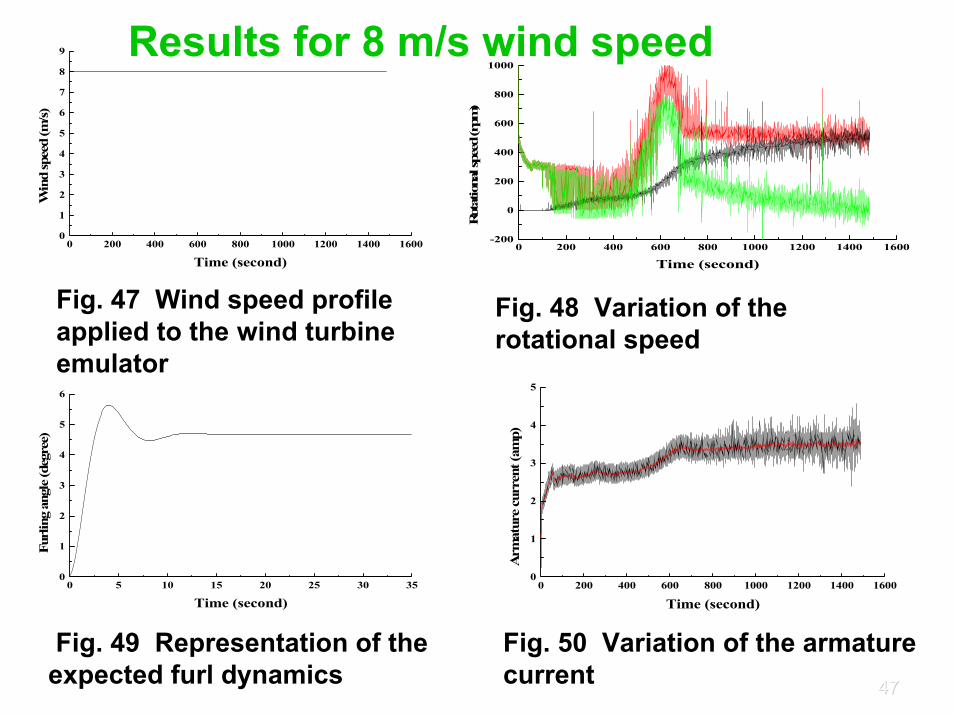
Fig. 47 Wind speed profile applied to the wind turbine emulator
Fig. 48 Variation of the rotational speed
Fig. 49 Representation of the expected furl dynamics
Fig. 50 Variation of the armature current
0 200 400 600 800 1000 1200 1400 16000
1
2
3
4
5
6
7
8
9W
ind
spee
d (m
/s)
Time (second)0 200 400 600 800 1000 1200 1400 1600
-200
0
200
400
600
800
1000
Rot
atio
nal s
peed
(rpm
)
Time (second)
0 5 10 15 20 25 30 350
1
2
3
4
5
6
Furl
ing
angl
e (d
egre
e)
Time (second)0 200 400 600 800 1000 1200 1400 1600
0
1
2
3
4
5
Arm
atur
e cu
rren
t (am
p)
Time (second)
Results for 8 m/s wind speed
4848
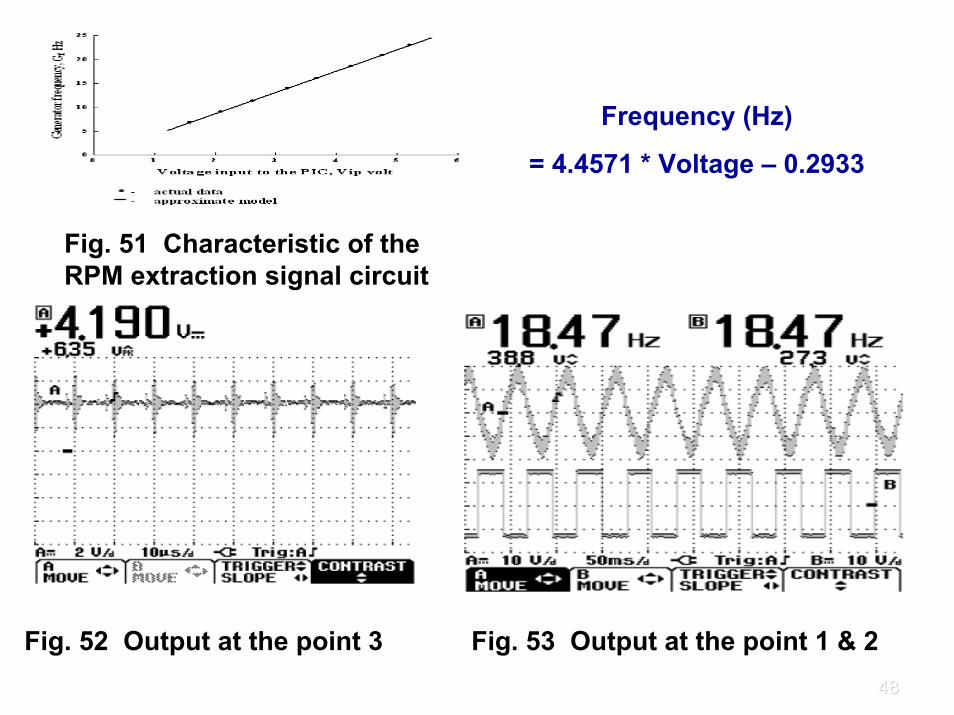
Frequency (Hz)
= 4.4571 * Voltage – 0.2933
Fig. 51 Characteristic of the RPM extraction signal circuit
Fig. 52 Output at the point 3 Fig. 53 Output at the point 1 & 2
4949
0 200 400 600 800 1000 1200 1400 16000
1
2
3
4
5
6
7
8
Tip
spee
d ra
tio
Time (second)
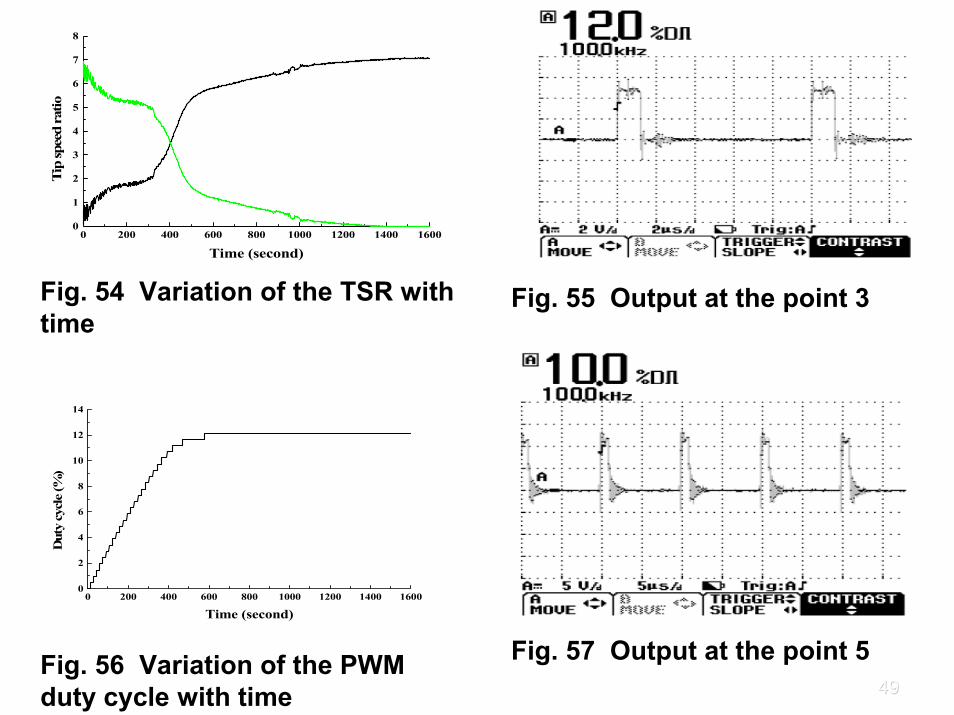
Fig. 54 Variation of the TSR with time
Fig. 55 Output at the point 3
0 200 400 600 800 1000 1200 1400 16000
2
4
6
8
10
12
14
Dut
y cy
cle
(%)
Time (second)
Fig. 57 Output at the point 5Fig. 56 Variation of the PWM duty cycle with time
5050
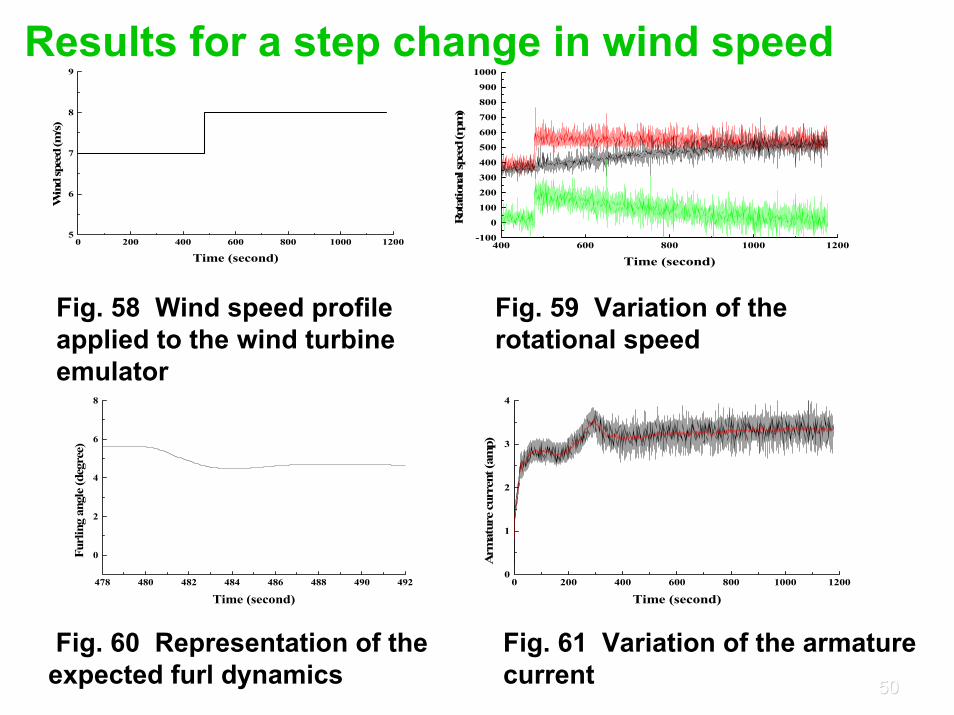
Fig. 58 Wind speed profile applied to the wind turbine emulator
Fig. 59 Variation of the rotational speed
Fig. 60 Representation of the expected furl dynamics
Fig. 61 Variation of the armature current
0 200 400 600 800 1000 12005
6
7
8
9W
ind
spee
d (m
/s)
Time (second)400 600 800 1000 1200
-100
0
100
200
300
400
500
600
700
800
900
1000
Rot
atio
nal s
peed
(rpm
)
Time (second)
478 480 482 484 486 488 490 492
0
2
4
6
8
Furl
ing
angl
e (d
egre
e)
Time (second)0 200 400 600 800 1000 1200
0
1
2
3
4
Arm
atur
e cu
rren
t (am
p)
Time (second)
Results for a step change in wind speed
5151
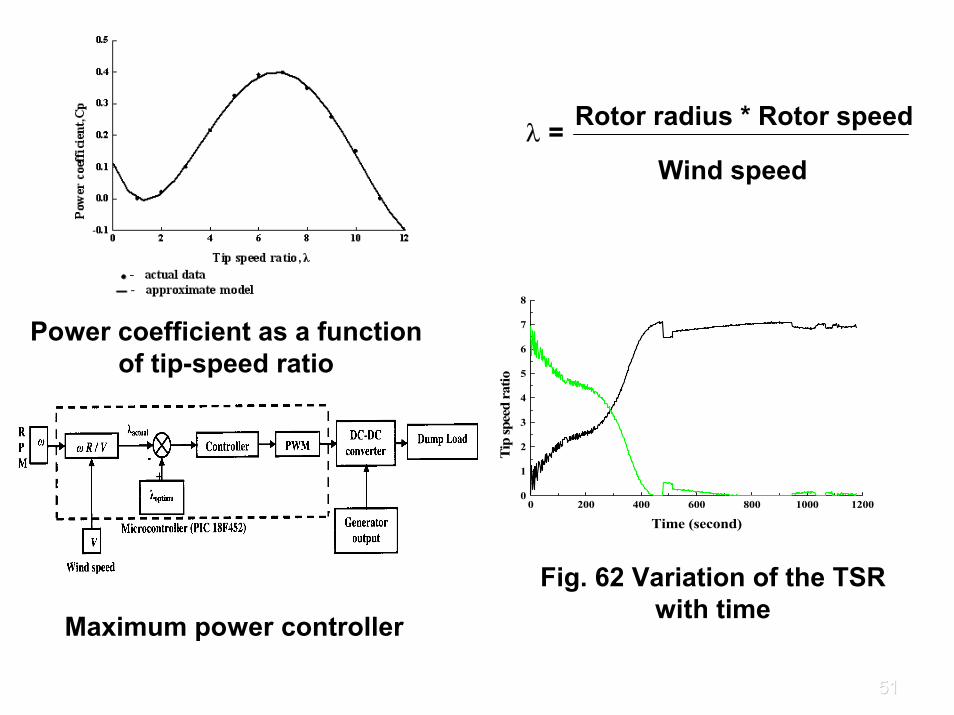
Power coefficient as a function of tip-speed ratio
Fig. 62 Variation of the TSR with timeMaximum power controller
0 200 400 600 800 1000 12000
1
2
3
4
5
6
7
8
Tip
spee
d ra
tioTime (second)
λ =Wind speed
Rotor radius * Rotor speed
5252
Conclusions
A separately excited DC motor based an isolated small wind turbine emulator has been implemented for small wind turbine system.
Inertia of the wind turbine has been considered by coupling an inertia disk with the system.
A maximum power point controller along with required power electronics has been implemented and tested.
Emulator test results show acceptable performance.

5353
Supervisors
Dr. M.Tariq Iqbal
Dr. John E. Quaicoe
Acknowledgements
• Faculty of Engineering, MUN
• School of Graduate Studies, MUN
• NSERC

5454
Thank you
Questions/Comments?????