Embed Size (px)
Citation preview

AN INVESTIGATION OF THREE METACOGNITIVE MEASURES
by
Cristina D. Zepeda
B.S., University of San Diego, California, 2011
Submitted to the Graduate Faculty of the
Kenneth P. Dietrich School of Arts and Sciences in partial fulfillment
of the requirements for the degree of
Master of Science
University of Pittsburgh
2015

ii
UNIVERSITY OF PITTSBURGH
THE KENNETH P. DIETRICH SCHOOL OF ARTS AND SCIENCES
This thesis was presented
by
Cristina D. Zepeda
It was defended on
June 23, 2015
and approved by
Ming-Te Wang, Associate Professor, Department of Education, University of Pittsburgh
Christian D. Schunn, Professor, Department of Psychology, University of Pittsburgh
Thesis Director: Timothy J. Nokes-Malach, Associate Professor, Department of Psychology,
University of Pittsburgh

iii
Copyright © by Cristina D. Zepeda
2015
iv
Metacognition, or the awareness and ability to control one’s cognitions, is hypothesized to play a
central role in productive problem solving (Berardi-Coletta, Buyer, Dominowski, & Rellinger,
1995) and self-regulated learning (Zepeda, Richey, Ronevich, & Nokes-Malach, 2015). To
assess metacognitive skills, different measures have been developed including questionnaires,
verbal protocols, and metacognitive judgments. However, there is little research on whether
these measures assess the same metacognitive processes (e.g., monitoring, debugging, and
evaluation) or are related to the same learning outcomes (e.g., transfer and preparation for future
learning). To address these issues we investigated whether these three measures captured the
same metacognitive processes during a learning task and test. The results showed that evaluation
skills as measured by verbal protocols were positively related to debugging and evaluation as
measured by the task-based questionnaire. There were also unexpected negative associations
between monitoring skills as measured by verbal protocols and the questionnaire and
metacognitive judgments. There was no association between the monitoring questionnaire and
metacognitive judgments. All three measures were related to learning, but the type of
metacognitive skill, the direction of the effect, and the type of learning differed among the
measures. Implications for future research and applications are discussed.
AN INVESTIGATION OF THREE METACOGNITIVE MEASURES
Cristina D. Zepeda, M.S.
University of Pittsburgh, 2015

v
TABLE OF CONTENTS
1.0 INTRODUCTION ........................................................................................................ 1
1.1 THEORY AND MEASUREMENT ................................................................... 1
1.2 RELATION AMONG MEASURES .................................................................. 3
1.3 RELATION TO ROBUST LEARNING ........................................................... 5
1.3.1 Questionnaires ............................................................................................... 6
1.3.2 Verbal protocols ............................................................................................ 7
1.3.3 Metacognitive judgments ............................................................................. 7
1.4 MEASUREMENT VALIDITY .......................................................................... 8
1.4.1 Questionnaires ............................................................................................... 9
1.4.2 Verbal protocols .......................................................................................... 11
1.4.3 Metacognitive judgments ........................................................................... 12
1.5 CURRENT WORK ........................................................................................... 14
2.0 MIXED METHOD STUDY ...................................................................................... 16
3.0 METHODS ................................................................................................................. 17
3.1 PARTICIPANTS ............................................................................................... 17
3.2 DESIGN .............................................................................................................. 17
3.3 MATERIALS ..................................................................................................... 18
3.3.1 Learning pretest .......................................................................................... 18
vi
3.3.2 Learning activities ....................................................................................... 19
3.3.2.1 Scoring of learning activities .............................................................. 20
3.3.3 Learning posttest ......................................................................................... 21
3.3.3.1 Embedded resource............................................................................. 21
3.3.3.2 Scoring of posttest items ..................................................................... 22
3.3.3.3 Calibration of JOKs ............................................................................ 22
3.3.4 Task-based metacognitive questionnaire .................................................. 23
3.3.5 Verbal protocol coding ............................................................................... 26
3.4 PROCEDURE .................................................................................................... 28
4.0 RESULTS ................................................................................................................... 29
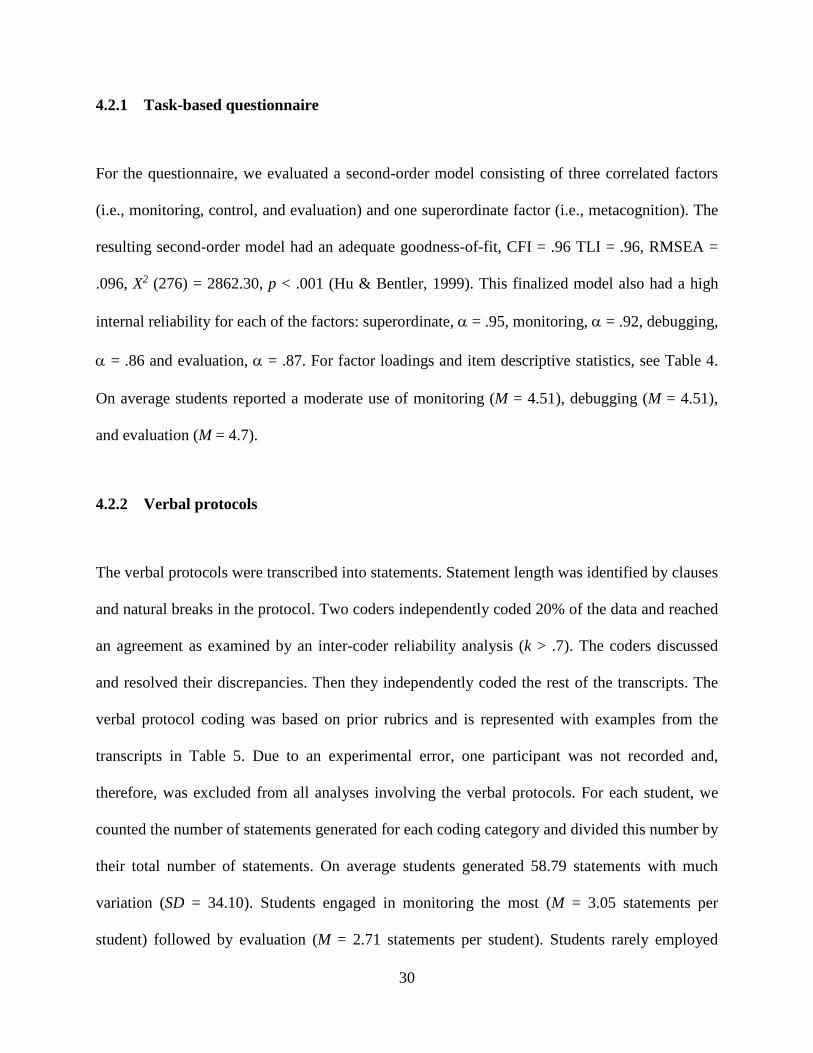
4.1 PRETEST ........................................................................................................... 29
4.2 STRUCTURAL VALIDITY AND RELIABILITY ....................................... 29
4.2.1 Task-based questionnaire ........................................................................... 30
4.2.2 Verbal protocols .......................................................................................... 30
4.3 RELATION WITHIN AND ACROSS METACOGNITIVE MEASURES . 31
4.4 RELATION BETWEEN METACOGNITIVE MEASURES AND
LEARNING ......................................................................................................................... 33
4.4.1 Learning and test performance ................................................................. 33
4.4.2 Task-based questionnaire ........................................................................... 34
4.4.3 Verbal protocols .......................................................................................... 35
4.4.4 JOKs ............................................................................................................. 36
4.4.4.1 Average ratings ................................................................................... 36
4.4.4.2 Mean absolute accuracy ..................................................................... 36

vii
4.4.4.3 Discrimination ..................................................................................... 37
4.4.5 Competing models ....................................................................................... 38
5.0 DISCUSSION ............................................................................................................. 40
5.1 RELATION OF MEASURES .......................................................................... 40
5.2 ROBUST LEARNING ...................................................................................... 42
5.3 THEORY ............................................................................................................ 45
5.4 FUTURE RESEARCH ...................................................................................... 46
BIBLIOGRAPHY ....................................................................................................................... 48
viii
LIST OF TABLES
Table 1. Comparison of three measures. ......................................................................................... 9
Table 2. Overview of the metacognitive measurements. .............................................................. 15
Table 3. Formulas used to calculate calibrations. ......................................................................... 23
Table 4. Descriptive statistics and factor loading. ........................................................................ 24
Table 5. Verbal coding rubric. ...................................................................................................... 27
Table 6. Associations between the number of utterances and the counts of each verbal protocol
code ............................................................................................................................................... 31
Table 7. Descriptive statistics for each measure ........................................................................... 31
Table 8. Correlations between the task-based questionnaire, verbal protocols, and metacognitive
judgments ...................................................................................................................................... 32
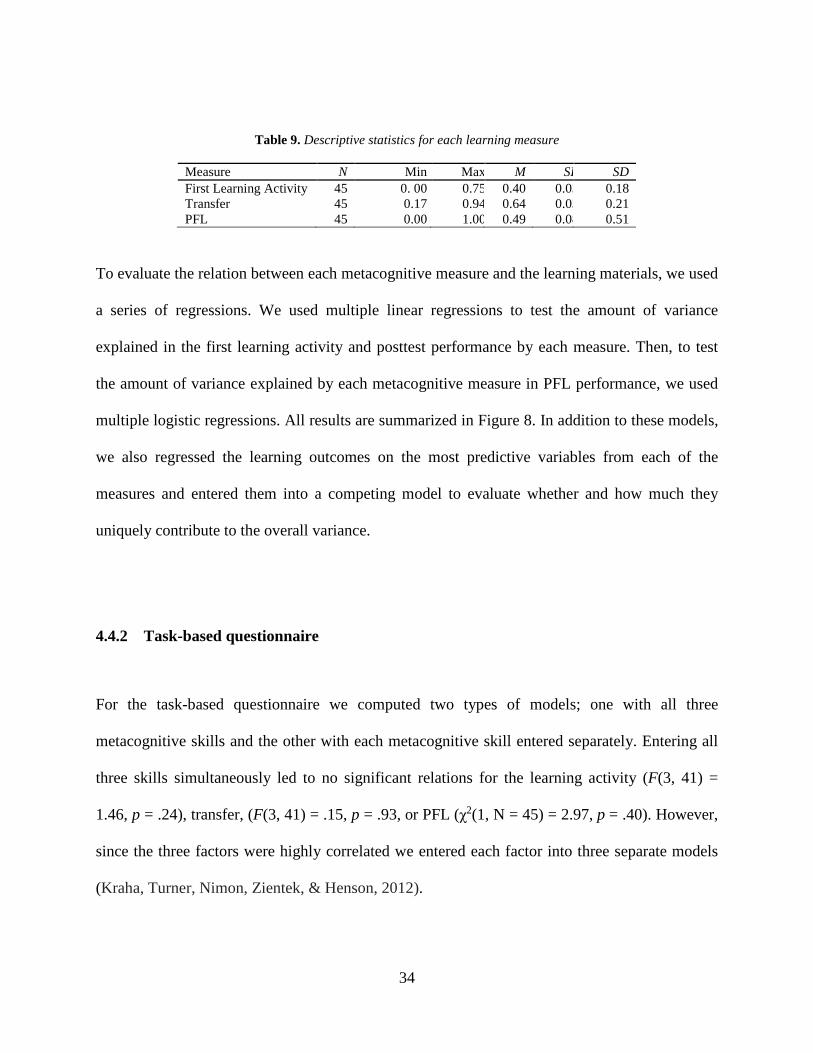
Table 9. Descriptive statistics for each learning measure ............................................................. 34
Table 10. Multiple linear regression model predicting performance on the first activity with
verbal protocols ............................................................................................................................. 36

ix
LIST OF FIGURES
Figure 1. Comparison of theoretical frameworks and the measures related to them. We aim to
measure the metacognitive constructs common between the models represented by the white
rectangles. ....................................................................................................................................... 2
Figure 2. Visual representation of the across-methods-and-time design. The gray arrow indicates
time from the learning task and the circles demonstrate the location of each metacognitive
measure in relation to the target learning measure. ........................................................................ 4
Figure 3. Comparison of transfer and PFL. .................................................................................... 6
Figure 4. Design summary. ........................................................................................................... 18
Figure 5. Example PFL test item. Identical to Belenky & Nokes-Malach (2012, p. 11). ............. 19
Figure 6. Data sets given in the variability activity. Identical to Belenky & Nokes-Malach (2012,
p. 12) ............................................................................................................................................. 20
Figure 7. Associations among variables across measures. ........................................................... 33
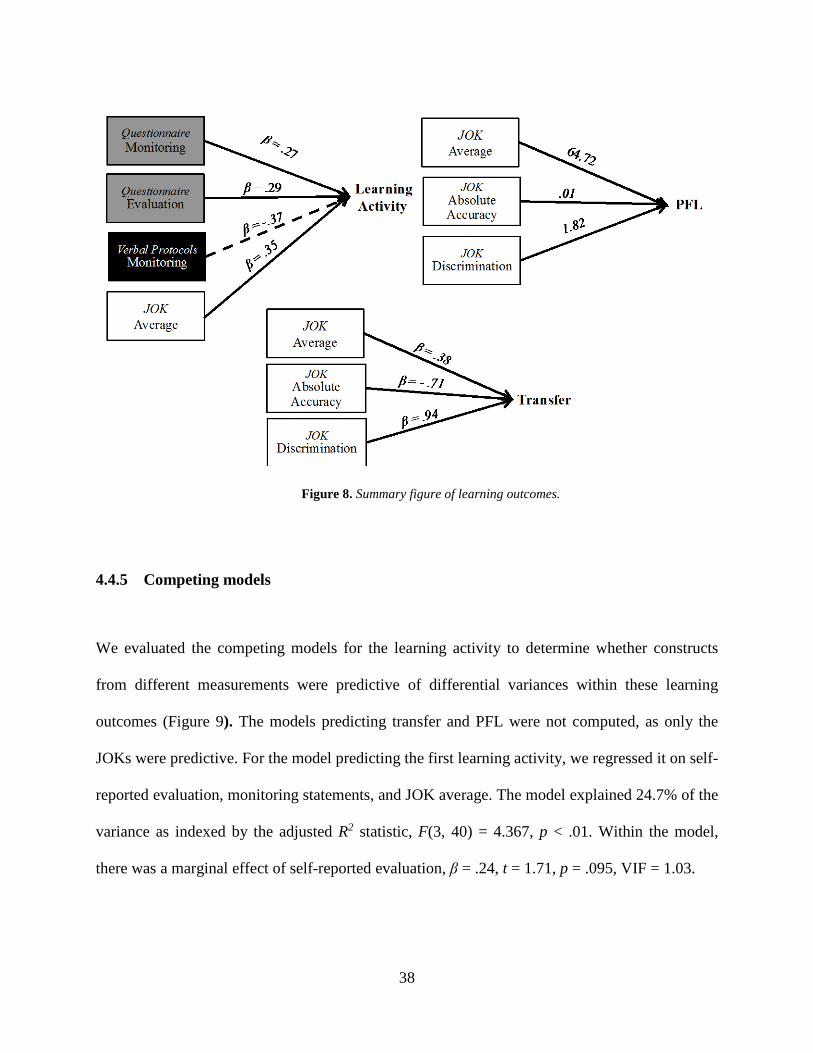
Figure 8. Summary figure of learning outcomes. ......................................................................... 38
Figure 9. Summary figure of competing models for learning outcomes. ..................................... 39
1
1.0 INTRODUCTION
Metacognition is a multi-faceted phenomena that involves thinking about and controlling one’s
cognitions (Flavell, 1979). Past research has shown that metacognition is positively related to
effective problem-solving (Berardi-Coletta, Buyer, Dominowski, & Rellinger, 1995) as well as
transfer (Lin & Lehman, 1999) and self-regulated learning (Zepeda, Richey, Ronevich, & Nokes-
Malach, 2015). However, prior work has used different metacognitive measures and the relations
among the measures are not well understood, resulting in concern about each measure’s validity
and accuracy (Veenman, 2005; Veenman, Prins, & Verheij, 2003). Further research is required to
help determine what types of metacognitive processes are being assessed by each measure. In
particular, we seek to evaluate three metacognitive measures: verbal protocols, a task-based
questionnaire, and metacognitive judgments.
1.1 THEORY AND MEASUREMENT
One source of the variation in measurement may be due to the variation in theories of
metacognition (e.g., Brown, 1987; Brown, Bransford, Ferrara, & Campione, 1983; Flavell, 1979;
Jacobs & Paris, 1987; Nelson & Narens, 1990; Schraw & Moshman, 1995). Although most
theories hypothesize that metacognition involves the ability to assess and regulate one’s
thoughts, they differ in how they operationalize those constructs (Pintrich, Wolters, & Baxter,
2
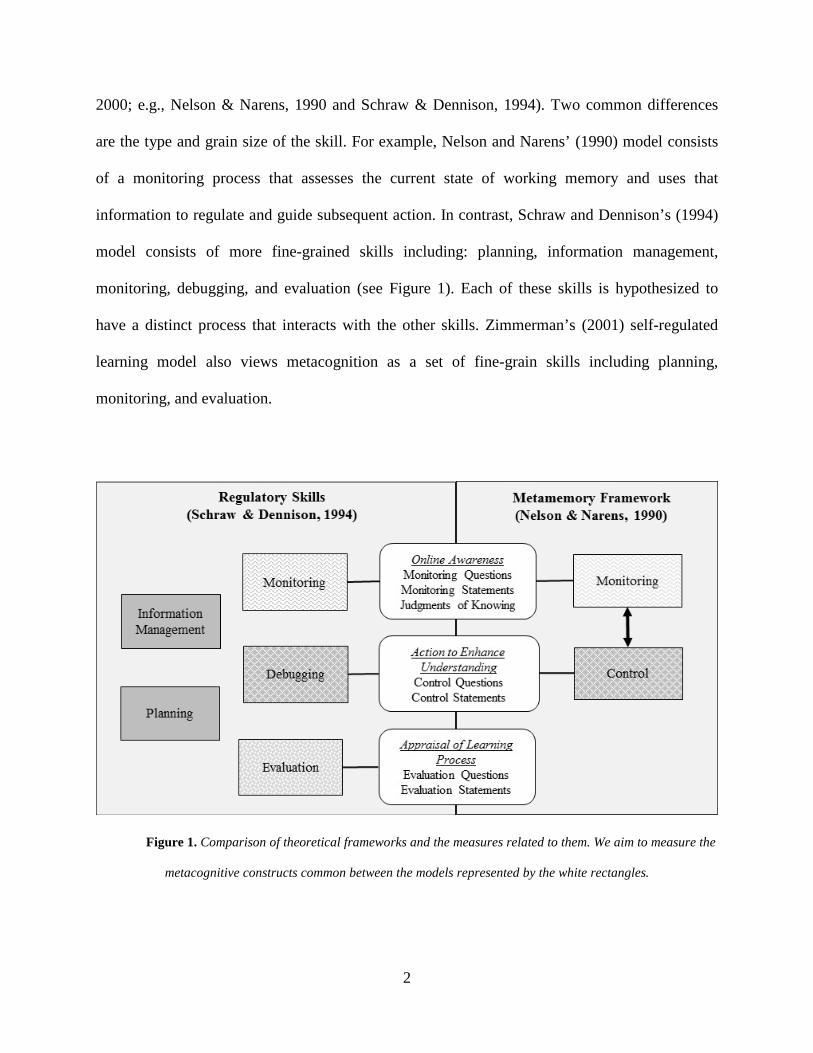
2000; e.g., Nelson & Narens, 1990 and Schraw & Dennison, 1994). Two common differences
are the type and grain size of the skill. For example, Nelson and Narens’ (1990) model consists
of a monitoring process that assesses the current state of working memory and uses that
information to regulate and guide subsequent action. In contrast, Schraw and Dennison’s (1994)
model consists of more fine-grained skills including: planning, information management,
monitoring, debugging, and evaluation (see Figure 1). Each of these skills is hypothesized to
have a distinct process that interacts with the other skills. Zimmerman’s (2001) self-regulated
learning model also views metacognition as a set of fine-grain skills including planning,
monitoring, and evaluation.
Figure 1. Comparison of theoretical frameworks and the measures related to them. We aim to measure the
metacognitive constructs common between the models represented by the white rectangles.

3
Although some researchers initially sought to capture these finer-grained skills vis-à-vis a
questionnaire they often ended up combining them into a single factor due to challenges in
establishing each as a separate construct (e.g., regulation, Schraw & Dennison, 1994). Similarly,
Pressley and Afflerbach (1995) had difficulty in differentiating monitoring from control
processes in verbal protocols and found that they tend to occur at the same time. The challenges
in differentiating between metacognitive skills could be why other researchers have proposed
fewer, interactive skills (Howard-Rose & Winne, 1993; Pintrich, Wolters, & Baxter, 2000).
We aim to further examine the relation between theory and measurement with respect to
monitoring, control/debugging, and evaluating. We define monitoring as one’s awareness of his
or her thinking and knowledge during the task, conceptual debugging as goal-directed activities
to increase one’s understanding, and evaluation as an assessment of one’s understanding,
accuracy, and/or strategy-use once the task is completed. For example, if a student identifies
what he or she does not understand (monitoring) while attempting to solve a problem he or she
has an opportunity to fill the gap in knowledge by seeking new information, rereading,
summarizing the instructions, trying out new ideas, and so forth (debugging). Then, once the
activity is completed, he or she can reflect on their accuracy as well as which strategies or
knowledge they found most beneficial in order to prepare them for future tasks (evaluation).
1.2 RELATION AMONG MEASURES
Two factors that differ across the measures concern when (e.g., concurrent vs. retrospective) and
how (e.g., think aloud vs. questionnaire vs. judgment) metacognition is assessed. Concurrent or
“online” measures such as verbal protocols (e.g., Chi, Bassok, Lewis, Reimann, & Glaser, 1989)

4
attempt to examine people’s metacognition as it is occurring whereas retrospective or “offline”
measures such as questionnaires (e.g., Schraw & Dennison, 1994) or retrospective metacognitive
judgments (see Dunlosky & Metcalfe, 2009 for an overview) evaluate metacognition after the
activity has occurred. Unlike the retrospective measures, concurrent verbal protocols allow
access to the contents of working memory without having to rely on one’s long-term memory
(Ericsson & Simon, 1980). For a visual representation see Figure 2.
Figure 2. Visual representation of the across-methods-and-time design. The gray arrow indicates time
from the learning task and the circles demonstrate the location of each metacognitive measure in relation to the
target learning measure.
Little prior work has directly compared these measures to one another. However, there
are a few studies showing that student responses to questionnaires rarely correspond to
concurrent measures (Cromley & Azevedo, 2006; Van Hout-Wolters, 2009; Veenman, 2005;
Veenman et al., 2003; Winne, Jamieson-Noel, & Muis, 2002). For example, Veenman et al.
(2003) found weak associations (r’s ranged from -.18 to = .29) between verbal protocols and a
questionnaire assessing student’s metacognitive study habits. Van Hout-Wolters’ (2009) work
revealed similar findings in which correlations between verbal protocols and dispositional
5
questionnaires were weak (r’s = -.07 to .22). In addition, Zepeda et al. (2015) found that students
who received metacognitive training differed from a comparison condition in the accuracy of
their metacognitive judgments, but not in their questionnaire responses. Schraw and Dennison
(1994) and Sperling, Howard, Staley, and DuBoius (2004) found similar findings in which
student accuracy on metacognitive judgments were not related to their responses on the
Metacognitive Awareness Inventory’s (MAI) regulation dimension. The lack of associations
among the different metacognitive measures may be due to the measurements assessing different
processes, an imprecise measurement, or a combination of the two. Veenman, Van Hout-
Wolters, and Afflerbach (2006) suggest that to evaluate the relations of these measurements a
multi-method design should explicitly compare different methodologies to one another.
1.3 RELATION TO ROBUST LEARNING
To what degree do these different measures predict learning? Prior research provides some
evidence that metacognition is related to school achievement (e.g., grades or GPA) and
performance on tests (e.g., quizzes, standardized assessments). However, no work has examined
whether all three measures predict the same type of learning outcomes.
We define robust learning as the acquisition of new knowledge or skills, which can be
applied to new contexts (transfer), or prepares students for future learning (PFL) (Bransford &
Schwartz, 1999; Koedinger, Perfetti, & Corbett, 2012; Schwartz, Bransford, & Sears, 2005;
Richey & Nokes-Malach, 2015). We define transfer as the ability to use and apply prior
knowledge to solve new problems, and PFL, as the ability use prior knowledge to learn new
material (reference Figure 3 for a comparison). To our knowledge, there is no work examining

6
the relation between metacognition and PFL using these different metacognitive measures. To
gain an understanding of how these measures have been related to different learning outcomes
we surveyed the literature.
Figure 3. Comparison of transfer and PFL.
1.3.1 Questionnaires
Prior work using metacognitive questionnaires typically measure student achievement as
assessed by class grades, GPA, or standardized tests (Pintrich & DeGroot, 1990 and Pintrich,
Smith, Garcia, & McKeachie, 1993; Sperling et al., 2004). Using these measures makes it
difficult to identify how much and what type of knowledge a student learned since these
measures are coarse-grained and often do not take into account prior knowledge. For example,
class grades (which determine GPA) typically include other factors in addition to individual
learning assessments such as participation and group work. These measures also do not
differentiate between different types of learning outcomes such as transfer or PFL.
Instruction Concept A
Assessment on Concept A’
Out
Instruction Concept A
Assessment on Concept A’
Resource on Concept B
Assessment on Concept B’
Out
In

7
1.3.2 Verbal protocols
In contrast to questionnaires, some past work using verbal protocol methods has examined
different types of learning. For example, Van der Stel and Veenman (2010) found that increased
use of metacognitive skills (e.g., planning, monitoring and evaluating) was associated with better
near transfer (e.g., performance on isomorphic problems with different values). In other work,
Renkl (1997) found that the frequency of positive monitoring statements (e.g., “That makes
sense”) was unrelated to transfer performance, but the frequency of negative monitoring
statements (e.g., “I do not understand this”) was negatively related to transfer. This result shows
that different types of metacognitive phenomena are differentially related to transfer. In this case,
monitoring behaviors can be useful in identifying when a learner does not understand something.
1.3.3 Metacognitive judgments
Metacognitive judgments such as judgments of knowing (JOKs) have typically been used in
vocabulary paradigms (e.g., Jacob & Nelson, 1990). There is some work that has examined JOKs
and their relation to test performance and GPA (Nietfeld, Cao, & Osborne, 2005; 2006).
Nietfeld, Cao, and Osborne (2005) found that students’ JOKs across different tests (that included
transfer items) within a course were associated with learning even when controlling for GPA.
From this brief survey of the prior literature, we see that different metacognitive
measures have been related to different types of learning outcomes. Questionnaires have
primarily been related to achievement outcomes whereas verbal protocols and metacognitive
judgments have been related to multiple learning outcomes including achievement and transfer.
This variation makes it difficult to determine whether these measures predict the same types of

8
learning. To gain a better understanding of how metacognition is related to learning, we examine
the relations among all three measures to transfer and PFL. These empirical and theoretical
challenges have direct implications for determining measurement validity.
1.4 MEASUREMENT VALIDITY
We use Messik’s (1989) validity framework to structure our review. We focus on six aspects of
validity: structural, external, content, temporal occurrence, generality, and utility. Structural
validity concerns whether the measure produces the predicted structure of the theoretical
constructs (e.g., type and number of metacognitive skills). External validity concerns the
predictive or convergent relations to variables that theory predicts (e.g., similar types of learning
outcomes and alignment of metacognitive measures). Given the “Relation among Measures”
above, there are some issues in the convergent aspect of external validity. Content validity
concerns whether the measure is tailored to a specific activity or material. Temporal occurrence
concerns the measures relation to what is being assessed in terms of time elapsed as represented
in Figure 2. Generality of the meaning concerns the applicability of the measure to different
populations and utility examines the ease of implementation. Below we describe each
metacognitive measure and their alignment with each of the six aspects of validity. See Table 1
for a summary.

9
Table 1. Comparison of three measures.
Measurement Substantive Validity
External Validity
Structural Validity
Content Validity Temporal Occurrence
Generality Utility
Questionnaires Weak Moderate Weak Weak – General or specific
Retrospective Yes Strong
Verbal Protocols
Moderate Moderate Strong Moderate – Domain general
Concurrent Yes Weak
JOK Weak Moderate Strong Weak – domain general and specific
Retrospective Yes Moderate
1.4.1 Questionnaires
Questionnaires are used to determine the degree to which students use various metacognitive
skills. The majority of questionnaires ask students to report on their dispositional use of the skills
although a few are specific to a task or context. The similarity between the structure of the
measurement and theory is not aligned well. Many questionnaires attempt to assess fine-grain
distinctions between metacognitive skills, but are unable to do so. For example, Schraw and
Dennison (1994) originally sought to capture five distinct metacognitive skills within the MAI;
however, the results revealed only a single factor.
In contrast, there is moderate evidence for the external validation of questionnaires. Prior
work has shown that questionnaires relate to other variables predicted by metacognitive theory
such as achievement (Pintrich & DeGroot, 1990; Pintrich & Garcia, 1991) as well as
convergence with similar questionnaires assessing similar processes (Sperling et al., 2004; Muis,
Winne, & Jamieson-Noel, 2007). For example, Sperling and colleagues (2004) found that MAI’s
Regulation of Cognition dimension was related to the MSLQ’s Metacognitive self-regulation
scale (r = .46).
10
The content validity of a questionnaire depends on its intended scope. Some
questionnaires are designed to capture the general use of metacognitive skills such as the MAI or
MSLQ. Other questionnaires assess metacognitive skills for a particular task. For example, work
by Van Hout-Wolters (2009) demonstrated that task-based measures have a stronger positive
relation to verbal protocols than dispositional questionnaires. It is difficult to assess the success
of these different types of questionnaires because dispositional questionnaires typically focus on
a generalization of the skills over a longer time period than task-based questionnaires.
Additionally, metacognitive questionnaires have been reliably adapted to serve a variety
of ages (e.g., Sperling Howard, Miller, & Murphy 2002). Of particular interest to educators and
researchers is the ease of administering and scoring the instrument. Researchers have sought to
develop easy-to-use retrospective questionnaires that take just a few minutes to complete.
Perhaps the ease of this measure is why there are many questionnaires aimed at capturing
different types of content, making it difficult to assess the validity of such measures.
Informed by this research and Schellings and Van Hout-Wolters’ (2011) in-depth
analysis of the use of questionnaires and their emphasis on selecting an appropriate questionnaire
given the nature of the to-be-assessed activity, we created a task-based questionnaire and adapted
items from the MAI, MSLQ, Awareness of Independent Learning Inventory (AILI, Meijer et al.,
2013), a problem-solving based questionnaire (Howard, Mcgee, Shia, & Hong, 2000; How do I
solve problems?), and a state-based questionnaire (O’Neil & Abeli, 1996; State Metacognitive
Inventory [SMI]). We chose to develop and validate a task-based metacognitive questionnaire
for three reasons. First, there is mixed evidence about the generality of metacognitive skills (Van
der Stel & Veenman, 2014). Second, there are no task-based metacognitive measures for a
11
problem-solving activity. Third, to our knowledge there is no questionnaire that reliably
distinguishes between the metacognitive skills of monitoring, debugging, and evaluation.
1.4.2 Verbal protocols
Verbal protocols provide fine-grain verbal data to test hypotheses about what and how
metacognition is used when a participant is engaged in some learning or problem-solving
activity. They tend to range in their specificity of metacognition in which the grain size of
metacognition differs. For example, Renkl (1997) only examined negative versus positive
monitoring whereas other verbal protocol analyses have attempted to create a detailed taxonomy
for evaluating the metacognitive activity of a learner (Meijer, Veenman, & van Hout-Wolters,
2006). Although Meijer, Veenman, and van Hout-Wolters (2006) originally sought to develop a
fine-grain taxonomy, due to difficulties in obtaining interrater reliability, they condensed their
codes into fewer, more generalized aspects of metacognition. Given this ability to capture
distinct metacognitive skills as predicted by theory, verbal protocols have structural validity.
Verbal protocols also have moderate external validity as they have been shown to
correlate with learning outcomes in some studies (e.g., Van der Stel & Veenman, 2010), but not
others (Meijer, Veenman, & van Hout-Wolters, 2012; Renkl, 1997). However, this might be
attributed to the way in which the verbal protocols were coded. Some coding rubrics differ in
whether they code for the quality of metacognition versus the frequency of a specific
metacognitive activity (Meijer, Veenman, & van Hout-Wolters, 2012).
Within a specific coding rubric, there is evidence showing that verbal protocols have
content validity, as it is domain general. Veenman, Elshout, and Meijer (1997) found that the
same coding rubric could be applied across three domains and were each predictive of learning
12
outcomes within that domain. Verbal protocols have also been successfully employed with a
variety of populations (e.g., Veenman et al. 2004) and can be applied to a variety of contexts and
tasks. They have been used in physics (Chi et al., 1989), biology (Gadgil, Nokes-Malach, & Chi,
2012), probability (Renkl, 1997), and reading (Pressley & Afflerbach, 1995), among others.
Unlike questionnaires, verbal protocols take a substantial amount of time to administer
and evaluate. Instead of administering the measurement to groups of students, researchers
typically run one student at a time because of the challenges of recording multiple speakers and
potential verbal interference across speakers in the same room. It also requires more time to
transcribe and code, making it a time-consuming task for researchers and practically challenging
to use in the classroom. Although think-aloud protocols are more difficult to employ in
classrooms, they provide benefits to researchers as it provides a fine-grained source of trace data
(Ericsson & Simon, 1980).
1.4.3 Metacognitive judgments
Metacognitive judgments are used to assess students’ accuracy in their monitoring.
Metacognitive judgments ask students to rate their confidence in their understanding, learning, or
an answer to a question (see Alexander, 2013 for an overview). Different types of calibrations
have been applied to determine the accuracy and consistency of student judgments (see Schraw,
2009 and Schraw, Kuch, & Gutierrez, 2013). A common form of metacognitive judgment is
called a JOK in which a student is asked to rate how confident he or she about an answer
(Schraw, 2009). It has structural validity in that it is designed to capture one metacognitive skill
referred to as monitoring or awareness of one’s understanding. However, this structure may
differ dependent on the calibrations used to assess different types of accuracy (for a review see
13
Schraw, 2009). JOKs have some external validity as Neitfeld, Cao, and Osborne (2005; 2006)
showed that student judgments were related to learning performance and GPA. The content
validity of JOKs is unclear. Some work has demonstrated it is domain general (Schraw, 1996;
Schraw, Dunkle, Bendixen, & Roedel, 1995) and other work has shown it is domain specific
(Kelemen, Frost, & Weaver, 2000). For example, as Schraw (1996) showed that when
controlling for test difficulty, confidence ratings from three unrelated tests (math, reading
comprehension, and syllogism) were moderately related to each other (average r = .42).
Regardless of these limitations, JOKs are also applied to multiple domains (e.g., physics, general
facts) and are used for multiple age groups (Dunlosky & Metcalfe, 2009). Although JOKs are
moderately easy to implement, it takes more time to determine calibrations of metacognitive
judgments than it does to evaluate questionnaire responses, but it is not as time intensive as
verbal protocols.
Drawing from Zepeda et al. (2015), we focus on the relation between three types of JOK
calibrations: absolute accuracy, gamma, and discrimination. In our prior work, we found
differences in an experimental manipulation for one form of calibration (discrimination) but not
others (absolute accuracy and gamma), suggesting that they captured different metacognitive
processes. Therefore, in this study we employ three different types of calibration: relative
accuracy as measured by gamma, absolute accuracy, and discrimination. Gamma evaluates
confidence judgment accuracy on one item relative to another (Nelson, 1996) whereas absolute
accuracy compares judgments to performance. Schraw (1995) suggested that since there is not a
one-to-one relation between gamma and absolute accuracy, research should report both.
Discrimination examines the degree to which students can distinguish their confidence for
incorrect and correct performance (Schraw, 2009). Positive discrimination indicates that a
14
learner gave higher confidence ratings for correct trials compared to incorrect trials, a negative
value indicates higher confidence ratings for incorrect trials compared to correct trials, and a zero
indicates no relation between the two. It can be interpreted that those with positive
discrimination are aware of their correct performance. In addition to these calibrations, we also
examined average JOK ratings given that students are typically poor at calibrating their
understanding when the task is difficult (Howie & Roebers, 2007).
1.5 CURRENT WORK
In this work, we assess the relations among a retrospective task-based questionnaire, concurrent
verbal protocols recorded during a learning activity, and metacognitive judgments of knowing
elicited during a posttest (outlined in Table 2). The overall goal of this study is to investigate
whether these measures capture the same metacognitive skills and to determine the degree to
which they predict similar learning outcomes. We hypothesize that:
H1: The metacognitive measurements will assess similar processes. Monitoring
assessed by JOKs will have a small positive association with the monitoring assessed by
the verbal protocols and the task-based questionnaire (r’s between .20 and .30) since all
assess some type of monitoring. We also predict a moderate relation between the verbal
protocols and the task-based questionnaire for monitoring, evaluating, and debugging (r’s
between .30 and .50), which would be consistent with past work examining the relations
between questionnaire and verbal protocols by Schellings and colleagues (2011, 2013).
H2: All measures will predict learning, transfer, and PFL.

15
Table 2. Overview of the metacognitive measurements.
Metacognitive Measurement
Metacognitive Skill
Timing Framing of the Assessment
Analytical Measures Predicted Learning Outcome
Questionnaires Monitoring, Control, and Evaluation
Retrospective Task-based CFA, EFA, Cronbach’s alpha
Learning, transfer, and PFL
Verbal Protocols Monitoring, Control, and Evaluation
Concurrent Task-based Inter-rater reliability, Cronbach’s alpha
Learning, transfer, and PFL
Metacognitive Judgments
Monitoring, and Monitoring Accuracy
Retrospective Test items
Cronbach’s alpha, Average, Mean Absolute accuracy, Gamma, and Discrimination measures
Learning, transfer, and PFL
Prior studies examining metacognition tend to utilize tell-and-practice activities in which
students receive direct instruction on the topic (e.g., Meijer, Veenman, & Van Hout-Wolters,
2006). However, we chose a structured-inquiry learning activity as it might provide more
opportunities for students to engage in metacognition (Schwartz & Bransford, 1998; Schwartz &
Martin, 2004). A core feature of structured inquiry activities is that students try to invent new
ways to think about, explain, and predict various patterns observed in the data. In the task we
chose, students attempt to solve a challenging statistics problem in which they have an
opportunity to monitor their progress and understanding, try out different strategies, and evaluate
their performance. Although there is controversy in the learning sciences about the benefits of
inquiry-based instruction (Alfieri, Brooks, Aldrich, & Tenenbaum, 2011), several research
groups have started to accumulate evidence for the benefits of these types of structured inquiry
activities in math and science domains (e.g., Belenky & Nokes-Malach, 2012; Kapur, 2008; Roll,
Aleven, & Koedinger, 2009; Schwartz & Martin, 2004). For example, these activities have been
shown to engage students in more constructive cognitive processes (Roll et al., 2009), and to
facilitate learning and transfer (Kapur & Bielaczyc, 2012; Kapur, 2008, 2012; Roll et al., 2009).

16
2.0 MIXED METHOD STUDY
The first set of analyses examined the structural validity and reliability of each method as
outlined in Table 2. For the questionnaire, we evaluated the distinction between the different
metacognitive components of monitoring, control, and evaluation. The second set of analyses
examined whether the metacognitive skills represented by the task-based questionnaire, verbal
protocols, and metacognitive judgments captured the same processes. The third set of analyses
evaluated the degree to which the different measures related to learning, transfer, and PFL. This
set of analyses would also provide external reliability for the measurements.

17
3.0 METHODS
3.1 PARTICIPANTS
Sixty-four undergraduates (51 = males) enrolled in an introductory psychology course at the
University of Pittsburgh participated in the study. All students received credit hours for their
participation. We excluded 19 students from the analyses, as they were able to correctly solve for
mean deviation and/or standard deviation on the pretest. The remaining 45 students (36 = male)
were included in the analyses as they still had an opportunity to learn the material. Within this
sample, student GPAs included a broad range with students reporting below a 2.0 (4.4%), 2.0-2.5
(20%), 2.5-3.0 (28.9%), 3.0-3.5 (24.4%), and 3.5-4.0 (22.2%). The sample was comprised of
77.8% Caucasians, 6.7% African Americans, 6.7% Biracials, 4.4% Hispanics, 2.2% Asian
Indians, and 2.2% did not specify.
3.2 DESIGN
Using an across-method-and-time design, we recorded student behaviors with video recording
software during a learning activity, and collected student responses to a task-based questionnaire
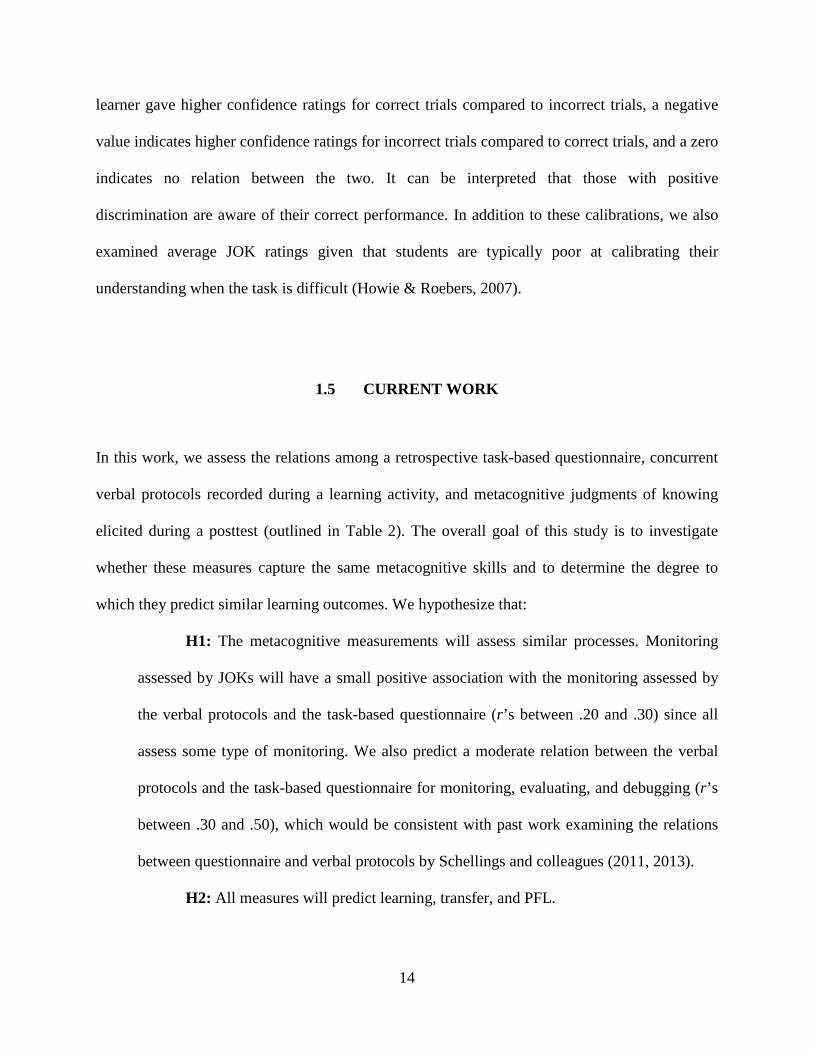
and retrospective judgments of knowing. See Figure 4 for an overview of the experimental
design, materials, and procedure.
18
Figure 4. Design summary.
3.3 MATERIALS
The materials consisted of a pretest, learning phase, questionnaires, and a posttest. The learning
phase was divided into three segments: an invention task on variability, a lecture on mean
deviation, and a learning activity on standard deviation. The questionnaires assessed student
metacognition, motivation, and cognitive processes; however, for this paper we focus only on the
metacognitive components.
3.3.1 Learning pretest
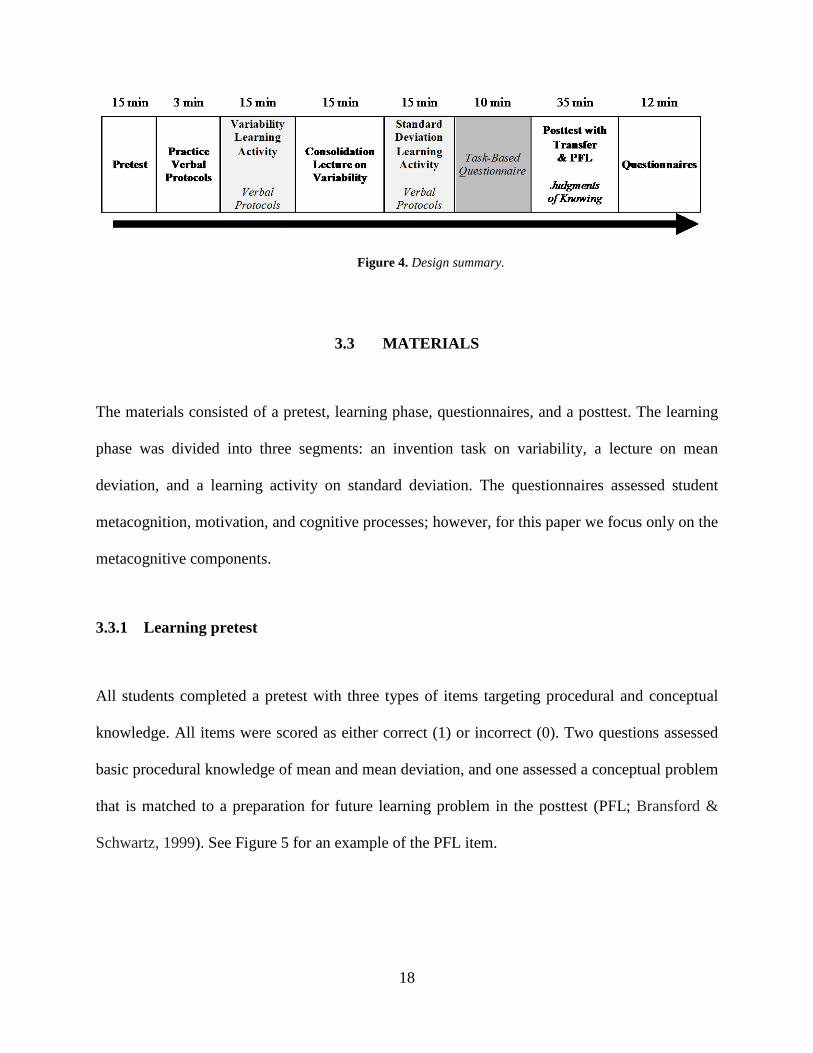
All students completed a pretest with three types of items targeting procedural and conceptual
knowledge. All items were scored as either correct (1) or incorrect (0). Two questions assessed
basic procedural knowledge of mean and mean deviation, and one assessed a conceptual problem
that is matched to a preparation for future learning problem in the posttest (PFL; Bransford &
Schwartz, 1999). See Figure 5 for an example of the PFL item.
19
Figure 5. Example PFL test item. Identical to Belenky & Nokes-Malach (2012, p. 11).
3.3.2 Learning activities
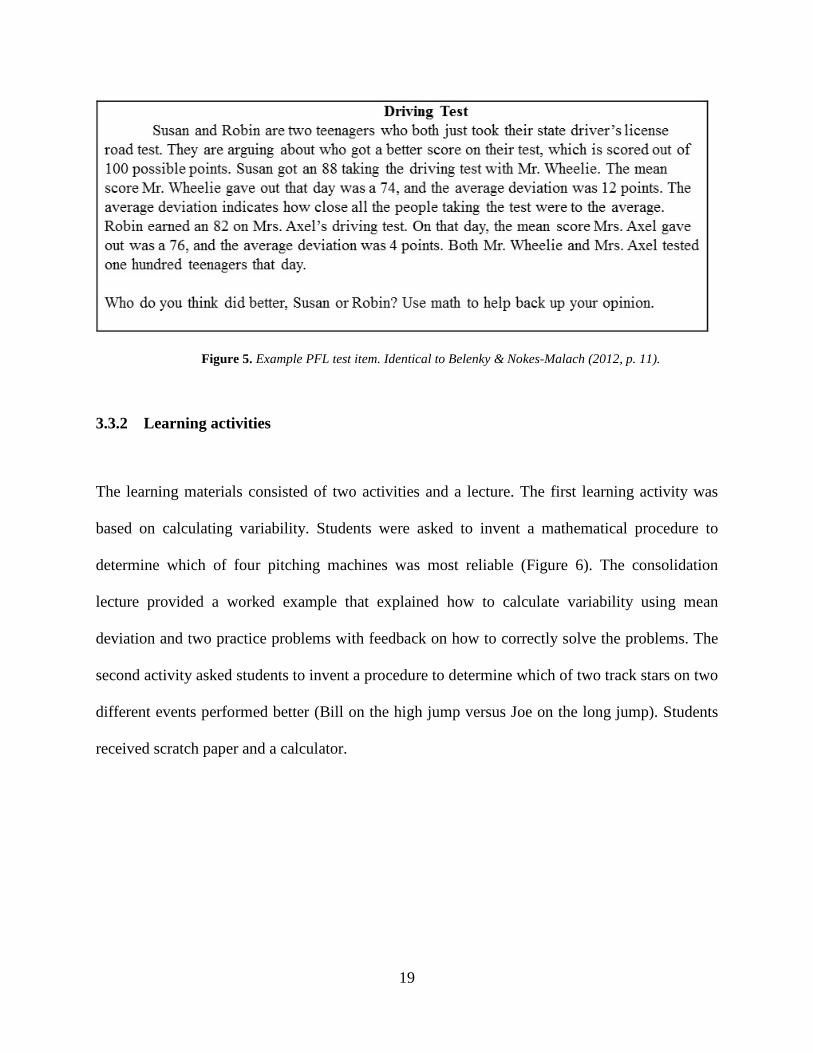
The learning materials consisted of two activities and a lecture. The first learning activity was
based on calculating variability. Students were asked to invent a mathematical procedure to
determine which of four pitching machines was most reliable (Figure 6). The consolidation
lecture provided a worked example that explained how to calculate variability using mean
deviation and two practice problems with feedback on how to correctly solve the problems. The
second activity asked students to invent a procedure to determine which of two track stars on two
different events performed better (Bill on the high jump versus Joe on the long jump). Students
received scratch paper and a calculator.
20
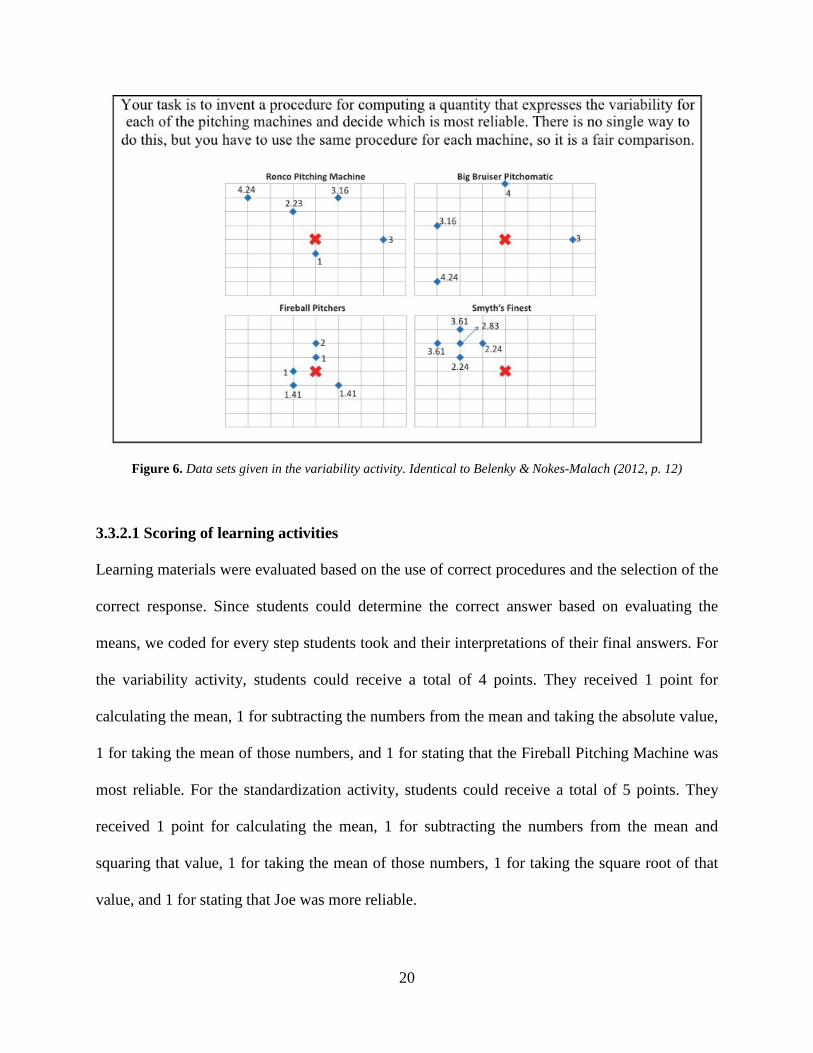
Figure 6. Data sets given in the variability activity. Identical to Belenky & Nokes-Malach (2012, p. 12)
3.3.2.1 Scoring of learning activities
Learning materials were evaluated based on the use of correct procedures and the selection of the
correct response. Since students could determine the correct answer based on evaluating the
means, we coded for every step students took and their interpretations of their final answers. For
the variability activity, students could receive a total of 4 points. They received 1 point for
calculating the mean, 1 for subtracting the numbers from the mean and taking the absolute value,
1 for taking the mean of those numbers, and 1 for stating that the Fireball Pitching Machine was
most reliable. For the standardization activity, students could receive a total of 5 points. They
received 1 point for calculating the mean, 1 for subtracting the numbers from the mean and
squaring that value, 1 for taking the mean of those numbers, 1 for taking the square root of that
value, and 1 for stating that Joe was more reliable.

21
3.3.3 Learning posttest
The posttest contained seven items that measured students’ conceptual and procedural
knowledge of the mean deviation. It also assessed students’ abilities to visually represent and
reason about data. These items assess a variety of different types of transfer such as near and
immediate (Nokes-Malach, VanLehn, Belenky, Lichtenstein, & Cox, 2013). For the purposes of
this work, we do not analyze these levels of transfer separately as there are not enough items for
each transfer type to effectively examine outcomes.
Within the assessment, there was also a PFL problem that evaluated students’ abilities to
apply information from an embedded resource to this standard deviation problem (see below for
more information and Figure 5 for an example problem). The PFL problem required students to
determine which value from two different distributions was more impressive. During the
posttest, students were also asked to respond to a judgment of knowing or JOK for each problem
in which they rated how confident they were in their answer from 1 being not at all confident to
5 being very confident.
3.3.3.1 Embedded resource
The learning resource was presented as a worked example in the posttest and showed students
how to calculate a standardized score with a simple data set. This resource also gave another
simple problem involved using standardized scores. The transfer question appeared two
problems after the worked example. The problem was presented later in the posttest so that the
application of the information was not due to simple temporal proximity (i.e., the next problem),
but instead it required that students to notice, recall, and apply the relevant information at a later
time.
22
3.3.3.2 Scoring of posttest items
Each item was coded for accuracy. The posttest was comprised of two types of problems: 6
transfer items focused on solving the correct procedure and understanding the concepts of mean
deviation (α = .39), and 1 PFL problem. Two transfer problems involved the use of the correct
procedure in which a correct response was coded as 1, and an incorrect response was coded as a
0. The other four transfer problems involved reasoning and were coded for the amount of detail
within their reasoning. Each of these conceptual problems included different types of reasoning.
One point was granted for a complete understanding of the concept and either a .67, .50, .33 for
partial understanding (dependent on how many ideas were needed to represent a complete
concept) or a 0. The PFL problem was scored as correct (1) or incorrect (0).
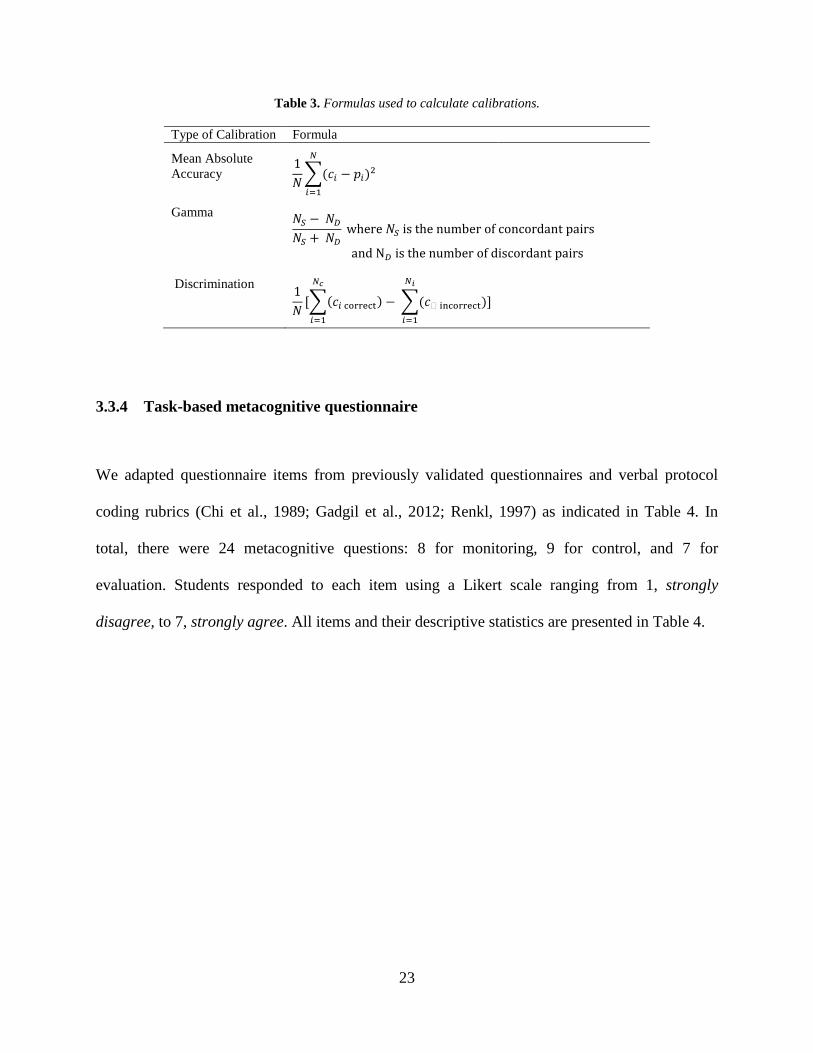
3.3.3.3 Calibration of JOKs
We also analyzed the JOKs (α = .86) using different calibrations. As mentioned in the
introduction, we calculated mean absolute accuracy, gamma, and discrimination (see Table 3 for
formulas and Schraw, 2009 for further details). When calculating the calibrations gamma could
not be computed for 9 participants (25% of the sample) since they responded with the same
confidence rating for all seven items. Therefore, we did not examine gamma in our analyses.
Absolute accuracy ranged from .06 to .57 with a lower score indicating better precision in their
judgments whereas discrimination in this study ranged from -3.75 to 4.5 with more positive
scores indicating that students were able to indicate when they knew something.
23
Table 3. Formulas used to calculate calibrations.
Type of Calibration Formula
Mean Absolute Accuracy
1𝑁𝑁�(𝑐𝑐𝑖𝑖 − 𝑝𝑝𝑖𝑖
𝑁𝑁
𝑖𝑖=1
)2
Gamma 𝑁𝑁𝑆𝑆 − 𝑁𝑁𝐷𝐷𝑁𝑁𝑆𝑆 + 𝑁𝑁𝐷𝐷
where 𝑁𝑁𝑆𝑆 is the number of concordant pairs
and N𝐷𝐷 is the number of discordant pairs
Discrimination 1𝑁𝑁
[�(𝑐𝑐𝑖𝑖 correct) − �(𝑐𝑐� incorrect)]𝑁𝑁𝑖𝑖
𝑖𝑖=1
𝑁𝑁𝑐𝑐
𝑖𝑖=1
3.3.4 Task-based metacognitive questionnaire
We adapted questionnaire items from previously validated questionnaires and verbal protocol
coding rubrics (Chi et al., 1989; Gadgil et al., 2012; Renkl, 1997) as indicated in Table 4. In
total, there were 24 metacognitive questions: 8 for monitoring, 9 for control, and 7 for
evaluation. Students responded to each item using a Likert scale ranging from 1, strongly
disagree, to 7, strongly agree. All items and their descriptive statistics are presented in Table 4.

24
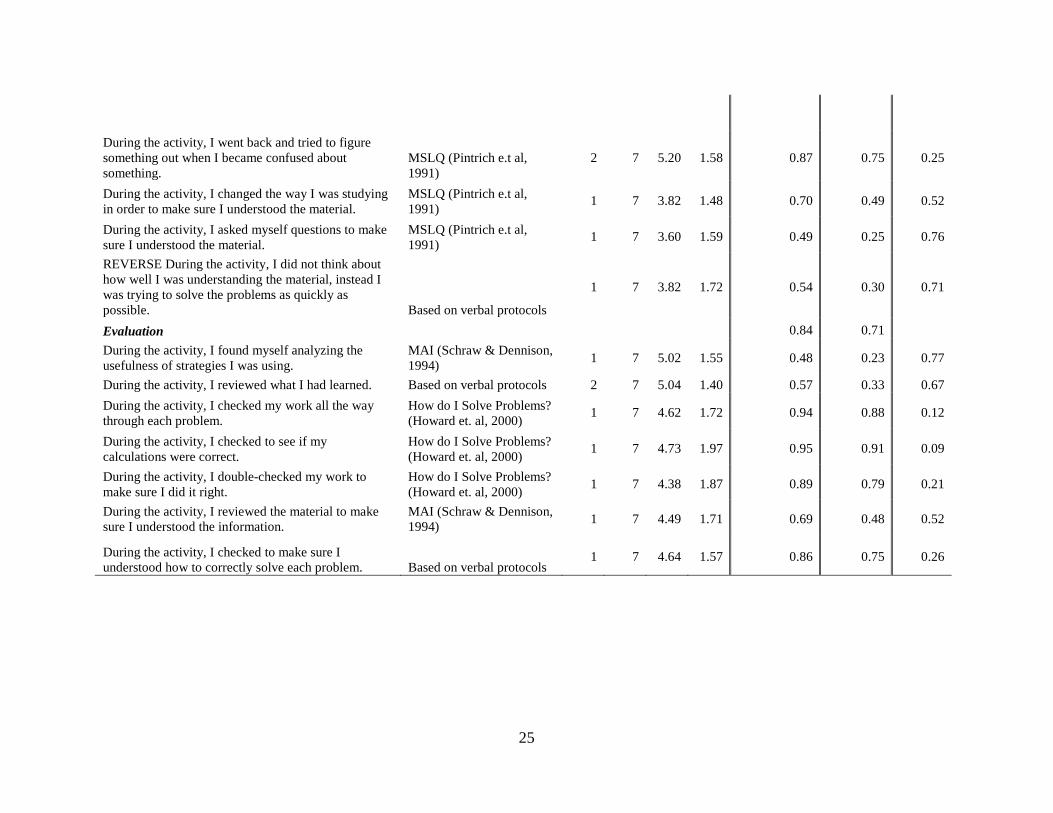
Table 4. Descriptive statistics and factor loading.
Item Original Construct Min Max M SD Standardized
Factor Residual Estimate
Variance
Monitoring 0.90 0.94
During the activity, I found myself pausing to regularly to check my comprehension.
MAI (Schraw & Dennison, 1994) 1 7 4.20 1.78 0.90 0.81 0.19
During the activity, I kept track of how much I understood the material, not just if I was getting the right answers.
MSLQ Adaptation (Wolters, 2004)
1 7 4.18 1.60 0.83 0.69 0.31
During the activity, I checked whether my understanding was sufficient to solve new problems. Based on verbal protocols 1 7 4.47 1.59 0.77 0.59 0.41
During the activity, I tried to determine which concepts I didn't understand well.
MSLQ (Pintrich e.t al, 1991) 1 7 4.44 1.65 0.85 0.73 0.27
During the activity, I felt that I was gradually gaining insight into the concepts and procedures of the problems. AILI (Meijer et al. 2013)
2 7 5.31 1.28 0.75 0.56 0.44
During the activity, I made sure I understood how to correctly solve the problems. Based on verbal protocols 1 7 4.71 1.46 0.90 0.80 0.20
During the activity, I tried to understand why the procedure I was using worked.
Strategies (Belenky & Nokes-Malach, 2012)
1 7 4.40 1.74 0.78 0.62 0.39
During the activity, I was concerned with how well I understood the procedure I was using.
Strategies (Belenky & Nokes-Malach, 2012) 1 7 4.38 1.81 0.74 0.55 0.45
Control/Debugging 0.81 0.66 During the activity, I reevaluated my assumptions when I got confused.
MAI (Schraw & Dennison, 1994) 2 7 5.09 1.58 0.94 0.89 0.11
During the activity, I stopped and went back over new information that was not clear.
MAI (Schraw & Dennison, 1994)
1 7 5.09 1.54 0.65 0.42 0.58
During the activity, I changed strategies when I failed to understand the problem.
MAI (Schraw & Dennison, 1994) 1 7 4.11 1.67 0.77 0.60 0.40
During the activity, I kept track of my progress and, if necessary, I changed my techniques or strategies.
SMI (O’Neil & Abeli, 1996) 1 7 4.51 1.52 0.89 0.79 0.21
During the activity, I corrected my errors when I realized I was solving problems incorrectly.
SMI (O’Neil & Abeli, 1996) 2 7 5.36 1.35 0.50 0.25 0.75
25
During the activity, I went back and tried to figure something out when I became confused about something.
MSLQ (Pintrich e.t al, 1991)
2 7 5.20 1.58 0.87 0.75 0.25
During the activity, I changed the way I was studying in order to make sure I understood the material.
MSLQ (Pintrich e.t al, 1991) 1 7 3.82 1.48 0.70 0.49 0.52
During the activity, I asked myself questions to make sure I understood the material.
MSLQ (Pintrich e.t al, 1991) 1 7 3.60 1.59 0.49 0.25 0.76
REVERSE During the activity, I did not think about how well I was understanding the material, instead I was trying to solve the problems as quickly as possible. Based on verbal protocols
1 7 3.82 1.72 0.54 0.30 0.71
Evaluation 0.84 0.71 During the activity, I found myself analyzing the usefulness of strategies I was using.
MAI (Schraw & Dennison, 1994) 1 7 5.02 1.55 0.48 0.23 0.77
During the activity, I reviewed what I had learned. Based on verbal protocols 2 7 5.04 1.40 0.57 0.33 0.67 During the activity, I checked my work all the way through each problem.
How do I Solve Problems? (Howard et. al, 2000) 1 7 4.62 1.72 0.94 0.88 0.12
During the activity, I checked to see if my calculations were correct.
How do I Solve Problems? (Howard et. al, 2000) 1 7 4.73 1.97 0.95 0.91 0.09
During the activity, I double-checked my work to make sure I did it right.
How do I Solve Problems? (Howard et. al, 2000) 1 7 4.38 1.87 0.89 0.79 0.21
During the activity, I reviewed the material to make sure I understood the information.
MAI (Schraw & Dennison, 1994) 1 7 4.49 1.71 0.69 0.48 0.52
During the activity, I checked to make sure I understood how to correctly solve each problem. Based on verbal protocols
1 7 4.64 1.57 0.86 0.75 0.26

26
3.3.5 Verbal protocol coding
All videos were transcribed and coded from the first learning activity on variability using prior
rubrics for monitoring, debugging, and evaluation (Chi et al., 1989; Gadgil et al., 2012; Renkl,
1997; see Table 5). Critically, we coded for the frequency of each metacognitive process as it
aligned well with how cognitive psychologists have measured it in the past. We hypothesized
that the first learning activity would have representative instances of metacognition since it was
an invention task. The second learning task also involved invention, but it came after direct
instruction. This order of materials might have led students to directly apply the knowledge they
learned in the instruction to the second activity, perhaps reducing the probability of observing
metacognitive statements.
27
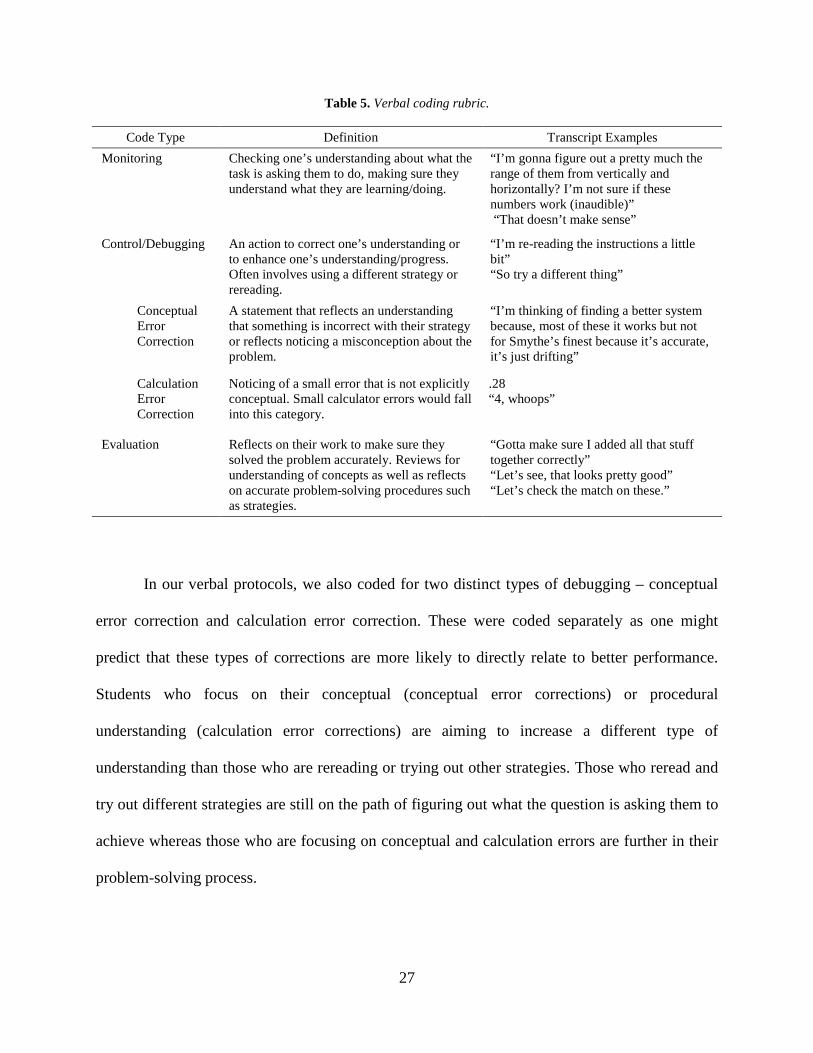
Table 5. Verbal coding rubric.
Code Type Definition Transcript Examples Monitoring Checking one’s understanding about what the
task is asking them to do, making sure they understand what they are learning/doing.
“I’m gonna figure out a pretty much the range of them from vertically and horizontally? I’m not sure if these numbers work (inaudible)” “That doesn’t make sense”
Control/Debugging An action to correct one’s understanding or to enhance one’s understanding/progress. Often involves using a different strategy or rereading.
“I’m re-reading the instructions a little bit” “So try a different thing”
Conceptual Error Correction
A statement that reflects an understanding that something is incorrect with their strategy or reflects noticing a misconception about the problem.
“I’m thinking of finding a better system because, most of these it works but not for Smythe’s finest because it’s accurate, it’s just drifting”
Calculation Error Correction
Noticing of a small error that is not explicitly conceptual. Small calculator errors would fall into this category.
.28 “4, whoops”
Evaluation Reflects on their work to make sure they solved the problem accurately. Reviews for understanding of concepts as well as reflects on accurate problem-solving procedures such as strategies.
“Gotta make sure I added all that stuff together correctly” “Let’s see, that looks pretty good” “Let’s check the match on these.”
In our verbal protocols, we also coded for two distinct types of debugging – conceptual
error correction and calculation error correction. These were coded separately as one might
predict that these types of corrections are more likely to directly relate to better performance.
Students who focus on their conceptual (conceptual error corrections) or procedural
understanding (calculation error corrections) are aiming to increase a different type of
understanding than those who are rereading or trying out other strategies. Those who reread and
try out different strategies are still on the path of figuring out what the question is asking them to
achieve whereas those who are focusing on conceptual and calculation errors are further in their
problem-solving process.

28
3.4 PROCEDURE
The study took approximately 120 minutes to complete. During the first fifteen minutes, students
completed a pretest (5 minutes per question) followed by think-aloud training (3 minutes). The
remaining time involved learning activity and posttest materials, followed by a debriefing.
Reference Figure 4 for the timing details.
At the beginning of the study, students were informed that they were going to be
videotaped during the experiment. After completing the pretest, the experimenter instructed
students to say their thoughts aloud. Then, the experimenter gave the students a sheet of paper
with three multiplication problems. If students struggled to think aloud while solving problems
(i.e., they did not say anything), the experimenter modeled how to think aloud. Once students
completed all three problems and the experimenter was satisfied that they understood how to
think aloud, the experimenter moved onto the learning activity. Students had 15 minutes to
complete the variability learning activity. After the variability activity, students watched a
consolidation video, and worked through a standard deviation activity. Then, they were asked to
complete the task-based questionnaire. Once the questionnaire was completed, the students
received 35 minutes to complete the posttest. Upon completion of the posttest, students
completed several questionnaires, a demographic survey, and then students were debriefed.
29
4.0 RESULTS
4.1 PRETEST
The pretest evaluated student familiarity of mean, mean deviation, and standard deviation.
Students had adequate procedural knowledge of solving for the mean (M = .95, SD = .21), but
had a more difficult time solving for mean deviation (M = .08, SD = .27), and standard deviation
(M = .21, SD = .40). For all analyses, we removed the participants who correctly solved the mean
and standard deviation problems. Therefore, the remaining participants had the opportunity to
learn the concepts and procedures of mean deviation and standard deviation.
4.2 STRUCTURAL VALIDITY AND RELIABILITY
In the first set of analyses, we evaluated whether the three conceptualized constructs of
metacognition (monitoring, debugging, evaluation) were distinguishable within the coding of the
verbal protocols and whether the task-based questionnaire had structural validity.
30
4.2.1 Task-based questionnaire
For the questionnaire, we evaluated a second-order model consisting of three correlated factors
(i.e., monitoring, control, and evaluation) and one superordinate factor (i.e., metacognition). The
resulting second-order model had an adequate goodness-of-fit, CFI = .96 TLI = .96, RMSEA =
.096, X2 (276) = 2862.30, p < .001 (Hu & Bentler, 1999). This finalized model also had a high
internal reliability for each of the factors: superordinate, α = .95, monitoring, α = .92, debugging,
α = .86 and evaluation, α = .87. For factor loadings and item descriptive statistics, see Table 4.
On average students reported a moderate use of monitoring (M = 4.51), debugging (M = 4.51),
and evaluation (M = 4.7).
4.2.2 Verbal protocols
The verbal protocols were transcribed into statements. Statement length was identified by clauses
and natural breaks in the protocol. Two coders independently coded 20% of the data and reached
an agreement as examined by an inter-coder reliability analysis (k > .7). The coders discussed
and resolved their discrepancies. Then they independently coded the rest of the transcripts. The
verbal protocol coding was based on prior rubrics and is represented with examples from the
transcripts in Table 5. Due to an experimental error, one participant was not recorded and,
therefore, was excluded from all analyses involving the verbal protocols. For each student, we
counted the number of statements generated for each coding category and divided this number by
their total number of statements. On average students generated 58.79 statements with much
variation (SD = 34.10). Students engaged in monitoring the most (M = 3.05 statements per
student) followed by evaluation (M = 2.71 statements per student). Students rarely employed

31
debugging, conceptual error correction, and calculation error correction (M = .23, .05, and .61,
respectively). Therefore, we combined these scores into one debugging verbal protocol code (M
= .88 statements per student).
We also examined the relations between the total number of statements generated (i.e.,
verbosity) and the number of statements for each type of metacognitive category (Table 6). The
amount students monitored, debugged, and evaluated their understanding was related to the total
number of utterances. The descriptive statistics are represented in Table 7.
Table 6. Associations between the number of utterances and the counts of each verbal protocol code
Monitoring Debugging Evaluation
Number of Utterances .59** .69** .72**
Table 7. Descriptive statistics for each measure
Measure Variable N Min Max M SE SD
Questionnaire Monitoring 45 1.13 6.75 4.51 0.19 1.29 Debugging 45 2.33 6.44 4.51 0.16 1.08 Evaluation 45 2.14 7.00 4.70 0.19 1.28
Verbal Protocols Monitoring 44 0.00 0.29 0.05 0.01 0.06 Debugging 44 0.00 0.06 0.01 0.002 0.02 Evaluation 44 0.00 0.16 0.04 0.01 0.04
JOK Mean 45 2.00 5.00 4.31 0.09 0.60 Mean Absolute Accuracy 45 0.06 0.57 0.22 0.02 0.13 Discrimination 45 -3.75 4.5 1.43 0.33 2.21
4.3 RELATION WITHIN AND ACROSS METACOGNITIVE MEASURES
Second, we examined the correlations within and across each of the metacognitive measures to
evaluate whether the different methodologies captured the same processes. Using Pearson

32
correlation analyses we found that there was a positive association between all of the
metacognitive questionnaire factors, but there was not an association within the verbal protocol
codes. For the JOKs, there was a negative association between mean absolute accuracy and
discrimination, meaning that the more accurate they were at judging their confidence (a score
closer to 0 for absolute accuracy), the more likely they were aware of their correct performance
(positive discrimination score). There was also a positive association between the average ratings
of the JOKs and discrimination, meaning those who were assigning higher values in their
confidence were also more aware of their correct performance.
Across measures an interesting pattern emerged. Monitoring statements were negatively
associated with the monitoring questionnaire and the average JOK ratings. However, there was
no relationship between the monitoring questionnaire and the average JOK ratings. Debugging
and evaluation questionnaires positively correlated with evaluation statements (see Table 8 for
all correlations and Figure 7 for a visual of the significant relations across measures). Otherwise,
there were no other associations.
Table 8. Correlations between the task-based questionnaire, verbal protocols, and metacognitive judgments
Variable 1 2 3 4 5 6 7 8 9
Qs
1. Monitoring - 0.73* 0.73* -0.36* 0.12 0.29 0.26 0.06 0.02 2. Debugging - 0.65* -0.1 -0.08 0.31* 0.02 -0.02 -0.033. Evaluation - -0.16 0.14 0.37* 0.15 0.11 -0.09
VPs
4. Monitoring - 0.1 0.01 -0.41* -0.07 -0.145. Debugging - 0.16 -0.16 0.03 -0.086. Evaluation - -0.1 0.02 0.01
JOK
7. Average - 0.14 0.39*8. Mean Absolute Accuracy - -0.76*9. Discrimination -
Note. Qs = Questionnaire, VPs = Verbal Protocols, * = p < .05

33
Figure 7. Associations among variables across measures.
4.4 RELATION BETWEEN METACOGNITIVE MEASURES AND LEARNING
4.4.1 Learning and test performance
The learning materials included the first and second learning activities, and a posttest that
included transfer items and a PFL item. For the first learning activity, the scores ranged from 0 to
3 with students receiving an average 1.6 points (SD = .72). On the second learning activity, the
scores ranged between 0 and 2 with the average score being 1.56 (SD = .59). Given the low
performance on solving this activity and the observation that most students were applying mean
deviation to the second activity, instead of inventing a new procedure, we did not analyze these
results. The transfer scores ranged from 1 to 5.67 with an average score of 3.86 points (SD =
1.26). We did not include the PFL in the transfer score, as we were particularly interested in
examining the relation between the metacognitive measures and PFL (M = 0.52, SD = 0.49). For
ease in interpretation, we converted student scores for all learning measures into the proportion
correct. See Table 9 for these proportions.
34
Table 9. Descriptive statistics for each learning measure
Measure N Min Max M SE SD First Learning Activity 45 0. 00 0.75 0.40 0.03 0.18 Transfer 45 0.17 0.94 0.64 0.03 0.21 PFL 45 0.00 1.00 0.49 0.08 0.51
To evaluate the relation between each metacognitive measure and the learning materials, we used
a series of regressions. We used multiple linear regressions to test the amount of variance
explained in the first learning activity and posttest performance by each measure. Then, to test
the amount of variance explained by each metacognitive measure in PFL performance, we used
multiple logistic regressions. All results are summarized in Figure 8. In addition to these models,
we also regressed the learning outcomes on the most predictive variables from each of the
measures and entered them into a competing model to evaluate whether and how much they
uniquely contribute to the overall variance.
4.4.2 Task-based questionnaire
For the task-based questionnaire we computed two types of models; one with all three
metacognitive skills and the other with each metacognitive skill entered separately. Entering all
three skills simultaneously led to no significant relations for the learning activity (F(3, 41) =
1.46, p = .24), transfer, (F(3, 41) = .15, p = .93, or PFL (χ2(1, N = 45) = 2.97, p = .40). However,
since the three factors were highly correlated we entered each factor into three separate models
(Kraha, Turner, Nimon, Zientek, & Henson, 2012).
35
Entering the skills into separate models revealed a marginal effect of self-reported
monitoring, β = .27, t = 1.87, p = .07, and self-reported evaluation, β = .29, t = 2.0, p = .05 on the
first learning activity. The model predicting performance on the first learning activity with self-
reported monitoring explained 7.5% of the variance as indexed by the adjusted R2 statistic, F(1,
43) = 3.50, p = .07, whereas the model predicting performance on the first learning activity with
self-reported evaluation explained 8.5% of the variance as indexed by the adjusted R2 statistic,
F(1, 43) = 4.01, p = .05. Otherwise there were no significant relations. Self-reported monitoring
and evaluation were not related to performance on transfer (F(1, 43) = 0.1, p = .75; F(1, 43) =
.02, p = .88) or PFL scores ( χ2(1, N = 45) = 0.01, p = .91; χ2(1, N = 45) = 1.29, p = .26),
respectively, and self-reported debugging had no relation to any of the learning outcomes
(learning activity: F(1, 43) = 1.52, p = .22), transfer: F(1, 43) = 0.07, p = .79, and PFL: χ2(1, N =
45) = .69, p = .41).
4.4.3 Verbal protocols
For verbal protocols we entered in each of the codes into the model. The model predicting
performance on the first learning activity explained 14.2% of the variance as indexed by the
adjusted R2 statistic, F(3, 40) = 2.21, p = .10. Within the model, there was only an effect of
monitoring, β = -.37, t = -2.51, p = .02, VIF = 1.00 (Table 10). The models predicting transfer
(F(3, 40) = .19, p = .90) and PFL scores (χ2(3, N = 44) = 5.05, p = .17) were not significant.

36
Table 10. Multiple linear regression model predicting performance on the first activity with verbal protocols
Variable β t p VIF Monitoring -0.37 -2.51 0.02 1.01Debugging -0.05 -0.32 0.75 1.03Evaluation -0.03 -0.17 0.87 1.02Constant 10.06 0
4.4.4 JOKs
The JOKs were separately entered into three separate models for each learning outcome since
they were highly correlated with each other.
4.4.4.1 Average ratings
The model predicting first activity explained 10.4% of the variance as indexed by the adjusted R2
statistic, F(1, 43) = 6.11, p < .05, in which there was an effect of average JOK ratings, β = .35, t
= 2.47, p < .05. The model predicting transfer explained 14.1% of the variance as indexed by the
adjusted R2 statistic, F(1, 43) = 7.07, p < .05, in which there was an effect of average JOK
ratings, β = .38, t = 2.66, p < .05. The logistic model predicting PFL scores explained 15.6% of
the variance as indexed by the adjusted Nagelkerke R2 statistic, χ2(1, N = 43) = 5.6, p < .05.
There was an effect of average JOK ratings, B = 4.17, Exp (B) = 64.71, Wald’s χ2 (1, N = 44) =
4.21, p < .05. Thus, higher average JOK ratings were associated with an increase in likelihood of
solving the PFL problem.
4.4.4.2 Mean absolute accuracy
The model predicting first activity explained 4.2% of the variance as indexed by the adjusted R2
statistic, F(1, 42) = 1.85, p =.18. The model predicting transfer explained 50.8% of the variance
37
as indexed by the adjusted R2 statistic, F(1, 42) = 43.42, p < .05, in which there was an effect of
mean absolute accuracy, β = -.71, t = -6.59, p < .05. The logistic model predicting PFL scores
explained 8.9% of the variance as indexed by the adjusted Nagelkerke R2 statistic, χ2(1, N = 43)
= 3.03, p = .08, in which there was a marginal effect of mean absolute accuracy, B = -4.26, Exp
(B) = .01, Wald’s χ2 (1, N = 44) = 2.74, p = .098. Thus, increasing mean absolute accuracy (i.e.,
worse accuracy) was associated with a reduction in likelihood of solving the PFL problem.
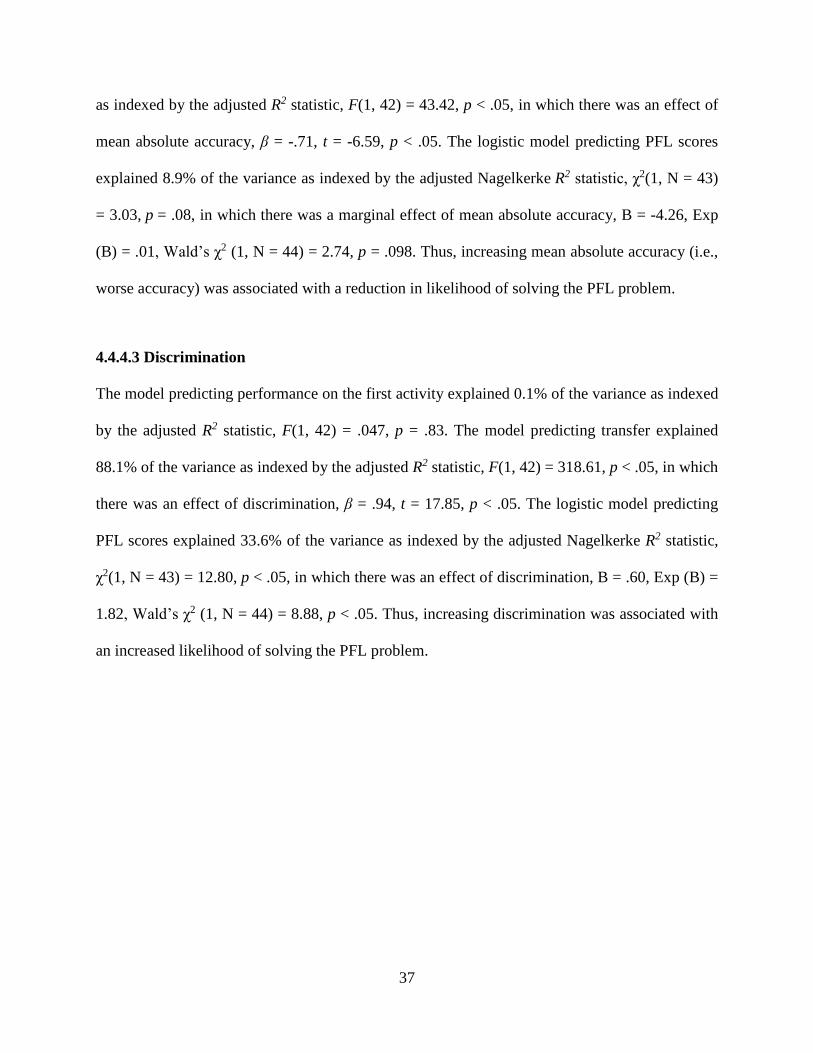
4.4.4.3 Discrimination
The model predicting performance on the first activity explained 0.1% of the variance as indexed
by the adjusted R2 statistic, F(1, 42) = .047, p = .83. The model predicting transfer explained
88.1% of the variance as indexed by the adjusted R2 statistic, F(1, 42) = 318.61, p < .05, in which
there was an effect of discrimination, β = .94, t = 17.85, p < .05. The logistic model predicting
PFL scores explained 33.6% of the variance as indexed by the adjusted Nagelkerke R2 statistic,
χ2(1, N = 43) = 12.80, p < .05, in which there was an effect of discrimination, B = .60, Exp (B) =
1.82, Wald’s χ2 (1, N = 44) = 8.88, p < .05. Thus, increasing discrimination was associated with
an increased likelihood of solving the PFL problem.
38
Figure 8. Summary figure of learning outcomes.
4.4.5 Competing models
We evaluated the competing models for the learning activity to determine whether constructs
from different measurements were predictive of differential variances within these learning
outcomes (Figure 9). The models predicting transfer and PFL were not computed, as only the
JOKs were predictive. For the model predicting the first learning activity, we regressed it on self-
reported evaluation, monitoring statements, and JOK average. The model explained 24.7% of the
variance as indexed by the adjusted R2 statistic, F(3, 40) = 4.367, p < .01. Within the model,
there was a marginal effect of self-reported evaluation, β = .24, t = 1.71, p = .095, VIF = 1.03.

39
Figure 9. Summary figure of competing models for learning outcomes.
40
5.0 DISCUSSION
From these results, we raise some important questions about the measures. Not only do the
measures show little relation to one another, but they also predict different learning outcomes.
However, in the competing model for the learning activity the different types of measures did not
result in a significant model suggesting that they captured some overlapping variance.
5.1 RELATION OF MEASURES
A central goal of this study was to examine to what degree these different measurements relate to
each other. The results demonstrated that there is little association between the task-based
metacognitive questionnaire and the corresponding verbal protocols, suggesting that these
methods have either poor/inaccurate measures of metacognition or they measure different types
of unrelated metacognitive phenomena. For example, self-reported monitoring was negatively
related to the monitoring statements. This finding suggests that the more students monitored their
understanding, the less likely they were to report doing so on a questionnaire. It also reflects a
disconnect between what students do versus what they think they do. This misalignment might
be particularly true for students struggling with the content who are making more monitoring
statements. It also implies that students are unaware of the amount they are struggling or, worse,
they are aware of it but when asked about it, they are biased to say the opposite, perhaps because

41
they do not want to appear incompetent. This speculation is also be related to the observational
finding that when students monitored their understanding, they were more likely to have negative
monitoring statements such as “I don’t understand this.” Therefore perhaps a more in-depth
analysis of the monitoring statements might provide more clarity on the relation between these
two measures. It could be that the self-reported monitoring is negatively aligned with negative
monitoring statements but not positive monitoring statements. A similar pattern might also be
true of the JOK average ratings and the monitoring statements as they were also negatively
associated with each other.
The frequency of evaluation statements was associated with self-reported debugging, and
evaluation, suggesting that the different self-reported constructs capture a similar aspect of
metacognitive behavior. This misalignment of associations between the questionnaire and verbal
protocols could also be attributed to students not being very accurate at knowing what they did
and did not do during a learning task. This was also evident in work by Veenman and colleagues
(2003) in which students’ self-reports had little relation to their actual behaviors. Instead,
students might be self-reporting the gist of their actions and not their specific behaviors which
are captured in the verbal protocols. It is also possible that there could have been more overlap
between the two measures if we coded the verbal protocols for the entire set of learning activities
that the students were self-reporting on. It is also unclear as to what students were referencing
when answering the self-reports. They could have been referencing their behaviors on the most
recent task (i.e., the standard deviation activity) in which we did not code for their metacognitive
verbalizations.
Contrary to our hypothesis, there are no positive associations between the monitoring of
the JOK calibrations and the monitoring statements or between the JOK calibrations and the self-

42
reported monitoring. As mentioned in our hypothesis, JOK calibrations capture the accuracy of
one’s monitoring, not just the act of monitoring or recounting their monitoring instances. One
interpretation of this finding is that being able to identify when one knows or does not know
something is different from gauging whether one is understanding information or self-reporting
on whether one was engaged in checking one’s understanding. Another interpretation is that the
monitoring accuracy might benefit from the additional learning experiences that took place after
the verbal protocols (i.e., the consolidation video) and after the questionnaire (i.e., the embedded
resource). These additional resources may provide a more comprehensive picture of the learner’s
understanding and might have allowed them to resolve some of their misunderstandings.
The learning activity might have also played a role in the relationship across the different
measures. As previously mentioned the structured inquiry task allows for more opportunities to
engage in metacognition. This opportunity might also allow for instances in which the
metacognitive skills are difficult to distinguish as they might co-occur or overlap with each
other. Perhaps if the learning activity were designed to elicit a specific metacognitive behavior,
different associations would emerge.
5.2 ROBUST LEARNING
In terms of the learning, we see that students’ self-reported use of monitoring and evaluation has
a marginal relation to their learning performance on the first activity, which provides some
external validity for those two components. However, there was not a relation between the self-
reports and the transfer or PFL performance. It could be that the monitoring and evaluation
components of the questionnaire were able to predict performance specific to the task with which
43
they were based on but not the application of the knowledge beyond the task. This finding
suggests that these questionnaire measures are limited in the types of learning outcomes they
predict. It is also important to note the differences between this work and past; here, the
questionnaire was task specific and involved a problem-solving activity whereas other work has
looked at more domain-general content and related the questionnaires to achievement. In general,
the majority of prior work examined dispositional metacognition or metacognition within a
specific domain in which they related metacognitive questionnaires to performance measures
(e.g., standardized tests or GPA); therefore, it is difficult to know whether the framing of the
questionnaire limits its predictability.
The low internal reliability of the transfer posttest could have also posed difficulties in
examining these analyses as students were responding very differently across the items. The lack
of internal reliability might be attributed to the combination of different types of transfer items
within the assessment that assess the varying degrees students can apply their knowledge. Future
work could employ an assessment with multiple items per concept and per transfer type (e.g.,
near versus intermediate) to determine the extent to which the reliability of the test items
impacted the results.
As predicted, there was an association between monitoring verbal protocols and the first
learning activity. The negative association, as well as the observation that the majority of the
metacognitive statements reflected a lack of understanding, aligns well with Renkl’s (1997)
findings in which negative monitoring was related to transfer outcomes. Although monitoring
was not a positive predictor, we used a different verbal protocol rubric that differs from those
who have found positive learning outcomes as we coded for the frequency of the metacognitive
statements and not the quality (e.g., Van der Stel & Veenman, 2010). Perhaps the differentiation

44
in the learning task also contributed to the finding that the verbal protocols were unrelated to the
transfer and PFL outcomes, which is in contrast to some prior research. Although there is no
prior work evaluating PFL, other work evaluating transfer would have suggested that we would
find some relation (e.g., Renkl, 1997). It would be productive for research to explore how
different verbal protocol rubrics relate to one another and whether the types of verbal protocols
elicited from different learning activities result in different relations to robust learning.
Students’ average JOK ratings, absolute accuracy (knowing when they knew something)
and discrimination (rating correct items with higher confidence than incorrect items), were
strong predictors of performance on transfer and PFL. This could be partially due to the time-
locked aspect of the JOKs as they were tied to the test whereas the verbal protocols and
questionnaires were tied to the learning materials. Regardless, these findings suggest that being
able to monitor one’s understanding is important for learning outcomes. Given the stronger
relationship between the JOK calibrations than that of the average JOK ratings and task-based
questionnaire it also indicates that these measures might capture different aspects of
metacognition. JOK calibrations might be assessing one’s accuracy at identifying their
understanding (i.e., monitoring accuracy) whereas the non-calibrated JOKs and the monitoring
questionnaire might be assessing one’s awareness of checking one’s understanding. However,
when comparing the average JOK ratings to the monitoring questionnaire on the first learning
activity, it appears that the JOKs are more predictive, implying that after a learning experience
and consolidation lecture students are more accurate at recognizing their understanding.
Although prior work has argued that JOKs are domain general (Schraw, 1996), we do not
find JOK calibrations to be predictive of the learning activity but the average JOK ratings were
predictive. That means that students who had higher ratings in their average JOKs performed

45
better on the learning activity, but it did not matter how accurate their JOKs were. However for
transfer and PFL measures, their accuracy in their monitoring did matter. This finding suggests
that students’ ability to monitor their understanding might transfer across different learning
measures, but their accuracy is more dependent on the actual learning measure. This assumption
is consistent with prior work on monitoring calibrations in which students’ monitoring accuracy
varied as a function of the item difficulty (Pulford & Colman, 1997).
When generating competing models across the metacognitive measures, we were only
able to examine one in which we predicted performance on the first activity with evaluation
questionnaire, monitoring statements, and JOK average. The model was not significant. This
suggests that they captured shared variances in their relation to learning, but that they are
distinctly different in that they were not associated to each other.
5.3 THEORY
One goal of this study was to explore the relation between different skills and at what level of
specificity to describe the constructs. We were able to establish a second-order factor in which
the different skills were distinguishable. We were also able to distinguish between the different
metacognitive skills in the verbal protocols with adequate inter-rater reliability between the two
coders and the differential relations the codes had with each other and the learning and robust
learning outcomes. The lack of correlation between the codes shows that they are not related to
each other and suggests that they are capturing different skills. This finding is further supported
when predicting learning outcomes the codes are related to different types of learning outcomes.
46
Future work should develop a metacognitive theory that incorporates these types of measures
into a cohesive framework.
5.4 FUTURE RESEARCH
This work examines a subset of metacognitive measures, but there are many more in the
literature that should be compared to evaluate the ways in which metacognitive regulation
functions. Given the nature of the monitoring examined in the measures presented in this paper,
it would be particularly interesting to examine how different metacognitive judgments such as
judgments of learning relate to the monitoring assessed by the verbal protocols and
questionnaire. Kelemen, Frost, and Weaver (2000) provide evidence that different metacognitive
judgments assess different processes so we might expect to find different associations. For
example, perhaps judgments of learning are more related to monitoring statements than JOKs.
Judgments of learning have a closer temporal proximity to the monitoring statements and target
same material as the verbal protocols. In contrast, JOKs occur at a delay and assess posttest
materials that are not identical to the material presented in the learning activity. Therefore due to
the timing of the measures and the material referenced we might see different relations emerge.
Future work could also explore the predictability the task-based questionnaire has over
other validated self-report measures such as a domain-based adoption of the MAI or MSLQ. It
would also be interesting to examine how these different measures relate to other external factors
as predicted by theories of self-regulated learning. These factors include examining the degree to
which the task-based questionnaire, JOKs, and verbal protocols relate to motivational aspects
such as achievement goal orientations as well as more cognitive sense-making processes such as
47
analogical comparison and self-explanation. Perhaps this type of research would provide more
support for some self-regulated learning theories over others given their hypothesized
relationships.
48
BIBLIOGRAPHY
Alexander, P. A. (2013). Calibration: What is it and why it matters? An introduction to the special issue on calibrating calibration. Learning and Instruction, 24, 1-3.
Aleven, V., Mclaren, B., Roll, I., & Koedinger, K. (2006). Toward meta-cognitive tutoring: A model of help-seeking with a cognitive tutor. International Journal of Artificial Intelligence in Education, 16, 101–130.
Alfieri, L., Brooks, P. J., Aldrich, N. J., & Tenenbaum, H. R. (2011). Does discovery-based instruction enhance learning?. Journal of Educational Psychology, 103(1), 1-18. doi: 10.1037/a0021017.
Azevedo, R., & Cromley, J. G. (2004). Does training on self-regulated learning facilitate students' learning with hypermedia?. Journal of Educational Psychology, 96(3), 523.
Barnett, S. M., & Ceci, S. J. (2002). When and where do we apply what we learn?: A taxonomy for far transfer. Psychological Bulletin, 128(4), 612–637. doi:10.1037//0033-2909.128.4.612
Bransford, J. D., & Schwartz, D. L. (1999). Rethinking transfer: A simple proposal with multiple implications. Review of Research in Education, 24, 61–100.
Berardi-coletta, B., Buyer, L. S., Dominowski, R. L., & Rellinger, E. R. (1995). Metacognition and problem solving: A process-oriented approach. Journal of Experimental Psychology: Learning, Memory, and Cognition, 21(1), 205–223.
Belenky, D. M., & Nokes-Malach, T. J. (2012). Motivation and Transfer: The Role of Mastery-Approach Goals in Preparation for Future Learning. Journal of the Learning Sciences, 21(3), 399–432. http://doi.org/10.1080/10508406.2011.651232
Brown, A. L. (1987). Metacognition, executive control, self-regulation, and other more mysterious mechanisms. In F. E. Weinert & R. H. Kluwe (Eds.), Metacognition, motivation, and understanding (pp. 65–116). Hillsdale, NJ: Lawrence Erlbaum Associates.
Brown, A. L., Bransford, J. D., Ferrara R. A., & Campione, J. C. (1983). Learning, remembering, and understanding. In J. H. Flavell, & E. M. Markman (Eds.), Handbook of child psychology: Vol. 3. Cognitive development (4th ed., pp. 77–166). New York: Wiley.
Chi, M. T., Bassok, M., Lewis, M. W., Reimann, P., & Glaser, R. (1989). Self‐ explanations: How students study and use examples in learning to solve problems. Cognitive science, 13(2), 145-182.
Cromley, J. G., & Azevedo, R. (2006). Self-report of reading comprehension strategies: What are we measuring?. Metacognition and Learning, 1(3), 229-247.
Dinsmore, D. L., & Parkinson, M. M. (2013). What are confidence judgments made of? Students' explanations for their confidence ratings and what that means for calibration. Learning and Instruction, 24, 4-14.
Dunlosky, J., & Metcalfe, J. (2009). Metacognition. Thousand Oaks, CA: Sage Publications, Inc.
49
Ericsson, K. A., & Simon, H. A. (1980). Verbal reports as data. Psychological Review, 87(3), 215.
Fan, X., Thompson, B., & Wang, L. (1999). Effects of sample size, estimation methods, and model specification on structural equation modeling fit indexes. Structural Equation Modeling: A Multidisciplinary Journal, 6(1), 56-83.
Flavell, J. H. (1979). Metacognition and cognitive monitoring: A new area of cognitive-developmental inquiry. American Psychologist, 34(10), 906–911.
Gadgil, S., Nokes-Malach, T. J., & Chi, M. T. H. (2012). Effectiveness of holistic mental model confrontation in driving conceptual change. Learning and Instruction, 22(1), 47–61. http://doi.org/10.1016/j.learninstruc.2011.06.002
Gerbing, D. W., & Anderson, J. C. (1987). Improper solutions in the analysis of covariance structures: Their interpretability and a comparison of alternate respecifications. Psychometrika, 52,99-111.
Glaser, R., Schauble, L., Raghavan, K., & Zeitz, C. (1992). Scientific reasoning across different domains. In E. de Corte, M. C. Linn, H. Mandl, & L. Verschaffel (Eds.), Computer-based learning environments and problem solving NATO ASI series F, vol. 84. (pp. 345−371) Heidelberg: Springer Verlag.
Howard, B. C., Mcgee, S., Shia, R., & Hong, N. S. (2000). Metacognitive self-regulation and problem-solving: Expanding the theory base through factor analysis. Paper presented at the Annual Meeting of the American Educational Research Association, New Orleans, LA.
Howard-Rose, D., & Winne, P. H. (1993). Measuring component and sets of cognitive processes in self-regulated learning. Journal of Educational Psychology, 85(4), 591.
Howie, P., & Roebers, C. M. (2007). Developmental progression in the confidence-accuracy relationship in event recall: insights provided by a calibration perspective. Applied Cognitive Psychology, 21(7), 871-893. doi:10.1002/acp.1302
Hu, L. T., & Bentler, P. M. (1999). Cutoff criteria for fit indexes in covariance structure analysis: Conventional criteria versus new alternatives. Structural Equation Modeling: A Multidisciplinary Journal, 6(1), 1-55.
Jacobs, J. E., & Paris, S. G. (1987). Children's metacognition about reading: Issues in definition, measurement, and instruction. Educational Psychologist, 22(3-4), 255-278.
Kapur, M. (2008). Productive failure. Cognition and Instruction, 26(3), 379–424. doi:10.1080/07370000802212669
Kapur, M. (2009). Productive failure in mathematical problem solving. Instructional Science, 38(6), 523–550. doi:10.1007/s11251-009-9093-x
Kapur, M. (2012). Productive failure in learning the concept of variance. Instructional Science, 40(4), 651–672. doi:10.1007/s11251-012-9209-6
Kapur, M., & Bielaczyc, K. (2012). Designing for productive failure. Journal of the Learning Sciences, 21(1), 45–83. doi:10.1080/10508406.2011.591717
Kelemen, W. L., Frost, P. J., & Weaver, C. a. (2000). Individual differences in metacognition: evidence against a general metacognitive ability. Memory & Cognition, 28(1), 92–107.
Koedinger, K. R., Corbett, A. T., & Perfetti, C. (2012). The knowledge-learning-instruction framework: bridging the science-practice chasm to enhance robust student learning. Cognitive Science, 36(5), 757–98. http://doi.org/10.1111/j.1551-6709.2012.01245.x
Kraha, A., Turner, H., Nimon, K., Zientek, L. R., & Henson, R. K. (2012). Tools to support interpreting multiple regression in the face of multicollinearity. Frontiers in Psychology, 3. doi:10.3389/fpsyg.2012.00044

50
Lin, X., & Lehman, J. D. (1999). Supporting learning of variable control in a computer-based biology environment: Effects of prompting college students to reflect on their own thinking. Journal of Research in Science Teaching, 36(7), 837–858. http://doi.org/10.1002/(SICI)1098-2736(199909)36:7<837::AID-TEA6>3.0.CO;2-U
Meijer, J., Sleegers, P., Elshout-Mohr, M., Daalen-Kapteijns, M. V., Meeus, W., & Tempelaar, D. (2013). The development of a questionnaire on metacognition for students in higher education. Educational Research, 55(1), 31-52.
Meijer, J., Veenman, M. V. J., & Van Hout-Wolters, B. H. A. M. (2006). Metacognitive activities in text studying and problem solving: Development of a taxonomy. Educational Research and Evaluation, 12, 209–237.
Meijer, J., Veenman, M. V. J., & Van Hout-Wolters, B. H. A. M. (2012) Multi-domain, multi-method measures of metacognitive activity: what is all the fuss about metacognition … indeed?, Research Papers in Education, 27(5), 597-627.
Messick, S. (1989). Validity. In R. L. Linn (Ed.), Educational Measurement (3rd ed., pp. 13-103). New York: Macmillan.
Mokhtari, K., & Reichard, C. A. (2002). Assessing students' metacognitive awareness of reading strategies. Journal of Educational Psychology, 94(2), 249-259.
Muis, K. R., Winne, P. H., & Jamieson-Noel, D. (2007). Using a multitrait-multimethod analysis to examine conceptual similarities of three self-regulated learning inventories. The British Journal of Educational Psychology, 77, 177–195. http://doi.org/10.1348/000709905X90876
Nelson, T. (1996). Gamma is a measure of the accuracy of predicting performance on one item relative to another item, not the absolute performance on an individual item Comments on Schraw. Applied Cognitive Psychology, 10, 257–260.
Nelson, T., & Narens, L. (1990). Metamemory: a theoretical framework and new findings. The Psychology of Learning and Motivation, 26, 125–173.
Nokes-Malach, T. J., VanLehn, K., Belenky, D., Lichtenstein, M., & Cox, G. (2013). Coordinating principles and examples through analogy and self-explanation. European Journal of Education of Psychology, 28(4), 1237-1263.
Nietfeld, J. L., Cao, L., & Osborne, J. W. (2005). Metacognitive monitoring accuracy and student performance in the postsecondary classroom. The Journal of Experimental Education, 74(1), 7–28.
Nietfeld, J. L., Cao, L., & Osborne, J. W. (2006). The effect of distributed monitoring exercises and feedback on performance, monitoring accuracy, and self-efficacy. Metacognition and Learning, 1(2), 159–179.
O’Neil, H. F., Jr., & Abedi, J. (1996). Reliability and validity of a state metacognitive inventory: Potential for alternative assessment. Journal of Educational Research, 89(4), 234–245.
Pereira‐ Laird, J. A., & Deane, F. P. (1997). Development and validation of a self-report measure of reading use. Reading Psychology: An International Quarterly, 18(3), 185-235.
Pintrich, P. R. (2000). The role of goal orientation in self-regulated learning. In M. Boekaerts, P. R. Pintrich, & M. Zeidner (Eds.), Handbook of Self-Regulation (pp. 451–502). San Diego, CA: Academic.
Pintrich, P. R., & De Groot, E. V. (1990). Motivational and self-regulated learning components of classroom academic performance. Journal of Educational Psychology, 82(1), 33-40.
Pintrich, P. R., Smith, D., Garcia, T., and McKeachie, W. (1991). A Manual for the Use of the Motivated Strategies for Learning Questionnaire (MSLQ), The University of Michigan, Ann Arbor, MI.
51
Pintrich, P. R., Smith, D., Garcia, T., and McKeachie, W. (1993). Predictive validity and reliability of the Motivated Strategies for Learning Questionnaire (MSLQ). Educational and Psychological Measurement, 53(3), 801–813.
Pintrich, P. R., Wolters, C., and Baxter, G. (2000). Assessing metacognition and self-regulated learning. In Schraw, G., and Impara, J. (eds.), Issues in the Measurement of Metacognition, Buros Institute of Mental Measurements, Lincoln, NE.
Pressley, M., & Afflerbach, P. P. (1995). Verbal protocols of reading: The nature of constructively responsive reading. Routledge.
Pulford, B. D., & Colman, A. M. (1997). Overconfidence: Feedback and item difficulty effects. Personality and Individual Differences, 23, 125-133. Renkl, A. (1997). Learning from worked-out examples: A study on individual differences. Cognitive Science, 21, 1–29.
Richey, J. E., & Nokes-Malach, T. J. (2015). Comparing four instructional techniques for promoting robust learning. Educational Psychology Review, 27, 181-218.
Richey, J.E., Zepeda, C. D., & Nokes-Malach, T. J. (2015, accepted). Effects of prompted and self reported analogical comparison and self-explanation on learning. Paper submitted to the Thirty-Seventh Annual Conference of the Cognitive Science Society, Pasadena, CA.
Roll, I., Aleven, V., & Koedinger, K. R. (2009). Helping students know “further” – increasing the flexibility of students ’ knowledge using symbolic invention tasks. In N. A. Taatgen & H. Van Rijn (Eds.), Proceedings of the 33rd Annual Conference of the Cognitive Science Society (pp. 1169–1174). Austin: Cognitive Science Society.
Schellings, G., & Van Hout-Wolters, B. (2011). Measuring strategy use with self-report instruments: theoretical and empirical considerations. Metacognition and Learning, 6(2), 83-90.
Schellings, G. L., Van Hout-Wolters, B. H., Veenman, M. V., & Meijer, J. (2013). Assessing metacognitive activities: the in-depth comparison of a task-specific questionnaire with think-aloud protocols. European Journal of Psychology of Education, 28(3), 963-990.
Schraw, G. (1994). The effect of metacognitive knowledge on local and global monitoring. Contemporary Educational Psychology, 19(2), 143-154.
Schraw, G. (2009). A conceptual analysis of five measures of metacognitive monitoring. Metacognition and Learning, 4(1), 33–45. http://doi.org/10.1007/s11409-008-9031-3
Schraw, G., & Dennison, R. S. (1994). Assessing metacognitive awareness. Contemporary Educational Psychology, 19, 460–475.
Schraw, G., & Moshman, D. (1995). Metacognitive theories. Educational Psychology Review, 7(4), 351-371.
Schraw, G., Dunkle, M. E., Bendixen, L. D., & Roedel, T. D. (1995). Does a general monitoring skill exist? Journal of Educational Psychology, 87, 433−444.
Schraw, G., Kuch, F., & Gutierrez, A. P. (2013). Measure for measure: Calibrating ten commonly used calibration scores. Learning and Instruction, 24, 48–57. http://doi.org/10.1016/j.learninstruc.2012.08.007
Schwartz, D. L., & Bransford, J. D. (1998). A time for telling. Cognition and Instruction, 16(4), 475–522.
Schwartz, D. L, Bransford, J. D., & Sears, D. (2005). Efficiency and innovation in transfer. In J. Mestre (Ed.), Transfer of learning from a modern multidisciplinary perspective (pp. 1–51). Greenwich, CT: Information Age Publishers.
52
Schwartz, D. L., & Martin, T. (2004). Inventing to prepare for future learning: The hidden efficiency of encouraging original student production in statistics instruction. Cognition and Instruction, 22(2), 129–184.
Slotta, J. D., & Chi, M. T. H. (2006). Helping students understand challenging topics in science through ontology training. Cognition and Instruction, 24(2), 261–289. doi:10.1207/s1532690xci2402_3
Sperling, R. a, Howard, B. C., Miller, L. A., & Murphy, C. (2002). Measures of children’s knowledge and regulation of cognition. Contemporary Educational Psychology, 27(1), 51–79. http://doi.org/10.1006/ceps.2001.1091
Sperling, R. A., Howard, B. C., Staley, R., & DuBois, N. (2004). Metacognition and self-regulated learning constructs. Educational Research and Evaluation, 10(2), 117–139.
Taylor, J. L., Smith, K. M., Stolk, A. P. Van, & Spiegelman, G. B. (2010). Using invention to change how students tackle problems. CBE—Life Sciences Education, 9, 504–512. doi:10.1187/cbe.10
VanLehn, K., Siler, S., Murray, C., Yamauchi, T., & Baggett, W. B. (2003). Why do only some events cause learning during human tutoring? Cognition and Instruction, 21(3), 209–249. doi:10.1207/S1532690XCI2103_01
Van der Stel, M., & Veenman, M. V. (2010). Development of metacognitive skillfulness: A longitudinal study. Learning and Individual Differences, 20(3), 220-224.
Van der Stel, M., & Veenman, M. V. (2014). Metacognitive skills and intellectual ability of young adolescents: A longitudinal study from a developmental perspective. European Journal of Psychology of Education, 29(1), 117-137.
Van Hout-Wolters, B. H. A. M. (2009). Leerstrategieën meten. Soorten meetmethoden en hun bruikbaarheid in onderwijs en onderzoek. [Measuring learning strategies. Different kinds of assessment methods and their usefulness in education and research]. Pedagogische Studiën, 86, 103–110.
Veenman, M. V. J. (2005). The assessment of metacognitive skills: What can be learned from multi- method designs? In C. Artelt, & B. Moschner (Eds), Lernstrategien und Metakognition: Implikationen für Forschung und Praxis (pp. 75–97). Berlin: Waxmann.
Veenman, M. V. J., Elshout, J. J., & Meijer, J. (1997). The generality vs. domain-specifity of metacognitive skills in novice learning across domains. Learning and Instruction, 7, 187−209.
Veenman, M. V., Prins, F. J., & Verheij, J. (2003). Learning styles: Self‐ reports versus thinking‐ aloud measures. British Journal of Educational Psychology, 73(3), 357-372.
Veenman, M. V., Van Hout-Wolters, B. H., & Afflerbach, P. (2006). Metacognition and learning: Conceptual and methodological considerations. Metacognition and Learning, 1(1), 3-14.
Veenman, M. V., Wilhelm, P., & Beishuizen, J. J. (2004). The relation between intellectual and metacognitive skills from a developmental perspective. Learning and Instruction, 14(1), 89-109.
Winne, P. H., Jamieson-Noel, D., & Muis, K. (2002). Methodological issues and advances in researching tactics, strategies, and self-regulated learning. In P.R. Pintrich & M. L. Maehr (Eds.), Advances in motivation and achievement: New directions in measures and methods (Vol. 12, pp. 121-155). Greenwich, CT: JAI Press.

53
Yore, L. D., Craig, M. T., & Maguire, T. O. (1998). Index of science reading awareness: An interactive‐ constructive model, test verification, and grades 4–8 results. Journal of Research in Science Teaching, 35(1), 27-51.
Zimmerman, B. J. (2001). Theories of self-regulated learning and academic achievement: An overview and analysis. In B. Zimmerman & D. Schunk (Eds.), Self-regulated learning and academic achievement: Theoretical perspectives (pp. 1–37). Mahwah, NJ: Erlbaum.
Zepeda, C. D., Richey, J. E., Ronevich, P., & Nokes-malach, T. J. (n.d.). Direct Instruction of Metacognition Benefits Adolescent Science Learning, Transfer, and Motivation: An In Vivo Study. Journal of Educational Psychology. http://doi.org/http://dx.doi.org/10.1037/edu0000022