Embed Size (px)
Citation preview
An investigation of the “Orange Peel” Phenomenon
A thesis submitted to Cardiff University
for the degree o f Doctor of Philosophy by
Wan Ahmad Yusmawiza Wan Yusoff
Manufacturing Engineering Centre
Cardiff University
April 2007
UMI Number: U584935
All rights reserved
INFORMATION TO ALL USERS The quality of this reproduction is dependent upon the quality of the copy submitted.
In the unlikely event that the author did not send a complete manuscript and there are missing pages, these will be noted. Also, if material had to be removed,
a note will indicate the deletion.
Dissertation Publishing
UMI U584935Published by ProQuest LLC 2013. Copyright in the Dissertation held by the Author.
Microform Edition © ProQuest LLC.All rights reserved. This work is protected against
unauthorized copying under Title 17, United States Code.
ProQuest LLC 789 East Eisenhower Parkway
P.O. Box 1346 Ann Arbor, Ml 48106-1346
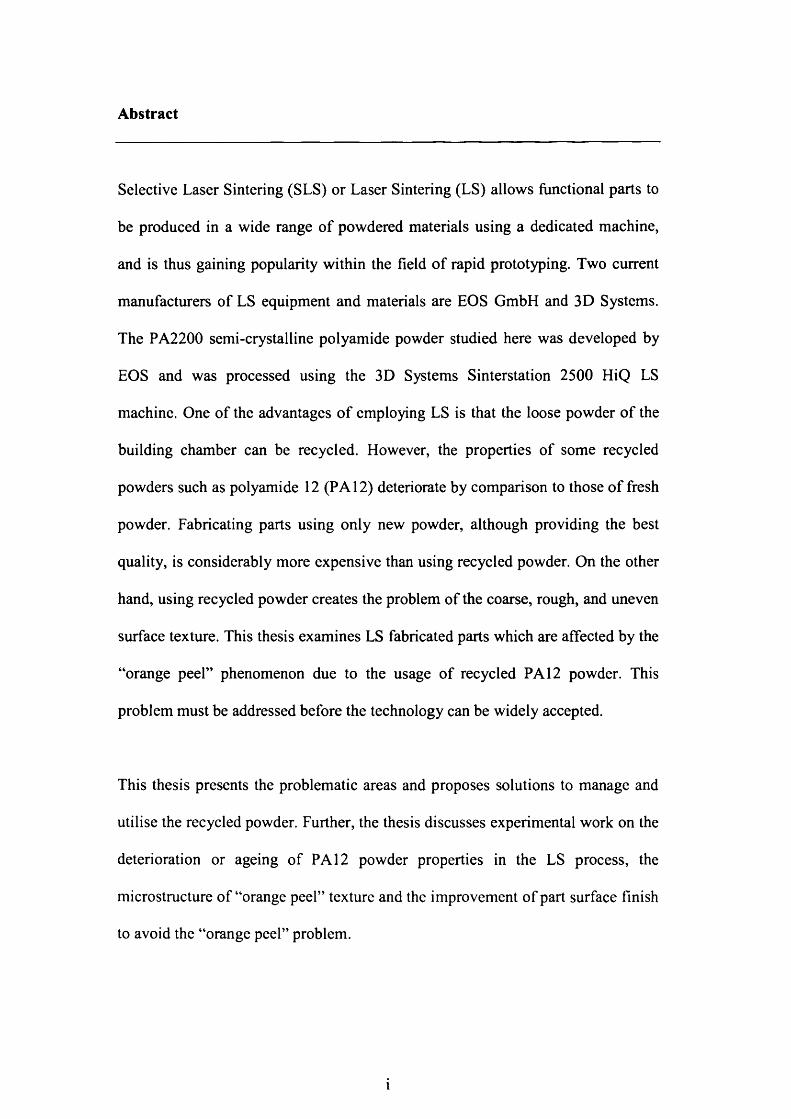
Abstract
Selective Laser Sintering (SLS) or Laser Sintering (LS) allows functional parts to
be produced in a wide range of powdered materials using a dedicated machine,
and is thus gaining popularity within the field of rapid prototyping. Two current
manufacturers of LS equipment and materials are EOS GmbH and 3D Systems.
The PA2200 semi-crystalline polyamide powder studied here was developed by
EOS and was processed using the 3D Systems Sinterstation 2500 HiQ LS
machine. One of the advantages of employing LS is that the loose powder of the
building chamber can be recycled. However, the properties of some recycled
powders such as polyamide 12 (PA 12) deteriorate by comparison to those of fresh
powder. Fabricating parts using only new powder, although providing the best
quality, is considerably more expensive than using recycled powder. On the other
hand, using recycled powder creates the problem of the coarse, rough, and uneven
surface texture. This thesis examines LS fabricated parts which are affected by the
“orange peel” phenomenon due to the usage of recycled PA 12 powder. This
problem must be addressed before the technology can be widely accepted.
This thesis presents the problematic areas and proposes solutions to manage and
utilise the recycled powder. Further, the thesis discusses experimental work on the
deterioration or ageing of PA 12 powder properties in the LS process, the
microstructure of “orange peel” texture and the improvement of part surface finish
to avoid the “orange peel” problem.
Acknowledgements
I would like to thank Allah s.w.t for granting me His strength through the writing
of this thesis. I am also grateful to my wife, Nurakidah and my family for their
patience, support, and encouragement throughout the year it took to complete my
thesis.
This research was partially supported by EPSRC by under grant no:
GR/S75505/01. I wish to thank Professor D T Pham (OBE), Director of
Manufacturing Engineering Centre (MEC), Cardiff University, for his unwavering
support of this research. Without the constant encouragement of project manager
Dr.K Dotchev I could not possibly have finished the thesis on schedule. In
addition, I would like to acknowledge the valuable support from Justin and
Richard of Cardiff Rapid Prototyping Centre.
The acknowledgement would not be complete without recognising the support of
the following persons, for supplying information for this research:
1. Dr. Steve Holding and Dr.Martin Ridesof RAPRA, UK.
2. Dr. Rod Bottom of Mettler Toledo, UK
3. Dr.Peter Fisher of Department of Earth Science, Cardiff University, UK
4. Dr. Arrate and Dr.Castella of Teckniker, Spain
DECLARATION
This work has not previously been accepted in substance for any degree and is not
concurrentl^f^ng submitted in candidature for any other degree.
Signed:. . . ................(Wan Ahmad Yusmawiza) Date :..?.?.
STATEMENT 1
This thesis is being submitted in partial fulfilment of the requirements for the
degree ofjgj
Signed:.. (Wan Ahmad Yusmawiza) Date ^
STATEMENT 2
This thesis is the result of my own independent work/investigation, except where
o therw isestatg i^ ther sources are acknowledged by explicit references.
Signed:. . (Wan Ahmad Yusmawiza) Date :.. P.
STATEMENT 3
I hereby give consent for my thesis, if accepted, to be available for photocopying
and for inter-library loan and for the title and summary to be available to outside
organisations,
Signed:.................. (Wan Ahmad Yusmawiza) Date
Contents
Abstract i
Acknowledgements ii
Declaration iii
Contents iv
List of figures xi
List of tables xvi
List of symbols xviii
List of abbreviations xix
CHAPTER 1:
INTRODUCTION
1.1 Background 1
1.2 Aim and objectives 2
1.3 Outline of the thesis 2
CHAPTER 2:
THE TECHNOLOGY AND APPLICATIONS OF LASER SINTERING
2.1 Preliminaries 4
2.2 Selective laser sintering systems 7
2.2.1 Sinterstations 2500 HiQ 13
2.2.2 EOSINT P700 14
2.3 Laser sintering process parameters 15
2.3.1 Laser power 16
iv
2.3.2 Laser scan speed 16
2.3.3 Scan spacing 17
2.3.4 Part bed temperature 17
2.3.5 Scanning strategy 17
2.3.6 The influence of energy density on the laser sintering
fabricated part 18
2.4 Powder materials used in laser sintering and their applications 19
2.4.7.1 Polyamide PA2200 19
2.4.7.2 Glass-filled Polyamide 3200 20
2.4.7.3 Aluminium-filled Polyamide 21
2.4.7.4 Composites /Cooper Polyamide 21
2.4.7.5 Carbon Fibre-filled Polyamide 22
2.4.7.6 Polystyrene 22
2.4.7.7 Alloy mixtures 22
2.4.7.8 Steel 23
2.4.7.9 Green sand 24
2.5 The laser sintering process and material deterioration 25
2.6 Discussion 30
2.7 Summary 31
v
CHAPTER 3:
EXPLANATIONS OF THE “ORANGE PEEL” PHENOMENON IN THE
LASER SINTERING PROCESS
3.1 Preliminaries 32
3.2 Previous studies of the “Orange Peel” phenomenon in the laser sintering
process 33
3.3 The “orange peel” texture study 37
3.4 The significant of molecular weight distribution to the
melting viscosity in laser sintering process 39
3.5 Experimental results and discussion 42
3.5.1 Methodology and equipment used 42
3.5.1.1 Scanning Electron Microscope examinations 43
3.5.2 Design and fabrication of bench part 44
3.5.3 The study of the PA2200 powder sizes 46
3.5.4 The microstructure of external surface and cross sectional
of benchmark parts 47
3.5.5 The relationship between molecular weight distributions
and melt flow rate 53
3.5.6 The effects of polydispersity on melt flow rate 54
3.5.7 The relationship between heat of fusion
and recycled powder 55
3.5.8 Qualitative process model for the “orange peel”
phenomenon 56
3.6 Discussion 58
3.7 Summary 59
CHAPTER 4:
DETERIORATION OF POLYAMIDE 12 POWDER PROPERTIES IN
THE LASER SINTERING PROCESS
4.1 Preliminaries 60
4.2 The polyamide 12 powder properties’ deterioration during the
laser sintering process 61
4.3 Experimental results and discussion 67
4.3.1 Methodology and equipment used 67
4.3.1.1 Melt Flow Rate Indexer 67
4.3.1.2 Differential Scanning Calorimetry 69
4.3.1.3 Gel Permeation Chromatography 71
4.3.2 Thermal properties of new and recycled polyamide 12
powders 72
4.3.3 The relationship between the molecular weight and the
melt flow rate 77
4.3.4 The effect of the laser sintering time and temperature on the
glass transition temperature and melting temperature 80
4.3.5 The effect of the laser sintering time and temperature on the
melt flow rate 82
4.3.6 The effect of the number of builds on the melt flow rate 85
4.4 Discussion 87
4.5 Summary 89
CHAPTER 5:
IMPROVEMENT OF THE PART SURFACE FINISHING IN LASER
SINTERING BY EXPERIMENTAL DESIGN OPTIMISATION
5.1 Preliminaries 90
5.2 Fabrication of a part using laser sintering 90
5.3 The influences of the powder quality on the fabricated part quality 92
5.4 Experimental results and discussion 93
5.4.1 Methodology and equipment used 93
5.4.1.1 Design experimental approach to reduce/eliminate
the “Orange Peel” texture 94
5.4.1.2 Designing the benchmark part 95
5.4.1 3 Selection of the response variable 95
5.4.1.4 The score system 95
5.4.1.5 Screening test 97
5.4.2 Results and Analysis of Design of Experiment 103
5.5 Discussion 114
5.6 Summary 115
CHAPTER 6:
IMPROVEMENT OF POWDER MANAGEMENT AND RECYCLING IN
LASER SINTERING
6.1 Preliminaries 116
6.2 Powder utilisation 117
6.3 Current powder management practice and its limitations 118
6.4 Powder recycling method 121
6.5 Experimental results and discussion 123
6.5.1 Methodology and equipment used 123
6.5.1.1 Variation of polyamide 12 powder properties
in the laser sintering process 123
6.5.1.2 Powder collection and categorisation 129
6.5.1.3 Variation of the new and once-used polyamide 12
powder properties 131
6.5.2 “Orange peel” texture and optimal polyamide 12 powder
quality 132
6.5.3 Optimal refresh rates 133
6.5.4 Case study 139
6.6 Discussion 141
6.7 Summary 143
CHAPTER 7:
CONCLUSION AND FURTHER WORK
7.1 Contributions 144
7.2 Conclusions 145
7.3 Future work 149
Appendix 1: Polymers and polyamides 151
Appendix 2: Publications 161
References 163
L IST OF FIGURES
CHAPTER 2
Figure 2.1: Rapid prototyping unit sales worldwide
Figure 2.2: The use of rapid prototyping systems in different
6
applications
Figure 2.3: The major components parts of laser sintering machine
6
Sinterstation 2500 HiQ 10
Figure 2.4: Powder management Sinterstation 2500 HiQ (3D Systems)
Figure 2.5: Integrated powder management system and the
13
EOSINT P700 laser sintering machine (EOS GmbH) 15
Figure 2.6: The laser beam movement in the laser sintering process 17
Figure 2.7: Laser scanning strategies 18
Figure 2.8: Sinterstation 2500 HiQ laser sintering machine 29
Figure 2.9: EOSINT P700 laser sintering machine
Figure 2.10: Heat transfer in the build cylinder during laser sintering
30
process
CHAPTER 3
28
Figure 3.1a: “Orange peel” texture 37
Figure 3.1b: Good part surface 37
Figure 3.2a “Orange peel” sintered layers 37
Figure 3.2b: Good surface sintered layers 37
Figure 3.3: Test part with surfaces at the different angles 39
Figure 3.4: Molecular weight distributions of polymers 40
Figure 3.5a: Narrow molecular weight distribution 41
Figure 3.5b: Broad molecular weight distribution 41
Figure 3.6a: Benchmark part (top view) 44
Figure 3.6b: Benchmark part (bottom view) 44
Figure 3.7a: Refresh PA2200 powder 46
Figure 3.7b: Twice recycled PA2200 powder 46
Figure 3.8a: Smooth surface 47
Figure 3.8b: Uneven and rough surface 47
Figure 3.9a: Small voids 47
Figure 3.9b: Bigger voids sizes 47
Figure 3.10a: Dense microstructure 48
Figure 3.10b: Inhomogeneous structure 48
Figure 3.11: Microstructure cross-sectional of the “orange peel” part 49
Figure 3.12: Particle core of “orange peel” microstructure 50
Figure 3.13: Microstructure cross-sectional of the good part 51
Figure 3.14: Particle core of good part microstructure 52
Figure 3.15: Molecular weight distributions of different
PA2200 quality grades 53
Figure 3.16: Polydispersity of different melt flow rate 54
Figure 3.17: The melting heat of different powder usage 55
Figure 3.18: Qualitative processes model for the “orange peel”
phenomenon 56
xii

CHAPTER 4
Figure 4.1: Polyamide 12 molecules chains structure 61
Figure 4.2: The molecular structure of a semi-crystalline polymer 62
Figure 4.3: The rate of crystallisation and the temperature 63
Figure 4.4: Morphology changes “New Polyamide 12” and “Recycled
polyamide 12” in time 66
Figure 4.5: Spherulite growths in “New Polyamide 12” and “Recycled
polyamide 12” powder in time 66
Figure 4.6: The cross sectional view of melt flow rate indexer
measurement 69
Figure 4.7: Differential scanning calorimetry sample testing the
Cross-sectional view of melt flow rate indexer measurement 70
Figure 4.8: Differential scanning calorimetry plot of “New PA 2200”
powder 72
Figure 4.9: Glass transition temperatures vs. melt flow rate 74
Figure 4.10: The melting temperature and the melt flow rate 75
Figure 4.11: The correlation between crystallisation temperature and the
melt flow rate 76
Figure 4.12: The percentage of crystallinity at different melt flow rate 78
Figure 4.13: The shrinkage and melt flow rate 79
Figure 4.14: The effect of heating time and temperature on melting
temperature of “New polyamide 12” powder 80
Figure 4.15: The effect of the laser sintering time and temperature on
glass transition temperature of “New PA2200” powder 81
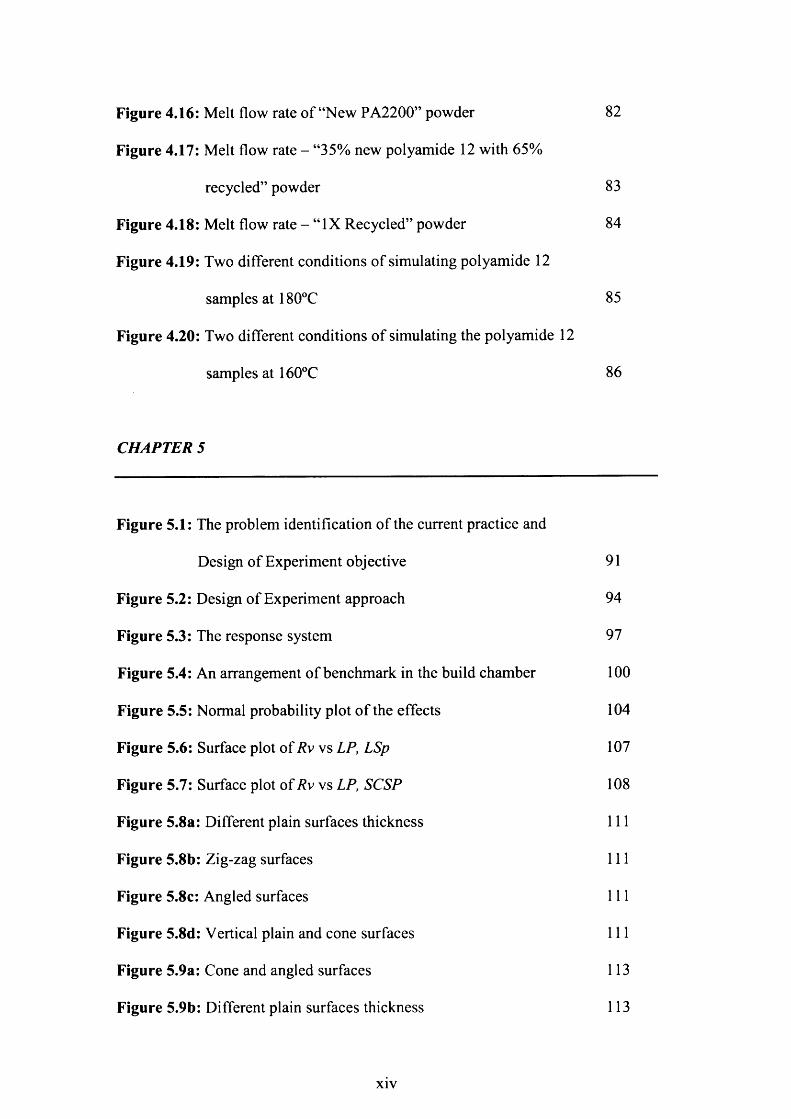
Figure 4.16: Melt flow rate of “New PA2200” powder 82
Figure 4.17: Melt flow rate - “35% new polyamide 12 with 65%
recycled” powder 83
Figure 4.18: Melt flow rate - “ IX Recycled” powder 84
Figure 4.19: Two different conditions of simulating polyamide 12
samples at 180°C 85
Figure 4.20: Two different conditions of simulating the polyamide 12
samples at 160°C 86
CHAPTER 5
Figure 5.1: The problem identification of the current practice and
Design of Experiment objective 91
Figure 5.2: Design of Experiment approach 94
Figure 5.3: The response system 97
Figure 5.4: An arrangement of benchmark in the build chamber 100
Figure 5.5: Normal probability plot of the effects 104
Figure 5.6: Surface plot of Rv vs LP, LSp 107
Figure 5.7: Surface plot of Rv vs LP, SCSP 108
Figure 5.8a: Different plain surfaces thickness 111
Figure 5.8b: Zig-zag surfaces 111
Figure 5.8c: Angled surfaces 111
Figure 5.8d: Vertical plain and cone surfaces 111
Figure 5.9a: Cone and angled surfaces 113
Figure 5.9b: Different plain surfaces thickness 113
CHAPTER 6
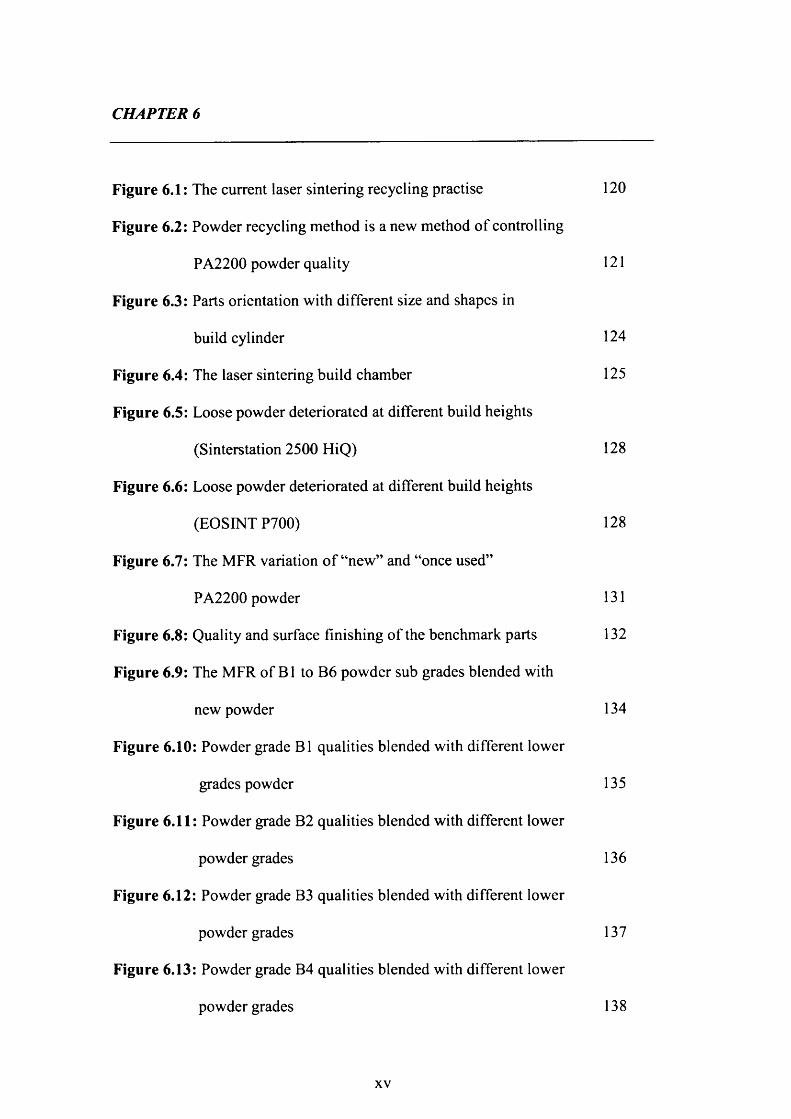
Figure 6.1: The current laser sintering recycling practise 120
Figure 6.2: Powder recycling method is a new method of controlling
PA2200 powder quality 121
Figure 6.3: Parts orientation with different size and shapes in
build cylinder 124
Figure 6.4: The laser sintering build chamber 125
Figure 6.5: Loose powder deteriorated at different build heights
(Sinterstation 2500 HiQ) 128
Figure 6.6: Loose powder deteriorated at different build heights
(EOSINT P700) 128
Figure 6.7: The MFR variation of “new” and “once used”
PA2200 powder 131
Figure 6.8: Quality and surface finishing of the benchmark parts 132
Figure 6.9: The MFR of B1 to B6 powder sub grades blended with
new powder 134
Figure 6.10: Powder grade B1 qualities blended with different lower
grades powder 135
Figure 6.11: Powder grade B2 qualities blended with different lower
powder grades 136
Figure 6.12: Powder grade B3 qualities blended with different lower
powder grades 137
Figure 6.13: Powder grade B4 qualities blended with different lower
powder grades 138
xv
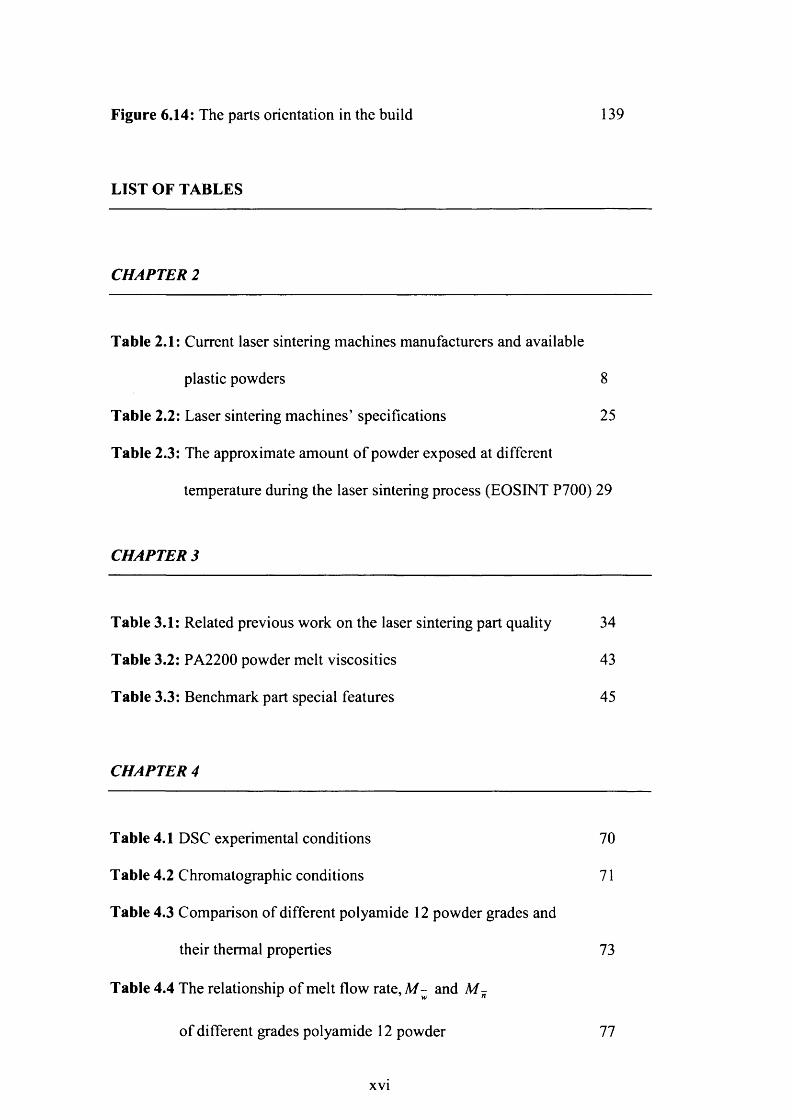
Figure 6.14: The parts orientation in the build
LIST OF TABLES
139
CHAPTER 2
Table 2.1: Current laser sintering machines manufacturers and available
plastic powders 8
Table 2.2: Laser sintering machines’ specifications 25
Table 2.3: The approximate amount of powder exposed at different
temperature during the laser sintering process (EOSINT P700) 29
CHAPTER 3
Table 3.1: Related previous work on the laser sintering part quality 34
Table 3.2: PA2200 powder melt viscosities 43
Table 3.3: Benchmark part special features 45
CHAPTER 4
Table 4.1 DSC experimental conditions 70
Table 4.2 Chromatographic conditions 71
Table 4.3 Comparison of different polyamide 12 powder grades and
their thermal properties 73
Table 4.4 The relationship of melt flow rate, M - and M -
of different grades polyamide 12 powder 77
xvi
CHAPTER 5
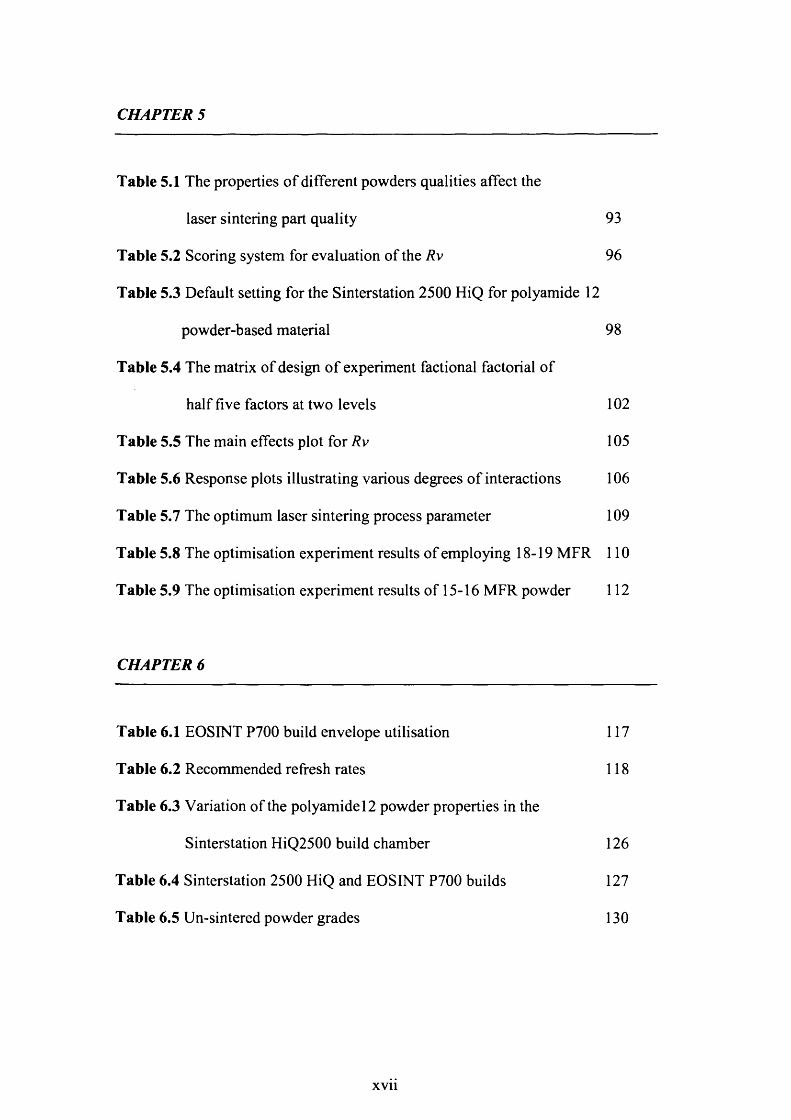
Table 5.1 The properties of different powders qualities affect the
laser sintering part quality 93
Table 5.2 Scoring system for evaluation of the Rv 96
Table 5.3 Default setting for the Sinterstation 2500 HiQ for polyamide 12
powder-based material 98
Table 5.4 The matrix of design o f experiment factional factorial of
half five factors at two levels 102
Table 5.5 The main effects plot for Rv 105
Table 5.6 Response plots illustrating various degrees of interactions 106
Table 5.7 The optimum laser sintering process parameter 109
Table 5.8 The optimisation experiment results of employing 18-19 MFR 110
Table 5.9 The optimisation experiment results of 15-16 MFR powder 112
CHAPTER 6
Table 6.1 EOSINT P700 build envelope utilisation 117
Table 6.2 Recommended refresh rates 118
Table 6.3 Variation of the polyamide 12 powder properties in the
Sinterstation HiQ2500 build chamber 126
Table 6.4 Sinterstation 2500 HiQ and EOSINT P700 builds 127
Table 6.5 Un-sintered powder grades 130
xvii
L IST OF SYM BOLS
Symbol Description SI Unit
A constant specific to a molecules mobility sec'1
Dc the degree of crystallinity %
W ; the number average molecular weight A.U
M -w
the average molecular weight g/mol
R Boltzmann and gas constants kJ mol^K'1
T the absolute temperature Kelvin
Tb part bed temperature °C
Tc crystalline temperature °C
Ts glass transition temperature °c
Tm melting point °cr p O
m equilibrium melting point °c
AE the activation energy kJ/mol
Ahc heat of fusion of purely crystalline material J/g
Ah f heat of fusion of the test sample J/g
AT degree of super cooling °C
Vo the viscosity Pa.s
r spherulite radius pm
t cooling time hours
V growth rate pm/hour
ED energy density J/mm2
xviii
LP laser powder Watt
LSp laser scan speed mm/sec
MFR melt flow rate g/lOmin
P laser power Watt
SCSP Scan spacing mm
List of Abbreviations
ANOVA Analysis of variance
CAD Computer aided design
DOE Design of experiment
DSC Differential Scanning Calorimetric
DM Direct manufacturing
DF ™ DuraForm™
EOS Electro optical systems
GPC Gel permeation chromatography
GF Glass filled
IPCM Integrated process chain management
LS Laser Sintering
LF LaserForm
MWD Molecular weight distribution
PA 12 Polyamide 12
D l Polydispersity
PRM Powder recycling method
Rv Response variable
xix

RM Rapid manufacturing
RP Rapid prototyping
RS Rapid steel
SSt Scanning strategy
SLS Selective laser sintering
xx
Chapter 1: Introduction
CHAPTER 1
INTRODUCTION
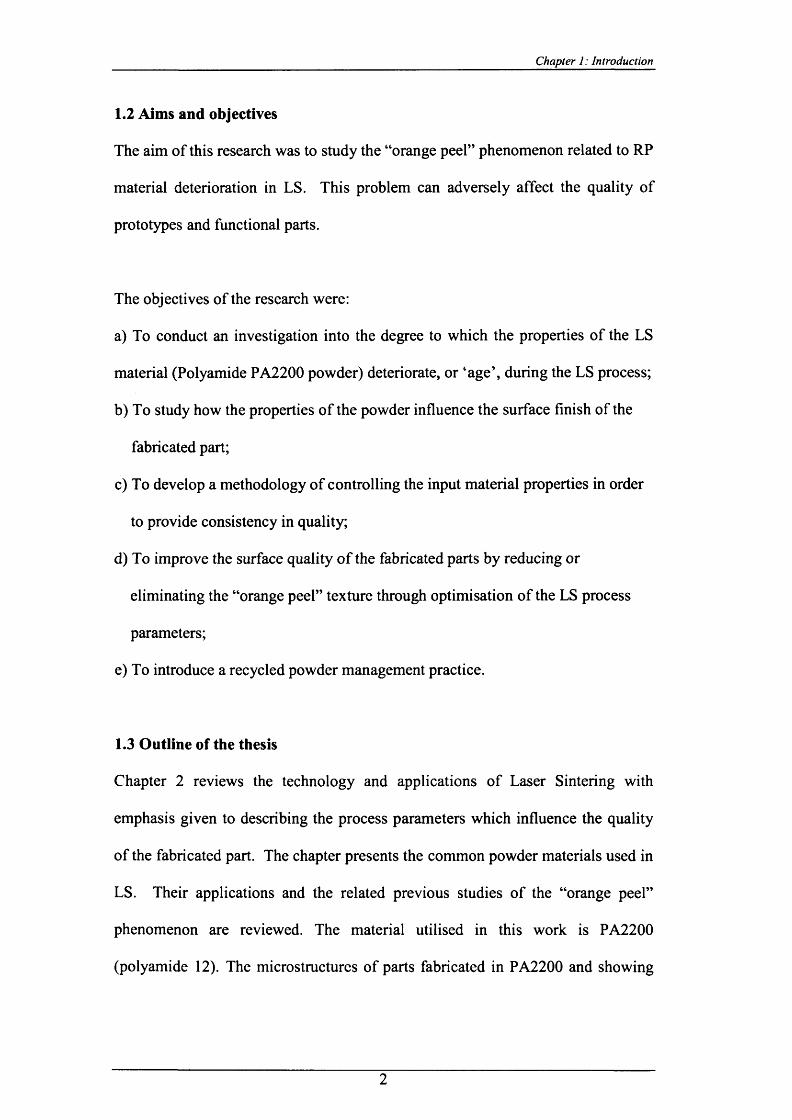
1.1 Background
In manufacturing, many products need to undergo increasing customisation, and a
shortening of the manufacturing cycle time. This makes the time needed to
produce prototypes one of the most important contributors to product
development cycles. Because of the development and pre-production stages of
rapid prototyping (RP), it is often necessary to have small batches of parts for
testing and evaluation purposes. However, today’s trend is for various companies,
across different market sectors, to adopt RP, not only to produce test parts,
prototypes and models but also to fabricate (non-mass production) functional
parts. RP is also known as solid-free form, or layered manufacturing. RP offers
the user the ability to optimise part design in order to meet customer requirements
with few manufacturing restrictions.
One of the most common RP processes is Laser Sintering (LS). A problem with
LS is that sometimes the surface of the parts produced displays a texture similar to
that of the skin of an orange (the so-called “orange peel” texture). This problem
must be addressed before the technology can gain wider acceptance.
1
Chapter I: Introduction
1.2 Aims and objectives
The aim of this research was to study the “orange peel” phenomenon related to RP
material deterioration in LS. This problem can adversely affect the quality of
prototypes and functional parts.
The objectives of the research were:
a) To conduct an investigation into the degree to which the properties of the LS
material (Polyamide PA2200 powder) deteriorate, or ‘age’, during the LS process;
b) To study how the properties of the powder influence the surface finish of the
fabricated part;
c) To develop a methodology of controlling the input material properties in order
to provide consistency in quality;
d) To improve the surface quality o f the fabricated parts by reducing or
eliminating the “orange peel” texture through optimisation of the LS process
parameters;
e) To introduce a recycled powder management practice.
1.3 Outline of the thesis
Chapter 2 reviews the technology and applications of Laser Sintering with
emphasis given to describing the process parameters which influence the quality
of the fabricated part. The chapter presents the common powder materials used in
LS. Their applications and the related previous studies of the “orange peel”
phenomenon are reviewed. The material utilised in this work is PA2200
(polyamide 12). The microstructures of parts fabricated in PA2200 and showing
2
Chapter 1: Introduction
the “orange peel” texture are examined and qualitative models for this problem
are presented in chapter 3.
In chapter 4, the effects of LS process time and temperature which cause the loose
powder to deteriorate are studied and the methods of measuring powder
deterioration which affects the thermal properties and melt viscosity are
presented. Melt Flow Rate (MFR) indexing, Differential Scanning Calorimetry,
and Gel Permeation Chromatography approaches are discussed in chapters 3, 4, 5
and 6. Chapter 5 presents the application of fractional factorial design of
experiments (DOE) to optimise the LS process. Recycled PA2200 powder with
18-19 MFR (twice-used material) was employed in the experiments. It was of
interest to recycle powder in order to avoid wasting material.
Chapter 6 identifies the limitations of present powder management methods. To
overcome those limitations, a new powder recycling method (PRM) is introduced.
This involves classifying the quality of powders based on flow ability and
experimentally determining optimal refresh rates.
Finally, chapter 7 presents the contributions of this research and its conclusions.
This is followed by the identification of further work on this research topic.
3
Chapter 2: The technology and applications o f laser sintering
CHAPTER 2
THE TECHNOLOGY AND APPLICATIONS OF LASER SINTERING
2.1 Preliminaries
There are many different RP technologies available today which differ in terms of
speed, materials, and overall technique [Usher, 2000]. RP refers to the physical
modelling of a design using a special class of machine technology which allows
manufacturers to improve product quality and reduce both times to market and
cost. Due to its tremendous impact on design and manufacturing, the global
demand for RP technology has shown dramatic growth since it was introduced in
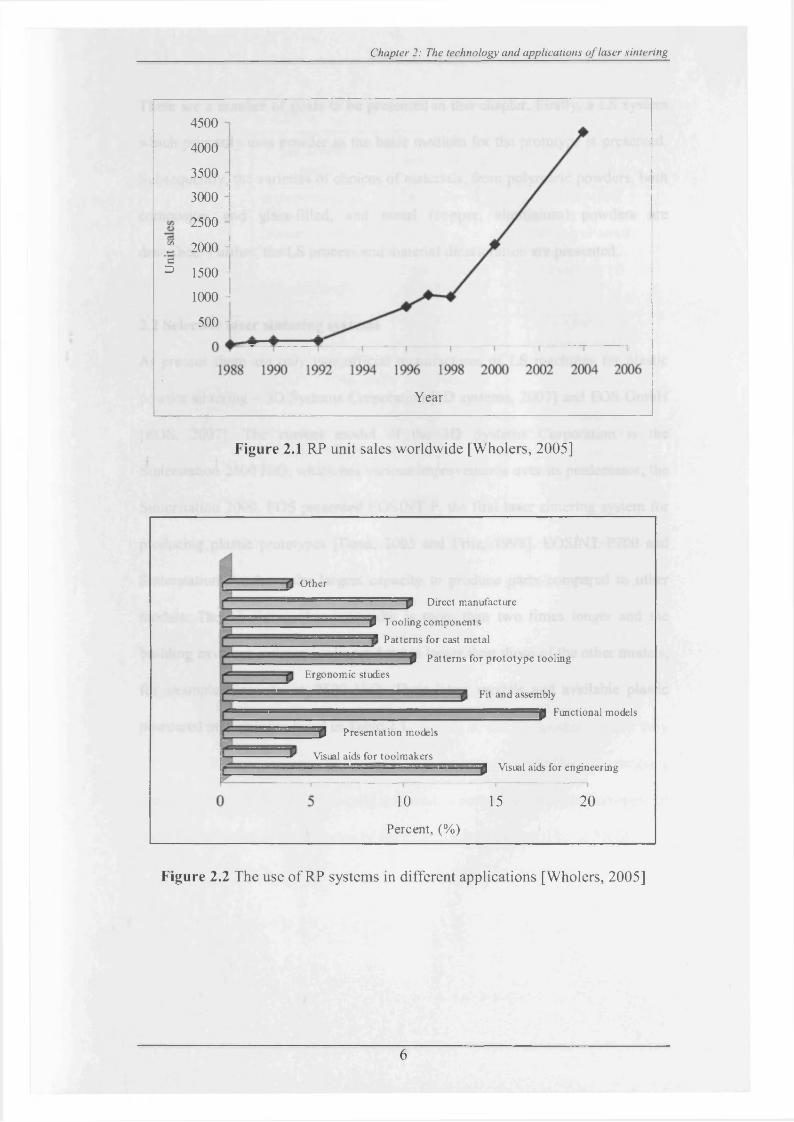
1988, as shown in Figure 2.1 [Pham et al., 1997; Gale, 1997; Dickens and Keane,
1998; Hopkinson, 2006].
One of the most effective and versatile RP techniques available is Selective Laser
Sintering (SLS) or the Laser Sintering (LS) process. In this technology, an object
is created layer by layer from heat-fusible solid fine powdered materials with heat
generated from a CO2 laser [Wholers, 1999; Naim, 2000; Wohlers, 2002]. It is
capable of producing very complex part geometry directly from three-dimensional
CAD software by a quick, highly automated and high-process, flexible
manufacturing process. [Stacey, 1993; Kai, 1998; Pham et, al, 2000; King, 2003;
Shi Y et. al., 2004], It was originally developed by Carl Deckard at the University
of Texas. It was then patented in 1989 and commercialised by DTM Corporation,
4
Chapter 2: The technology and applications o f laser sintering
with support from B.F Goodrich. The first LS system was shipped in 1992, and
there are currently several systems in use worldwide [Kai et al., 1997; Lauwers et
al.,1998; Pham, 2000; Cooper, 2001, and Mazzoli et al., 2007].
RP systems have been sold worldwide. RP has gradually matured. As illustrated
in Figure 2.2, this technology offers a unique, versatile process that can be used
for a broad range of applications in different fields including the electronic,
aerospace, and biomedical areas [Pham and Dimov., 2003; Salmoria et al., 2007;
Mazzoli et al., 2007].
LS differs from conventional manufacturing processes in that it is an additive
process which is able to produce a high degree of accuracy. In addition, no
tooling, fixing, and reorientation is required during the process. In contrast,
traditional machining methods involve removal of material from the final object
geometry. [Pham et al., 1998; King, 2003; Mercelis and Kurth, 2006]. The
advantages associated with this technique are as follows [Theodore, 1996; Effier,
1997; Potts, 1998; Usher et al., 2000; Steve and Richard, 2003]:
• a wide range of build materials, self-supporting build envelope and high
output rate;
• high design flexibility and capability of producing complex shapes with
internal features in a few days compared to conventional methods;
• the LS functional parts can be mechanically tested and fitted for
application;
• time and cost-saving, especially for the manufacture of high-value parts.
5
Chapter 2: The technology and applications o f laser sintering
4500
4000 -
3500 -
3000
2500
t 2000 H
^ 1500 i
1000 1
500 -
Year
Figure 2.1 RP unit sales worldwide [Wholers, 2005]
Other
53 Direct manufacture
3 Tooling components Patterns for cast metal
1 Patterns for prototype toolingErgonomic studies
Fit and assembly
==$ Functional models
5 Presentation models
Visual aids for toolmakers , - = ^ Visual aids for engineering
10 15
Percent, (%)
20
Figure 2.2 The use of RP systems in different applications [Wholers, 2005]
6
Chapter 2: The technology and applications o f laser sintering
There are a number of goals to be presented in this chapter. Firstly, a LS system
which primarily uses powder as the basic medium for the prototype is presented.
Subsequently, the varieties of choices of materials, from polymeric powders, both
composites and glass-filled, and metal (copper, aluminium) powders are
described. Further, the LS process and material deterioration are presented.
2.2 Selective laser sintering systems
At present there are only two official manufactures of LS machines for plastic
powder sintering - 3D Systems Corporation [3D systems, 2007] and EOS GmbH
[EOS, 2007]. The current model of the 3D Systems Corporation is the
Sinterstation 2500 HiQ, which has various improvements over its predecessor, the
Sinterstation 2000. EOS presented EOSINT P, the first laser sintering system for
producing plastic prototypes [Dean, 2005 and Fritz, 1998]. EOSINT P700 and
Sinterstation Pro have the largest capacity to produce parts compared to other
models. Their building chamber width is more than two times longer and the
building envelope volume is almost 4 times larger than those of the other models,
for example Sinterstation 2500 HiQ. Their latest models and available plastic
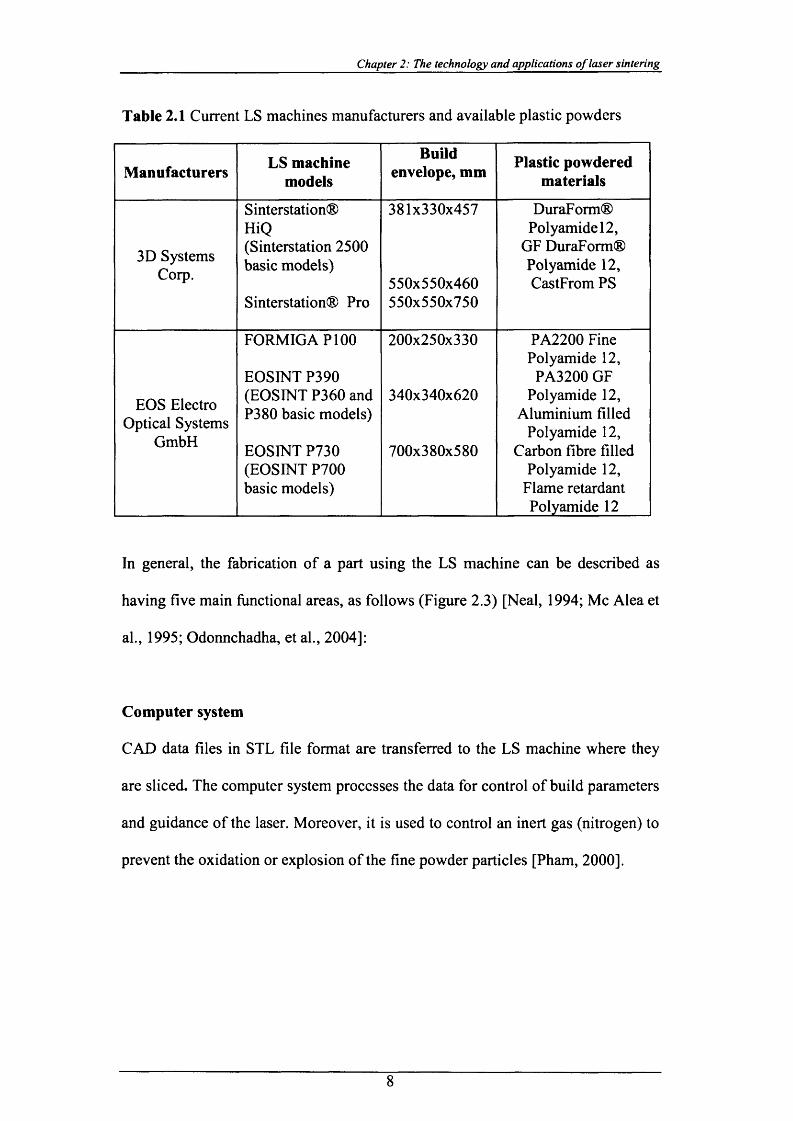
powdered materials are listed in Table 2.1.
7
Chapter 2: The technology and applications o f laser sintering
Table 2.1 Current LS machines manufacturers and available plastic powders
Manufacturers LS machine models
Build envelope, mm Plastic powdered
materials
3D Systems Corp.
Sinterstation®HiQ(Sinterstation 2500 basic models)
Sinterstation® Pro
381x330x457
550x550x460550x550x750
DuraForm® Polyamide 12,
GF DuraForm® Polyamide 12, CastFrom PS
EOS Electro Optical Systems
GmbH
FORMIGA P I00
EOSINT P390 (EOSINT P360 and P380 basic models)
EOSINT P730 (EOSINT P700 basic models)
200x250x330
340x340x620
700x380x580
PA2200 Fine Polyamide 12,
PA3200 GF Polyamide 12,
Aluminium filled Polyamide 12,
Carbon fibre filled Polyamide 12,
Flame retardant Polyamide 12
In general, the fabrication of a part using the LS machine can be described as
having five main functional areas, as follows (Figure 2.3) [Neal, 1994; Me Alea et
al., 1995; Odonnchadha, et al., 2004]:
Computer system
CAD data files in STL file format are transferred to the LS machine where they
are sliced. The computer system processes the data for control of build parameters
and guidance of the laser. Moreover, it is used to control an inert gas (nitrogen) to
prevent the oxidation or explosion of the fine powder particles [Pham, 2000].
8
Chapter 2: The technology and applications o f laser sintering
Heaters
It heats the powder to a temperature just below the melting point of the material.
The reason for this is to decrease the heat stress to the lowest degree and to
prevent the fabrication part from warping. The temperature of the powder
cartridge must be controlled to allow powder to be moved freely by the roller [Shi
et al., 2004].
Roller mechanism
The roller spreads a very thin (between 100 pm to 125pm) layer across the part
build cylinder [Pham et al., 1997 and Naim, 2002]. The roller transverse speed is
an adjustable machine parameter. If the roller speed is set too slow, the processing
time increases. Conversely, setting the roller speed relatively high may result in
the powder being pushed in front of the roller [Naim, 2002].
CO2 laser set
The mirrors cause the laser to scan specific areas of the powder corresponding to a
slice thorough the object’s design geometry. The interaction of the laser beam
with the powder fuses the powder particles to produce the LS parts [Neal, 1994].
Build Cylinder
The part build cylinder lowers slightly and one of the feed cartridges rises. The
sinter material forms the part while the unsintered powder remains in place to
support the structure.
9
Chapter 2: The technology and applications o f laser sintering
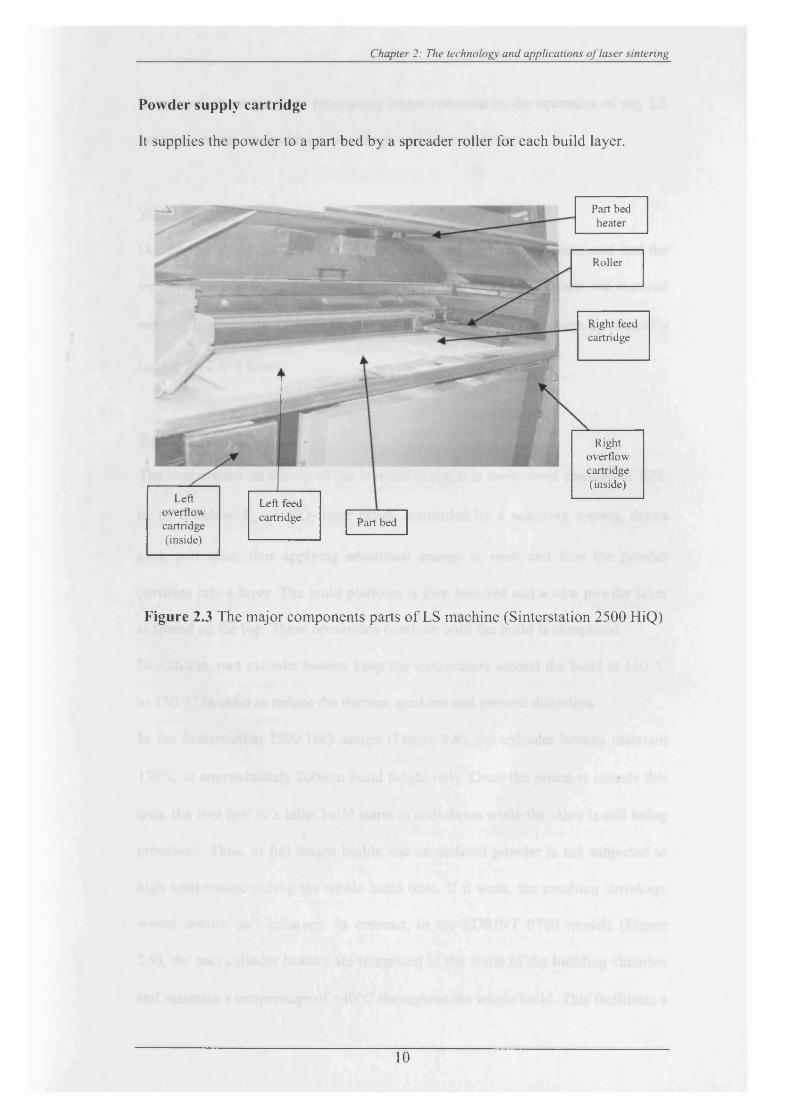
Powder supply cartridge
It supplies the powder to a part bed by a spreader roller for each build layer.
Leftoverflowcartridge(inside)
Left feed cartridge Part bed
Rightoverflowcartridge(inside)
Right feed cartridge
Part bed heater
Roller
Figure 2.3 The major components parts of LS machine (Sinterstation 2500 HiQ)
10
Chapter 2: The technology and applications o f laser sintering
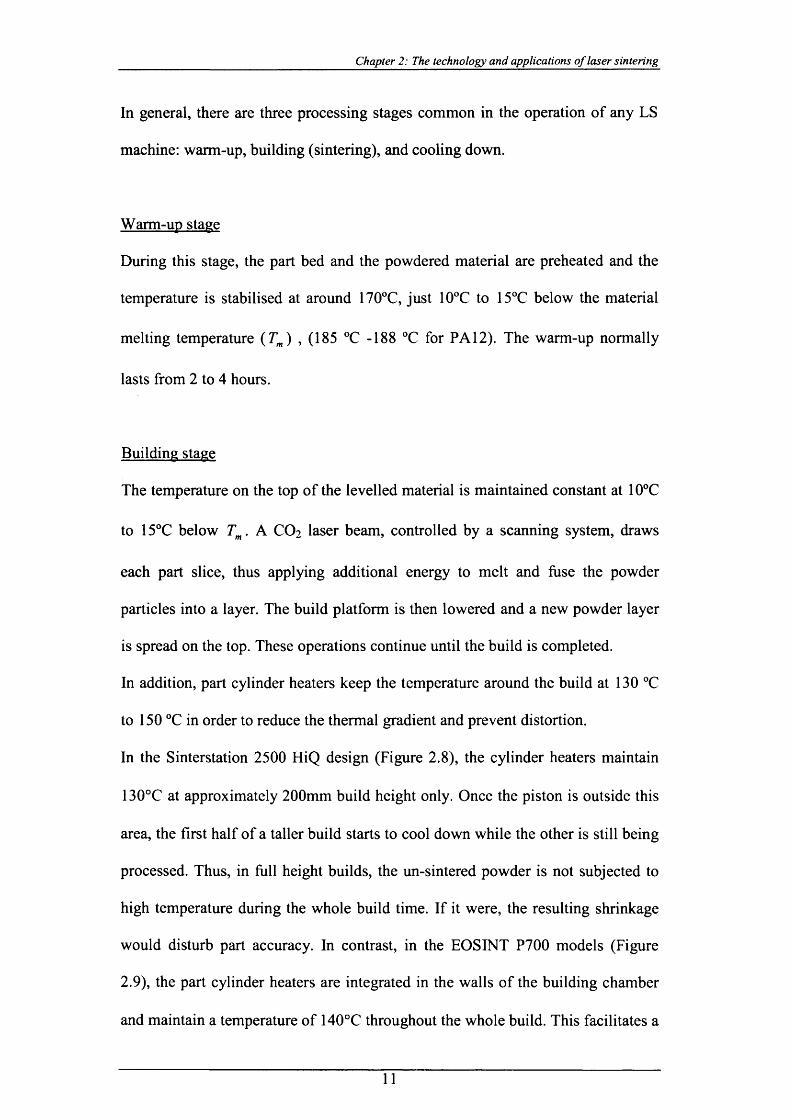
In general, there are three processing stages common in the operation of any LS
machine: warm-up, building (sintering), and cooling down.
Warm-up stage
During this stage, the part bed and the powdered material are preheated and the
temperature is stabilised at around 170°C, just 10°C to 15°C below the material
melting temperature (Tm) , (185 °C -188 °C for PA12). The warm-up normally
lasts from 2 to 4 hours.
Building stage
The temperature on the top of the levelled material is maintained constant at 10°C
to 15°C below Tm. A CO2 laser beam, controlled by a scanning system, draws
each part slice, thus applying additional energy to melt and fuse the powder
particles into a layer. The build platform is then lowered and a new powder layer
is spread on the top. These operations continue until the build is completed.
In addition, part cylinder heaters keep the temperature around the build at 130 °C
to 150 °C in order to reduce the thermal gradient and prevent distortion.
In the Sinterstation 2500 HiQ design (Figure 2.8), the cylinder heaters maintain
130°C at approximately 200mm build height only. Once the piston is outside this
area, the first half of a taller build starts to cool down while the other is still being
processed. Thus, in full height builds, the un-sintered powder is not subjected to
high temperature during the whole build time. If it were, the resulting shrinkage
would disturb part accuracy. In contrast, in the EOSINT P700 models (Figure
2.9), the part cylinder heaters are integrated in the walls of the building chamber
and maintain a temperature of 140°C throughout the whole build. This facilitates a
11
Chapter 2: The technology and applications o f laser sintering
uniform temperature distribution and therefore uniform shrinkage but the un
sintered material stays at higher temperature for much longer.
This stage could last from 10 hours to more than 100 hours depending on the LS
machine speed, build height, and volume of the parts in the build.
Cooling down stage
At the end of the process, the temperature in the build is very high, from 140°C to
180°C. The sintered parts can be removed only after their temperature falls below
that of material glass transition, 45°C - 60°C, otherwise they could warp or
deform. This could take from 10 hours (small builds) to more than 30-40 hours
(long builds) and therefore the un-sintered material is ageing further during this
stage. Generally, the larger the building volume, the longer is the cooling down
time.
In both technologies, the un-sintered PA 12 powder in the build is subjected to
temperature close to Tm for a long period of time which affects significantly the
material properties and usability. It needs to be refreshed with a sufficient amount
of new powder in order to produce parts of good quality.
12
Chapter 2: The technology and applications o f laser sintering
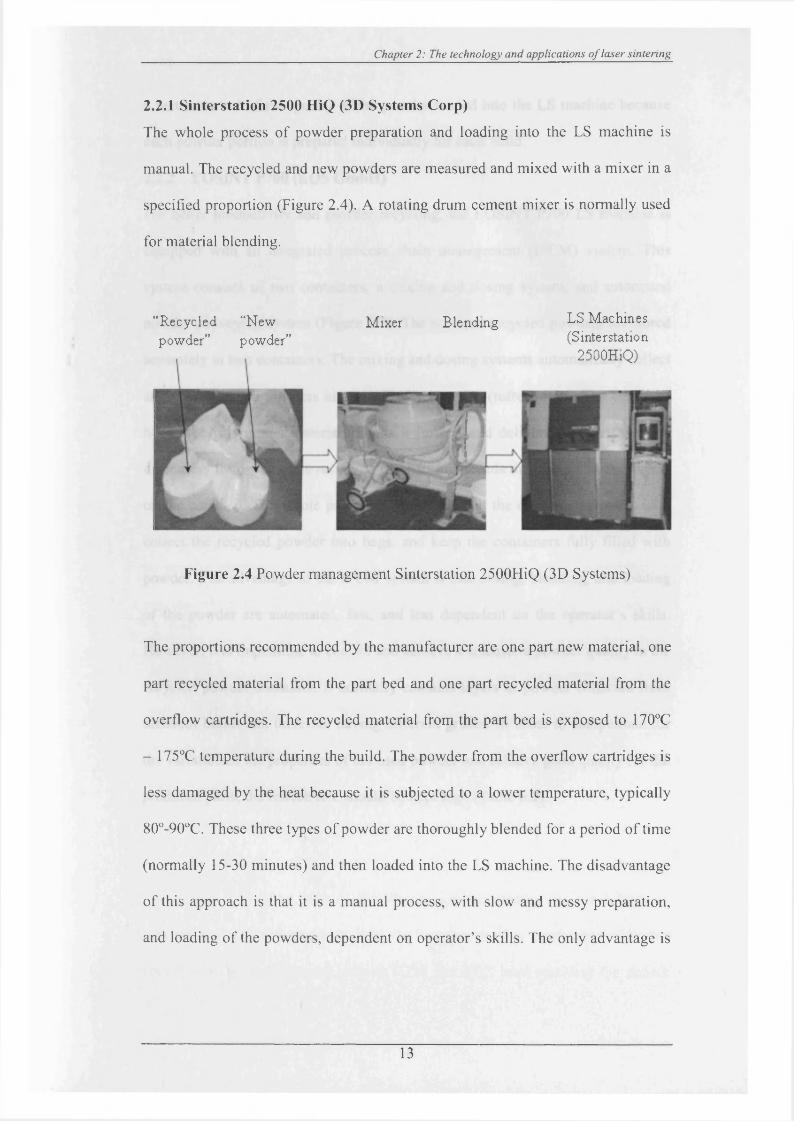
2.2.1 Sinterstation 2500 HiQ (3D Systems Corp)
The whole process of powder preparation and loading into the LS machine is
manual. The recycled and new powders are measured and mixed with a mixer in a
specified proportion (Figure 2.4). A rotating drum cement mixer is normally used
for material blending.
“Recycled “New powder” powder”
Mixer Blending LS Machines (Sinterstation
2500HiQ)
Figure 2.4 Powder management Sinterstation 2500HiQ (3D Systems)
The proportions recommended by the manufacturer are one part new material, one
part recycled material from the part bed and one part recycled material from the
overflow cartridges. The recycled material from the part bed is exposed to 170°C
- 175°C temperature during the build. The powder from the overflow cartridges is
less damaged by the heat because it is subjected to a lower temperature, typically
80°-90°C. These three types of powder are thoroughly blended for a period of time
(normally 15-30 minutes) and then loaded into the LS machine. The disadvantage
of this approach is that it is a manual process, with slow and messy preparation,
and loading of the powders, dependent on operator’s skills. The only advantage is
13
Chapter 2: The technology and applications o f laser sintering
a better control of the quality of the powder loaded into the LS machine because
each powder portion is prepared individually for each build.
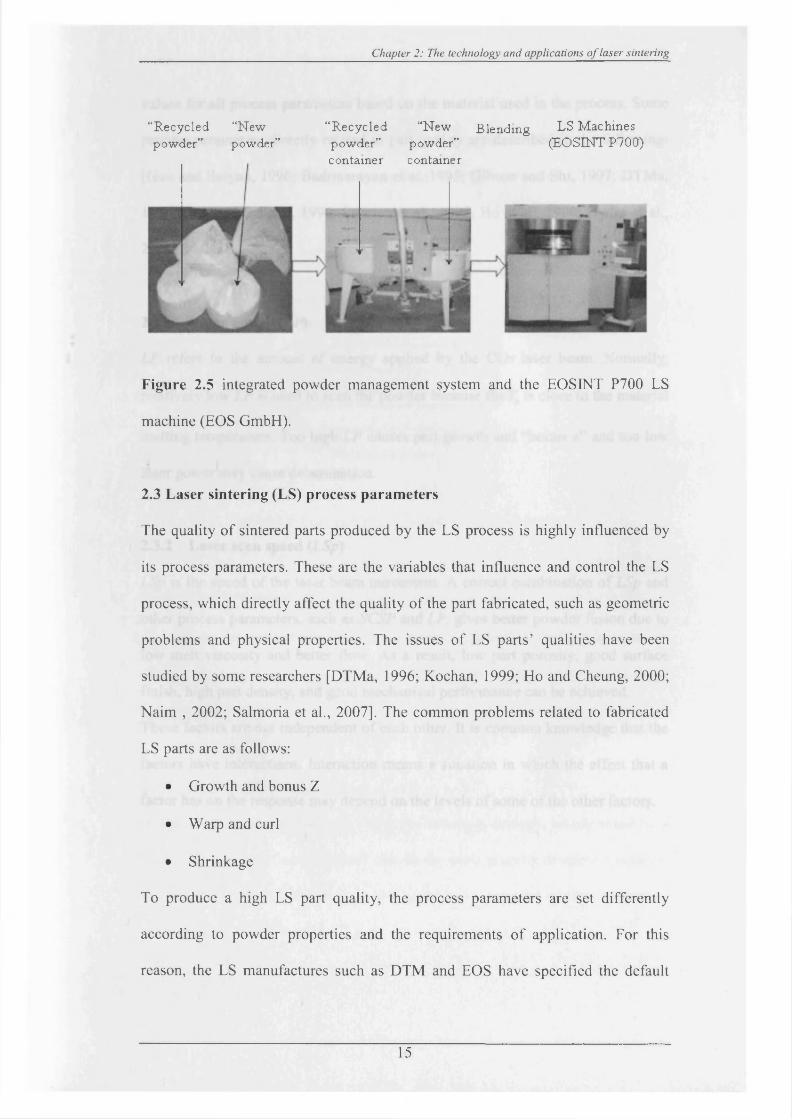
2.2.2 EOSINT P700 (EOS GmbH)
For better productivity and powder recycling, the EOSINT P700 LS machine is
equipped with an integrated process chain management (IPCM) system. This
system consists of two containers, a mixing and dosing system, and automated
powder conveying system (Figure 2.5). The new and recycled powders are stored
separately in two containers. The mixing and dosing systems automatically collect
and blend the two powders in a specified proportion (refresh rate). The conveyor
hose takes the mixed material, blends it further, and delivers it to the machine
dispensers from where the recoating mechanism spreads the powder in thin layers
on the part bed. The whole process is automatic and the only manual work is to
collect the recycled powder into bags, and keep the containers fully filled with
powder. The advantage of the IPCM system is that dosing, blending, and loading
of the powder are automated, fast, and less dependent on the operator’s skills.
However, it is impossible to control and achieve a consistent powder quality in the
recycled powder container. It normally contains layers of powder collected from
different builds and therefore having different grades. In order to compensate for
the variation of the properties of the used powder and achieve good quality for the
produced parts, the refresh rate should be kept high (Table 6.2).
14
Chapter 2: The technology and applications o f laser sintering
“R ecycled “N ew “R ecycled “N ew Blending LS M achinespowder” powder” powder” powder” (EOSINT P 700)
container container
Figure 2.5 integrated powder management system and the EOSINT P700 LS
machine (EOS GmbH).
2.3 Laser sintering (LS) process parameters
The quality of sintered parts produced by the LS process is highly influenced by
its process parameters. These are the variables that influence and control the LS
process, which directly affect the quality of the part fabricated, such as geometric
problems and physical properties. The issues of LS parts’ qualities have been
studied by some researchers [DTMa, 1996; Kochan, 1999; Ho and Cheung, 2000;
Naim , 2002; Salmoria et al., 2007]. The common problems related to fabricated
LS parts are as follows:
• Growth and bonus Z
• Warp and curl
• Shrinkage
To produce a high LS part quality, the process parameters are set differently
according to powder properties and the requirements of application. For this
reason, the LS manufactures such as DTM and EOS have specified the default
15
Chapter 2: The technology and applications o f laser sintering
values for all process parameters based on the material used in the process. Some
process parameters directly related to part quality are described in the following:
[Guo and Suiyan, 1996; Badrinarayan et al.,1995; Gibson and Shi, 1997; DTMa,
1996; Gou and Suiyan , 1996; Stierlen et al., 1997, Ho et al., 1999; Hydro et al.,
2004].
2.3.1 Laser power (LP)
LP refers to the amount of energy applied by the CO2 laser beam. Normally,
relatively low LP is used to scan the powder because the Tb is close to the material
melting temperature. Too high LP causes part growth and “bonus z” and too low
laser power may cause delamination.
2.3.2 Laser scan speed (LSp)
LSp is the speed of the laser beam movement. A correct combination of LSp and
other process parameters, such as SCSP and LP, gives better powder fusion due to
low melt viscosity and better flow. As a result, low part porosity, good surface
finish, high part density, and good mechanical performance can be achieved.
These factors are not independent of each other. It is common knowledge that the
factors have interactions. Interaction means a situation in which the effect that a
factor has on the response may depend on the levels of some of the other factors.
16
Chapter 2: The technology and applications o f laser sintering
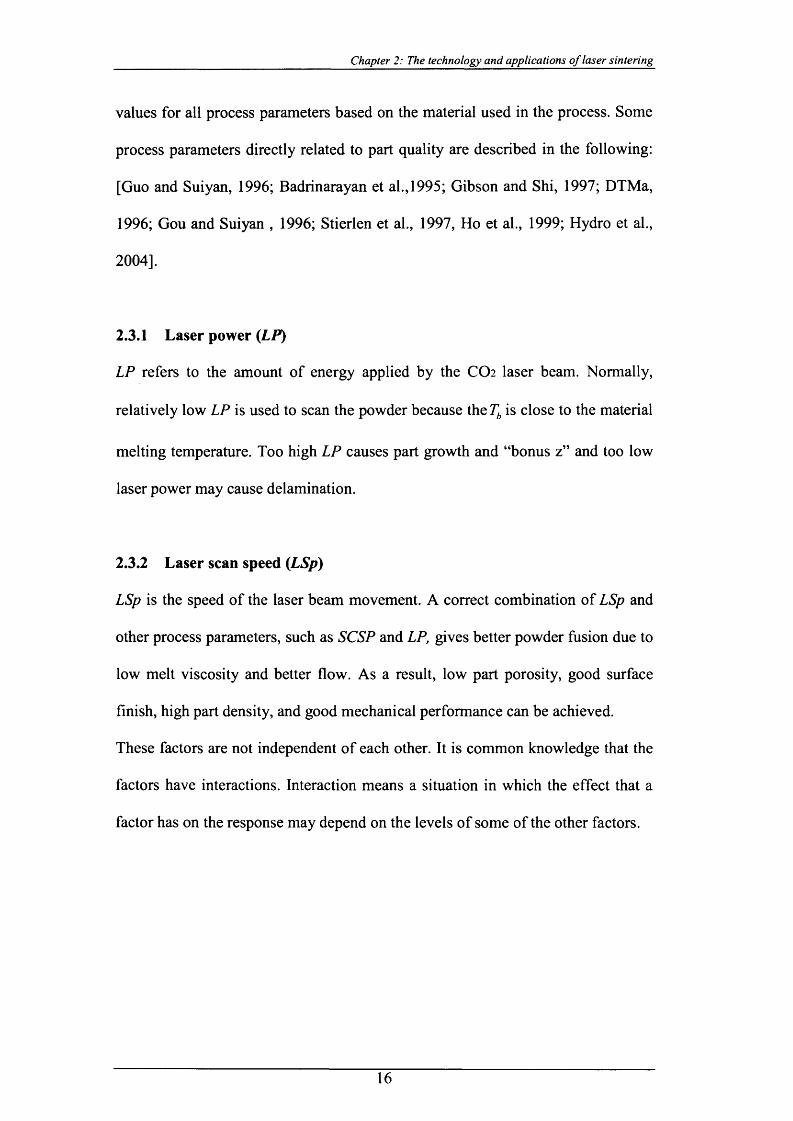
2.3.3 Scan spacing (SCSP)
SCSP is the distance between two nearest overlapping parallel scan vectors, as
shown in Figure 2.6. The parts are fragile if the SCSP value is too high and part
surface may be rough if the SCSP is too low.
Laser beam movement
^ \ ( ri----- =i y<h
( ^= > f ^
k ------- ---------- >1Nominal dimension
Figure 2.6 The laser beam movement in the LS process
2.3.4 Part bed temperature ( Tb)
Tb refers to the powder temperature at the top of the build cylinder during the LS
process. Normally, this temperature is 10°C to 15°C below the PA 12 material
melting point.
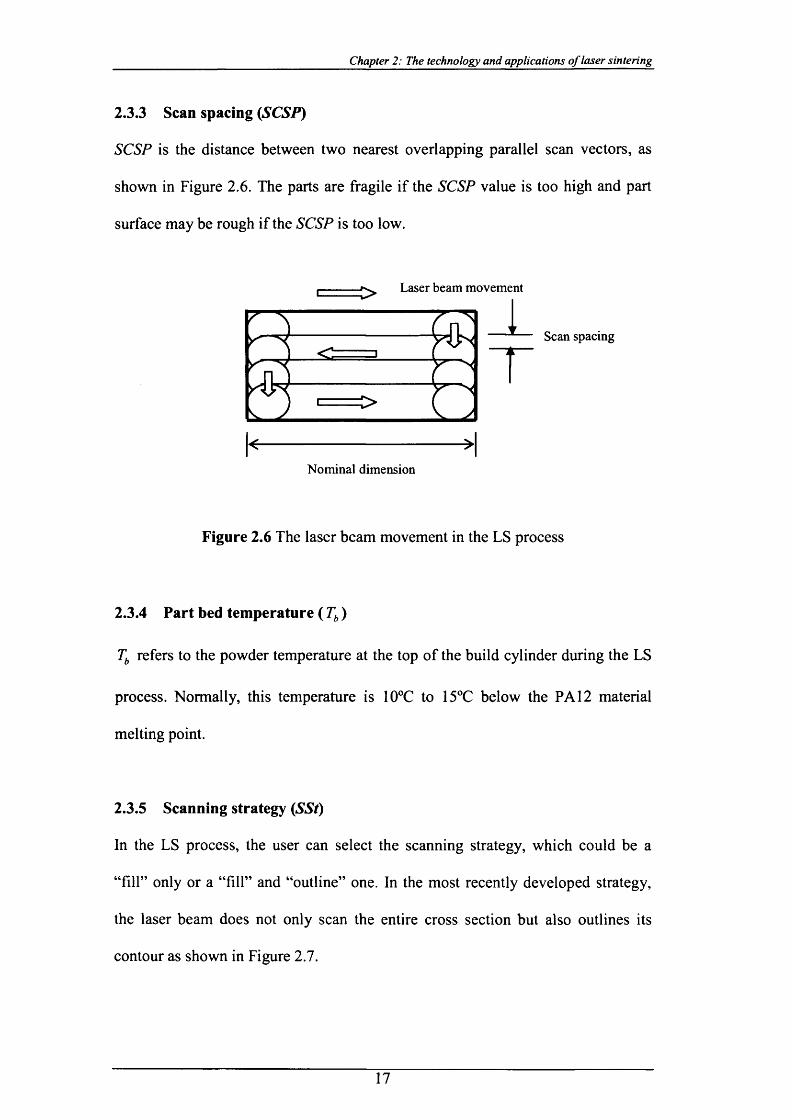
2.3.5 Scanning strategy (SSt)
In the LS process, the user can select the scanning strategy, which could be a
“fill” only or a “fill” and “outline” one. In the most recently developed strategy,
the laser beam does not only scan the entire cross section but also outlines its
contour as shown in Figure 2.7.
17
Chapter 2: The technology and applications o f laser sintering
‘Outline’
“Fill”X aser beam movement
Nominal dimension
Figure 2.7 Laser scanning strategies
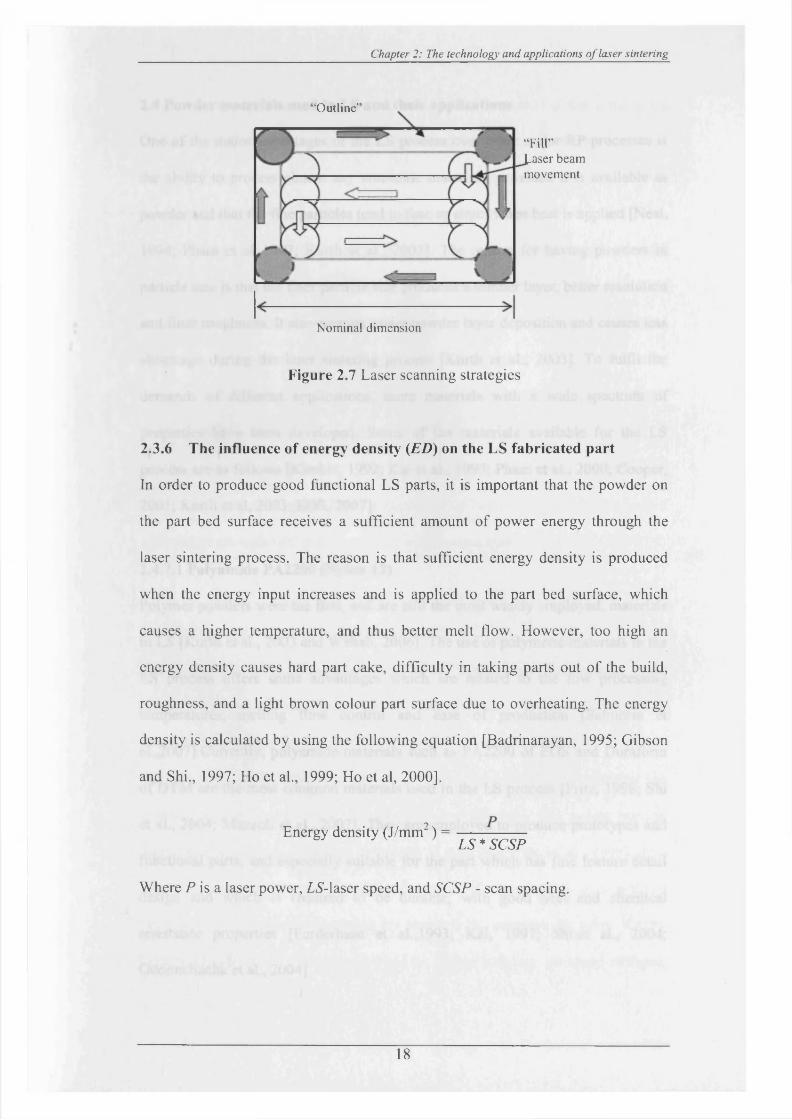
2.3.6 The influence of energy density (ED) on the LS fabricated part
In order to produce good functional LS parts, it is important that the powder on
the part bed surface receives a sufficient amount of power energy through the
laser sintering process. The reason is that sufficient energy density is produced
when the energy input increases and is applied to the part bed surface, which
causes a higher temperature, and thus better melt flow. However, too high an
energy density causes hard part cake, difficulty in taking parts out of the build,
roughness, and a light brown colour part surface due to overheating. The energy
density is calculated by using the following equation [Badrinarayan, 1995; Gibson
and Shi., 1997; Ho et al., 1999; Ho et al, 2000].
rs
Energy density (J/mm“) =LS *SCSP
Where P is a laser power, LS-laser speed, and SCSP - scan spacing.
18
Chapter 2: The technology and applications o f laser sintering
2.4 Powder materials used in LS and their applications
One of the major advantages of the LS process over other major RP processes is
the ability to process almost any non-toxic materials, provided it is available as
powder and that the fine particles tend to fuse or sinter when heat is applied [Neal,
1994; Pham et al.,1997; Kurth et al., 2003]. The reason for having powders in
particle size is that the finer particle size produces a thinner layer, better resolution
and finer roughness. It also permits easier powder layer deposition and causes less
shrinkage during the laser sintering process [Kurth et al., 2003]. To fulfil the
demands of different applications, more materials with a wide spectrum of
properties have been developed. Some of the materials available for the LS
process are as follows [Kimble, 1992; Kai et al., 1997; Pham et al., 2000; Cooper,
2001; Kurth et al, 2003; EOS, 2007]:
2.4.7.1 Polyamide PA2200 (Nylon 12)
Polymer powders were the first, and are still the most widely employed, materials
in LS [Kurth et al., 2003 and Wahab, 2006]. The use of polymeric materials in the
LS process offers some advantages which are related to the low processing
temperatures, melting flow control and ease of production [Salmoria et
al.,2007].Currently, polyamide materials such as PA2200 of EOS and Duraform
of DTM are the most common materials used in the LS process [Fritz, 1998; Shi
et al., 2004; Mazzoli et al., 2007]. They are employed to produce prototypes and
functional parts, and especially suitable for the part which has fine feature detail
design and which is required to be durable, with good heat and chemical
resistance properties [Forderhase et al.,1993; Kai, 1997; Shi.et al., 2004;
Odonnchadha et al., 2004]
19

Chapter 2: The technology and applications o f laser sintering
The advantage of using PA semi-crystalline as an LS material is that it has good
physical properties with a high melting temperature due to the strong hydrogen
bonding. Due to the LS process involving a thermal stage, the part produced is
associated with shrinkage and wraps [Naim, 2002]. Typically for the semi
crystalline polymers, shrinkage is 3-4 per cent [Pham et al., 2000 and Kurth et al.,
2003]. An alternative to PA2200 is PA2210FR and PrimePart. PA2210FR. This
is suitable for parts which require flame resistance with high mechanical
properties. It contains a chemical flame retardant and a carbonating coating
develops at the surface of the part in case of fire [Metalworking production, 2006;
Desktop Engineering, 2006 and EOS, 2007]. PrimePart is new fine polyamide
powder which is suitable for the rapid and cost-effective manufacture of
functional prototypes and end products. It offers a balanced relationship between
mechanical strength and elasticity over a wide temperature range [EOS, 2007].
2.4.7.2 Glass-filled Polyamide 3200 (Nylon 12)
The GF3200PA of EOS and LNC 7000 of 3D Systems are two types of nylon
composite commonly used in the LS process. However, the crystalline nature of
PA affects the properties significantly and highly crystalline types can be stiff and
hard [Walter et al., 2006]. The use of glass fibre and other reinforcements can
improve the mechanical properties (modulus and strength). The weight fraction
glass reinforcement in the nylon composite is 0.50 [Mc.Alea et. al., 1995]. This
provides increased strength and dimensional stability as well as cutting down
expansion due to water absorption by about 0.3% compare to nylon 0.41%.
Compared to nylon it offers greater rigidity; higher stability; increased stiffness;
20
Chapter 2: The technology and applications o f laser sintering
and good heat resistance; which makes it a perfect material for extreme testing
conditions [Michael, 1998 and Mazzoli, 2007].
2.4.7.3 Aluminium-filled Polyamide (AJumide™)
This is a new LS powder which is made of aluminium-filled polyamide by EOS
GmbH in 2005. The Alumide™ parts have an excellent accuracy, high
temperature resistance, and are extremely rigid, with a shiny metallic appearance
that means it is a favourite among motor sport teams [Mazzoli, 2007]. In addition,
it produces a superior surface finish for many functional prototypes such as
manifolds, thermoforming moulds, tooling and aerodynamic wind tunnel test
models [Materialise, 2006]. The surface of parts made of Alumide can be finished
by grinding, polishing, or coating. This provides an alternative to the conventional
materials such as polyamide, glass-filled polyamide, or polystyrene [EOS, 2007].
2.4.7.4 Composites /Cooper Polyamide (Cooper PA)
Copper polyamide (Cooper PA) is a metal-plastic composite which was put on the
market in 1998 by DTM [DTM, 1998d.] It is a metal - plastic composite used for
tooling plastic injection moulding. It consists of nylon (polyamide base filled with
copper powder [Pham, 2000 and Dimov, 2001]. It can be built into mould tool
inserts in the LS machine in the same way as other PA materials (e.g. PA2200 and
DF™). It is suitable for injection moulded inserts when need to mould 100-400
parts in polyethylene, polypropylene, polystyrene, ABS and other common
plastics [King, 2002]. The advantage is that inserts from copper PA are easy to
machine and finish. Their heat resistance and thermal conductivity are better
compared to the most common plastic tooling materials [DTM, 1998c;
21

Chapter 2: The technology and applications o f laser sintering
DTM,1998d; Levy and Schindel, 2002]. The cycle times of moulds using Copper
PA inserts are similar to those for metal tooling [Pham, 2000 and King, 2002],
2.4.7.5 CarbonMide®-Carbon Fibre-filled Polyamide
The part built of CarbonMide® has outstanding mechanical properties
characterised by extreme stiffness and strength. It is suitable for the production of
fully functional prototypes with high end finish for wind tunnel tests or other
aerodynamic applications [EOS, 2007].
2.4.7.6 Prime Cast 101 (Polystyrene)/ Castform
This material is used to make complex investment casting patterns because of its
low ash content (<0.02%) and compatibility with standard foundry practice.
Patterns made with Castform material are low density (45% dense), and can be
infiltrated with foundry wax to create a pattern that is easy to handle [Pham et
al.,2000; Pham et al., 2001; Dochev and Soe, 2006]. Moreover, it is ideal for
making patterns for casting reactive metal such as titanium, and it has also been
used successfully with low-melt temperature metals such as aluminium,
magnesium, and zinc [Pham et al.,2000].
2.4.7.7 Alloy mixtures / LaserForm™ (LF™)
This is a stainless steel-based powder which is employed in the production of
durable metal prototypes, parts and as a tooling application, for mould inserts or
discrete parts. According to 3D systems, parts produced from LF™ enjoy cycle
times faster almost 20% to 40% than most tool steels due to its high thermal
conductivity. In addition, the parts are easily finished and polished. This means
22

Chapter 2: The technology and applications o f laser sintering
that complex designs can be rapidly fabricated. Another advantage is that the parts
are durable as concerns casting temperature, welding, or highly corrosive
environments [Das and Bourell, 1998, Ghany, 2006; 3D systems, 2007].
2.4.7.8 Steel
This was the first steel powder-based material, introduced by EOS GmbH in 1995,
to offer a low melting point. It has been employed for producing complex inserts
for plastic injection. Since then, a new generation of steel and metal powders have
been introduced, such as the well-known DirectSteelTM 50-V1 and
DirectMetalTM 50-V2, which allow inserts with layer thickness of 50 pm to be
built, facilitating reproduction of intricate structural detail. The latest generation
of metal powder-base is DirectMetal™, which has a maximum particle size of
100pm and is employed to produce at higher building speeds [Fritz, 1998; Pham,
2000; Dewidar and Dalgamo, 2001].
Rapid Steel 1.0 fRSl) and Rapid Steel 2.0 (RS2)
The starting material for Rapid Steel 1.0 (RSI) is a ferrous alloy with low carbon
content and a particle size of 55 pm which is coated with 1% weight polymer
[Pham, 1999 and DTMb, 1999]. It is used to produce inserts for pre-production
and production tools. It was made commercially available in 1998 by DTM after
modifications over RSI. It is used in creating metal core-and cavity inserts for
injection moulding and die-casting tools. The average particle size of 34pm and a
smaller layer thickness of 75 pm lead to smoother surfaces by a reduction of stair
stepping effects and a shortening of the time required for finishing. RS2 has
higher accuracy than RP1, which is closer to the ±0.1 mm, and it is usually
required for production injection moulding tools [Lacan, 2000].
23
Chapter 2: The technology and applications o f laser sintering
2.4.7.9 Green sand (SandForm™)
SandForm™ Zr & Si is used to fabricate pre-production moulds for
manufacturing, verification and testing, and in order to reduce the costs associated
with conventional core production using the core box. According to DTM, the
manufacture of complex cores is a time-consuming process but LS machines can
fabricate the sand casting cores in a number of hours. The sand moulds and
cavities produced are of equivalent accuracy, and have properties that are identical
to cores fabricated with conventional methods. It can be employed for low-
pressure sand casting [DTM, 1998e].
24
Chapter 2: The technology and applications o f laser sintering
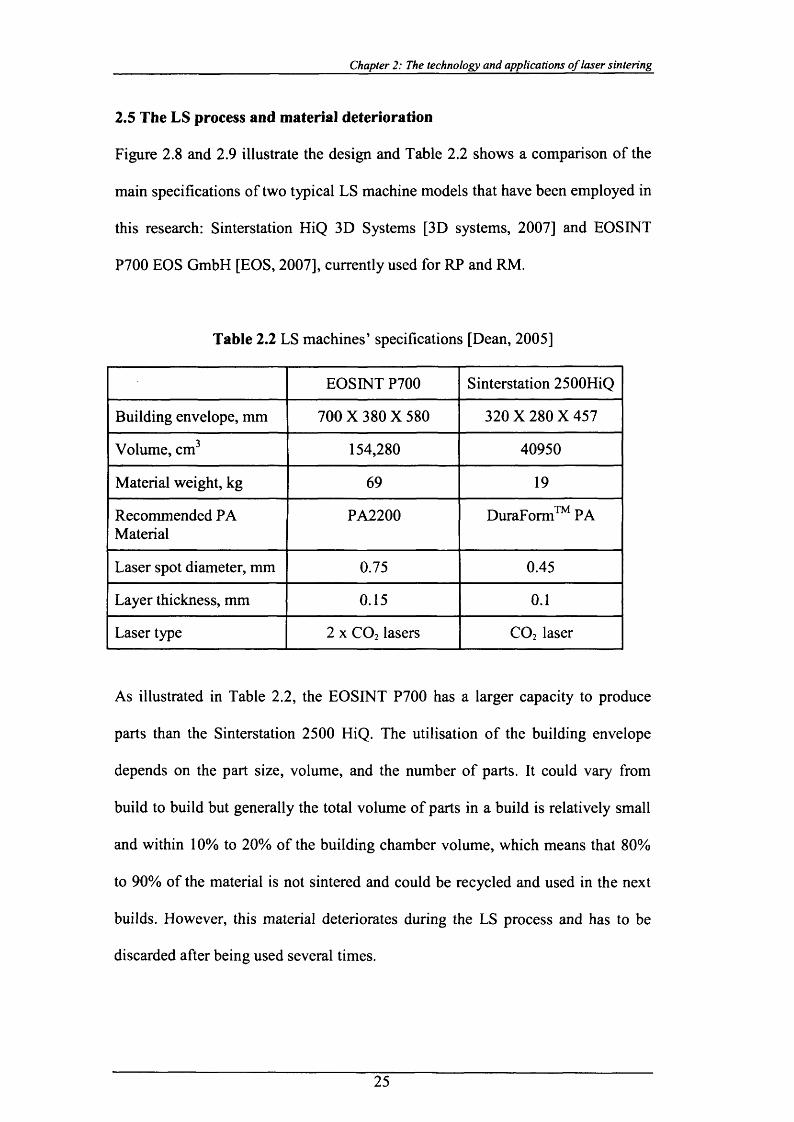
2.5 The LS process and material deterioration
Figure 2.8 and 2.9 illustrate the design and Table 2.2 shows a comparison of the
main specifications of two typical LS machine models that have been employed in
this research: Sinterstation HiQ 3D Systems [3D systems, 2007] and EOSINT
P700 EOS GmbH [EOS, 2007], currently used for RP and RM.
Table 2.2 LS machines’ specifications [Dean, 2005]
EOSINT P700 Sinterstation 2500HiQ
Building envelope, mm 700 X 380 X 580 320 X 280 X 457
Volume, cm3 154,280 40950
Material weight, kg 69 19
Recommended PA Material
PA2200 DuraForm™ PA
Laser spot diameter, mm 0.75 0.45
Layer thickness, mm 0.15 0.1
Laser type 2 x C 0 2 lasers C 02 laser
As illustrated in Table 2.2, the EOSINT P700 has a larger capacity to produce
parts than the Sinterstation 2500 HiQ. The utilisation of the building envelope
depends on the part size, volume, and the number of parts. It could vary from
build to build but generally the total volume of parts in a build is relatively small
and within 10% to 20% of the building chamber volume, which means that 80%
to 90% of the material is not sintered and could be recycled and used in the next
builds. However, this material deteriorates during the LS process and has to be
discarded after being used several times.
25
Chapter 2: The technology and applications o f laser sintering
In general, there are three processing stages common to any of the two LS
technologies, which significantly influence the material ageing process.
Warm-up stage
In the Sinterstation 2500 HiQ design, the cylinder heater is set to maintain a
temperature of 130°C while the piston heater is set to 150°C. A specific feature in
this design is that the cylinder heater covers approximately a half of the total build
height. Once the piston is outside the heater area, the first half of a full build starts
to cool down while the other half is still being processed. By contrast, the building
chamber or the frame in the EOSINT P700 design is removable and has heaters
integrated in the frame walls and piston. The temperature is maintained at 140°C
throughout the whole build. This facilitates a uniform temperature distribution and
therefore uniform shrinkage distribution but the unsintered material is subjected to
a higher temperature for much longer. In the Sinterstation 2500 HiQ design, the
material stays at high temperature for a shorter time but the resulting non-uniform
shrinkage disturbs the part accuracy in full height builds.
In both systems the part bed temperature is controlled in the region of 130°C to
150°C to prevent fast cooling rates and therefore excessive distortion and warping
of the parts.
26
Chapter 2: The technology and applications o f laser sintering
Build stage
During the whole build stage the powdered material is subjected to heat and the
part bed temperature is constantly controlled to be 10°C to 15°C below the Tm
with ±1 accuracy. It facilitates the LS process because only a small amount of
energy is needed from the laser to melt and fuse the powder particles. This also
prevents higher thermal gradients and part distortion. Based on the slice data
obtained from the STL file, a CO2 laser (or two lasers in the EOSINT P700
design) draws the part cross section and sinters the powder particles. Then the
roller spreads a new layer on the part bed for the next laser scanning process.
Cooling-down stage
The already sintered parts and the powdered material, which is not sintered, stay
in the building chamber for another period of time at relatively high temperature.
Temperature measurements experimentally taken at the end of a full EOSINT
P700 build in different places o f the part bed show that the powder temperature in
the middle area approximately 50mm from the frame walls is between 160°C and
180°C. Within 50mm distance from the walls, the temperature is between 140°C
to 160°C.
The parts can be removed and cleaned only after the temperature reaches the
material Tg or below 45°C to 60°C, otherwise they could warp or deform. The
cooling-down time can vary depending on the building height, part volume and
the LS machine design. For a typical build, it could be from 25 to 50 hours.
27
Chapter 2: The technology and applications o f laser sintering
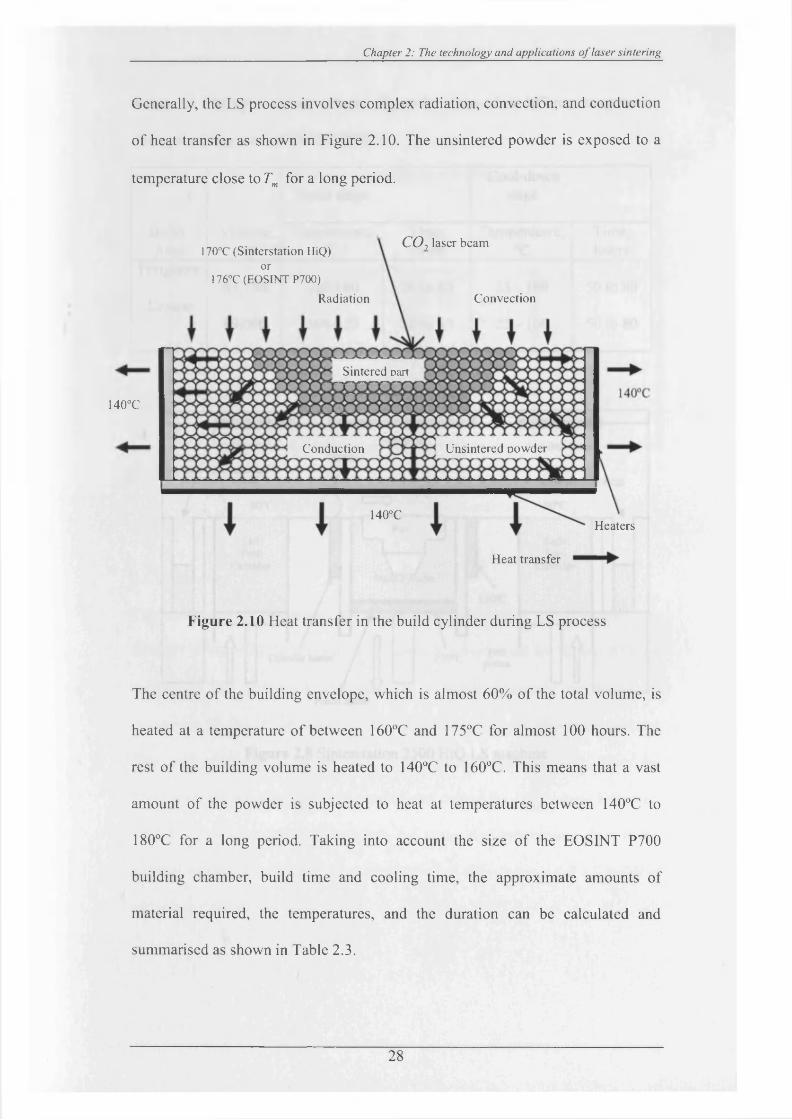
Generally, the LS process involves complex radiation, convection, and conduction
of heat transfer as shown in Figure 2.10. The unsintered powder is exposed to a
temperature close to Tm for a long period.
CO-, laser beam170°C (Sinterstation HiQ)
or176°C (EOSINT P700)
ConvectionRadiation
Sintered Dart
140°C
Conduction Unsintered oowder
140°CHeaters
Heat transfer
Figure 2.10 Heat transfer in the build cylinder during LS process
The centre of the building envelope, which is almost 60% of the total volume, is
heated at a temperature of between 160°C and 175°C for almost 100 hours. The
rest of the building volume is heated to 140°C to 160°C. This means that a vast
amount of the powder is subjected to heat at temperatures between 140°C to
180°C for a long period. Taking into account the size of the EOSINT P700
building chamber, build time and cooling time, the approximate amounts of
material required, the temperatures, and the duration can be calculated and
summarised as shown in Table 2.3.
28
Chapter 2: The technology and applications o f laser sintering
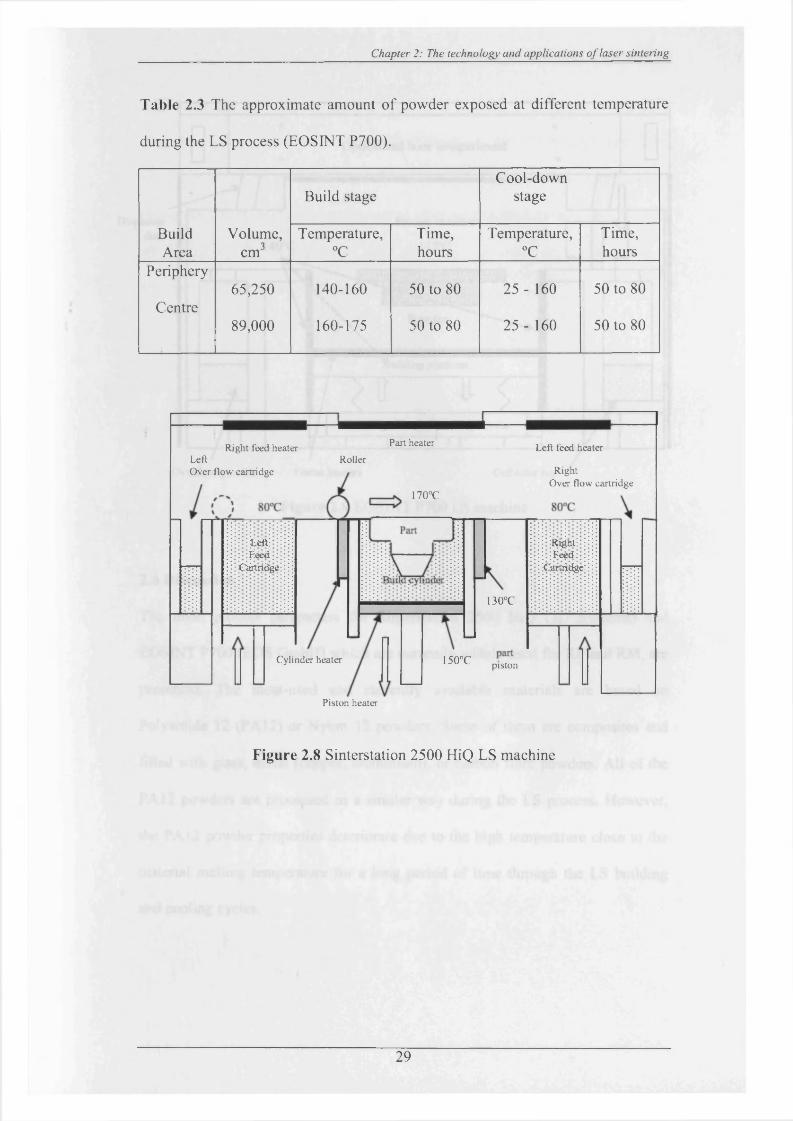
Table 2.3 The approximate amount of powder exposed at different temperature
during the LS process (EOSINT P700).
Build stageCool-down
stage
BuildArea
Volume,cm3
Temperature,°C
Time,hours
Temperature,°C
Time,hours
Periphery65,250 140-160 50 to 80 25 - 160 50 to 80
Centre89,000 160-175 50 to 80 25 - 160 50 to 80
Right feed heaterLeftOver flow cartridge
Part heaterRoller
Left feed heater
Right Over flow cartridge
170°C
LfcftFjdedi:
Cartridge
Rightfeed
Cartridge
130°C
Cylinder heater 150°C piston
Piston heater
Figure 2.8 Sinterstation 2500 HiQ LS machine
29
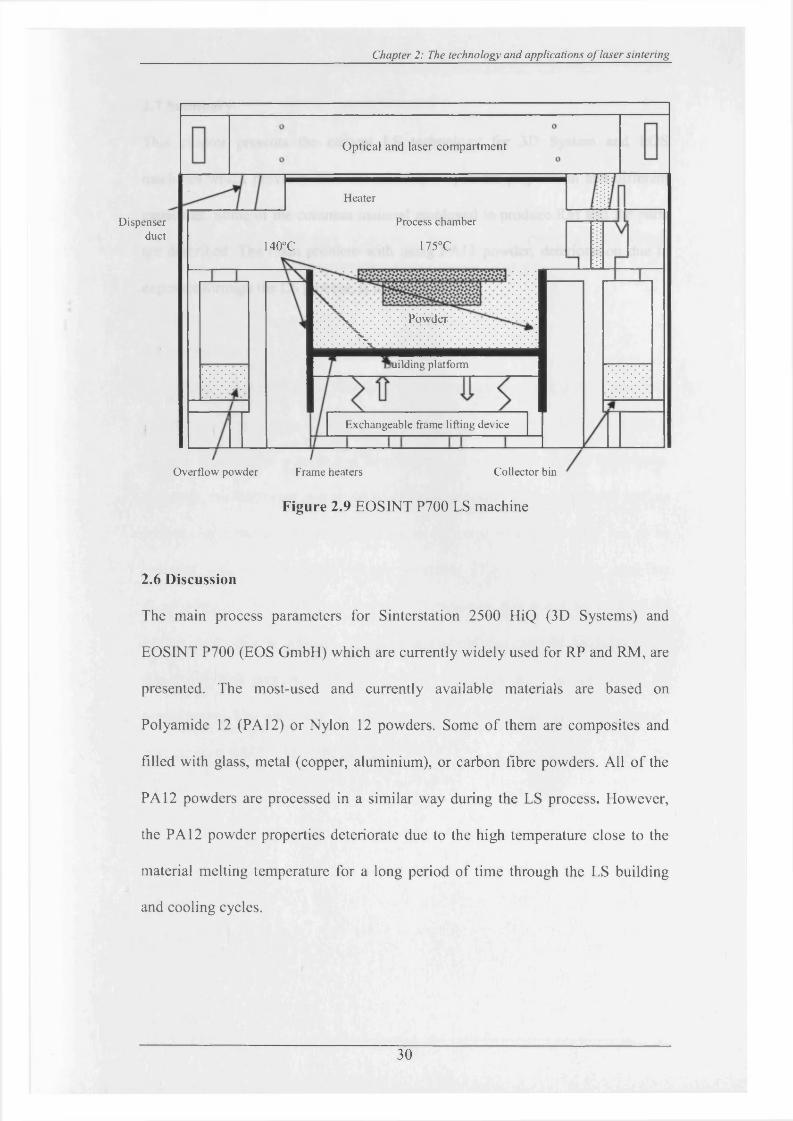
Chapter 2: The technology and applications o f laser sintering
Optical and laser compartment
Heater
Process chamberDispenserduct
175°C140°C
Powder
luilding platform
Exchangeable frame lifting device
Overflow powder Frame heaters Collector bin
Figure 2.9 EOSINT P700 LS machine
2.6 Discussion
The main process parameters for Sinterstation 2500 HiQ (3D Systems) and
EOSINT P700 (EOS GmbH) which are currently widely used for RP and RM, are
presented. The most-used and currently available materials are based on
Polyamide 12 (PA 12) or Nylon 12 powders. Some of them are composites and
filled with glass, metal (copper, aluminium), or carbon fibre powders. All of the
PA 12 powders are processed in a similar way during the LS process. However,
the PA 12 powder properties deteriorate due to the high temperature close to the
material melting temperature for a long period of time through the LS building
and cooling cycles.
30
Chapter 2: The technology and applications o f laser sintering
2.7 Summary
This chapter presents the current LS technology for 3D System and EOS
machines which provides different methods of powder preparation and different
capacities. Some of the common material employed to produce RM and RP parts
are described. The main problem with using PA 12 powder, deterioration due to
exposure through the LS process, is highlighted.
31
Chapter 3: Explanations o f the “Orange Peel ”phenomenon in LS process
CHAPTER 3
EXPLANATIONS OF THE “ORANGE PEEL” PHENOMENON IN THE
LASER SINTERING PROCESS (LS)
3.1 Preliminaries
Laser sintering (LS) is one of the most versatile rapid prototyping (RP) processes
currently available. One of the main advantages of employing this technology is
that the non-sintered powder can be recycled and reused for another fabrication.
However, the fabricated part could be affected by rough and unacceptable surface
texture. As a result, the parts may have to be scrapped and the build has to be
repeated with a higher ratio of new material. This causes delays, customer
disappointment, and additional expense. Sometimes, this could be avoided by
adding plenty of new material. However, this would also raise the production cost
due to the high proportion of the material cost within the total cost of the LS
manufacture. The main aim of this chapter is to investigate the “orange peel”
phenomenon which affects the LS part.
32

Chapter 3: Explanations o f the “Orange P eel” phenomenon in LS process
3.2 Previous studies of the “Orange Peel” phenomenon in the LS process
Prior to this study, the ageing of PA 12 powder and more efficient recycling in the
LS process had not been thoroughly investigated. Most previous research was
carried out using PA 12 as the focus for the study of the thermal, mechanical, and
chemical properties which affect the part surface finish. Table 3.1 shows a
summary of related research reviewed in this section.
Gomet [Gomet, 2002a,b] studied how the mechanical and thermal properties of
LS parts from DuraForm (trade name of a PA 12 powder produced by 3D Systems
[DTM, 1996a and 3D system, 2006]) material were affected by the number of
builds or the number of times the powder was used. In the Sinterstation 2000, the
first LS machine available from DTM Corporation, the use of a plastometer,
which is a commonly used tool in the injection-moulding industry, was suggested
in order to measure the flow ability of the used DuraForm (DF™) powder. One of
the conclusions was that after approximately 7-8 builds the properties of the
processed material were so badly deteriorated that it should be fully discarded.
However, the effect of the duration of each individual build, or the total LS
processing time, on the powder and part properties was not investigated.
33
Chapter 3: Explanations o f the ‘‘Orange Peel" phenomenon in LS process
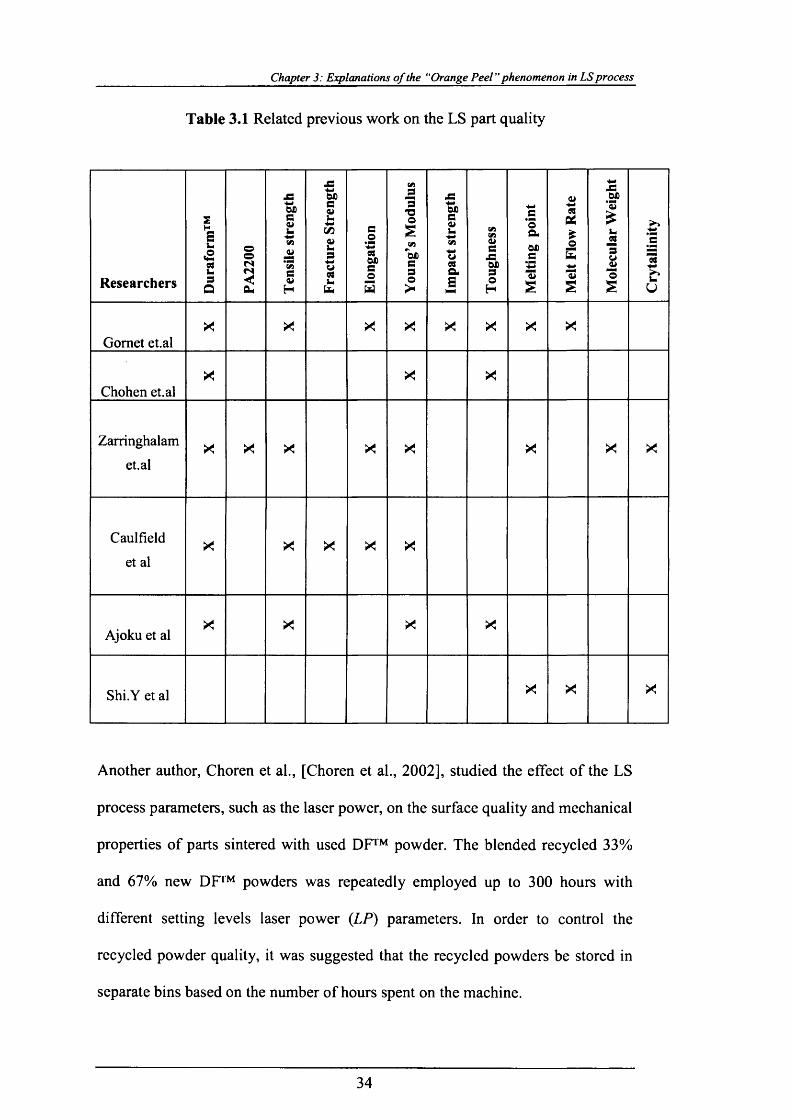
Table 3.1 Related previous work on the LS part quality
Researchers
2HsUaWusQ PA
2200
Tens
ile
stre
ngth
Frac
ture
St
reng
th
Elon
gatio
n
You
ng’s
Mod
ulus
Impa
ct st
reng
th
Toug
hnes
s
Melt
ing
poin
t
Melt
Flow
R
ate
Mol
ecul
ar W
eigh
t
Cry
talli
nity
X X X X X X X XGomet et.al
X X XChohen et.al
Zarringhalam X X X X X X X Xet.al
Caulfield X X X X Xet al
X X X XAjoku et al
Shi.Y et al X X X
Another author, Choren et al., [Choren et al., 2002], studied the effect of the LS
process parameters, such as the laser power, on the surface quality and mechanical
properties of parts sintered with used DF™ powder. The blended recycled 33%
and 67% new DF™ powders was repeatedly employed up to 300 hours with
different setting levels laser power (LP) parameters. In order to control the
recycled powder quality, it was suggested that the recycled powders be stored in
separate bins based on the number of hours spent on the machine.
34

Chapter 3: Explanations o f the “Orange P eel” phenomenon in LS process
A new PA12-based material, known as HP A, was developed by Y.Shi et al.,
[Y.Shi et al, 2004]. Shi et.al studied the effect of the properties of the polymer
materials on the quality of LS parts by using an HRPS-III laser sintering system
(developed by Huangzhong University). It is reported that the higher melt
viscosity obtained was due to the increased M w, which causes higher warp, part
shrinkage and slightly less part density (about 1.8%). It is also suggested that a
particle size of 75-100 pm is thought suitable in order to produce higher part
density and accuracy. However, the properties of HPA (PA12-based) were not
presented and it is important to compare them with those of PA2200 and DF™.
Zarringhalam, et al., studied thermal and, mechanical properties and
microstructure of the test part fabricated from new and used DF™ and PA2200
produced by EOS (Electro-Optical Systems) GmbH [Zarringhalam et al., 2006].
The microstructure, which indicates the porosity of the LS parts, was studied. The
mechanical and thermal properties of the test parts composed of both new and
used powders were compared.
Ajoku et al [Ajoku et al., 2006] studied the comparison of mechanical properties
of the LS test part produced by LS and injection moulding using the new DF™
powder. The LS part has higher strength and superior toughness than the injection
moulded part. However, the cross-sectional test part made of LS was found to
have high porosity due to uneven heat distribution, inadequate heat supply from
the laser and insufficient process temperatures.
35
Chapter 3: Explanations o f the "Orange P eel” phenomenon in LS process
Caulfield et al [Caulfield et al, 2006] employed the new DF™ powder to
investigate the influence of different levels of Energy Density (ED) and part build
orientations to the part surface, as well as the mechanical properties of the sintered
parts, using the Sinterstation 2500 HiQ. The increase in material property values
found increased in ED correlate with the increase in material density.
Gomet et at, Chohen at el and Zarringhalam, et.al reported that the higher
molecular weight and the melting point of the samples notably influenced the melt
flow rate. They also reported that the mechanical properties of the sintered part do
not significantly change depending on the LS part surface finish.
36
Chapter 3: Explanations o f the “Orange Peel ’’phenomenon in LS process
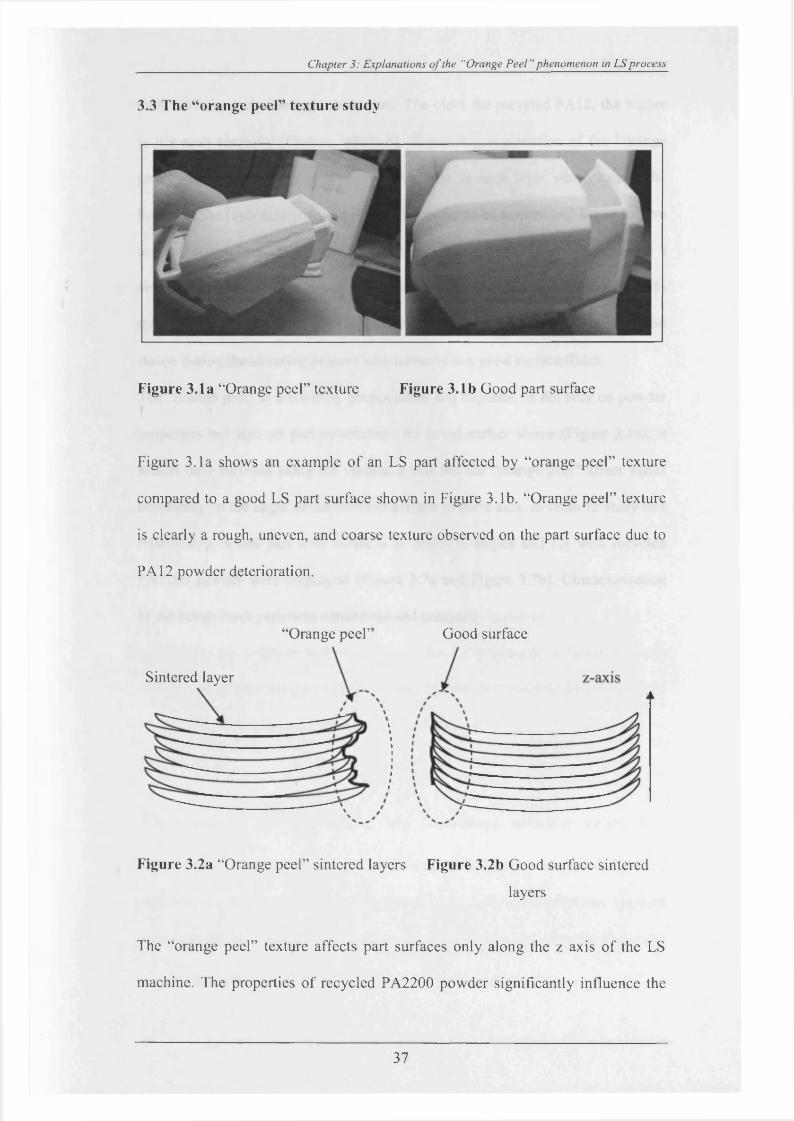
3.3 The “orange peel” texture study
Figure 3.1a “Orange peel” texture Figure 3.1b Good part surface
Figure 3.1a shows an example of an LS part affected by “orange peel” texture
compared to a good LS part surface shown in Figure 3.1b. “Orange peel” texture
is clearly a rough, uneven, and coarse texture observed on the part surface due to
PA 12 powder deterioration.
“Orange peel’
Sintered layer
Good surface
Figure 3.2a “Orange peel” sintered layers Figure 3.2b Good surface sintered
layers
The “orange peel” texture affects part surfaces only along the z axis of the LS
machine. The properties of recycled PA2200 powder significantly influence the
37
Chapter 3: Explanations o f the “Orange Peel ’’phenomenon in LS process
melt viscosity and sintering mechanism. The older the recycled PA12, the higher
is it’s melt viscosity [Gomet, 2002a,b]. A possible explanation of the “orange
peel” texture is a variation of the viscous flow in each layer which causes the
border of the layer sintered with recycled powder to be uneven and hence to give
a poor, coarse, surface finish (Figure 3.2a). By contrast, Figure 3.2b shows a
sintered layer employing less deteriorated powder (blended 35 % new with 65%
recycled) which has lower melt viscosity. This causes better powder melting and
fusion during the sintering process which results in a good surface finish.
The “orange peel” is a complex phenomenon and depends on not only on powder
properties but also on part orientation. As noted earlier above (Figure 3.1a), it
affects only surfaces along the vertical z axis but the “orange peel” affect varies
depending on the angle of the sintered surface to the z axis. In order to study this
relationship, a test part with surfaces at different angles and LS with recycled
PA2200 powder were employed (Figure 3.7a and Figure 3.7b). Characterisation
of the bench mark parts was carried out and analysed.
38
Chapter 3: Explanations o f the "Orange Peel "phenomenon in LS process
45° angl
surface
90° angl
surface surface
70° angled
30° angled
surface
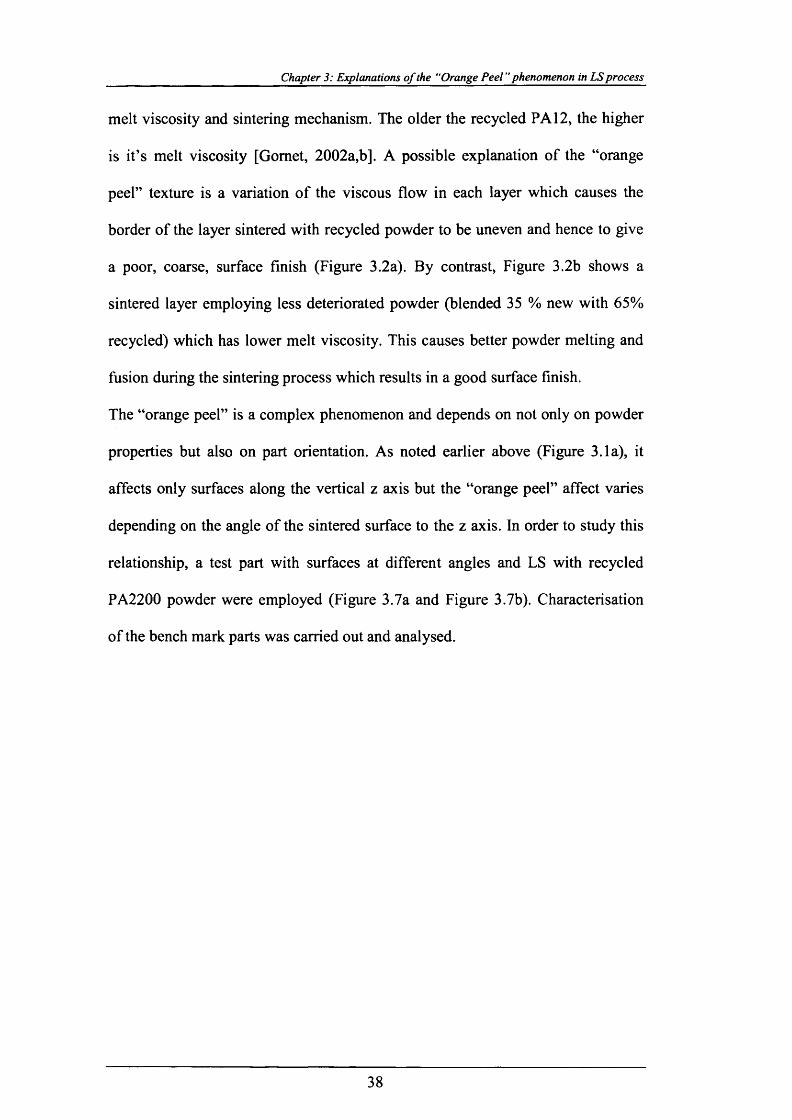
Figure 3.3 Test part with surfaces at the different angles
As shown in Figure 3.3, the 90° angled parts exhibit the worst “orange peel”
texture compared to all other surfaces. Signs o f “orange peel” texture were
observed also for the 45° angled surfaces. The surface at 30° was not affected by
this phenomenon.
3.4 The significant of MWD to the melting viscosity in LS process
In general, the polymer melt viscosity in the LS process is a function o f the
average molecular weight, which follows the Mark-Houwink equation below
[Cogswell, 1981; Brydson., 1999; Shi et al, 2004]:
Where ^0is the melting viscosity, M - the average molecular weight, K a
constant that depends upon the type o f polymer and the exponent n, a function o f
polymer geometry, and which varies from 0.2 to 3.5. From this formula, the melt
viscosity and M - o f the polymer are found to be closely related to the molecular
weight distribution {MWD) which affects the LS part surface.
39
Chapter 3: Explanations o f the “Orange P eel” phenomenon in LS process
Number of molecules( M „ ) ,
Molecular weight of molecule (M w), g/mol
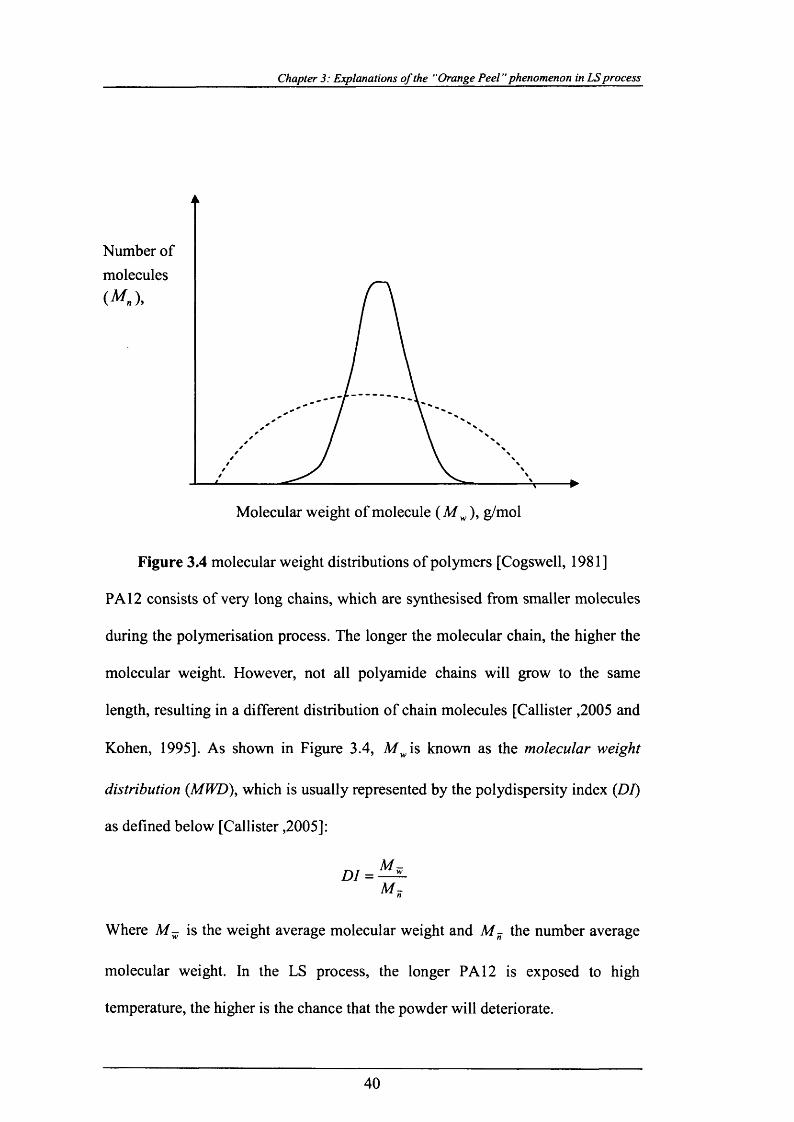
Figure 3.4 molecular weight distributions of polymers [Cogswell, 1981]
PA 12 consists of very long chains, which are synthesised from smaller molecules
during the polymerisation process. The longer the molecular chain, the higher the
molecular weight. However, not all polyamide chains will grow to the same
length, resulting in a different distribution of chain molecules [Callister ,2005 and
Kohen, 1995]. As shown in Figure 3.4, A/^is known as the molecular weight
distribution (MWD), which is usually represented by the polydispersity index (DP)
as defined below [Callister ,2005]:
Where M - is the weight average molecular weight and M - the number average
molecular weight. In the LS process, the longer PA 12 is exposed to high
temperature, the higher is the chance that the powder will deteriorate.
40
Chapter 3: Explanations o f the "Orange Peel" phenomenon in LS process
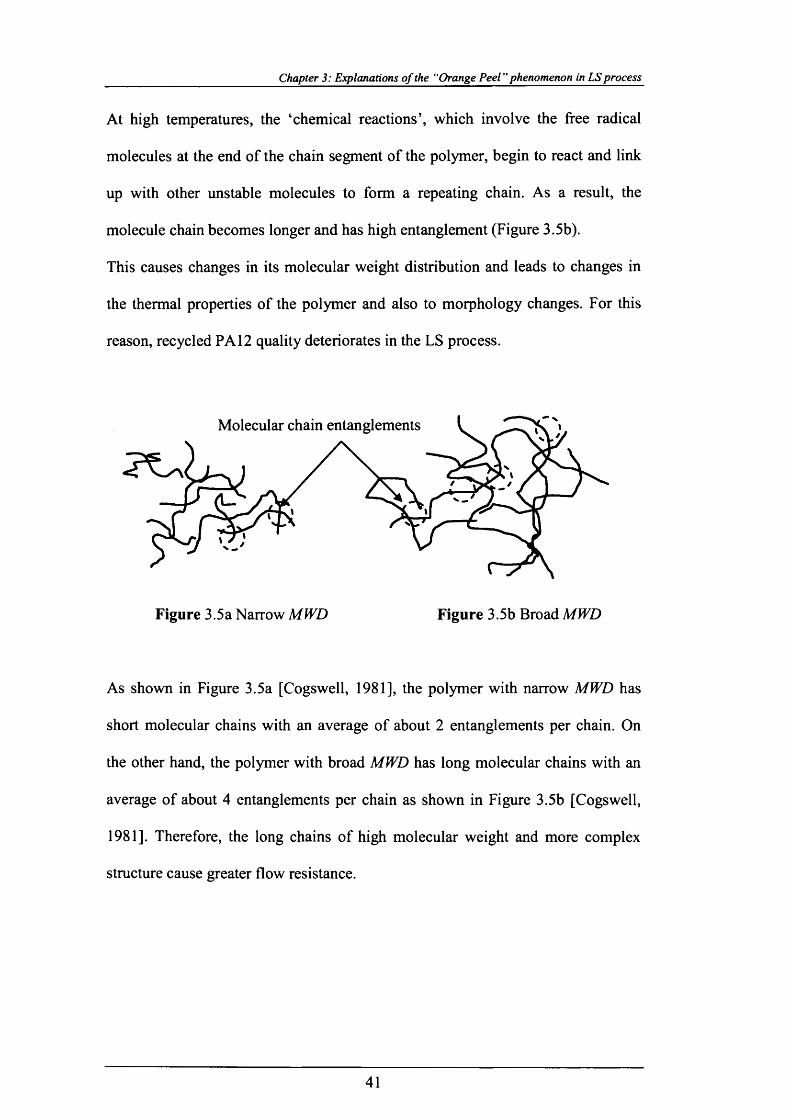
At high temperatures, the ‘chemical reactions’, which involve the free radical
molecules at the end of the chain segment of the polymer, begin to react and link
up with other unstable molecules to form a repeating chain. As a result, the
molecule chain becomes longer and has high entanglement (Figure 3.5b).
This causes changes in its molecular weight distribution and leads to changes in
the thermal properties of the polymer and also to morphology changes. For this
reason, recycled PA 12 quality deteriorates in the LS process.
Molecular chain entanglements
Figure 3.5a Narrow MWD Figure 3.5b Broad MWD
As shown in Figure 3.5a [Cogswell, 1981], the polymer with narrow MWD has
short molecular chains with an average of about 2 entanglements per chain. On
the other hand, the polymer with broad MWD has long molecular chains with an
average of about 4 entanglements per chain as shown in Figure 3.5b [Cogswell,
1981]. Therefore, the long chains of high molecular weight and more complex
structure cause greater flow resistance.
41

Chapter 3: Explanations o f the “Orange Peel" phenomenon in LS process
3.5 Experimental results and discussion
3.5.1 Methodology and equipment used
The aim of this experiment is to study the relationship of MWD, melting heat or
heat of fusion, to the external and internal microstructure of good parts and parts
affected by an “orange peel” texture. DSC was employed to measure the MWD by
using GPC [ISO 16014], The heat of fusion was measured using DSC [ISO 11357]
and the PA2200 powder quality, which has been employed this experiment, was
measured using the melt flow rate indexer [ISO 1133]. These equipments are also
used for the particular purposes of this research in succeeding chapters. The
details of the procedures which relate to these equipments will be explained later
in section 4.3.1.1, 4.3.1.2, and 4.3.2.3. For the purpose of “orange peel” texture
study, refreshed and twice-used PA2200 is employed to produce the specially
designed bench parts. As the average particle size of PA2200 is approximately
50pm, the microstructure of the “orange peel” texture of the sintered part may be
studied using a Scanning Electron Microscope (SEM) [Tontowi and Childs,
2001].
42
Chapter 3: Explanations o f the “Orange Peel" phenomenon in LS process
3.5.1.1 Scanning Electron Microscope (SEM) examinations.
For all examinations, a thin layer of gold was sputtered on substrates using an
auto sputter apparatus. Two pieces of equipment have been used consecutively.
The first is a Bio-Rad SC500 for gold coating of the specimens and the second is
an EMSCOPE SC500 for image capture. It is employed to characterise the
individual powders and to analyse the surface morphology and microstructure of
the sintered bench part. All LS fabricated bench parts were examined under high
vacuum conditions. A low voltage (lOkV) was chosen to minimise heat damage to
the sample [Ho et al.,1999].
Powder
The LS material investigated in this study is PA12-based powder PA2200
supplied by EOS GmbH. In the preparation of the specimens for the SEM, a small
amount of powder was stuck on a holder using glue. Then it is coated with gold in
the Bio-Rad SC500. The specimen is now ready to be fixed in the EMSCOPE
SC500 Cam Scan. Table 3.2 shows the melting viscosity of the two different
powder grades in the experiment. These two powders were employed to produce
the bench parts.
Table 3.2 PA2200 powder melt viscosities
Powder Melt flow rate (MFR),
g/lOmin
Refresh PA2200 33.15(35% New + 65% once Recycled)
Twice used PA2200 17.41
43
Chapter 3: Explanations o f the "Orange Peel ’’phenomenon in LS process
3.5.2 Design and fabrication of bench part
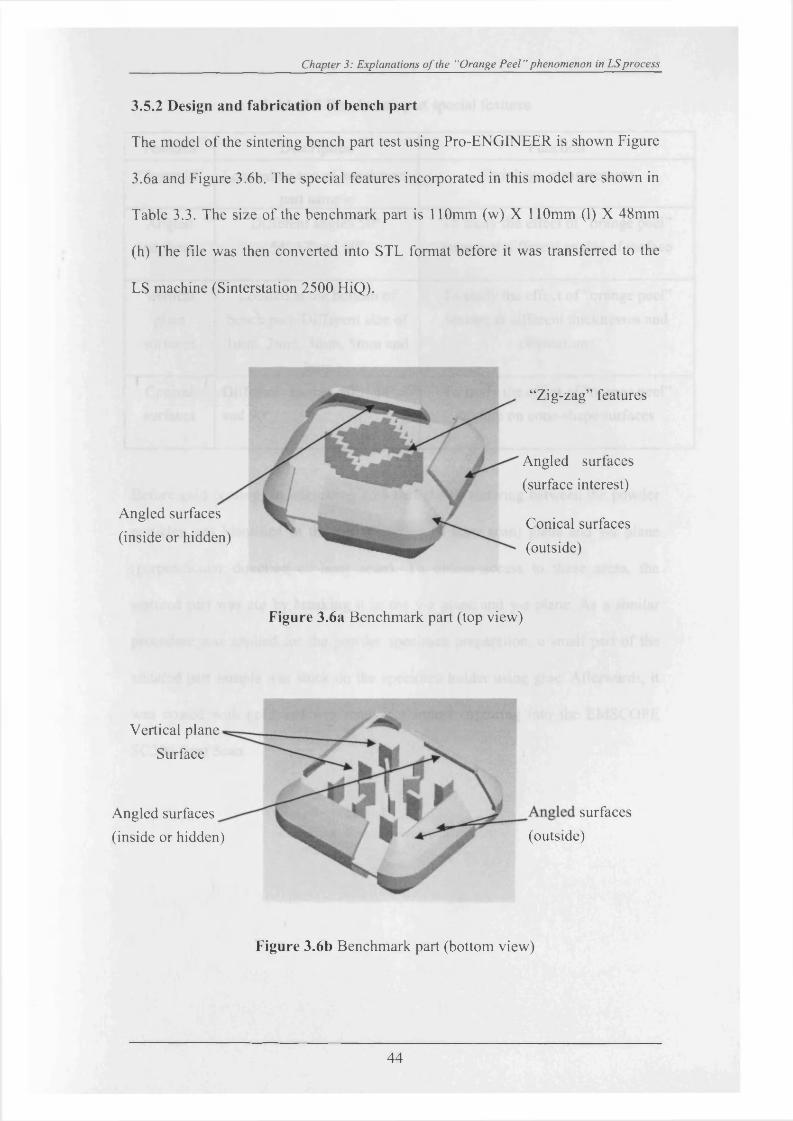
The model o f the sintering bench part test using Pro-ENGINEER is shown Figure
3.6a and Figure 3.6b. The special features incorporated in this model are shown in
Table 3.3. The size o f the benchmark part is 110mm (w) X 110mm (1) X 48mm
(h) The file was then converted into STL format before it was transferred to the
LS machine (Sinterstation 2500 HiQ).
Angled surfaces
(inside or hidden)
Angled surfaces
(surface interest)
Conical surfaces
(outside)
“Zig-zag” features
Figure 3.6a Benchmark part (top view)
Vertical plane
Surface
Angled surfaces
(inside or hidden)
surfaces
(outside)
Figure 3.6b Benchmark part (bottom view)
44
Chapter 3: Explanations o f the “Orange Peel" phenomenon in LS process
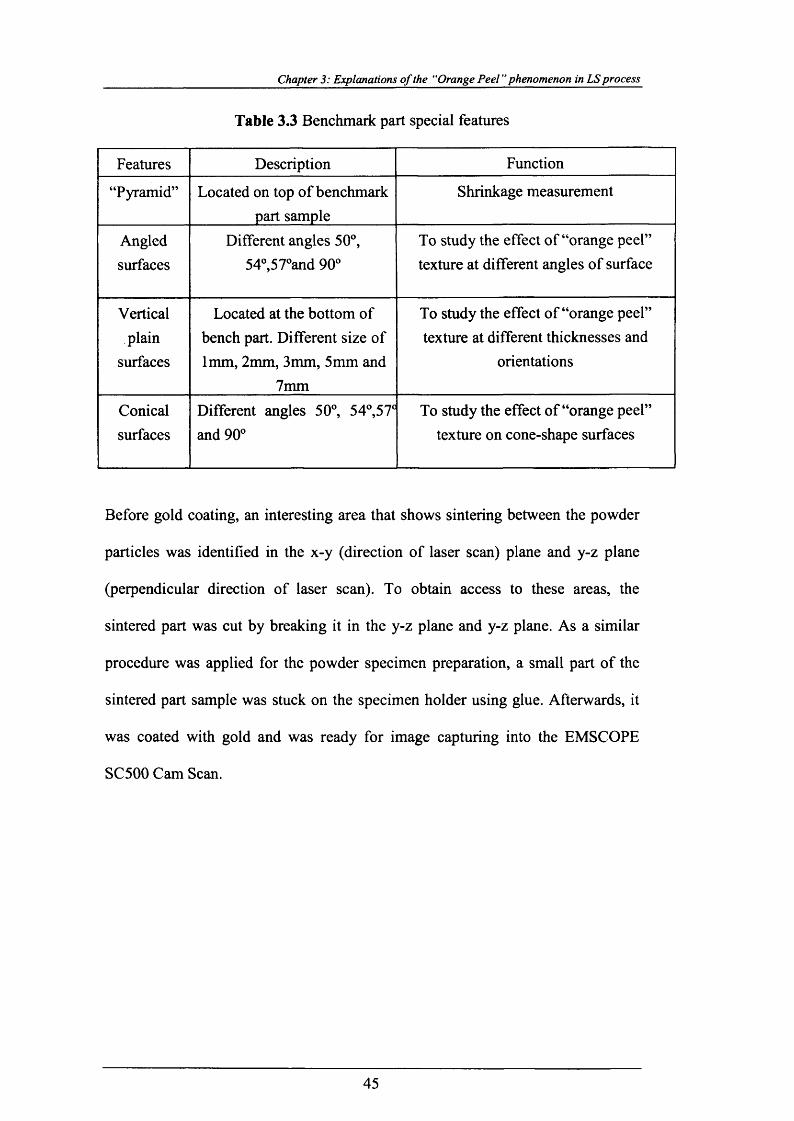
Table 3.3 Benchmark part special features
Features Description Function
“Pyramid” Located on top of benchmark part sample
Shrinkage measurement
Angledsurfaces
Different angles 50°, 54°,57°and 90°
To study the effect of “orange peel” texture at different angles of surface
Verticalplain
surfaces
Located at the bottom of bench part. Different size of 1mm, 2mm, 3mm, 5mm and
7mm
To study the effect of “orange peel” texture at different thicknesses and
orientations
Conicalsurfaces
Different angles 50°, 54°,57£ and 90°
To study the effect of “orange peel” texture on cone-shape surfaces
Before gold coating, an interesting area that shows sintering between the powder
particles was identified in the x-y (direction of laser scan) plane and y-z plane
(perpendicular direction of laser scan). To obtain access to these areas, the
sintered part was cut by breaking it in the y-z plane and y-z plane. As a similar
procedure was applied for the powder specimen preparation, a small part of the
sintered part sample was stuck on the specimen holder using glue. Afterwards, it
was coated with gold and was ready for image capturing into the EMSCOPE
SC500 Cam Scan.
45
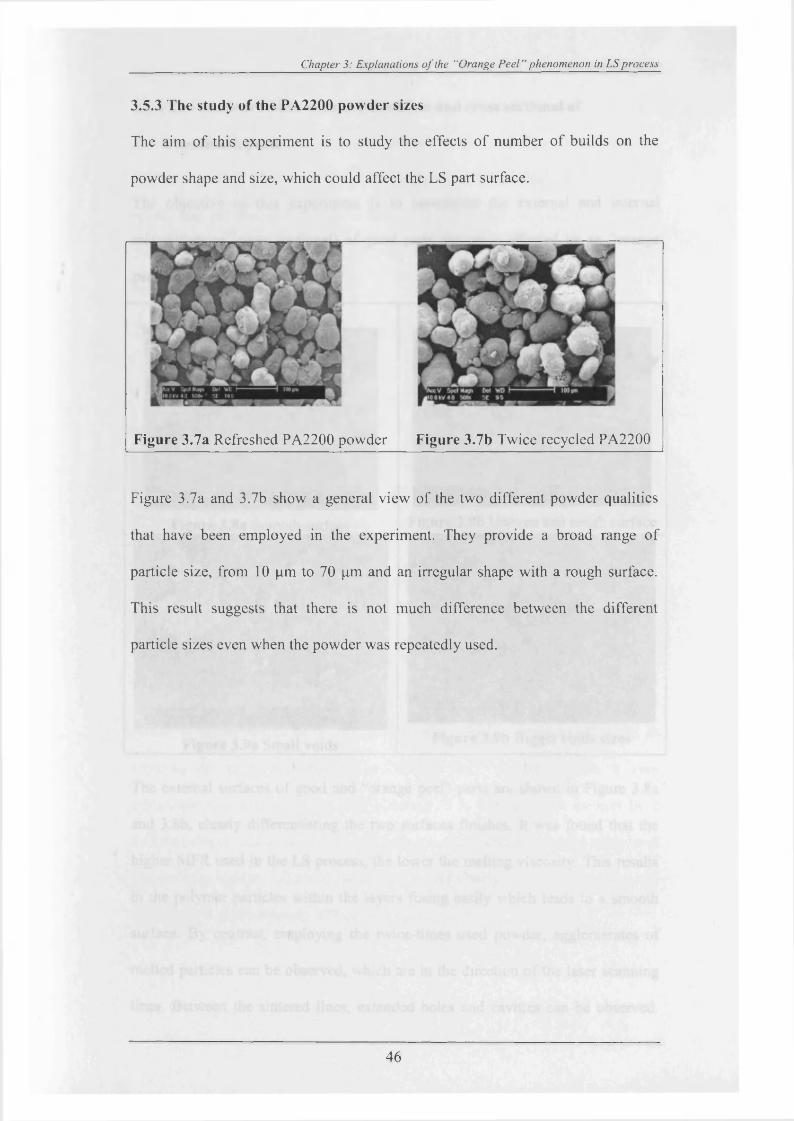
Chapter 3: Explanations o f the “Orange P ee l” phenomenon in LS process
3.5.3 The study of the PA2200 powder sizes
The aim o f this experiment is to study the effects o f number o f builds on the
powder shape and size, which could affect the LS part surface.
Figure 3.7a Refreshed PA2200 powder Figure 3.7b Twice recycled PA2200
Figure 3.7a and 3.7b show a general view o f the two different powder qualities
that have been employed in the experiment. They provide a broad range o f
particle size, from 10 pm to 70 pm and an irregular shape with a rough surface.
This result suggests that there is not much difference between the different
particle sizes even when the powder was repeatedly used.
46
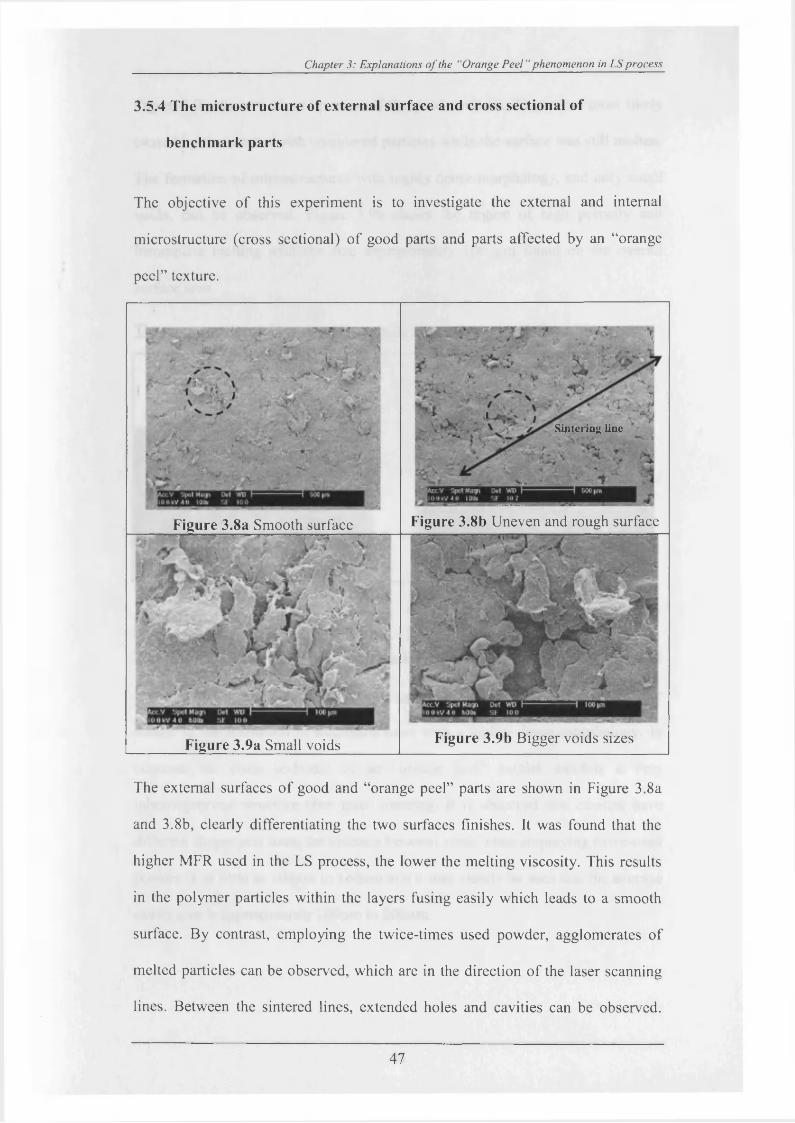
Chapter 3: Explanations o f the “Orange Peel" phenomenon in LS process
3.5.4 The microstructure of external surface and cross sectional of
benchmark parts
The objective o f this experiment is to investigate the external and internal
microstructure (cross sectional) o f good parts and parts affected by an “orange
peel” texture.
Sintering line
Figure 3.8b Uneven and rough surface
Figure 3.9b Bigger voids sizesFigure 3.9a Small voids
Figure 3.8a Smooth surface
The external surfaces o f good and “orange peel” parts are shown in Figure 3.8a
and 3.8b, clearly differentiating the two surfaces finishes. It was found that the
higher MFR used in the LS process, the lower the melting viscosity. This results
in the polymer particles within the layers fusing easily which leads to a smooth
surface. By contrast, employing the twice-times used powder, agglomerates o f
melted particles can be observed, which are in the direction o f the laser scanning
lines. Between the sintered lines, extended holes and cavities can be observed.
47
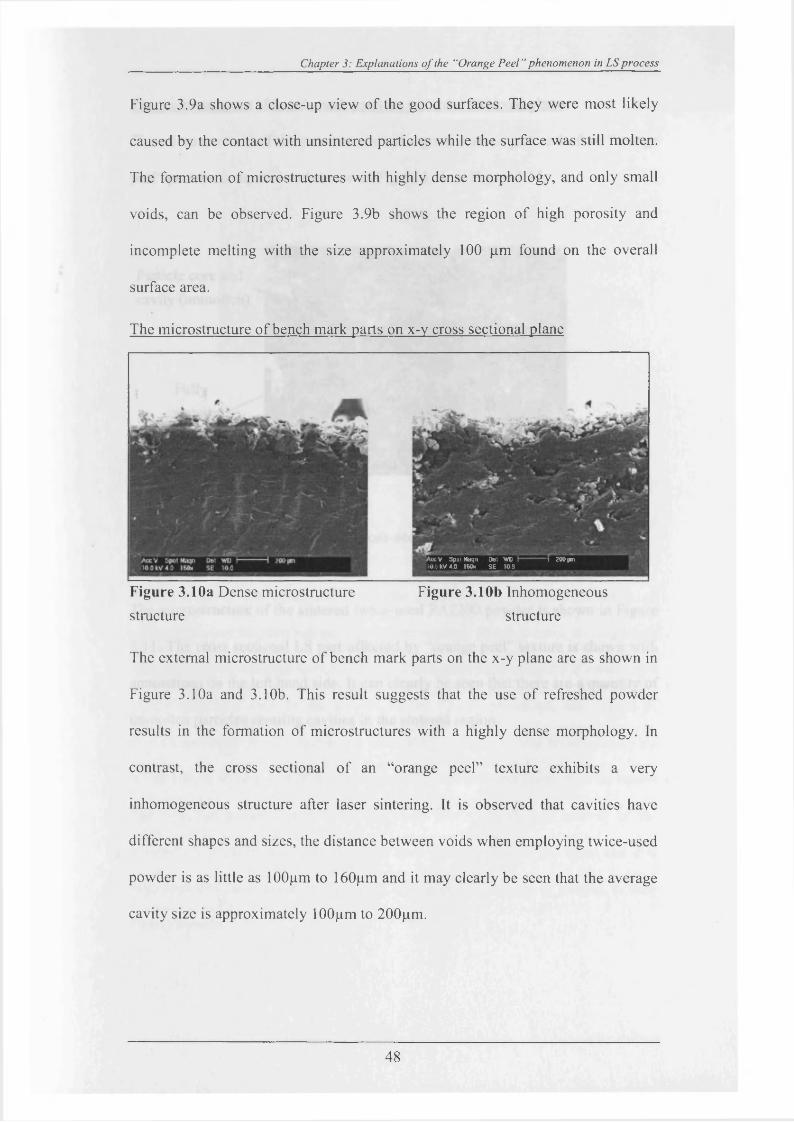
Chapter 3: Explanations o f the "Orange Peel’’ phenomenon in LS process
Figure 3.9a shows a close-up view o f the good surfaces. They were most likely
caused by the contact with unsintered particles while the surface was still molten.
The formation o f microstructures with highly dense morphology, and only small
voids, can be observed. Figure 3.9b shows the region o f high porosity and
incomplete melting with the size approximately 100 pm found on the overall
surface area.
The microstructure o f bench mark parts on x-v cross sectional plane
T 200 pmV Spui Maqn Del WO10 0 kV 4 0 I60« SE 103
Figure 3.10a Dense microstructure Figure 3.10b Inhomogeneous
structure structure
The external microstructure o f bench mark parts on the x-y plane are as shown in
Figure 3.10a and 3.10b. This result suggests that the use o f refreshed powder
results in the formation o f microstructures with a highly dense morphology. In
contrast, the cross sectional o f an “orange peel” texture exhibits a very
inhomogeneous structure after laser sintering. It is observed that cavities have
different shapes and sizes, the distance between voids when employing twice-used
powder is as little as 100pm to 160pm and it may clearly be seen that the average
cavity size is approximately 100pm to 200pm.
48
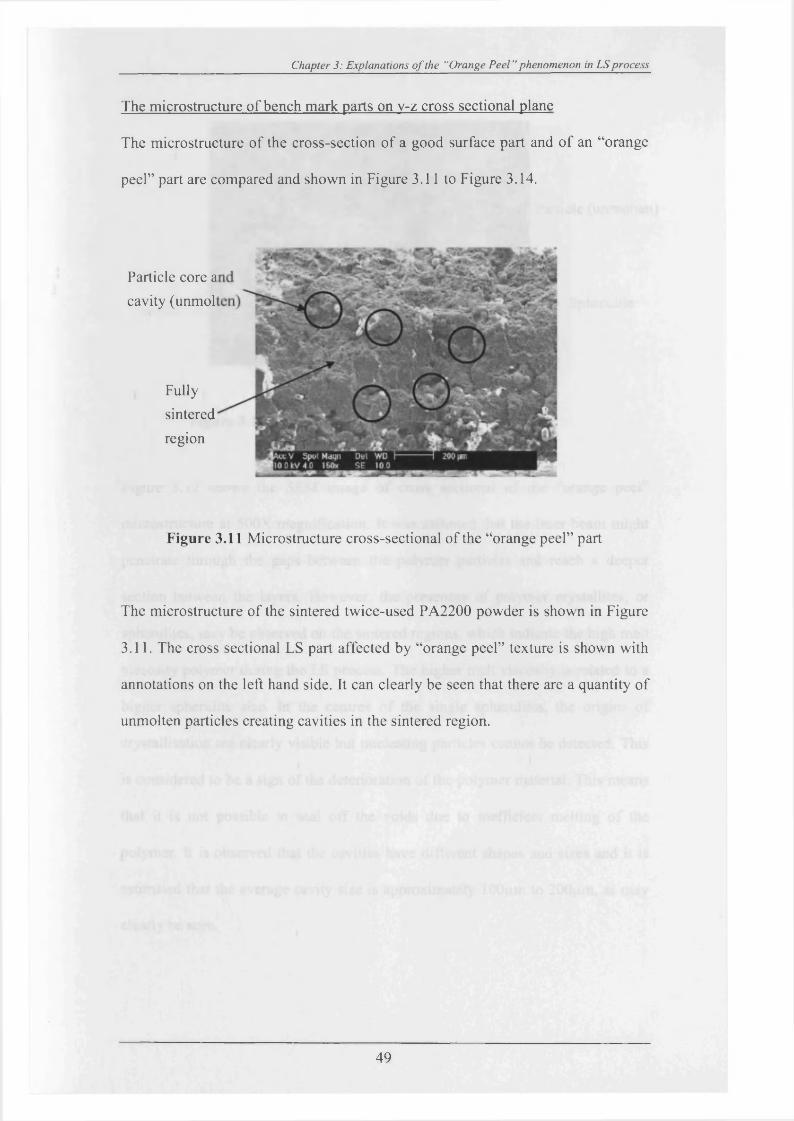
Chapter 3: Explanations o f the "Orange Peel "phenomenon in LS process
The microstructure o f bench mark parts on v-z cross sectional plane
The microstructure o f the cross-section o f a good surface part and o f an “orange
peel” part are compared and shown in Figure 3.11 to Figure 3.14.
Particle core a
cavity (unmol
Fully
sintered
region
Figure 3.11 Microstructure cross-sectional of the “orange peel” part
The microstructure o f the sintered twice-used PA2200 powder is shown in Figure
3.11. The cross sectional LS part affected by “orange peel” texture is shown with
annotations on the left hand side. It can clearly be seen that there are a quantity o f
unmolten particles creating cavities in the sintered region.
49
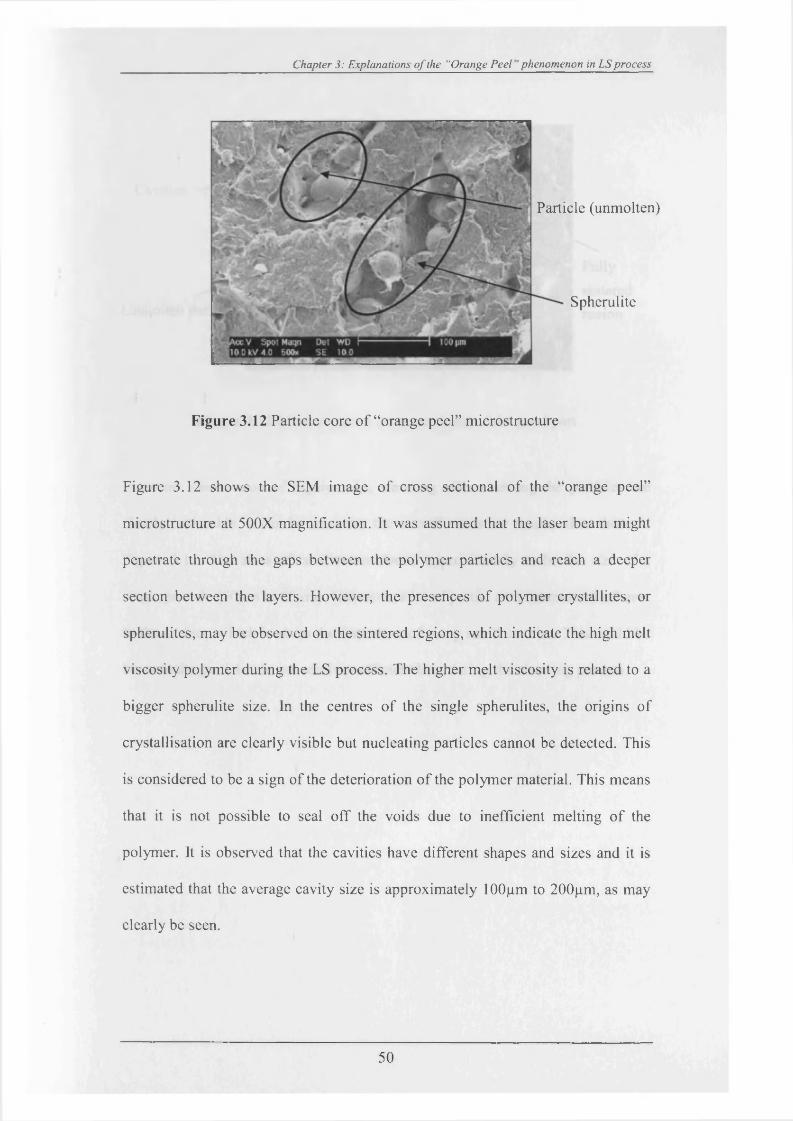
Chapter 3: Explanations o f the “Orange Peel ’ phenomenon in LS process
Particle (unmolten)
Spherulite
Figure 3.12 Particle core o f “orange peel” microstructure
Figure 3.12 shows the SEM image o f cross sectional o f the “orange peel”
microstructure at 500X magnification. It was assumed that the laser beam might
penetrate through the gaps between the polymer particles and reach a deeper
section between the layers. However, the presences o f polymer crystallites, or
spherulites, may be observed on the sintered regions, which indicate the high melt
viscosity polymer during the LS process. The higher melt viscosity is related to a
bigger spherulite size. In the centres o f the single spherulites, the origins o f
crystallisation are clearly visible but nucleating particles cannot be detected. This
is considered to be a sign o f the deterioration o f the polymer material. This means
that it is not possible to seal o ff the voids due to inefficient melting o f the
polymer. It is observed that the cavities have different shapes and sizes and it is
estimated that the average cavity size is approximately 100pm to 200pm, as may
clearly be seen.
50
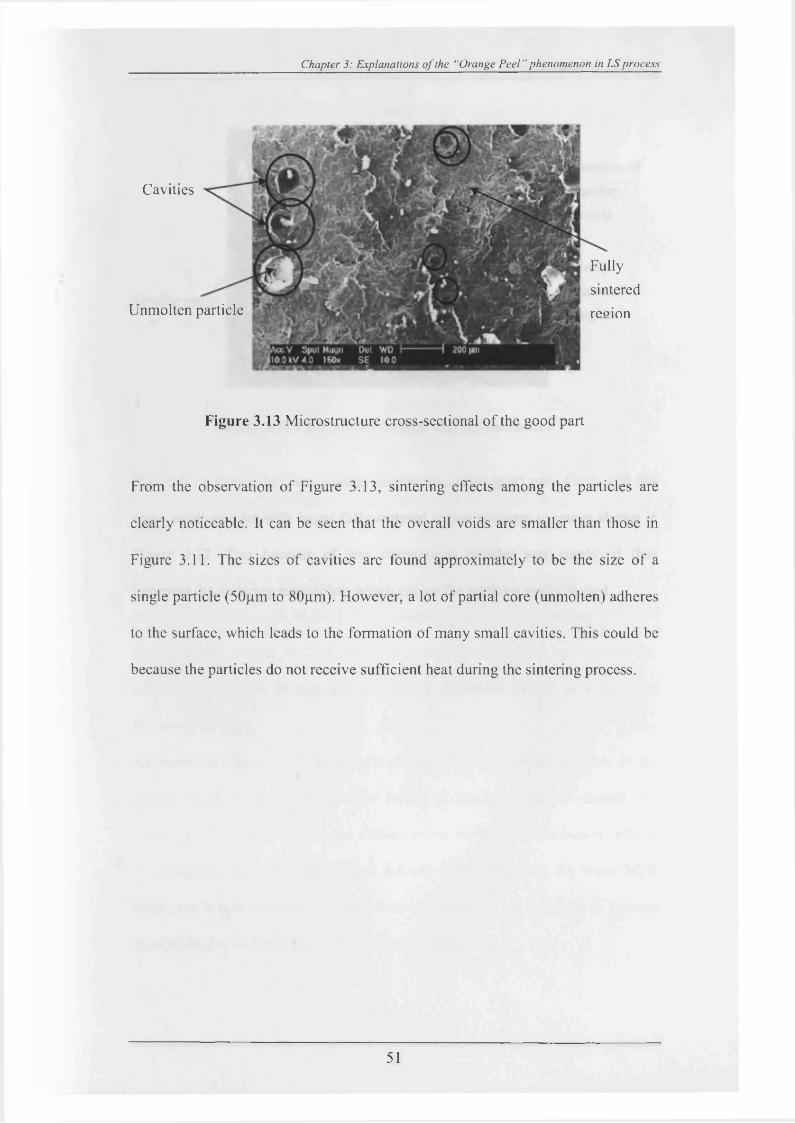
Chapter 3: Explanations o f the “Orange P ee l’’ phenomenon in LS process
Unmolten particle
Fully
sintered
reeion
Cavities
Figure 3.13 Microstructure cross-sectional o f the good part
From the observation o f Figure 3.13, sintering effects among the particles are
clearly noticeable. It can be seen that the overall voids are smaller than those in
Figure 3.11. The sizes o f cavities are found approximately to be the size o f a
single particle (50pm to 80pm). However, a lot o f partial core (unmolten) adheres
to the surface, which leads to the formation o f many small cavities. This could be
because the particles do not receive sufficient heat during the sintering process.
51
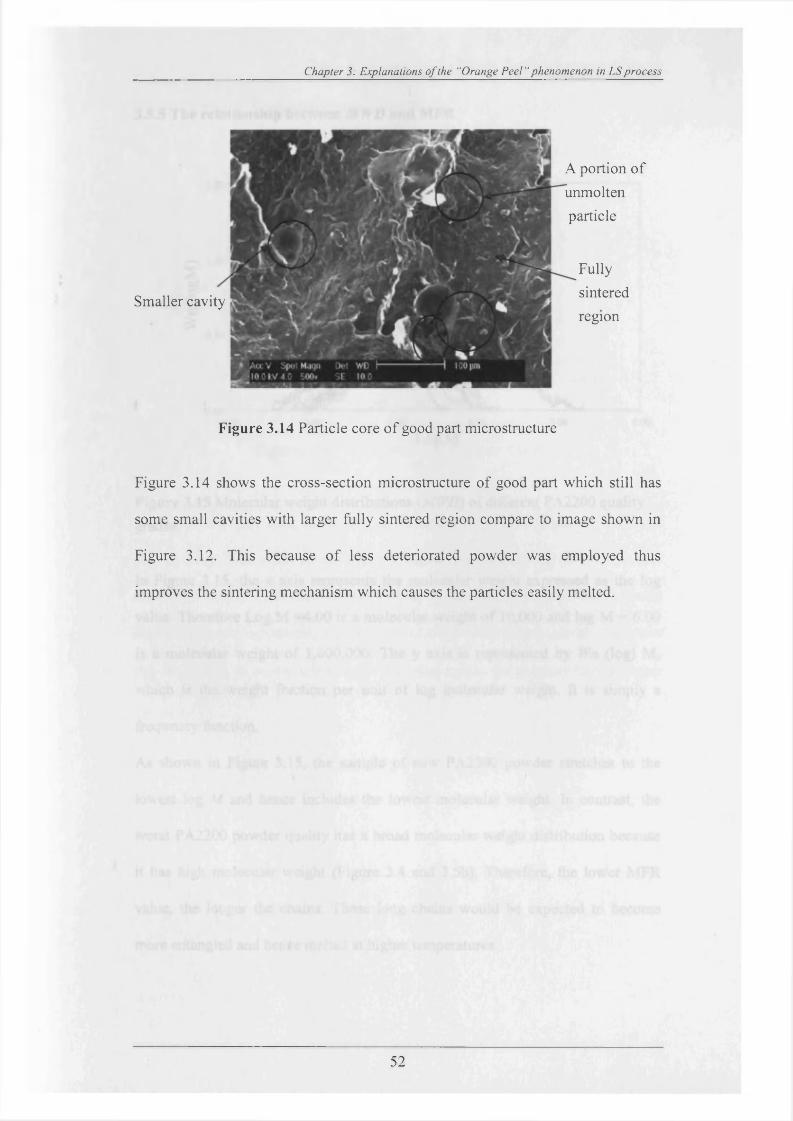
Chapter 3: Explanations o f the “Orange P eel” phenomenon in LS process
A portion o f
unmolten
particle
Fully
sinteredSmaller cavityregion
Figure 3.14 Particle core o f good part microstructure
Figure 3.14 shows the cross-section microstructure o f good part which still has
some small cavities with larger fully sintered region compare to image shown in
Figure 3.12. This because o f less deteriorated powder was employed thus
improves the sintering mechanism which causes the particles easily melted.
52
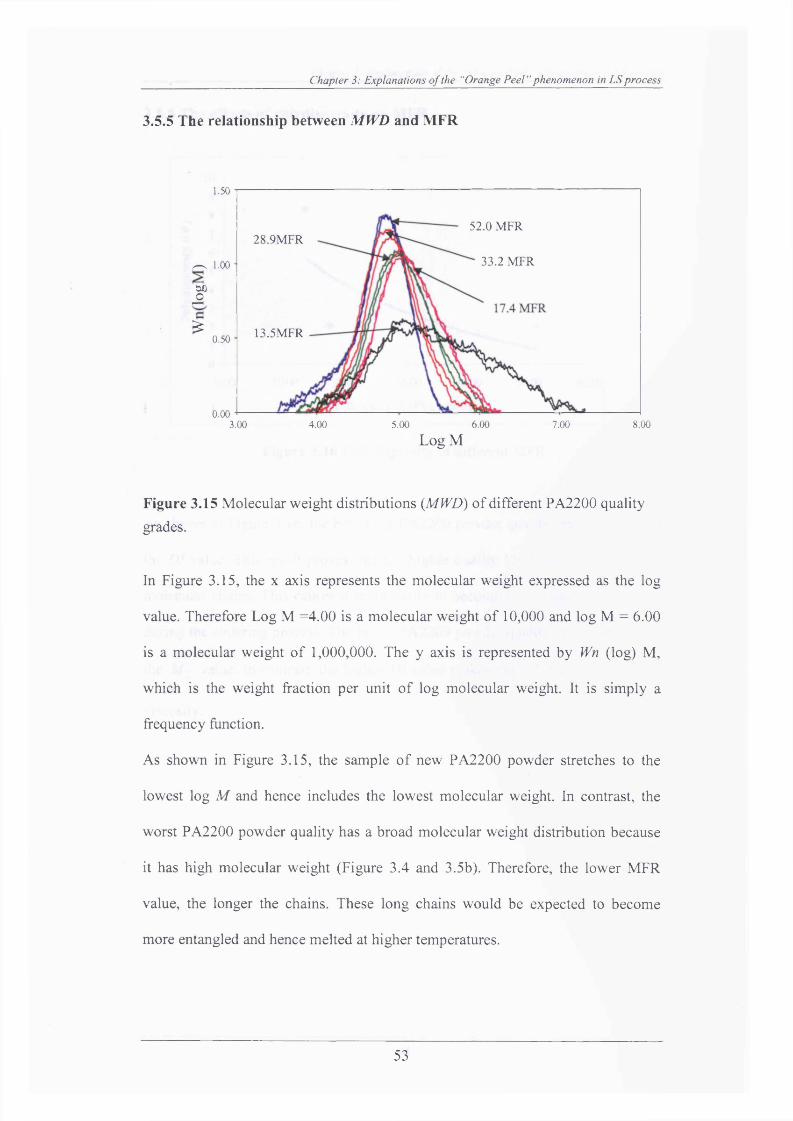
Chapter 3: Explanations o f the ‘‘Orange P eel” phenomenon in LS process
3.5.5 The relationship between MWD and MFR
1.50
^ 1.00
W)JD
£0.50
0.003.00 4.00 5.00 6.00 7.00 8.00
Log M
Figure 3.15 Molecular weight distributions (MWD) o f different PA2200 quality
grades.
In Figure 3.15, the x axis represents the molecular weight expressed as the log
value. Therefore Log M =4.00 is a molecular weight o f 10,000 and log M = 6.00
is a molecular weight o f 1,000,000. The y axis is represented by Wn (log) M,
which is the weight fraction per unit o f log molecular weight. It is simply a
frequency function.
As shown in Figure 3.15, the sample o f new PA2200 powder stretches to the
lowest log M and hence includes the lowest molecular weight. In contrast, the
worst PA2200 powder quality has a broad molecular weight distribution because
it has high molecular weight (Figure 3.4 and 3.5b). Therefore, the lower MFR
value, the longer the chains. These long chains would be expected to become
more entangled and hence melted at higher temperatures.
52.0 MFR28.9M FR
33.2 MFR
13.5MFR
53
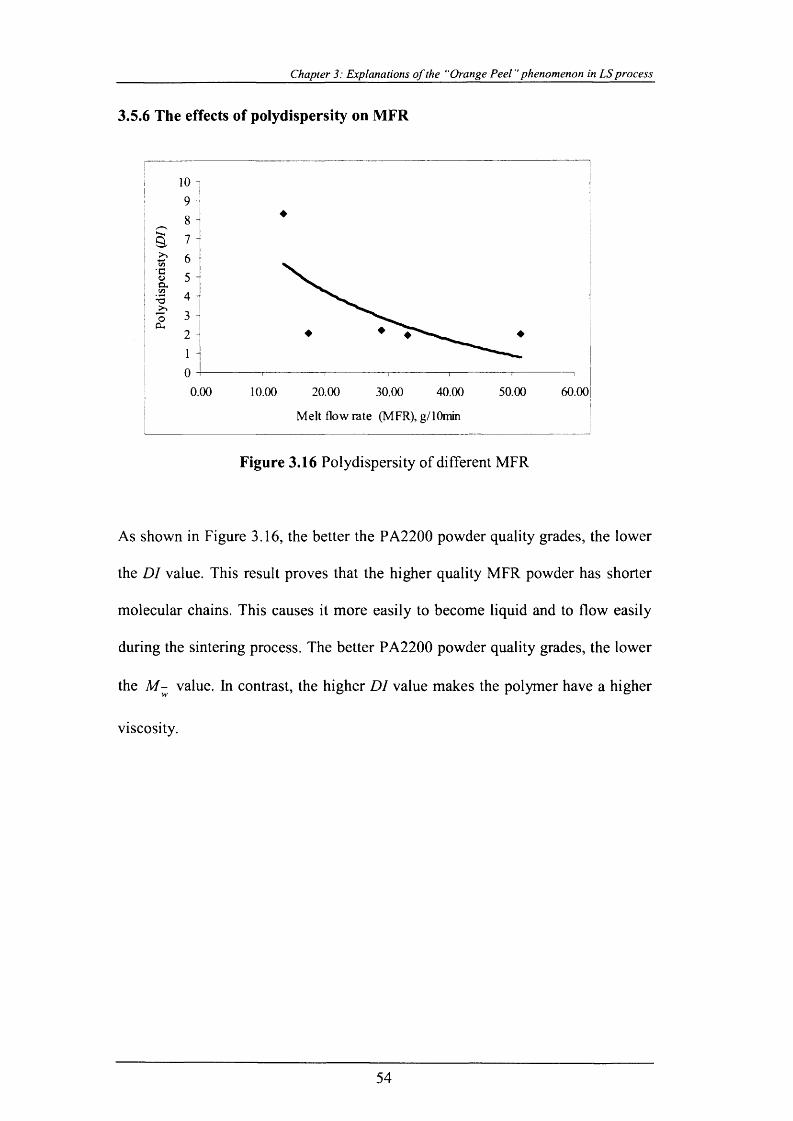
Chapter 3: Explanations o f the “Orange P e e l"phenomenon in LS process
3.5.6 The effects of polydispersity on MFR
Vi•coQ.Vi
•oOeu,
T
0.00 10.00 20.00 30.00 40.00
M elt flow rate (MFR), g/lOrrrin
50.00 60.00
Figure 3.16 Polydispersity o f different MFR
As shown in Figure 3.16, the better the PA2200 powder quality grades, the lower
the DI value. This result proves that the higher quality MFR powder has shorter
molecular chains. This causes it more easily to become liquid and to flow easily
during the sintering process. The better PA2200 powder quality grades, the lower
the M - value. In contrast, the higher D l value makes the polymer have a higher
viscosity.
54
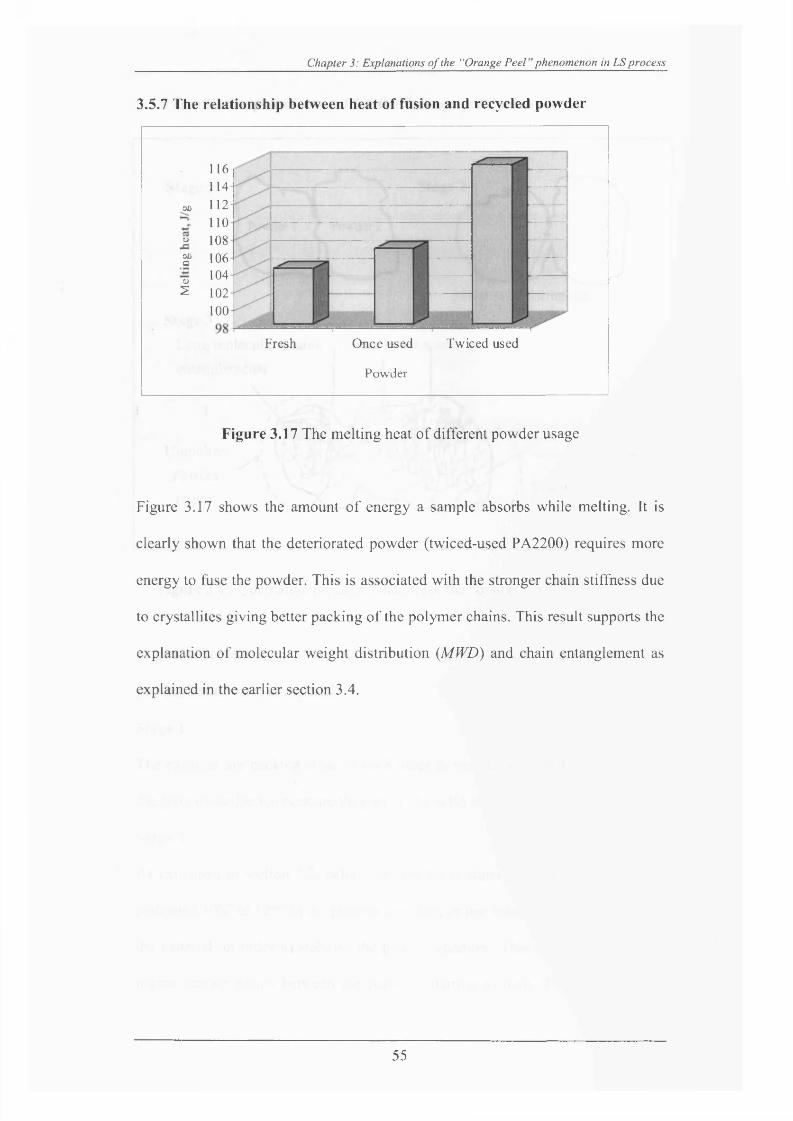
Chapter 3: Explanations o f the "Orange Peel ’phenomenon in LS process
3.5.7 The relationship between heat of fusion and recycled powder
1161 114
112 110 108
106 104
102 100
00
o00co2
Twiced usedFresh Once used
Powder
Figure 3.17 The melting heat o f different powder usage
Figure 3.17 shows the amount o f energy a sample absorbs while melting. It is
clearly shown that the deteriorated powder (twiced-used PA2200) requires more
energy to fuse the powder. This is associated with the stronger chain stiffness due
to crystallites giving better packing o f the polymer chains. This result supports the
explanation o f molecular weight distribution (MWD) and chain entanglement as
explained in the earlier section 3.4.
55
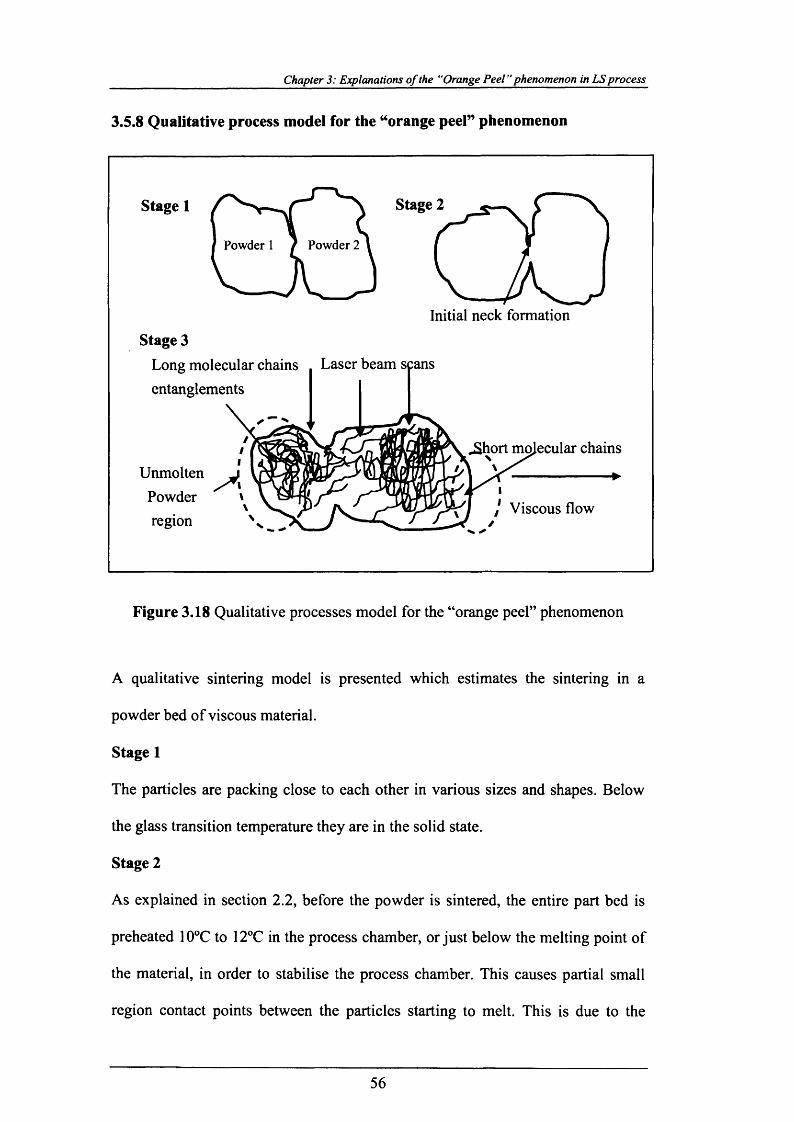
Chapter 3: Explanations o f the “Orange Peel" phenomenon in LS process
3.5.8 Qualitative process model for the “orange peel” phenomenon
Stage 1
Powder 2Powder 1
Stage 2
Initial neck formation
Stage 3Long molecular chains Laser beam s entanglements
:ans
PowderUnmolten
region
ecular chains---------------p
I Viscous flow
Figure 3.18 Qualitative processes model for the “orange peel” phenomenon
A qualitative sintering model is presented which estimates the sintering in a
powder bed of viscous material.
Stage 1
The particles are packing close to each other in various sizes and shapes. Below
the glass transition temperature they are in the solid state.
Stage 2
As explained in section 2.2, before the powder is sintered, the entire part bed is
preheated 10°C to 12°C in the process chamber, or just below the melting point of
the material, in order to stabilise the process chamber. This causes partial small
region contact points between the particles starting to melt. This is due to the
56

Chapter 3: Explanations o f the “Orange P eel’’ phenomenon in LS process
breaking of the van der Waal chains which leads to the initial sintering neck
formation developed during this stage.
Stage three: Viscous flow takes place at this stage. This is due to laser beam
scans of the particles and laser energy absorption by the particles, leading to the
significant growth of the neck formation between particles which then transforms
into viscous flows. In liquids, an increase in temperature is associated with the
weakening of bonds between molecules. Since these bonds contribute to viscosity,
which decreases rapidly with an increase in temperature, it has been assumed that
the amount of absorbed energy was large enough to melt the entire polymer and to
form a stable sintering neck. Then, the polymers particles are completely melted
and the fluid phase starts.
However, due to the limitation in the LS process, not all the powder particles are
fused during the sintering process which still formed porosity as can be seen in
Figure 3.13. This can be explained by the fact that the higher MFR value means a
lower melting viscosity. This is strongly related to the shorter molecular chains
and therefore to fewer entanglements. The sintering occurs by viscous flow. Then
the material moves from large pores to smaller ones and dominates the vacancy.
Also, employing deteriorated powder is influenced by its thermal history. This is
associated with the higher DI and higher chains entanglements (Figure 3.5b).
Moreover, the heat of fusion and the amount of heat absorbed to melt the
polymers is affected by the variation in thickness of the lamella in the crystalline
region (Figure 4.2 and Figure 4.5). This is the result of the mobility of the
polymer molecules and is more restricted. Variations of the viscous flow may be
expected, which lead to the formation of unmolten particle cores as clearly
observed in the microstructure of the “orange peel” texture (Figure 3.1a).
57

Chapter 3: Explanations o f the “Orange P eel” phenomenon in LS process
3.6 Discussion
This research investigated the potential causes of the “orange peel” phenomenon
which affects some LS fabricated parts. Refreshed and twice-used PA2200
powder with 33.15MFR and 17.41 MFR respectively were employed to produce
the bench parts. Visual inspection of an SEM micrograph showed that the overall
particle powder sizes of these different melting viscosities were not influenced by
the number of builds.
The experimental work shows that powder quality, melt viscosity, and part
surface finish are correlated. The following main tendencies can be observed. A
lower heat of fusion is required to melt the higher MFR value (33.15g/10min)
powder. Lowering melting viscosity generally leads to a more highly dense
microstructure and exhibits dimensional stability and is non-porous. The
physically refreshed powders that were sintered exhibited good interconnectivity.
Necking between the PA2200 particles indicated good sintering effects. This
means that better sintering mechanism is achieved if a powder with lower melt
viscosity is chosen. The explanation of the “orange peel” phenomenon can be
understood by a multistage model. At first, nearly all laser energy is absorbed by
particle powders, causing local heating. Then, a part of the particle is melted,
which leads to complete melting of the surrounding polymer and the formation of
sintering necks. At the build stage, the melt viscosity of the polymer is
significantly influenced by the molecular chain entanglement (spherulites), the
higher molecular weight, and longer molecular chains, leading to higher viscosity
and to the formation of agglomerates of melted particles. This results in an
inhomogeneous structure and a poor coherence sintered region.
58
Chapter 3: Explanations o f the “Orange Peel" phenomenon in LS process
3.7 Summary
The “orange peel” phenomenon is one of the main constrains in the LS process as
it causes unacceptable LS parts’ surface quality. It happens when deteriorated
PA 12 powder is employed in the LS process. This chapter reported on the effect
of the properties of the PA12 polymer on the microstructure of the parts which are
affected by the “orange peel” phenomenon.
59
Chapter 4: Deterioration o f PA12 properties in the LS process
CHAPTER 4
DETERIORATION OF POLYAMIDE 12 POWDER PROPERTIES IN
THE LASER SINTERING PROCESS
4.1 Preliminaries
LS with Polyamide 12 (PA 12) or Nylon 12 powders is a widely used technology
for the rapid prototyping of functional parts and recently has become very
attractive for the rapid manufacturing o f small batches of plastic parts. However,
the plastic powder’s properties deteriorate during the LS process, which requires
new material to be mixed with the recycled one. An insufficient amount of new
powder results in poor quality and rough surface finishing known as “orange peel”
of the produced parts. This chapter presents an experimental study of the
deterioration or ageing of PA 12 powder properties in the LS process. The
influence of temperature, time, and the number of exposures on these properties is
investigated. The main aim of this research is to develop a methodology of
controlling the input material properties that will ensure consistent and good
quality of the fabricated parts.
60
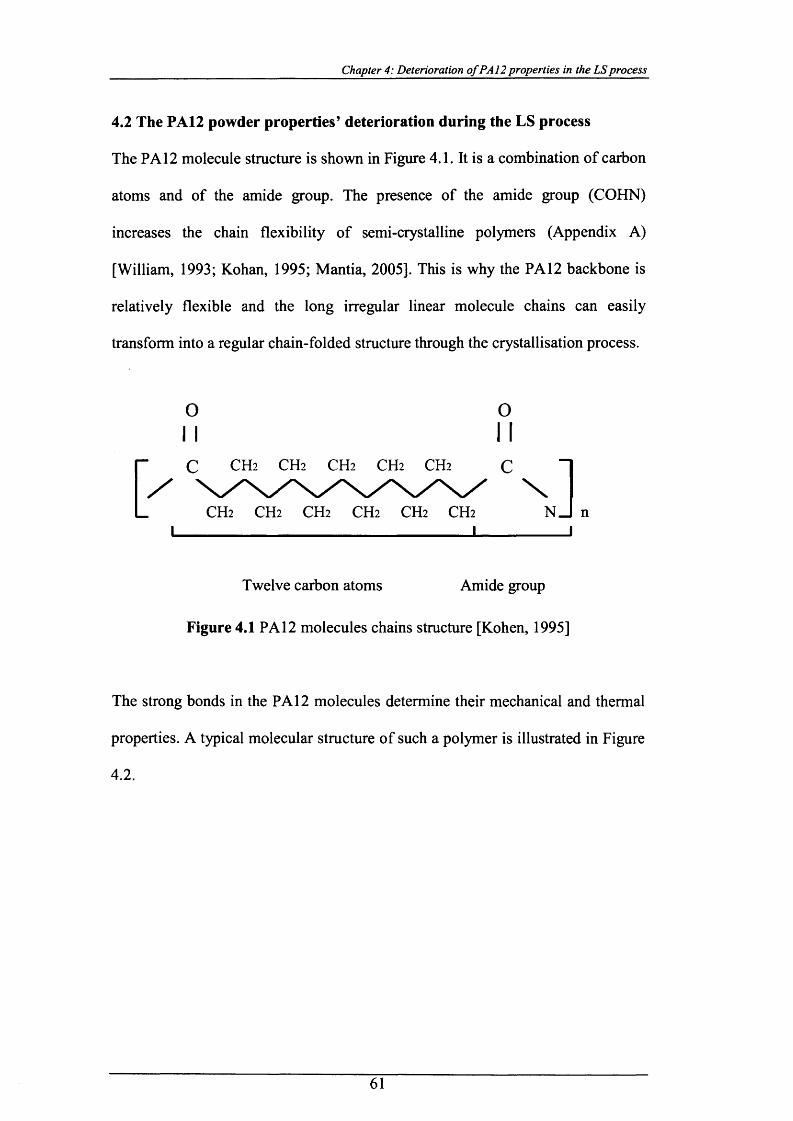
Chapter 4: Deterioration o f PA 12 properties in the LS process
4.2 The PA12 powder properties’ deterioration during the LS process
The PA 12 molecule structure is shown in Figure 4.1. It is a combination of carbon
atoms and of the amide group. The presence of the amide group (COHN)
increases the chain flexibility of semi-crystalline polymers (Appendix A)
[William, 1993; Kohan, 1995; Mantia, 2005]. This is why the PA 12 backbone is
relatively flexible and the long irregular linear molecule chains can easily
transform into a regular chain-folded structure through the crystallisation process.
The strong bonds in the PA 12 molecules determine their mechanical and thermal
properties. A typical molecular structure of such a polymer is illustrated in Figure
O o
Twelve carbon atoms Amide group
Figure 4.1 PA 12 molecules chains structure [Kohen, 1995]
4.2.
61
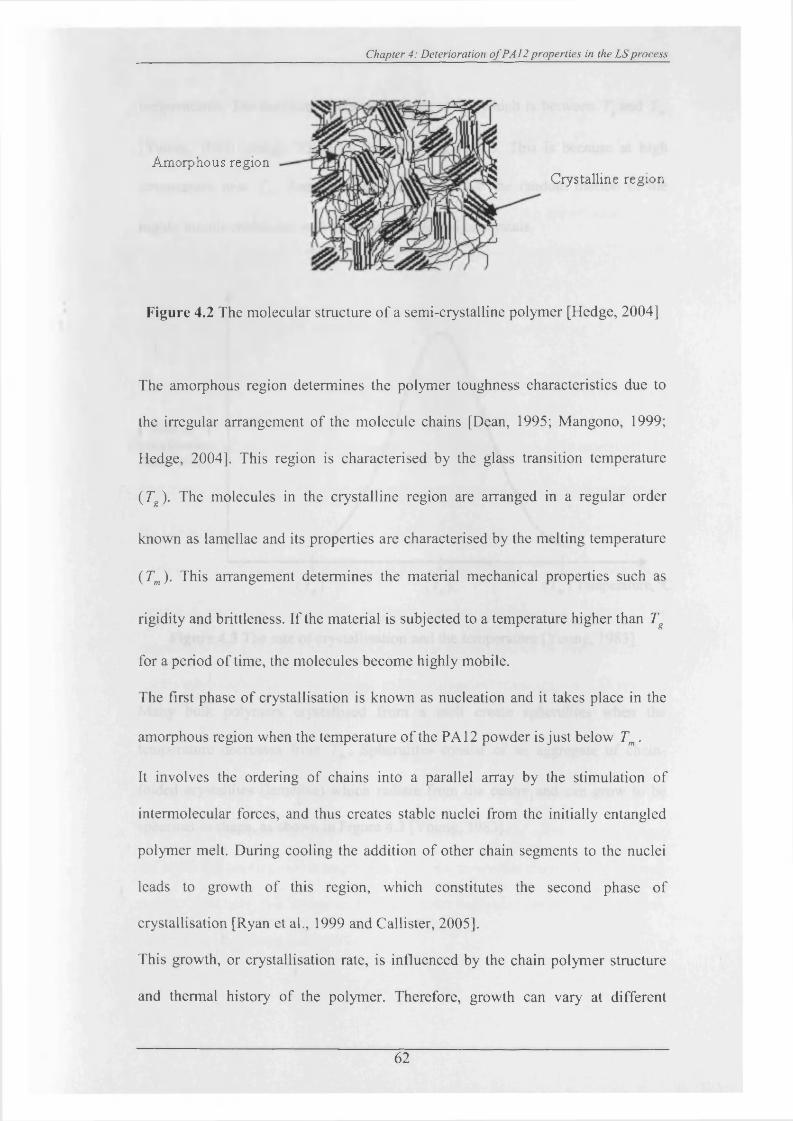
Chapter 4: Deterioration o f PA12 properties in the LS process
Amorphous regionCrystalline region
Figure 4.2 The molecular structure o f a semi-crystalline polymer [Hedge, 2004]
The amorphous region determines the polymer toughness characteristics due to
the irregular arrangement o f the molecule chains [Dean, 1995; Mangono, 1999;
Hedge, 2004]. This region is characterised by the glass transition temperature
( Tg ). The molecules in the crystalline region are arranged in a regular order
known as lamellae and its properties are characterised by the melting temperature
(Tm). This arrangement determines the material mechanical properties such as
rigidity and brittleness. If the material is subjected to a temperature higher than Tg
for a period o f time, the molecules become highly mobile.
The first phase o f crystallisation is known as nucleation and it takes place in the
amorphous region when the temperature o f the PA 12 powder is just below Tm.
It involves the ordering o f chains into a parallel array by the stimulation o f
intermolecular forces, and thus creates stable nuclei from the initially entangled
polymer melt. During cooling the addition o f other chain segments to the nuclei
leads to growth o f this region, which constitutes the second phase o f
crystallisation [Ryan et al., 1999 and Callister, 2005].
This growth, or crystallisation rate, is influenced by the chain polymer structure
and thermal history o f the polymer. Therefore, growth can vary at different
62
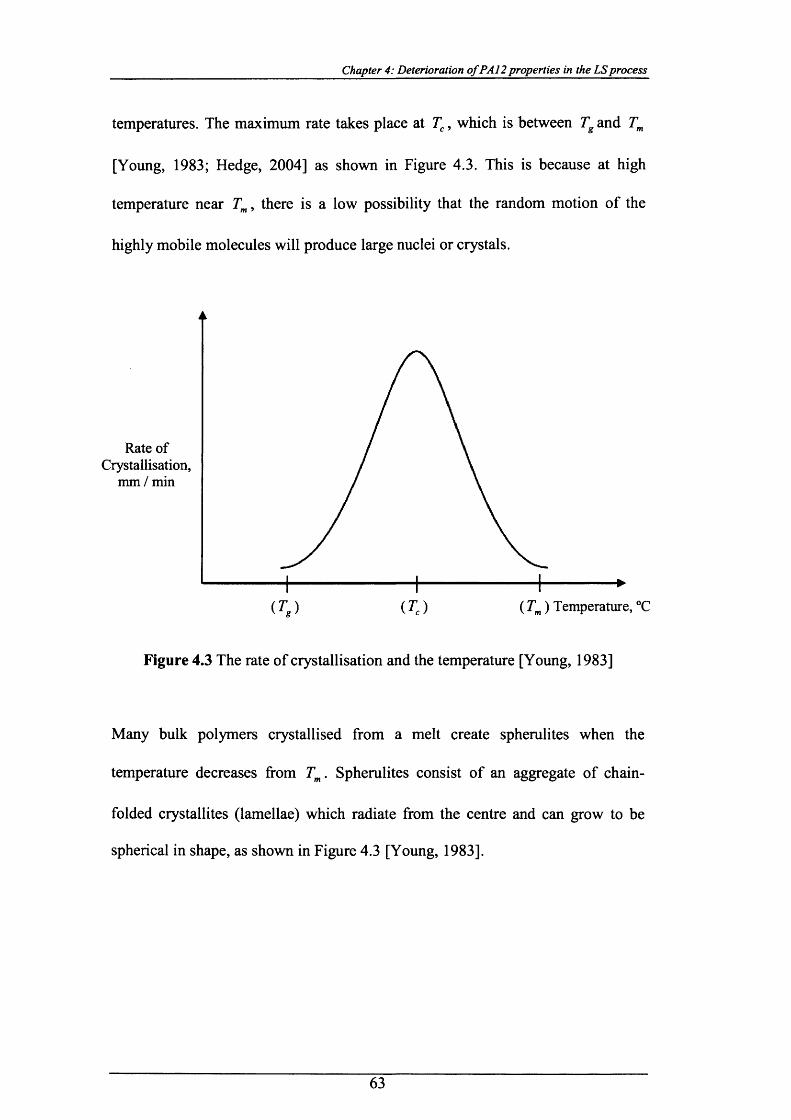
Chapter 4: Deterioration o f PA12 properties in the LS process
temperatures. The maximum rate takes place at Tc, which is between Tg and Tm
[Young, 1983; Hedge, 2004] as shown in Figure 4.3. This is because at high
temperature near Tm, there is a low possibility that the random motion of the
highly mobile molecules will produce large nuclei or crystals.
Rate of Crystallisation,
mm / min
(Tm) Temperature, °C
Figure 4.3 The rate of crystallisation and the temperature [Young, 1983]
Many bulk polymers crystallised from a melt create spherulites when the
temperature decreases from Tm. Spherulites consist of an aggregate of chain-
folded crystallites (lamellae) which radiate from the centre and can grow to be
spherical in shape, as shown in Figure 4.3 [Young, 1983].
63
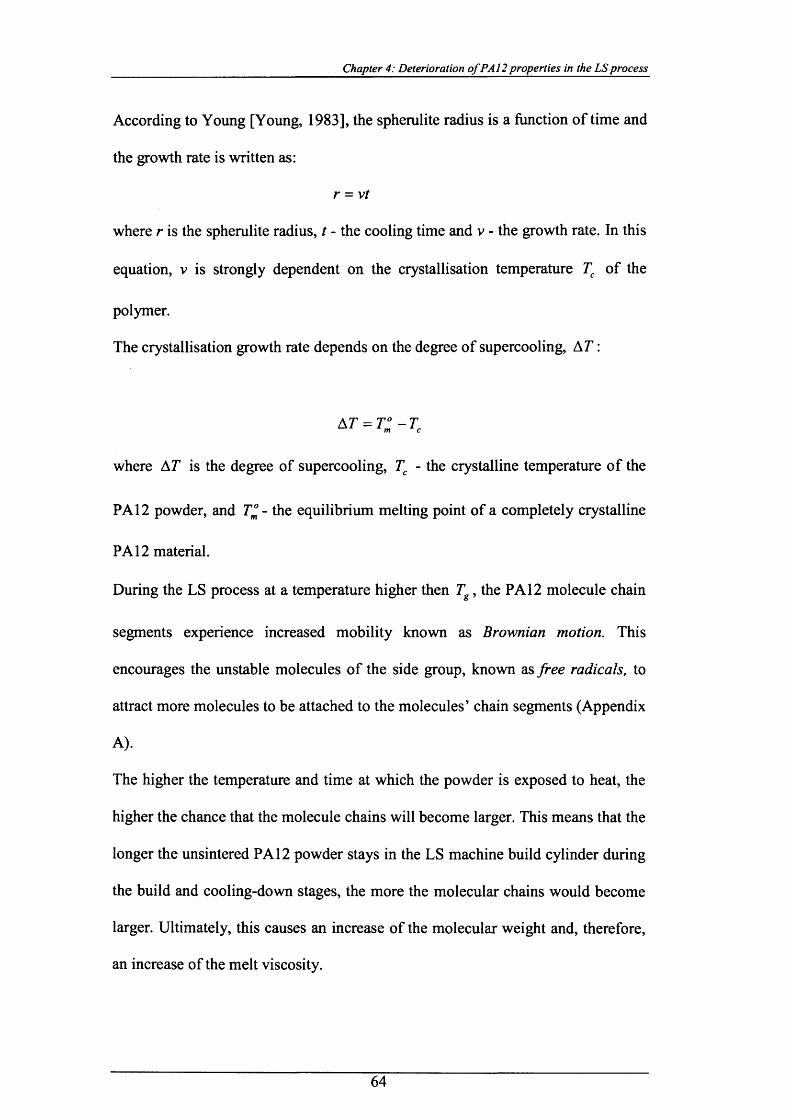
Chapter 4: Deterioration ofPA12 properties in the LS process
According to Young [Young, 1983], the spherulite radius is a function of time and
the growth rate is written as:
r - v t
where r is the spherulite radius, t - the cooling time and v - the growth rate. In this
equation, v is strongly dependent on the crystallisation temperature Tc of the
polymer.
The crystallisation growth rate depends on the degree of supercooling, A T :
a t = t: - tc
where AT is the degree of supercooling, Tc - the crystalline temperature of the
PA 12 powder, and T° - the equilibrium melting point of a completely crystalline
PA 12 material.
During the LS process at a temperature higher then Tg , the PA 12 molecule chain
segments experience increased mobility known as Brownian motion. This
encourages the unstable molecules of the side group, known as free radicals, to
attract more molecules to be attached to the molecules’ chain segments (Appendix
A).
The higher the temperature and time at which the powder is exposed to heat, the
higher the chance that the molecule chains will become larger. This means that the
longer the unsintered PA 12 powder stays in the LS machine build cylinder during
the build and cooling-down stages, the more the molecular chains would become
larger. Ultimately, this causes an increase of the molecular weight and, therefore,
an increase of the melt viscosity.
64
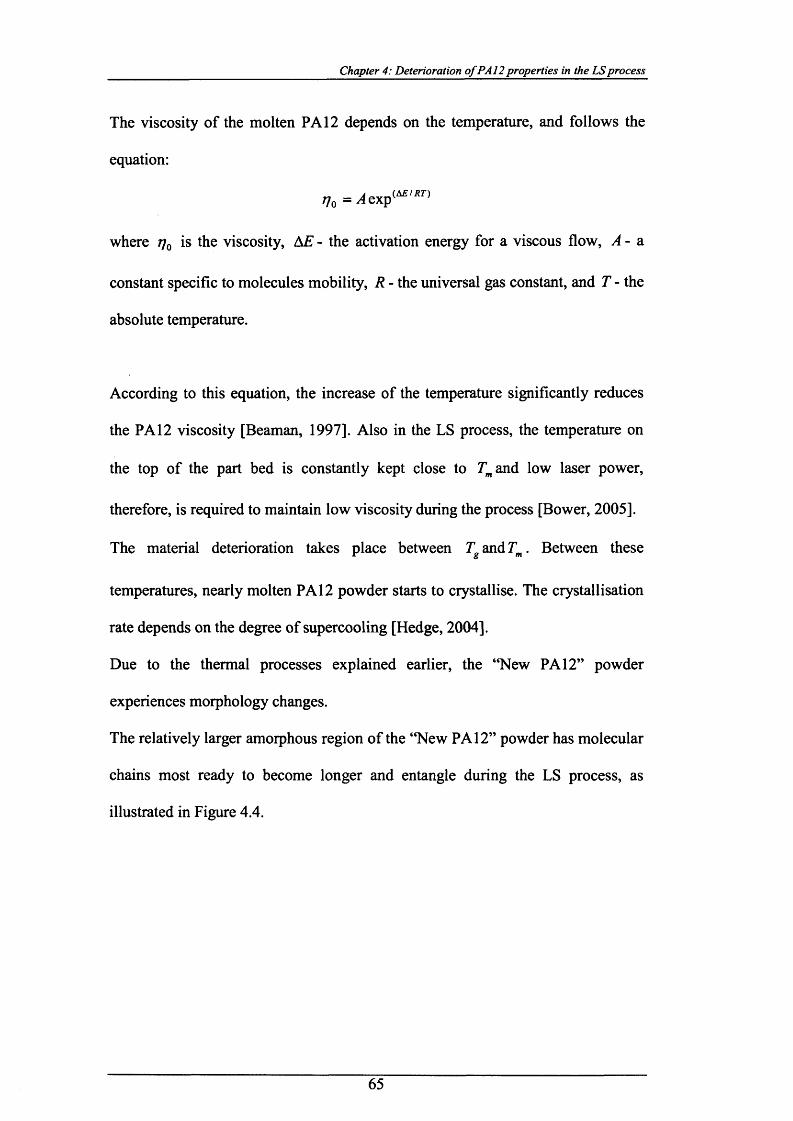
Chapter 4: Deterioration o f PA 12 properties in the LS process
The viscosity of the molten PA 12 depends on the temperature, and follows the
equation:
7o =^exp(A£//?r)
where tjq is the viscosity, AE - the activation energy for a viscous flow, A - a
constant specific to molecules mobility, R - the universal gas constant, and T - the
absolute temperature.
According to this equation, the increase of the temperature significantly reduces
the PA 12 viscosity [Beaman, 1997]. Also in the LS process, the temperature on
the top of the part bed is constantly kept close to Tm and low laser power,
therefore, is required to maintain low viscosity during the process [Bower, 2005].
The material deterioration takes place between Tg and Tm. Between these
temperatures, nearly molten PA 12 powder starts to crystallise. The crystallisation
rate depends on the degree of supercooling [Hedge, 2004].
Due to the thermal processes explained earlier, the “New PA 12” powder
experiences morphology changes.
The relatively larger amorphous region of the “New PA 12” powder has molecular
chains most ready to become longer and entangle during the LS process, as
illustrated in Figure 4.4.
65
Chapter 4: Deterioration o f PA 12 properties in the LS process
“N ew P A 12" powder “R ecycledPA 12" powder —►
Time
Figure 4.4 Morphology changes “New PA 12 ” and “Recycled PA 12” in time
Longer molecular chains in the “Recycled PA 12” morphology means higher
molecular weight and melt viscosity, which ultimately will affect the material
sintering properties and part quality.
Spherulites growth
“New PA 12” powder “Recycled PA 12” powder
Time
Figure 4.5 Spherulite growths in “New PA 12” and “Recycled PA 12” powder in
time.
As schematically show in Figure 4.5, the crystal growth takes place by a chain
folding mechanism that is influenced by the degree o f supercooling and the time
to form a bigger spherulite [Young, 1983]. At this phase, the growth process
gradually slows down to temperatures close to Tg . During this stage, diffusion
takes place, where the polymer chains are unable to move easily and to form
66
Chapter 4: Deterioration o f PA 12 properties in the LS process
nuclei or to continue to grow further crystals due to lack of movement in the
molecules.
4.3 Experimental results and discussion
4.3.1 Methodology and equipment used
The LS material investigated in this study is PA12-based powder PA2200
supplied by EOS GmbH. Samples of un-sintered (loose) powder were placed in a
temperature controlled oven, Heraeus Instruments Vacutherm type 6060M, in a
Nitrogen rich atmosphere. They were heated at a specified temperature for a
period in order to simulate the conditions of the LS process. The samples were
heated at temperatures 100°C, 120°C, 140°C, 150°C, 160°C and 180°C and kept
for 10, 15, 25, 50, 100, 150 and 200 hours at each temperature.
Samples of new and recycled grades powder were tested, and the results were
analysed in order to investigate the effect of the temperature and time on the
powder properties.
4.3.1.1 Melt Flow Rate Indexer (MFR)
The Melt Flow Rate (MFR) measures the flow viscosity of a molten polymer
when extruded through a capillary die under specific temperature and load
conditions. The flow ability of any polymer depends on its chemical structure.
Polymer chains with simple geometry and short length “slide” past one another
relatively easily with low flow resistance. By contrast, long chains of high
molecular weight and complex structure yield greater flow resistance or viscosity
[Barnes, 1998; Martin et al., 2001; Martin, 2006].
67
Chapter 4: Deterioration o f PA 12 properties in the LS process
The MFR was selected as a criterion because the flow characteristics of a molten
polymer are very sensitive to changes in the basic polymer structure and its
molecular weight [Van Waser, 1963; Shearman, 1970; Martinet al., 2002; Gomet,
2002a,b]. The basic polymer property which is measured by this test is the molten
plastic flow at a particular shear stress (related to the applied load) and
temperature as illustrated in Figure 4.6. In this case, the MFR test provides a
relatively fast and inexpensive method of measuring the rate of PA 12 powder
degradation because of the LS process.
For each sample, 6 MFR measurements were taken to calculate the (average)
result. The coefficient of variation of this experiment is about ± 3 %. The MFR
experiments were performed according to ISO 1133 standard [ISO 1133, Thermo
Haake, 2000]. A small amount of PA2200 material (8-10 grams) was extruded for
10 minutes, at a temperature of 235 °C under a weight of 2.16kg. The measured
MFR units are in g/10 min.
68
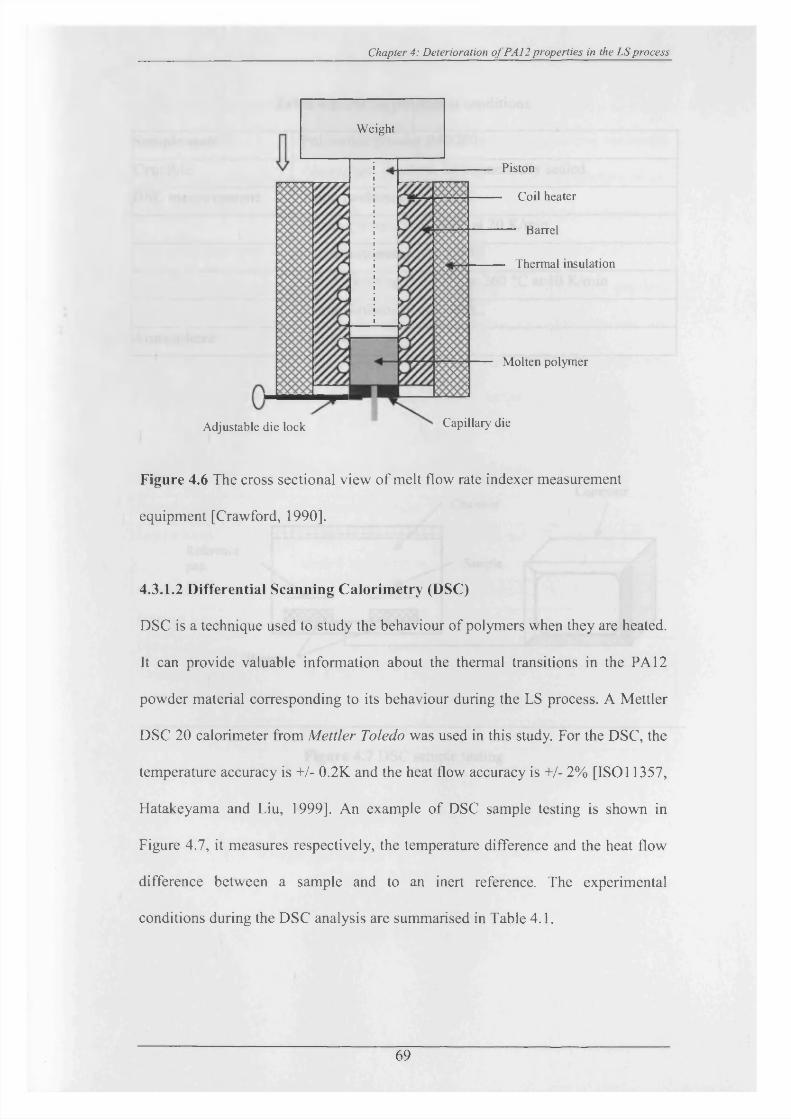
Chapter 4: Deterioration o f PA12 properties in the LS process
Figure 4.6 The cross sectional view o f melt flow rate indexer measurement
equipment [Crawford, 1990].
4.3.1.2 Differential Scanning Calorimetry (DSC)
DSC is a technique used to study the behaviour o f polymers when they are heated.
It can provide valuable information about the thermal transitions in the PA 12
powder material corresponding to its behaviour during the LS process. A Mettler
DSC 20 calorimeter from Mettler Toledo was used in this study. For the DSC, the
temperature accuracy is +/- 0.2K and the heat flow accuracy is +/- 2% [ISOl 1357,
Hatakeyama and Liu, 1999], An example o f DSC sample testing is shown in
Figure 4.7, it measures respectively, the temperature difference and the heat flow
difference between a sample and to an inert reference. The experimental
conditions during the DSC analysis are summarised in Table 4.1.
Weight
Adjustable die lock
Piston
Coil heater
Barrel
Thermal insulation
Molten polymer
Capillary die
69
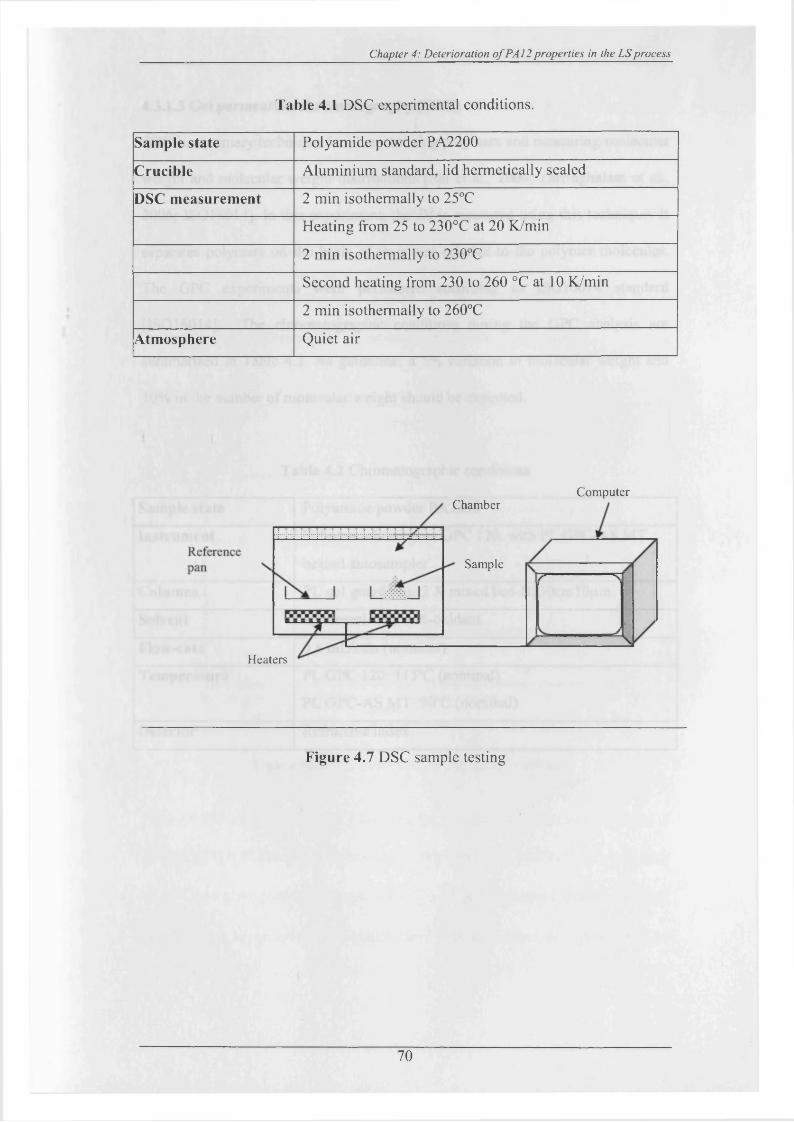
Chapter 4: Deterioration o f PA J 2 properties in the LS process
Table 4.1 DSC experimental conditions.
Sample state Polyamide powder PA2200
Crucible Aluminium standard, lid hermetically sealed
DSC measurement 2 min isothermally to 25°C
Heating from 25 to 230°C at 20 K/min
2 min isothermally to 230°C
Second heating from 230 to 260 °C at 10 K/min
2 min isothermally to 260°C
Atmosphere Quiet air
ComputerChamber
Sample
Heaters
Figure 4.7 DSC sample testing
70
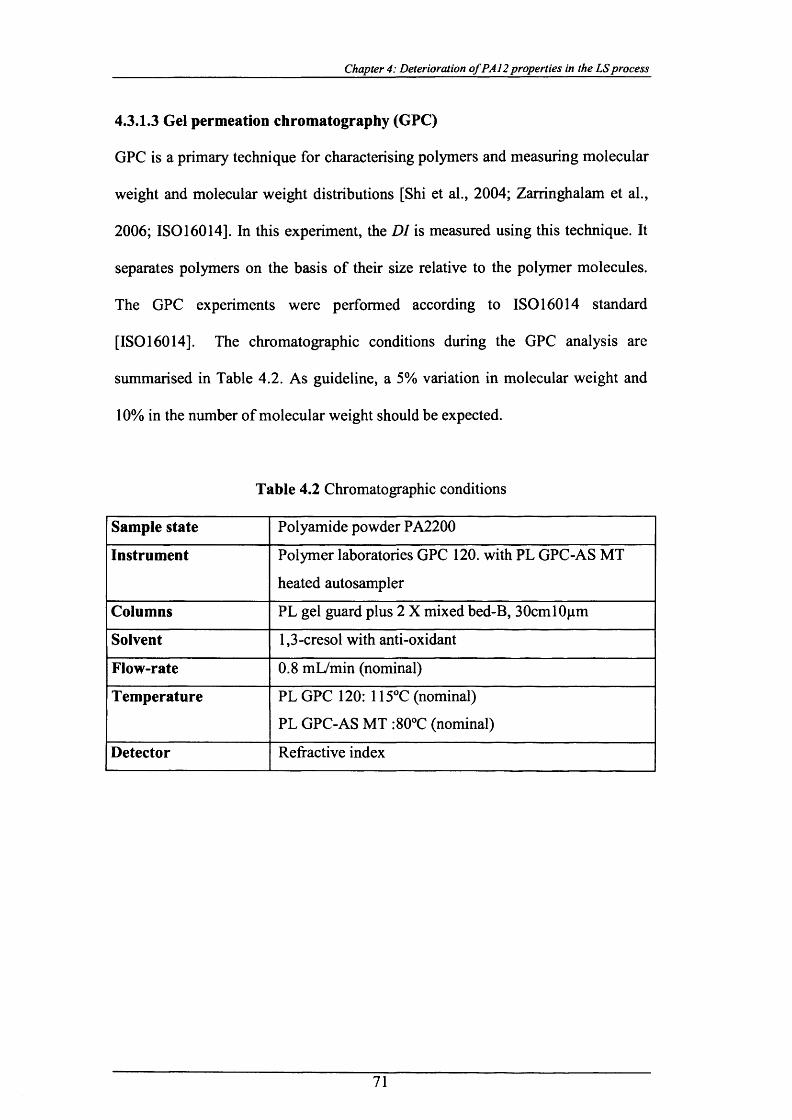
Chapter 4: Deterioration o f PA12 properties in the LS process
4.3.1.3 Gel permeation chromatography (GPC)
GPC is a primary technique for characterising polymers and measuring molecular
weight and molecular weight distributions [Shi et al., 2004; Zarringhalam et al.,
2006; ISO 16014]. In this experiment, the DI is measured using this technique. It
separates polymers on the basis of their size relative to the polymer molecules.
The GPC experiments were performed according to ISO 16014 standard
[ISO 16014]. The chromatographic conditions during the GPC analysis are
summarised in Table 4.2. As guideline, a 5% variation in molecular weight and
10% in the number of molecular weight should be expected.
Table 4.2 Chromatographic conditions
Sample state Polyamide powder PA2200
Instrument Polymer laboratories GPC 120. with PL GPC-AS MT
heated autosampler
Columns PL gel guard plus 2 X mixed bed-B, 30cml0pm
Solvent 1,3-cresol with anti-oxidant
Flow-rate 0.8 mL/min (nominal)
Temperature PL GPC 120: 115°C (nominal)
PL GPC-AS MT :80°C (nominal)
Detector Refractive index
71
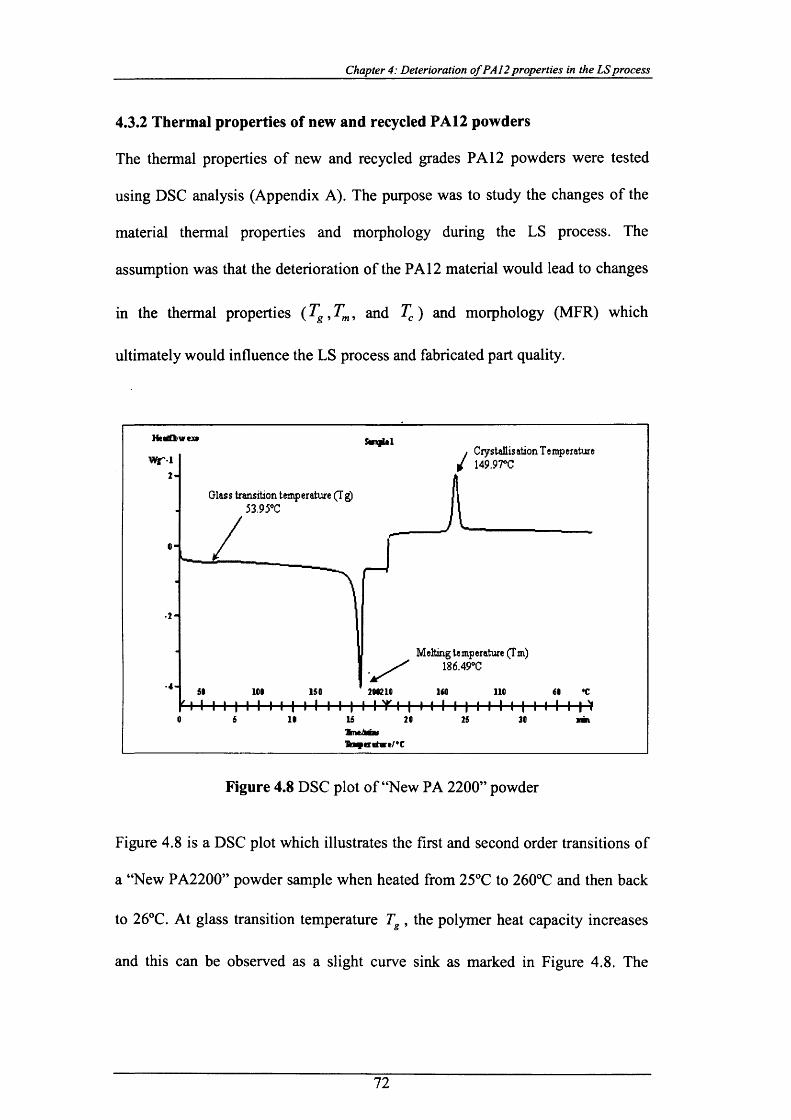
Chapter 4: Deterioration o f PA12 properties in the LS process
4.3.2 Thermal properties of new and recycled PA12 powders
The thermal properties of new and recycled grades PA 12 powders were tested
using DSC analysis (Appendix A). The purpose was to study the changes of the
material thermal properties and morphology during the LS process. The
assumption was that the deterioration of the PA 12 material would lead to changes
in the thermal properties (Tg ,Tmi and Tc ) and morphology (MFR) which
ultimately would influence the LS process and fabricated part quality.
Crystallisation T emperature 149.97°C
2 -
Glass transition temperature (Tg) 53.95°C
c-
• 2 -
Melting temperature (T m) 186.49°C
- 4 -2 M210101 150 1(0 110
Figure 4.8 DSC plot of “New PA 2200” powder
Figure 4.8 is a DSC plot which illustrates the first and second order transitions of
a “New PA2200” powder sample when heated from 25°C to 260°C and then back
to 26°C. At glass transition temperature Tg , the polymer heat capacity increases
and this can be observed as a slight curve sink as marked in Figure 4.8. The
72
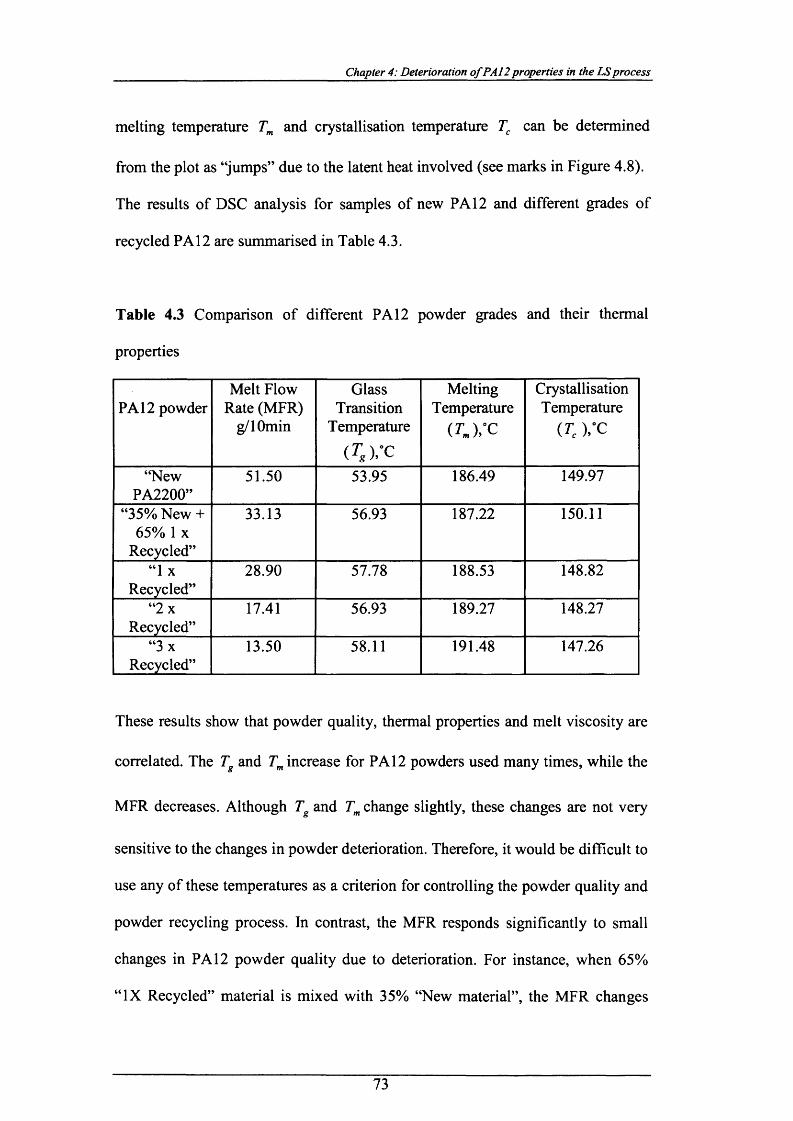
Chapter 4: Deterioration ofPA12 properties in the LS process
melting temperature Tm and crystallisation temperature Tc can be determined
from the plot as “jumps” due to the latent heat involved (see marks in Figure 4.8).
The results of DSC analysis for samples of new PA 12 and different grades of
recycled PA 12 are summarised in Table 4.3.
Table 4.3 Comparison of different PA12 powder grades and their thermal
properties
PA 12 powderMelt Flow
Rate (MFR) g/lOmin
GlassTransition
Temperature
( T8 y c
MeltingTemperature
( T J X
Crystallisation Temperature
(Tc ),°C
“NewPA2200”
51.50 53.95 186.49 149.97
“35% New + 65% 1 x
Recycled”
33.13 56.93 187.22 150.11
“1 X
Recycled”28.90 57.78 188.53 148.82
“2 x Recycled”
17.41 56.93 189.27 148.27
“3 x Recycled”
13.50 58.11 191.48 147.26
These results show that powder quality, thermal properties and melt viscosity are
correlated. The T and Tm increase for PA 12 powders used many times, while the
MFR decreases. Although Tg and Tm change slightly, these changes are not very
sensitive to the changes in powder deterioration. Therefore, it would be difficult to
use any of these temperatures as a criterion for controlling the powder quality and
powder recycling process. In contrast, the MFR responds significantly to small
changes in PA 12 powder quality due to deterioration. For instance, when 65%
“ IX Recycled” material is mixed with 35% “New material”, the MFR changes
73
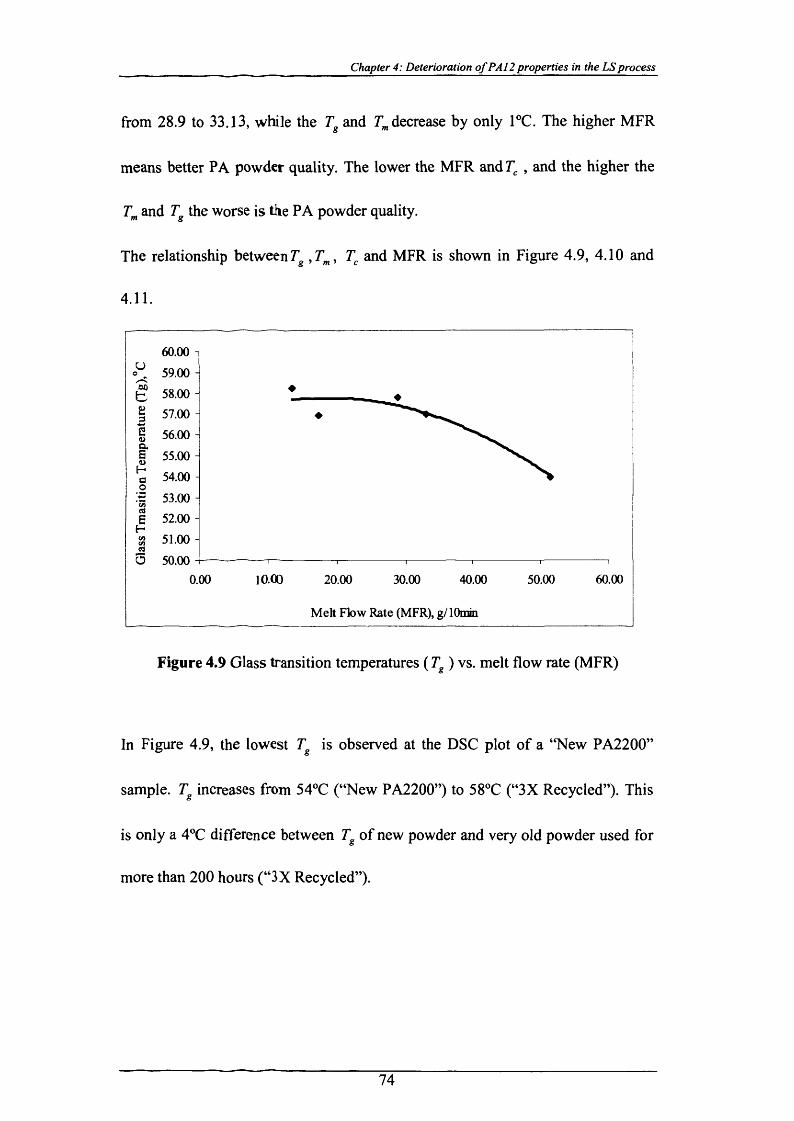
Chapter 4: Deterioration o f PA12 properties in the LS process
from 28.9 to 33.13, while the Tg and ^decrease by only 1°C. The higher MFR
means better PA powder quality. The lower the MFR and Tc , and the higher the
Tm and Tg the worse is the PA powder quality.
The relationship between Tg ,Tmi Tc and MFR is shown in Figure 4.9, 4.10 and
4.11.
60.00 -I^ 59.00 -g 58.00 -
Q.
54.00 -53.00 -
% 51.00 -d5 50.00 -
10.00 60.000.00 50.0020.00 30.00 40.00
Melt Flow Rate (MFR), g/lOmin
Figure 4.9 Glass transition temperatures ( T ) vs. melt flow rate (MFR)
In Figure 4.9, the lowest Tg is observed at the DSC plot of a “New PA2200”
sample. Tg increases from 54°C (“New PA2200”) to 58°C (“3X Recycled”). This
is only a 4°C difference between T of new powder and very old powder used for
more than 200 hours (“3X Recycled”).
74
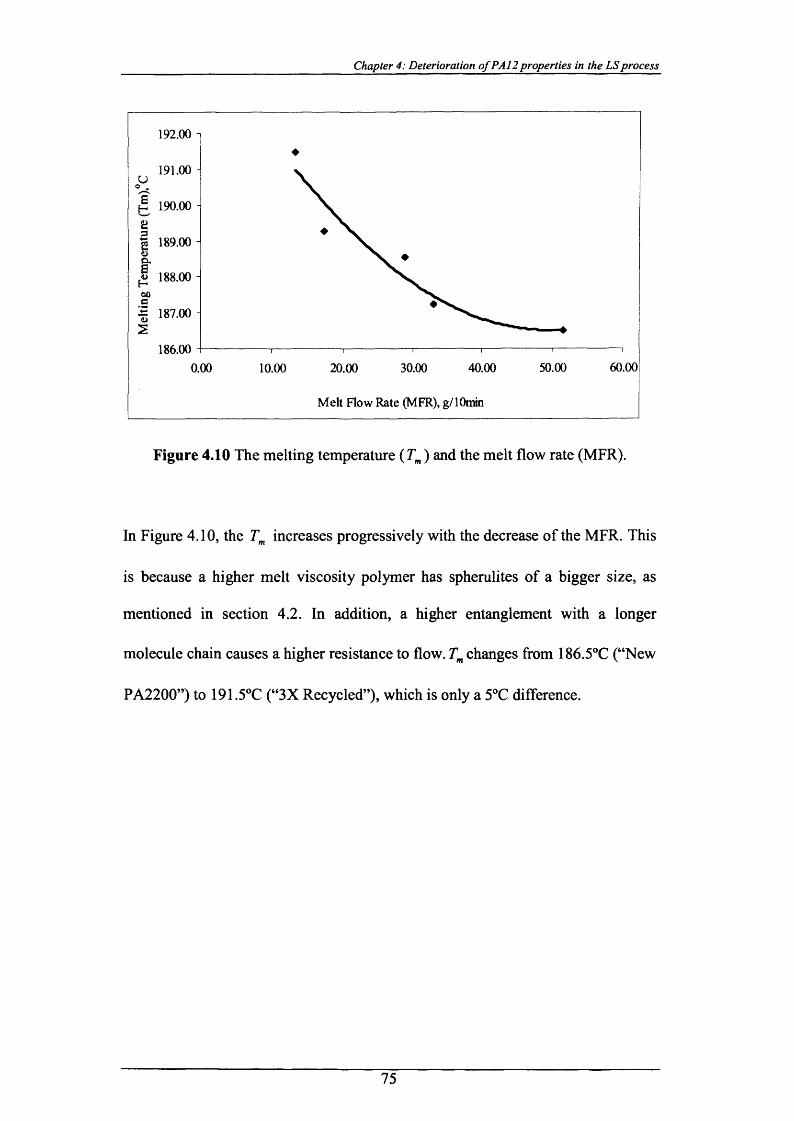
Chapter 4: Deterioration o f PA12 properties in the LS process
192.00 i
191.00 -
£ 190.00 -
)8 189.00 -<Da.
J 188.00 -
2 187.00 -
186.0060.0050.000.00 20.00 30.00 40.0010.00
Melt Flow Rate (MFR), g/lOmin
Figure 4.10 The melting temperature ( Tm ) and the melt flow rate (MFR).
In Figure 4.10, the Tm increases progressively with the decrease of the MFR. This
is because a higher melt viscosity polymer has spherulites of a bigger size, as
mentioned in section 4.2. In addition, a higher entanglement with a longer
molecule chain causes a higher resistance to flow. Tm changes from 186.5°C (“New
PA2200”) to 191.5°C (“3X Recycled”), which is only a 5°C difference.
75
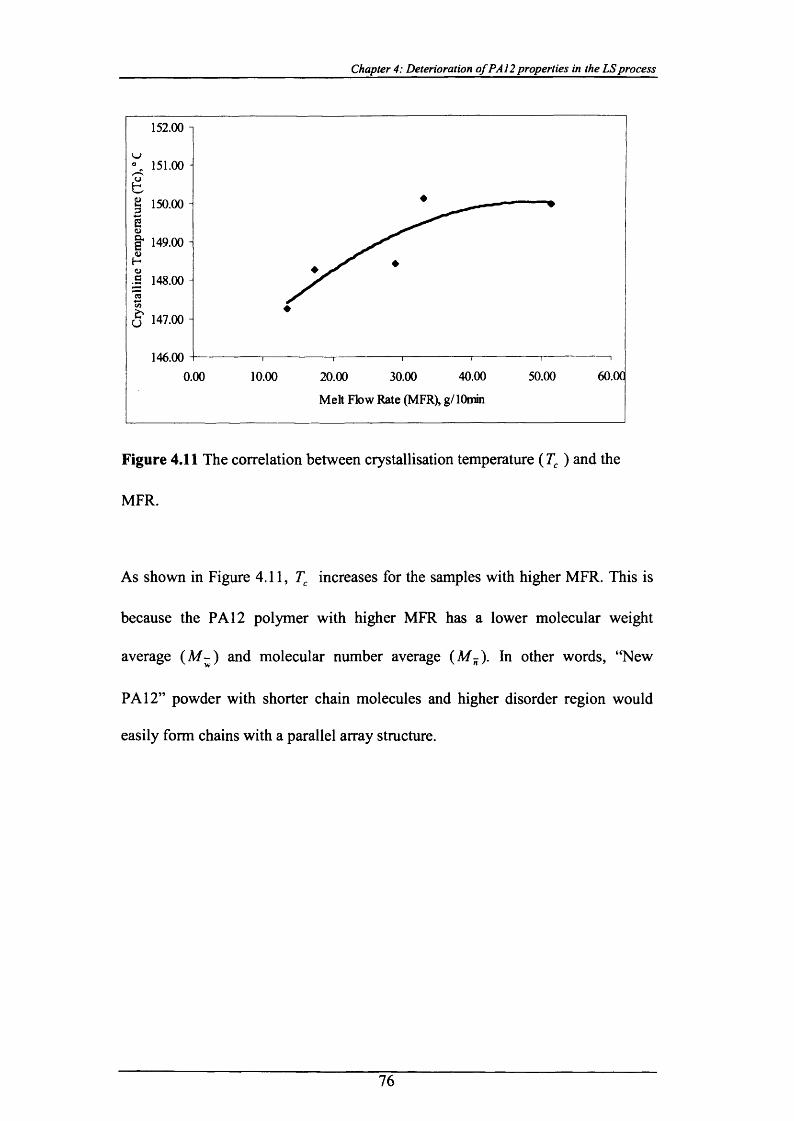
Chapter 4: Deterioration o f PA12 properties in the LS process
152.00 i
151.00 -
g 150.00 -
| 149.00 -
•S 148.00 -
147.00 -
146.0060.0040.00 50.0010.00 30.000.00 20.00
Melt Flow Rate (MFR), g/lOmm
Figure 4.11 The correlation between crystallisation temperature (Tc ) and the
MFR.
As shown in Figure 4.11, Tc increases for the samples with higher MFR. This is
because the PA 12 polymer with higher MFR has a lower molecular weight
average (A /-) and molecular number average (M-) . In other words, “New
PA 12” powder with shorter chain molecules and higher disorder region would
easily form chains with a parallel array structure.
76
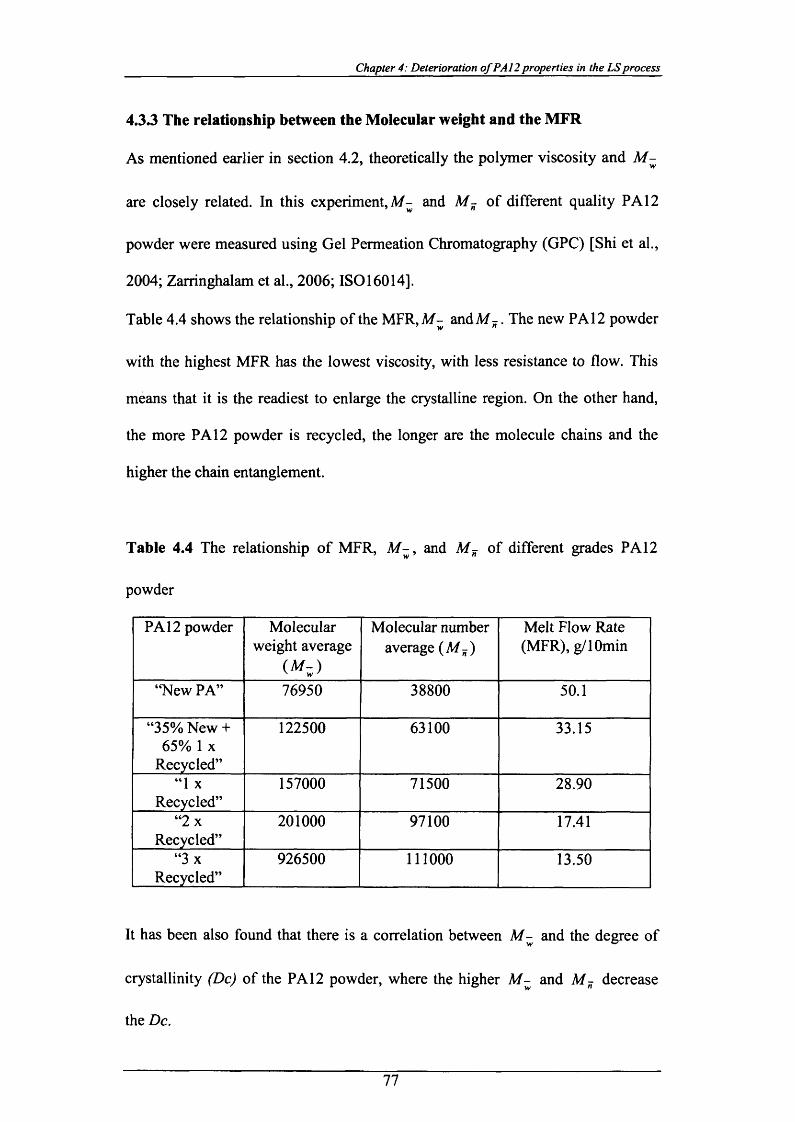
Chapter 4: Deterioration o f PA 12 properties in the LS process
4.3.3 The relationship between the Molecular weight and the MFR
As mentioned earlier in section 4.2, theoretically the polymer viscosity and M -
are closely related. In this experiment, M - and M - of different quality PA 12
powder were measured using Gel Permeation Chromatography (GPC) [Shi et al.,
2004; Zarringhalam et al., 2006; ISO 16014].
Table 4.4 shows the relationship of the MFR, M - andM - . The new PA12 powder
with the highest MFR has the lowest viscosity, with less resistance to flow. This
means that it is the readiest to enlarge the crystalline region. On the other hand,
the more PA 12 powder is recycled, the longer are the molecule chains and the
higher the chain entanglement.
Table 4.4 The relationship of MFR, M -, and M - of different grades PA12
powder
PA 12 powder Molecular weight average
Molecular number average ( M w)
Melt Flow Rate (MFR), g/lOmin
“New PA” 76950 38800 50.1
“35% New + 65% 1 x
Recycled”
122500 63100 33.15
“ 1 X
Recycled”157000 71500 28.90
“2 x Recycled”
201000 97100 17.41
“3 x Recycled”
926500 111000 13.50
It has been also found that there is a correlation between M - and the degree of
crystallinity (Dc) of the PA 12 powder, where the higher M - and M - decrease
the Dc.
77

Chapter 4: Deterioration ofPA12 properties in the LS process
A higher M - causes chain folding to become less regular and the degree of
crystallinity decreases. This is due to the freedom of chains to rearrange
themselves during crystallinity decreases [Bower, 2002].
The Dc of the polymer can be calculated from the DSC plot. This requires Tm
determination of the heat of fusion at Tm of the test sample and purely crystalline
material. The Dc of the polymer sample is calculated as follows [Belofsky, 1995]:
Ah fDc = —f- x m
Where Ahf is the heat of fusion of the test sample, Ahc - the heat of fusion of
purely crystalline material. The heat of fusion for 100% crystalline material was
taken as 209.3 J/g [Zarringhalam et al., 2006 and Gololewski et al.,1980].
57.00 n
56.50 -
S' 56.00 -
£ 55.50 - '.S| 55.00 -
£ 54.50 -
z 54.00 -
| 53.50 -
I 53.00 -
52.50 -
52.00
Melt Flow Rate (MFR), (g/lOmin)
Figure 4.12 The percentage of crystallinity at different MFRs.
Figure 4.12 shows the relationship between the MFR and the Dc. The samples of
“New PA2200” have larger Dc and higher MFR compared to the samples of the
78
Chapter 4: Deterioration o f PA12 properties in the LSprocess
older or recycled powder. These results support the analysis of the process of
powder deterioration (section 4.2) and the hypothesis of the enlargement of the
crystalline region in the new PA 12 powder.
00
Melt Flow Rate (MFR), g/lOmin
Figure 4.13 The shrinkage and MFR
Figure 4.13 depicts the average shrinkage of LS parts built from PA2200 powder
with different grade and MFRs. As explained earlier in section 4.2 and Figure 4.4,
more efficient packing of the PA 12 polymer chains causes higher melt viscosity,
which also leads to an increase in the LS part’s shrinkage.
79
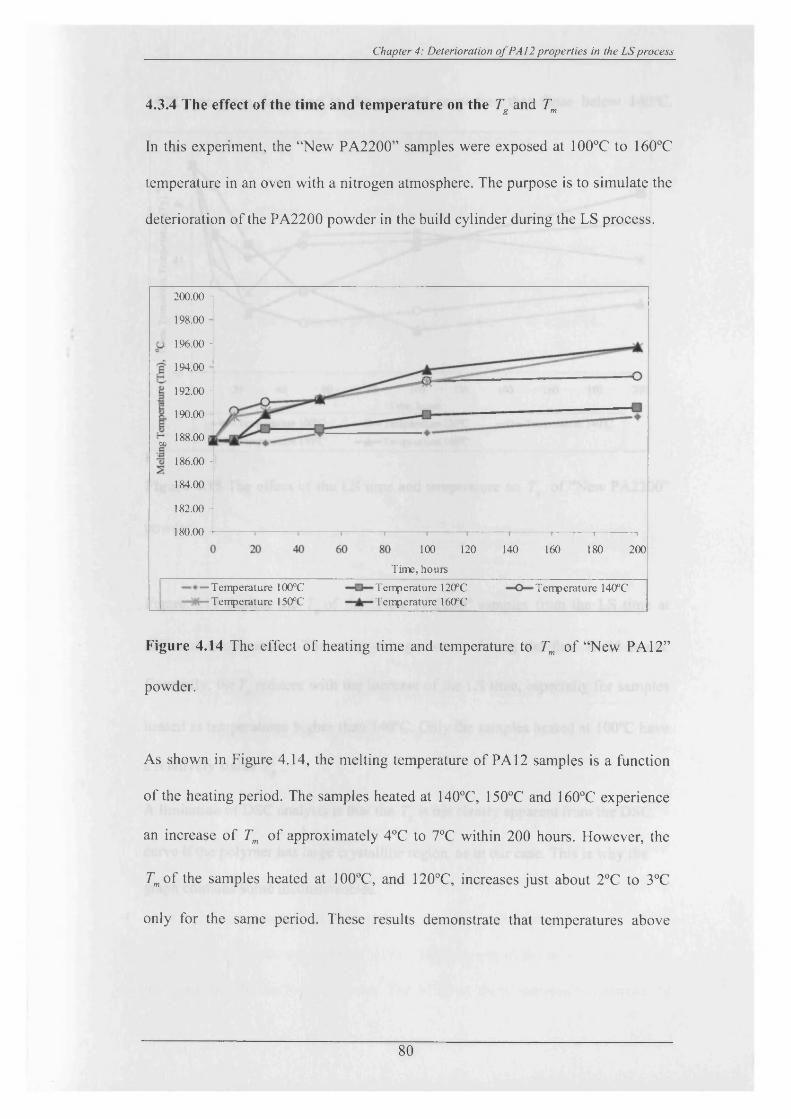
Chapter 4: Deterioration o f PA12 properties in the LS process
4.3.4 The effect of the time and temperature on the Tg and Tm
In this experiment, the “New PA2200” samples were exposed at 100°C to 160°C
temperature in an oven with a nitrogen atmosphere. The purpose is to simulate the
deterioration o f the PA2200 powder in the build cylinder during the LS process.
200.00 i
198.00
196.00 -
194.00
192.00 -
190.00 -
188.0000
186.00 -
184.00 -
182.00 -
180.00) 100
Time, hours
120 180140 160 200
— Temperature 100°C c— Temperature 150°C
Temperature 120PC Temperature 160 *0
Temperature 140PC
Figure 4.14 The effect o f heating time and temperature to Tm o f “New PA12”
powder.
As shown in Figure 4.14, the melting temperature o f PA 12 samples is a function
o f the heating period. The samples heated at 140°C, 150°C and 160°C experience
an increase o f Tm o f approximately 4°C to 7°C within 200 hours. However, the
Tmo f the samples heated at 100°C, and 120°C, increases just about 2°C to 3°C
only for the same period. These results demonstrate that temperatures above
80
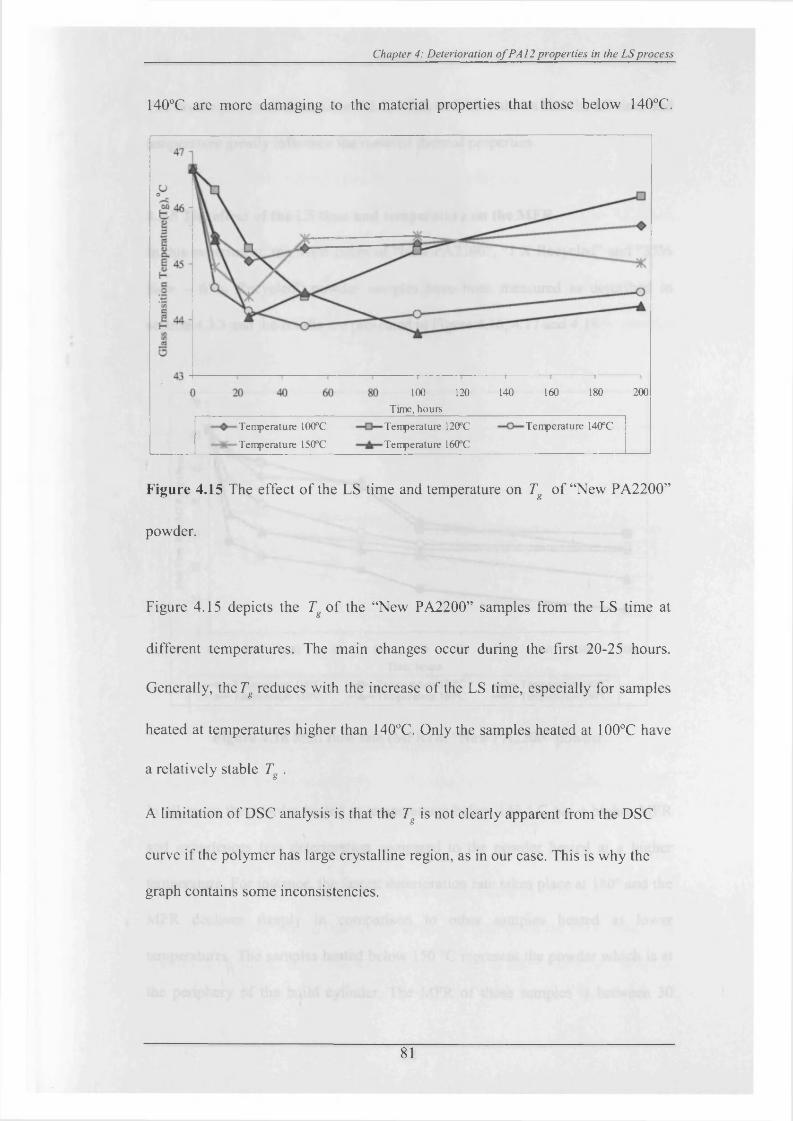
Chapter 4: Deterioration o f PA 12 properties in the LS process
140°C are more damaging to the material properties that those below 140°C.
200120 140 160 180100 Time, hours
Temperature 120°C
Temperature 160°C
Temperature 140°CTemperature 100°C
Temperature lSO C
Figure 4.15 The effect o f the LS time and temperature on Tg o f “New PA2200”
powder.
Figure 4.15 depicts the Tg o f the “New PA2200” samples from the LS time at
different temperatures. The main changes occur during the first 20-25 hours.
Generally, the Tg reduces with the increase o f the LS time, especially for samples
heated at temperatures higher than 140°C. Only the samples heated at 100°C have
a relatively stable Tg .
A limitation o f DSC analysis is that the Tg is not clearly apparent from the DSC
curve if the polymer has large crystalline region, as in our case. This is why the
graph contains some inconsistencies.
81
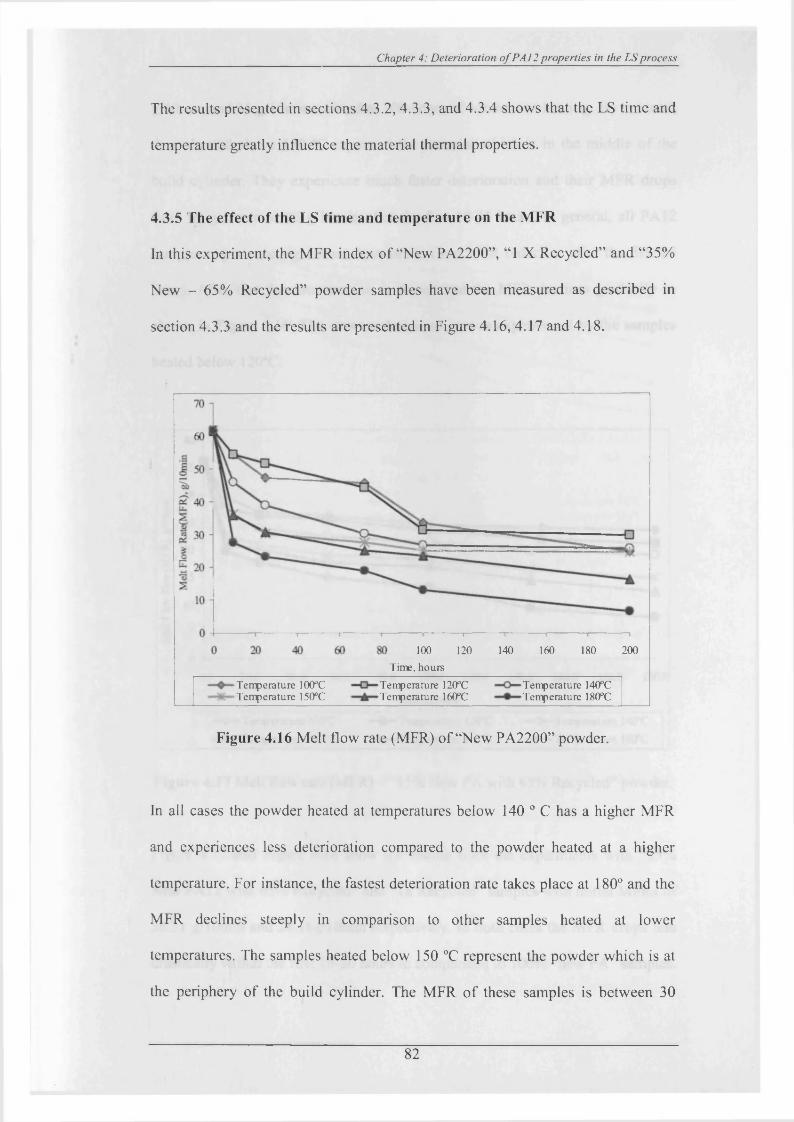
Chapter 4: Deterioration o f PA 12 properties in the LS process
The results presented in sections 4.3.2, 4.3.3, and 4.3.4 shows that the LS time and
temperature greatly influence the material thermal properties.
4.3.5 The effect of the LS time and temperature on the MFR
In this experiment, the MFR index o f “New PA2200”, “I X Recycled” and “35%
New - 65% Recycled” powder samples have been measured as described in
section 4.3.3 and the results are presented in Figure 4.16,4.17 and 4.18.
160 180 200100 Time, hours
120 140
Temperature 100°C Temperature 150°C
Temperature 120°C Temperature 160°C
Temperature 140°C Temperature 180°C
Figure 4.16 Melt flow rate (MFR) of “New PA2200” powder.
In all cases the powder heated at temperatures below 140 ° C has a higher MFR
and experiences less deterioration compared to the powder heated at a higher
temperature. For instance, the fastest deterioration rate takes place at 180° and the
MFR declines steeply in comparison to other samples heated at lower
temperatures. The samples heated below 150 °C represent the powder which is at
the periphery o f the build cylinder. The MFR o f these samples is between 30
82
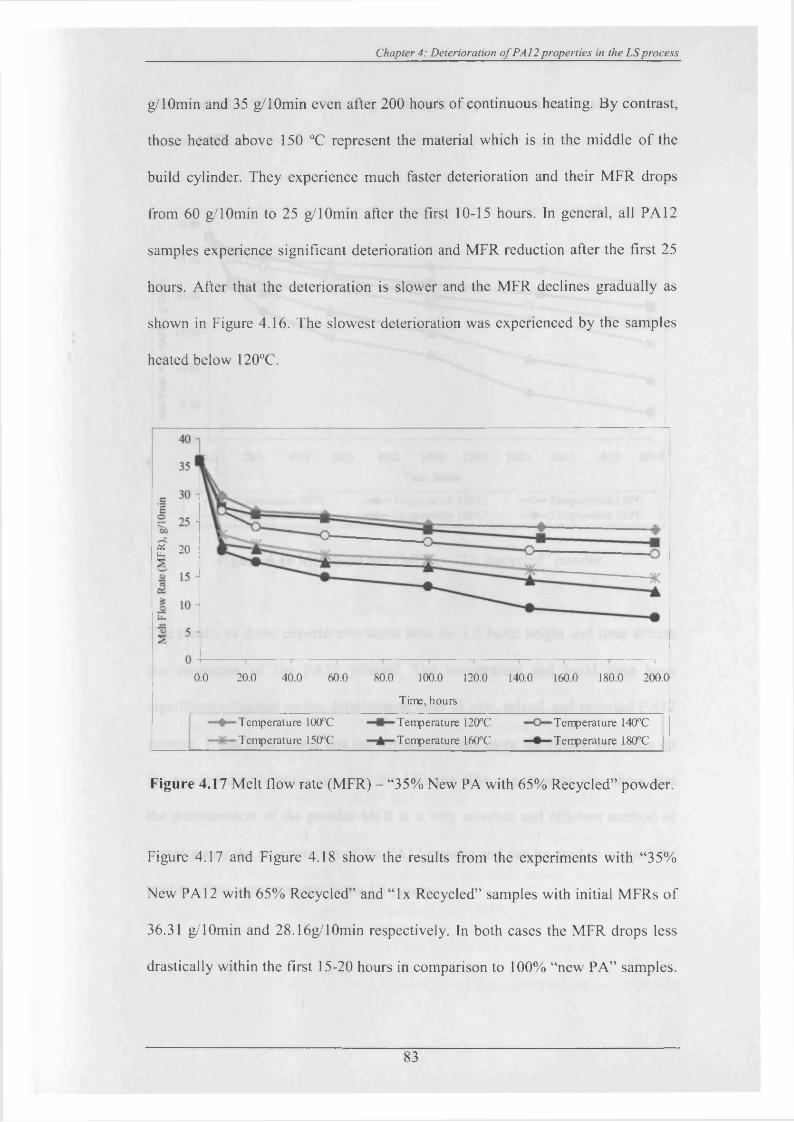
Chapter 4: Deterioration o f PA 12 properties in the LS process
g/10min and 35 g/lOmin even after 200 hours o f continuous heating. By contrast,
those heated above 150 °C represent the material which is in the middle o f the
build cylinder. They experience much faster deterioration and their MFR drops
from 60 g/lOmin to 25 g/lOmin after the first 10-15 hours. In general, all PA 12
samples experience significant deterioration and MFR reduction after the first 25
hours. After that the deterioration is slower and the MFR declines gradually as
shown in Figure 4.16. The slowest deterioration was experienced by the samples
heated below 120°C.
£ 2 0 -
0.0 20.0 40.0 60.0 80.0 100.0 120.0 140.0 160.0 180.0 200.0
Time, hours
Temperature 100°C Temperature 150°C
Temperature 120°C Temperature 160°C
Temperature 140°C Temperature 180°C
Figure 4.17 Melt flow rate (MFR) - “35% New PA with 65% Recycled” powder.
Figure 4.17 and Figure 4.18 show the results from the experiments with “35%
New PA 12 with 65% Recycled” and “ lx Recycled” samples with initial MFRs o f
36.31 g/lOmin and 28.16g/10min respectively. In both cases the MFR drops less
drastically within the first 15-20 hours in comparison to 100% “new PA” samples.
83
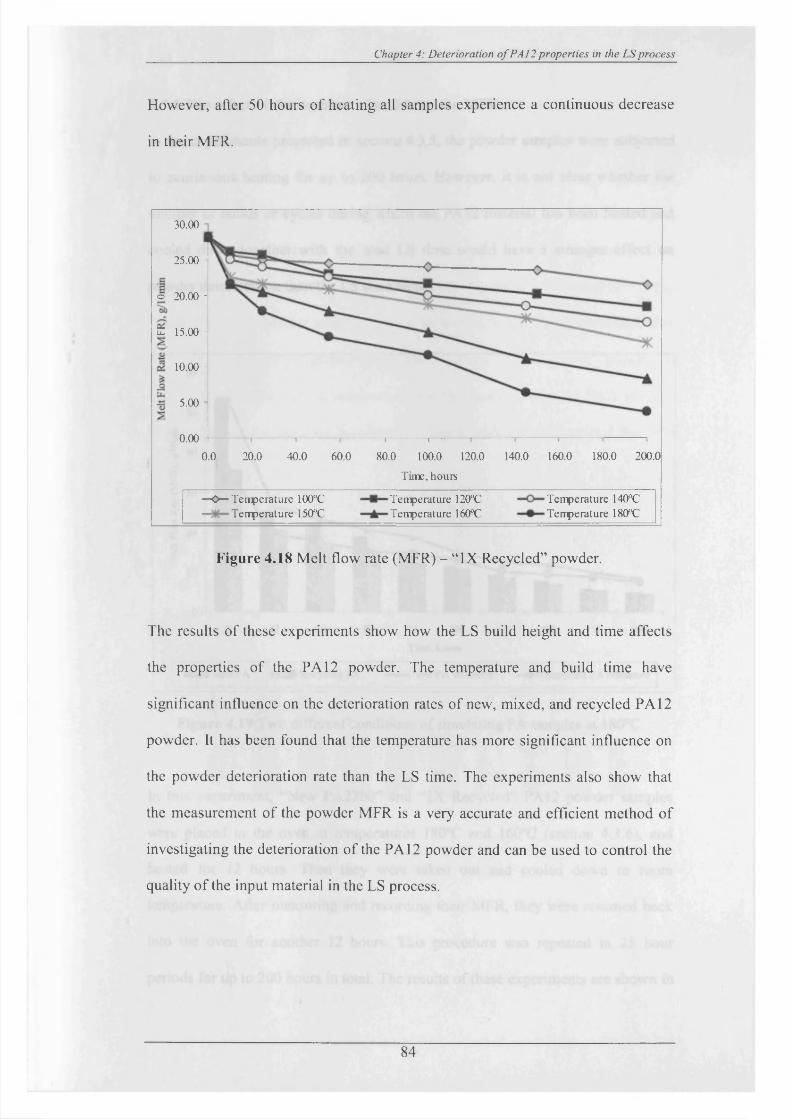
Chapter 4: Deterioration o f PA12 properties in the LS process
However, after 50 hours o f heating all samples experience a continuous decrease
in their MFR.
30.00
25.00 -
o 20.00 -
£ 15.00 -
1 0 . 0 0 -
5.00
0.0080.0 100.0 120.0 140.0 160.0 180.0 200.0
Time, hours
0.0 20.0 40.0 60.0
Temperature 140°C Temperature 180°C
—O— Temperature 100°C — Temperature 150°C
Temperature 120°C Temperature 160°C
Figure 4.18 Melt flow rate (MFR) - “IX Recycled” powder.
The results o f these experiments show how the LS build height and time affects
the properties o f the PA 12 powder. The temperature and build time have
significant influence on the deterioration rates o f new, mixed, and recycled PA 12
powder. It has been found that the temperature has more significant influence on
the powder deterioration rate than the LS time. The experiments also show that
the measurement o f the powder MFR is a very accurate and efficient method o f
investigating the deterioration o f the PA 12 powder and can be used to control the
quality o f the input material in the LS process.
84
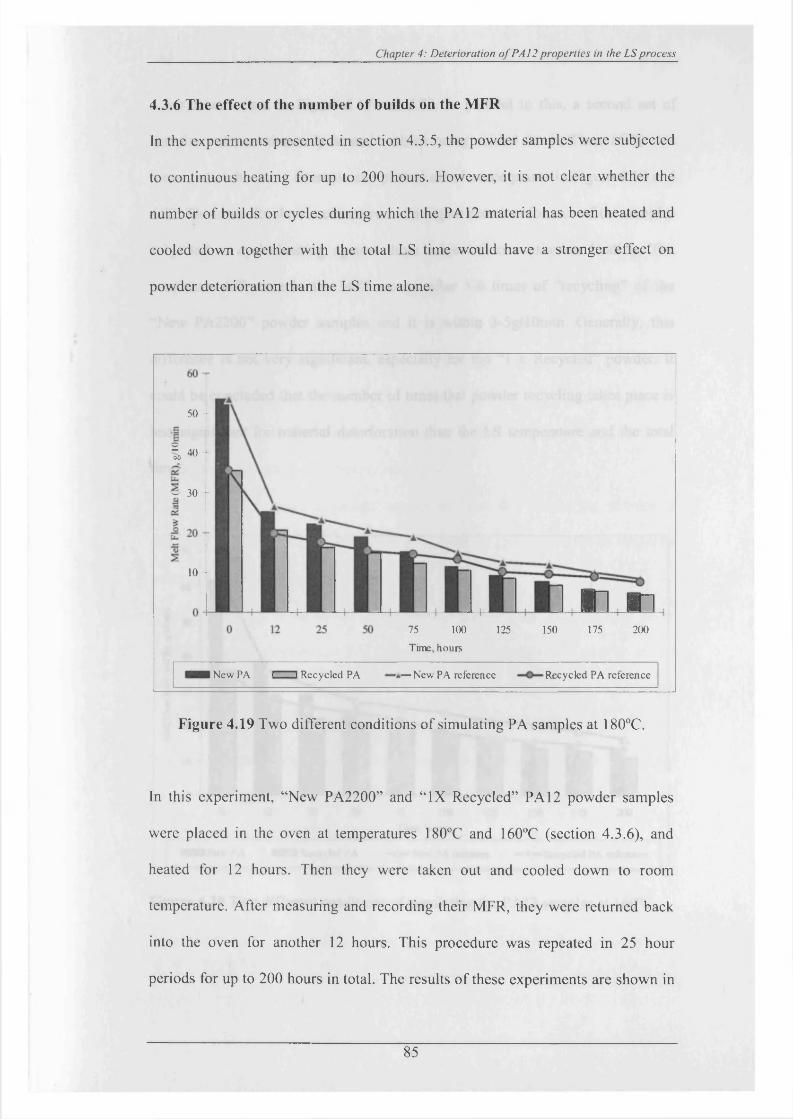
Chapter 4: Deterioration o f PA12 properties in the LS process
4.3.6 The effect of the number of builds on the MFR
In the experiments presented in section 4.3.5, the powder samples were subjected
to continuous heating for up to 200 hours. However, it is not clear whether the
number o f builds or cycles during which the PA 12 material has been heated and
cooled down together with the total LS time would have a stronger effect on
powder deterioration than the LS time alone.
50 -
| 4 0 -
- 30 -
10 - -
I n n175 20075 100
Time, hours
125 150
New PA » i Recycled PA k— New PA reference Recycled PA reference
Figure 4.19 Two different conditions o f simulating PA samples at 180°C.
In this experiment, “New PA2200” and “IX Recycled” PA 12 powder samples
were placed in the oven at temperatures 180°C and 160°C (section 4.3.6), and
heated for 12 hours. Then they were taken out and cooled down to room
temperature. After measuring and recording their MFR, they were returned back
into the oven for another 12 hours. This procedure was repeated in 25 hour
periods for up to 200 hours in total. The results o f these experiments are shown in
85

Chapter 4: Deterioration o f PA 12 properties in the LS process
a bar chart format in Figure 4.19 and 4.20. In parallel to this, a second set o f
samples were continuously heated without being cooled down. Their MFR was
measured at the same intervals and plotted as reference points in Figure 4.19 and
4.20. These results show a clear trend o f a higher deterioration rate o f the samples
subjected to cycle heating against those subjected to continuous heating. The
maximum difference in the MFR occurs after 5-6 times o f “recycling” o f the
“New PA2200” powder samples and it is within 3-5g/10min. Generally, this
difference is not very significant, especially for the “1 x Recycled” powder. It
could be concluded that the number o f times that powder recycling takes place is
less significant for material deterioration than the LS temperature and the total
time.
60 + B j
10 - -
75 100Time, hours
125 150 175 200
New PA Recycled PA New PA refrence '—Recycled PA reference
Figure 4.20 Two different conditions o f simulating the PA12 samples at 160°C.
86
Chapter 4: Deterioration o f PA12 properties in the LS process
4.4 Discussion
PA12-based powders are the most used materials in the LS process for RP and
RM of plastic parts. An average of 80% to 90% of the powdered material in the
building chamber is not sintered during the LS and could be reused. However, the
PA 12 powder properties deteriorate due to the high temperature, close to the
material melting temperature, for a long period of time through the LS building
and cooling cycles. The recycled powder needs to be blended with a sufficient
quantity of new material in order to produce parts with good quality. Adding too
much new powder would increase the cost because of the high cost of the powder
within the total manufacturing cost. Using too old recycled powder or less new
powder would result in poor quality and waste.
The specific LS machine design determines how the unsintering powder is
subjected to heating and cooling during the building and cooling down cycles in
terms of temperature and time.
In all LS machine designs, the temperature in the building chamber after LS is
maintained very close to the PA 12 crystallisation temperature. However, in the
3D Systems LS machines, the build starts to cool down after a certain build height
while in the EOS LS process, this temperature is maintained high until end of the
build. This means that in the second case the unsintered powder would be
subjected to higher temperature for longer time, which ultimately would reduce its
quality more than in the first case.
PA 12 powder is a semi-crystalline polymer whose properties are determined by
the molecular morphology. After being repeatedly recycled during the LS process,
the powder deteriorates and becomes less viscous, which ultimately affects the
quality of the LS process and the part quality. It causes a decrease of the
87
Chapter 4: Deterioration o f PA12 properties in the LS process
crystalline region, enlargement of the chain molecule segments, more efficient
packing, and ultimately larger molecular weight (M -andA /-). Another
consequence of the increased packing of the polymer chains is the higher material
shrinkage and, as a result, poor dimensional accuracy.
Ultimately the powder ageing affects the PA12’s thermal and mechanical
properties. In order to understand this process, samples of PA2200 powder with
different grades were artificially aged in a temperature-controlled oven by heating
at different temperatures and held for different periods of time. DSC analysis was
employed to determine Tm, T , and Tc of the samples. Tm and Tg increase by 4-5
°C with powder usage while Tc reduces insignificantly. Generally, DSC analysis
is not a very practical method for measuring the powder deterioration because it is
relatively slow and expensive and also that the error is compatible with the
resolution.
The MFR or the melt flow viscosity of the samples was also measured and the
results presented in section 4.3.3 show a very good correlation between the MFR
index and the powder age. The MFR index is a very sensitive parameter to the
changes in powder properties and provides a relatively fast and inexpensive
method of measuring the rate of the powder degradation caused by the LS
process.
As shown in Figure 4.19 and Figure 4.20, the new PA12 powder samples with the
lowest viscosity experience the highest deterioration rate in the first 20 hours.
After that, the deterioration rate gradually declines at a lower rate. The PA 12
powder exposed at the higher temperature experienced a much higher
deterioration rate. The temperature at which the unsintered PA 12 material was
exposed and the duration of this exposure are the most influential parameters for
88
Chapter 4: Deterioration o f PA12 properties in the LS process
powder aging and deterioration of material properties. Tests performed in section
4.3.6 proved that the number builds or the number of times powder recycling
takes place is less significant than the LS temperature and total time of the process
on material deterioration.
4.5 Summary
One of the challenges which LS faces is the RM of plastic parts with good
consistent quality. This is due to the fact that plastic powder properties deteriorate
during the long periods of time through the LS building and cooling cycles. The
influences of temperature and time are found to be of significant influence on the
deterioration of PA 12 powder.
89
Chapter 5: Improvement ofpart surface finishing in LS by DOE
CHAPTER 5
IMPROVEMENT OF PART SURFACE FINISHING IN LASER
SINTERING BY EXPERIMENTAL DESIGN OPTIMISATION (DOE)
5.1 Preliminaries
The powder properties and process parameters have a great influence on the
mechanical properties and surface qualities of the LS parts. Therefore, it is
important to obtain a better understanding of the relationship between part quality,
powder properties, and LS process parameters [DTM, 1996a; Gibson and Shi,
1997]. The objectives of this research are to improve the surface quality of parts
produced by Laser Sintering (LS) and to reduce or eliminate the rough surface
texture known as “Orange Peel” by optimising the LS process parameters.
5.2 Fabrication of a part using LS
The details of the fabrication of a part using LS process have been explained in
detail in the previous section 2.2. All of the PA12 powders are processed in a
similar way during the LS process. They are exposed to long heating and cooling
cycles, at temperatures very close to the material melting temperature in a
Nitrogen rich atmosphere. These processing conditions cause physical and
chemical changes of the powdered material and deterioration of its mechanical
and thermal properties. As mentioned previously in section 2.5, the non-sintered
powder can be recycled and reused for another fabrication after being blended
90
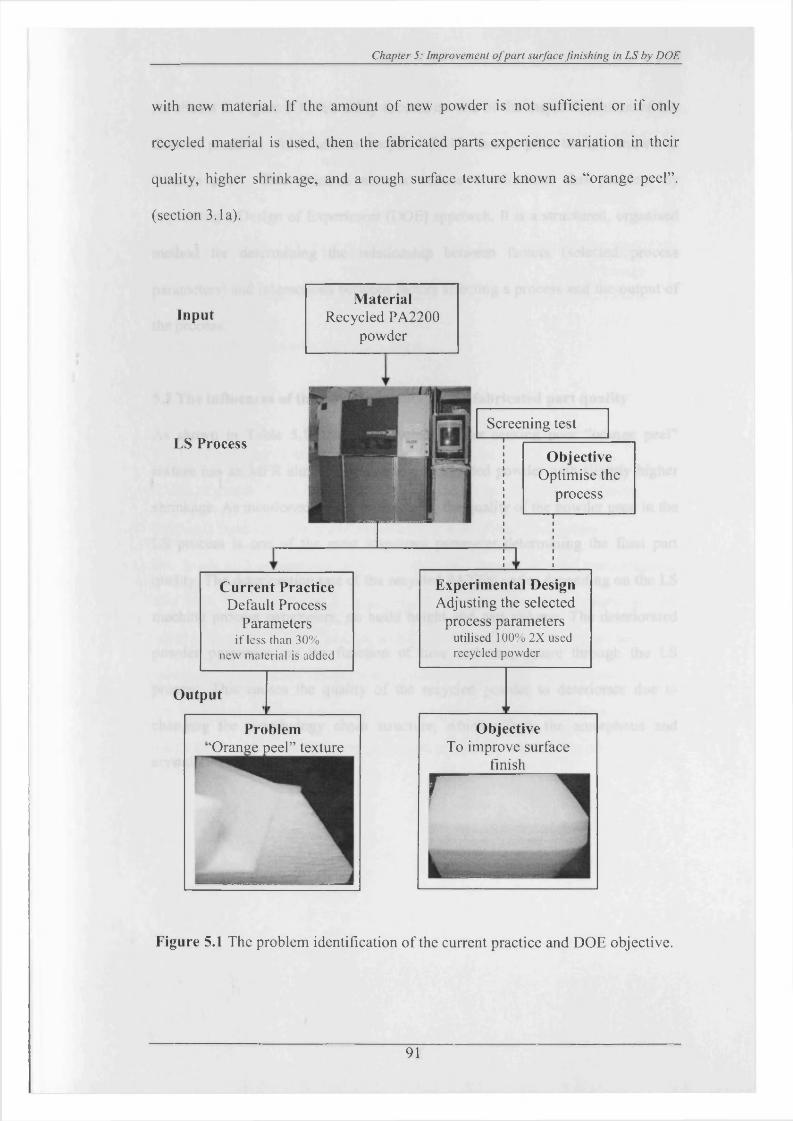
Chapter 5: Improvement o fpart surface finishing in LS by DOE
with new material. If the amount o f new powder is not sufficient or if only
recycled material is used, then the fabricated parts experience variation in their
quality, higher shrinkage, and a rough surface texture known as “orange peel”,
(section 3.1a).
InputMaterial
Recycled PA2200 powder
LS Process
Output
Problem‘Orange peel” texture
Screening test
ObjectiveOptimise the
process
Current Practice Experimental DesignDefault Process Adjusting the selected
Parameters process parametersif less than 30% utilised 100% 2X used
new material is added recycled powder
ObjectiveTo improve surface
finishr
Figure 5.1 The problem identification o f the current practice and DOE objective.
91
Chapter 5: Improvement ofpart surface finishing in LS by DOE
As shown in Figure 5.1, this study focuses on one of the major limitation of LS.
Current practice, which utilises recycled PA 12, causes poor texture known as
“orange peel”. This research aims to reduce or eliminate this problem by
implanting a Design of Experiment (DOE) approach. It is a structured, organised
method for determining the relationship between factors (selected process
parameters) and interactions between factors affecting a process and the output of
the process.
5.3 The influences of the powder quality on the fabricated part quality
As shown in Table 5.1, the old recycled powder causing poor “orange peel”
texture has an MFR almost twice as low as blended powder with slightly higher
shrinkage. As mentioned earlier in chapter 3, the quality of the powder used in the
LS process is one of the most important parameter determining the final part
quality. The deterioration rate of the recycled PA2200 varies depending on the LS
machine process parameters, on build height and part volume. The deteriorated
powder properties are the function of time and temperature through the LS
process. This causes the quality of the recycled powder to deteriorate due to
changing the morphology chain structure, which affects the amorphous and
crystalline regions.
92
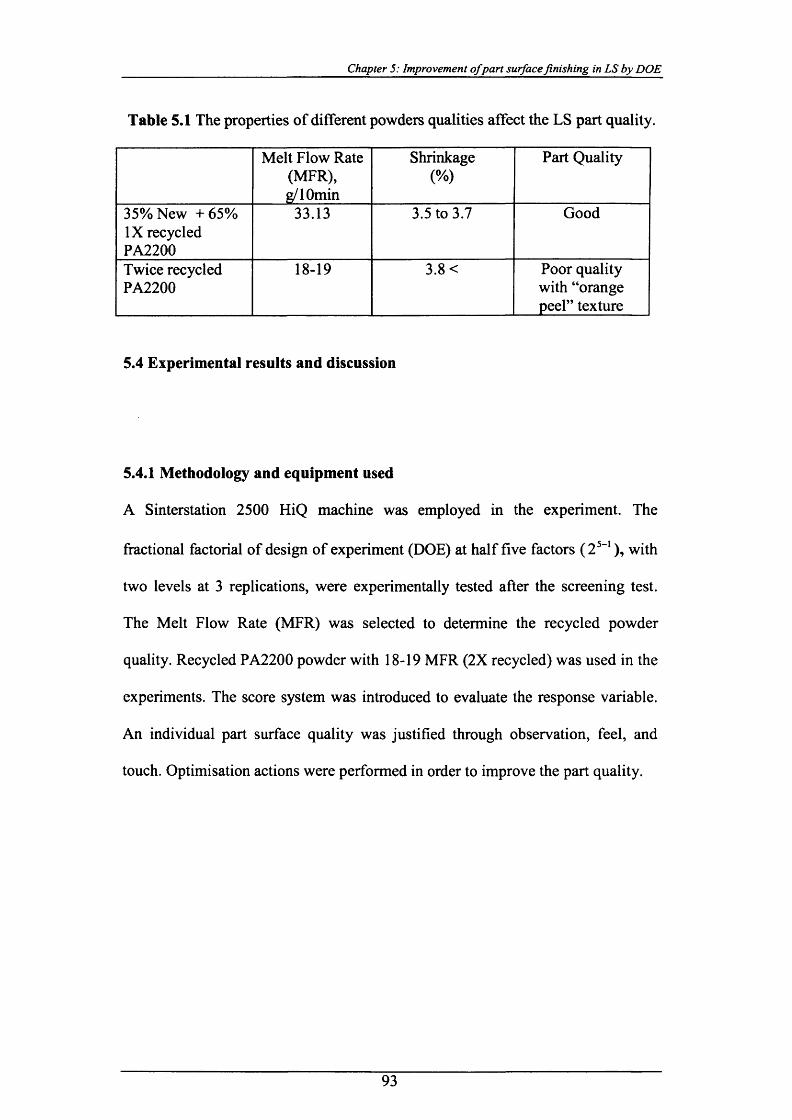
Chapter 5: Improvement ofpart surface finishing in LS by DOE
Table 5.1 The properties of different powders qualities affect the LS part quality.
Melt Flow Rate (MFR), g/lOmin
Shrinkage(%)
Part Quality
35% New +65% IX recycled PA2200
33.13 3.5 to 3.7 Good
Twice recycled PA2200
18-19 3.8 < Poor quality with “orange peel” texture
5.4 Experimental results and discussion
5.4.1 Methodology and equipment used
A Sinterstation 2500 HiQ machine was employed in the experiment. The
fractional factorial of design of experiment (DOE) at half five factors (2 5-1), with
two levels at 3 replications, were experimentally tested after the screening test.
The Melt Flow Rate (MFR) was selected to determine the recycled powder
quality. Recycled PA2200 powder with 18-19 MFR (2X recycled) was used in the
experiments. The score system was introduced to evaluate the response variable.
An individual part surface quality was justified through observation, feel, and
touch. Optimisation actions were performed in order to improve the part quality.
93
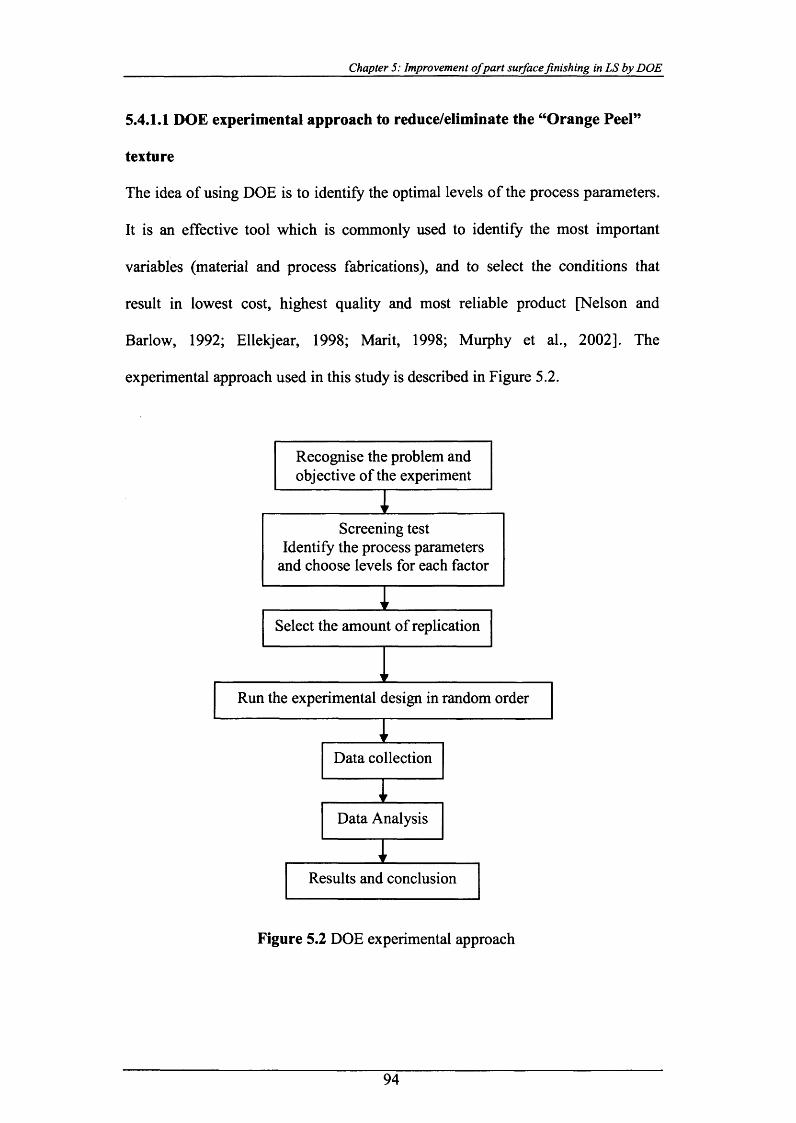
Chapter 5: Improvement ofpart surface finishing in LS by DOE
5.4.1.1 DOE experimental approach to reduce/eliminate the “Orange Peel”
texture
The idea of using DOE is to identify the optimal levels of the process parameters.
It is an effective tool which is commonly used to identify the most important
variables (material and process fabrications), and to select the conditions that
result in lowest cost, highest quality and most reliable product [Nelson and
Barlow, 1992; Ellekjear, 1998; Marit, 1998; Murphy et al., 2002]. The
experimental approach used in this study is described in Figure 5.2.
Data collection
Data Analysis
Results and conclusion
Select the amount of replication
Recognise the problem and objective of the experiment
Run the experimental design in random order
Screening test Identify the process parameters
and choose levels for each factor
Figure 5.2 DOE experimental approach
94
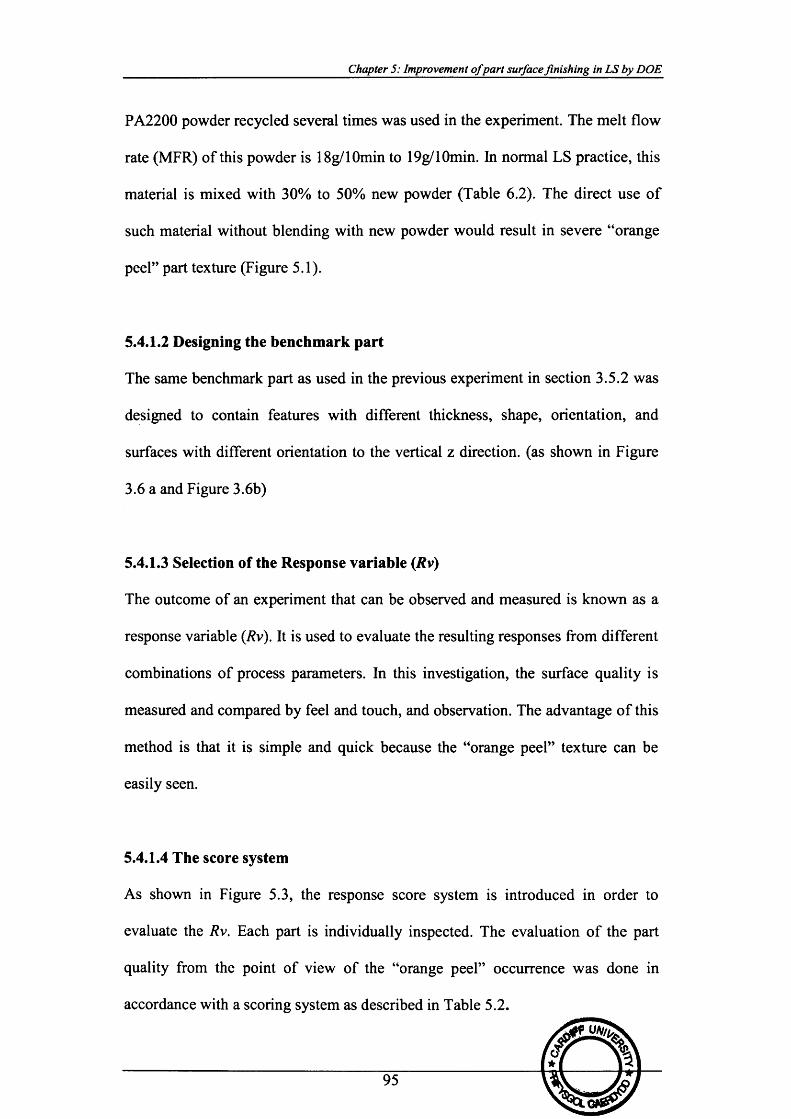
Chapter 5: Improvement ofpart surface finishing in LS by DOE
PA2200 powder recycled several times was used in the experiment. The melt flow
rate (MFR) of this powder is 18g/10min to 19g/10min. In normal LS practice, this
material is mixed with 30% to 50% new powder (Table 6.2). The direct use of
such material without blending with new powder would result in severe “orange
peel” part texture (Figure 5.1).
5.4.1.2 Designing the benchmark part
The same benchmark part as used in the previous experiment in section 3.5.2 was
designed to contain features with different thickness, shape, orientation, and
surfaces with different orientation to the vertical z direction, (as shown in Figure
3.6 a and Figure 3.6b)
5.4.1.3 Selection of the Response variable (Rv)
The outcome of an experiment that can be observed and measured is known as a
response variable (Rv). It is used to evaluate the resulting responses from different
combinations of process parameters. In this investigation, the surface quality is
measured and compared by feel and touch, and observation. The advantage of this
method is that it is simple and quick because the “orange peel” texture can be
easily seen.
5.4.1.4 The score system
As shown in Figure 5.3, the response score system is introduced in order to
evaluate the Rv. Each part is individually inspected. The evaluation of the part
quality from the point of view of the “orange peel” occurrence was done in
accordance with a scoring system as described in Table 5.2.
Chapter 5: Improvement ofpart surface finishing in LS by DOE
Table 5.2 Scoring system for evaluation o f the Rv
Description Score QualityGood surface finish, NO “orange peel”
1 Acceptable
Slightly rougher surface finish, NO “orange peel”
0.5 Acceptable
Small signs of “orange peel” 0 Not Acceptable“orange peel” texture 0 Not Acceptable
The three additional marks are given to any benchmark part which shows good
surface finish and its features. For example, if all features at the bottom of the
benchmark part are perfect (no defects), especially on the 1 mm thickness as
shown in Table 3.3, an additional three points is given. The Rv is calculated based
on the total number of scores divided by 96, which is the total number of surfaces.
96
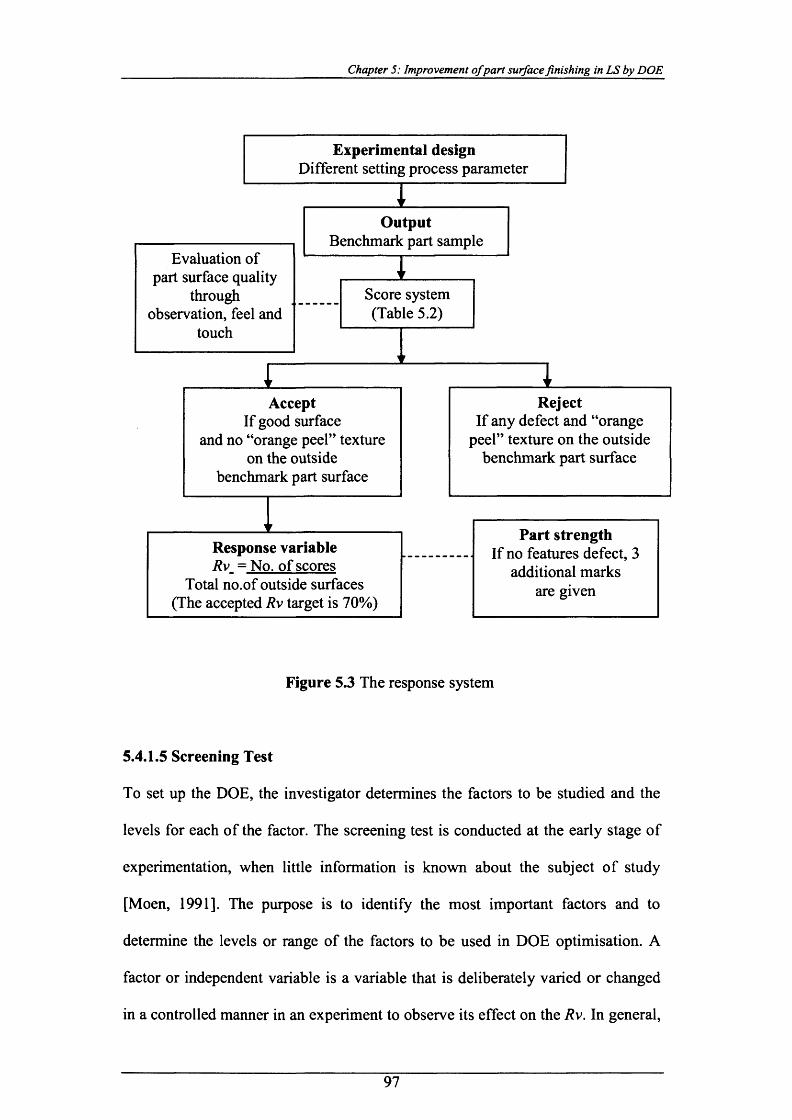
Chapter 5: Improvement ofpart surface finishing in LS by DOE
Score system (Table 5.2)
OutputBenchmark part sample
Experimental designDifferent setting process parameter
Evaluation of part surface quality
through observation, feel and
touch
Part strengthIf no features defect, 3
additional marks are given
Response variableRv = No. of scores
Total no.of outside surfaces (The accepted Rv target is 70%)
AcceptIf good surface
and no “orange peel” texture on the outside
benchmark part surface
RejectIf any defect and “orange
peel” texture on the outside benchmark part surface
Figure 5.3 The response system
5.4.1.5 Screening Test
To set up the DOE, the investigator determines the factors to be studied and the
levels for each of the factor. The screening test is conducted at the early stage of
experimentation, when little information is known about the subject o f study
[Moen, 1991]. The purpose is to identify the most important factors and to
determine the levels or range of the factors to be used in DOE optimisation. A
factor or independent variable is a variable that is deliberately varied or changed
in a controlled manner in an experiment to observe its effect on the Rv. In general,
97
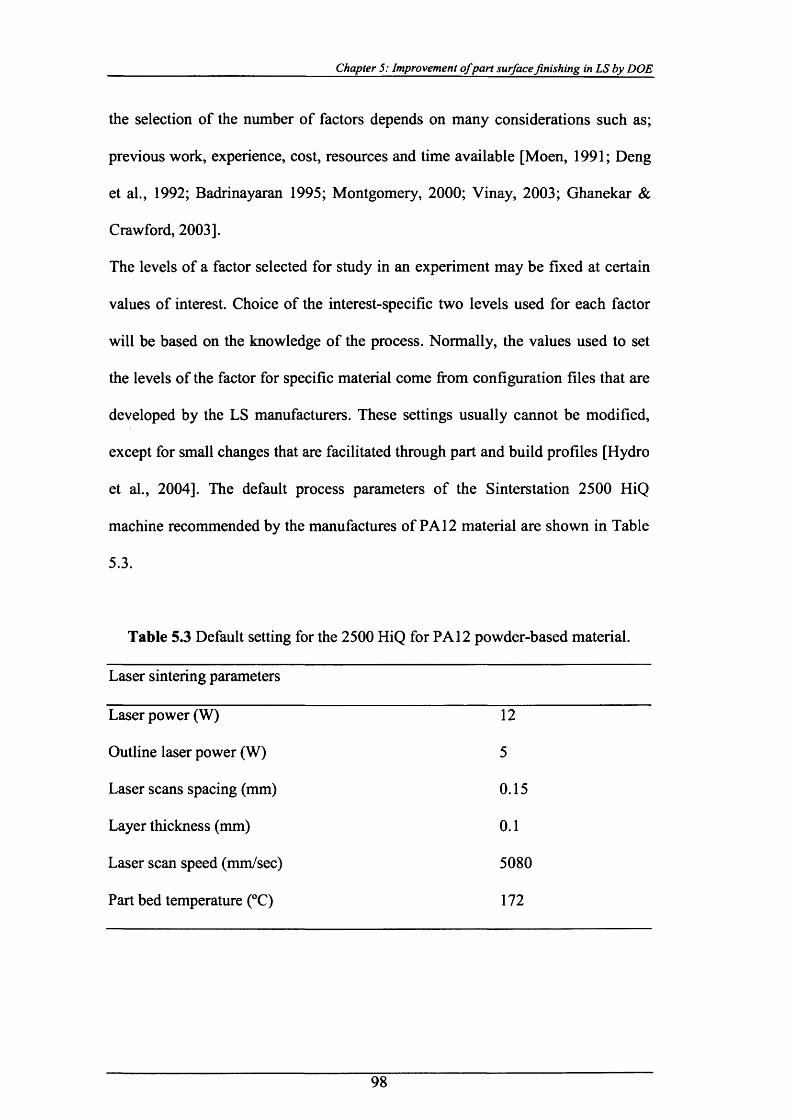
Chapter 5: Improvement ofpart surface finishing in LS by DOE
the selection of the number of factors depends on many considerations such as;
previous work, experience, cost, resources and time available [Moen, 1991; Deng
et al., 1992; Badrinayaran 1995; Montgomery, 2000; Vinay, 2003; Ghanekar &
Crawford, 2003].
The levels of a factor selected for study in an experiment may be fixed at certain
values of interest. Choice of the interest-specific two levels used for each factor
will be based on the knowledge of the process. Normally, the values used to set
the levels of the factor for specific material come from configuration files that are
developed by the LS manufacturers. These settings usually cannot be modified,
except for small changes that are facilitated through part and build profiles [Hydro
et al., 2004]. The default process parameters of the Sinterstation 2500 HiQ
machine recommended by the manufactures of PA 12 material are shown in Table
5.3.
Table 5.3 Default setting for the 2500 HiQ for PA 12 powder-based material.
Laser sintering parameters
Laser power (W) 12
Outline laser power (W) 5
Laser scans spacing (mm) 0.15
Layer thickness (mm) 0.1
Laser scan speed (mm/sec) 5080
Part bed temperature (°C) 172
98
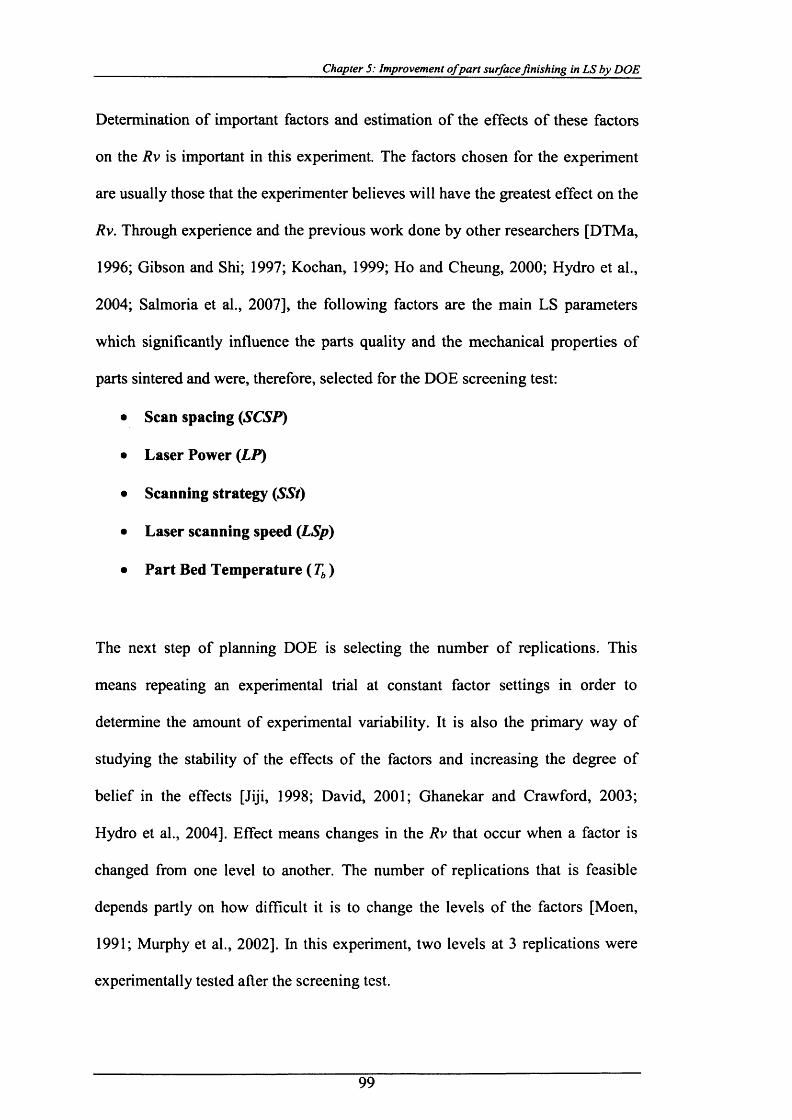
Chapter 5: Improvement ofpart surface finishing in LS by DOE
Determination of important factors and estimation of the effects of these factors
on the Rv is important in this experiment. The factors chosen for the experiment
are usually those that the experimenter believes will have the greatest effect on the
Rv. Through experience and the previous work done by other researchers [DTMa,
1996; Gibson and Shi; 1997; Kochan, 1999; Ho and Cheung, 2000; Hydro et al.,
2004; Salmoria et al., 2007], the following factors are the main LS parameters
which significantly influence the parts quality and the mechanical properties of
parts sintered and were, therefore, selected for the DOE screening test:
• Scan spacing (SCSP)
• Laser Power (LP)
• Scanning strategy (SSt)
• Laser scanning speed (LSp)
• Part Bed Temperature ( Tb)
The next step of planning DOE is selecting the number of replications. This
means repeating an experimental trial at constant factor settings in order to
determine the amount of experimental variability. It is also the primary way of
studying the stability of the effects of the factors and increasing the degree of
belief in the effects [Jiji, 1998; David, 2001; Ghanekar and Crawford, 2003;
Hydro et al., 2004]. Effect means changes in the Rv that occur when a factor is
changed from one level to another. The number of replications that is feasible
depends partly on how difficult it is to change the levels of the factors [Moen,
1991; Murphy et al., 2002]. In this experiment, two levels at 3 replications were
experimentally tested after the screening test.
99
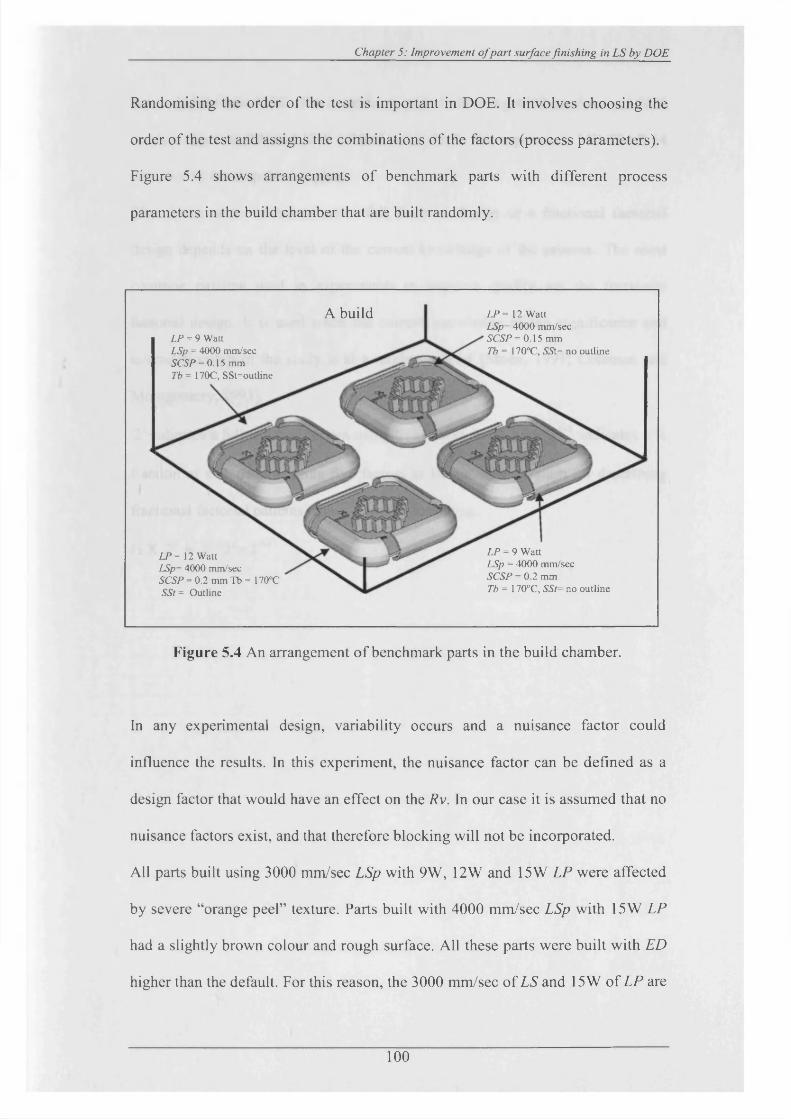
Chapter 5: Improvement o fpart surface finishing in LS by DOE
Randomising the order o f the test is important in DOE. It involves choosing the
order o f the test and assigns the combinations o f the factors (process parameters).
Figure 5.4 shows arrangements o f benchmark parts with different process
parameters in the build chamber that are built randomly.
LP = 9 Watt LSp = 4000 mm/sec SCSP = 0.15 mm Tb = 170C, SSt=outline
LP= 12 Watt LSp= 4000 mm/sec SCSP = 0.2 mm Tb = 170°C SSt = Outline
LP = 9 WattLSp = 4000 mm/secSCSP = 0.2 mmTb = 170°C, SSt= no outline
A build LP = 12 Watt LSp= 4000 mm/sec SCSP =0.15 mm Tb = 170°C, SSl= no outline
Figure 5.4 An arrangement o f benchmark parts in the build chamber.
In any experimental design, variability occurs and a nuisance factor could
influence the results. In this experiment, the nuisance factor can be defined as a
design factor that would have an effect on the Rv. In our case it is assumed that no
nuisance factors exist, and that therefore blocking will not be incorporated.
All parts built using 3000 mm/sec LSp with 9W, 12W and 15W LP were affected
by severe “orange peel” texture. Parts built with 4000 mm/sec LSp with 15W LP
had a slightly brown colour and rough surface. All these parts were built with ED
higher than the default. For this reason, the 3000 mm/sec o f LS and 15W o f LP are
100
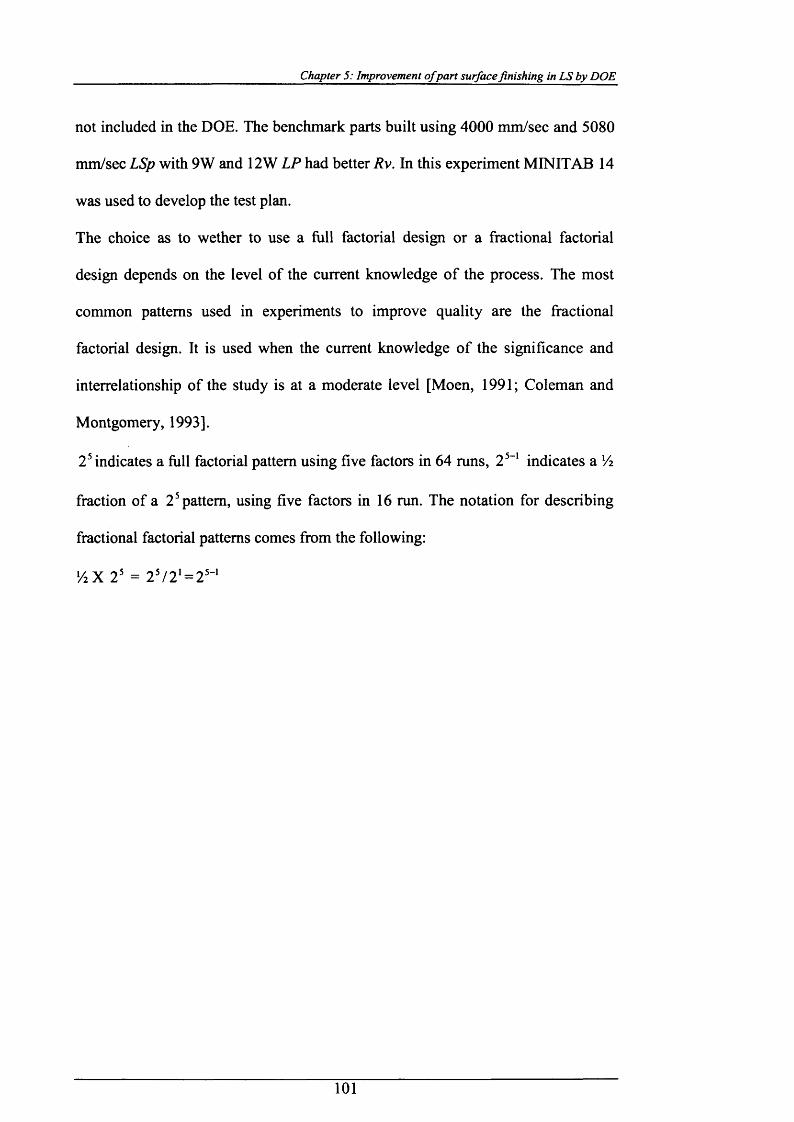
Chapter 5: Improvement ofpart surface finishing in LS by DOE
not included in the DOE. The benchmark parts built using 4000 mm/sec and 5080
mm/sec LSp with 9W and 12W LP had better Rv. In this experiment MINITAB 14
was used to develop the test plan.
The choice as to wether to use a full factorial design or a fractional factorial
design depends on the level of the current knowledge of the process. The most
common patterns used in experiments to improve quality are the fractional
factorial design. It is used when the current knowledge of the significance and
interrelationship of the study is at a moderate level [Moen, 1991; Coleman and
Montgomery, 1993].
25 indicates a full factorial pattern using five factors in 64 runs, 25-1 indicates a Vi
fraction of a 25 pattern, using five factors in 16 run. The notation for describing
fractional factorial patterns comes from the following:
ViX 25 = 25/2 1 = 25' 1
101

Chapter 5: Improvement ofpart surface finishing in LS by DOE
The structure of the DOE test plan allows all the data from the experiment to be
used to study each factor.
Table 5.4 The matrix of DOE factional factorial of half five factors at two levels
25"1.
Benc
hmar
k pa
rt te
st
Run
Ord
er
Factors
Ener
gy
dens
ity
(ED
), J/
mm
2
Response variable (Pv)
Build
tim
e (%
)
Lase
r po
wer
(LP)
, W
Lase
r Sp
eed
(LSp
), m
m/s
ec
Scan
Sp
acin
g (S
CSP
), m
m
Part
bed
tem
pera
ture
(T
b);5C
Scan
ning
str
ateg
y (S
St)
Rep
licat
ion
1
Repl
icat
ion
2
Rep
licat
ion
3
Ave
rage
R
v
1 1 9 4000 0.15 170 Yes 0.022 58 52 59 56 1.23
2 5 12 5080 0.15 172 No 0.016 52 47 50 50 -0.04
3 9 9 4000 0.15 172 No 0.015 60 56 57 58 1.04
4 13 9 5080 0.2 170 Yes 0.014 34 41 40 38 -0.26
5 10 12 4000 0.2 172 No 0.015 20 23 22 22 1
6 6 12 5080 0.2 172 Yes 0.017 49 54 52 52 -0.26
7 2 12 4000 0.15 170 No 0.020 55 47 53 52 1.04
8 14 9 5080 0.15 170 No 0.012 44 48 45 46 -0.04
9 3 12 4000 0.2 170 Yes 0.020 41 37 42 40 1.25
10 15 12 5080 0.2 170 No 0.012 50 46 47 48 -0.22
11 11 9 4000 0.2 172 Yes 0.016 45 44 45 44 1.25
12 16 12 5080 0.15 170 Yes 0.022 62 60 59 60 default
13 4 9 4000 0.2 170 No 0.011 56 59 54 56 1
14 7 9 5080 0.15 172 Yes 0.018 37 35 37 36 default
15 12 12 4000 0.15 172 Yes 0.027 54 55 58 56 1.23
16 8 9 5080 0.2 172 No 0.009 50 53 48 50 -0.22
• (-) lower than default build time, (+) higher than default build time
Table 5.4 shows the matrix of DOE factional factorial of half five factors at two
levels 25-1. The build time of each part was compared to the standard build time,
which used the default setting LS process parameter. As shown in Table 5.4, the
benchmark test part no. 12 and benchmark test part no.5 were observed as being
the best and the worst Rv results. The build time of benchmark parts (test) no. 12
and 14 were found to be the same standard build time, which is 4.56.23 hours
102

Chapter 5: Improvement ofpart surface finishing in LS by DOE
(default). It was found that the level of the factors determined the build time. For
instance, the build time of all benchmark test parts which employed 4000 mm/sec
(LSp) were slightly higher than the standard build time by increasing 1.04% to
1.23% due to lower LSp. However, the build time results of all benchmark test
parts which used 5080 mm/sec (LSp) were found to be not much different
compare to standard times (less than 1%).
5.4.2 Results and Analysis of DOE
As mentioned earlier in section 5.4.1, the DOE experiments were performed for
16 run fractional factorial designs with 3 replications. The average Rv was taken
and further analysed using the Minitab 14.0 software.
The normal probability plot of the effects graph is used for assessing whether or
not a data set is approximately distributed. The data are plotted against a
theoretical normal distribution in such a way that the points form an
approximately straight line. Departures from this straight line indicate departures
from normality.
103
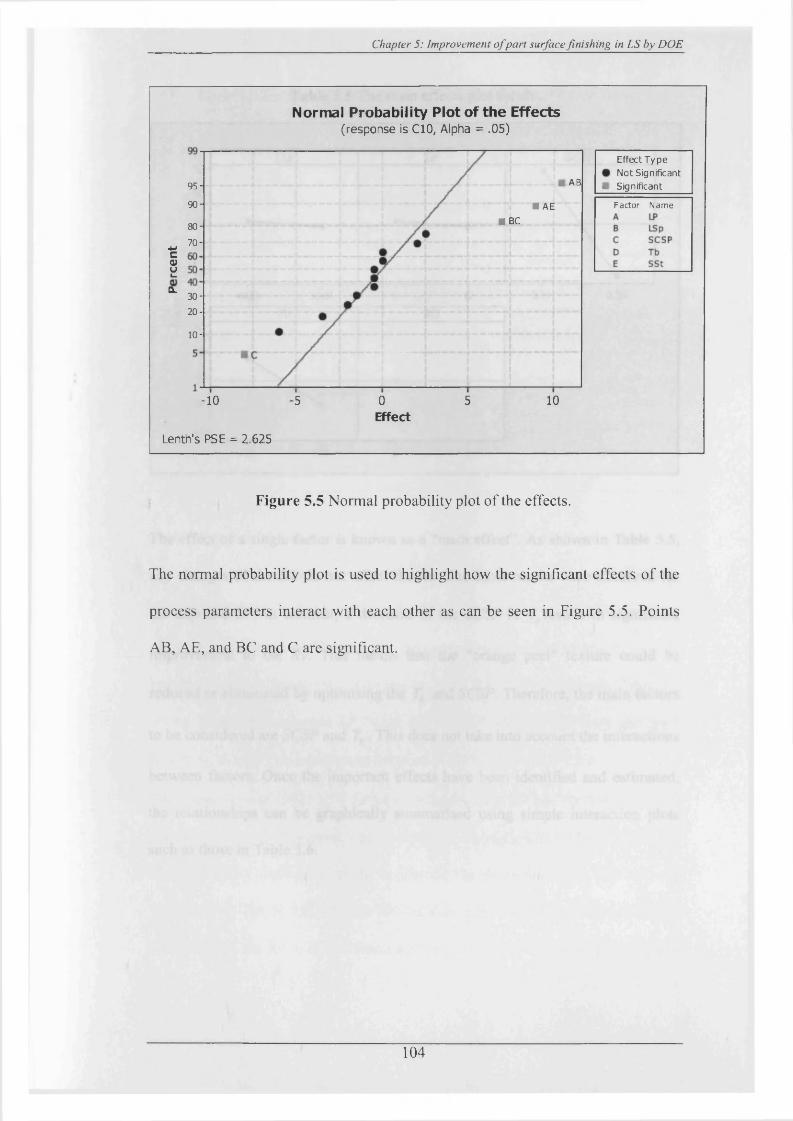
Chapter 5: Improvement o fpart surface finishing in LS by DOE
Normal Probability Plot of the Effects(response is CIO, Alpha = .05)
A B95-
90- ■ AE■ BC80-
70-4-»CVuL .
a.30-
2 0 -
1 0 -
10-10 05 5
Lenth’s PSE = 2.625
Effect
Effect Type Not Significant Significant
Factor N am e
Figure 5.5 Normal probability plot o f the effects.
The normal probability plot is used to highlight how the significant effects o f the
process parameters interact with each other as can be seen in Figure 5.5. Points
AB, AE, and BC and C are significant.
104
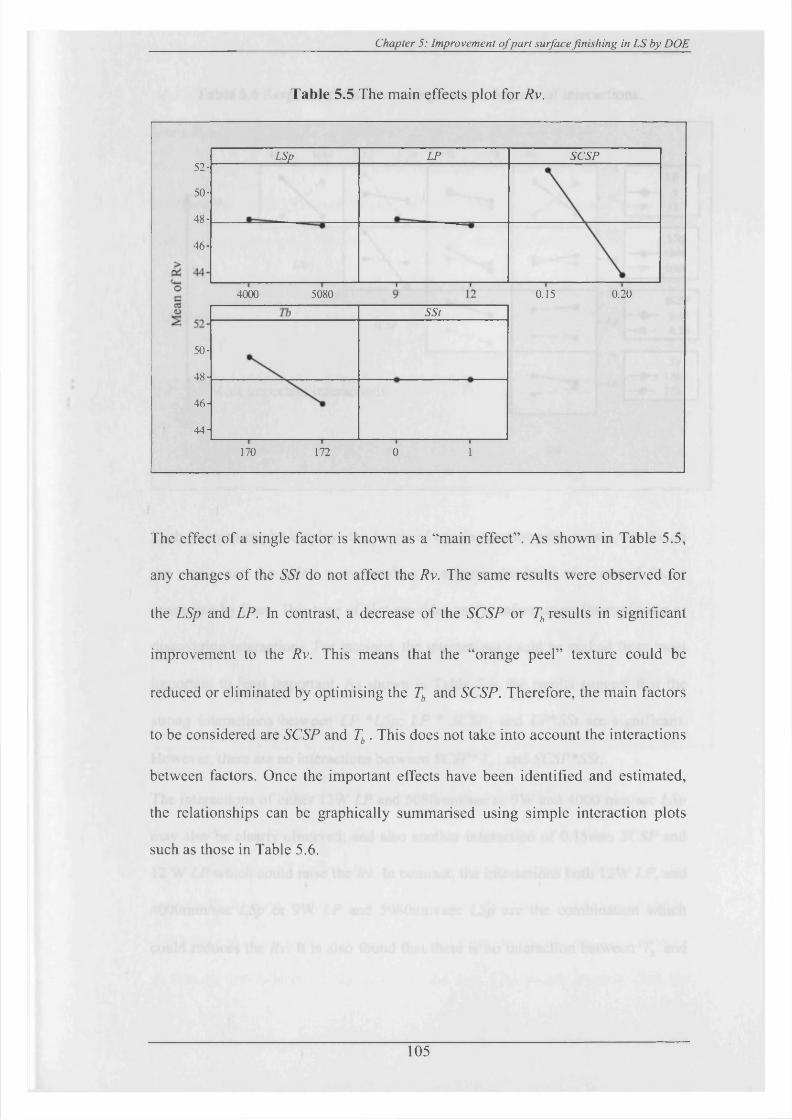
Chapter 5: Improvement ofpart surface finishing in LS by DOE
Table 5.5 The main effects plot for Rv.
LSp S C S PLP52-
50-
48-
46-
0.204000 5080 0.15
SSt
50-
48-
46-
44-
170 172 0 1
The effect o f a single factor is known as a “main effect”. As shown in Table 5.5,
any changes o f the SSt do not affect the Rv. The same results were observed for
the LSp and LP. In contrast, a decrease o f the SCSP or Tb results in significant
improvement to the Rv. This means that the “orange peel” texture could be
reduced or eliminated by optimising the Tb and SCSP. Therefore, the main factors
to be considered are SCSP and Tb . This does not take into account the interactions
between factors. Once the important effects have been identified and estimated,
the relationships can be graphically summarised using simple interaction plots
such as those in Table 5.6.
105
Chapter 5: Improvement o f part surface finishing in LS by DOE
Table 5.6 Response plots illustrating various degrees o f interactions.
5080 0.15 0.20 170 172 Yes4000 NoI- 56
LP
- 48
- 56L Sp
% 4000— m - 5080
- 48LSp
- 56SCSP
• 0.15
— ■ - 0.20- 48SCSP
- 56 Tb170
• * - 172- 48Most important interactions
SSt
Each interaction plot displays the levels o f one factor along the x-axis, the Rv on
the y-axis, and the points corresponding to a particular level o f a second factor
connected by lines. This type o f plot provides useful information for exploring or
discovering interactions. For instance, the interactions could be ranked from most
important to least important. As shown in Table 5.6, the results suggest that the
strong interactions between LP *LSp; LP * SCSP, and LP*SSt are significant.
However, there are no interactions between SCSP* Tb; and SCSP*SSt.
The interactions o f either 12W LP and 5080mm/sec or 9W and 4000 mm/sec LSp
may also be clearly observed; and also another interaction o f 0.15mm SCSP and
12 W LP which could raise the Rv. In contrast, the interactions both 12W LP, and
4000mm/sec LSp or 9W LP and 5080mm/sec LSp are the combination which
could reduces the Rv. It is also found that there is no interaction between Tb and
106

i^napier j : improvement o jp a r i surjacejim sning in oy u u c .
SSt. A similar result may also be observed in Table 5.6, where there is no
interaction between, SCSP and SSt.
The interaction analysis o f the variables could also be presented as a 3D surface o f
the response Rv. DOE allows the study o f interactions between factors. Figure 5.6
and Figure 5.7 show a geometric display. Each comer o f the square corresponds
to a different set o f combinations o f the factors. The value o f the Rv obtained from
each test is written at the z axis on the left side.
The highest Rv point
480(fLSp, (mm/sec)4400
4000LP. (W)
Figure 5.6 Surface plot o f Rv vs LP, LSp.
As shown in Figure 5.6, the factor 1, LP is studied by comparing the data on the
left side o f the cube to the data on the right side. The factor 2, LSp is studied by
comparing the front to the back, and the Rv o f these two factors can be studied by
comparing the bottom o f the cube to the top. The results suggest that the
107
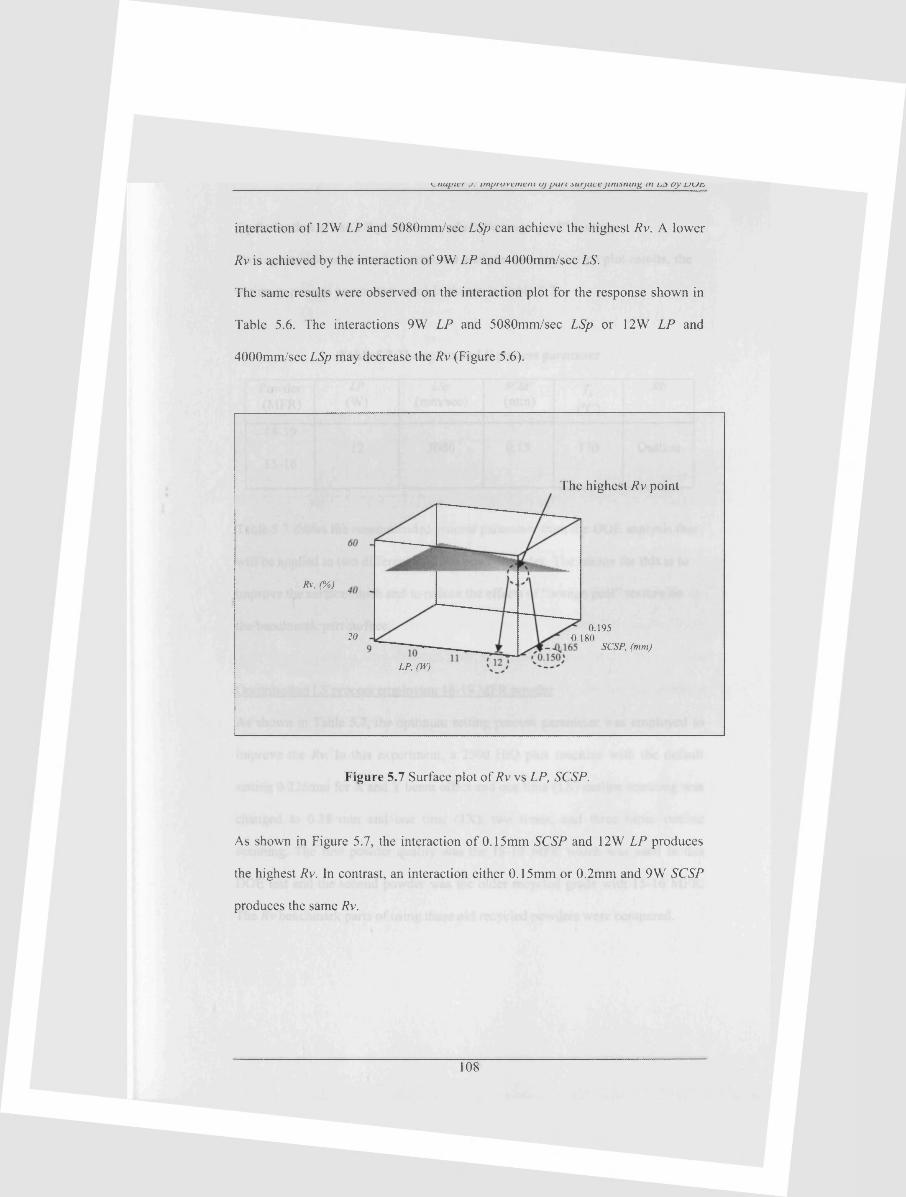
^nu pier j . im provem ent uj p a r i su rja ce jim sn in g in l,o o y u u r .
interaction o f 12W LP and 5080m m /sec LSp can achieve the highest Rv. A lower
Rv is achieved by the interaction o f 9W LP and 4000m m /sec LS.
The same results were observed on the interaction plot for the response shown in
Table 5.6. The interactions 9W LP and 5080m m /sec LSp or 12W LP and
4000mm/sec LSp may decrease the Rv (Figure 5.6).
The highest Rv point
Rv. (%)
0.19520 0.180
SCSP, (mm)
LP, (W)
Figure 5.7 Surface plot o f Rv vs LP, SCSP.
As shown in Figure 5.7, the interaction o f 0.15mm SCSP and 12W LP produces
the highest Rv. In contrast, an interaction either 0.15mm or 0.2mm and 9W SCSP
produces the same Rv.
108
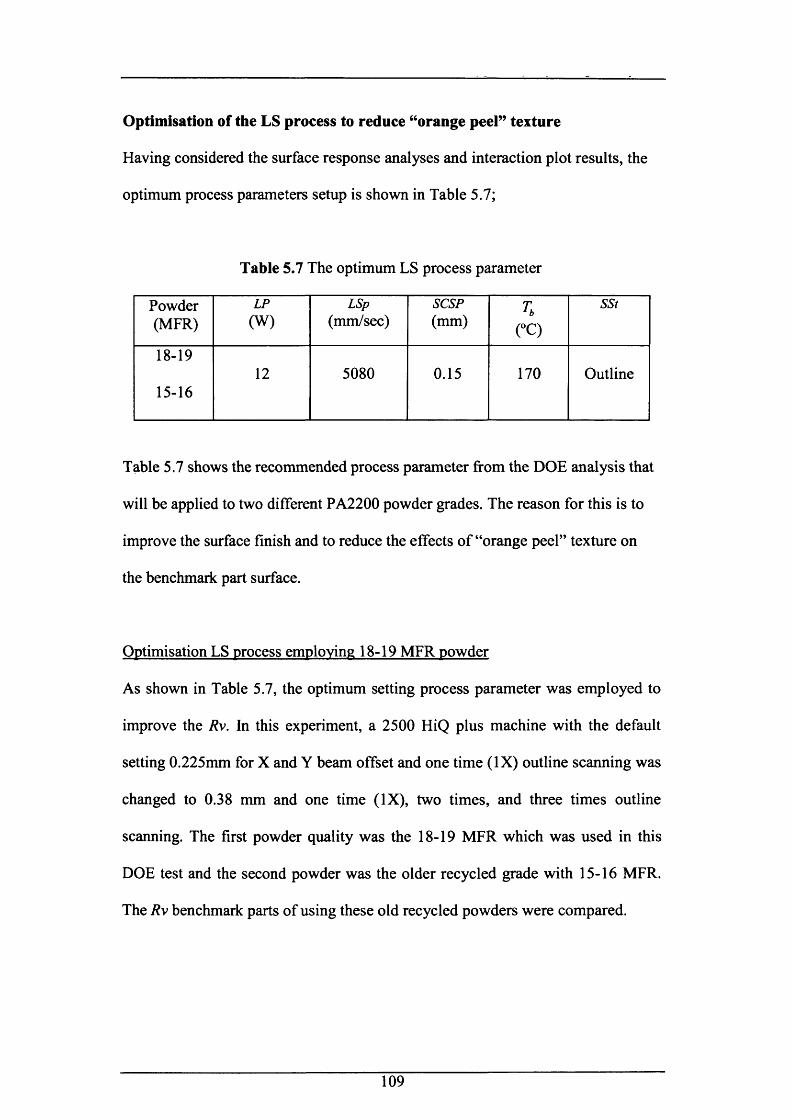
Optimisation of the LS process to reduce “orange peel” texture
Having considered the surface response analyses and interaction plot results, the
optimum process parameters setup is shown in Table 5.7;
Table 5.7 The optimum LS process parameter
Powder(MFR)
LP(W)
LSp(mm/sec)
SCSP(mm)
TbCO
SSt
18-19
15-1612 5080 0.15 170 Outline
Table 5.7 shows the recommended process parameter from the DOE analysis that
will be applied to two different PA2200 powder grades. The reason for this is to
improve the surface finish and to reduce the effects of “orange peel” texture on
the benchmark part surface.
Optimisation LS process employing 18-19 MFR powder
As shown in Table 5.7, the optimum setting process parameter was employed to
improve the Rv. In this experiment, a 2500 HiQ plus machine with the default
setting 0.225mm for X and Y beam offset and one time (IX) outline scanning was
changed to 0.38 mm and one time (IX), two times, and three times outline
scanning. The first powder quality was the 18-19 MFR which was used in this
DOE test and the second powder was the older recycled grade with 15-16 MFR.
The Rv benchmark parts of using these old recycled powders were compared.
109

Table 5.8 The optimisation experiment results of employing 18-19 MFR
Powder
MFR
SSt
(No.oftimes
outlinescan)
Beam offset
Fill laser power X &Y ,(mm)
Beamoffset
Outlinelaser
powerX & Y,(mm)
Rv
(%)
Energy
Density
(ED),
J/mm2
Shrinkage
(%)
Build time
(%)
18-19 IX 0.38 -0.1 21 0.022 Delamination default
18-19 IX 0.38 0.1 62 0.022 3.72 default
18-19 2X 0.38 0.1 58 0.029 3.78 +0.82
18-19 3X 0.38 0.1 46 0.036 3.82 +0.98
18-19 IX 0.38 0.2 66 0.022 3.68 default
18-19 2X 0.38 0.2 78 0.029 3.65 +0.82
18-19 3X 0.38 0.2 65 0.036 3.76 +0.98
As shown in Table 5.8, changes of the setting level of beam offset fill to 0.38 mm
and outline 0.1 & 0.2 better observed the Rv results than the DOE result (Table
5.4). Three repetition tests with one layer build were performed and the old used
PA2200 with 18-19 MFR was employed. As noted in Figure 5.3, the accepted
score of Rv is 70%. The average of Rv for this optimisation experiment is 78%.
This means the Rv target is achieved.
The beam offset of the machine is 0.2 mm in the x and y axis. When the beam
offset is set to a lower value, as it is in our experiments for trials with 0.1 and -0.1,
the processed parts will be slightly bigger. In our case, the main reason was to
study the effect of the beam offset on the “orange peel” texture regardless of the
accuracy.
110
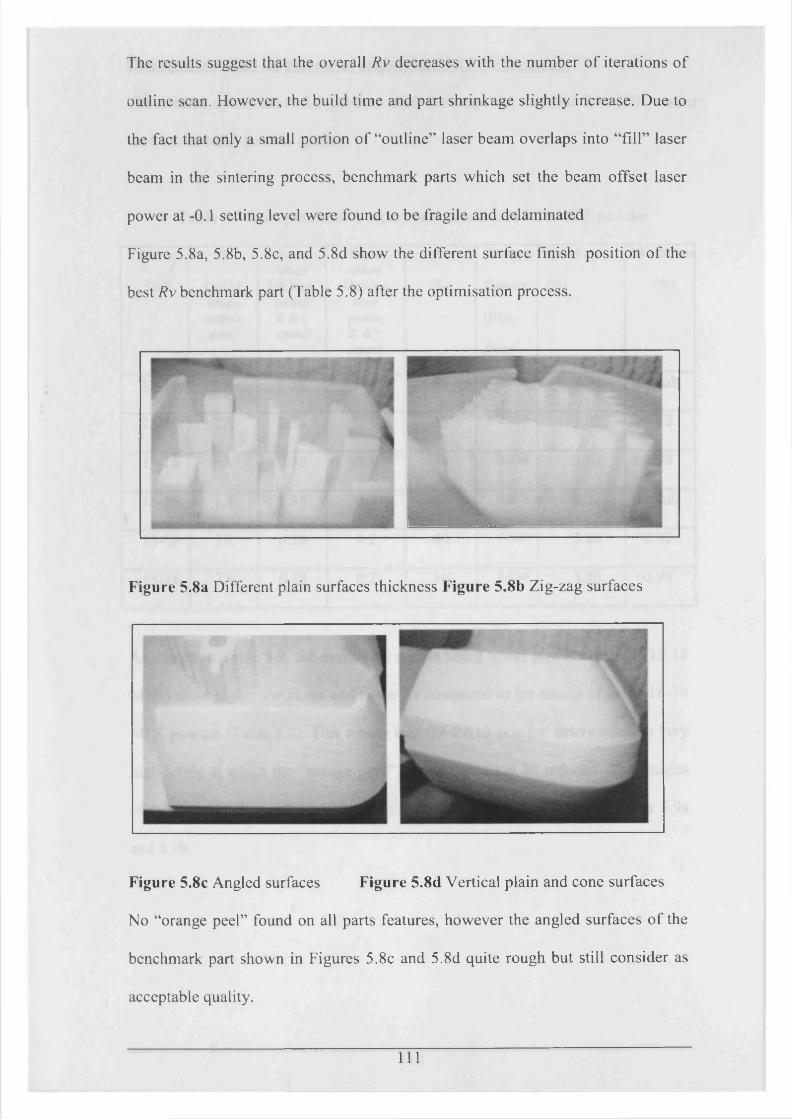
The results suggest that the overall Rv decreases with the number o f iterations o f
outline scan. However, the build time and part shrinkage slightly increase. Due to
the fact that only a small portion o f “outline” laser beam overlaps into “fill” laser
beam in the sintering process, benchmark parts which set the beam offset laser
power at -0.1 setting level were found to be fragile and delaminated
Figure 5.8a, 5.8b, 5.8c, and 5.8d show the different surface finish position o f the
best Rv benchmark part (Table 5.8) after the optimisation process.
I K
Figure 5.8a Different plain surfaces thickness Figure 5.8b Zig-zag surfaces
Figure 5.8c Angled surfaces Figure 5.8d Vertical plain and cone surfaces
N o “orange peel” found on all parts features, however the angled surfaces o f the
benchmark part shown in Figures 5.8c and 5.8d quite rough but still consider as
acceptable quality.
ITT "
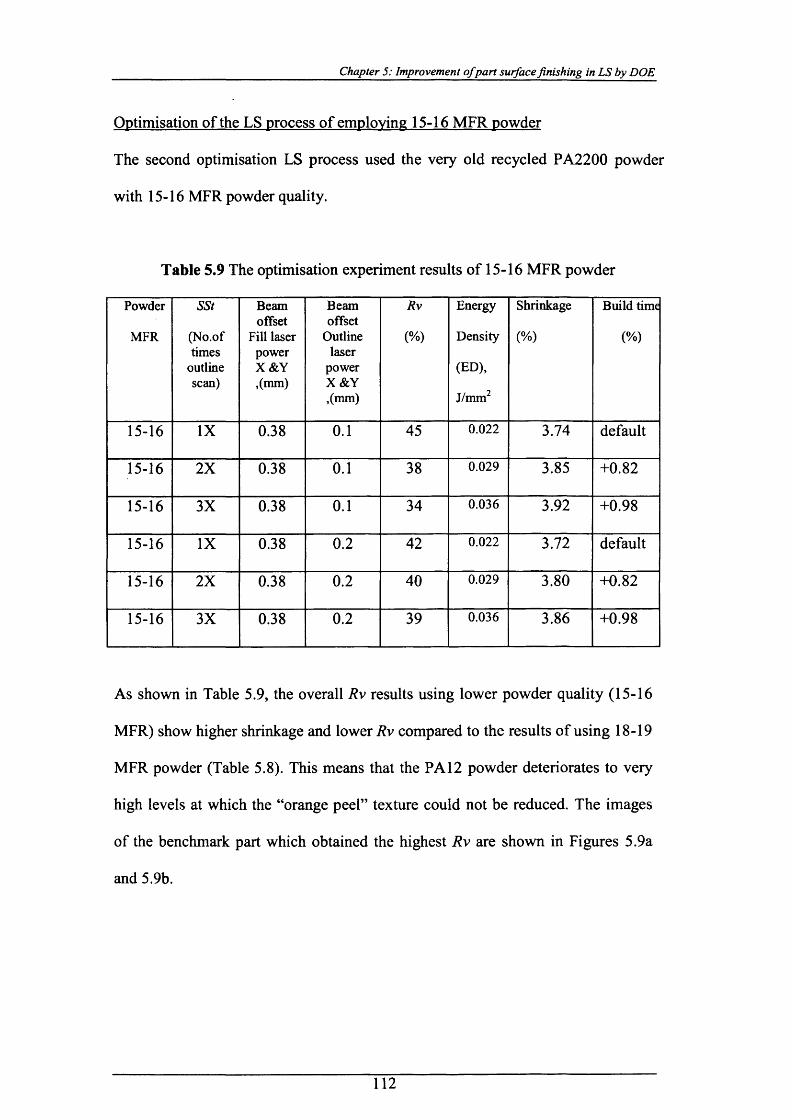
Chapter 5: Improvement ofpart surface finishing in LS by DOE
Optimisation of the LS process of employing 15-16 MFR powder
The second optimisation LS process used the very old recycled PA2200 powder
with 15-16 MFR powder quality.
Table 5.9 The optimisation experiment results of 15-16 MFR powder
Powder
MFR
SSt
(No.oftimes
outlinescan)
Beam offset
Fill laser power X & Y ,(mm)
Beamoffset
Outlinelaser
powerX & Y,(mm)
Rv
(%)
Energy
Density
(ED),
J/mm2
Shrinkage
(%)
Build time
(%)
15-16 IX 0.38 0.1 45 0.022 3.74 default
15-16 2X 0.38 0.1 38 0.029 3.85 +0.82
15-16 3X 0.38 0.1 34 0.036 3.92 +0.98
15-16 IX 0.38 0.2 42 0.022 3.72 default
15-16 2X 0.38 0.2 40 0.029 3.80 +0.82
15-16 3X 0.38 0.2 39 0.036 3.86 +0.98
As shown in Table 5.9, the overall Rv results using lower powder quality (15-16
MFR) show higher shrinkage and lower Rv compared to the results of using 18-19
MFR powder (Table 5.8). This means that the PA 12 powder deteriorates to very
high levels at which the “orange peel” texture could not be reduced. The images
of the benchmark part which obtained the highest Rv are shown in Figures 5.9a
and 5.9b.
112
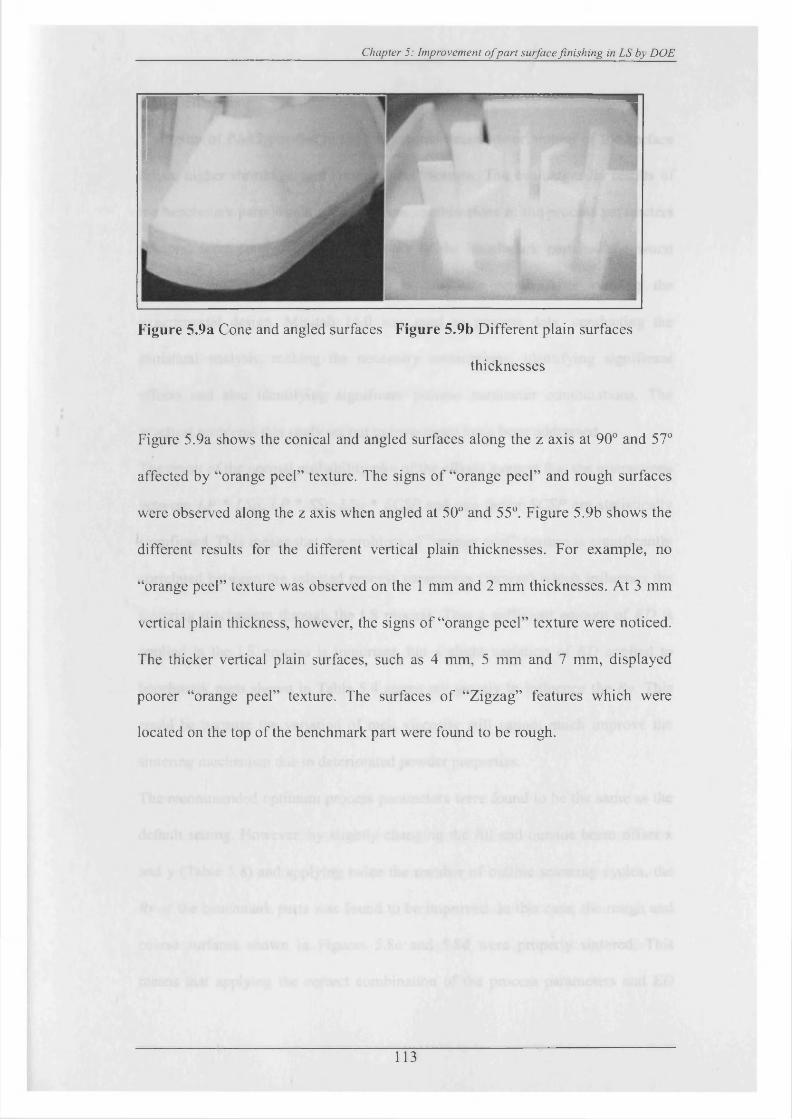
Chapter 5: Improvement ofpart surface finishing in LS by DOE
Figure 5.9a Cone and angled surfaces Figure 5.9b Different plain surfaces
thicknesses
Figure 5.9a shows the conical and angled surfaces along the z axis at 90° and 57°
affected by “orange peel” texture. The signs of “orange peel” and rough surfaces
were observed along the z axis when angled at 50° and 55°. Figure 5.9b shows the
different results for the different vertical plain thicknesses. For example, no
“orange peel” texture was observed on the 1 mm and 2 mm thicknesses. At 3 mm
vertical plain thickness, however, the signs of “orange peel” texture were noticed.
The thicker vertical plain surfaces, such as 4 mm, 5 mm and 7 mm, displayed
poorer “orange peel” texture. The surfaces of “Zigzag” features which were
located on the top of the benchmark part were found to be rough.
113
Chapter 5: Improvement ofpart surface finishing in LS by DOE
5.5 Discussions
The reuse of PA 12 powder in the LS process causes deterioration of the surface
finish, higher shrinkage, and “orange peel” texture. The evaluation Rv results of
the benchmark parts which used different combinations of the process parameters
(factors) were compared. The lowest Rv o f the benchmark part has the worst
“orange peel” texture and its surfaces are very rough After running the
experimental design, Minitab 14.0 was used to process data, conducting the
statistical analysis, making the necessary assumptions, identifying significant
effects and also identifying significant process parameter combinations. The
practical problems this study set out to investigate have been addressed.
The result of the normal probability plot of the effects suggest that the interactions
between LP * LSp, LP * SSt; LSp * SCSP and one factor SCSP are statistically
significant. This means that the problem of “orange peel” texture is significantly
correlated between the selected process parameters (factors) which influence the
sintering mechanism through the LS process. That a sufficient amount of ED is
applied in the LS process is important, but a slight variation of ED applied to
benchmark parts shown in Table 5.4 seems not greatly to influence the Rv. This
could be because the variation of melt viscosity still cannot much improve the
sintering mechanism due to deteriorated powder properties.
The recommended optimum process parameters were found to be the same as the
default setting. However, by slightly changing the fill and outside beam offset x
and y (Table 5.8) and applying twice the number of outline scanning cycles, the
Rv o f the benchmark parts was found to be improved. In this case, the rough and
coarse surfaces shown in Figures 5.8c and 5.8d were properly sintered. This
means that applying the correct combination of the process parameters and ED
114

Chapter 5: Improvement ofpart surface finishing in LS by DOE
could significantly improve the viscous flow mechanisms and powder fusion
which leads to a reduction in the “orange peel” texture. In contrast, the same
optimum process parameters applied to the older PA2200 powder (15MFR-
16MFR) could not overcome the “orange peel” texture problem. This could be
due to the fact that the deteriorated powder has changed its thermal and sintering
properties, which could not be easily improved. For instance, it could be due to
the higher degree of chain molecules’ entanglement which influences the viscous
flow to become higher. As a result, more efficient packing of the polymer chains
leads to significant shrinkage, as shown in Table 5.9.
These experiments suggest that the optimisation of process parameters could help
the RP industry to reuse the recycled PA2200 powders at specific powder grades.
The optimisation of the LS process parameters could improve the part surface
quality if the MFR of the recycled powder is 18g/10min-19g/10min or higher. The
proposed method does not lead to improvement of the surface quality when the
PA2200 powder is deteriorated to very high levels (18-19 MFR or lower)
DOE can be employed to optimise the LS process parameters and MFR is the
most suitable method for use as a quality control tool to determine the powder
quality due to its effectiveness.
Summary
This chapter furthers the understanding of the LS process and in particular the
relationship between the LS parameters and part quality. This methodology could
be used to determine the optimum LS process parameters’ setup in relation to the
recycled powder PA 12 properties and to improve the surface quality of the LS
part.
115
Chapter 6: Improvement o f powder management and recycling in LS
CHAPTER 6
IMPROVEMENT OF POWDER MANAGEMENT AND RECYCLING IN
LASER SINTERING
6.1 Preliminaries
Nowadays the utilisation of PA 12 powders using the LS process has become very
popular, not only for rapid prototyping but also for the direct manufacturing (DM)
of bespoke parts. In order to fabricate parts with good quality and to avoid the
“orange peel” occurrence, the users of LS machines apply a constant refresh rate
with a higher portion of new powder. As a result, a huge amount of recycled
powder has to be discarded.
This chapter reports on an experimental study of the deterioration of PA 12
powder properties in the LS process. The main aim of this research is to develop a
methodology for powder recycling and for controlling the input material
properties that will ensure a good and consistent quality of the fabricated parts and
a more efficient use of the LS material.
116
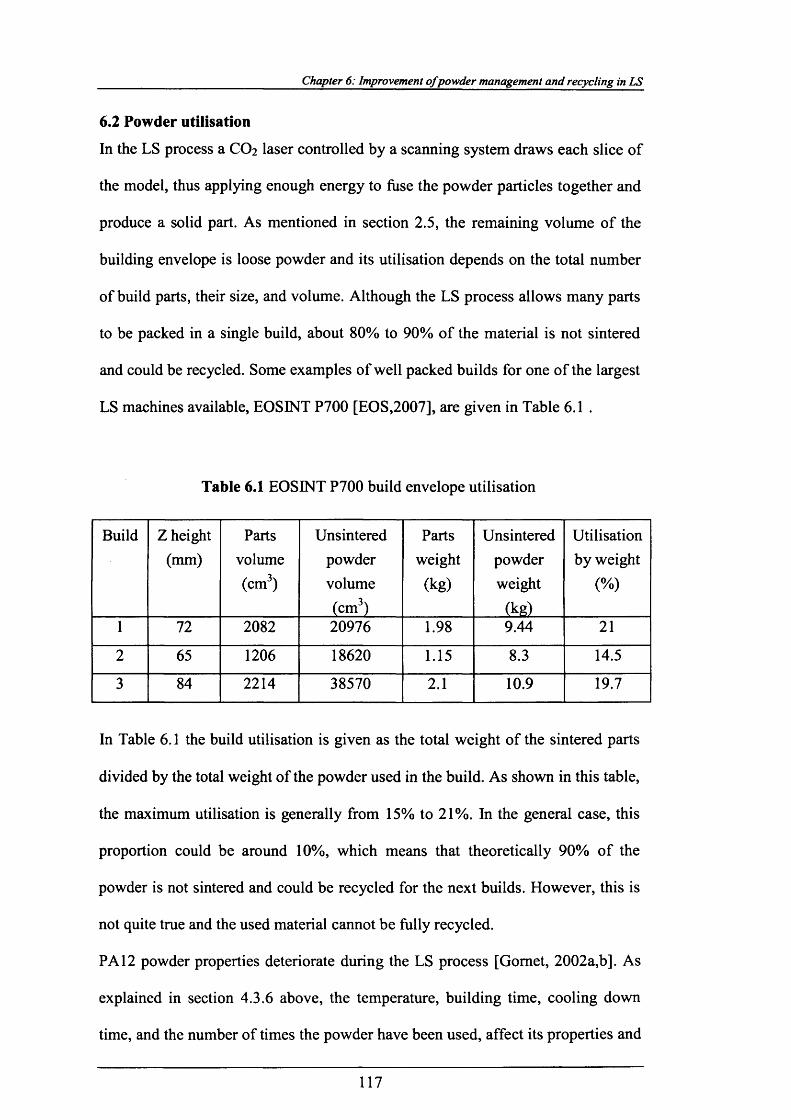
Chapter 6: Improvement o f powder management and recycling in LS
6.2 Powder utilisation
In the LS process a CO2 laser controlled by a scanning system draws each slice of
the model, thus applying enough energy to fuse the powder particles together and
produce a solid part. As mentioned in section 2.5, the remaining volume of the
building envelope is loose powder and its utilisation depends on the total number
of build parts, their size, and volume. Although the LS process allows many parts
to be packed in a single build, about 80% to 90% of the material is not sintered
and could be recycled. Some examples of well packed builds for one of the largest
LS machines available, EOSINT P700 [EOS,2007], are given in Table 6.1 .
Table 6.1 EOSINT P700 build envelope utilisation
Build Z height (mm)
Partsvolume(cm3)
Unsinteredpowdervolume(cm3)
Partsweight
(kg)
Unsinteredpowderweight
(kg)
Utilisation by weight
(%)
1 72 2082 20976 1.98 9.44 21
2 65 1206 18620 1.15 8.3 14.5
3 84 2214 38570 2.1 10.9 19.7
In Table 6.1 the build utilisation is given as the total weight of the sintered parts
divided by the total weight of the powder used in the build. As shown in this table,
the maximum utilisation is generally from 15% to 21%. In the general case, this
proportion could be around 10%, which means that theoretically 90% of the
powder is not sintered and could be recycled for the next builds. However, this is
not quite true and the used material cannot be fully recycled.
PA 12 powder properties deteriorate during the LS process [Gomet, 2002a,b]. As
explained in section 4.3.6 above, the temperature, building time, cooling down
time, and the number of times the powder have been used, affect its properties and
117
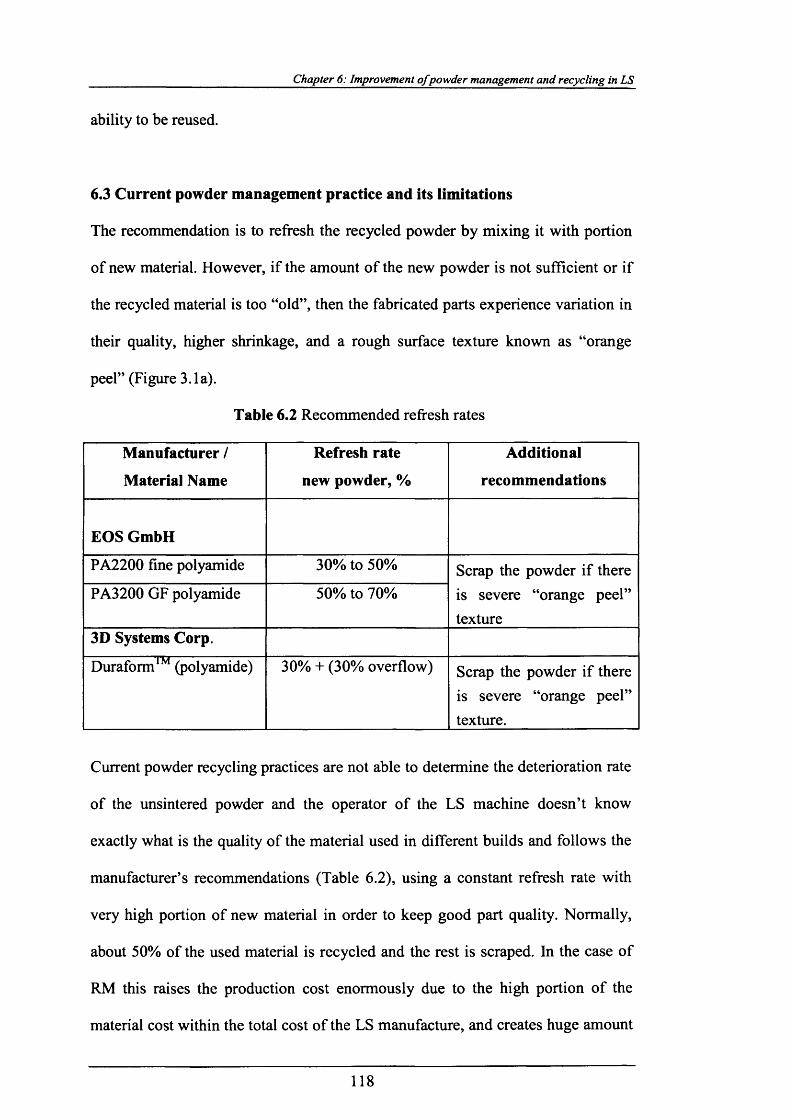
Chapter 6: Improvement o f powder management and recycling in LS
ability to be reused.
6.3 Current powder management practice and its limitations
The recommendation is to refresh the recycled powder by mixing it with portion
of new material. However, if the amount of the new powder is not sufficient or if
the recycled material is too “old”, then the fabricated parts experience variation in
their quality, higher shrinkage, and a rough surface texture known as “orange
peel” (Figure 3.1a).
Table 6.2 Recommended refresh rates
Manufacturer /
Materia] Name
Refresh rate
new powder, %
Additional
recommendations
EOS GmbH
PA2200 fine polyamide 30% to 50% Scrap the powder if there is severe “orange peel” texture
PA3200 GF polyamide 50% to 70%
3D Systems Corp.
Duraform1M (polyamide) 30% + (30% overflow) Scrap the powder if there is severe “orange peel” texture.
Current powder recycling practices are not able to determine the deterioration rate
of the unsintered powder and the operator of the LS machine doesn’t know
exactly what is the quality of the material used in different builds and follows the
manufacturer’s recommendations (Table 6.2), using a constant refresh rate with
very high portion of new material in order to keep good part quality. Normally,
about 50% of the used material is recycled and the rest is scraped. In the case of
RM this raises the production cost enormously due to the high portion of the
material cost within the total cost of the LS manufacture, and creates huge amount
118
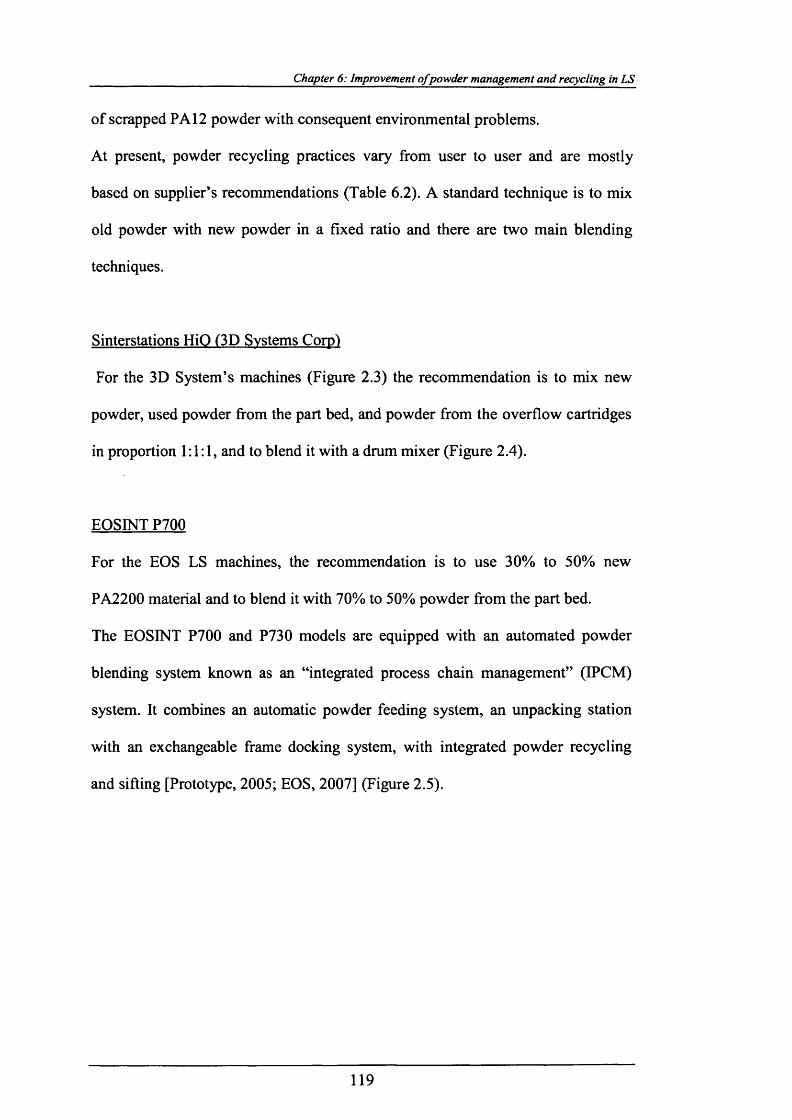
Chapter 6: Improvement o f powder management and recycling in LS
of scrapped PA 12 powder with consequent environmental problems.
At present, powder recycling practices vary from user to user and are mostly
based on supplier’s recommendations (Table 6.2). A standard technique is to mix
old powder with new powder in a fixed ratio and there are two main blending
techniques.
Sinterstations HiO (3D Systems Corpl
For the 3D System’s machines (Figure 2.3) the recommendation is to mix new
powder, used powder from the part bed, and powder from the overflow cartridges
in proportion 1:1:1, and to blend it with a drum mixer (Figure 2.4).
EOSINT P700
For the EOS LS machines, the recommendation is to use 30% to 50% new
PA2200 material and to blend it with 70% to 50% powder from the part bed.
The EOSINT P700 and P730 models are equipped with an automated powder
blending system known as an “integrated process chain management” (IPCM)
system. It combines an automatic powder feeding system, an unpacking station
with an exchangeable frame docking system, with integrated powder recycling
and sifting [Prototype, 2005; EOS, 2007] (Figure 2.5).
119
Chapter 6: Improvement o f powder management and recycling in LS
New powder Recycled powder
EOS GmbH 3D System
Table 6.2 Table 6.2
*
LS process
____________z ___________
Remove parts from build
_______________________ z ________________________
The loose powder is collected, sifted and used for the next build
Figure 6.1 The current LS recycling practise
In all cases, the used powder quality is not tested (Figure 6.1). Often, despite the
large portion of new powder added in the mix, the final part quality is not
adequate. The reason is that the quality of the used powder could be so bad that
even a higher portion of new material cannot make it usable. To maintain good
part quality and prevent the “orange peel” texture, the users employ the highest
recommended ratio of new powder, and discard huge quantities of used material.
Even so, from time to time the sintered parts are of bad quality and the whole
batch of mixed material is scrapped.
120

Chapter 6: Improvement o f powder management and recycling in LS
6.4 Powder recycling method (PRM)
A major constraint that limits the application of LS as a viable RM process is the
inconsistency in the part quality due to variation o f the powdered material
properties. For this reason, the systematic new practice of recycling powder
management takes into consideration all the limitations of the current practice that
have been discussed above and seeks to minimise the usage o f fresh powder in
order to sustain parts quality.
New PA2200
MFR test
Recycled powder
LS process
Categorise the “used” powder quality
Discard if the MFR is below
20 g/lOmin
The ratio of X % and Y % is taken from Figure 6.9 to 6.13
Collect “used”powder selectively, remove/clean parts
Mixed powder ratio X % Recycled powder
Keep in storage if the MFR is higher than 20g/10min, Classify the powder quality
Figure 6.2 PRM is a new method of controlling PA2200 powder quality
121

Chapter 6: Improvement o f powder management and recycling in LS
PRM is a systematic approach to controlling the input material properties that will
ensure consistent and good quality for the fabricated parts as shown in Figure 6.2.
As mentioned earlier in section 2.5. The longer build stage period in the LS
process increases the chances that loose powder in the build cylinder may become
badly deteriorated due to exposure to high temperature. This is significantly
influenced by the thermal history of the loose powder in the build cylinder.
The new recycled powder practice principles are as follows:
• It is assumed that the loose powder deteriorates at a different rate for every
different build of the LS process.
• The quality o f all the powders must be tested to determine the MFR.
• The method of collecting the loose powder from the build should be
reviewed and its quality experimentally tested.
It is assumed that not all the loose powder in the build cylinder is badly
deteriorated. This is because it is the loose powder located around and closer to
the sintered part that is the hottest, and therefore exposed to the longest period of
high temperature through the LS process.
The quality grade of the loose powder at the different locations in the build
envelope must also be identified before it is discarded because there is a
possibility it can be reused. Therefore, the PRM fundamental strategies for
recycling the used powder are as follows:
• The mixed powder ratio, or the ratio of blending the new PA12 powder/
less deteriorated powder, should be varied and it must be based on the
recycled powder quality grade itself.
• The key factor in improving the optimal refresh rate is to achieve the
122
Chapter 6: Improvement o f powder management and recycling in LS
specific melt viscosity target. All LS machine users must control the input
material quality and so ensure the consistent and good quality of the
fabricated parts.
6.5 Experimental results and discussion
6.5.1 Methodology and equipment used
The LS material investigated in this study is PA2200 fine polyamide supplied by
EOS. The MFR measurements were performed according to ISO 1133 standard
[ISO 1133]. The details of the MFR test procedure have already been mentioned
above (see section 4.3.1.1).
6.5.1.1 Variation of PA12 powder properties in the LS process
As mentioned earlier in section 6.4, the powder deteriorated at a different rate for
each different build of the LS process and there is a possibility that the less
deteriorated loose powder can be reused. In order to confirm these assumptions,
and investigate the deterioration of the PA 12 powder properties in the LS process,
samples from several Sinterstation HiQ and EOSINT P700 builds were collected
and their MFR measured. One of these builds is shown in Figure 6.3. The
different parts size and shapes were built at 440 mm (maximum) height by using
the Sinterstation HiQ. Two powder collection methods were compared. The first
method is the new practice powder collection and second method is the current
practice loose powder collection.
123
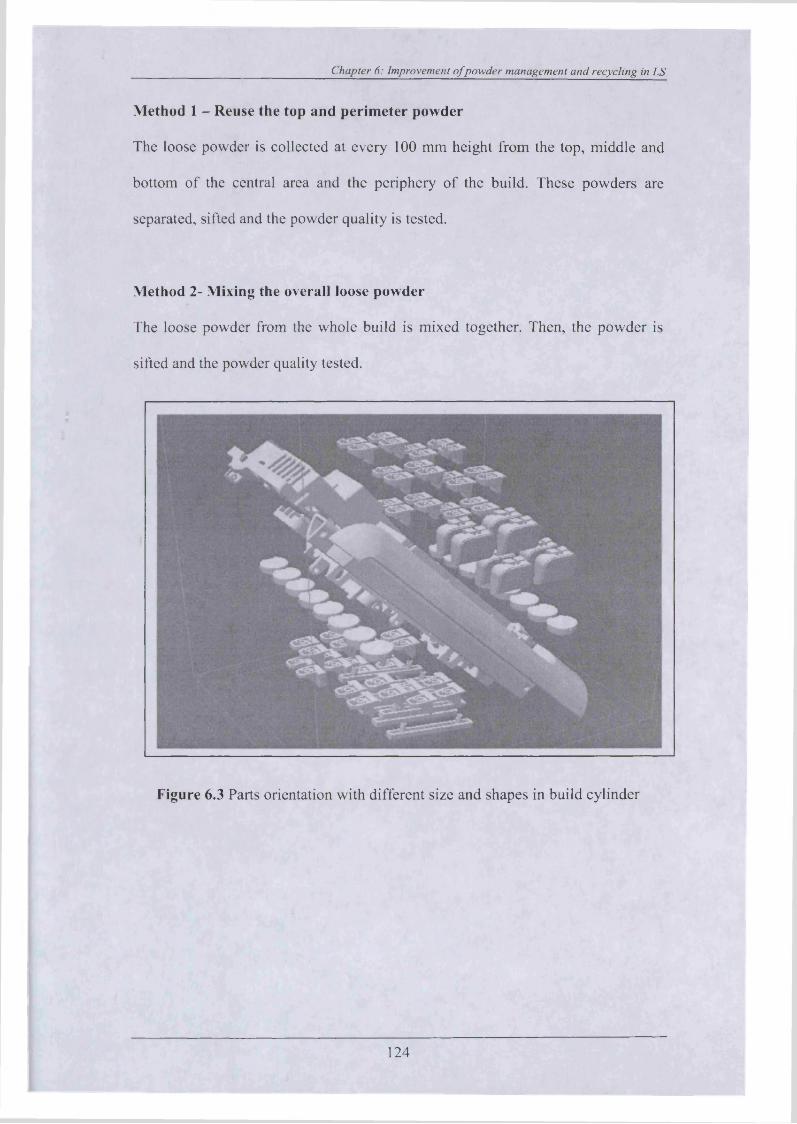
Chapter 6: Improvement o f powder management and recycling in LS
Method 1 - Reuse the top and perimeter powder
The loose powder is collected at every 100 mm height from the top, middle and
bottom o f the central area and the periphery o f the build. These powders are
separated, sifted and the powder quality is tested.
Method 2- Mixing the overall loose powder
The loose powder from the whole build is mixed together. Then, the powder is
sifted and the powder quality tested.
Figure 6.3 Parts orientation with different size and shapes in build cylinder
124
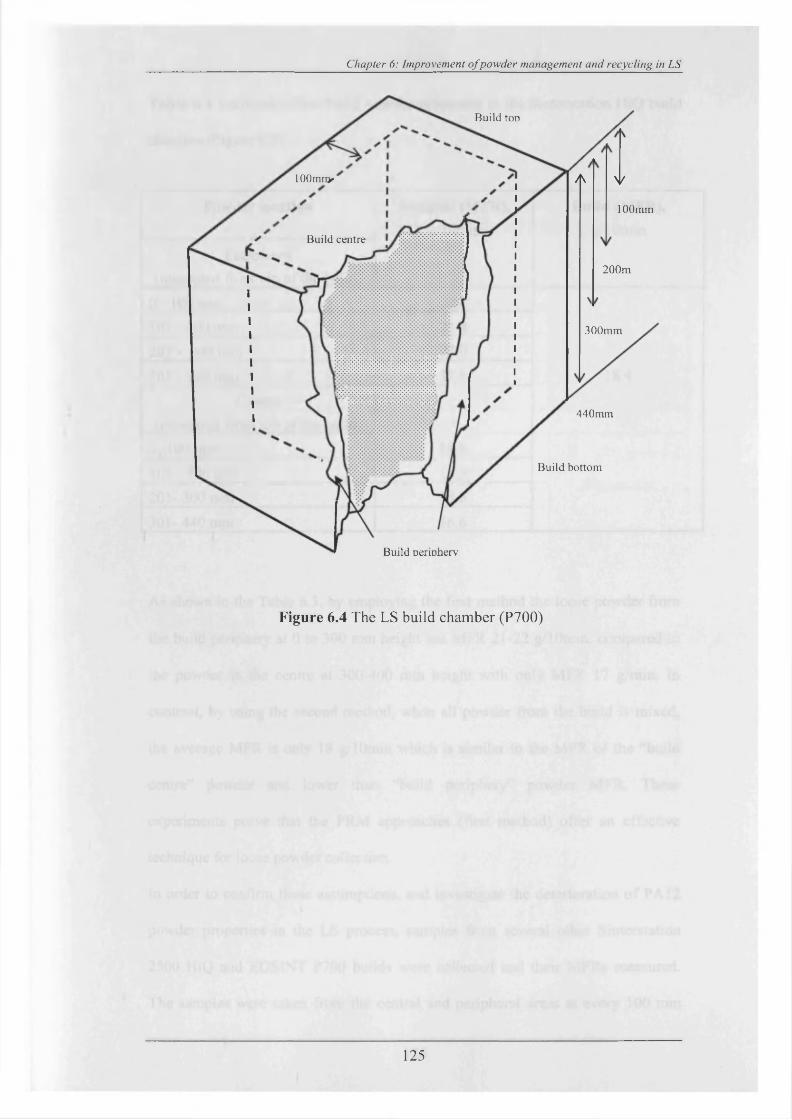
Chapter 6: Improvement o f powder management and recycling in LS
Build too
lOOmny A V
100mm
Build centre
200m
300mm
440mm
Build bottom
Build Deritiherv
Figure 6.4 The LS build chamber (P700)
125
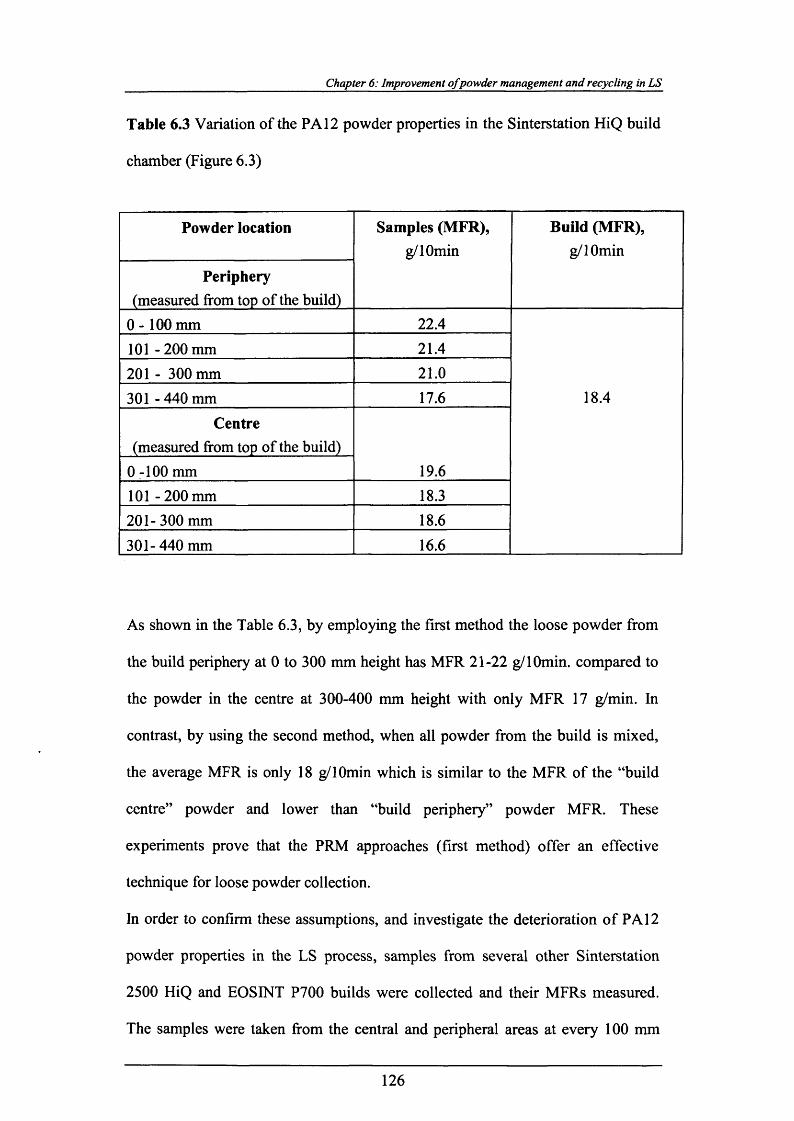
Chapter 6: Improvement o f powder management and recycling in LS
Table 6.3 Variation of the PA 12 powder properties in the Sinterstation HiQ build
chamber (Figure 6.3)
Powder location Samples (MFR),g/lOmin
Build (MFR),g/lOmin
Periphery(measured from top of the build)
0 - 100 mm 22.4
18.4
101 - 200 mm 21.4
201 - 300 mm 21.0
301 -440 mm 17.6
Centre(measured from top of the build)
19.60 -100 mm101 - 200 mm 18.3201- 300 mm 18.6
301- 440 mm 16.6
As shown in the Table 6.3, by employing the first method the loose powder from
the build periphery at 0 to 300 mm height has MFR 21-22 g/lOmin. compared to
the powder in the centre at 300-400 mm height with only MFR 17 g/min. In
contrast, by using the second method, when all powder from the build is mixed,
the average MFR is only 18 g/lOmin which is similar to the MFR of the “build
centre” powder and lower than “build periphery” powder MFR. These
experiments prove that the PRM approaches (first method) offer an effective
technique for loose powder collection.
In order to confirm these assumptions, and investigate the deterioration of PA 12
powder properties in the LS process, samples from several other Sinterstation
2500 HiQ and EOSINT P700 builds were collected and their MFRs measured.
The samples were taken from the central and peripheral areas at every 100 mm
126

Chapter 6: Improvement o f powder management and recycling in LS
height of the build chamber as shown in Figure 6.4. The build height and total
build time are listed in Table 6.3 and 6.4.
Table 6.4 Sinterstation 2500HiQ and EOSINT P700 builds
Sinterstation 2500HiQBuild No Build height, mm Total build time, hour
Figure 6.51 87.28 9.05
2 115.21 12.37
3 129.75 13.56
4 440 44.24
EOSINT P7001 241 26.32
Figure 6.62 325 33.28
3 372 39.274 435 45.35
127
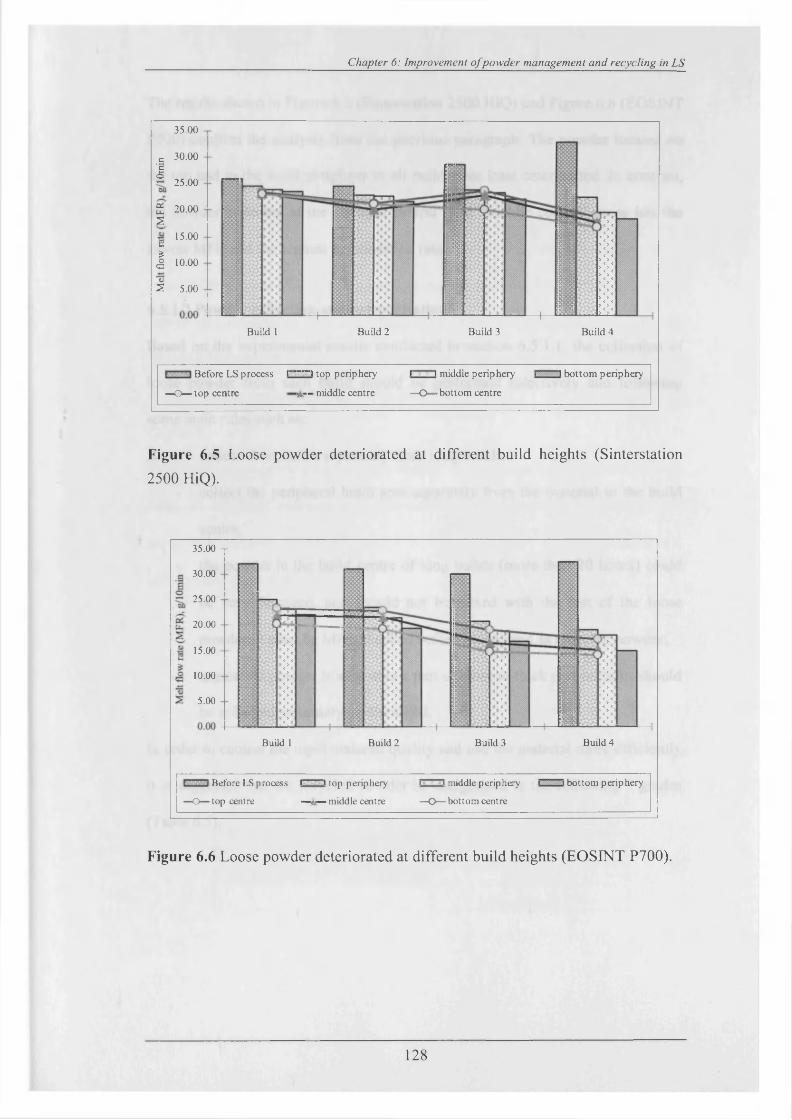
Chapter 6: Improvement o f pow der management and recycling in LS
Before LS process I ""**"I top periphery I > > »middle periphery i 1 bottom periphery
—O -to p centre 4»- middle centre —O — bottom centre
Build 2 Build 3 Build 4
35.00
1 30.00
25.00
at.UuS
20.00
6 15.00soc: 10.00ys 5.00
Build 1
Figure 6.5 Loose powder deteriorated at different build heights (Sinterstation
2500 HiQ).
Before LS process I l top periphery i -■ i middle periphery » i bottom periphery
—O—top centre —A— middle centre —O— bottom centre
Build 1 Build 2 Build 3 Build 4
35.00 T
30.00
25.00
20.00
15.00
10.00
5.00
Figure 6.6 Loose powder deteriorated at different build heights (EOSINT P700).
128
Chapter 6: Improvement o f powder management and recycling in LS
The results shown in Figure 6.5 (Sinterstation 2500 HiQ) and Figure 6.6 (EOSINT
P700) confirm the analysis from the previous paragraph. The powder located on
the top and in the build periphery in all builds was least deteriorated. In contrast,
the powder collected at the “bottom central” and “middle central” areas has the
lowest MFR and the highest deterioration rate.
6.5.1.2 Powder collection and categorisation
Based on the experimental results conducted in section 6.5.1.1, the collection of
loose powder from each build should be performed selectively and following
some main rules such as:
- collect short builds separately from long builds;
- collect the peripheral build area separately from the material in the build
centre;
- the powder in the build centre of long builds (more than 20 hours) could
be very damaged, and should not be mixed with the rest of the loose
powder. It must be MFR checked before being used as recycled powder;
- unsintered powder from within a part or close to thick part sections should
be collected separately or discarded.
In order to control the input material quality and use the material more efficiently
it is suggested that the recycled powder be categorised in the following 3 grades
(Table 6.5).
129
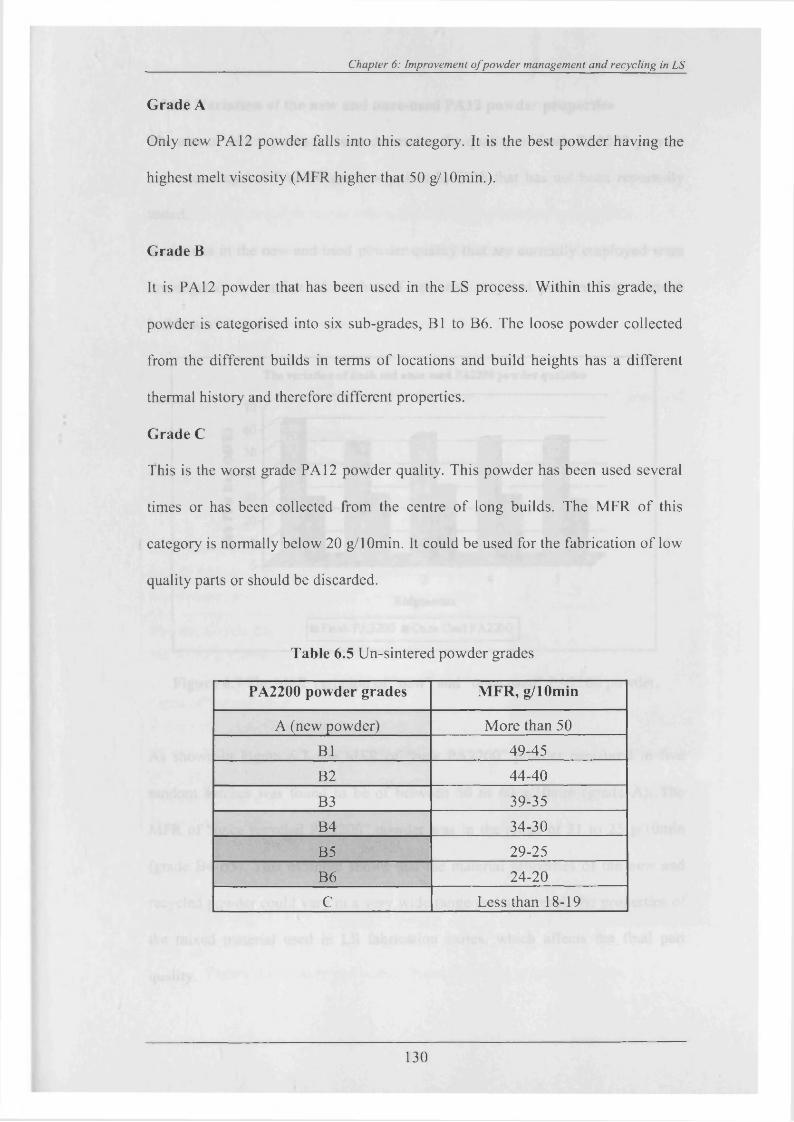
Chapter 6: Improvement o f pow der management and recycling in LS
Grade A
Only new PA 12 powder falls into this category. It is the best powder having the
highest melt viscosity (MFR higher that 50 g/10min.).
Grade B
It is PA 12 powder that has been used in the LS process. Within this grade, the
powder is categorised into six sub-grades, B1 to B6. The loose powder collected
from the different builds in terms o f locations and build heights has a different
thermal history and therefore different properties.
Grade C
This is the worst grade PA 12 powder quality. This powder has been used several
times or has been collected from the centre o f long builds. The MFR o f this
category is normally below 20 g/lOmin. It could be used for the fabrication o f low
quality parts or should be discarded.
Table 6.5 Un-sintered powder grades
PA2200 powder grades MFR, g/lOmin
A (new powder) More than 50
B1 49-45
B2 44-40
B3 39-35
B4 34-30
B5 29-25
B6 24-20
C Less than 18-19
130
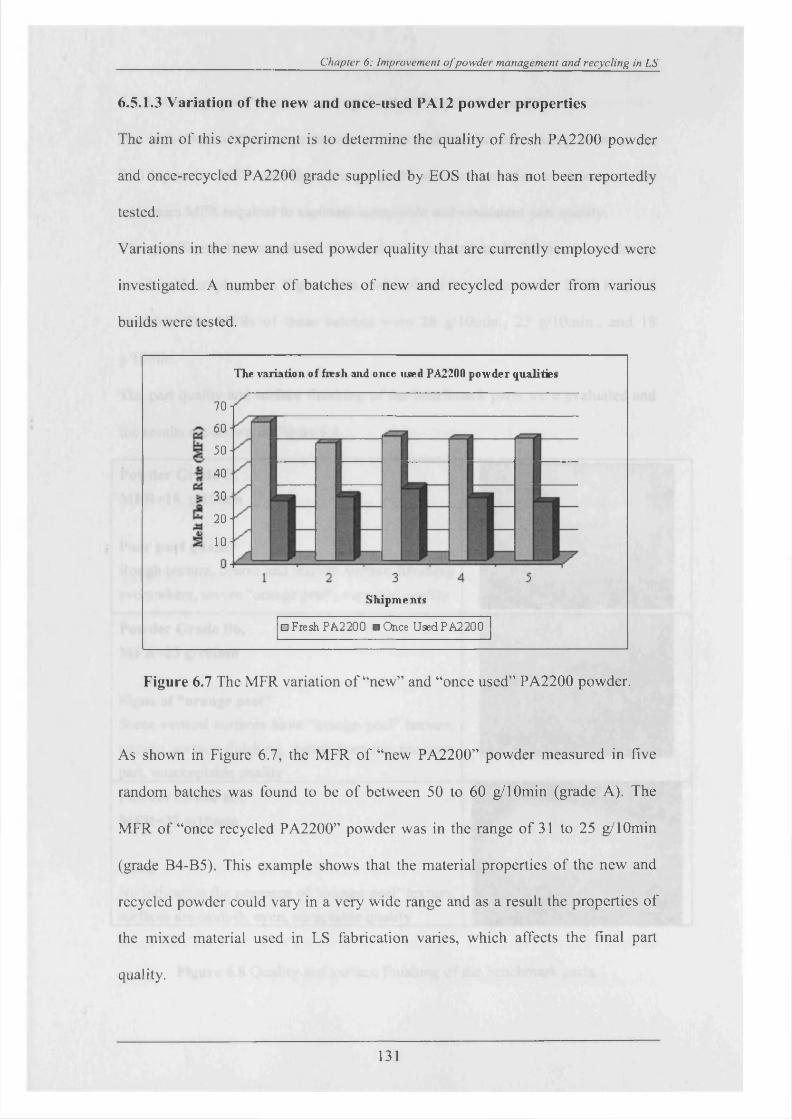
______________________________ Chapter 6: Improvement o f pow der management and recycling in LS
6.5.1.3 Variation of the new and once-used PA12 powder properties
The aim o f this experiment is to determine the quality o f fresh PA2200 powder
and once-recycled PA2200 grade supplied by EOS that has not been reportedly
tested.
Variations in the new and used powder quality that are currently employed were
investigated. A number o f batches o f new and recycled powder from various
builds were tested.
The variation of fresh and once used PA2200 powder qualities
7 0 1
60-
50-
40-
30-
2 0 -
1 0 -
Shipm ents
□ Fresh PA2200 BOnce UsedPA2200
Figure 6.7 The MFR variation o f “new” and “once used” PA2200 powder.
As shown in Figure 6.7, the MFR o f “new PA2200” powder measured in five
random batches was found to be o f between 50 to 60 g/lOmin (grade A). The
MFR o f “once recycled PA2200” powder was in the range o f 31 to 25 g/lOmin
(grade B4-B5). This example shows that the material properties o f the new and
recycled powder could vary in a very wide range and as a result the properties o f
the mixed material used in LS fabrication varies, which affects the final part
quality.
131

Chapter 6: Improvement o f pow der management and recycling in LS
6.5.2 “Orange peel” texture and optimal PA12 powder quality
The objectives of these experiments were to find out the relationship between the
PA 12 powder MFR and the “orange peel” texture, and also to determine the
minimum MFR required to maintain acceptable and consistent part quality.
Three different batches of PA 12 powder were used to build the same design
benchmark employed in Figure 3.6a and 3.6b on the Sinterstation 2500 HiQ LS
machine. The MFRs of these batches were 28 g/10min., 23 g/10min., and 18
g/lOmin.
The part quality and surface finishing of the benchmark parts were evaluated and
the results are shown in Figure 6.8.
Powder Grade C,MFR=18 g/lOmin
Poor part qualityRough texture, coarse and uneven surface finishing everywhere, severe “orange peel”, very bad quality
Powder Grade B6,MFR=23 g/lOmin
Signs of “orange peel”Some vertical surfaces have “orange peel” texture, uneven surface finishing, better than the previouspart, unacceptable quality______________________
Powder Grade B5,MFR=28 g/lOmin
GoodNo indication the presence of ‘orange peel’ texture, surfaces are smooth, even, acceptable quality_____
Figure 6.8 Quality and surface finishing of the benchmark parts.
132
Chapter 6: Improvement o f powder management and recycling in LS
Employing less deteriorated powder (28 MFR) produced a good physical surface.
In contrast, employing the lower MFR powders (23 MFR and 18 MFR) produced
poorer results. In this case it was concluded that PA 12 powder having an MFR of
approximately 28 g/lOmin would produce the best results.
This relatively simple experiment could be performed on any LS machine in order
to find out what is the optimum level of powder MFR for a given LS machine
model with a particular setup of LS parameters.
6.5.3 Optimal refresh rates
As mentioned earlier the “orange peel” is an unwanted phenomenon resulting in
rough surface texture of the LS parts and occurring when the portion of new PA 12
powder is not sufficient or when too old powder is used in the input powder mix.
The main questions are how to measure the powder age and what should be the
minimum amount of new PA12 powder required to avoid the “orange peel”
phenomenon. The purpose of this experiment is to investigate the significance of
the PA 12 powder age on the part surface quality. The goal is to find a threshold or
a level of acceptable powder quality which would guarantee a relatively good
surface finish and absence of “orange peel” for the LS process.
This section presents a series of experiments is to find the optimal refresh rate for
a particular powder sub-grade within grade B when blending with new powder
(grade A).
Samples from B1 to B6 grades were mixed with new powder (grade A) in ratios
ranging from 10% to 50% new powder. The same ratio is used to mix among the
B sub-grades powders. The MFR of the mixture was then measured and the
results are shown in Figure 6.9 to Figure 6.13. In this way the user would be able
133
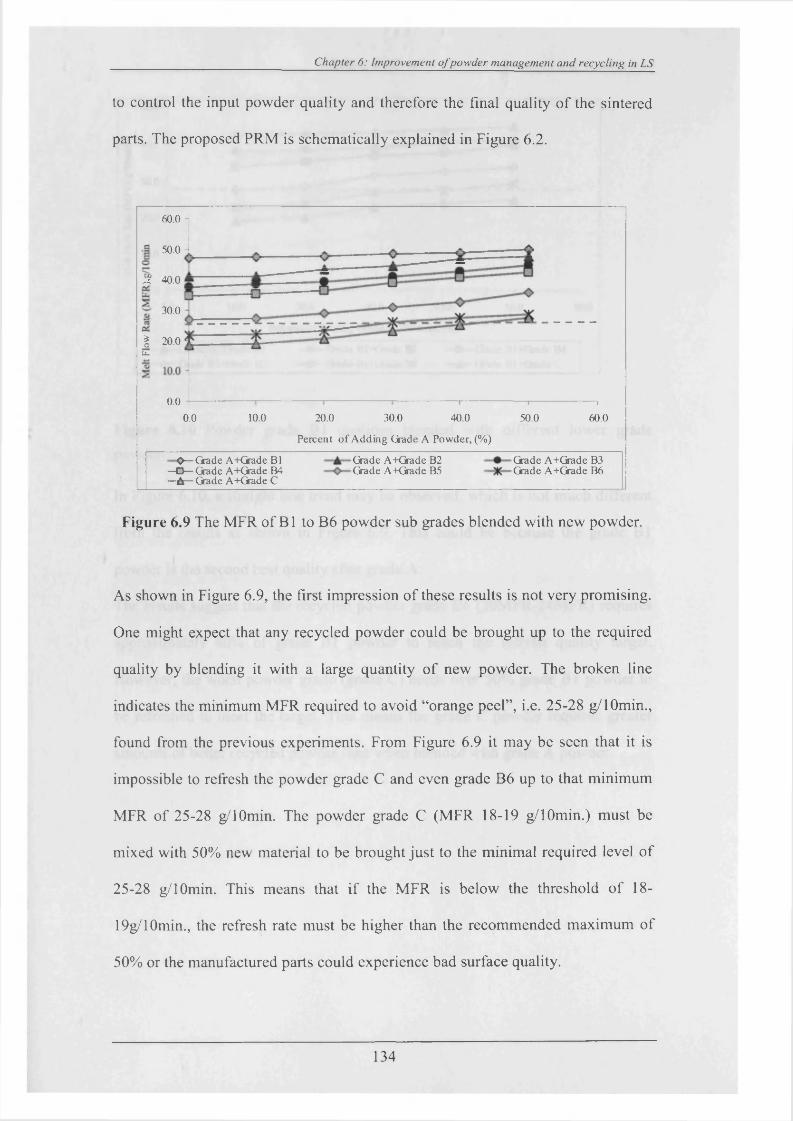
Chapter 6: Improvement o f pow der management and recycling in LS
to control the input powder quality and therefore the final quality of the sintered
parts. The proposed PRM is schematically explained in Figure 6.2.
60.0 -
50.0 -
jS 40.0
3o.o
I 20.0u.
0.010.0 20.0
Percent o f Adding Grade A Powder, (%)
30.0 40.00.0 50.0 60.0
O— Grade A+Grade B1 —O— Grade A+Grade B4 —A— Grade A+Grade C
Grade A+Grade B2 Grade A+Grade B5
Grade A+Grade B3 Grade A+Grade B6
Figure 6.9 The MFR of B1 to B6 powder sub grades blended with new powder.
As shown in Figure 6.9, the first impression of these results is not very promising.
One might expect that any recycled powder could be brought up to the required
quality by blending it with a large quantity of new powder. The broken line
indicates the minimum MFR required to avoid “orange peel”, i.e. 25-28 g/10min.,
found from the previous experiments. From Figure 6.9 it may be seen that it is
impossible to refresh the powder grade C and even grade B6 up to that minimum
MFR of 25-28 g/lOmin. The powder grade C (MFR 18-19 g/lOmin.) must be
mixed with 50% new material to be brought just to the minimal required level of
25-28 g/lOmin. This means that if the MFR is below the threshold of 18-
19g/10min., the refresh rate must be higher than the recommended maximum of
50% or the manufactured parts could experience bad surface quality.
134
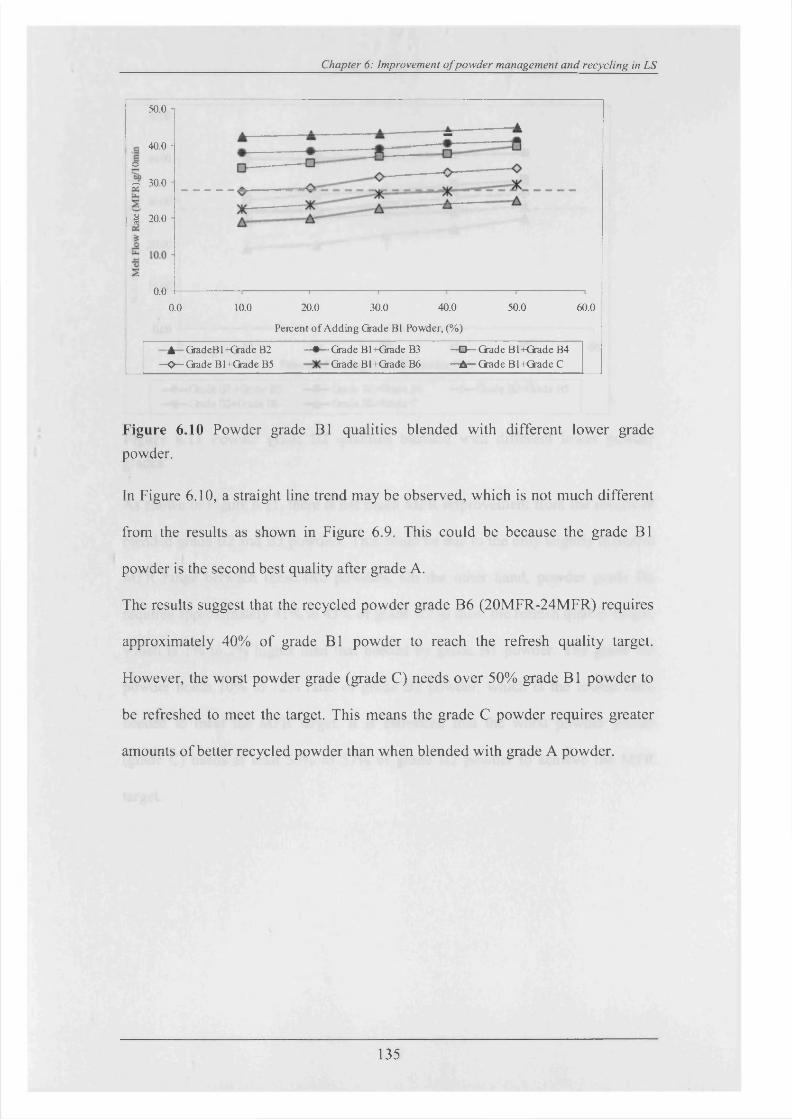
Chapter 6: Improvement o f pow der management and recycling in LS
50.0
40.0 -o
C? 30.0
2 20.0
0.00.0 10.0 20.0 30.0 40.0
Percent o f Adding Grade B1 Powder, (%)
50.0 60.0
—♦ —Grade Bl+Grade B3 Grade Bl+Grade B6
—D— Grade Bl+Grade B4 — A — Grade Bl+Grade C
—A ~ GradeB 1 +Grade B2 —O—Grade Bl+Oade B5
Figure 6.10 Powder grade B1 qualities blended with different lower grade powder.
In Figure 6.10, a straight line trend may be observed, which is not much different
from the results as shown in Figure 6.9. This could be because the grade B1
powder is the second best quality after grade A.
The results suggest that the recycled powder grade B6 (20MFR-24MFR) requires
approximately 40% of grade B1 powder to reach the refresh quality target.
However, the worst powder grade (grade C) needs over 50% grade B1 powder to
be refreshed to meet the target. This means the grade C powder requires greater
amounts of better recycled powder than when blended with grade A powder.
135
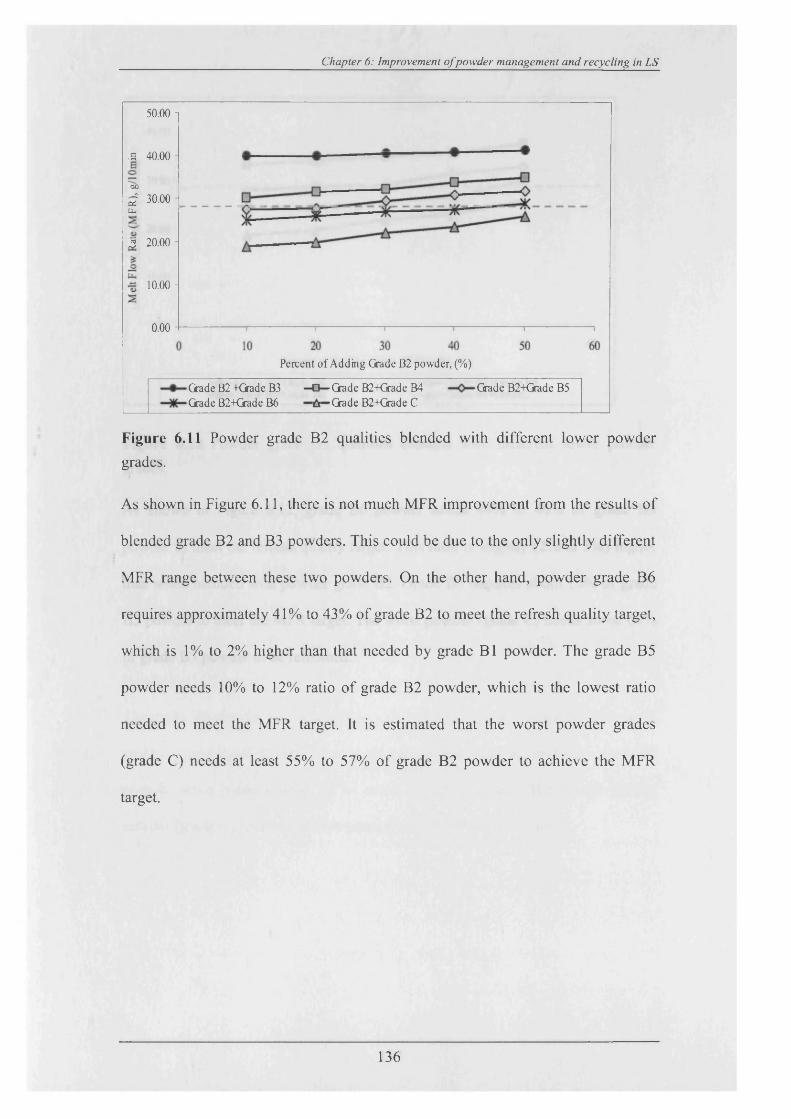
Chapter 6: Improvement o f powder management and recycling in LS
50.00 -i
.a 40.00 -
00
£ 30.00 -U.
3 20.00 -
1 0 . 0 0 -
0.00
Percent of Adding Grade B2 powder, (%)
Grade B2+Grade B3 Grade B2+Grade B6
—O—Grade B2+Grade B4 A Grade B2+Grade C
Grade B2+Grade B5
Figure 6.11 Powder grade B2 qualities blended with different lower powdergrades.
As shown in Figure 6.11, there is not much MFR improvement from the results of
blended grade B2 and B3 powders. This could be due to the only slightly different
MFR range between these two powders. On the other hand, powder grade B6
requires approximately 41% to 43% of grade B2 to meet the refresh quality target,
which is 1% to 2% higher than that needed by grade B1 powder. The grade B5
powder needs 10% to 12% ratio of grade B2 powder, which is the lowest ratio
needed to meet the MFR target. It is estimated that the worst powder grades
(grade C) needs at least 55% to 57% of grade B2 powder to achieve the MFR
target.
136
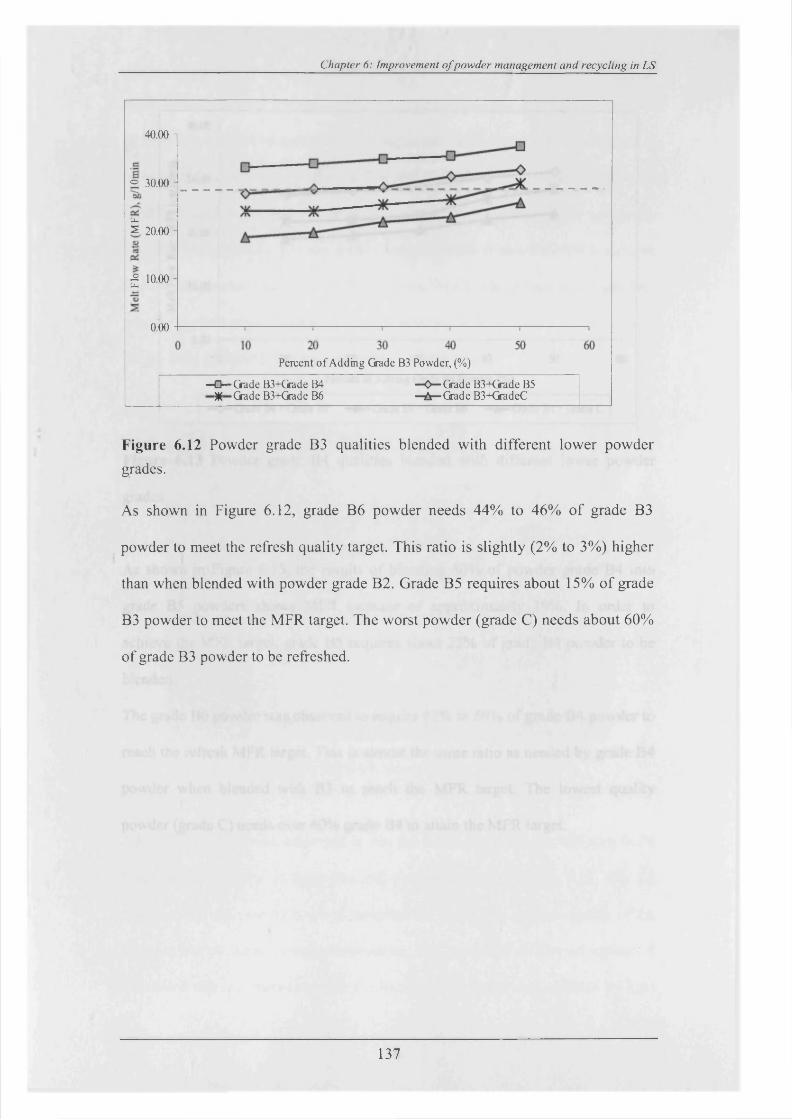
Chapter 6: Improvement o f p o w d er m anagement an d recycling in L S
40.00 -
® 30.00 -
u.s 20.00 -
S. 1 0 0 0 ■
0.00
Percent o f Adding Grade B3 Powder, (%)
—□ —Grade B3+Grade B4 X Grade B3+Grade B6
—❖ —Grade B3+Grade B5 —b — Grade B3+GradeC
Figure 6.12 Powder grade B3 qualities blended with different lower powder grades.
As shown in Figure 6.12, grade B6 powder needs 44% to 46% of grade B3
powder to meet the refresh quality target. This ratio is slightly (2% to 3%) higher
than when blended with powder grade B2. Grade B5 requires about 15% of grade
B3 powder to meet the MFR target. The worst powder (grade C) needs about 60%
of grade B3 powder to be refreshed.
137

Chapter 6: Improvement o f pow der management and recycling in LS
40.00 i
O 30.00 -*0”
^ 1 0 . 0 0 -
0.00
Percent of Adding Grade B4 Powder, (%)
Grade B4 + Grade B6 -^y-G radeB 4 +Grade C—0 —Grade B4 + Grade B5
Figure 6.13 Powder grade B4 qualities blended with different lower powder
grades.
As shown in Figure 6.13, the results of blending 50% of powder grade B4 into
grade B5 powders shows MFR increase o f approximately 19%. In order to
achieve the MFR target, grade B5 requires about 22% of grade B4 powder to be
blended.
The grade B6 powder was observed to require 47% to 50% of grade B4 powder to
reach the refresh MFR target. This is almost the same ratio as needed by grade B4
powder when blended with B3 to reach the MFR target. The lowest quality
powder (grade C) needs over 60% grade B4 to attain the MFR target.
138
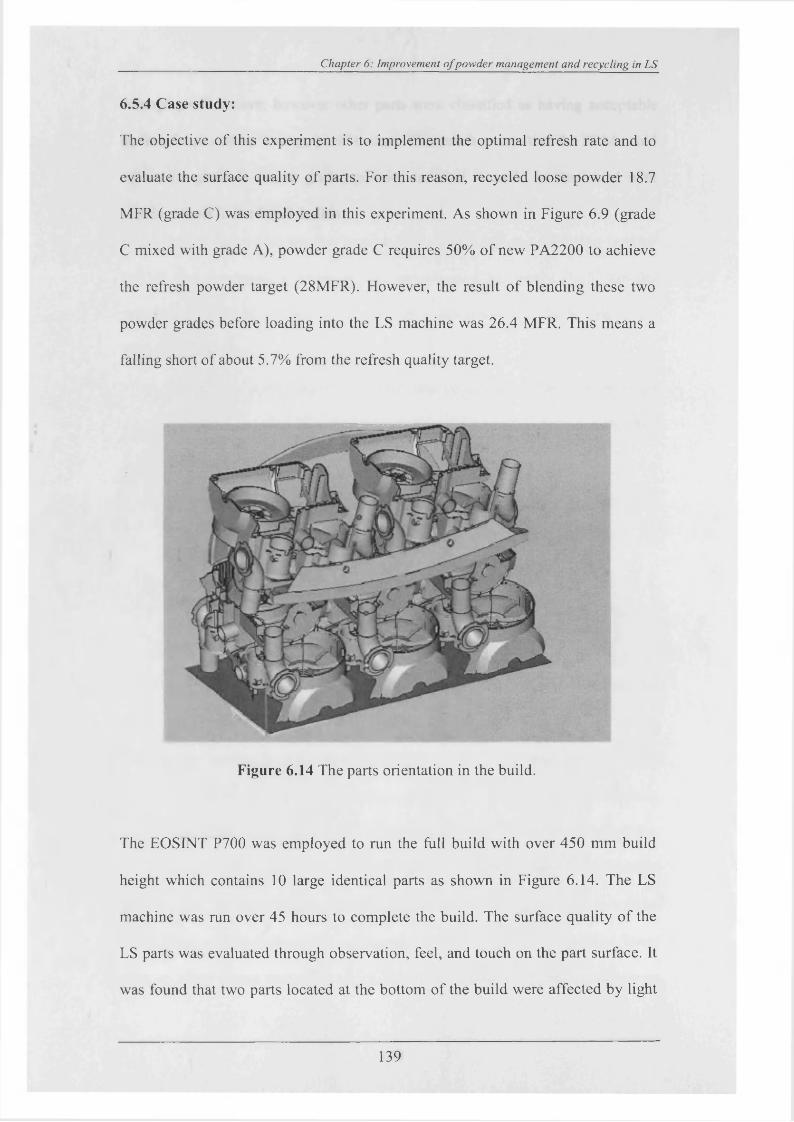
Chapter 6: Improvement o f pow der management and recycling in LS
6.5.4 Case study:
The objective of this experiment is to implement the optimal refresh rate and to
evaluate the surface quality of parts. For this reason, recycled loose powder 18.7
MFR (grade C) was employed in this experiment. As shown in Figure 6.9 (grade
C mixed with grade A), powder grade C requires 50% of new PA2200 to achieve
the refresh powder target (28MFR). However, the result of blending these two
powder grades before loading into the LS machine was 26.4 MFR. This means a
falling short of about 5.7% from the refresh quality target.
Figure 6.14 The parts orientation in the build.
The EOSINT P700 was employed to run the full build with over 450 mm build
height which contains 10 large identical parts as shown in Figure 6.14. The LS
machine was run over 45 hours to complete the build. The surface quality of the
LS parts was evaluated through observation, feel, and touch on the part surface. It
was found that two parts located at the bottom of the build were affected by light
139
Chapter 6: Improvement o f powder management and recycling in LS
“orange peel” texture; however other parts were classified as having acceptable
surface finish and no “orange peel” texture. This result proves that the PRM could
utilise the grade C (worst grade) powder and that it could be improved with
certain criteria in the future builds.
140
Chapter 6: Improvement o f powder management and recycling in LS
6.6 Discussion
This thesis suggests how to develop a methodology for improving the different
Polyamide 12 (PA 12) powder grades that will ensure consistent and good quality
for the LS fabricated parts. The limitations of the current practice of collecting
loose powder were discussed in section 6.3. A new powder recycling method
(PRM) was developed to minimise the variations of the mixed PA12 powder
properties. The PRM is based on the findings in the previous sections, and on the
following strategies:
• the powder deteriorates at different rates in different areas of a build, so
the powder at the periphery of the build cylinder is less damaged than the
powder in the build centre;
• the loose powder in long builds, having more than 15-20 hours build time,
is much more deteriorated than recycled powder from short builds;
• powder collected from each build should be tested and categorised;
• consistent and optimal recycled powder quality is the key to achieving
consistent part quality and efficient use of the material;
• the proportion of new PA 12 powder should be varied depending on the
grade of the available recycled powder.
The LS part quality is significantly influenced by the PA12 powder properties.
The tests performed in section 6.5.2 were aimed at investigating the significance
of PA 12 powder quality and its MFR on the surface quality. It has been found that
the powder with a higher melt viscosity (lower MFR) produces a poor “orange
peel” texture. An acceptable level of PA 12 powder quality which would guarantee
a relatively good surface finish and absence of “orange peel” is a powder blend
with an MFR higher than 25-27. This could be used as a reference point when
141

Chapter 6: Improvement o f powder management and recycling in LS
mixing and blending used and new PA 12 material in the LS process.
The results presented in sections 6.5.3 are a basis for the development of a
strategy for systematic recycling and a set of rules for more efficient powder
management. Considering the number of builds only [Gomet, 2002a,b ] does not
provide enough information forjudging how to process the recycled material. The
build time and the type of LS machine should be also taken into account. For
instance, the recycled powder from a build of approximately 100 mm or less build
height would have relatively good quality and will need a smaller amount of new
material. On the other hand, powder collected from a 350mm to 400mm build
height of EOSINT P700 build, which has 35 to 45 hours cooling down time,
would be badly damaged and needs a lot of new material.
Also, the powder collected from the build periphery where the temperature was
high only for a short period of time is less damaged than the material collected
from the build centre.
The results of the case study parts build using (50%:50%) ratio of grade A and
grade C powders in section 6.5.4 could still be employed in the fixture but with
certain limitations. Below is a list of several factors that could influence the
experimental result above:
• There is a possibility that that powder was not mixed thoroughly and/or
needs longer mixing time;
• The part thickness, part geometry, and part orientation in the build should
to be considered during the parts arrangement process. The reason for this
is that if a low powder grade was employed to run the full build, the part
with greater wall thickness should to be placed on the top and the thinner
or smaller parts should be placed at the bottom of the build. This is
142

Chapter 6: Improvement o f powder management and recycling in LS
because the powder located at the bottom deteriorates at the highest rate
due to expose to heat for the longest period through the LS process. This
causes a higher chance that parts located at the bottom of the build might
be affected by “orange peel” texture;
• The only way to employ grade C powder is it that it must be blended with
new PA2200 at (50%:50%) ratio. In order to avoid having any parts
affected by “orange peel” texture, it is recommended that this powder be
used only for builds of less than 300 mm build height. Based on the
experimental results (Figure 6.6 and Table 6.4), the deterioration rate in
the build would range 35% to 38 % for 325mm.
However, if this powder is employed for a 440 mm build height, the powder
located inside in the centre at the bottom will experience about a 50 %
deterioration rate (Figure 6.5 and Table 6.4). Thus, there is a higher chance of the
parts being affected by “orange peel” texture.
6.7 Summary
This chapter focuses on controlling and utilising the recycled powder. This can be
achieved if a new recycling powder management practice is implemented. As a
result, the manufacturing cost of LS parts can be reduced and the usage of new
material can be optimised according to the properties of the recycled powder.
143
CHAPTER 7
CONCLUSION AND FURTHER WORK
7.1 Contributions
The “orange peel” phenomenon which affects fabricated LS parts has been
investigated and experimental work related to the deterioration of PA2200 powder
in the LS process has been undertaken.
Causes of the “orange peel” phenomenon related to changes in the properties of
the LS material, in particular its melt viscosity, due to exposure to high process
temperatures have been presented.
A new powder recycling method (PRM), which utilises the used powder and
controls the powder quality, has been proposed.
An attempt has been successfully made to reduce occurrences of the “orange peel”
texture by optimising the LS process parameters.
144
7.2 Conclusions
In chapter 2, the technology and applications of Selective Laser Sintering using a
Sinterstation 2500 HiQ and an EOSINT P700 and their LS process parameters and
materials are reviewed. This is followed by a description of the LS process and
PA 12 material deterioration.
There is very little information from previously published work on the “orange
peel” phenomenon and how the “orange peel” texture affects the microstructure of
the LS part. With this background in chapter 3, the effect of the properties of PA 12
polymer-based powder such as molecular weight distribution, melting viscosity,
and heat of fusion, on the quality of LS fabricated parts affected by the “orange
peel” phenomenon is researched. The results of experimental work indicate that
the polydispersity, melt viscosity, and part surface finish are correlated. The
powder which has higher melt viscosity and lower melting heat becomes liquid
more easily and therefore flows better during the sintering process due to a shorter
chain molecular structure. SEM micrographs show that the morphology of the
external surfaces and cross sections of parts affected by the “orange peel” texture
exhibits a very inhomogeneous structure after laser sintering. On the basis of the
experimental results, a qualitative LS mechanism has been proposed to describe
the “orange peel” phenomenon.
Chapter 4 focuses on an experimental study of the deterioration or ageing of PA 12
powder properties in the LS process. The influence of temperature, time, and the
number of exposures on these properties is investigated. It has been found that the
longer PA 12 powder is exposed at higher temperature in the long heating period,
145
the longer a period of cooling is required. The longer cooling period leads to a
longer period in which deterioration may take place. It has been found that PA12
samples with higher MFR experienced faster deterioration due to having a larger
amorphous region. The MFR of the samples decreases when they are subjected to
higher temperature and longer heating time. The deterioration speed is faster for
the first 15 to 20 hours and then gradually decreases during the next 100 hours.
The Tm, Tg and Tc temperatures slightly increase for samples subjected to higher
temperature and longer heating time. MFR indexing is the recommended method
for determining the polymer powder quality due to it effectiveness. Based on the
results from the experiments explained in the previous sections, the MFR index
was selected as a criterion for the powder “age” evaluation for the following
reasons:
- MFR testing is a relatively cheap, quick and efficient way of measuring
PA 12 powder properties;
- MFR is very sensitive to powder deterioration;
- MFR is directly correlated with the PA 12 material morphology and other
thermal properties.
However, skills are needed to conduct the test and time is required for the cleaning
process. DSC is useful for thermal analysis to study the thermal behaviour of the
polymer samples in determining Tm, Tg and Tc . The limitation of DSC is that Tg
is not clearly apparent from the DSC curve if the polymer sample is highly
crystalline.
Gel Permutation Chromatography (GPC) is one o f the common methods that can
be used to determine theM - and M - of a semi-crystalline polymer. This method
146
separates the molecules based on their size. A higher M - and M - means shorter
chain segments with lower viscosity. A challenging aspect of determining powder
deterioration in the LS process is that the different LS machines have different
process capabilities and the different LS powder materials may have different
properties, affecting deterioration rate.
Chapter 5 furthers understanding of how the LS process parameters, together with
the powder quality, determine the final quality of the produced parts. The DOE
approach has been applied successfully in determining the optimum LS process
parameters by using deteriorated recycled PA2200 powder. The “orange peel”
surface texture is influenced by the variable scan spacing (<SCSP), as well as by
interactions between laser power (LP) and laser scan speed (LSp); laser power
(LP) and scanning strategy (SSt); and laser scan speed (LSp) and scan spacing
(SCSP). Optimisation of the LS process parameters could improve the part surface
quality if the MFR of the recycled powder is 18g/10min-19g/10min or higher. The
proposed method does not lead to improvement of the surface quality once the
PA2200 powder has badly deteriorated (18-19 MFR or lower). Adding more
parameters, including other process parameters such as powder layer thickness and
laser scanning patterns, would result in an accurate and useful model for predicting
the part surface quality. An increase in the number of levels could be helpful. The
effects plots are also useful in obtaining an understanding of surface finish quality
in relation to process setting parameter variation. Therefore, the DOE method
which has been applied to the PA2200 powder could also be applicable to the
DF™ powder.
147
The advantage of DOE is that it could be used to improve the part surface finish by
analysing the effects and interaction of the selected factors. The disadvantage is
that it is relatively slow and expensive because it requires the performance of
many tests.
Chapter 6 concentrates on the question of maintaining consistent materials quality
as a main requirement for achieving consistent part quality and increasing LS
process reliability and efficiency. This chapter presents a methodology for
improving the different PA2200 powder grades that will ensure consistent and
good quality of the LS fabricated parts. A powder recycling method (PRM) is
developed to improve on the limitations of current powder recycling practice. It
introduces the loose powder collection method from the build; the classification of
PA 12 powder qualities; a method of utilising used powder to gain better control of
used powder quality. For instance, refreshed powder quality after the deteriorated
PA 12 powder is blended results in a 10% to 50% better powder quality. However,
not all grades of powder can be recycled. The results from recycled powder quality
consistency graphs suggested that badly deteriorated powder (grade C or < 18
MFR) needed the highest ratio of added better quality powder to achieve the
refresh powder target of 28MFR (grade B5). The eventual benefit of this study is
to utilise the deteriorated recycled PA 12 so as to reduce the material cost and
produce a better part surface quality. The RPM method which was applied to the
PA2200 powder could also be used for the DF™ powder.
148
7.3 Future work
It is important to predict the temperature distribution and its effects on powder
deterioration in the LS process by using a simulation model. It is useful to collect
loose powder of acceptable quality from different positions in the build chamber as
proposed in chapter 6 . The PRM will be more efficient and practical if LS
machine users could determine regions of the build chamber with less powder
deterioration. As a result, powder of acceptable quality would be more fully
utilised due to the fact that its location is known. This can be achieved by
developing a Finite Element simulation model. The method undertaken in model
development might be mainly focused on specifying temperature changes expected
to reflect those experienced during LS processing. Mathematical equations could
be developed in order to predict temperature changes experienced at different
points in a build during processing. This takes into consideration the fact that
temperature distribution in both liquid and solid phase through the LS process
causes the powder deterioration which leads to the “orange peel” phenomenon.
Once the model has been developed, the density of solid parts could also be
predicted.
It is suggested that properties of the used powder (grade B and grade C) may be
improved by using special additives and plasticisers. As described in chapter 4, the
results of this research show that the more badly deteriorated is the powder the
higher is the degree of chain entanglement due to the longer molecular chains.
This significantly increases the melt viscosity, leading to the “orange peel”
phenomenon. For this reason, it is suggested that special additives are mixed into
used powder. This would shorten the molecular chains which could reduce the
149

degree of chain molecular entanglement, in turn lowering the melt viscosity and
giving the desired high MFR values.
150
Appendix 1
Appendix 1
Polymers and polyamides
3.1 Preliminaries
Polymers are important engineering materials for many reasons. One of the most
popular, high demanding and widely used polymer is polyamide. It was originally
the name given and discovered by Carothers W.H of Du Pont Co. in 1934 [Kohen,
1995]. Nowadays, there are many types of PA group of polymers available in the
market under the heading of “Nylon”. They become the key component of current
polymer research and technology, because of the diversities of properties and their
applications. The variations in properties are largely associated with the chain
flexibility, the interchain attraction, and the regularity of the molecular chain
factors which determine whether a polymer is glassy, rubbery, or liquid. This
makes thermoplastic material can be heated to a soft condition and then reshaped
before cooling.
The work presented in this thesis focuses on polyamide 12 based material known
as PA2200 of EOS. In the LS process, the PA2200 polymer powder in the bed
part cylinder goes through extreme changes temperature causes its transform
phase transitions results in changes physical and thermal properties of the
polymer. In following sections, brief descriptions of thermal properties are
presented. In addition, an attempt is made to show how such properties are
influenced when the temperature of the polymer is changed.
151
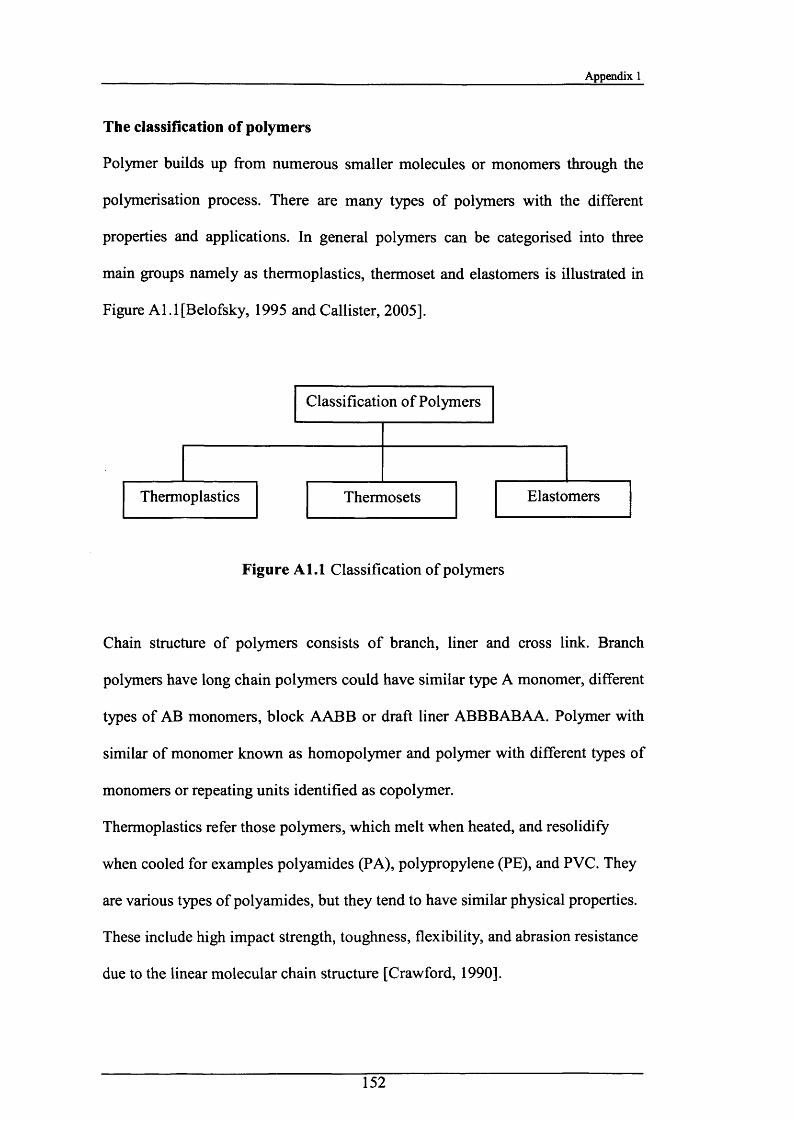
Appendix 1
The classification of polymers
Polymer builds up from numerous smaller molecules or monomers through the
polymerisation process. There are many types of polymers with the different
properties and applications. In general polymers can be categorised into three
main groups namely as thermoplastics, thermoset and elastomers is illustrated in
Figure Al.l[Belofsky, 1995 and Callister, 2005].
Thermoplastics ElastomersThermosets
Classification of Polymers
Figure A l . l Classification of polymers
Chain structure of polymers consists of branch, liner and cross link. Branch
polymers have long chain polymers could have similar type A monomer, different
types of AB monomers, block AABB or draft liner ABBBABAA. Polymer with
similar of monomer known as homopolymer and polymer with different types of
monomers or repeating units identified as copolymer.
Thermoplastics refer those polymers, which melt when heated, and resolidify
when cooled for examples polyamides (PA), polypropylene (PE), and PVC. They
are various types of polyamides, but they tend to have similar physical properties.
These include high impact strength, toughness, flexibility, and abrasion resistance
due to the linear molecular chain structure [Crawford, 1990].
152
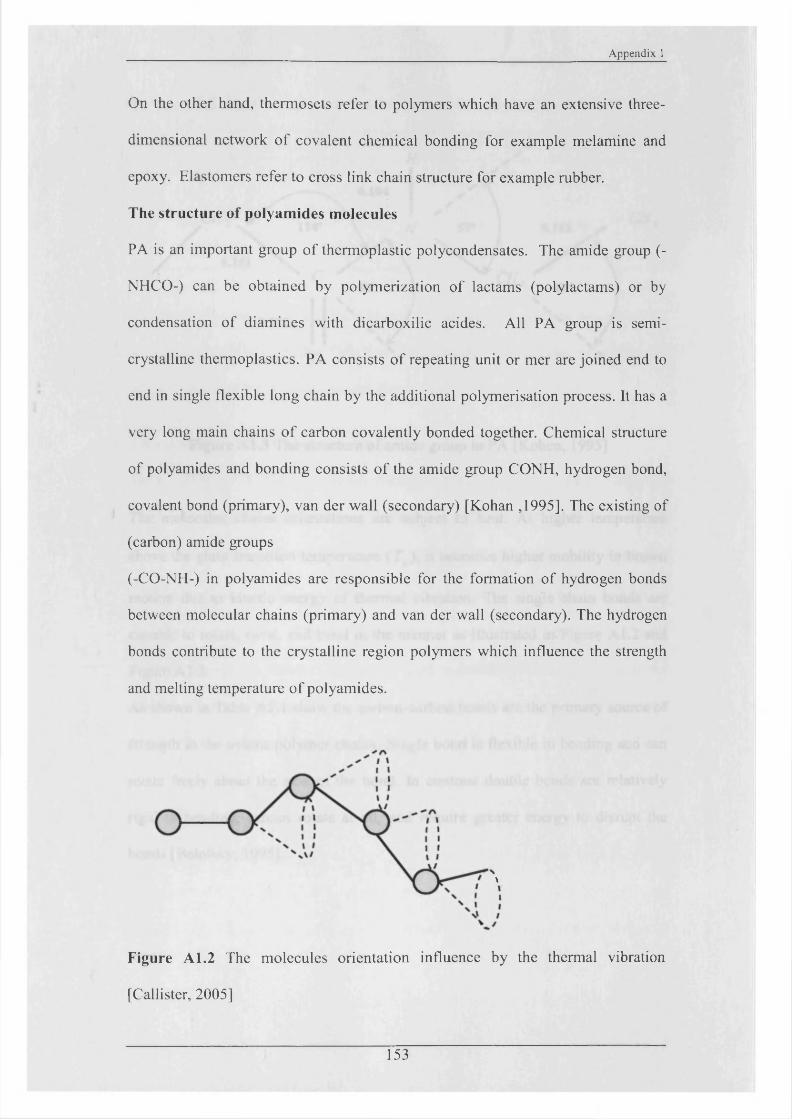
Appendix 1
On the other hand, thermosets refer to polymers which have an extensive three-
dimensional network of covalent chemical bonding for example melamine and
epoxy. Elastomers refer to cross link chain structure for example rubber.
The structure of polyamides molecules
PA is an important group of thermoplastic polycondensates. The amide group (-
NHCO-) can be obtained by polymerization of lactams (polylactams) or by
condensation of diamines with dicarboxilic acides. All PA group is semi
crystalline thermoplastics. PA consists of repeating unit or mer are joined end to
end in single flexible long chain by the additional polymerisation process. It has a
very long main chains of carbon covalently bonded together. Chemical structure
of polyamides and bonding consists of the amide group CONH, hydrogen bond,
covalent bond (primary), van der wall (secondary) [Kohan ,1995]. The existing of
(carbon) amide groups
(-CO-NH-) in polyamides are responsible for the formation of hydrogen bonds
between molecular chains (primary) and van der wall (secondary). The hydrogen
bonds contribute to the crystalline region polymers which influence the strength
and melting temperature of polyamides.
Figure A 1.2 The molecules orientation influence by the thermal vibration
[Callister, 2005]
\
153
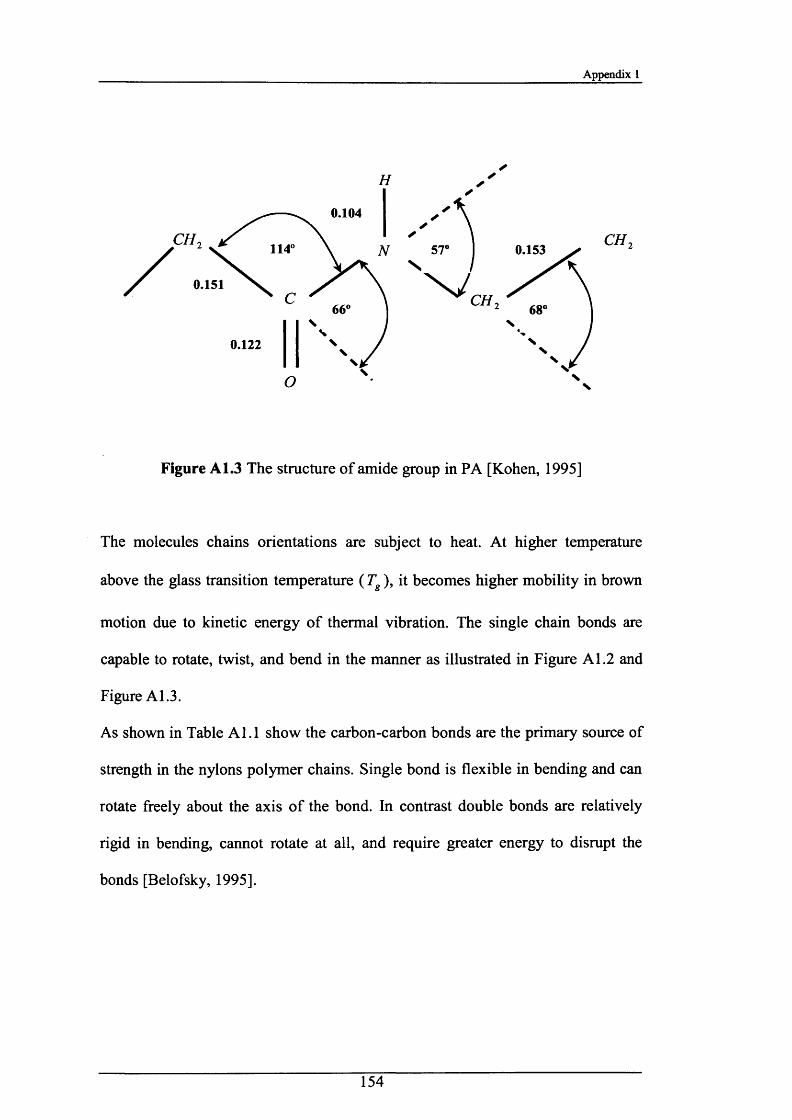
Appendix 1
H
0.104
\0.153 ^ CH2
X/CH 2
\O N
Figure A1.3 The structure of amide group in PA [Kohen, 1995]
The molecules chains orientations are subject to heat. At higher temperature
above the glass transition temperature ( T ), it becomes higher mobility in brown
motion due to kinetic energy o f thermal vibration. The single chain bonds are
capable to rotate, twist, and bend in the manner as illustrated in Figure A 1.2 and
Figure A 1.3.
As shown in Table A 1.1 show the carbon-carbon bonds are the primary source of
strength in the nylons polymer chains. Single bond is flexible in bending and can
rotate freely about the axis of the bond. In contrast double bonds are relatively
rigid in bending, cannot rotate at all, and require greater energy to disrupt the
bonds [Belofsky, 1995].
154
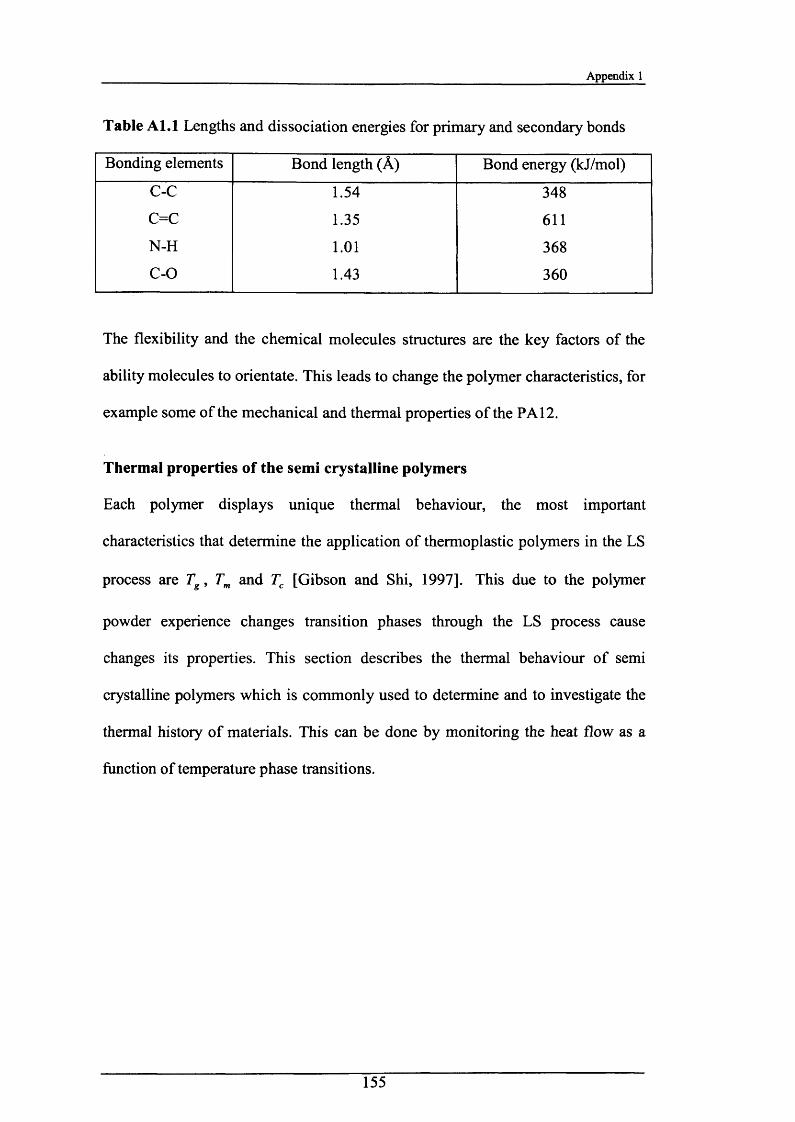
Appendix 1
Table A l.l Lengths and dissociation energies for primary and secondary bonds
Bonding elements Bond length (A) Bond energy (kJ/mol)
C-C 1.54 348
c=c 1.35 611
N-H 1 .0 1 368
C-0 1.43 360
The flexibility and the chemical molecules structures are the key factors of the
ability molecules to orientate. This leads to change the polymer characteristics, for
example some of the mechanical and thermal properties of the PA 12.
Thermal properties of the semi crystalline polymers
Each polymer displays unique thermal behaviour, the most important
characteristics that determine the application of thermoplastic polymers in the LS
process are Tg , Tm and Tc [Gibson and Shi, 1997]. This due to the polymer
powder experience changes transition phases through the LS process cause
changes its properties. This section describes the thermal behaviour of semi
crystalline polymers which is commonly used to determine and to investigate the
thermal history of materials. This can be done by monitoring the heat flow as a
function of temperature phase transitions.
155
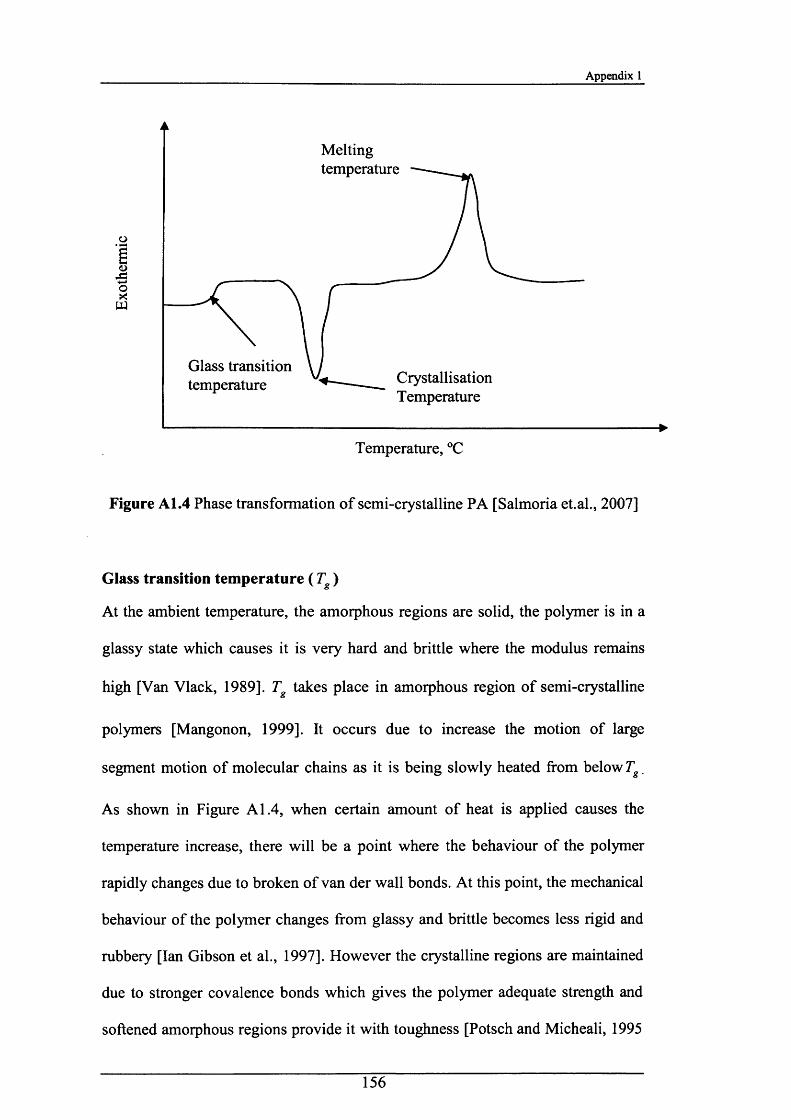
Appendix 1
Glass transition temperature Crystallisation
Meltingtemperature
43
Temperature
Temperature, °C
Figure A1.4 Phase transformation o f semi-crystalline PA [Salmoria et.al., 2007]
Glass transition temperature ( Tg )
At the ambient temperature, the amorphous regions are solid, the polymer is in a
glassy state which causes it is very hard and brittle where the modulus remains
high [Van Vlack, 1989]. T takes place in amorphous region of semi-crystalline
polymers [Mangonon, 1999]. It occurs due to increase the motion of large
segment motion of molecular chains as it is being slowly heated from below Tg.
As shown in Figure A 1.4, when certain amount of heat is applied causes the
temperature increase, there will be a point where the behaviour of the polymer
rapidly changes due to broken of van der wall bonds. At this point, the mechanical
behaviour of the polymer changes from glassy and brittle becomes less rigid and
rubbery [Ian Gibson et al., 1997]. However the crystalline regions are maintained
due to stronger covalence bonds which gives the polymer adequate strength and
softened amorphous regions provide it with toughness [Potsch and Micheali, 1995
156
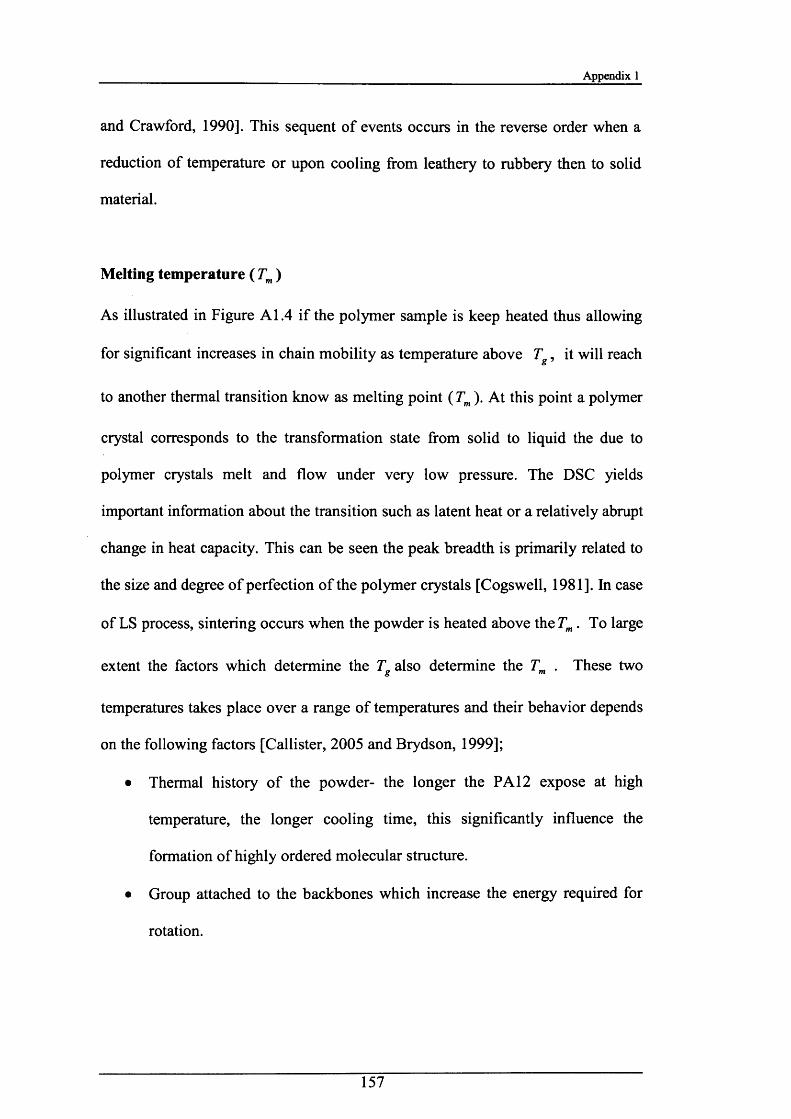
Appendix 1
and Crawford, 1990]. This sequent of events occurs in the reverse order when a
reduction of temperature or upon cooling from leathery to rubbery then to solid
material.
Melting temperature ( Tm )
As illustrated in Figure A 1.4 if the polymer sample is keep heated thus allowing
for significant increases in chain mobility as temperature above Tg, it will reach
to another thermal transition know as melting point ( Tm ). At this point a polymer
crystal corresponds to the transformation state from solid to liquid the due to
polymer crystals melt and flow under very low pressure. The DSC yields
important information about the transition such as latent heat or a relatively abrupt
change in heat capacity. This can be seen the peak breadth is primarily related to
the size and degree of perfection o f the polymer crystals [Cogswell, 1981]. In case
of LS process, sintering occurs when the powder is heated above the Tm. To large
extent the factors which determine the Tg also determine the Tm . These two
temperatures takes place over a range of temperatures and their behavior depends
on the following factors [Callister, 2005 and Brydson, 1999];
• Thermal history of the powder- the longer the PA 12 expose at high
temperature, the longer cooling time, this significantly influence the
formation of highly ordered molecular structure.
• Group attached to the backbones which increase the energy required for
rotation.
157

Appendix 1
• Chain stiffness- the presence of the NH group to form strong hydrogen
bonds (H-bonds) with the CO group leads to significant intermolecular
bonding forces an relatively high Tm
• Lamellae thickness-the thickness of chain-folded lamellae will depend on
Tc, the thicker the lamellae the higher Tm
• Molecular weight ( M w )- The higher M w, the less ease of movement and
more restriction in overall molecular freedom
Crystallisation Temperature ( Tc)
The crystallisation of a polymer crystal corresponds to the transformation of a
viscous liquid to solid phase. At Tc the polymer starts to solidify in which no order
molecule chains becomes the ordered structure of aligned molecular chains in
highly random then the crystal structural is formed due to heat given off. The
ability of a material to crystallise depends on the regularity of its molecular
structure. The longer cooling rate causes the more efficient packing of the
polymer chins leads to significant shrinkage and degree of crystallinity. This
influences the mechanical and thermal properties of this material. For this reason
the structure and properties of a given polymer will very much depend on the way
crystallisation has taken place [Potsch and Michaeli, 1995].
158
Appendix 1
Polymer crystallinity
PA 12 crystalline region is form due to the presence of spherulites or high degree
entanglement of the molecular chains. It may vary in size from frictions of a
micron to several millimetres in diameter, depending on the cooling rate from the
melt [Crawford, 1990]. I f the polymer melt is cooled very quickly it may
undercool, for instance remain molten at melting point. This result a plenty of
nucleation sites becoming available. The solid polymer will then consist of a large
number of small spherulites. The feature of long chain molecules as described in
section 4.2.
Effects of molecular factors in viscous flow properties
The properties of polymers are strongly dependent on their temperatures. During
the LS process molecules in the melted polymer flow in a non-Newtonian manner
and tend to line up in the direction o f flow [Van Wazer et al., 1963; Shearman,
1970 and Bames, et al., 1998].
Viscous flows
A further important property of polymers, also strongly dependent on their
temperatures, is their response to the application of a force, as indicated by two
main types of behaviour: elastic and plastic. In polymer materials, flowing is takes
place, much like viscous liquid. The viscous flow behaviour of the polymer plays
a key feature in the LS process. This because the powder experience the phase
transition by laser beam scanning. The viscosity o f the fluid can be measured by
the ratio of the shearing stress to the velocity gradient [Bourell and Beaman,
2005].
r77 = -
r
159
Appendix 1
Where 77 is the viscosity, r - a shear stress and y - a shear strain.
The study of deformation and flow of molten polymer under the influence of an
applied stress can be measured using a kind of viscometer known as melt flow
indexer device [Rides 2002.; Potsch and Micheali, 1995]
160
Appendix 2
Appendix 2
Publications
D.T.Pham , K.D.Dotchev , W.A.Y Yusoff, Explanations of the “orange peel”
phenomenon in the laser sintering process (LS), Proceedings of the Institution of
Mechanical Engineers, Part B: Journal of Engineering Manufacture.
(Final preparation for submission)
D.T.Pham, K.D.Dotchev , W.A.Y Yusoff, Deterioration of Polyamide Powder
Properties in the Laser Sintering Process, Proceedings of the Institution of
Mechanical Engineers, Part B: Journal of Engineering Manufacture.
(Final preparation for submission)
D.T.Pham, K.D.Dotchev, W.A.Y Yusoff, Improvement of powder management
and recycling in laser sintering (LS), Proceedings of the Institution of
Mechanical Engineers, Part B: Journal of Engineering Manufacture.
(Final preparation for submission)
D.T.Pham, K.D.Dotchev, W.A.Y Yusoff, Improvement of part surface finishing
in Laser Sintering by experimental design optimisation (DOE), 3rd Virtual
International Conference on Innovative Production Machines and Systems
(PPROMPS), 2nd- 13th July 2007, Cardiff, United Kingdom.
(Accepted)
161
Appendix 2
K.D.Dotchev , D.T.Pham , W.A.Y Yusoff , S.Soe, Investigation on polyamide
powder properties deterioration and efficient powder recycling in Laser Sintering,
3rd International Conference on Advanced Research in Virtual and Rapid
Prototyping, 24th - 29th September 2007, Leira, Portugal.
(Accepted)
162
References
Ajoku U, Saleh N, Hopkinson N, Hague R and Erasenthiran (2006)
Investigating mechanical anisotropy and end-of-vector effect on laser-sintered
nylon parts, Proceedings of the Institution of Mechanical Engineers, Part
B: Journal of Engineering Manufacture, Vol.220, No.7, pp 1077-1086.
Badrinarayan B and Barlow J W (1995) Effect of processing parameters in
SLS of Metal-Polymers, Proceedings of Solid Freeform Fabrication
Symposium, Austin, Texas, pp 55-63.
Barnes H A, Hutton J F and Walters K W (1998) An introduction to
Rheology, Elsevier, ISBN 0-444-87140-3.
Beaman J J, Barlow J W, Bourell D L, Crawford R H, Marcus H L and Me
Alea K P (1997) Solid Freeform Fabrication: A New Direction in
Manufacturing, Kluwer Academic Publishers, Dordrecht, The Netherlands,
ISBN 0 7923 9834 3.
Badrinayaran and Barlow J W (1995) Effects of Processing Parameters in SLS
of metal-polymer powders, Proceedings of Solid Freeform Fabrication,
Austin, Texas, pp 55-63.
Belofsky.H (1995) Plastics: Product Design and Process Engineering,
Hanser. ISBN 3-446-17417-6.
Bourell D L and Beaman J J (2005) 2nd International Conference on
Advanced Research in Virtual Research and Rapid Prototyping, Portugal
Bower D 1.(2002) An Introduction to Polymer Physics, Cambridge
University Press, ISBN 0-521-63721-X.
163
Brydson J (1999) Plastics Material, Butterworth Heinemann, 7th editions,
United Kindom. ISBN-10: 0750641320
Callister W D (2005) Fundamentals of Materials Science and Engineering,
2nd, John Wiley & Sons Inc. ISBN 978-0-471-74477-1
Caulfield B, McHuge P E and Lohfeld S (2007) Dependence of mechanical
properties of polyamide components on build parameters in the SLS process,
Journal of Materials Processing Technology, Vol. 182, Issues 1-3, pp 477-
488.
Choren J , Gervasi V, Herman T, Kamara S and Mitchell J (2001) Selective
Laser Sintering (SLS) powder life, Proceedings of Solid Freeform
Fabrication, Austin, Texas, pp 39-45..
Chua C K and Fai L K (1997) Rapid Prototyping: Principles and applications
in manufacturing, John Wiley & Sons. Inc,ISBN 0-471-19004-7.
Cogswell F N (1981) Polymer Melt Rheology, A Guide for Industrial
Practice, John Wiley&Sons. ISBN 0-470-27102-7.
Coleman E D ,Montgomery C D (1993) A Systematic Approach to Planning
for a Design Industrial Experiment, Technometrics Journal, Vol.35, No.l,
pp 1-26.
Cooper K G, Rapid Prototyping Technology, Selection and Application,
Marcle Dekker, Inc, 2001.0-8247-0261-1.
Crawford R J (1990) Plastics Engineering, 2nd editions, Pergamon Press.
ISBN 0-08-032626-9.
Das S B, Wohlert M, and Bourell D (1998) Direct Laser Freeform Fabrication
of High Performance Metal Components, Rapid Prototyping Journal, Vol 4,
No 3, pp 112-117.
164
David A (2001) The use of statistical experimental design for PCB process
optimisation, Circuit World, Volume 27, No 4, pp 12-15.
Dean A (2005) EOSINT P Series, Prototype, The dedicated Journal for
Prototyping and direct manufacturing.
Dean Y (1995) Materials Technology, Longman, pp 151-158. ISBN 0-582-
21259-6
Deng X, Zong G, and Beaman J J (1992) Parametric analysis for the Selective
Laser Sintering of a sample polymer system, Proceedings of Solid Freeform
Fabrication, Austin, Texas, pp 102-109.
Determination of the melt flow rate (MFR) and the melt volume rate (MVR)
of Thermoplastics, ISO 1133 Standard.
Desktop Engineering, http://www.deskeng.com/Articles/Hardware-
Review/Parts-from-Powder-200612121522.html. Parts from Powder
[Accessed 15th February 2006].
Determination of average molecular mass and molecular mass distribution of
polymers using Gel Permeation Chromatography (GPC), ISO16014
Standard.
Dewidar M and Dalgamo K W (2001) Direct selective laser sintering of high
speed steel, 17th National Conference on Manufacturing Research, pp 181-
186.
Dimov S S, Pham D T, Lancan F and Dotchev K.D (2001) Rapid tooling
applications of the laser sintering process, Rapid Prototyping Journal,
Vol.4, No.4, pp 296-302.
165
Dickens P M and Keane J N (1998) Rapid manufacturing, Prototyping
Technology International ’98, pp 209-212.
Dochev K and Soe S (2006) Rapid Manufacturing of patterns for investment
casting: improvement of quality and success rate, Rapid Prototyping
Journal, Vol 12, Issue.3, pp 156-164.
DTM (1996a) The Sinterstation® System 2500, Guide to Materials for
Nylon Compounds; DTM Corporation. DCN:8001-10003.
DTM (1998b) DTM 2nd European User Group Meeting Leuven, Belgium,
Rapid Steel 2.0, 7-8 October 1998.
DTM Product information-Rapid Tool 2.0 Material (1998c) DTM GmbH,
OttoHahn-Str.6, D-40721 Hilden.
DTM Product information (1998d) Copper Polyamide Mold Insets for Plastic
Injection Moulding, DTM Corporation, June, 81611 Headway Circle,
Building 2, Austin, TX.
DTM SandForm material fuels development of new aircraft engine part for
Woodward Governor company (1998e) Horizons, newsletter published by
DTM.
3D System Corporation, www.3dsvstems.com. [Accessed 15th February
2007].
Effier P Jand Saal J D (1997) Prototyping: a design chain integration
perspective, Prototyping Technology International ’97, The International
Review of Simulations-Based, Rapid Prototyping & Manufacturing, UK&
International Press, United Kingdom, pp 23-25.
EOS, Electro Optical Systems GmbH, www.eos-gmbh.de. [Accessed 15th
February 2007.]
166

Ellekjaer M.R, (1998) The use of experimental design in the development of
new products, International Journal of Quality Science, Vol 3, No 3, pp
254-274.
Forderhase P, Me Alea K, Michelewicz M, Ganninger M, and Firestone
K(1992) SLS prototypes from nylon, Proceedings of Solid Freeform
Fabrication Symposium, Austin, Texas pp 102-109.
Fritz F (1998) Laser sintering on its way up, Prototyping Technology
International ’98, pp 186-189.
Gale L (1997) RP past and present, Prototyping Technology International
’97, The International Review of Simulations-Based, Rapid Prototyping &
Manufacturing, UK& International Press, United Kingdom, pp 12-14
Ghanekar A and Crawford (2003) Optimisation of SLS Process Parameters
using D-Optimality, Proceedings of Solid Freeform Fabrication, Austin,
Texas, pp 348-361.
Gololewski E, Czemiawska K, Gasiorek M (1980) Colloid Polymer Science,
Vol.258, pp 1130-1136.
Gomet T J (2002) Characterisation of Selective Laser sintering TM to
Determine Process Stability, Proceedings of Solid Freeform Fabrication,
Austin, Texas, pp 546-553.
Gomet T J (2002) Improving Selective Laser Sintering Consistency,
CAD/CAM Publishing, pp-1-3 .
Ghany K A and Moustafa S F (2006) Comparison between the products of
four RPM systems for metals. Rapid Prototyping Journal, Vol. 12, Issue 2,
pp 86-94.
167
Gibson,I. and Shi (1997) Material Properties and Fabrication Parameters in
SLS, Process, Rapid Prototyping Journal, Vol 3, No 4, pp 129-136.
Guo and Suiyan (1996) Optimizing of Selective Laser Sintering; Laser
Processing of Materials and Industrial Applications. Proceedings of SPIE
The International Society for Optical Engineering, Beijing. Vol 2888, pp
389-391.
Hatakeyama T and Liu Z (1999) Handbook of Thermal Analysis, John
Wiley & Sons, ISBN 1418-2874.
Hardro P J, Wang J H, and Stucker B E (2004) A design of experiment
approach to determine the optimal process parameters for rapid prototyping
machines, Proceedings of Solid Freeform Fabrication, Austin, Texas, pp 1-
20.
Hedge R R., Kamath M G. and Dahiya A. Polymer Crystallinity, Material
Science Lecture Notes, pp 1-17.
http://www.engr.utk.edu/mse/pages/Textiles/Polvmer%20Crvstallinitv.htm-
last [Accessed on 22nd April 2006].
Ho H C, Gibson I and Cheung, L W (1999) Effects of energy density on
morphology and properties of selective laser sintered polycarbonate, Journal
of Materials Processing Technology, Vol.89, pp 204-210.
Ho H C, Gibson I and Cheung W L (2000) Effects of Energy density on
Bonus Z , surface roughness and warpage of SLS sintered Polycarbonate,
Rapid Prototyping, 9th International Conference, Tokyo Japan, June 12-13,
pp 99-103.
168
Hopkinson N, Hauge R and Dickens P (2006) Introduction to Rapid
Manufacturing, an industrial revolution for the digital age. ISBN 13 978-0-
470-01613-8.
Jiji A (1998) Some key things industrial engineers should know about
experimental design, Journal of Logistics Information Management, Vol
11, pp 386-392.
Kai C C, Chou S M and Wong T S (1998) A study of the state of the Art
Rapid Prototyping Technologies, The International Journal of Advanced
Manufacturing Technology, Vol 14, pp 146-152.
Kimble. L.L (1992) The materials advantage of the Selective Laser Sintering
process, Proceedings of Solid Freeform Fabrication Symposium, Austin,
Texas, pp 212-219.
King D and Tansey T (2003) Rapid Tooling: selective laser sintering injection
tooling, Journal of Materials Processing Technology, pp 42-48.
King D and Tansey T (2002) Alternative for Rapid Tooling, Journal of
Materials Processing Technology, Vol 121, pp 313-317.
Kohan MI (1995) Nylon Plastics Handbook, Hanser. ISBN 3-446-17048-0
Kruth J P, Wang X, Laoui T, and Froyen L (2003) Laser and materials in
selective laser sintering, Rapid Prototyping Journal, Vol 23, No 4, pp 357-
371.
Lacan F (2000) Capabilities of the RapidTool process, PhD thesis, Cardiff
University.
Lauwers B, Kruth J P, Froyen L, Bonse J and Morren B(1998) Hard metal
parts by SLS, Prototyping Technology International ’98, pp 124-126.
169

Levy G N and Schindel (2002) Overview of layer manufacturing technologies,
opportunities, options and applications for rapid tooling, Proceedings of the
Institution of Mechanical Engineers, Part B: Journal of Engineering
Manufacture, Vol 216, pp 1621-1634
Mangonon P.L (1999) The principles of materials selection for engineering
design, Prentice Hall. ISBN 0-13-242595-5.
Mantia F L (2002) Handbook of Plastic Recycling, Rapra Technology
Limited, ISBN 1-85957-325
Marit R E (1998) The use of experimental design in the development of new
products, International Journal of Quality Science, Vol 3, No 3, pp 254-
274.
Martin J (2006) Materials for engineering, 3rd editions, Woodhead
publishing in materials, ppl59-184, ISBN 10-0-84938780-9
Martin R, Crispin A and Angela D (2001) Multi-rate and Extensional Flow
Measurements using the Melt Flow Rate Instrument: Measurement Good
Practice Guide, National Physical Laboratory.
Martin R, Crispin A and Angela D (2002) Improved melt flow rate
measurements: an industrial case study, Measurement note, National Physical
Laboratory.
Materialise Belgium, www.materialise.com. New EOSINT P700 machine
and Alumide material [Accessed 18th September 2006].
Me Alea K, Booth R, Foderhase P, and Lackminarayan U (1995) Materials for
Selective Laser Sintering Process, International SAMPE technical
conference, Vol 27, pp 949-961.
170
Mazzoli A, Moriconi G, and Pauri M G (2006) Characterisation of an
aluminium-filled polyamide powder for applications in selective laser
sintering, Journal of Materials and Design, ppl-8.
Metalworking Production magazine, http://www.mwponline.com. Laser-
sintering for series production [Accessed 11th September 2006].
Michael S (1998) New RP Material from EOS Rapid Prototyping, Electronic
Mailing List, http://rapid.lpt.fi/rp-ml-1998/2284.html [Accessed 11th
September 2006]
Moen D R, Norlan W T and Provost P L (1991) Improving Quality Through
Planned Experimentation, McGraw-Hill, ISBN 0-07-100837-3.
Montgomery C D (2000) Design and Analysis of Experiments, Wiley,5th
edition, ISBN 0471316490.
Murphy J, Lappo K, Wood K, Beaman J J (2002) Statistical Model of Laser
Surface Finishing using Design of Experiments, Proceedings of Solid
Freeform Fabrication, Austin, Texas, pp 585-593.
Naim J (2001)Phd thesis, Finite Element Analysis of Curl Development in the
SLS process, Leeds University.
Neal P J (1994) Rapid Prototyping Using the Selective Laser Sintering
Process, Rapid Prototyping Journal, Vol 14, No 2, pp 14-17.
Nelson J C and Barlow J W (1992) Relating operating parameters between
SLS machines which have different scanner geometries and laser spot sizes,
Proceedings of Solid Freeform Fabrication, Austin, Texas, pp 228-235.
171
Odonnchadha B and Tansey A (2004) A note on rapid composite tooling by
selective laser sintering, Journal of Materials Processing Technology, pp
28-34.
Pham D T, Dimov S.S and Gault R.S (1997) RP past and present,
Prototyping Technology International ’97, The International Review of
Simulations-Based, Rapid Prototyping & Manufacturing, UK& International
Press, United Kingdom, pp 15-19.
Pham D.T, Dimov S.S and Gault R.S (1998) Laser sintering on its way up,
Prototyping Technology International ’98, pp 196-202.
Pham D.T, Dimov S.S and Lacan F (1999) The RapidTool process: Selective
Laser Sintering: Applications and Technological Capabilities, Proceedings of
the Institution of Mechanical Engineers, Part B: Journal of Engineering
Manufacture, Vol. 213, No 5, pp 435-449.
Pham D T, and Dimov S S, (2000) Rapid Manufacturing, The Technologies
& Applications of Rapid Prototyping & Rapid Tooling, Springer, ISBN 1-
85233-360-X.
Pham D T, and Dimov S S, (2003) Rapid Prototyping and rapid tooling -
the key enablers for rapid manufacturing, Proceedings of the Institution
of Mechanical Engineers, Part B: Journal of Engineering Manufacture, Vol.
217, No l ,pp 1-24.
Plastics- Differential Scanning Calorimetry (DSC), ISO 11357 Standard.
Potsch G and Micheali W (1995) Injection Moulding, Hanser publishers,
ISBN: 1-56990-193-7.
Potts A (1998) Real prototypes at realistic cost, Prototyping Technology
International ’98, pp 204-208.
172

Salmoria G V, Leite J L, Ahrens C H, Lago A and Pires A T N (2007) Rapid
manufacturing of PA/HDPE blend specimens by selective laser sintering :
Microstructural characterisation, Journal of Polymer Testing, ppl-8
Shearman P (1970) Industrial Rheology, Academic Press, pp 33-40,
ISBN: 12-639950-6
Stephen Z D, Christopher Y L, Bret H C. Lei Z and William W Z (2000)
Thermal analysis: the next two decades, Thermochimica Acta, Vol 355, pp
59-68.
Shi Y, Li Z, Huang S and Zeng F (2004) Effects of the properties of the
polymer materials on the quality of selective laser sintering parts,
Proceedings of the Institution of Mechanical Engineers, Part B: Journal of
Engineering Manufacture, Vol 214, No 6, pp 247-249.
Shi Y, Li Z, Sun H, Huang S and Zeng F (2004) Development of a polymer
alloy of polystyrene (PS) and polyamide (PA) for building functional part
based on selective laser sintering (SLS), , Proceedings of the Institution of
Mechanical Engineers, Part B: Journal of Engineering Manufacture,
Vol.218, No.5, pp 299-306.
Stacey Au and Paul K.Wright (1993) A Comparative study of Rapid
Prototyping Technology, Proceedings of Solid Freeform Fabrication,
Austin, Texas ,pp 73-82.
Stierlen P, Keller B, Shen J and Eyerer P (1997) Developments in SLS
technology, Prototyping Technology International ’97, The International
Review of Simulations-based, Rapid Prototyping & Manufacturing, UK&
International Press, United Kingdom, pp 153-155.
Ryan A Y, Fairclough P A, Terril N J, Olmsted P D and Pooh W C K (1999)
173
Scattering study of nucleation phenomenon in polymer crystallisation, Royal
Society of Chemistry, No 112, pp 13-29.
Steve U and Richard F (2003) Rapid prototyping technologies, Journal of
Rapid Prototyping, Vol 23, No 4, pp 318-330.
Theodore L, Bergman, and David L B (1996) Materials and Materials
Processing, WTEC Rapid Prototyping Report.
Thermo Haake (2000) Meltflow Indexer 2000, Thermo Haake Scientific.
Tontowi A E and Childs T H (2001) Scanning Electron Microscope of a
Glass-Filled Crystalline polymer sintered part, ISTECS Europe, Proceedings
6th ISSM, pp 1-4.
Usher S J and Srinivasan K M (2000) Quality improvement of Selective Laser
Sintering process, Journal of Quality Engineering, pp 161-168.
Van Wazer J R,Lyons J W, Kim K Y, Colwell R E (1963) Viscosity and Flow
Measurement, Interscience publishers.
Wahab M S, Dalgamo K W and Cochrane (2006) Processing of A
Polyamide/Yttrium stabilised Zirconia nanocomposite using the Selective
Laser Sintering, 7th conference on Rapid Design, Prototyping and
Manufacture, pp 21-28.
Walter K, Bart V, Hessel M and Nico K (2006) Design for Rapid
Manufacturing functional SLS parts, Innovative Production Machines and
Systems Conference, pp 389-394.
William F S (1993) Foundations of Materials Science and Engineering, 2nd
editions, ISBN 0-07059202.
174
Wohlers Report (2005) An in-depth worldwide progress report on the Rapid
Prototyping, tooling, and manufacturing state of the industry, Annual
Worldwide Progress Report, Wohlers Associates Inc.
Wholers T (2000) Executive Summary, Worldwide Progress Report,
Wohlers Associates Inc.
Wholers T (1999) Rapid Prototyping & Tooling State of the Industry,
Executive Summary, Worldwide Progress Report, Wohlers Associates Inc.
Vinay S, Kristin W, Davis B, Beaman J J (2003) Selective Laser Sintering of
Duraform Polyamide™ with small-scale features, Proceedings of Solid
Freeform Fabrication, Austin, Texas, pp 585-605.
Young R J (1983) Introduction to Polymers, Chapman and Hall, ppl85,
ISBN 0-412-221802.
Zarringhalam H, Hopkinson N, Kamperman N F, and Vlieger. D J J (2006)
Effects of processing on microstructure and properties of SLS Nylon 12,
Journal of Materials Science & Engineering, pp 172-180.
175