Embed Size (px)
Citation preview
Eastern Illinois UniversityThe Keep
Masters Theses Student Theses & Publications
2016
An Investigation of the Nexus between Poverty andthe Informal Sector in Developing Economies: ACase Study of NigeriaOmotara AdeekoEastern Illinois UniversityThis research is a product of the graduate program in Economics at Eastern Illinois University. Find out moreabout the program.
This is brought to you for free and open access by the Student Theses & Publications at The Keep. It has been accepted for inclusion in Masters Thesesby an authorized administrator of The Keep. For more information, please contact [email protected].
Recommended CitationAdeeko, Omotara, "An Investigation of the Nexus between Poverty and the Informal Sector in Developing Economies: A Case Studyof Nigeria" (2016). Masters Theses. 2497.https://thekeep.eiu.edu/theses/2497
The Graduate School� EASTERN ILLINOIS UNIVERSITY"
Thesis Maintenance and Reproduction Certificate
FOR: Graduate Candidates Completing Theses in Partial Fulfillment of the Degree Graduate Faculty Advisors Directing the Theses
RE: Preservation, Reproduction, and Distribution of Thesis Research
Preserving, reproducing, and distributing thesis researcn is an important part of Booth Library's responsibility to provide access to scholarship. In order to further this goal, Booth Library makes all graduate theses completed as part of a degree program at Eastern Illinois University available for personal study, research, and other not-for-profit educational purposes. Under 17 U.S.C. § 108, the library may reproduce and distribute a copy without infringing on copyright; however, professional courtesy dictates that permission be requested from the author before doing so.
Your signatures affirm the following: • The graduate candidate is the author of this thesis. • The graduate candidate retains the copyright and intellectual property rights associated with the
original research, creative activity, and intellectual or artistic content of the thesis. • The graduate candidate certifies her/his compliance with federal copyright law (Title 17 of the U.
S. Code) and her/his right to authorize reproduction and distribution of all copyrighted materials
included in this thesis. • The graduate candidate in consultation with the faculty advisor grants Booth Library the non
exclusive, perpetual right to make copies of the thesis freely and publicly available without restriction, by means of any current or successive technology, including by not limited to photocopying, microfilm, digitization, or internet.
• The graduate candidate acknowledges that by depositing her/his thesis with Booth Library, her/his work is available for viewing by the public and may be borrowed through the library's circulation and interlibrary loan departments, or accessed electronically.
• The graduate candidate waives the confidentiality provisions of the Family Educational Rights and Privacy Act (FERPA) (20 U.S. C. § 1232g; 34 CFR Part 99) with respect to the contents of the thesis and with respect to information concerning authorship of the thesis, including name and status as a student at Eastern Illinois University.
I have conferred with my graduate faculty advisor. My signature below indicates that I have read and agree with the above statements, and hereby give my permission to allow Booth Library to reproduce and distribute my thesis. My adviser's signature indicates concurrence to.reproduce and distribute the thesis.
Graduate Candidate Signature
Printed Name
£.coNDOO/CJ Graduate Degree Program
Please submit in duplicate.
Faculty Adviser Signature
Printed Name
_3)_2-CJlJ&_ __ _
Date
AN INVESTIGATION OF THE NEXUS BETWEEN POVERTY AND THE INFORMAL
SECTOR IN DEVELOPING ECONOMIES: A CASE STUDY OF NIGERIA
(TITLE)
BY
OMOTARA ADEEKO
THESIS
SUBMITTED IN PARTIAL FULFILLMENT OF THE REQUIREMENTS
FOR THE DEGREE OF
Master of Arts in Economics
IN THE GRADUATE SCHOOL, EASTERN ILLINOIS UNIVERSITY
CHARLESTON, ILLINOIS
2016
YEAR
I HEREBY RECOMMEND THAT THIS THESIS BE ACCEPTED AS FULFILLING
THIS PART OF THE GRADUATE DEGREE CITED ABOVE
't/29{1� THESIS COMMITTEE CHAIR DATE DEPARTMENT/SCHOOL C�
OR CHAIR'S DESIGNEE
8 / • {IC. THESIS COMMITTEE MEMBER DATE THESIS COMMITTEE MEMBER
rM THESIS COMMITTEE M91rBER DATE THESIS COMMITTEE MEMBER
� DATE
DATE
DATE
Copyright © 20 1 6 by Omotara Adeeko All rights reserved

Acknowledgement
I would like to take this opportunity to thank all of the people that supported me through
my graduate studies and my thesis . I am particularly grateful to Dr. A. Desire Adorn, my
supervisor, for his immense guidance, patience and help in completing this thesis . Without your
effort and understanding, I could not have been able to choose my thesis topic, also, being able to
complete my thesis and degree on time . I am privileged to be under his tutelage .
I would also like to thank Dr. Mukti Upadhyay, Dr. Ali Moshtagh and Dr. Ahmed Abou
Zaid for their help and suggestion in this thesis . Their encouragement and suggestions in
completing this thesis deserves my earnest appreciation. I also thank all my professors and
friends (Erica Tiku, Freda Opoku, Dayo Kukoyi, Annie Barber, Peter Ebukuyo, Ebede
Beluchukwu, Ifeanyi Okonta and Salim Nuhu) at Eastern Illinois University for their support.
I owe my deepest gratitude to my parents, siblings and my Ohio family. Thank you for
supporting my education, financially, emotionally and spiritually. Mom and Dad, you are my
inspirations, helping me to struggle against all odds and keeping me thriving.
AN INVESTIGATION OF THE NEXUS BETWEEN POVERTY AND THE INFORMAL SECTOR IN DEVELOPING
ECONOMIES: A CASE STUDY OF NIGERIA
Adeeko Omotara Department of Economics Eastern Illinois University.
Advisor: Dr. A. Desire Adorn
Committee: Dr. Ali Moshtagh Dr. Mukti Upadhyay
ABSTRACT
This paper examines the relationship between poverty and the informal sector in Nigeria.
In order to achieve this objective both primary and secondary sources of data mostly spanning
from 1 980 to 20 1 4 are utilized. The methodology follows three stages . First, the Granger
causality test is performed to determine the direction of causality . Using that information, a
baseline model, along with several variants, is built on the next stage. Lastly, a robustness check
is completed to ensure that the results do not exhibit severe spuriousness problems.
Granger causality tests indicate that the informal sector causes poverty. Overall , nine
models including some key determinants of poverty, such as unemployment, debt service,
inflation, rural population and corruption, are considered. The robustness check includes two
distinct steps . First, different proxies for poverty and the informal sector are used. Second, a
Jarque-Bera test is conducted. The findings from the check shows that the residuals are normally
distributed and not spurious . The regression result reveals that as the informal sector expands,
poverty expands too . Therefore, a reduction in the size of the informal sector could be targeted
by decision makers in their attempt to fight poverty in Nigeria. In practice, policies focusing on
curtailing red tapes or lengthy bureaucratic processes, stamping out corruption, and training as
well as providing support to small business owners could be implemented or strengthened.
Table of Contents
1 Introduction . . . . . . . . . . . . . . . . . . . . . . . . . . . . . . . . . . . . . . . . . . . . . . . . . . . . . . . . . . . . . . . . . . . . . . . . . . . . . . . . . . 1
2 Literature Review . . . . . . . . . . . . . . . . . . . . . . . . . . . . . . . . . . . . . . . . . . . . . . . . . . . . . . . . . . . . . . . . . . . . . . . . . . . . . 5
3 Background Analysis and Economic Presentation . . . . . . . . . . . . . . . . . . . . . . . . . . . . . . . . . . . . . . 1 0
3 . 1 Geography and the people . . . . . . . . . . . . . . . . . . . . . . . . . . . . . . . . . . . . . . . . . . . . . . . . . . . . . . . . . . . . . 1 0
3 .2 The economy . . . . . . . . . . . . . . . . . . . . . . . . . . . . . . . . . . . . . . . . . . . . . . . . . . . . . . . . . . . . . . . . . . . . . . . . . . . . 1 0
3 .2 . 1 Unemployment . . . . . . . . . . . . . . . . . . . . . . . . . . . . . . . . . . . . . . . . . . . . . . . . . . . . . . . . . . . . . . . . . . . . . . . . 1 2
3 .2 .2 Inflation . . . . . . . . . . . . . . . . . . . . . . . . . . . . . . . . . . . . . . . . . . . . . . . . . . . . . . . . . . . . . . . . . . . . . . . . . . . . . . . . 1 3
3 .2 . 3 Debt Servicing . . . . . . . . . . . . . . . . . . . . . . . . . . . . . . . . . . . . . . . . . . . . . . . . . . . . . . . . . . . . . . . . . . . . . . . . . 1 4
3 .2 .4 Corruption . . . . . . . . . . . . . . . . . . . . . . . . . . . . . . . . . . . . . . . . . . . . . . . . . . . . . . . . . . . . . . . . . . . . . . . . . . . . . 1 5
3 . 3 Poverty in Nigeria . . . . . . . . . . . . . . . . . . . . . . . . . . . . . . . . . . . . . . . . . . . . . . . . . . . . . . . . . . . . . . . . . . . . 1 6
3 . 3 . 1 Causes of Poverty . . . . . . . . . . . . . . . . . . . . . . . . . . . . . . . . . . . . . . . . . . . . . . . . . . . . . . . . . . . . . . . . . . . . 1 6
3 . 3 . 1 Review of Poverty Reduction Programs . . . . . . . . . . . . . . . . . . . . . . . . . . . . . . . . . . . . . . . . . 1 7
3 . 3 . 2 Problems/Challenges of Poverty Reduction Programs in Nigeria . . . . . . . . . . . . . 1 9
3 .4 The Informal Sector . . . . . . . . . . . . . . . . . . . . . . . . . . . . . . . . . . . . . . . . . . . . . . . . . . . . . . . . . . . . . . . . . 20
3 .5 Size and Composition of the Informal Sector in Nigeria . . . . . . . . . . . . . . . . . . . . . . . 2 1
4 Methodology and Data . . . . . . . . . . . . . . . . . . . . . . . . . . . . . . . . . . . . . . . . . . . . . . . . . . . . . . . . . . . . . . . . . . . . . 23
4 . 1 Methodology . . . . . . . . . . . . . . . . . . . . . . . . . . . . . . . . . . . . . . . . . . . . . . . . . . . . . . . . . . . . . . . . . . . . . . . . . . . 23
4. 1 . 1 Granger Causality Test . . . . . . . . . . . . . . . . . . . . . . . . . . . . . . . . . . . . . . . . . . . . . . . . . . . . . . . . . . . . . . . . 23
4. 1 .2 The model . . . . . . . . . . . . . . . . . . . . . . . . . . . . . . . . . . . . . . . . . . . . . . . . . . . . . . . . . . . . . . . . . . . . . . . . . . . . . 25
4 . 1 . 3 Robustness Test . . . . . . . . . . . . . . . . . . . . . . . . . . . . . . . . . . . . . . . . . . . . . . . . . . . . . . . . . . . . . . . . . . . . . . .29
4.2 Data . . . . . . . . . . . . . . . . . . . . . . . . . . . . . . . . . . . . . . . . . . . . . . . . . . . . . . . . . . . . . . . . . . . . . . . . . . . . . . . . . . . . . . 30
5 Results and Implications . . . . . . . . . . . . . . . . . . . . . . . . . . . . . . . . . . . . . . . . . . . . . . . . . . . . . . . . . . . . . . . . . . . 3 1
5. 1 Results . . . . . . . . . . . . . . . . . . . . . . . . . . . . . . . . . . . . . . . . . . . . . . . . . . . . . . . . . . . . . . . . . . . . . . . . . . . . . . . . . . . . 3 1
5.2 Implications . . . . . . . . . . . . . . . . . . . . . . . . . . . . . . . . . . . . . . . . . . . . . . . . . . . . . . . . . . . . . . . . . . . . . . . . . . . . . . 43
6 Conclusion . . . . . . . . . . . . . . . . . . . . . . . . . . . . . . . . . . . . . . . . . . . . . . . . . . . . . . . . . . . . . . . . . . . . . . . . . . . . . . . . . . . . 45
Reference . . . . . . . . . . . . . . . . . . . . . . . . . . . . . . . . . . . . . . . . . . . . . . . . . . . . . . . . . . . . . . . . . . . . . . . . . . . . . . . . . . . . . . . 46
Appendix . . . . . . . . . . . . . . . . . . . . . . . . . . . . . . . . . . . . . . . . . . . . . . . . . . . . . . . . . . . . . . . . . . . . . . . . . . . . . . . . . . . . . . . . 49
List of Figures and Tables
Figure 1 GDP in Nigeria from 1 980-20 1 4 ('billions) . . . . . . . . . . . . . . . . . . . . . . . . . . . . . . . . . . . . . . . . . . . 1 1
Figure 2 Unemployment Trend in Nigeria from 1 980-20 1 4 . . . . . . . . . . . . . . . . . . . . . . . . . . . . . . . . . . . 1 2
Figure 3 Inflation rate in Nigeria from 1 980-20 1 4 . . . . . . . . . . . . . . . . . . . . . . . . . . . . . . . . . . . . . . . . . . . . . . 1 3
Figure 4 Debt service in Nigeria from 1 980-20 1 4 ('billions) . . . . . . . . . . . . . . . . . . . . . . . . . . . . . . . . . . . 1 4
Table 1 Corruption Perception Index (CPI) of Nigeria from 1 996-20 1 4 . . . . . . . . . . . . . . . . . . . . . . 1 5
Table 2 Distribution of lnformal Manufacturing Enterprises in Nigeria, 1 998 . . . . . . . . . . . . . . . 22
Table 3 Granger Causality . . . . . . . . . . . . . . . . . . . . . . . . . . . . . . . . . . . . . . . . . . . . . . . . . . . . . . . . . . . . . . . . . . . . . . . . . . . . 24
Table 4 Skewness/Kurtosis tests for Normality . . . . . . . . . . . . . . . . . . . . . . . . . . . . . . . . . . . . . . . . . . . . . . . . . . . 30
Table 5 Summary Statistics . . . . . . . . . . . . . . . . . . . . . . . . . . . . . . . . . . . . . . . . . . . . . . . . . . . . . . . . . . . . . . . . . . . . . . . . . .49
Table 6 Regression Results . . . . . . . . . . . . . . . . . . . . . . . . . . . . . . . . . . . . . . . . . . . . . . . . . . . . . . . . . . . . . . . . . . . . . . . . . . . 3 1
Table 7 Robustness Check 1 . . . . . . . . . . . . . . . . . . . . . . . . . . . . . . . . . . . . . . . . . . . . . . . . . . . . . . . . . . . . . . . . . . . . . . . . . 37
Table 8 Robustness Check 2 . . . . . . . . . . . . . . . . . . . . . . . . . . . . . . . . . . . . . . . . . . . . . . . . . . . . . . . . . . . . . . . . . . . . . . . . . 39
Table 9 Robustness Check 3 . . . . . . . . . . . . . . . . . . . . . . . . . . . . . . . . . . . . . . . . . . . . . . . . . . . . . . . . . . . . . . . . . . . . . . . . . 4 1
Table 10 Water Regression Result 1 . . . . . . . . . . . . . . . . . . . . . . . . . . . . . . . . . . . . . . . . . . . . . . . . . . . . . . . . . . . . . . . . . 49
Table 1 1 Water Regression Result 2 . . . . . . . . . . . . . . . . . . . . . . . . . . . . . . . . . . . . . . . . . . . . . . . . . . . . . . . . . . . . . . . . . 50
1. Introduction
The informal sector is a prevalent and persistent economic feature of most
developing economies, contributing significantly to employment creation, production,
and income generation. Recent estimates of the size of the informal sector in developing
countries in terms of its share of employment range roughly between one-fifth and four
fifths. In terms of its contribution to GDP, the informal sector accounts for between 25%
and 40% of annual output in developing countries .
The International Labor Organization (ILO) was the first to employ the term
"informal sector" in its report on Kenya ( 1 972). The ILO ' s mission to Africa in 1 972
recognized that the traditional or informal sector had not just persisted but expanded.
The mission also observed that the informal sector activities, described as activities that
are unrecognized, unrecorded, unprotected, and unregulated by the public authorities,
were not confined to marginal activities but also included profitable enterprises in
manufacturing.
There are various reasons why governments may be concerned about large
informal sectors . These include potentially negative consequences for competitiveness
and growth, incomplete coverage of formal social programs, undermining social cohesion
and law and order, and fiscal losses due to undeclared economic activity . For most
governments, these concerns outweigh any advantages that the informal sector offers as a
source of j ob creation and as a safety net for the poor.
Lately, many African countries have experienced substantial economic growth but
this has not necessarily led to the creation of decent jobs. This is because most of the
labor force comprises of the informal sector. African Development Bank in 20 1 3 ,
1
reported that 55% of sub-Saharan Africa' s GDP and 80% of the labor force is informal
sector driven. Nine in ten rural dwellers have informal jobs as a means of support to earn
a living.
In Nigeria, the informal sector serves as a source of employment for the poor
because it provides employment in one form of economic activity or another. This sector
of the economy has helped in absorbing low level qualification holders and rural-urban
drift, population that is unable to secure wage employment in the modem sector.
The growth of the informal sector in Nigeria like in most African countries stems
from government failures and the hidden opportunities that become available when
governments fail . Although the informal sector is an avenue to create a reasonable source
of livelihood for the poor, it has challenges such as lack of income security and other
benefits that are inclusive in the formal employment framework.
Poverty remains endemic in Nigeria, despite the introduction of several anti
poverty programs by successive governments . According to statistics, the incidence of
poverty has significantly increased in Nigeria since 1 980 . The percentages of the
Nigerian population that were classified as 'extremely poor' over the last three decades
are as follows : 6 .2% ( 1 980); 1 2 . 1 % ( 1 985); 1 3 . 9% ( 1 992); 29 . 3% ( 1 996); 22 .0% (2004)
and 3 8 .7% (20 1 0) . These increases are strongest among the most vulnerable groups. In
20 1 2, for example, the National Bureau of Statistics (NBS) reported that the poverty
crisis in Nigeria varied by region, sector and gender, and impacted Nigerian youth,
children and mothers more than the adult male population.
2
Quite a number of studies have investigated the relationship between informal
sector and poverty. While the papers helped to reveal the presence of the informal sector
in the Nigerian economy, especially as a means of employment, no econometric model
was used and the direction of causality was not shown. Also, the suggested
recommendations were that the informal sector should be empowered which I believe is
not a good policy recommendation because if this sector is empowered it will further lead
to no tax revenue for the government and tax is important to any economy because this is
a major revenue source for any economy. Therefore, this paper will add to the literature
by addressing these issues .
This study is going to contribute to the literature by clearly defining the direction
of causality between poverty and the informal sector. Thereby, rightly examining the
relationship between poverty and the informal sector in Nigeria.
The broad objective of this work is to empirically investigate the relationship
between poverty and the informal sector in Nigeria. Towards this objective, this study
attempts to address three key questions :
sector?
1. What is the direction of causality between poverty and the informal
2 . Based upon the direction of causality established, what is the
impact of poverty on the informal sector, or vice-versa?
3 . In accordance with the results obtained, what are the implications
and possible solutions to the problems identified?
3
The rest of this work is organized around six sections. Section 2 includes a
comprehensive and critical review of the literature on this topic . Section 3 completes a
background analysis and an economic presentation of Nigeria along with its potentials
and the challenges it faces . Section 4 describes the methodology, while section 5
discusses the results, their implications and makes policy recommendations . At last,
section 6 concludes this work.
4
2. Literature review
The literature reviews existing literatures which deal with the relationship
between informal sector and poverty . This section exammes the concepts, existing
theories and various empirical findings covering both developing and developed
economies from various geographical areas across the globe .
The informal sector is an important part of the economy because the informal
sector has helped in reducing poverty by creating employment for the individuals who
cannot be employed in the formal sector. Kapunda & Moffat (20 1 4) in trying to examine
employment trends in the informal sector and poverty reduction in Botswana used
different surveys on the employment status in informal business households, informal
employment as a percentage of the labor force, across genders. It was shown that the
informal self-employment has been increasing in the last two decades and has helped in
generating employment, especially to children and youths which has in turn helped to
improve their welfare . Improvement in technical/vocational education is also encouraged.
Dhemba ( 1 999) was of the opinion that by adopting the informal sector, this will
help in the fight against poverty as advocated by developmentalists who are of the
opinion that economic growth is achieved through state intervention and adoption of
specific poverty alleviation measures as against the modernization theorist who support
the weakening of traditional institutions and cultural values and rapid industrialization in
achieving economic growth as in the case of Zimbabwe which has a high level of urban
poverty . Dhemba ( 1 999) believed that as long as there is mass urban poverty, there will
also be the presence of the informal sector. Therefore, in order to alleviate this poverty
5
policies relating to credit facilities and non-governmental mobilizations should be put in
place, urban management and training (Dhemba 1 999, Rogerson! 996).
A major determinant of the reduction in GDP in Argentina was poverty which
came into effect after the world wars . A major policy that was introduced to curb this was
the head of households plan and because the majority of the population could not find a
decent job, most of them turned to the informal sector (Millan-Smitmans 20 1 0) .
The informal sector is a major source of income, especially for the poor and helps
in the reduction of poverty and the improvement of labor productivity, especially in the
rural areas where agriculture is dominant, better education and health facilities is
encouraged (Tambunan 2004 & Nikopur & Shah Habibullah 20 1 0) .
Yuriy (20 1 3 ) focuses on Russia and examines the economic effects and social
consequences of the involvement of the poor in the informal sector in Russia. The author
used the income approach to calculate the labor income of the poor and the number of the
poor employed in the informal sector. It was suggested that the mostly under skilled poor
save very little or nothing and do not receive income from other sources. The author finds
out that the informal economy has not helped in decreasing poverty level in Russia, and a
way to minimize exploitation in this sector there should be laws that will protect the
workers in this sector but this might lead to a stifle in the growth and development of this
sector and also affect employment in this sector.
While unemployment is one of the major causes for the existence of the informal
economy, other contributing factors also include job market regulations, especially in
Spain, Greece and France, indirect taxes in Spain and Direct taxes in France, a high tax
6
burden, high inflation rates with respect to Turkey. Although the informal sector has its
advantages, of contributing to the eradication of poverty, the down side is that the jobs
provided by this sector are of low quality and of poor working conditions so therefore
does not have a lot of contribution to poverty reduction. The solution provided includes;
reduction of bureaucracy, structured tax system, improvement in public education
(Saglam 2007)
Poverty affects the informal sector in Nigeria because more than half of the
population is involved in one form of economic activity or the other and how this sector
can be empowered to reduce poverty and generate income. Iyoboyi (20 1 3 ) showed in his
work that the Nigerian economic landscape and the informal sector are littered with the
mosaic of poverty. The informal sector is an engine of growth. The majority of Nigerians
is engaged in it. The corollary of this is that there is an abysmal level of poverty in the
informal sector. Reducing the level of poverty in the informal sector is imperative as a
catalyst of growth and consequently on economic and social regeneration. Different
determinants were reviewed in alleviating poverty in the informal sector like ;
inaccessibility to finance, high operational cost, and intense global competition. The
recommendations made were improvement in power supply, skill improvement, more
access to funds, women development, policies that directly affect the sector.
The informal sector promotes employment in Nigeria. In explaining this
(Akinwale, 20 1 2) used the social capital theory which explains the cooperation among
individuals and groups in a society. Secondary and primary data were used, primary data
from trainees, masters and journeymen from tailoring and carpentry workshops were
collected through a structured questionnaire . The paper showed the importance of the
7
informal sector in providing employment to individuals in poverty, unemployed and
those with little or no education. Employment generation can be sustained with external
stakeholders like colleagues, masters, relatives which explains the social theory. The
paper goes to show that the informal sector promotes entrepreneurship, which could help
to drive the economy.
According to Abubakar (2002), poverty is always associated with unemployment
and together they produce in all material respects, the same unpleasant socioeconomic
and political repercussions . There exist a political, economic, social , health, and
psychological effects of poverty and unemployment. Poverty and unemployment destroy
aspirations, hope, happiness, self-esteem and sense of personal competence. Abubakar
further added that poverty, produces social, political religious, ethnic violence, the rise in
anti-behavior.
Siyanbola (2005) states that the debt service obligations and poverty are
positively related. A country with a huge debt burden like Nigeria, would find it difficult
to utilize available resources for projects that benefit the poor. Tomori & Adebiyi (2002),
demonstrated that the increases in government expenditure on debt service obligations
tend to adversely affect development from the distribution perspective, as the poor are
likely to receive the short end of the stick in expenditure reduction measures .
The governance model (also known as the political model) contends that
corruption affects poverty in the sense that corruption reduces governance capacity
(Kaufmann et al , 1 999) . Corruption has been attributed as one of the causes of poverty
and unemployment in Nigeria. For instance, the amount of money that ought to be
plugged into the productive sectors of the economy, strengthen the health sector, social
8
and educational services are diverted into private pockets of only but a few individuals
not minding that a maj ority of Nigerians are out of it, amongst other means like
investments directed at white elephant's projects (Abubakar 2002).
9
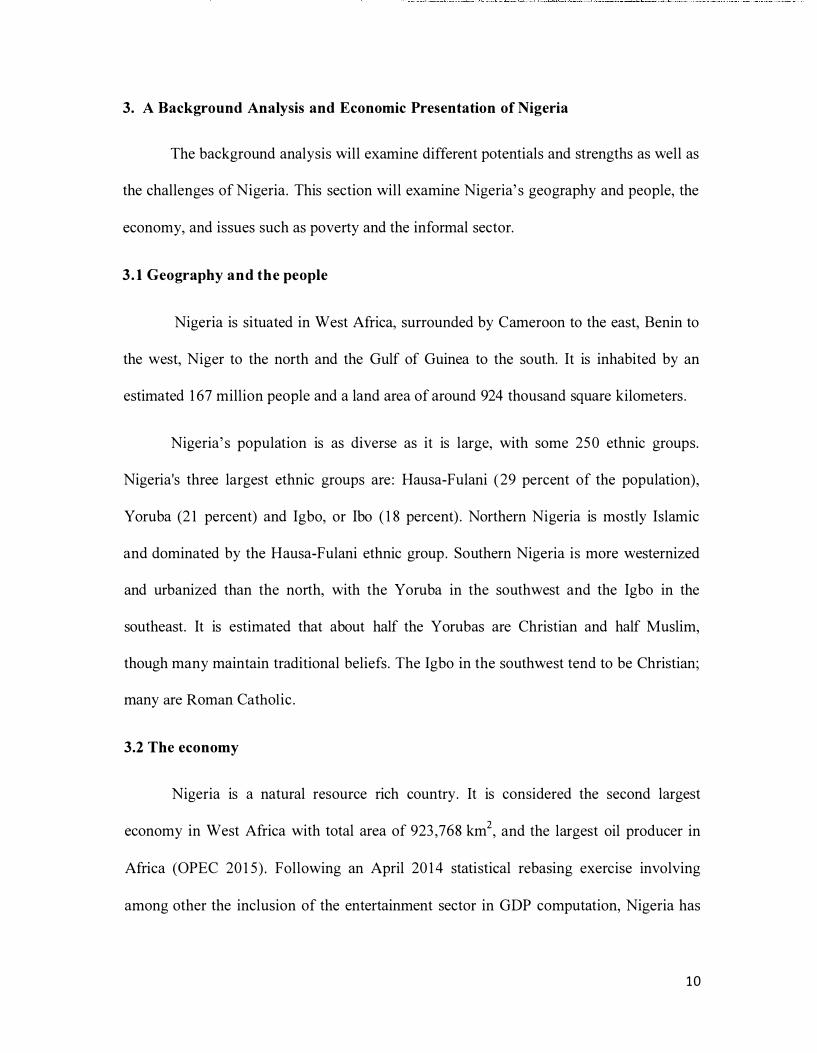
3. A Background Analysis and Economic Presentation of Nigeria
The background analysis will examine different potentials and strengths as well as
the challenges of Nigeria. This section will examine Nigeria's geography and people, the
economy, and issues such as poverty and the informal sector.
3.1 Geography and the people
Nigeria is situated in West Africa, surrounded by Cameroon to the east, Benin to
the west, Niger to the north and the Gulf of Guinea to the south. It is inhabited by an
estimated 1 67 million people and a land area of around 924 thousand square kilometers .
Nigeria's population is as diverse as it is large, with some 250 ethnic groups.
Nigeria's three largest ethnic groups are : Hausa-Fulani (29 percent of the population),
Yoruba (2 1 percent) and Igbo, or Ibo ( 1 8 percent) . Northern Nigeria is mostly Islamic
and dominated by the Hausa-Fulani ethnic group . Southern Nigeria is more westernized
and urbanized than the north, with the Yoruba in the southwest and the Igbo in the
southeast. It is estimated that about half the Y orubas are Christian and half Muslim,
though many maintain traditional beliefs . The Igbo in the southwest tend to be Christian;
many are Roman Catholic .
3.2 The economy
Nigeria is a natural resource rich country. It is considered the second largest
economy in West Africa with total area of 923 ,768 km2, and the largest oil producer in
Africa (OPEC 20 1 5). Following an April 20 1 4 statistical rebasing exercise involving
among other the inclusion of the entertainment sector in GDP computation, Nigeria has
10
emerged as Africa's largest economy by population and the 22nd largest economy in the
world.
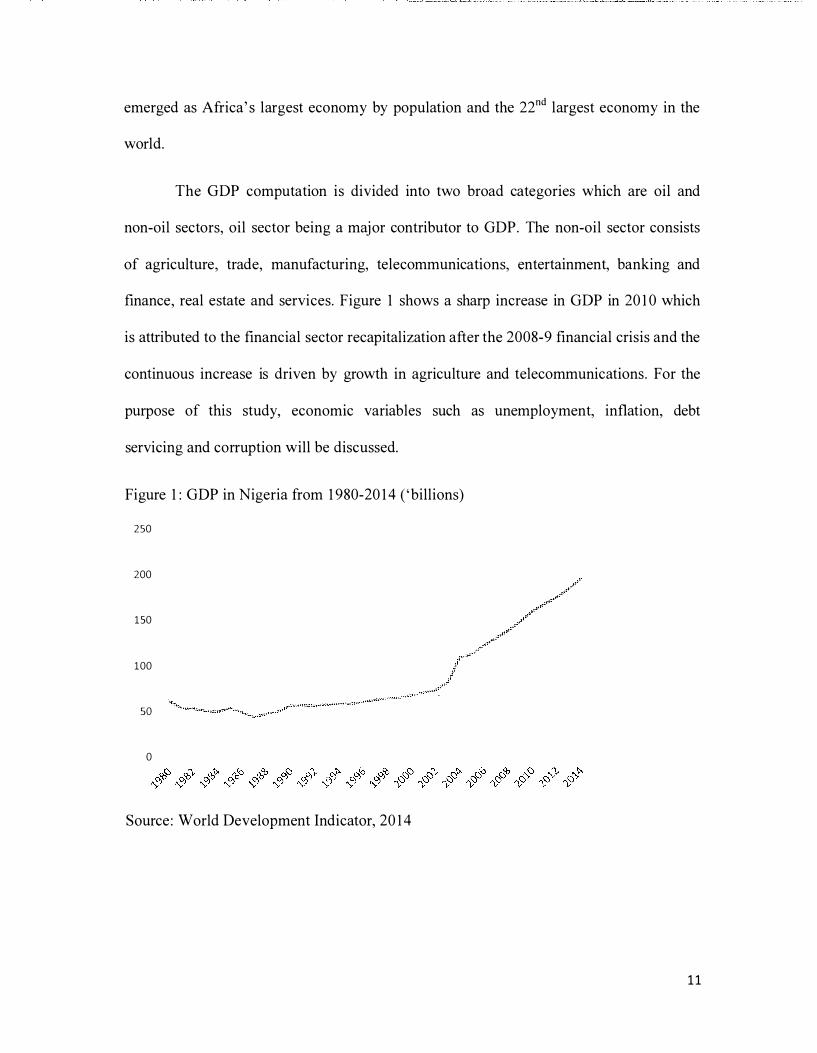
The GDP computation is divided into two broad categories which are oil and
non-oil sectors, oil sector being a major contributor to GDP. The non-oil sector consists
of agriculture, trade, manufacturing, telecommunications, entertainment, banking and
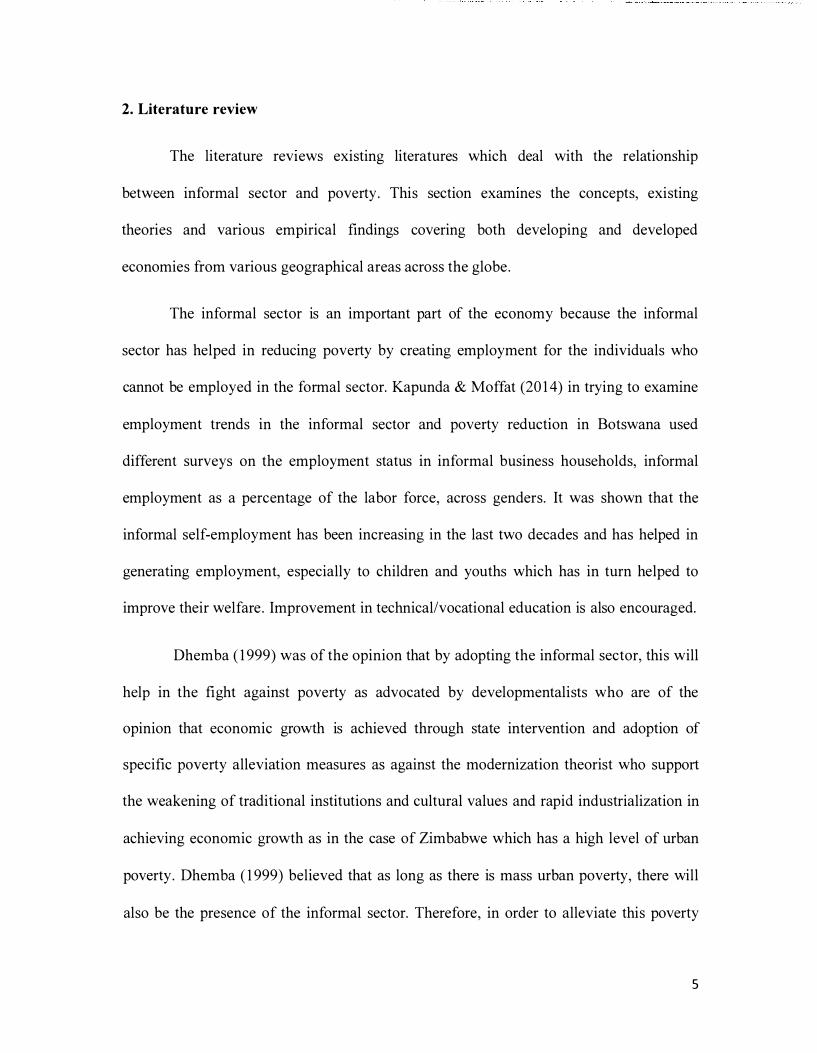
finance, real estate and services. Figure 1 shows a sharp increase in GDP in 20 1 0 which
is attributed to the financial sector recapitalization after the 2008-9 financial crisis and the
continuous increase is driven by growth in agriculture and telecommunications . For the
purpose of this study, economic variables such as unemployment, inflation, debt
servicing and corruption will be discussed.
Figure 1 : GDP in Nigeria from 1 980-20 1 4 ('billions)
250
200
150
100
so
0
Source : World Development Indicator, 20 1 4
11
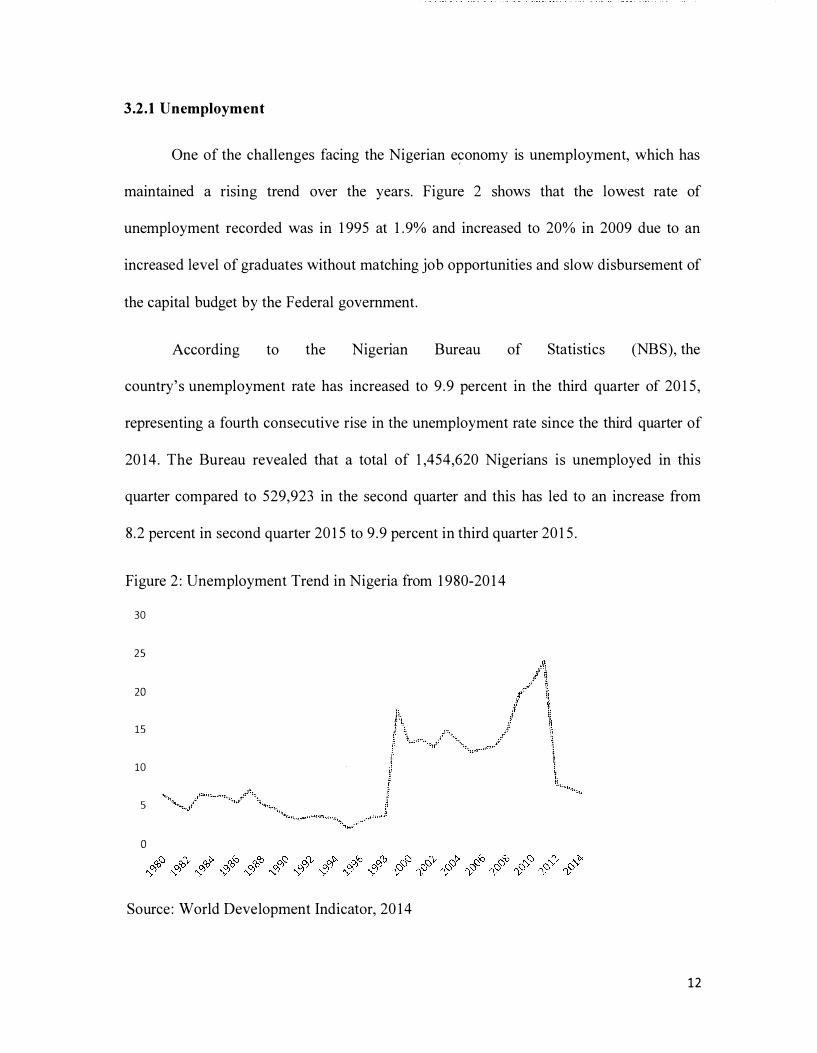
3.2.1 Unemployment
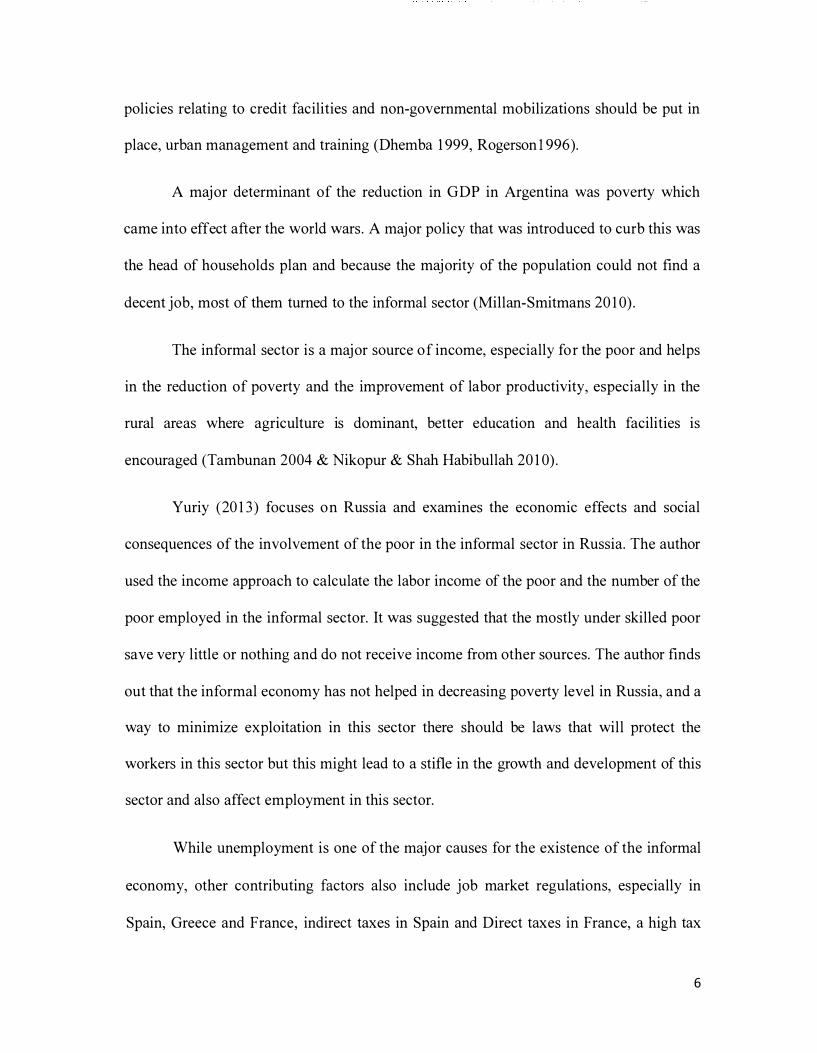
One of the challenges facing the Nigerian e�onomy is unemployment, which has
maintained a rising trend over the years. Figure 2 shows that the lowest rate of
unemployment recorded was in 1 995 at 1 . 9% and increased to 20% in 2009 due to an
increased level of graduates without matching job opportunities and slow disbursement of
the capital budget by the Federal government.
According to the Nigerian Bureau of Statistics (NBS), the
country's unemployment rate has increased to 9 .9 percent in the third quarter of 20 1 5,
representing a fourth consecutive rise in the unemployment rate since the third quarter of
20 1 4 . The Bureau revealed that a total of 1 ,454,620 Nigerians is unemployed in this
quarter compared to 529,923 in the second quarter and this has led to an increase from
8 .2 percent in second quarter 20 1 5 to 9 .9 percent in third quarter 20 1 5.
Figure 2 : Unemployment Trend in Nigeria from 1 980-20 1 4
30
25
20
15
10
5
0
Source: World Development Indicator, 20 1 4
12
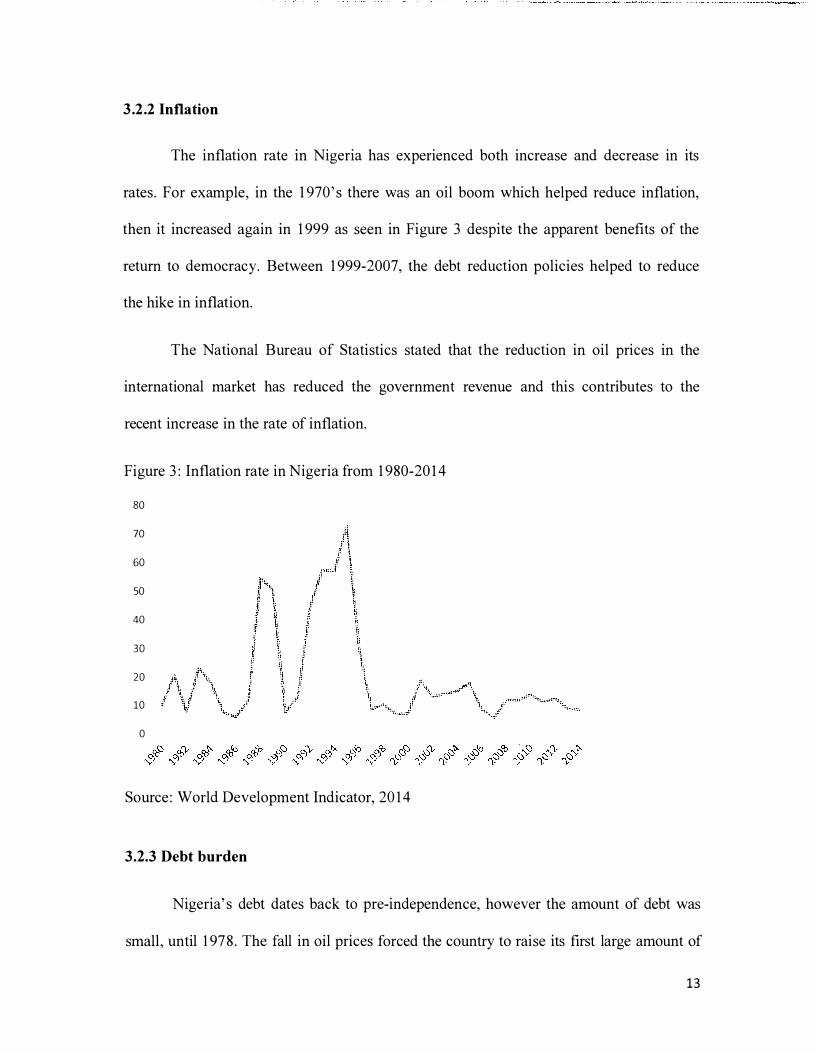
3.2.2 Inflation
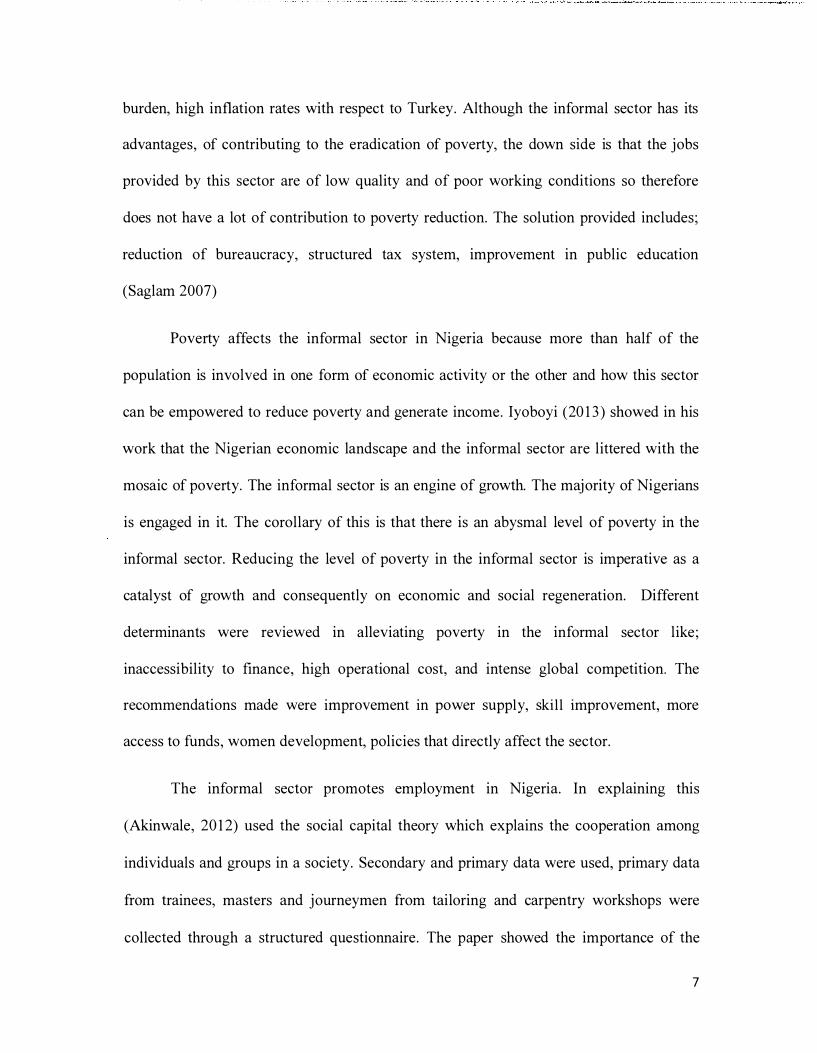
The inflation rate in Nigeria has experienced both increase and decrease in its
rates . For example, in the l 970's there was an oil boom which helped reduce inflation,
then it increased again in 1 999 as seen in Figure 3 despite the apparent benefits of the
return to democracy. Between 1 999-2007, the debt reduction policies helped to reduce
the hike in inflation.
The National Bureau of Statistics stated that the reduction in oil prices in the
international market has reduced the government revenue and this contributes to the
recent increase in the rate of inflation.
Figure 3 : Inflation rate in Nigeria from 1 980-20 1 4
80
70
60
50
40
30
20
10
0
Source : World Development Indicator, 20 1 4
3.2.3 Debt burden
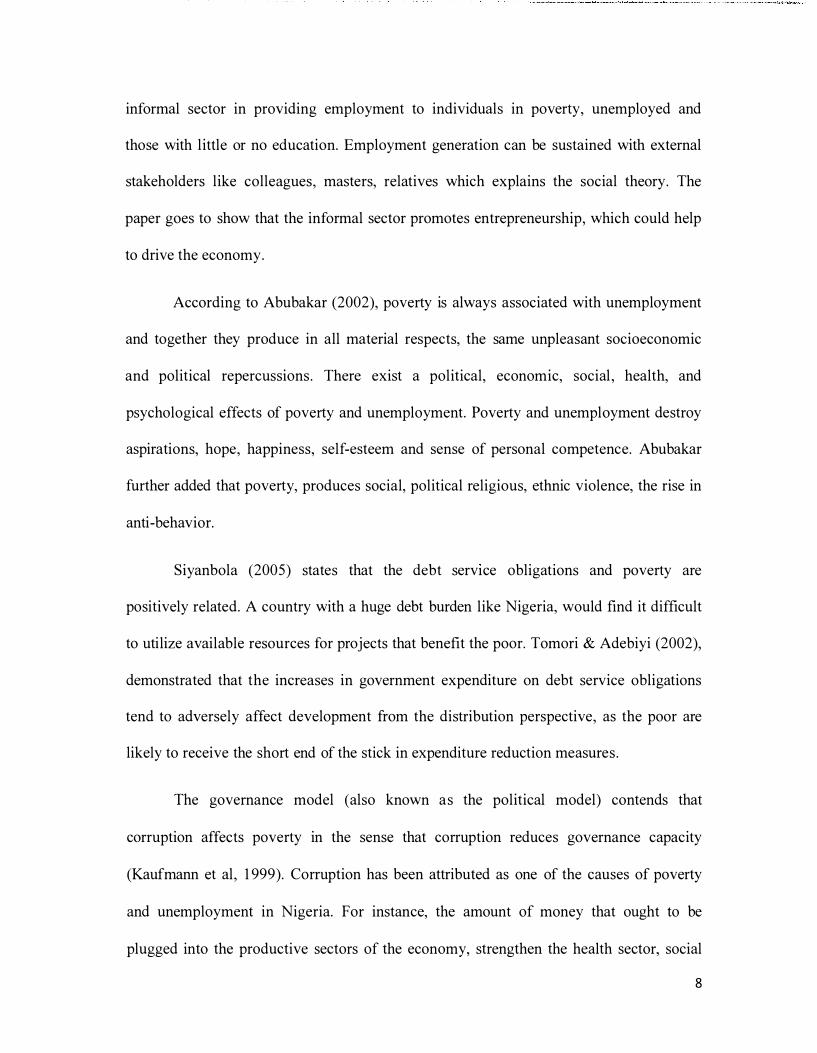
Nigeria's debt dates back to pre-independence, however the amount of debt was
small , until 1 978 . The fall in oil prices forced the country to raise its first large amount of
13
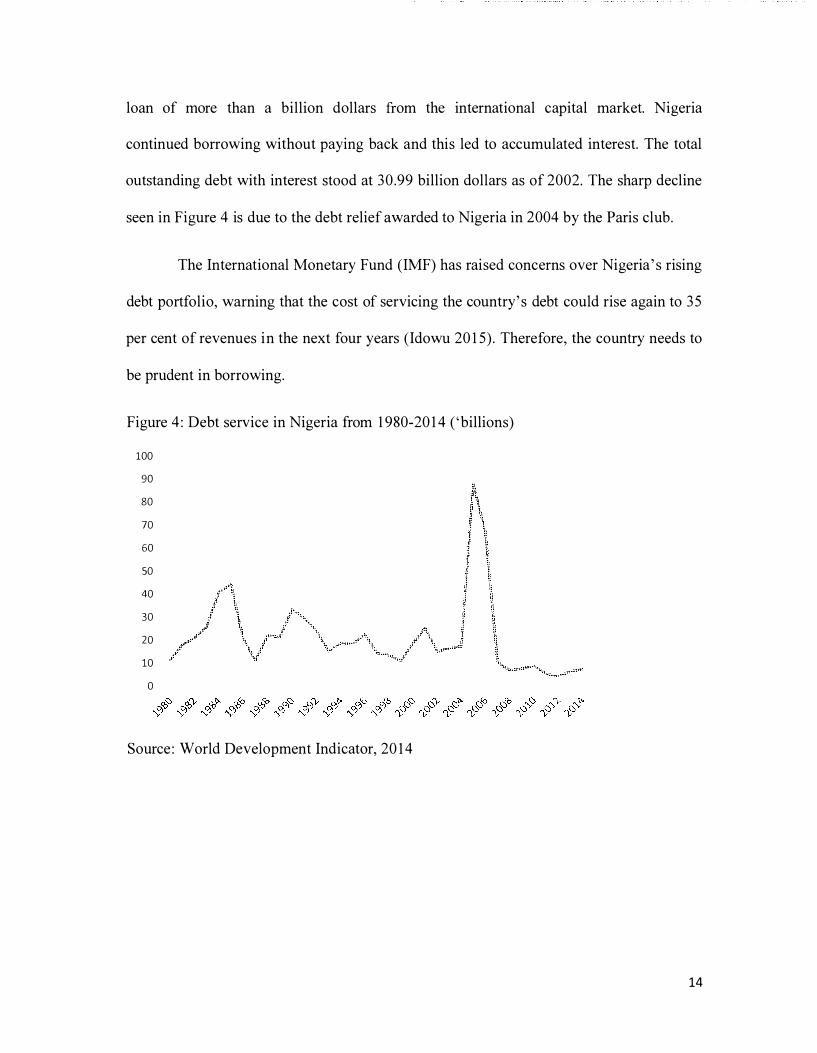
loan of more than a billion dollars from the international capital market. Nigeria
continued borrowing without paying back and this led to accumulated interest. The total
outstanding debt with interest stood at 30 .99 billion dollars as of 2002. The sharp decline
seen in Figure 4 is due to the debt relief awarded to Nigeria in 2004 by the Paris club.
The International Monetary Fund (IMF) has raised concerns over Nigeria's rising
debt portfolio, warning that the cost of servicing the country's debt could rise again to 35
per cent of revenues in the next four years (Idowu 20 1 5) . Therefore, the country needs to
be prudent in borrowing.
Figure 4 : Debt service in Nigeria from 1 980-20 1 4 ('billions)
100
90
80
70
60
50
40
30
20
10
0
Source : World Development Indicator, 20 1 4
14
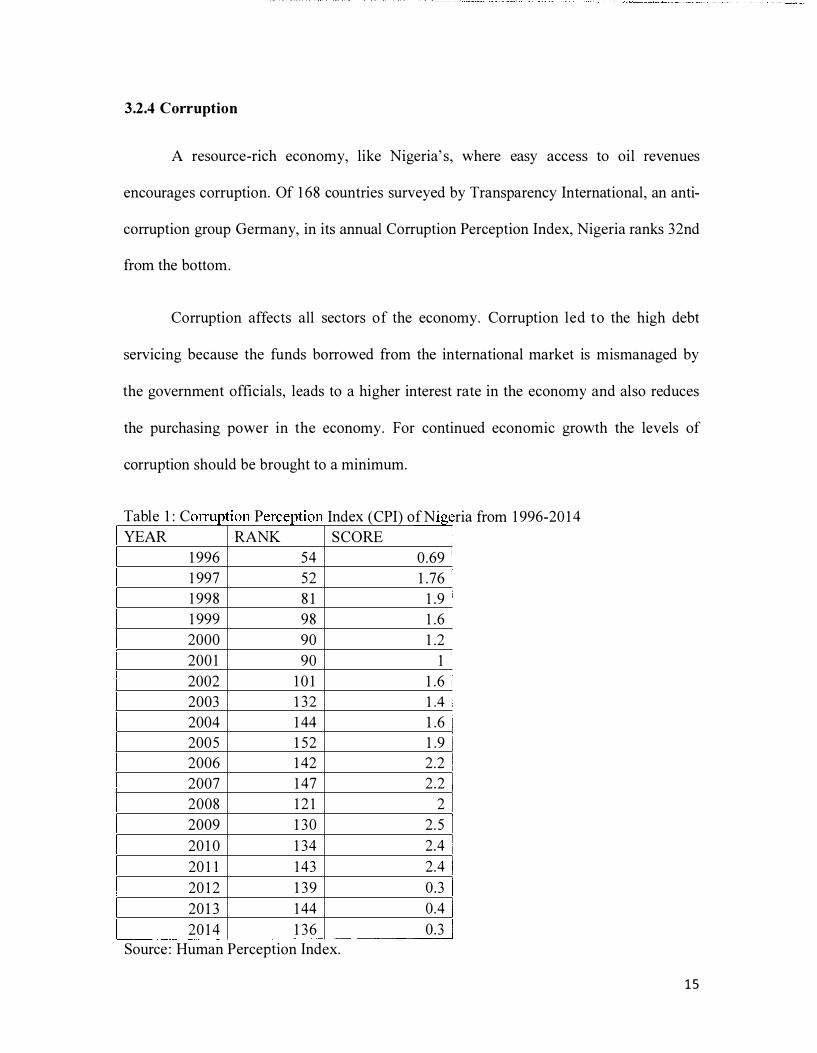
3.2.4 Corruption
A resource-rich economy, like Nigeria's, where easy access to oil revenues
encourages corruption. Of 1 68 countries surveyed by Transparency International, an anti-
corruption group Germany, in its annual Corruption Perception Index, Nigeria ranks 32nd
from the bottom.
Corruption affects all sectors of the economy. Corruption led to the high debt
servicing because the funds borrowed from the international market is mismanaged by
the government officials, leads to a higher interest rate in the economy and also reduces
the purchasing power in the economy. For continued economic growth the levels of
corruption should be brought to a minimum.
T bl 1 C a e : p I d (CPI) fN' ria from 1 996-20 1 4 orrupt10n ercept1on n ex 0 1ge YEAR RANK SCORE
1 996 54 0 .69 1 997 52 1 .76 1 998 8 1 1 .9 1 999 98 1 .6 2000 90 1 .2 200 1 90 1 2002 1 0 1 1 . 6 2003 13 2 1.4
2004 1 44 1 .6 2005 1 52 1 .9 2006 1 42 2 .2 2007 1 47 2 .2 2008 1 2 1 2 2009 1 30 2 .5 20 1 0 1 34 2 .4 20 1 1 1 43 2 .4 20 1 2 1 39 0 . 3 20 1 3 1 44 0 .4 20 1 4 1 36 0 .3
Source : Human Perception Index.
15
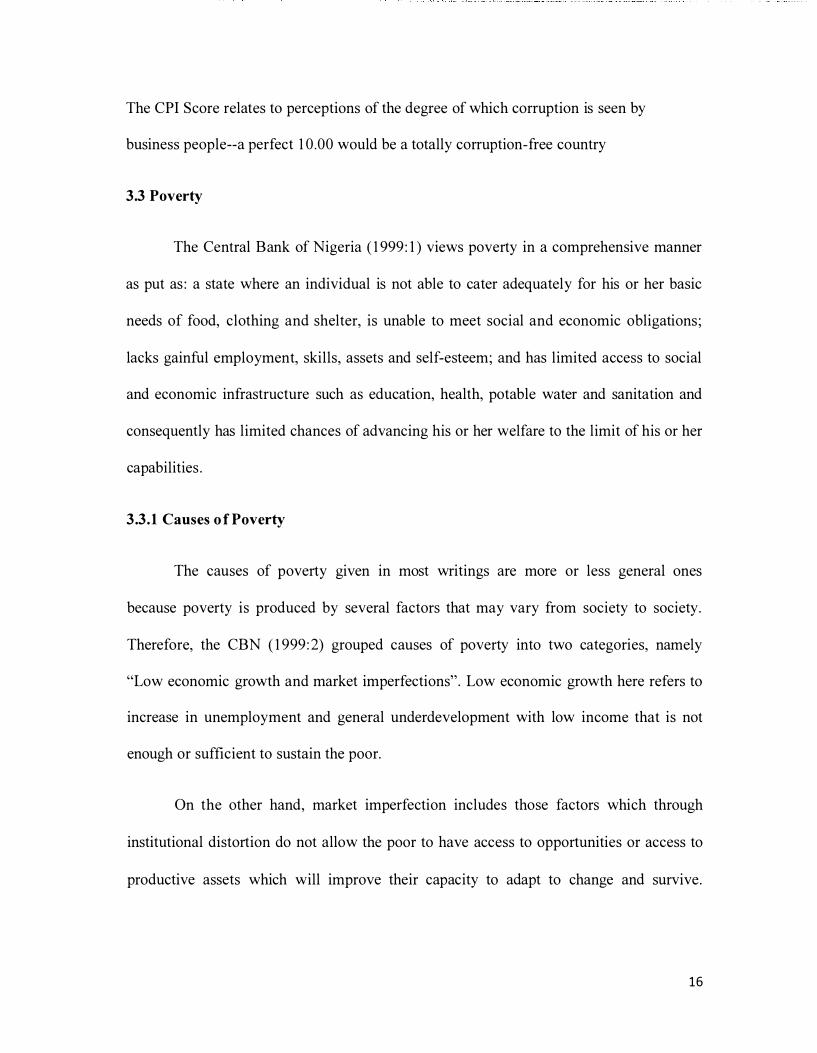
The CPI Score relates to perceptions of the degree of which corruption is seen by
business people--a perfect 1 0 .00 would be a totally corruption-free country
3.3 Poverty
The Central Bank of Nigeria ( 1 999 : 1 ) views poverty in a comprehensive manner
as put as : a state where an individual is not able to cater adequately for his or her basic
needs of food, clothing and shelter, is unable to meet social and economic obligations ;
lacks gainful employment, skills, assets and self-esteem; and has limited access to social
and economic infrastructure such as education, health, potable water and sanitation and
consequently has limited chances of advancing his or her welfare to the limit of his or her
capabilities .
3.3.l Causes of Poverty
The causes of poverty given in most writings are more or less general ones
because poverty is produced by several factors that may vary from society to society.
Therefore, the CBN ( 1 999:2) grouped causes of poverty into two categories, namely
"Low economic growth and market imperfections" . Low economic growth here refers to
increase in unemployment and general underdevelopment with low income that is not
enough or sufficient to sustain the poor.
On the other hand, market imperfection includes those factors which through
institutional distortion do not allow the poor to have access to opportunities or access to
productive assets which will improve their capacity to adapt to change and survive .
16
Therefore, this inability to adapt breeds poverty and this denied the victims the most
basic needs for survival .
3.3.2 Review of Poverty Reduction Programs in Nigeria
Aware of the grave consequence of poverty in the country, successive Nigerian
governments have designed and implemented numerous policies since the 1 980's to
tackle this scourge. Some of these programs include, among others, the Green Revolution
(GR), Directorate of Food, Road and Rural Infrastructure (DFRRI), National Directorate
of Employment (NDE), Better Life Program (BLF), Peoples Bank of Nigeria (PBN),
Community Bank (CB), Family Support Program (FSP), Family Economic Advancement
Program (FEAP), Poverty Alleviation Program (PAP), and National Poverty Eradication
Program (NAPEP) . A select few are briefly reviewed below because they were effective:
a. The Green Revolution
The Green Revolution was formally launched in Nigeria in 1 980 by the then
Federal Government. The major objective of the program was to modernize the
agricultural sector of the economy, especially in achieving self-sufficiency in food
production Oyeranti (2005) . The implementation strategy of the program sought to
achieve its objectives through total mobilization of plant, animal resources within a
food policy for Nigeria.
b. Directorate of Food, Road and Rural Infrastructure
The Directorate of Food, Roads and Rural Infrastructure was a rural
development strategy by the then president Babangida to complement the efforts of
17
the past, Green Revolution, especially in the rural areas where the majority of
Nigerians lives. The DFRRI was established with the aim of rehabilitating various
categories of roads in the country and especially for the development of rural feeder
roads in order to strengthen the massive efforts of food and agricultural self
sufficiency in the shortest possible period.
c. National Directorate of Employment
The Federal Government approved the establishment of the National
Directorate of Employment (NDE) on 26th March, 1 986 but its programs were
launched nationwide in January 1 987 . The major objectives of the program are : to
design an employment program to combat mass unemployment, to articulate policies
that would help develop work programs aimed at promoting skil l acquisition, self
employment and labor intensive potentials and also collect and maintain a data bank
on unemployment and vacancies in the country .
d. Better Life Program (BLP)-Family Economic Advancement Program
The Better Life Program came into being in September 1 986, to stimulate
women in rural areas towards achieving a better and a higher standard of living. It
helped to raise the social consciousness of women about their right and roles, as well
as their social, political and economic responsibilities. The program initiator was the
wife of the then Head of State of Nigeria Mrs . Maryam Babangida and was generally
aimed at complementing the then existing Federal Government policy to develop the
rural areas .
18
e. National Poverty Eradication Program
The National Poverty Eradication Program (NAPEP) was launched by President
Olusegun Obasanj o in January 200 1 . The National Poverty Eradication Program
(NAPEP) is a program designed to eradicate poverty in Nigeria through a number of
strategies . The major strategy of the National Poverty Eradication Program (NAPEP) is
the Youth Employment Scheme (YES) . This also has other sub-strategies, which includes
the Capacity Acquisition Program (CAP) and the Mandatory Attachment Program
(MAP). All these strategies are essentially designed to help the teeming population of
unemployed youths in Nigeria to acquire some useful skills, which could help them to
become self-reliant.
3.3.3. Problems and Challenges of Poverty Reduction Efforts
According to U goh and Ukpere (2009), corruption has bedeviled vanous
antipoverty programs of government and the manifestations and problems associated with
corruption in Nigeria have various dimensions . These corrupt practices include project
substitution, misrepresentation of project finances, diversion of resources, and conversion
of public funds to private uses among many others .
One other significant weakness in the policies and programs of poverty reduction
in Nigeria is the failure to effectively target the poor as well as focusing on specific target
community, and their specific poverty related problems in addressing them. To
effectively reduce poverty, focusing on the poor could have come as targeting. This is not
the case because the roles of the poor in Nigeria and their communities in poverty
reduction have not been fully appreciated by the implements of the program. Hence, the
19
reason why, despite the different policies that have been introduced, there is still a high
incidence of poverty.
In addition, the nature and pattern of authority allocation or relationship within
the local government for instance affects the policy implementation. In the present
dispensation where there is no convincing and clear-cut line of duty, cold war, is fought
silently between the heads of department and the supervisors, special assistant and
political advisers who jostle for one political favor or the other from the chairman.
Conflict usually arises among them over who supervises such policy/program. All these
can frustrate a policy or program implementation.
3.4. The Informal Sector
A CBN/NISER collaborative workshop in 200 1 defines the informal sector as that
which operates without binding official regulations, as well as one who operates under
official regulations that do not compel rendition of official returns on its operations or
production process .
The workshop asserts that in general terms, an informal sector activity consists of
enterprises which renders no account to any statutory bodies. Such enterprises comprise
a heterogeneous set of activities . Characteristically, the activities cover almost every
field of economic activity, ranging from petty trading and personal services to informal
construction, transport, money lending, manufacturing, and repairs . The operators are
generally of low level of education, risk takers, and accommodating.
20
3.5. Size and Composition of the Informal Sector in Nigeria
Generally, the global economic crisis of the past decades has been noted as the
cause of enlargement of the informal sector in almost all developing countries including
Nigeria. Estimates of the size of the informal sector in these countries appear to vary
with fuzziness of the informal concept and across countries, but representative
contributors place almost half of the urban workforce in developing countries in the
informal sector. Leidholm and Mead ( 1 987) for example, observed that 35 percent of
manufacturing employment in Jamaica takes place in firms with fewer than 1 0 employees
in the informal sector, while this figure is 90 percent for Sierra Leone. A survey carried
out by the Central Bank of Nigeria (CBN), in collaboration with the Nigerian Institute of
Social and Economic Research (NISER) and the Federal Office of Statistics (FOS) in
1 998 , put this figure at about 83 percent.
The composition of the informal sector in Nigeria is basically of two categories :
informal manufacturing and non-manufacturing activities. The composition of non
manufacturing informal sector is as listed above . In table 2 , the composition of the
informal manufacturing sector in Nigeria is presented. According to the table, the
dominant manufacturing activity in Nigeria is in food, beverages, and tobacco . This
comprises of about 69 percent of all informal manufacturing activities . Other
components of the informal manufacturing sector are : textile, 1 1 .2 percent; wood
products, 8 . 8 percent; paper products, 0.6 percent; chemicals and petroleum products, 0 .5
percent; non-metallic mineral products, 0 . 8 percent; basic metal product, 1 .6 percent;
fabricated metal products, machinery and equipment, 2 .2 percent.
21
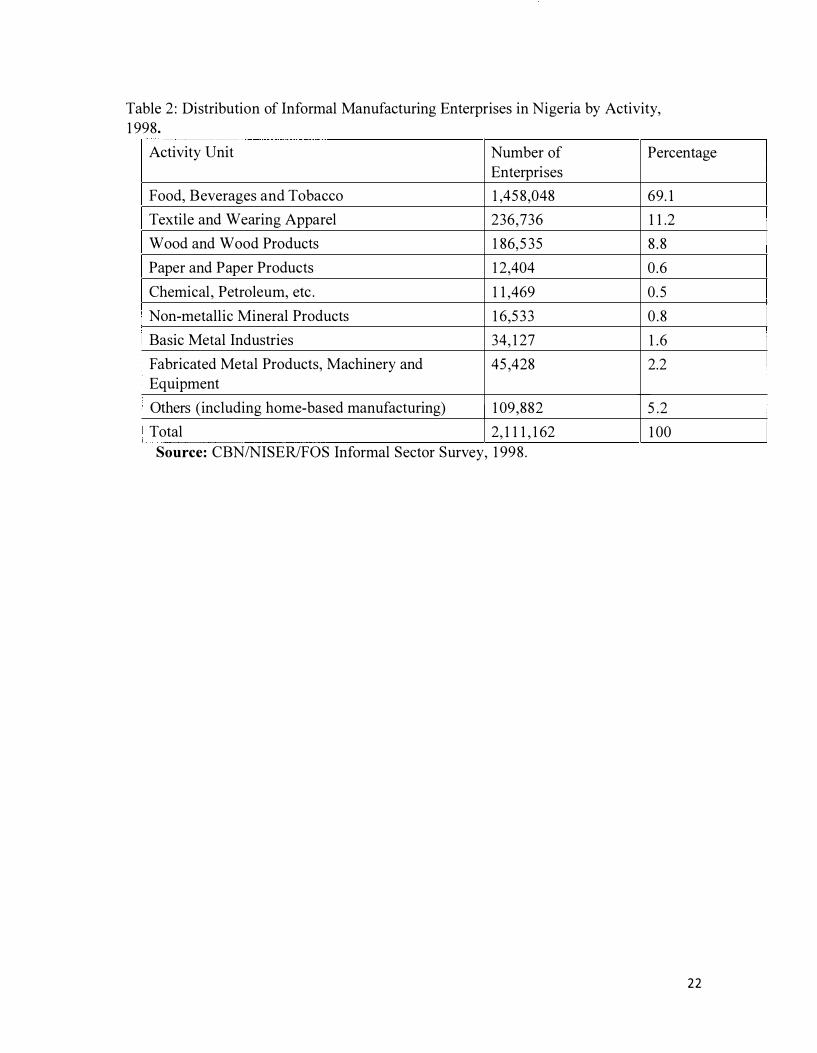
Table 2 : Distribution of Informal Manufacturing Enterprises in Nigeria by Activity, 1 998.
Activity Unit Number of Percentage Enterprises
Food, Beverages and Tobacco 1 ,458 ,048 69 . l Textile and Wearing Apparel 236 ,736 1 1 .2 Wood and Wood Products 1 86,535 8 . 8 Paper and Paper Products 1 2 ,404 0 .6 Chemical , Petroleum, etc . 1 1 ,469 0 .5 Non-metallic Mineral Products 1 6 ,533 0 . 8 Basic Metal Industries 34, 1 27 1 . 6 Fabricated Metal Products, Machinery and 45,428 2.2 Equipment Others (including home-based manufacturing) 1 09 ,882 5 .2 Total 2 , 1 1 1 , 1 62 1 00 Source: CBN/NISER/FOS Informal Sector Survey, 1 998 .
22
4. Methodology and Data
4.1 Methodology
This section includes, first, the granger causality test to determine the direction of
causality. The next step is about the model building. Lastly, the robustness checks to
ensure that the results are not spurious .
4.1.1 Granger Causality Test
This study utilizes Granger causality tests in investigating the causal relationship
between poverty and the informal sector (Granger & Newbold 1 974) . A variable x is said
to Granger-cause a variable y if, given the past values of y, past values of x are useful for
predicting y .
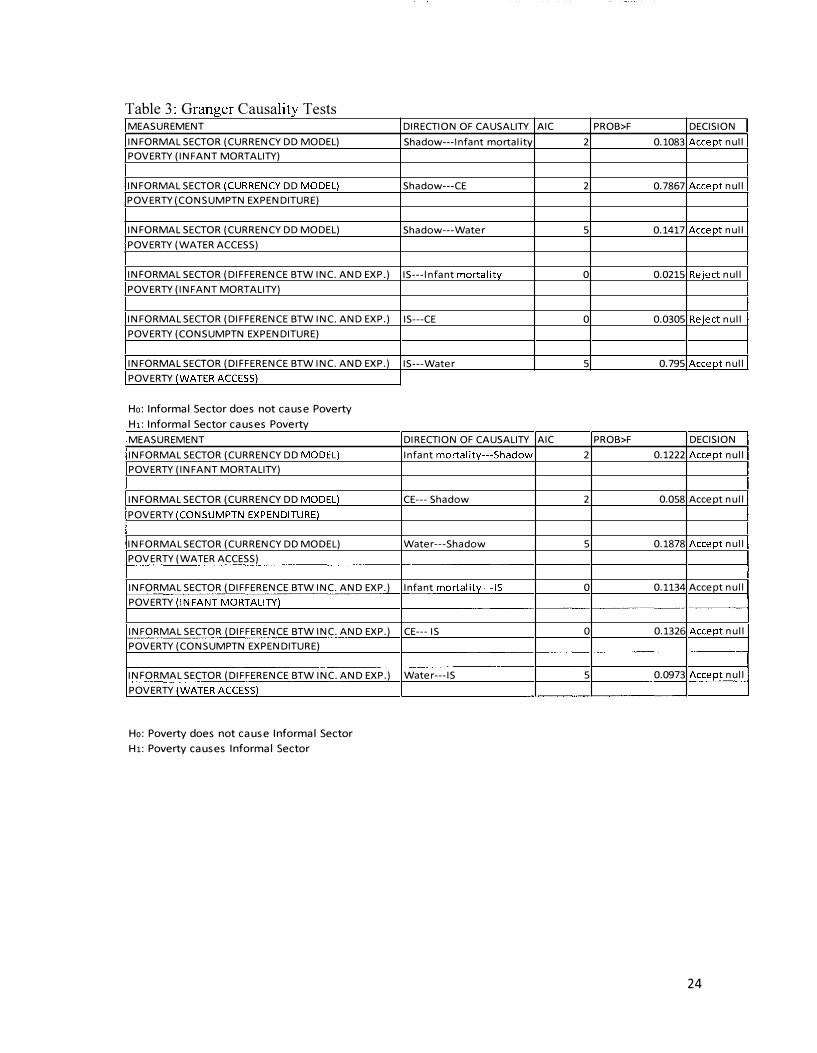
Firstly, this study tests for Granger causality by regressing poverty on its own
lagged values and on lagged values of the informal sector. Thereafter, test the null
hypothesis that the estimated coefficients on the lagged values of poverty are jointly zero .
Failure to rej ect the null hypothesis is equivalent to failing to rej ect the hypothesis that
poverty does not Granger-cause informal sector.
Furthermore, the informal sector is regressed on its own lagged values and on
lagged values of poverty. Thereafter, test the null hypothesis that the estimated
coefficients on the lagged values of the informal sector are jointly zero . Failure to reject
the null hypothesis is equivalent to failing to reject the hypothesis that informal sector
does not Granger-cause poverty. The result of all the measurements of the informal sector
and poverty is reported in Table 3 . The result shows that the informal sector causes
poverty. This helped in developing the models .
23
T bl 3 G a e ranger c rt T t ausa 1 :y es s MEASUREMENT
INFORMAL SECTOR (CURRENCY DD MODEL}
POVERTY {INFANT MORTALITY)
INFORMAL SECTOR (CURRENCY DD MODEL}
POVERTY (CONSUMPTN EXPENDITURE)
INFORMAL SECTOR (CURRENCY DD MODEL)
POVERTY (WATER ACCESS)
INFORMAL SECTOR (DIFFERENCE BTW INC. AND EXP.)
POVERTY (INFANT MORTALITY)
INFORMAL SECTOR (DIFFERENCE BTW INC. AND EXP.)
POVERTY (CONSUMPTN EXPENDITURE)
INFORMAL SECTOR (DIFFERENCE BTW INC. AND EXP.)
POVERTY (WATER ACCESS}
Ho: Informal Sector does not cause Poverty H1: Informal Sector causes Poverty MEASUREMENT
INFORMAL SECTOR (CURRENCY DD MODEL}
POVERTY {INFANT MORTALITY)
INFORMAL SECTOR (CURRENCY DD MODEL}
POVERTY (CONSUMPTN EXPENDITURE}
INFORMAL SECTOR (CURRENCY DD MODEL)
POVERTY (WATER ACCESS)
INFORMAL SECTOR (DIFFERENCE BTW INC. AND EXP.)
POVERTY (INFANT MORTALITY)
INFORMAL SECTOR (DIFFERENCE BTW INC. AND EXP.)
POVERTY (CONSUMPTN EXPENDITURE)
INFORMAL SECTOR (DIFFERENCE BTW INC. AND EXP.)
POVERTY (WATER ACCESS)
Ho: Poverty does not cause Informal Sector Hi: Poverty causes Informal Sector
DIRECTION OF CAUSALITY AIC PROB>F DECISION
Shadow---lnfant mortality 2 0.1083 Accept null
Shadow---CE 2 0.7867 Accept null
Shadow---Water s 0.1417 Accept null
IS---lnfant mortality 0 0.021S Reject null
IS---CE 0 0.0305 Reject null
IS---Water s 0.795 Accept null
DIRECTION OF CAUSALITY AIC PROB>F DECISION
Infant mortality---Shadow 2 0.1222 Accept null
CE--- Shadow 2 0.058 Accept null
Wate r---Shadow 5 0.1878 Accept null
Infant mortality---IS 0 0.1134 Accept null
CE--- IS 0 0.1326 Accept null
Water---IS 5 0.0973 Accept null
24
4.1.2 The model
Based on economic theory and previous work in the literature, the baseline model
(Model 1 ) in this study holds that poverty (POV) in Nigeria is a function of three main
determinants, namely, the informal sector (IS), debt service (DS) and unemployment
(UNEMP.) . That is ,
POV= f (IS , DS, UNEMP) ( 1 )
Where the function f () captures the relationship between the dependent variable
POV, and the independent variables IS, DS and UNEMP.
The formulation of equation ( 1 ) follows in the footsteps of many scholars who
have thoroughly investigated the concept of poverty.
This study incorporates proxies of poverty due to the lack of data directly
measuring poverty. These are infant mortality and consumption expenditure per capita.
Nigeria' s infant mortality rate has been estimated to be currently 99 per 1 000 births,
which shows that Nigeria has the thirteenth highest infant mortality rate in the world
(CIA 2009) . The infant mortality of children under the age of 5 was 1 1 2 per 1 000 births
in 20 1 4. The reason for this high mortality rate is mostly due to mothers, not having
enough money to take care of their children. Many children in Nigeria die as a result of
malaria, diarrhea, tetanus and similar diseases . These diseases are preventable and
curable, but because of poor health care facilities and lack of money far too many
children die off from them. All these are the features of poverty (Okungbowa 20 1 1 ) .
Another Poverty indicator employed is real consumption expenditure per capita
following previous studies by Ogun (20 1 0) and Okoj ie (2002) . The. two studies employed
real consumption expenditure as an alternative to per capita income on the basis of
25
consensus in the literature that an expenditure measure of poverty is superior to income
measures .
The size of the informal sector is measured using the currency demand method.
This is based on the work of Cagan ( 1 958), who estimated the determinants of the ratio of
currency to ' 'broad money' ' (or M2) for the United States . His estimates showed that the
key driving factors in the demand for currency were per-capita income, the interest rate,
and, importantly, the tax rate . The data for the currency demand method was derived
from (Ademola & Bekoe 20 1 2) .
Also, GDP income/expenditure discrepancies are used in measuring the size of
the informal sector (McAfee 1 980) . This is based on the assumption that the income
measure of GDP is supposed to be the same as the expenditure measure, some
economists have argued that any discrepancy between the two measures, specifically if
income GDP is larger than expenditure GDP, indicates the existence of a "hidden"
economy.
In several developing countries of the world, the debt burden is assuming an
increasing importance as a cause of poverty. In such countries, servicing of the debt has
infringed on the magnitude of resources needed for socioeconomic development Tomori
& Adebiyi (2002) . The productive sector such as agriculture, manufacturing etc . is
equally constrained, leading to low productivity, low capacity utilization, under
employment and low purchasing power thereby subjecting the masses of the people in
abject poverty. In Nigeria, at the end of December 2000 external debt stood at US$28 . 5
(about 80% of GDP), though, a debt pardon deal was brokered between Nigeria and her
creditors (Paris Club) during the Obasanjo ' s regime, by 20 1 1 debt portfolio was projected
26
to represent 1 2% of GDP . The amount required to service this debt annually is enough to
hamper government expenditure for the provision of social and physical infrastructure for
the poor (Olowa 20 1 2) . Therefore, a positive sign is expected.
Unemployment is a contributing factor to poverty in Nigeria. There is a strong
relationship between unemployment and poverty Abubakar (2002). When people are
unemployed, their source of livelihood depletes over time. The cost of living increases
and the standard of living begins to decline . The formal unemployment rate in Nigeria as
estimated by the World Bank in 2007 was 4. 9 percent and Nigeria ranked 6 1 st across the
worlds countries . A positive sign is expected.
In order to provide a comprehensive understanding of poverty in Nigeria, three
additional variants of the baseline model are introduced. These variants draw their
pertinence from the vast literature on poverty by identifying and including another set of
three major determinants- inflation (INF), rural population (RP) and corruption (CORR).
Indeed, this set has garnered attention among some researchers because of its perceived
relevance for developing countries, especially. Models 2, 3 and 4 are developed to
account for the aforementioned determinants :
Pov=f (IS , DS , UNEMP, RP)
Pov=f (IS , DS, UNEMP, RP, INF)
Pov=f (IS, DS, UNEMP, CORR)
(2)
(3 )
(4)
Although there are many other factors that may cause poverty, inflation is
regarded as an influential factor in determining the poverty. The problem of poverty
intensifies even more when the prices of commodities in general, and food in particular,
27
mcrease . Several arguments have been made in support of the view that inflation
increases poverty (Chaudhry and Chaudhry, 2008) .
Location of residence also matters . In particular, due to more job opportunities in
urban areas, poverty tends to be lower in urban than rural areas . A number of recent
studies, including the World Bank ( 1 990, 200 1 ) and the African Development Bank
(2002) have indicated that poverty in Africa (and other developing countries) is higher in
rural areas than in urban areas . Some of the reasons advanced for this include that
historically government policy has been biased against rural areas; rural areas are heavily
dependent on agricultural production, which in Africa is characterized by low labor
productivity and hence low incomes; and natural disasters such as flooding and drought
tend to affect rural areas more heavily than they affect urban areas . One might expect a
positive relationship will be associated with rural populations and poverty.
Corruption has been attributed as one of the causes of poverty in Nigeria. Nigeria
ranked as the second most corrupt in the world, corruption aggravated the level of
poverty of Nigerians in several ways (Abubakar 2002). Corrupt behaviors erode the
institutional capacity of government to deliver quality public services; divert public
investment away from major public needs into capital projects; lower compliance with
safety and health regulations; and increase budgetary pressures on government (Gupta
2000) . The above factors, which are caused by corruption, are in turn responsible for
producing poverty . The CPI Score relates to perceptions of the degree of which
corruption is seen by business people--a perfect 1 0 .00 would be a totally corruption-free
country. A negative sign is expected between poverty and corruption.
28
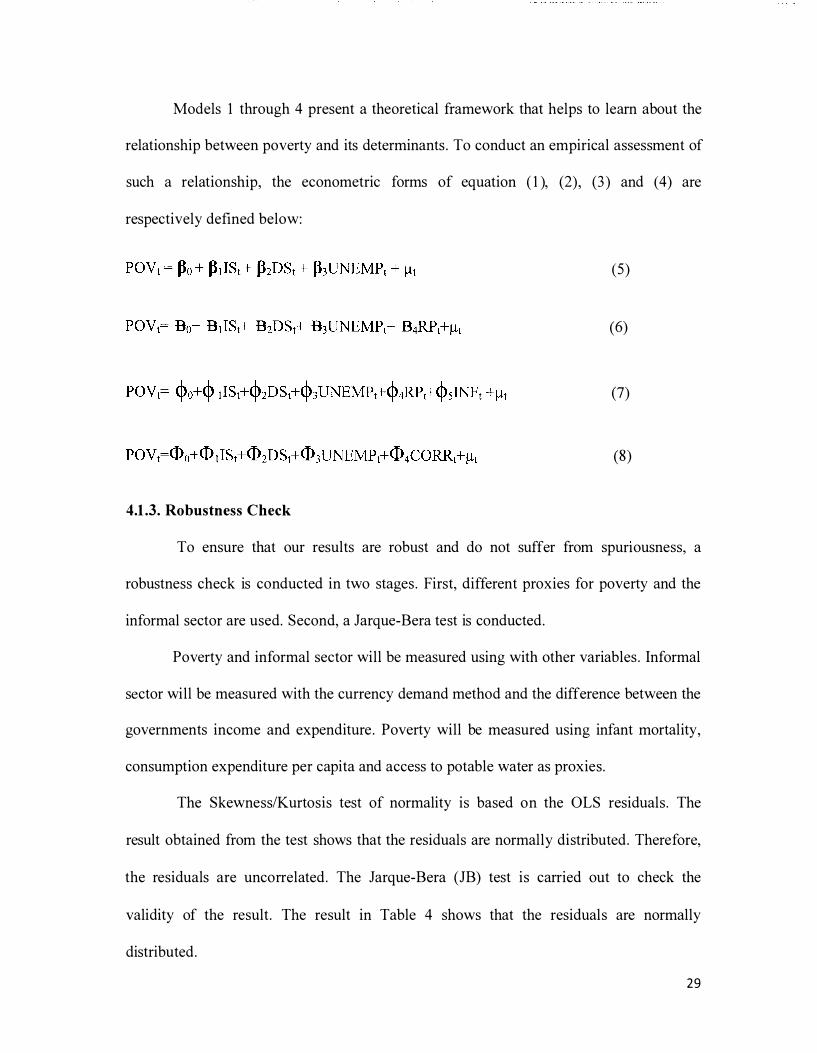
Models 1 through 4 present a theoretical framework that helps to learn about the
relationship between poverty and its determinants . To conduct an empirical assessment of
such a relationship, the econometric forms of equation ( 1 ), (2) , (3 ) and ( 4) are
respectively defined below:
(5)
(6)
(7)
(8)
4.1.3. Robustness Check
To ensure that our results are robust and do not suffer from spunousness, a
robustness check is conducted in two stages . First, different proxies for poverty and the
informal sector are used. Second, a Jarque-Bera test is conducted.
Poverty and informal sector will be measured using with other variables . Informal
sector will be measured with the currency demand method and the difference between the
governments income and expenditure . Poverty will be measured using infant mortality,
consumption expenditure per capita and access to potable water as proxies .
The Skewness/Kurtosis test of normality is based on the OLS residuals . The
result obtained from the test shows that the residuals are normally distributed. Therefore,
the residuals are uncorrelated. The Jarque-Bera (JB) test is carried out to check the
validity of the result . The result in Table 4 shows that the residuals are normally
distributed.
29
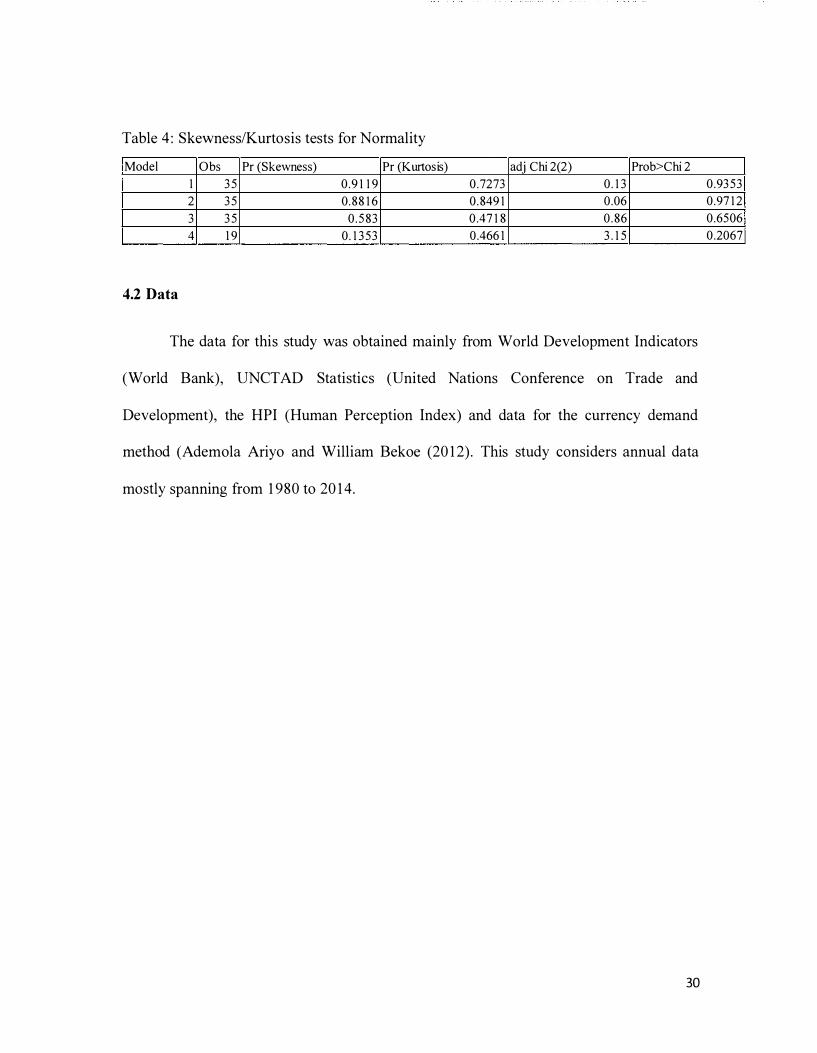
Table 4 : Skewness/Kurtosis tests for Normality
Model Obs Pr (Skewness) Pr (Kurtosis) adj Chi2(2) Prob>Chi2
1 35 0.9119 0.7273 0.13 0.9353
2 35 0.8816 0.8491 0.06 0.9712
3 35 0.583 0.4718 0.86 0.6506
4 19 0.1353 0.4661 3.15 0.2067
4.2 Data
The data for this study was obtained mainly from World Development Indicators
(World Bank), UNCTAD Statistics (United Nations Conference on Trade and
Development), the HPI (Human Perception Index) and data for the currency demand
method (Ademola Ariyo and William Bekoe (20 1 2) . This study considers annual data
mostly spanning from 1 980 to 20 1 4 .
30
5. Results and Implications
5.1 Results
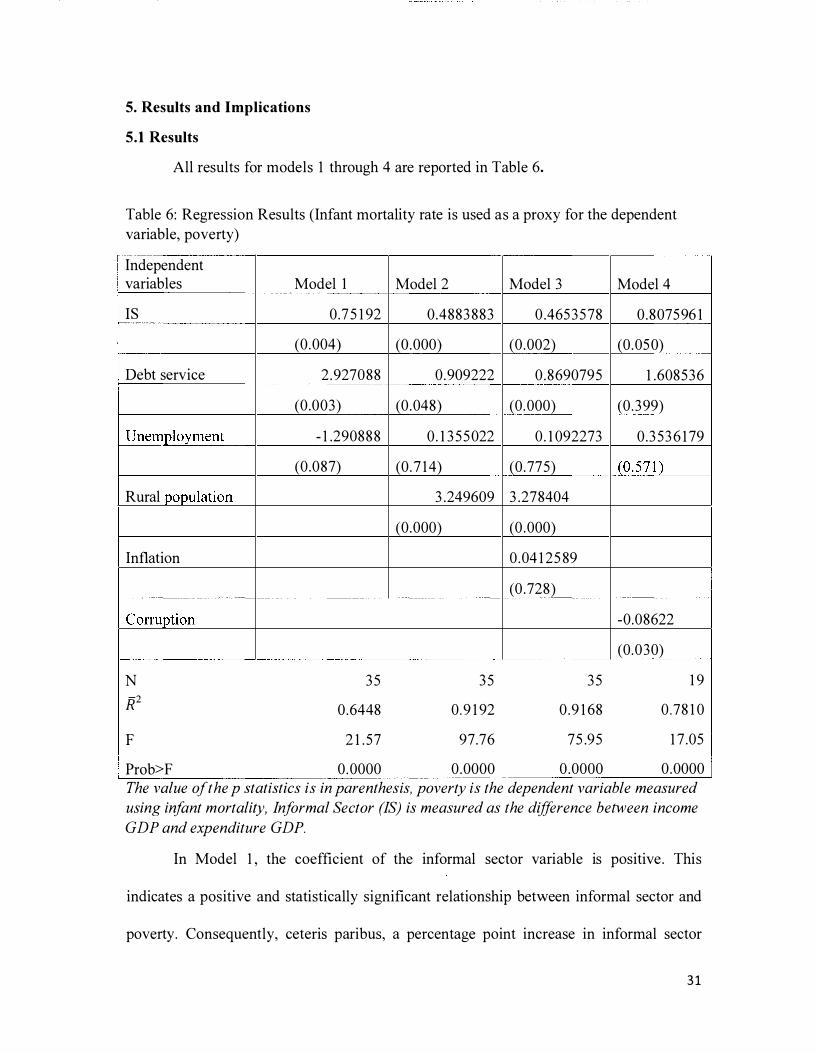
All results for models 1 through 4 are reported in Table 6.
Table 6: Regression Results (Infant mortality rate is used as a proxy for the dependent variable, poverty)
Independent variables Model 1 Model 2 Model 3 Model 4
IS 0 .751 92 0 .4883 883 0 .4653578 0 . 807596 1
(0 .004) (0 .000) (0 .002) (0 .050)
Debt service 2 .927088 0 .909222 0 . 8690795 1 .608536
(0 .003) (0 .048) (0 . 000) (0 . 399)
Unemployment - 1 .290888 0 . 1 355022 0 . 1 092273 0 . 353 6 1 79
(0 .087) (0 . 7 1 4) (0 .775) (0 .57 1 )
Rural population 3 .249609 3 .278404
(0 .000) (0 .000)
Inflation 0 .04 1 2589
(0 .728)
Corruption -0 .08622
(0 .030)
N 35 35 35 1 9 l?.2 0 .6448 0 . 9 1 92 0 .9 1 68 0 .78 1 0
F 2 1 .57 97 .76 75.95 1 7 .05
Prob>F 0 . 0000 0 .0000 0 .0000 0 .0000 The value of the p statistics is in parenthesis, poverty is the dependent variable measured
using infant mortality, Informal Sector (IS) is measured as the difference between income
GDP and expenditure GDP.
In Model 1 , the coefficient of the informal sector variable is positive . This
indicates a positive and statistically significant relationship between informal sector and
poverty. Consequently, ceteris paribus, a percentage point increase in informal sector
3 1
activity (expressed as a percentage of GDP) leads to an approximately 0 . 75 percentage
point increase in the poverty rate, on average . That is, as individuals engage in informal
sector activities poverty grows. This is because the existence of the informal sector
entails a loss in budget revenues . Consequently, reducing taxes and social security
contributions paid. Therefore, the availability of funds to improve infrastructure and other
public goods and services .
Furthermore, the coefficient of the debt service variable is positive and
statistically significant. Specifically, holding all other factors constant, a percentage point
increase in nation ' s debt servicing (expressed as a share of GDP) leads to about 2 .93
percentage point increase in poverty, on average. This suggests that any upward
movement in the amounts devoted by the Nigerian government in servicing debt will lead
to a reduction in the funds that would have been allocated to poverty alleviation projects,
and other infrastructural development projects aimed at improving the livelihoods of the
nation' s poor population.
Also, the coefficient of the unemployment variable suggests a negative
relationship with the rate of poverty in Nigeria but remains insignificant across all models
and specifications . Hence, holding all other factors constant, a percentage point increase
in the unemployment rate leads to a 1 .29 percentage point decrease in poverty, on
average . Even though this is surprising in the general context of the literature, it is not
strange in the Nigerian context because a reduction in the unemployment rate has largely
not come from the poor population- most of whom are engaged in agriculture and several
informal sector activities . This is probably why it is insignificant in explaining reductions
in the poverty rate .
3 2
The adjusted coefficient of the determination (iP) for the model is 0 .64 . This
implies that approximately 64% of the total variation in poverty is explained by the
informal sector, the growth rate of debt service and unemployment rate on average.
The F- statistic which shows the overall fit of the model was statistically
significant below the 1 % significance level and this implies that the estimated equation is
overall statistically significant.
In Model 2 , we control for the effects of the rural population on the rate of
poverty in Nigeria. After controlling for the share of the population living in rural areas,
our informal sector variable remained significant and positively related to the rate of
poverty. Thus, increases in informal sector would further lead to increases in poverty.
Specifically, other things being constant, a percentage point increase in the informal
sector activity leads to a 0 .49 percentage point increase in poverty, on average.
Furthermore, the coefficient of debt service is positive . On this account, it
indicates there is a positive and significant relationship between debt service and the
poverty rate in Nigeria. This implies that increases in debt service would further lead to
increases in poverty . As a result, ceteris paribus, an additional percentage point increase
in the country' s debt servicing as a share of GDP, causes the poverty rate to increase by
0 .9 1 percentage point, on average .
Interestingly, after controlling for the share of population living in rural Nigeria,
the coefficient of the unemployment rate variable turned out positive, but it is not
statistically significant, even at the 1 0% level . However, the positive sign shows that,
increases in the unemployment rate would further lead to increases in poverty.
33
Specifically, ceteris paribus, a percentage point increase in the unemployment rate leads
to a 0 . 1 4 percentage point increase in poverty, on average. The effect of this is that when
people are unemployed, their level of income reduces, which in tum reduces the standard
of living, but it remains insignificant as gains in employment have not been generally and
evenly spread across the different income classes .
The newly introduced rural population variable is however positive and
statistically significant. This therefore suggests that a positive relationship between the
percentage of people living in the rural areas and poverty. This did not come as a
surprise, given the evidence in the literature which suggests a positive correlation
between rural areas and poverty. Specifically, we find that all other things being constant,
a percentage point increase in rural population leads to a 3 .25 percentage point increase
in poverty, on average. Generally, people living in rural Nigeria do not have access to
basic amenities and good infrastructural services which will enable them to pull
themselves out of poverty .
The JP which measures the overall fit of the model is 0 .92 and it is statistically
significant at the 1 % level, suggesting that the variables are jointly significant in
explaining the model .
In model 3 , we attempt to control for the effects of inflation in eroding the value
of money and thus increasing poverty . After controlling for inflationary effects, the
coefficient of the informal sector remained positive . Suggesting that all other things
equal, a percentage point increase in informal sector would further lead to about 0 .47
percentage point increase in poverty . And it is statistically significant below the 1 % level .
34
Moreover, the coefficient of debt service remained positive, indicating a positive
relationship between debt servicing and poverty. Even though statistically insignificant,
we find, consistent with our a priori expectation that a percentage point increase in debt
servicing leads to a 0 . 87 percentage point increase in poverty, on average, all other things
equal .
In addition, the coefficient of the unemployment rate remained positive . This
indicates a positive relationship between the unemployment rate and poverty . Again,
even though statistically insignificant, the relationship implies that all other things being
constant, a percentage point increase in the unemployment rate leads to a 0 . 1 1 percentage
point increase in poverty, on average .
The coefficient of inflation variable also turned out positive . It shows a positive
relationship exists between the inflation rate and poverty . As a result, increases in the
inflation rate would further lead to increases in poverty . This follows the a priori
expectation, but is found to be statistically insignificant. Hence, ceteris paribus, a
percentage point increase in inflation rate leads to a 0 .04 percentage point increase in
poverty, on average. The fact that the inflation variable turned out insignificant did not
surprise as much because poor households often spend on consumption than on savings
and as such are able to escape the 'weakening purchasing power' effects of inflation on
savings . Therefore, even though inflation may be positively related to the rate of poverty,
it is insignificant in Nigeria.
We also found a positive relationship between the poverty rate and the rural
population, consistent with the literature . Specifically, we found that all other things
being constant, a percentage point increase in rural population leads to a 3 .28 percentage
35
point increase in poverty, on average . This is explained by the absence of life-enhancing
opportunities needed for households to move out of poverty in rural areas.
The li.2 for the model was quite high at 0 .92 . Suggesting that approximately 92%
of the variation in poverty rate in Nigeria is explained by the variables that is entered the
model . The F-statistic which gauges the overall goodness of fit was highly significant
below the 1 % level . Thus the model could be said to be significant, overall .
In Model 4, we tease out the effects of corruption on poverty by including a
corruption variable. Upon inclusion of the corruption variable, the coefficient of the
informal sector variable remained positive . The result indicates a positive and significant
relationship between informal sector and poverty . This implies that increases in informal
sector would further lead to increases in poverty. Therefore, ceteris paribus, a percentage
point increase in informal sector leads to a 0 . 8 1 percentage point increase in poverty, on
average .
Furthermore, the coefficient of debt service also remained positive . I t shows that a
positive relationship exists between debt service and poverty. On this account, increases
in debt service would further lead to increases in poverty . This follows the a priori
expectation, but is found to be statistically insignificant. Thus, all other things being
constant, a percentage point increase in debt service leads to a 1 . 6 1 percentage point
increase in poverty, on average .
Also, the coefficient of the unemployment rate is positive . This indicates a
positive relationship between the unemployment rate and poverty . Consequently,
increases in the unemployment rate would further lead to increases in poverty . This
36
follows the a priori expectation, but is found to be statistically insignificant. Thus, all
other things being constant, a percentage point increase in the unemployment rate leads to
a 0 .35 percentage point increase in poverty, on average.
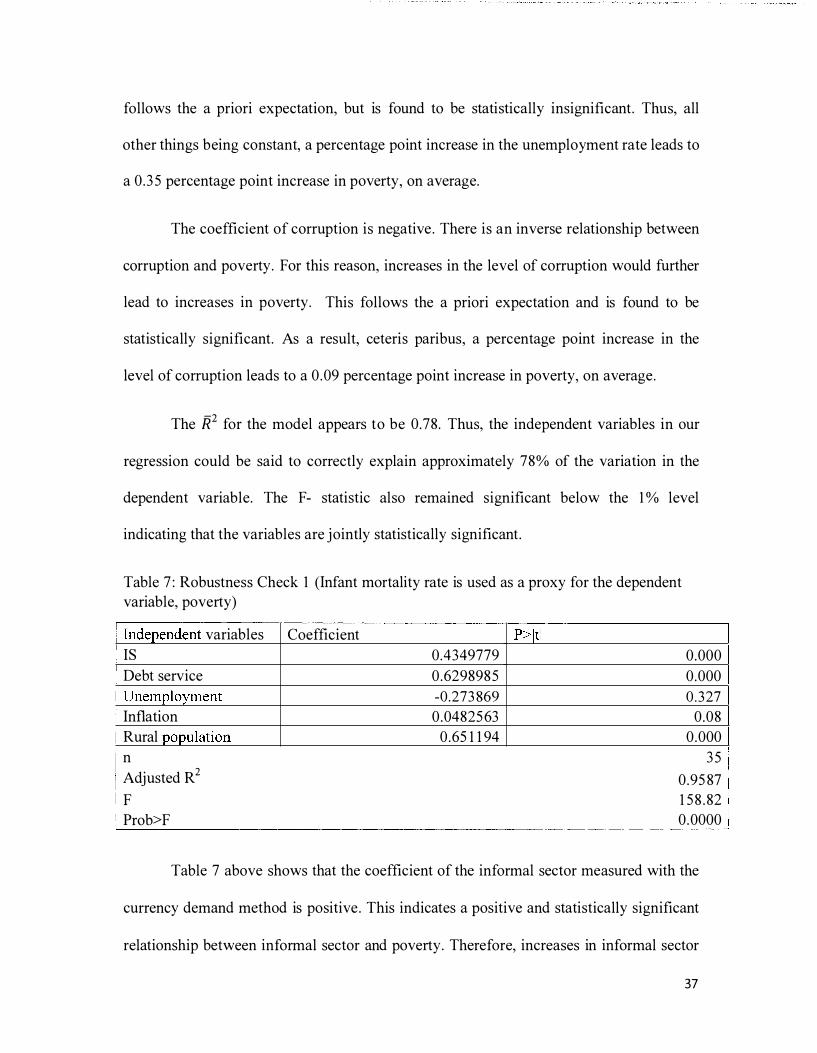
The coefficient of corruption is negative . There is an inverse relationship between
corruption and poverty . For this reason, increases in the level of corruption would further
lead to increases in poverty. This follows the a priori expectation and is found to be
statistically significant. As a result, ceteris paribus, a percentage point increase in the
level of corruption leads to a 0 .09 percentage point increase in poverty, on average.
The i?.2 for the model appears to be 0 .78 . Thus, the independent variables in our
regression could be said to correctly explain approximately 78% of the variation in the
dependent variable. The F- statistic also remained significant below the 1 % level
indicating that the variables are jointly statistically significant.
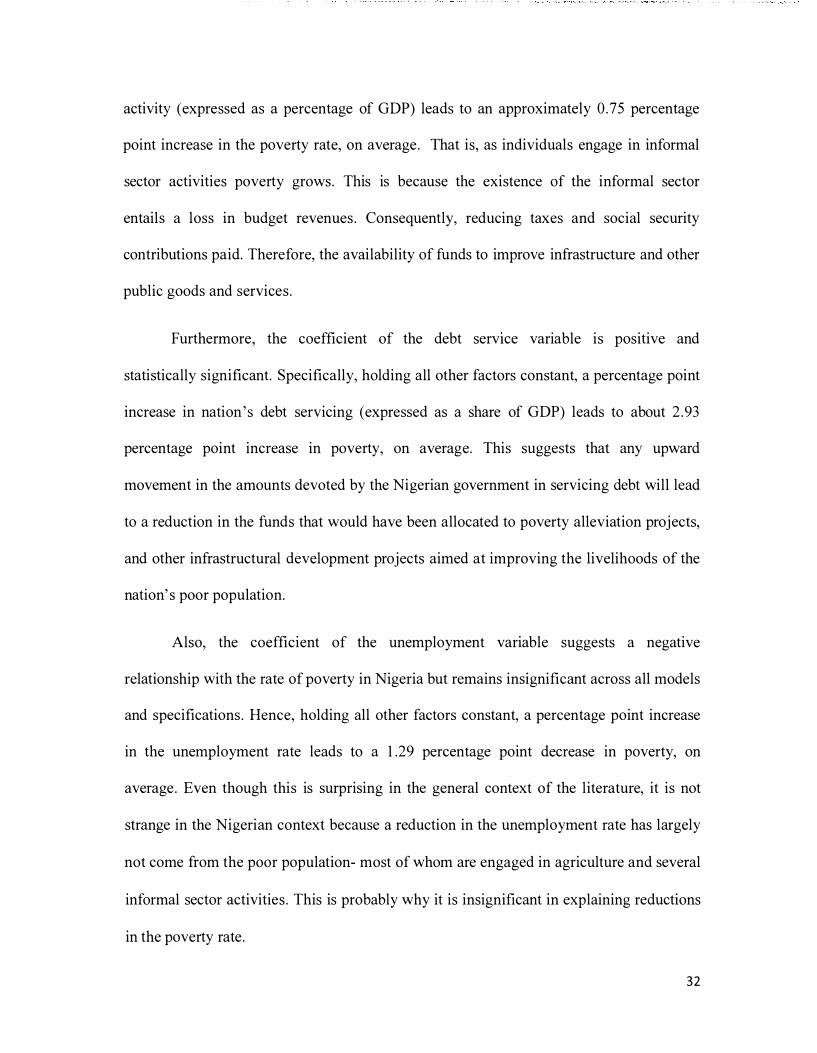
Table 7 : Robustness Check 1 (Infant mortality rate is used as a proxy for the dependent variable, poverty)
Independent variables Coefficient P> [t[ IS 0 .4349779 0 .000 Debt service 0 .6298985 0 .000 Unemployment -0 .273 869 0 . 3 27
Inflation 0 .0482563 0 .08 Rural population 0 .65 1 1 94 0 .000 n 35 Adjusted R2 0 .9587 F 1 58 . 82 Prob>F 0 .0000
Table 7 above shows that the coefficient of the informal sector measured with the
currency demand method is positive . This indicates a positive and statistically significant
relationship between informal sector and poverty. Therefore, increases in informal sector
37
would further lead to increases in poverty. This follows the theoretical expectation and is
found to be statistically significant. Thus, all other things being constant, a percentage
point increase in the informal sector leads to a 0 .43 percentage point increase in poverty,
on average .
Besides, the coefficient of debt service is positive . I t suggests that there is a
positive relationship between debt service and poverty . Hence, increases in debt service
would further lead to increases in poverty. This follows the theoretical expectation and is
found to be statistically significant at the 1 0 percent level . Thus, a percentage point
increase in debt service leads to a 0 .63 percentage point increase in poverty, on average.
In addition, the coefficient of the unemployment rate is negative . There is an
inverse relationship between unemployment rate and poverty . As a result, increases in the
unemployment rate would further lead to decreases in poverty. This does not follow the a
priori expectation and is found to be statistically insignificant. Thus, ceteris paribus, a
percentage point increase in the unemployment rate leads to a 0 .27 percentage point
decrease in poverty, on average .
The coefficient of inflation is positive . Therefore, there is a positive relationship
between inflation rate and poverty. For this reason, increases in the inflation rate would
further lead to increases in poverty . This follows the a priori expectation and is found to
be statistically significant. Thus, ceteris paribus, a percentage point increase in inflation
rate leads to a 0 . 05 percentage point increase in poverty, on average .
The coefficient of rural population is positive . There is a positive relationship
between the percentage of people living in the rural areas and poverty. As a result,
38
increases in the percentage of people living in rural areas would further lead to increases
in poverty. This follows the theoretical expectation and is found to be statistically
significant. Hence, all other things being constant, a percentage point increase in rural
population on average leads to a 0 .65 percentage point increase in poverty, on average .
The iP for this model appears was also quite high; 0 .96 . Thus, the model is said to
be of a good fit as the independent variables explain about 96% of the variation in the
dependent variable. The F- statistic which gives a much better measure of the goodness
of fit was also statistically significant below the 1 % level .
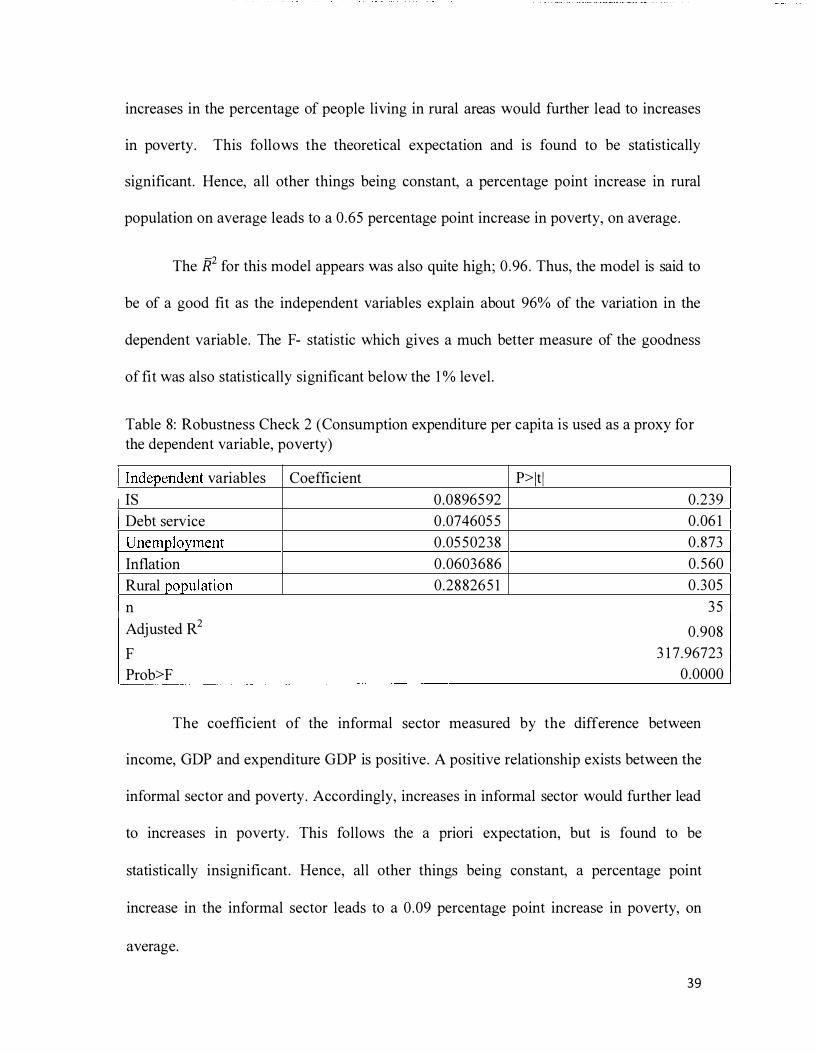
Table 8 : Robustness Check 2 (Consumption expenditure per capita is used as a proxy for the dependent variable, poverty)
Independent variables Coefficient P>Jt l IS 0 .0896592 0 .239 Debt service 0 .0746055 0 .06 1 Unemployment 0 .0550238 0 . 873 Inflation 0 .0603686 0 .560 Rural population 0 .2882651 0 . 305 n 35 Adjusted R2 0 .908 F 3 1 7 .96723 Prob>F 0 .0000
The coefficient of the informal sector measured by the difference between
income, GDP and expenditure GDP is positive . A positive relationship exists between the
informal sector and poverty . Accordingly, increases in informal sector would further lead
to increases in poverty. This follows the a priori expectation, but is found to be
statistically insignificant . Hence, all other things being constant, a percentage point
increase in the informal sector leads to a 0 .09 percentage point increase in poverty, on
average.
39
Furthermore, the coefficient of debt -service is positive . This indicates a positive
and significant relationship between debt service and poverty. As a result, increases in
debt service would further lead to increases in poverty . Thus, a percentage point increase
in debt service will lead to a 0 .07 percentage point increase in poverty, on average.
Moreover, the coefficient of the unemployment rate is positive . There is a positive
relationship between the unemployment rate and poverty, but is found to be statistically
insignificant. That being the case, increases in the unemployment rate would further lead
to increases in poverty . Thus, ceteris paribus, a percentage point increase in the
unemployment rate will lead to a 0 .06 percentage point increase in poverty, on average.
The coefficient of inflation is positive . A positive relationship is between the
inflation rate and poverty . This shows that increases in the inflation rate would further
lead to increases in poverty, but is found to be statistically insignificant. Thus, ceteris
paribus, a percentage point increase in the inflation rate will lead to a 0 .06 percentage
point increase in poverty, on average.
The coefficient of rural population 1s positive . This indicates a positive
relationship is between the percentage of people living in the rural areas and poverty.
Hence, increases in the percentage of people living in rural areas would further lead to
increases in poverty, but is found to be statistically insignificant. Therefore, all other
things being constant, a percentage point increase in rural population will lead to a 0 .29
percentage point increase in poverty, on average .
The i?.2 for the model is also 0 .9 1 . Thus, the model is said to be of a good fit as the
independent variables explain about 9 1 % of the variation in the dependent variable. The
40
F- statistic which gives a much better measure of the goodness of fit was also statistically
significant below the 1 % level .
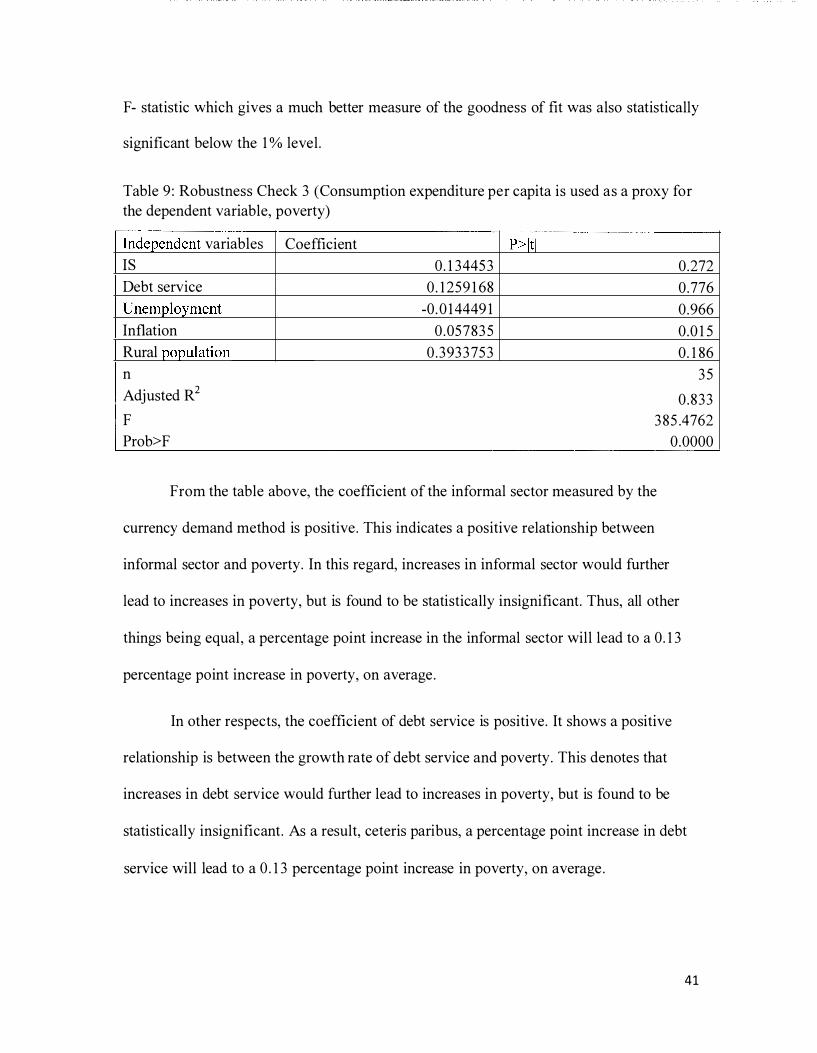
Table 9 : Robustness Check 3 (Consumption expenditure per capita is used as a proxy for the dependent variable, poverty)
Independent variables Coefficient P>lt l IS 0 . 1 34453 0 .272 Debt service 0 . 1 259 1 68 0 .776 Unemployment -0 . 0 1 4449 1 0 .966 Inflation 0 .057835 0 .0 1 5 Rural population 0 . 3933753 0 . 1 86 n 35 Adjusted R2
0 . 833 F 3 85.4762 Prob>F 0 .0000
From the table above, the coefficient of the informal sector measured by the
currency demand method is positive . This indicates a positive relationship between
informal sector and poverty. In this regard, increases in informal sector would further
lead to increases in poverty, but is found to be statistically insignificant. Thus, all other
things being equal , a percentage point increase in the informal sector will lead to a 0 . 1 3
percentage point increase in poverty, on average .
In other respects, the coefficient of debt service is positive . It shows a positive
relationship is between the growth rate of debt service and poverty . This denotes that
increases in debt service would further lead to increases in poverty, but is found to be
statistically insignificant. As a result, ceteris paribus, a percentage point increase in debt
service will lead to a 0 . 1 3 percentage point increase in poverty, on average .
41
Plus, the coefficient of the unemployment rate is negative . An inverse relationship
is between unemployment rate and poverty . Therefore, increases in the unemployment
rate would further lead to decreases in poverty. Thus, ceteris paribus, a percentage point
increase in the unemployment rate will lead to a 0 . 0 1 percentage point decrease in
poverty, on average.
The coefficient of inflation is positive . This indicates a positive relationship
between inflation rate and poverty . Hence, increases in the inflation rate would further
lead to increases in poverty. This follows the a priori expectation and is found to be
statistically significant. Thus, all other things being constant, a percentage point increase
in the inflation rate will lead to a 0 .06 percentage point increase in poverty, on average .
The coefficient of rural population is positive . It indicates a positive relationship
between the percentage of people living in the rural areas and poverty. This implies that
increases in the percentage of people living in rural areas would further lead to increases
in poverty. This follows the expected relationship, but is found to be statistically
insignificant. Thus, all other things being constant, a percentage point increase in rural
population will lead to a 0 . 39 percentage point increase in poverty, on average
The JP for the model appears to be 0 . 83 . Thus, the model is said to be of a good
fit as the independent variables explain about 83% of the variation in the dependent
variable. The F- statistic which gives a much better measure of the goodness of fit was
also statistically significant below the 1 % level .
42
5.2 Implications
The results show that the informal sector drives poverty in a positive and
significant relationship, although its impacts remain small in most specifications . That is,
as the informal sector expands in Nigeria, poverty also expands . Therefore, to tackle the
scourge of poverty, decision makers could implement policies intended to curtail the
development of the informal sector.
To start with, business regulations can affect the decisions people make regarding
whether to operate formally or not. The Nigerian government could reduce the
bureaucratic procedures by ensuring the simplification of the cost of registering and
provision of licenses which will encourage the businesses to declare themselves.
Registration and taxation should be made easier and even offering incentives to those
businesses that pay taxes .
Furthermore, the design and implementation of programs which would focus on
training and providing support to the small business owners could prove impactful
throughout the Nigerian economy. Indeed, such programs have the potential of fostering
both the creation and development of small businesses in the formal sector.
The government could also work towards building the public ' s trust, because
people will be more willing to participate in formal activities if they believe that their
contributions will positively affect their wellbeing, this can be done by ensuring the
efficient use of the taxes or by providing social services like a community bore-hole
which could provide them with clean water or by building health centers etc .
43
A very crucial issue that has to be addressed is corruption because this is a well-
known factor that could mitigate the prospects of the economy because irrespective of the
implications and policies recommended, if transparency is lacking in any sector and the
economy in general, then the idea of the reduction of poverty remains vague . The
Nigerian government has to put in place policies that will help curb corruption by
enacting anti- corruption laws and adopting codes of 1 conducts and ethical standards in
both the public and private sectors .
1 Water access was used as a p roxy for poverty but out of cons iderat ion for space and the l im ited data set, the resu lt can be fou n d Tab le 10 and 11 in the a ppend ix
44
6. Conclusion
This study attempted to analyze the relationship between poverty and the informal
sector in Nigeria. The contribution of the informal sector, unemployment rate, inflation,
rural population, debt service and corruption were used to determine the level of poverty .
From the results obtained, analyzed and interpreted it can be concluded that the informal
sector, unemployment rate, inflation, rural population, debt service and corruption are
important in influencing the level of poverty in Nigeria.
It was found that the size of the informal sector determines the level of poverty .
To this regard, in tackling the scourge of poverty, decision makers in Nigeria could
implement policies intended to curtail the development of the informal sector. Therefore,
policies like reduction in bureaucratic processes, reduction in the level of corruption and
skill development can be implemented.
This study can be improved by considering other variables that affect poverty like
level of education, democracy, political terror. The study can be further developed by
considering other developing countries or a group of developing countries .
45
Reference
Abubakar, G . A. (2002) . Poverty Reduction and Direct Job Creation in Nigeria. Abuja : Usman and Sons Publisher Ltd
Ademola Ariyo and William Bekoe (20 1 2) Currency Demand, the Underground Economy and Tax Evasion: The Case of Nigeria Journal of Monetary and Economic Integration . 1 1 (2) . 1 3 1 - 1 57 .
African Development Bank (2002), African Development Report 2002 : Rural Development for Poverty Reduction in Africa, Oxford University Press, Oxford.
Akinwale, A. A. (20 1 2) . The Informal Sector as a Catalyst for Employment Generation in Lagos State, Nigeria. African & Asian Studies, 1 1 (3) , 3 1 5-344. doi : l 0 . 1 1 63/ 1 5692 1 08- 1 234 1 236
Cagan, P . ( 1 958) . The Demand for Currency Relative to the Total Money Supply. Journal of Political Economy, 66 (3), 3 02-328
CBN/FOS/NISER (200 1 ) A Study of Nigeria 's Informal Sector, vols . I and II
Chauhary, T . T . and Chaudhary, A. A. (2008) . The Effects of Rising Food and Fuel Costs on Poverty in Pakistan. The Lahore Journal of Economics, Special Edition (September) . Lahore, Pakistan. pp. 1 1 7- 1 3 8
Dhemba, J . ( 1 999) Informal Sector Development : A Strategy for Alleviating Urban Poverty in Zimbabwe. Journal of Social Development in Africa, 1 4 , 2, 5- 1 9
FOS ( 1 999), "National Accounts Statistics ( 1 997- 1 999)" Federal Office of Statistics, Abuja
Granger, C .W.J . and Newbold, P . ( 1 974) . Spurious Regressions in Econometrics . Journal
of Econometrics 2 (2) : 1 1 1 -20
Gupta, Sanjeev, Hamid Davoodi and Erwin Tiongson (2000) . "Corruption and the Provision of Health Care and Education Services ." IMF Working Paper 00/ 1 1 6
Idowu, B . (20 1 5) ._Debt Servicing to Gulp 35% Of Nigeria' s Revenue. IMF working Papers .
International Labor Organization (2002), A Policy Framework, ILO
46
International Labor Organization ( 1 972), Conclusions on Decent Work and the Informal Sector, ILO
lyoboyi, M. (20 1 3 ) . Poverty Alleviation in the Informal Sector as a Catalyst for Nigeria's Economic Growth. International Journal of Research In Commerce, Economics And Management, 3 ( 1 ) , 28-35
Kapunda, S . M. , & Moffat, B . D . (20 1 4) . Employment Trends and Poverty Reduction: The Case of the Informal Sector in Botswana. Journal of Social and Economic Policy, 1 1 ( l ) , 1 - 1 2
Kaufmann, Daniel, Aart Kraay and Pablo Zoido- Lobaton (2002). "Governance Matters II, Updated Indicators for 2000/0 1 ," World Bank Policy Research Working Paper 2 7 72
Liedholm, C . and Mead, D . ( 1 987) , "Small-Scale Industries in Developing Countries : Empirical Evidence and Policy Implications", MSU International Development Paper, No . 9 .
McAfee, K. ( 1 980) "A glimpse of the hidden economy in the national accounts" , Economic Trends, 3 1 6 (Feb) : 8 1 -87 .
Millan-Smitmans, P . (20 1 0) . Poverty and Informal Employment in Argentina. Catholic University of Argentina.
National Bureau of Statistics (20 1 2) . 'The Nigerian Poverty Profile 20 1 0 report' , Abuja. 1 2- 1 4 .
Nikopur, H . , & Shah Habibullah, M. (20 1 0) . Shadow economy and poverty. MPRA Paper 23599, University Library of Munich
Ogun, T. P . (20 1 0) . Infrastructure and Poverty Reduction: Implications for Urban Development in Nigeria. Urban Forum, Springer Science Media B .V . , 2 1 , 249-266.
Okoj ie, C.E. (2002) "Gender and Education as Determinants of Household Poverty in Nigeria " United Nations University World Institute for Development Economics Research (UNU-WIDER) Discussion Paper Number 2002/37
Olowa. 0 . (20 1 2) ; Concept, Measurement and Causes of Poverty : Nigeria in Perspective. American Journal of Economics : 2 ( 1 ) : 25-36
Rogerson C . ( 1 996) Urban poverty and the informal economy in South Africa 's economic heartland. Environment & Urbanization . 8( 1 ) . 1 67- 1 79 .
47
Saglam N. (2007) . The informal Sector and Poverty in the Mediterranean countries and Turkey
Siyanbola, N. (2005) . Protecting the Poor from Macroeconomic Stock in Nigeria. An Empirical Investigation and Policy Options . A Study Commissioned by Global Development Network (GDN)
Tambunan, T. (2004) . Urban Poverty, Informal Sector and Poverty Alleviation Policies in Indonesia. Expert Group on Development Issues (EGDI) . World Institute for Development Economics Research - United Nations University
Tomori, S . & M. A. Adebiyi (2002) "External Debt and Health Expenditure in Nigeria: An Empirical Investigation: Nigerian Journal of Health and Biomedical Science, 1 ( 1 ), 1 -5.
Ugoh, S .C . and Ukpere, W.I . (2009), Appraising the trend of Policy on Poverty Alleviation Programmes in Nigeria with emphasis on National Poverty Eradication Programme (NAPEP), Business Papers and Reports, Paper 1 3 Available at http://dk.cput .ac .za/bus papers/ 1 3
World Bank ( 1 990), Toward Gender Equality : The Role of Public Policy, World Bank, Washington, DC.
World Bank (200 1 ) , World Development Report 2000/200 1 : Attacking Poverty, World Bank, Washington DC.
Yuriy, T. (20 1 3) . The Effects of the Informal Sector on Income of the Poor in Russia Social Indicators Research, 1 1 1 (3) , 855-866
48
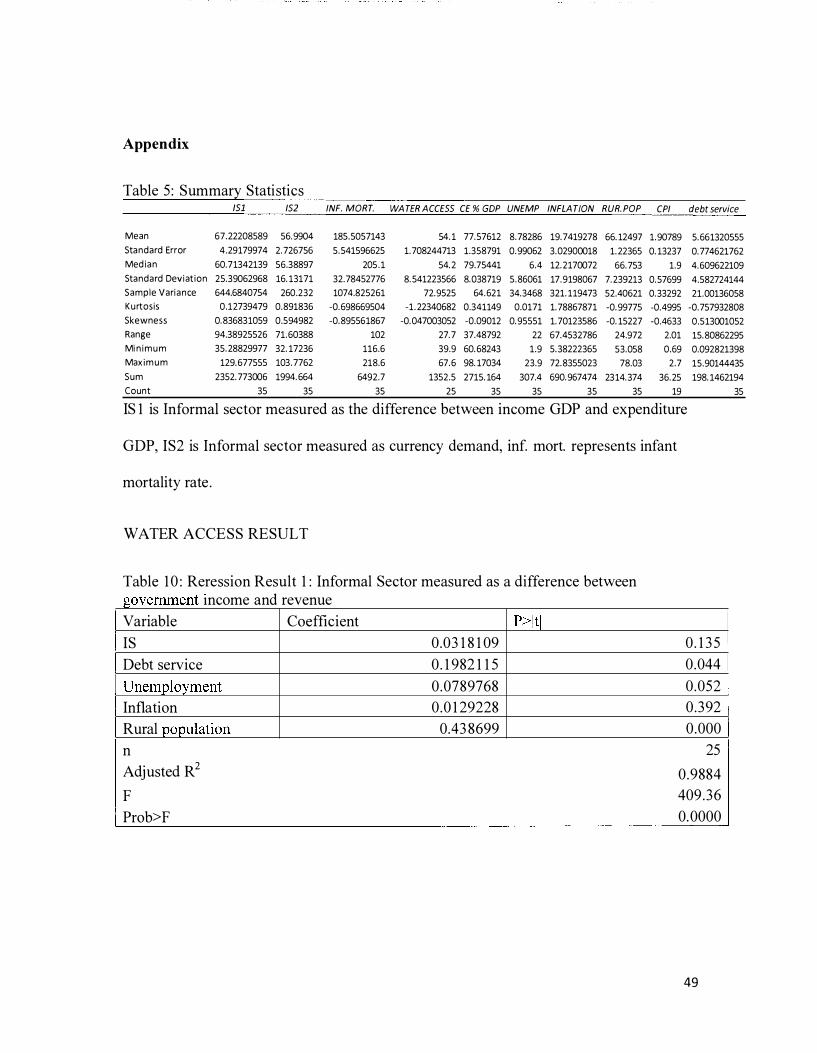
Appendix
Table 5: Summary Statistics 151 152 INF. MORT. WA TER A CCE55 CE % GDP UNEMP INFLA TION RUR. POP CPI debt service
Mean 67. 22208589 56. 9904 185.5057143 54. 1 77. 57612 8.78286 19. 7419278 66. 12497 1. 90789 5. 661320555 Standard Error 4 .29179974 2. 726756 5. 541596625 1. 708244713 1.358791 0. 99062 3.02900018 1. 22365 0. 13237 0. 774621762 Med i a n 60. 71342139 56.38897 205 . 1 54. 2 79.75441 6.4 12. 2170072 66. 753 1.9 4. 609622109 Standard Dev i at ion 25.39062968 16. 13171 32. 78452776 8. 541223566 8.038719 5. 86061 17. 9198067 7. 239213 0. 57699 4.582724144 Samp le Vari a n ce 644.6840754 260.232 1074.825261 72.9525 64. 621 34.3468 321. 119473 52.40621 0. 33292 21.00136058 K u rtosis 0 .12739479 0.891836 -0. 698669504 -1 . 22340682 0.341149 0.0171 1. 78867871 -0. 99775 -0.4995 -0. 757932808 Skewness 0. 836831059 0.594982 -0. 895561867 -0. 047003052 -0.09012 0. 95551 1. 70123586 -0. 15227 -0.4633 0.513001052 Range 94.38925526 71. 60388 102 27. 7 37.48792 22 67.4532786 24.972 2.01 15. 80862295 Mi n i m u m 35. 28829977 32. 17236 116.6 39.9 60. 68243 1 .9 5. 38222365 53.058 0.69 0.092821398 Max i m u m 129. 677555 103 . 7762 218.6 67. 6 98. 17034 23.9 72. 8355023 78.03 2 .7 15. 90144435 Sum 2352. 773006 1994. 664 6492.7 1352.5 2715. 164 307.4 690. 967474 23 14. 374 36. 25 198. 1462194 Count 35 35 35 25 35 35 35 35 19 35
IS 1 is Informal sector measured as the difference between income GDP and expenditure
GDP, IS2 is Informal sector measured as currency demand, inf. mort. represents infant
mortality rate .
WATER ACCESS RESULT
Table 1 0 : Reression Result 1 : Informal Sector measured as a difference between government mcome an d revenue Variable Coefficient P> ltl IS 0 .03 1 8 1 09 0 . 1 35 Debt service 0 . 1 982 1 1 5 0 .044 Unemployment 0 .0789768 0 .052 Inflation 0 .0 1 29228 0 .392 Rural population 0.43 8699 0 .000 n 25 Adjusted R2 0 .9884 F 409 .36 Prob>F 0. 0000
49
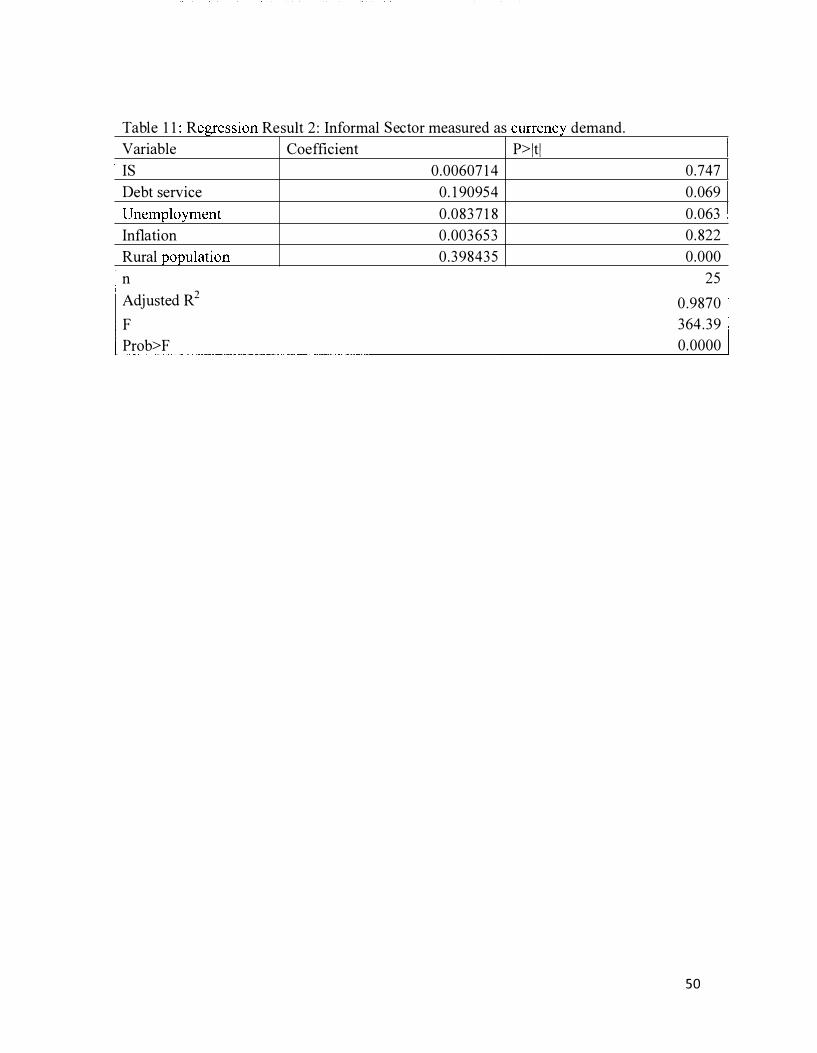
T bl 1 1 R a e egress1on R 1 2 I fi esu t : n orma 1 s t ec or measure d as currency d d eman . Variable Coefficient P> lt l IS 0 .00607 1 4 0 .747 Debt service 0 . 1 90954 0 .069 Unemployment 0 .083 7 1 8 0 .063 Inflation 0 .003653 0 . 822 Rural population 0 . 398435 0 .000 n 25 Adjusted R2 0 .9870 F 364 . 39 Prob>F 0 .0000
50


![The Nexus between Sustainable Power and Growing Local ......Poverty Alleviation” The Nexus between Sustainable Power and Growing Local ... utilities [construction and supervision],](https://img.pdfslide.us/doc/110x75/5e9ecb0ce04f1640c13ae1d6/the-nexus-between-sustainable-power-and-growing-local-poverty-alleviationa.jpg)