Embed Size (px)
Citation preview

An Investigation of the Mechanical Behavior ofCarbon Epoxy Cross Ply Cruciform SpecimensUnder Biaxial Loading
Andreas Makris,1 Carla Ramault,1 Danny Van Hemelrijck,1 Dimitrios Zarouchas,1
Ebrahim Lamkanfi,2 Wim Van Paepegem2
1Department of Mechanics of Materials and Constructions, Vrije Universiteit Brussel, Brussels, Belgium
2Department of Materials Science and Engineering, Ghent University, Ghent, Belgium
In this study, carbon epoxy cruciform type specimenswith a cross-ply layup were biaxially and uniaxially in-plane loaded using four independent servo-hydraulicactuators. Four different biaxial loading ratios wereinvestigated when the applied load was quasi-static. Acomparison between experimental observations (forthe damage and strain evolution of the biaxially loadedcentral section of the specimen) coming from digitalimage correlation measurements and a 3D finite ele-ment damage model will be shown. The symmetry andthe uniformity of the strain field on the biaxially loadedzone were by the use of digital image correlationmeasurements investigated. Furthermore, the failureloads coming from the load cells of the machine werestraightforward compared with the output of the finiteelement damage model. POLYM. COMPOS., 31:1554–1561,2010. ª 2009 Society of Plastics Engineers
INTRODUCTION
The lack of reliable multiaxial or even biaxial experi-
mental data to validate failure theories is a critical step in
the evolution and a most efficient usage of composite
materials [1]. Because of the complex anisotropic behav-
ior of composite materials more advanced experimental
testing is needed. The current practice of using uniaxial
test results to predict failure for multiaxial stress states
seems inadequate. To study the mechanical behavior of
fiber reinforced polymeric matrix composite laminates
under static and cyclic in-plane complex stress states a
horizontal biaxial loading frame and a special cruciform
type specimen have been developed. The reliability of the
experimental failure data depends a lot on the proper
design of the cruciform specimen and the accuracy of the
measurements [2]. The specimen should fulfill some
requirements as failure must mainly occur in the biaxially
loaded centre and the strain distribution should also be
uniform. Smits et al. [3] proposed a geometry to satisfy
these requirements. In this study, the evolution of the
strain and damage of the biaxially loaded central section
of this common used cruciform geometry [4, 5] was
experimentally and numerically investigated. In the nu-
merical part a progressive damage modeling (PDM) tech-
nique was implemented in the commercial finite element
software Ansys� to simulate the biaxial mechanical test
and study the damage evolution. Among literature, one of
the first progressive damage models present was intro-
duced by Chou et al. [6], where no distinction between
different failure modes was considered. In more recent lit-
erature, Tserpes et al. [7, 8] presented a 3D model for
predicting residual strength, final failure load, and modes
in bolted composite joints under quasi-static tensile load-
ing by using a set of 3D discrete failure criteria represen-
tative for the basic failure modes of composite materials.
EXPERIMENTAL PART
Plane Biaxial Test Bench for Testing CruciformSpecimens
The developed biaxial test rig, see Fig. 1, has a
capacity of 100 kN in each perpendicular direction, but
only in tension, limiting the experimental results to the
first quadrant of the 2D stress space failure envelope.
This type of machine is often used to perform mechanical
biaxial tests of composite materials or metals [9–11]. As
no cylinders with hydrostatic bearing were used, failure
or slip in one arm of the specimen will result in sudden
radial forces, which could seriously damage the servo-hy-
draulic cylinders and load cells. To prevent this, hinges
were used to connect the servo-hydraulic cylinders to the
Correspondence to: A. Makris; e-mail: [email protected]
DOI 10.1002/pc.20943
View this article online at wileyonlinelibrary.com.
VVC 2009 Society of Plastics Engineers
POLYMER COMPOSITES—-2010

test frame. By using four hinges in each loading direction
results in an unstable situation in compression and, conse-
quently, only tension loads can be applied. The stroke of
each cylinder is 150 mm, while the loading may be static
or dynamic up to a frequency of 20 Hz. Moreover, each
cylinder is independently controlled, and any type of
loading waveform, including spectral sequences of vari-
able amplitude, can be efficiently introduced using the
dedicated software and control system.
Cruciform Specimen and Mechanical Properties of theUD Material
Specimens tested were manufactured using carbon UD
SE84 prepreg material. The layup used for this study was
[(0/90)2, (90/0)2]sym, the thickness of each lamina was
0.28 mm, the width of the arms was 25 mm, and the
length 250 mm. This leads to a total nominal thickness of
4.48 mm for the arms of the cruciform specimen and of
2.24 mm for the biaxially loaded zone, where one group
of [(0/90)2] was milled away at each side of the speci-
men, see Fig. 2. To reduce interlaminar stresses, the layup
was built up in a way that the top layer of the milled
zone and the 4th or 13th layer of the arms have the same
orientation (908), this modification proved to improve the
failure behavior of glass epoxy specimens under biaxial
loading conditions [12]. A speckle pattern was also
applied on the surface of the specimen to perform optical
measurements using the Digital Image Correlation Tech-
nique [13].
To obtain the elastic properties and strength of the
UD material, mechanical tests were realized. Average
five specimens per property were tested. For the uniaxial
tensile properties, ISO-527-5 coupons were used, for the
uniaxial compression properties ISO-14126, and all shear
properties were measured by using the Iosipescu method
(ASTM D5379). For generating through-thickness (TT)
data in both tension and compression the circular-
waisted block (CWB), [14] testing method was used. In
Table 1, the average values and standard deviation of
the elastic properties of the UD SE84 material can be
found. These properties together with the strength of the
lamina, see Table 2, were used as basic input for the
FEDM.
In Table 1, defining term’s indexation, ‘‘123’’ is the
fiber coordinate system, ‘‘1’’ is the fiber direction, ‘‘2’’ is
the direction transverse to the fibers, and ‘‘3’’ is the
through thickness direction.
In Table 2, XT, XC are the tensile and compressive
strength longitudinal to the fibers, YT, YC are the tensile
and compressive strength transverse to the fibers normal
to ‘‘13’’ plane, ZT, ZC are the tensile and compressive
strength transverse to the fibers normal to ‘‘12’’ plane,
while Sij, i,j ¼ 1,2,3, is the shear strength of the lamina.
Strain Measurements Using Digital ImageCorrelation Technique
To be able to study the symmetry of the strain field
and the occurring shear strains experimentally, full field
methods are necessary. Strain measurements using a strain
gage or extensometer are not sufficient, because both give
an average value of the deformation along their gauge
length and sometimes fail earlier than the specimen.
The strain field of glass epoxy specimens of the same
geometry under uniaxial or biaxial loading conditions
was in a previous study extensively investigated [2].
There, because of the complexity of the specimen’s ge-
ometry, different measurement techniques (Strain gages,
FIG. 1. Plane biaxial test device for testing cruciform specimens.
FIG. 2. Cruciform geometry.
DOI 10.1002/pc POLYMER COMPOSITES—-2010 1555

Digital Image Correlation (DIC) and Electronic Speckle
pattern Interferometry (ESPI) techniques were used com-
bined or separately) were applied to investigate strain
concentrations, obtain the valid strain field of the zone
of interest, and finally, ensure the accuracy of the
measurements.
In this study, Digital Image Correlation Technique
(DICT) was used to follow the strain evolution of the
areas of interest. DICT is an experimental technique,
which offers the possibility to determine in-plane and out
of plane displacement and deformation fields of the sur-
face of objects under any kind of loading, based on a
comparison between images taken at different load steps.
By deriving the displacement field, the desirable strain
field can be obtained.
Four different load ratios (Fx/Fy) were applied on cru-
ciform specimens (three different biaxial cases 1/1, 2/1, 3/
1, and a uniaxial case 0/1), and for each ratio, two speci-
mens were tested in tension until total failure. Biaxial
testing of cruciform specimens was performed using load
control of the machine with a constant load speed of 5
kN/min and uniaxial testing of them by displacement
control with a displacement rate of 1 mm/min. Below, in
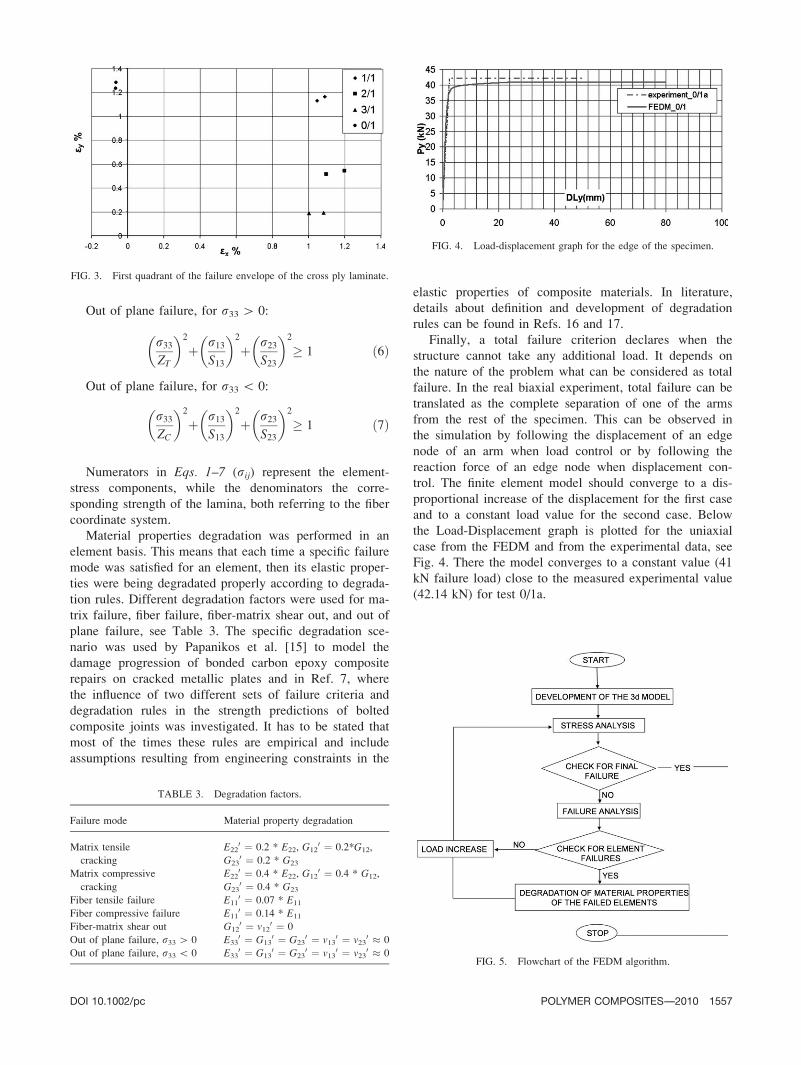
Fig. 3, presented is the first quadrant of the failure enve-
lope for the cross-ply cruciform laminate in strain space
from measurements coming from the geometrical centre
of the central section.
NUMERICAL PART
Progressive Damage Modeling
A three dimensional finite element model was devel-
oped using the commercial software Ansys to compare
with experimental observations and understand better the
different failure mechanisms. The model is using a pro-
gressive damage scenario. Progressive damage modeling
(PDM) technique has four basic steps, (i) stress analysis
of the structure, (ii) failure analysis in an element basis,
(iii) degradation of the properties of the failed elements,
and (iv) application of a total failure criterion. The proce-
dure stops when the total failure occurs, which physically
means that the structure cannot take any additional load.
In this study, and to simulate the testing of the cruciform
specimen, stress analysis was done by using Ansys solver.
For the failure analysis, different failure modes were con-
sidered, namely, matrix tensile and compressive cracking,
fiber tensile and compressive failure, fiber-matrix shear
out and out of plane failure. These failure modes repre-
sent basic failure modes of the composite materials. For
the detection of the failure modes, a set of 3D stress-
based polynomial failure criteria was used, Eq. 1–7. Thespecific set of failure criteria has been proposed in Refs.
7 and 15 in which it has been successfully used for ana-
lyzing failure of composite bolted joints subjected to ten-
sile loading.
Matrix tensile cracking, for r22 [ 0:
r22YT
� �2
þ r12S12
� �2
þ r23S23
� �2
� 1 ð1Þ
Matrix compressive cracking, for r22 \ 0:
r22YC
� �2
þ r12S12
� �2
þ r23S23
� �2
� 1 ð2Þ
Fiber tensile failure, for r11 [ 0:
r11XT
� �2
þ r12S12
� �2
þ r13S13
� �� 1 ð3Þ
Fiber compressive failure, for r11 \ 0:
r11XC
� �� 1 ð4Þ
Fiber-matrix shear out, for r11 \ 0:
r11XC
� �2
þ r12S12
� �2
þ r13S13
� �2
� 1 ð5Þ
TABLE 1. Elastic properties of the UD SE84 carbon lamina.
E1 (GPa) E2 (GPa) E3 (GPa) G12 (GPa) G23 (GPa) G13 (GPa) m12 m23 m13
Average 124.3 8.14 7.8 4.49 2.44 3.93 0.32 0.505 0.34
SD 4.4 0.1 0.12 0.07 0.21 0.1 0.02 0.005 0.025
TABLE 2. Strength of the UD SE84 carbon lamina.
XT (MPa) XC (MPa) YT (MPa) YC (MPa) ZT (MPa) ZC (MPa) S12 (MPa) S23 (MPa) S13 (MPa)
Average 2751 1180 25 162 42 165 106.9 35.21 97.87
SD 32 53 2.5 2 2.5 2.5 2.78 3.93 5.2
1556 POLYMER COMPOSITES—-2010 DOI 10.1002/pc
Out of plane failure, for r33 [ 0:
r33ZT
� �2
þ r13S13
� �2
þ r23S23
� �2
� 1 ð6Þ
Out of plane failure, for r33 \ 0:
r33ZC
� �2
þ r13S13
� �2
þ r23S23
� �2
� 1 ð7Þ
Numerators in Eqs. 1–7 (rij) represent the element-
stress components, while the denominators the corre-
sponding strength of the lamina, both referring to the fiber
coordinate system.
Material properties degradation was performed in an
element basis. This means that each time a specific failure
mode was satisfied for an element, then its elastic proper-
ties were being degradated properly according to degrada-
tion rules. Different degradation factors were used for ma-
trix failure, fiber failure, fiber-matrix shear out, and out of
plane failure, see Table 3. The specific degradation sce-
nario was used by Papanikos et al. [15] to model the
damage progression of bonded carbon epoxy composite
repairs on cracked metallic plates and in Ref. 7, where
the influence of two different sets of failure criteria and
degradation rules in the strength predictions of bolted
composite joints was investigated. It has to be stated that
most of the times these rules are empirical and include
assumptions resulting from engineering constraints in the
elastic properties of composite materials. In literature,
details about definition and development of degradation
rules can be found in Refs. 16 and 17.
Finally, a total failure criterion declares when the
structure cannot take any additional load. It depends on
the nature of the problem what can be considered as total
failure. In the real biaxial experiment, total failure can be
translated as the complete separation of one of the arms
from the rest of the specimen. This can be observed in
the simulation by following the displacement of an edge
node of an arm when load control or by following the
reaction force of an edge node when displacement con-
trol. The finite element model should converge to a dis-
proportional increase of the displacement for the first case
and to a constant load value for the second case. Below
the Load-Displacement graph is plotted for the uniaxial
case from the FEDM and from the experimental data, see
Fig. 4. There the model converges to a constant value (41
kN failure load) close to the measured experimental value
(42.14 kN) for test 0/1a.
FIG. 3. First quadrant of the failure envelope of the cross ply laminate.
TABLE 3. Degradation factors.
Failure mode Material property degradation
Matrix tensile
cracking
E220 ¼ 0.2 * E22, G12
0 ¼ 0.2*G12,
G230 ¼ 0.2 * G23
Matrix compressive
cracking
E220 ¼ 0.4 * E22, G12
0 ¼ 0.4 * G12,
G230 ¼ 0.4 * G23
Fiber tensile failure E110 ¼ 0.07 * E11
Fiber compressive failure E110 ¼ 0.14 * E11
Fiber-matrix shear out G120 ¼ v12
0 ¼ 0
Out of plane failure, r33 [ 0 E330 ¼ G13
0 ¼ G230 ¼ v13
0 ¼ v230 � 0
Out of plane failure, r33 \ 0 E330 ¼ G13
0 ¼ G230 ¼ v13
0 ¼ v230 � 0
FIG. 4. Load-displacement graph for the edge of the specimen.
FIG. 5. Flowchart of the FEDM algorithm.
DOI 10.1002/pc POLYMER COMPOSITES—-2010 1557

FIG. 6. Sixteen elements through thickness or one element/layer.
FIG. 7. Location of the damage initiation (white elements) for a cruciform specimen under Fx ¼ 6kN (Fx/Fy
¼ 2/1) obtained from the finite element model.
FIG. 8. Total failure locations from the experiments (below) and from the finite element damage model
(above) for the four loading ratios. [Color figure can be viewed in the online issue, which is available at
wileyonlinelibrary.com.]
TABLE 4. Total failure loads.
Experiments FEDMFEDM vs. Experiments
Biaxial ratio Failure Fx (kN) Failure Fy (kN) Failure Fx (kN) Failure Fy (kN) Variation (%)
1/1 a 42.10 42.16 43.00 43.00 2.09
1/1 b 40.50 40.71 43.00 43.00 5.81
2/1 a 44.41 22.21 42.00 21.00 5.75
2/1 b 42.35 21.17 42.00 21.00 0.82
3/1 a 37.78 12.59 40.00 13.33 5.54
3/1 b 37.57 12.52 40.00 13.33 6.08
0/1 a 0.00 42.14 0.00 41.00 2.77
0/1 b 0.00 42.40 0.00 41.00 3.41
1558 POLYMER COMPOSITES—-2010 DOI 10.1002/pc

Flowchart of the Model
A computer program has been created using Ansys
�FE code [18] to implement the progressive damagetechnique and simulate the mechanical testing of the cru-ciform specimen. The geometry of the specimen wasparametrically built, which allowed modifications of the
dimensions easily to be done. The program is explained
by the flowchart shown in Fig. 5 and involves the follow-
ing basic steps: (i) creation of the 3D model by giving as
input the material properties, the geometry of the exam-
ined configuration, the boundary conditions, the initial
load, and the load step, (ii) performing stress analysis
FIG. 9. A comparison between DIC measurements and the FEDM using the load-strain graphs for the four
loading cases.
FIG. 10. First principal strain field for the four load cases obtained by i) DICT (above) ii) FEDM (below).
[Color figure can be viewed in the online issue, which is available at wileyonlinelibrary.com.]
DOI 10.1002/pc POLYMER COMPOSITES—-2010 1559

using Ansys�solver to calculate the stresses, (iii) check
for final failure, (iv) performing failure analysis by apply-
ing the failure criteria, (v) check for element failures; if
no failure is predicted, the applied load is increased by a
pre-defined increment and the program returns to stress
analysis; if a mode of failure is predicted in an element
the program continues to the next step, (vi) degradation
of material properties of the failed element, and (vii)
increase load and return to stress analysis.
Cruciform Composite Geometry Modeling Using SolidElements
For the 3D modeling of the specimen, ‘‘solid46’’ ele-
ment type was selected [19]. Solid46 is an 8-node lay-
ered solid element, designed to model layered shells or
solids, with three degrees of freedom at each node:
translations in the nodal x, y, and z directions. For the
cruciform modeling through thickness, one element cor-
responds to one layer, see Fig. 6. A total number of
62,080 elements were used to achieve a converged solu-
tion. As biaxial experiments were performed by load
control of the machine and uniaxial by displacement
control of it, the application of the load in the model
was done by setting nodal forces in the arms of the cru-
ciform specimen in the first case and nodal displace-
ments in the second case.
COMPARISON BETWEEN FEDM ANDEXPERIMENTAL OBSERVATIONS
Damage Initiation and Total Failure Loads
For the four loading cases according to the FEDM,
failure initiated at an early loading stage. The value of
the necessary load in the main loading direction to initiate
damage mechanisms in the cruciform specimen was for
all the tested cases �14% of the total failure load. The
initial failure mode detected was matrix cracking of the
edge elements of the milled zone. In Fig. 7, the location
of the failed elements is presented for the loading case
Fx/Fy ¼ 2/1, there the edge elements of the top layer
(908) of the milled zone (5th and 12th layer), were failed
under Fx ¼ 6 kN.
Figure 8 presents a comparison between the total fail-
ure locations as captured from the experiments and the
one predicted from the simulations for the four different
load ratios. The damaged elements according to the
FEDM are presented in white. The locations where dam-
age was concentrated were the corners and the milled
zone of the specimen.
Finally, in Table 4 are compared the total failure
loads as measured from the load cells of the biaxial
machine with the output failure loads from the finite ele-
ment program. The variation of the results was from 2%
to 6%.
Strain Evolution of the Biaxially Loaded Zone
Figure 9 presents the load strain graphs from the four
loading cases, for both FEDM and DICT measurements,
from the centre of the specimen. Normal strain is plotted
for both directions (exx, eyy) and also the in-plane shear
strain exy is shown. For all the loading cases, the occur-
ring shear is negligible, and there is a good correlation
between measurements and the FEDM.
A quantitative and a qualitative comparison between
the first principal strain distribution coming from the
DIC measurements and the finite element program is
shown in Fig. 10. The data are plotted for 50% of the
total failure of each loading case. Strain concentrations
on the edge of the milled zone were observed, while the
distribution of the strain for all the loading cases for the
rest largest part of the biaxially loaded zone was
uniform.
CONCLUSION
The strain and the damage evolution of carbon epoxy
cross-ply specimens under biaxial loading conditions were
studied. A numerical simulation for the biaxial test was
developed and validated by experimental data coming
from digital image correlation measurements (DIC) and
failure loads measured from the load cells of the machine.
The finite element model with a progressive damage sce-
nario implemented showed good correlation with the ex-
perimental observations. Variation for the failure loads
coming from the FEDM and the experiments was between
2 and 6%. Moreover, there was a good match, quantita-
tive and qualitative, concerning the strain field of the cen-
tral biaxially loaded section.
From the analysis of the strain data, strain concentra-
tions on the edge of the milled zone were measured from
DICT and calculated from the finite element program.
Furthermore, undesirable premature damage outside the
biaxially loaded milled zone was observed, therefore, to
reduce these phenomena and further improve the accuracy
of the test, an optimization of the shape of the cruciform
specimen and a study of geometrical parameters such as
corner radius, thickness, and shape of the milled zone is
necessary. As objective function can be used, the uni-
formity of the central strain field and the concentration of
the damage in the central biaxially loaded section. The
3D model, which was presented in this article and proved
to produce reliable results, can be used as a simulation
tool of the experiment to evaluate the outputs of the opti-
mization method before manufacturing and testing real
specimens.
ACKNOWLEDGMENTS
The authors would like to acknowledge the financial
support for this research from the Fonds Wetenschappe-
1560 POLYMER COMPOSITES—-2010 DOI 10.1002/pc
lijk Onderzoek (FWO)—Vlaanderen, Belgium and also
thank Mr. Frans Boulpaep for technical support includ-
ing the manufacture and testing of the cruciform
specimens.
REFERENCES
1. M.J. Hinton, A.S. Kaddour, and P.D. Soden, ‘‘Failure Crite-ria in Fiber Reinforced Polymer Composites: The World-Wide Failure Exercise,’’ Elsevier (2004).
2. D. Van Hemelrijck, C. Ramault, A. Makris, E. Lamkanfi,
W. Van Paepegem, and D. Lecompte, Proc IME J MaterDes Appl., 222, 231 (2008).
3. A. Smits, D. Van Hemelrijck, T.P Philippidis, and A. Car-
don, Compos. Sci. Technol., 66, 964 (2006).
4. Y. Yu, M. Wan, and X.D. Wu, J. Mater. Process. Technol.,123, 67 (2002).
5. J.S. Welsh and D.F. Adams, Compos. A., 33, 829 (2002).
6. S-C. Chou, O. Orringer, and J.H. Rainey, J Compos. Mater.,11, 834, (1977).
7. K.I. Tserpes, G. Labeas, P. Papanikos, and Th. Kermanidis,
Compos. B., 33, 521 (2002).
8. K.I. Tserpes, P. Papanikos, and Th. Kermanidis, Fatigue.Fract. Eng. Mat. Struc., 24, 663 (2001).
9. J.P. Boehler, S. Demmerle, and S. Koss, Exp. Mech., 34, 1(1994).
10. J.S. Welsh and D.F. Adams, Exp. Mech., 40, 312 (2000).
11. A. Makinde, L. Thibodeau, and K.W. Neale, Exp. Mech.,32, 138 (1992).
12. C. Ramault, A. Makris, D. Van Hemelrijck, and E. Lam-
kanfi, W. Van Paepegem, in Proceedings of the 17th Inter-
national Conference on Composite Materials (ICCM17),
Edinburgh, Scotland, 132 (2009).
13. M.A Sutton, J.J Orteu, and H.W Schreier, ‘‘Image Correla-tion for Shape Motion and Deformation Measurements,’’ISBN 978-0-387-78746-6, Springer, (2009).
14. W. R Broughton and G.D Sims, ‘‘NPL Report DMM (A)148,’’ Middlesex, United Kingdom, National Physical Labo-
ratory, (1994).
15. P. Papanikos, K.I. Tserpes, G. Labeas, and Sp. Pantelakis,
Theoretic. Appl. Fract. Mech., 43, 189 (2005).
16. K.I. Tserpes, P. Papanikos, and Th. Kermanidis, Fatigue.Fract. Eng. Mat. Struc., 24, 663 (2001).
17. P.P. Camanho and F.L. Matthews, J. Compos. Mater., 33,906 (1999).
18. ‘‘ANSYS Users Manual, Version 6,’’ Swanson Analysis Sys-
tems, Inc, (2002).
19. R.L Taylor, P.J. Beresford, and E.L. Wilson, Int. J.Numeric. Methods. Eng., 10, 1211 (1976).
DOI 10.1002/pc POLYMER COMPOSITES—-2010 1561