Embed Size (px)
Citation preview

AN INVESTIGATION OF THE MATERIAL PROPERTIES OF LASER SINTERED
PARTS INCORPORATING CONFORMAL LATTICE STRUCTURE (CLSTM
)
TECHNOLOGY
A. L. Cooke1, C. E. Folgar
1, L. N. Folgar
1, J. Williams
1, S. Park
2, D. W. Rosen
2
13D Systems Corporation, Rock Hill, SC 29730
2School of Mechanical Engineering, Georgia Institute of Technology, Atlanta, GA 30332
Abstract
Cellular materials, including foams, honeycombs, lattices, and similar constructions, offer
the key advantages of high strength-to-weight ratios and favorable energy absorption
characteristics. The concept of designed cellular materials enables customized material
placement to best suit the demands of specific applications or achieve particular performance
targets. The design, generation, and fabrication of conformal lattice structures via laser sintering
are at the center of the disruptive manufacturing technologies proposed by 3D Systems
Corporation. The primary work reported here is the maturation and mechanical testing of the
conformal lattice structure technology developed between 3D Systems Corporation and the
Georgia Institute of Technology.
Introduction
Selective laser sintering (SLS1) is a form of additive manufacturing (AM), a layer-wise
fabrication technique that is increasingly being used to manufacture functional parts. The
commercially available materials used in the ploymer-based processes have been limited to
nylons. Direct part manufacturing of aerospace components is an application that requires the
use of engineered polymers with superior mechanical performance, intelligently engineered
structures, and advanced process controls with a combination of post processing techniques that
can enhance the ultimate performance of a given part.
Designed Cellular Materials
Figure 1 displays examples of cellular materials, which include foams, honeycombs,
lattices, and similar constructions. From a mechanical engineering viewpoint, a key advantage
offered by cellular materials is high strength accompanied by a relatively low mass. These
materials can also present good energy absorption characteristics (e.g. acoustic attenuation and
vibration damping), and when incorporated into designs for thermal applications they can
provide good thermal insulation [1]. The work presented here focuses on lattice structures.
Throughout the past two decades research pertaining to lattice materials has proliferated
due to their advantage of providing lighter, stronger, and stiffer materials than foams [2]. More
recently, conformal lattice structure (CLS2) technology has been introduced and detailed in
1 SLS
® is a registered trademark of 3D Systems Corporation.
2 CLS
TM is a trademark of 3D Systems Corporation.
908

various venues [3-5]. Figure 2 displays a graphic illustrating the difference between a uniform
lattice structure and a conformal lattice structure.
Figure 1: Examples of cellular materials: (a) foam [6], (b) honeycomb, and (c) lattice
Figure 2: Visual comparison between lattice structures: (a) uniform and (b) conformal
The concept of designed cellular materials is motivated by the desire to put material only
where it is needed for a specific application or for a specific target performance. As evidenced by
the image in Figure 2(b), the lattice structure in the conformal configuration corresponds to the
geometry’s surface and aligns to the load plane producing predictable testing and performance
behavior. 3D Systems Corporation and Georgia Institute of Technology have jointly developed a
technology that automates the creation of CLSes3 [7]. The schematic in Figure 3 provides a
flowchart depicting the creation and optimization of CLSes applied to solid models. After a part
is designed in a computer-aided design (CAD) software a plugin called TrussCreator is then used
to create lattice structure on selected surfaces or volumetric regions based on specified lattice
structure parameters, including unit cell size and type, orientation of lattice structure, and
tolerances on merging nodes and edges if they are close.
The creation of the initial lattice structures in the TrussCreator plugin serves as the first step in
an iterative process. For step two, the initial lattice is imported into a simulation package where
boundary conditions are configured and loads are applied in order to determine the selected
parameters’ adequacy. If the lattice structures fail in the simulations, then the two steps are
repeated until the resulting geometry is satisfactory. Then the final geometry returns to the CAD
software where it can be saved as a solid part file.
3 CLSes is used throughout this document as the plural form of CLS.
(a) (b) (c)
(a) (b)
909

Figure 3: Process of creating and optimizing CLSes
Mechanical Properties Testing
When analyzing the behavior of the latticed geometry in the second step of the iterative
process depicted in Figure 3, a very important assumption is made. That assumption is that the
material properties are independent of the final part’s build orientation. The goal of the work
presented here was to investigate the resulting properties of CLSes. To do this, sets of Nylon 12
test specimens were built and underwent a battery of ASTM testing. We wanted to evaluate the
properties of the individual struts making up the lattice structures as well as the properties of the
lattice structures formed by the individual struts.
Individual Struts
In order to evaluate the individual struts, structures (hereafter referred to as “peacocks”)
were designed to enable single struts to be built in specific orientations. Illustration of a single
strut and its arrangement with others to form the “peacock” are provided in Figure 4. The struts
were designed to be used as-built for tensile testing or simply altered to create the other
geometries necessary for different test methods. As built, the struts were connected to a sphere
by a rod less than 1 mm in diameter to enable easy removal. A total of 23 struts comprised each
“peacock” structure. Figure 5 illustrates the strut locations and the labeling schema that was
followed. A total of 60 “peacocks” were produced with struts of 1 mm, 2 mm, and 5 mm, for a
total of 1,380 struts. To reduce the expense of testing all 1,380 struts, 780 struts (13 per
“peacock”) were selected for testing at an outside facility. The battery of testing included those
for evaluating tensile, compressive, and flexural properties in accordance with applicable ASTM
standards. The struts tested are shown in Figure 5, and they are tabulated in Table 1.
Figure 4: Illustrations of (a) an individual strut and (b) the “peacock” structure.
CAD
Software Simulation
Software
TrussCreator
plugin
Step 1 Step 2
(a) (b)
Z
X
Y
910
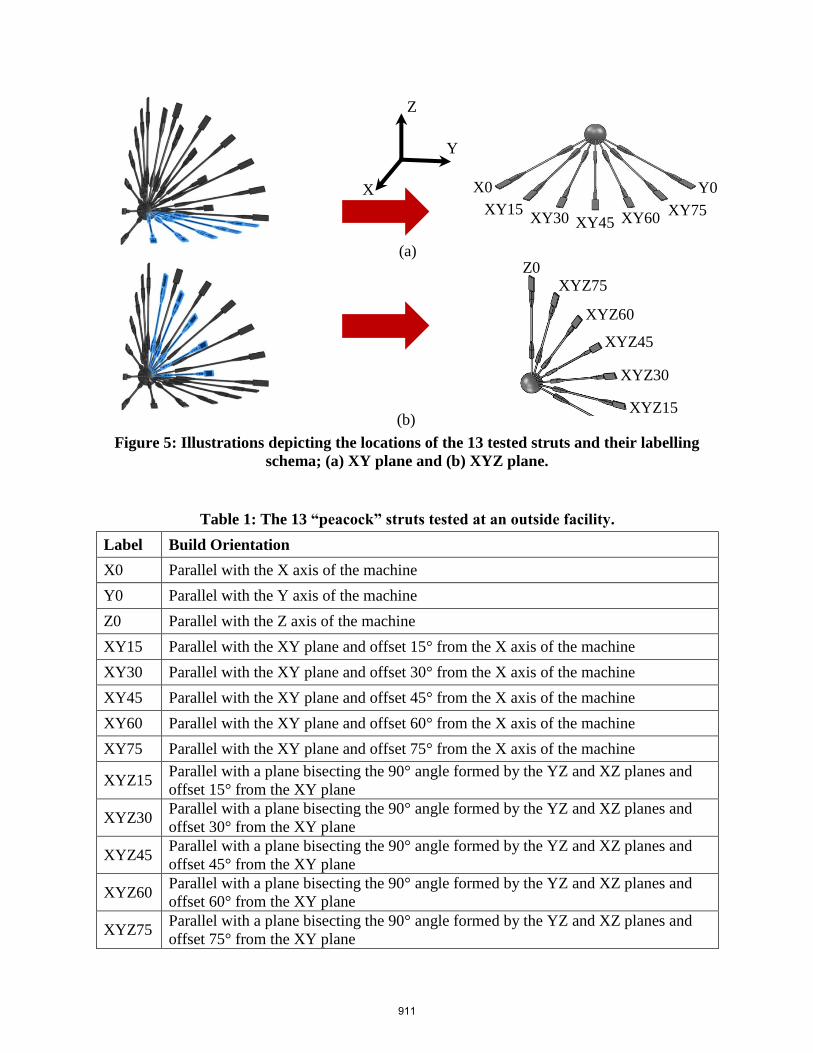
Figure 5: Illustrations depicting the locations of the 13 tested struts and their labelling
schema; (a) XY plane and (b) XYZ plane.
Table 1: The 13 “peacock” struts tested at an outside facility.
Label Build Orientation
X0 Parallel with the X axis of the machine
Y0 Parallel with the Y axis of the machine
Z0 Parallel with the Z axis of the machine
XY15 Parallel with the XY plane and offset 15° from the X axis of the machine
XY30 Parallel with the XY plane and offset 30° from the X axis of the machine
XY45 Parallel with the XY plane and offset 45° from the X axis of the machine
XY60 Parallel with the XY plane and offset 60° from the X axis of the machine
XY75 Parallel with the XY plane and offset 75° from the X axis of the machine
XYZ15 Parallel with a plane bisecting the 90° angle formed by the YZ and XZ planes and
offset 15° from the XY plane
XYZ30 Parallel with a plane bisecting the 90° angle formed by the YZ and XZ planes and
offset 30° from the XY plane
XYZ45 Parallel with a plane bisecting the 90° angle formed by the YZ and XZ planes and
offset 45° from the XY plane
XYZ60 Parallel with a plane bisecting the 90° angle formed by the YZ and XZ planes and
offset 60° from the XY plane
XYZ75 Parallel with a plane bisecting the 90° angle formed by the YZ and XZ planes and
offset 75° from the XY plane
(a)
(b)
X0
XY15 XY30 XY45 XY60
XY75
Y0
Z0 XYZ75
XYZ60
XYZ45
XYZ30
XYZ15
Z
X
Y
911

In ASTM D638 [8], tensile properties are determined by subjecting test specimens to an
increasing uniaxial tension, shown schematically in Figure 6. The geometry requirement for the
test specimens dictated no change in the as-built struts. Table 2 displays the yield strength values
determined from the tensile tests for each strut diameter. Figure 8 immediately follows and
displays plots of the values with respect to build orientations and strut diameters. Each data point
is the mean value of results from five tests, and the error bars represent one standard deviation.
Figure 6: Tensile test schematic (shown horizontally).
Table 2: ASTM D638 tensile testing results for the 1 mm, 2 mm, and 5 mm struts.
Label Strength at Yield
1 mm Struts 2 mm Struts 5 mm Struts
MPa MPa MPa
X0 23.4 31.6 52.5
Y0 24.2 31.1 46.2
Z0 30.4 43.1 44.5
XY15 26.1 30.4 46.4
XY30 26.5 30.7 45.9
XY45 29.4 31.4 45.6
XY60 26.9 34.4 45.7
XY75 25.9 34.7 45.7
XYZ15 29.5 33.1 44.6
XYZ30 30.3 32.6 44.4
XYZ45 30.6 32.3 45.0
XYZ60 31.3 32.8 44.8
XYZ75 31.8 41.1 44.6
Tensile
Force
912
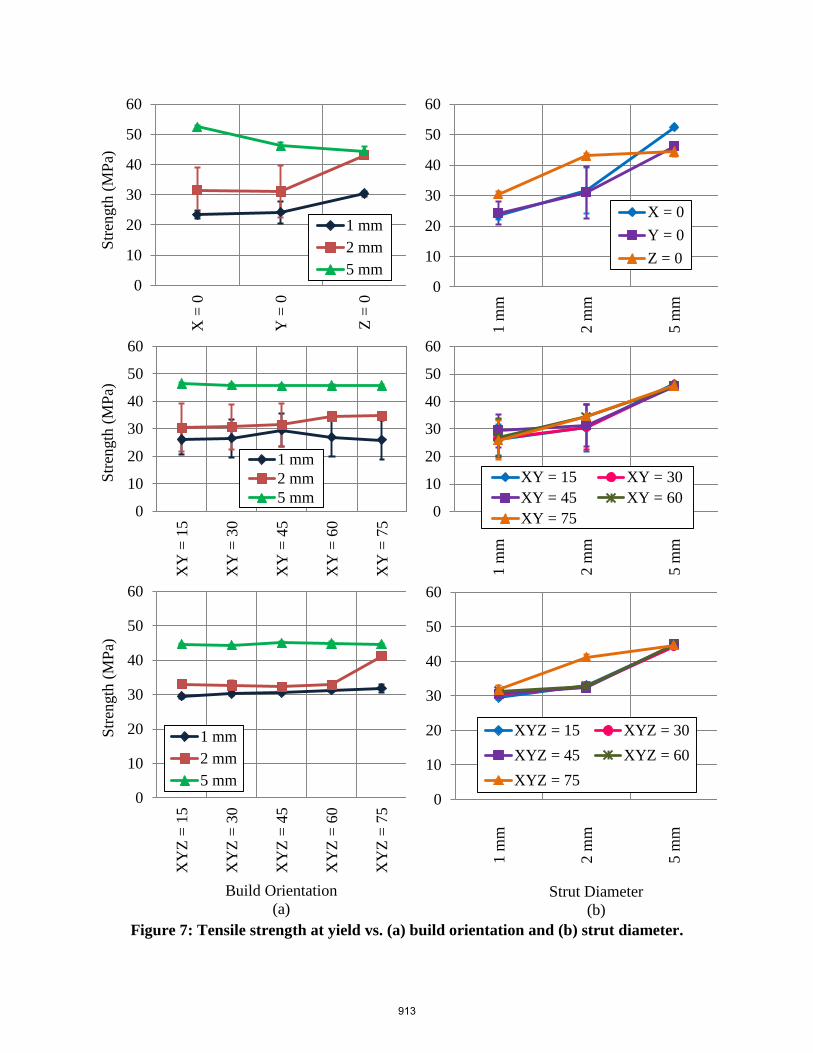
Figure 7: Tensile strength at yield vs. (a) build orientation and (b) strut diameter.
0
10
20
30
40
50
60
X =
0
Y =
0
Z =
0
Str
ength
(M
Pa)
1 mm
2 mm
5 mm0
10
20
30
40
50
60
1 m
m
2 m
m
5 m
m
X = 0
Y = 0
Z = 0
0
10
20
30
40
50
60
XY
= 1
5
XY
= 3
0
XY
= 4
5
XY
= 6
0
XY
= 7
5
Str
ength
(M
Pa)
1 mm
2 mm
5 mm0
10
20
30
40
50
60
1 m
m
2 m
m
5 m
m
XY = 15 XY = 30
XY = 45 XY = 60
XY = 75
0
10
20
30
40
50
60
XY
Z =
15
XY
Z =
30
XY
Z =
45
XY
Z =
60
XY
Z =
75
Str
ength
(M
Pa)
Build Orientation
(a)
1 mm
2 mm
5 mm
0
10
20
30
40
50
60
1 m
m
2 m
m
5 m
m
Strut Diameter
(b)
XYZ = 15 XYZ = 30
XYZ = 45 XYZ = 60
XYZ = 75
913
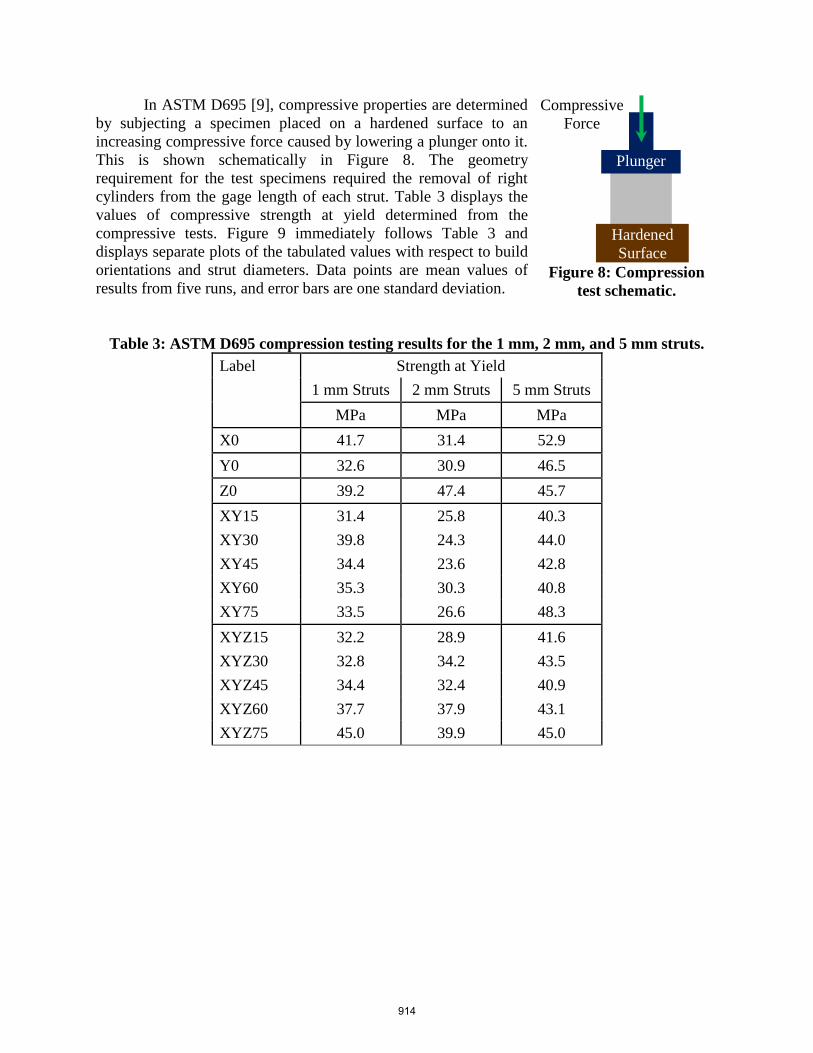
In ASTM D695 [9], compressive properties are determined
by subjecting a specimen placed on a hardened surface to an
increasing compressive force caused by lowering a plunger onto it.
This is shown schematically in Figure 8. The geometry
requirement for the test specimens required the removal of right
cylinders from the gage length of each strut. Table 3 displays the
values of compressive strength at yield determined from the
compressive tests. Figure 9 immediately follows Table 3 and
displays separate plots of the tabulated values with respect to build
orientations and strut diameters. Data points are mean values of
results from five runs, and error bars are one standard deviation.
Table 3: ASTM D695 compression testing results for the 1 mm, 2 mm, and 5 mm struts.
Label Strength at Yield
1 mm Struts 2 mm Struts 5 mm Struts
MPa MPa MPa
X0 41.7 31.4 52.9
Y0 32.6 30.9 46.5
Z0 39.2 47.4 45.7
XY15 31.4 25.8 40.3
XY30 39.8 24.3 44.0
XY45 34.4 23.6 42.8
XY60 35.3 30.3 40.8
XY75 33.5 26.6 48.3
XYZ15 32.2 28.9 41.6
XYZ30 32.8 34.2 43.5
XYZ45 34.4 32.4 40.9
XYZ60 37.7 37.9 43.1
XYZ75 45.0 39.9 45.0
Compressive
Force
Hardened
Surface
Plunger
Figure 8: Compression
test schematic.
914

Figure 9: Compression strength at yield vs. (a) build orientation and (b) strut diameter.
0
10
20
30
40
50
60
X =
0
Y =
0
Z =
0
Str
ength
(M
Pa)
1 mm
2 mm
5 mm
0
10
20
30
40
50
60
1 mm 2 mm 5 mm
X = 0
Y = 0
Z = 0
0
10
20
30
40
50
60
XY
= 1
5
XY
= 3
0
XY
= 4
5
XY
= 6
0
XY
= 7
5
Str
ength
(M
Pa)
1 mm
2 mm
5 mm0
10
20
30
40
50
60
1 m
m
2 m
m
5 m
m
XY = 15 XY = 30
XY = 45 XY = 60
XY = 75
0
10
20
30
40
50
60
XY
Z =
15
XY
Z =
30
XY
Z =
45
XY
Z =
60
XY
Z =
75
Str
ength
(M
Pa)
Orientation
(a)
1 mm
2 mm
5 mm
0
10
20
30
40
50
60
1 m
m
2 m
m
5 m
m
Diameter
(b)
XYZ = 15 XYZ = 30
XYZ = 45 XYZ = 60
XYZ = 75
915
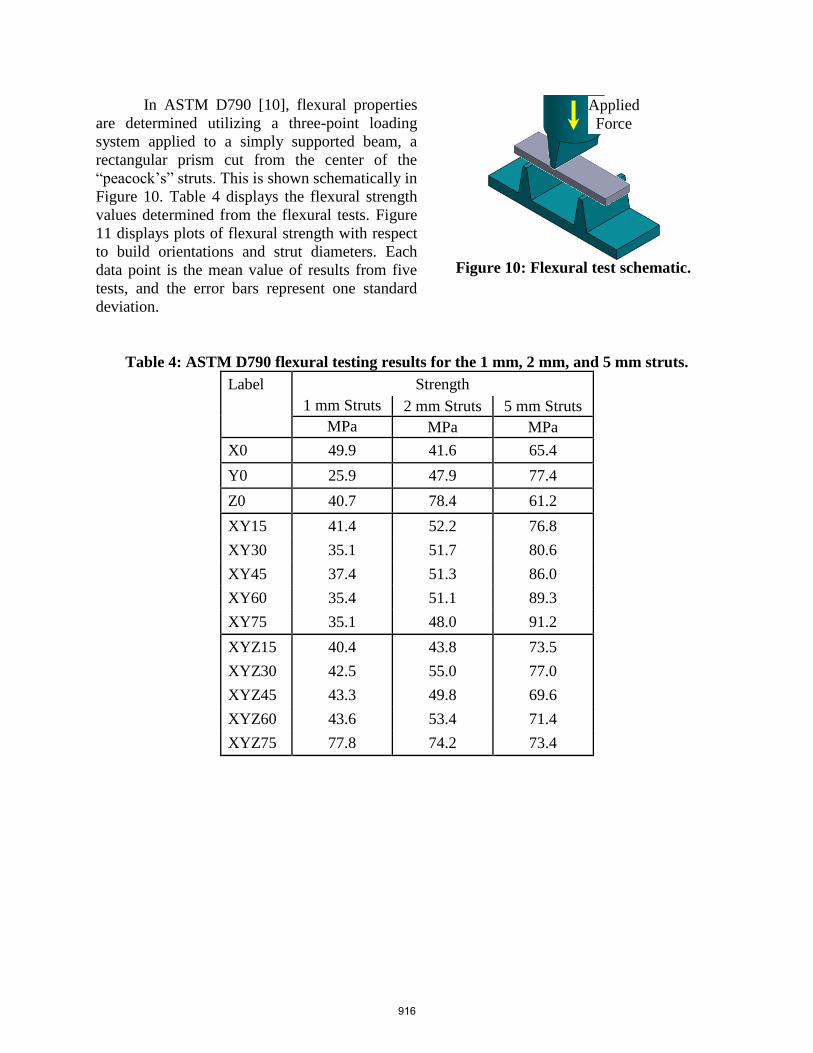
In ASTM D790 [10], flexural properties
are determined utilizing a three-point loading
system applied to a simply supported beam, a
rectangular prism cut from the center of the
“peacock’s” struts. This is shown schematically in
Figure 10. Table 4 displays the flexural strength
values determined from the flexural tests. Figure
11 displays plots of flexural strength with respect
to build orientations and strut diameters. Each
data point is the mean value of results from five
tests, and the error bars represent one standard
deviation.
Table 4: ASTM D790 flexural testing results for the 1 mm, 2 mm, and 5 mm struts.
Label Strength
1 mm Struts 2 mm Struts 5 mm Struts
MPa MPa MPa
X0 49.9 41.6 65.4
Y0 25.9 47.9 77.4
Z0 40.7 78.4 61.2
XY15 41.4 52.2 76.8
XY30 35.1 51.7 80.6
XY45 37.4 51.3 86.0
XY60 35.4 51.1 89.3
XY75 35.1 48.0 91.2
XYZ15 40.4 43.8 73.5
XYZ30 42.5 55.0 77.0
XYZ45 43.3 49.8 69.6
XYZ60 43.6 53.4 71.4
XYZ75 77.8 74.2 73.4
Applied
Force
Figure 10: Flexural test schematic.
916

Figure 11: Flexural strength vs. (a) build orientation and (b) strut diameter.
0
10
20
30
40
50
60
70
80
90
X =
0
Y =
0
Z =
0
Str
ength
(M
Pa)
1 mm
2 mm
5 mm0
10
20
30
40
50
60
70
80
90
1
mm 2
mm 5
mm
X = 0
Y = 0
Z = 0
0
10
20
30
40
50
60
70
80
90
100
XY
= 1
5
XY
= 3
0
XY
= 4
5
XY
= 6
0
XY
= 7
5
Str
ength
(M
Pa)
1 mm
2 mm
5 mm0
10
20
30
40
50
60
70
80
90
100
1 m
m
2 m
m
5 m
m
XY = 15 XY = 30
XY = 45 XY = 60
XY = 75
0
10
20
30
40
50
60
70
80
90
XY
Z =
15
XY
Z =
30
XY
Z =
45
XY
Z =
60
XY
Z =
75
Str
ength
(M
Pa)
Orientation
(a)
1 mm
2 mm
5 mm
0
10
20
30
40
50
60
70
80
90
1 m
m
2 m
m
5 m
m
Diameter
(b)
XYZ = 15 XYZ = 30
XYZ = 45 XYZ = 60
XYZ = 75
917
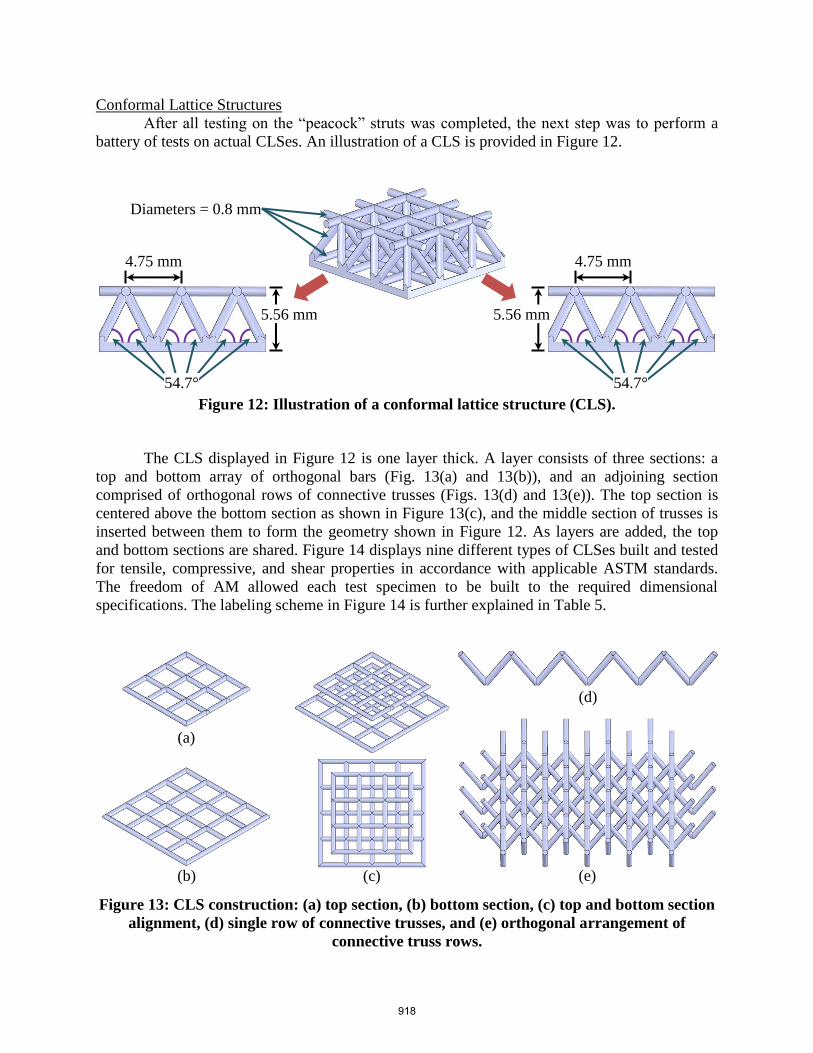
Conformal Lattice Structures
After all testing on the “peacock” struts was completed, the next step was to perform a
battery of tests on actual CLSes. An illustration of a CLS is provided in Figure 12.
Figure 12: Illustration of a conformal lattice structure (CLS).
The CLS displayed in Figure 12 is one layer thick. A layer consists of three sections: a
top and bottom array of orthogonal bars (Fig. 13(a) and 13(b)), and an adjoining section
comprised of orthogonal rows of connective trusses (Figs. 13(d) and 13(e)). The top section is
centered above the bottom section as shown in Figure 13(c), and the middle section of trusses is
inserted between them to form the geometry shown in Figure 12. As layers are added, the top
and bottom sections are shared. Figure 14 displays nine different types of CLSes built and tested
for tensile, compressive, and shear properties in accordance with applicable ASTM standards.
The freedom of AM allowed each test specimen to be built to the required dimensional
specifications. The labeling scheme in Figure 14 is further explained in Table 5.
Figure 13: CLS construction: (a) top section, (b) bottom section, (c) top and bottom section
alignment, (d) single row of connective trusses, and (e) orthogonal arrangement of
connective truss rows.
5.56 mm
4.75 mm
5.56 mm
4.75 mm
54.7° 54.7°
Diameters = 0.8 mm
(a)
(b) (c)
(d)
(e)
918

Figure 14: Nine CLS types built and tested for tensile, compressive, and shear properties.
Table 5: Descriptions of the nine types of CLSes tested.
Label Description
1L0S one layer and no skins*
1L1S one layer and one skin
1L2S one layer and two skins
3L0S three layers and no skins
3L1S three layers and one skin
3L2S three layers and two skins
5L0S five layers and no skins
5L1S five layers and one skin
5L2S five layers and two skins
*A skin is a solid sheet of material
that covers the top and/or bottom of
a CLS.
1L0S
3L0S
5L0S
1L1S
3L1S
5L1S
1L2S
3L2S
5L2S
L = Layer and S = Skin
919
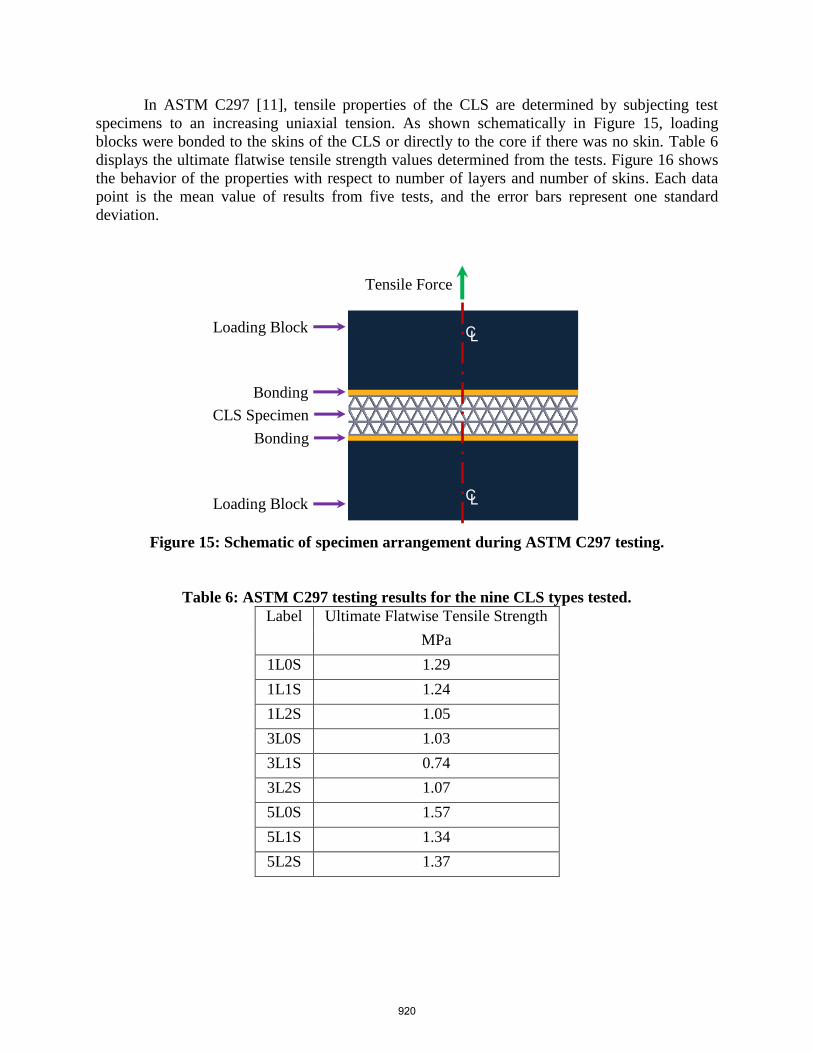
In ASTM C297 [11], tensile properties of the CLS are determined by subjecting test
specimens to an increasing uniaxial tension. As shown schematically in Figure 15, loading
blocks were bonded to the skins of the CLS or directly to the core if there was no skin. Table 6
displays the ultimate flatwise tensile strength values determined from the tests. Figure 16 shows
the behavior of the properties with respect to number of layers and number of skins. Each data
point is the mean value of results from five tests, and the error bars represent one standard
deviation.
Figure 15: Schematic of specimen arrangement during ASTM C297 testing.
Table 6: ASTM C297 testing results for the nine CLS types tested.
Label Ultimate Flatwise Tensile Strength
MPa
1L0S 1.29
1L1S 1.24
1L2S 1.05
3L0S 1.03
3L1S 0.74
3L2S 1.07
5L0S 1.57
5L1S 1.34
5L2S 1.37
Tensile Force
C L
Loading Block
Bonding
CLS Specimen
Bonding
Loading Block
C L
920
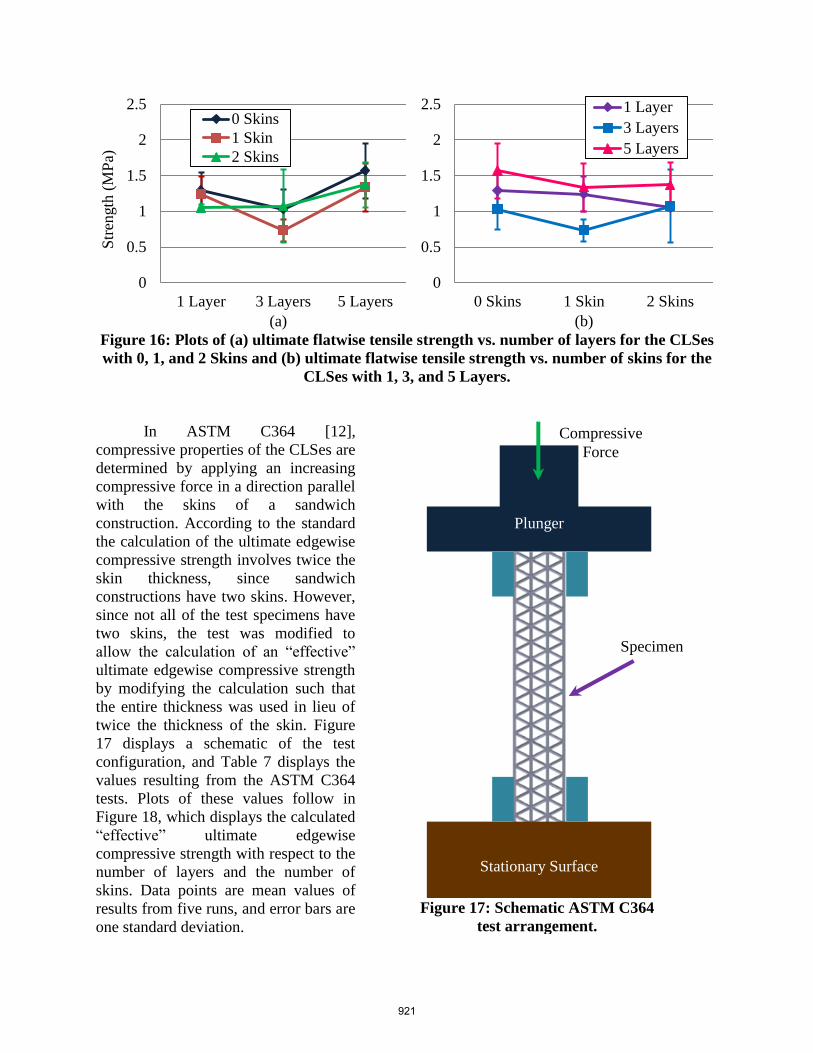
(a) (b)
Figure 16: Plots of (a) ultimate flatwise tensile strength vs. number of layers for the CLSes
with 0, 1, and 2 Skins and (b) ultimate flatwise tensile strength vs. number of skins for the
CLSes with 1, 3, and 5 Layers.
In ASTM C364 [12],
compressive properties of the CLSes are
determined by applying an increasing
compressive force in a direction parallel
with the skins of a sandwich
construction. According to the standard
the calculation of the ultimate edgewise
compressive strength involves twice the
skin thickness, since sandwich
constructions have two skins. However,
since not all of the test specimens have
two skins, the test was modified to
allow the calculation of an “effective”
ultimate edgewise compressive strength
by modifying the calculation such that
the entire thickness was used in lieu of
twice the thickness of the skin. Figure
17 displays a schematic of the test
configuration, and Table 7 displays the
values resulting from the ASTM C364
tests. Plots of these values follow in
Figure 18, which displays the calculated
“effective” ultimate edgewise
compressive strength with respect to the
number of layers and the number of
skins. Data points are mean values of
results from five runs, and error bars are
one standard deviation.
0
0.5
1
1.5
2
2.5
1 Layer 3 Layers 5 Layers
Str
ength
(M
Pa)
0 Skins
1 Skin
2 Skins
0
0.5
1
1.5
2
2.5
0 Skins 1 Skin 2 Skins
1 Layer
3 Layers
5 Layers
Compressive
Force
Stationary Surface
Plunger
Specimen
Figure 17: Schematic ASTM C364
test arrangement.
921
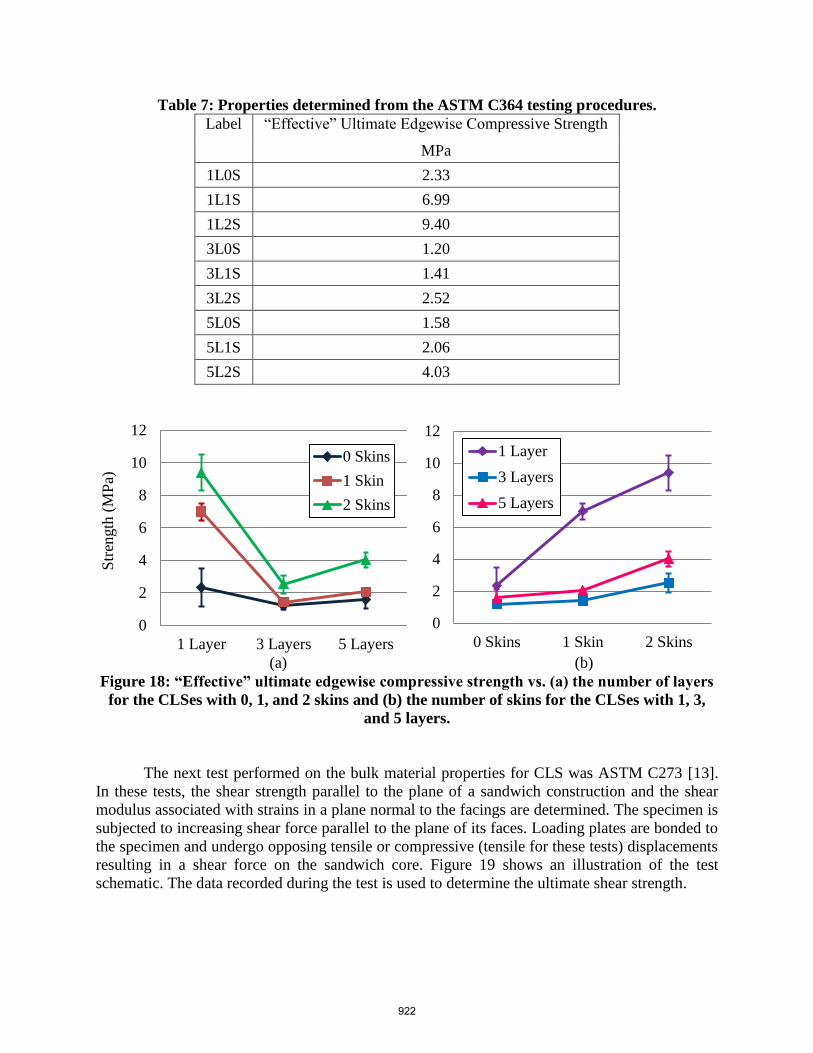
Table 7: Properties determined from the ASTM C364 testing procedures.
Label “Effective” Ultimate Edgewise Compressive Strength
MPa
1L0S 2.33
1L1S 6.99
1L2S 9.40
3L0S 1.20
3L1S 1.41
3L2S 2.52
5L0S 1.58
5L1S 2.06
5L2S 4.03
(a) (b)
Figure 18: “Effective” ultimate edgewise compressive strength vs. (a) the number of layers
for the CLSes with 0, 1, and 2 skins and (b) the number of skins for the CLSes with 1, 3,
and 5 layers.
The next test performed on the bulk material properties for CLS was ASTM C273 [13].
In these tests, the shear strength parallel to the plane of a sandwich construction and the shear
modulus associated with strains in a plane normal to the facings are determined. The specimen is
subjected to increasing shear force parallel to the plane of its faces. Loading plates are bonded to
the specimen and undergo opposing tensile or compressive (tensile for these tests) displacements
resulting in a shear force on the sandwich core. Figure 19 shows an illustration of the test
schematic. The data recorded during the test is used to determine the ultimate shear strength.
0
2
4
6
8
10
12
1 Layer 3 Layers 5 Layers
Str
ength
(M
Pa)
0 Skins
1 Skin
2 Skins
0
2
4
6
8
10
12
0 Skins 1 Skin 2 Skins
1 Layer
3 Layers
5 Layers
922

Table 8 displays the values resulting from
the ASTM C273 tests and plots of these
values follow. Figure 20 displays plots of
ultimate shear strength with respect to the
number of layers and the number of skins.
Each data point is the mean value of
results from five tests, and the error bars
represent one standard deviation.
Table 8: Property Values from the
ASTM C273 Testing Procedures.
Label Ultimate Shear Strength
MPa
1L0S 17.77
1L1S 15.64
1L2S 21.24
3L0S 3.68
3L1S 6.87
3L2S 6.23
5L0S 1.80
5L1S 2.47
5L2S 2.45
Tensile Force
Loading
Plates
Bonding
CLS
Specimen
Load Axis
Tensile Force
Figure 19: Schematic of ASTM C273 test setup.
923
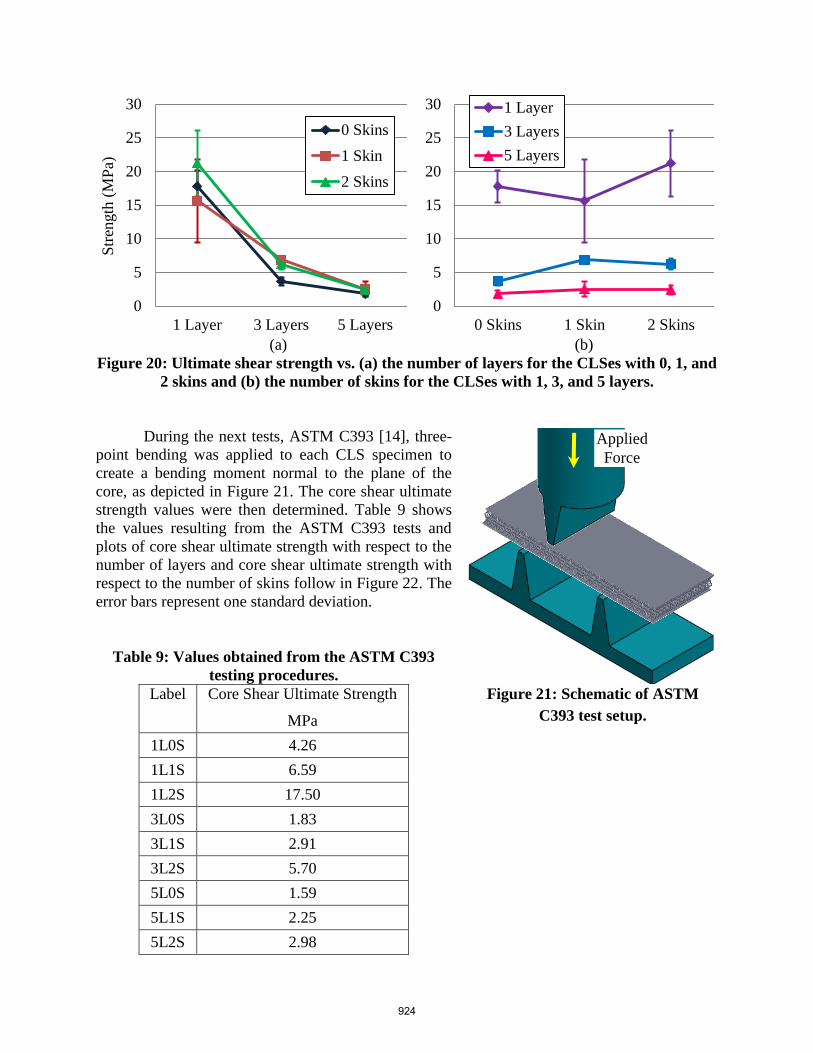
(a) (b)
Figure 20: Ultimate shear strength vs. (a) the number of layers for the CLSes with 0, 1, and
2 skins and (b) the number of skins for the CLSes with 1, 3, and 5 layers.
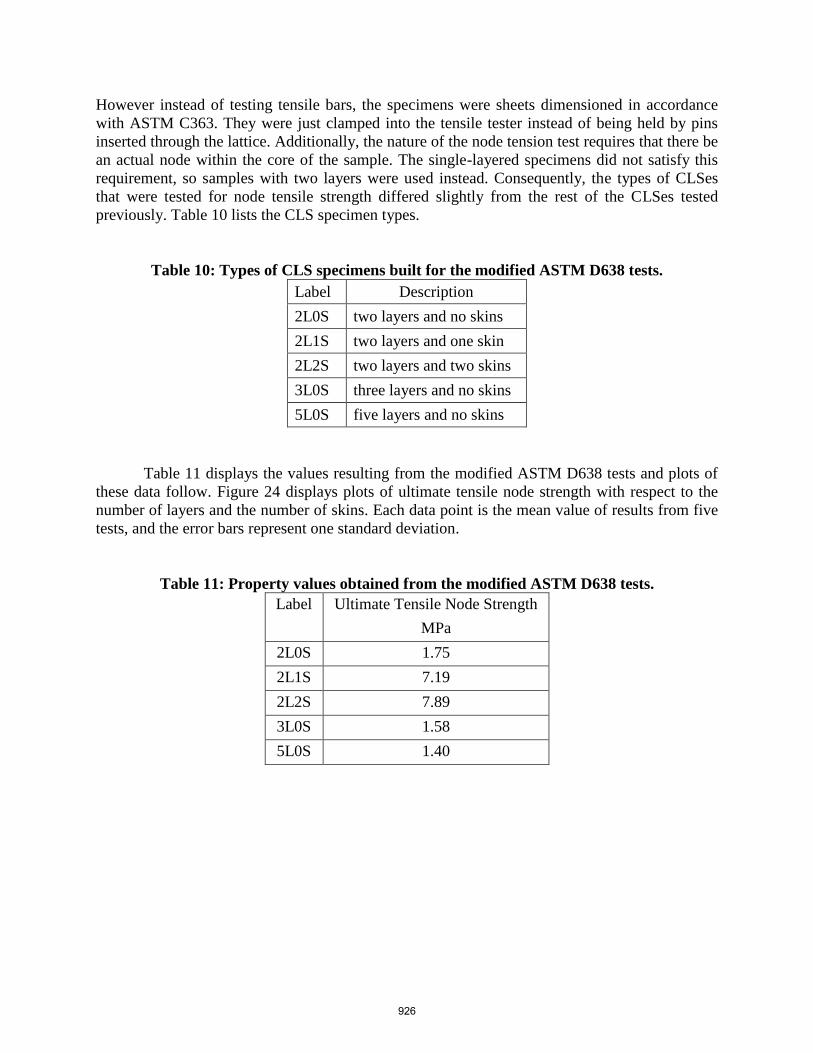
During the next tests, ASTM C393 [14], three-
point bending was applied to each CLS specimen to
create a bending moment normal to the plane of the
core, as depicted in Figure 21. The core shear ultimate
strength values were then determined. Table 9 shows
the values resulting from the ASTM C393 tests and
plots of core shear ultimate strength with respect to the
number of layers and core shear ultimate strength with
respect to the number of skins follow in Figure 22. The
error bars represent one standard deviation.
Table 9: Values obtained from the ASTM C393
testing procedures.
Label Core Shear Ultimate Strength
MPa
1L0S 4.26
1L1S 6.59
1L2S 17.50
3L0S 1.83
3L1S 2.91
3L2S 5.70
5L0S 1.59
5L1S 2.25
5L2S 2.98
0
5
10
15
20
25
30
1 Layer 3 Layers 5 Layers
Str
ength
(M
Pa)
0 Skins
1 Skin
2 Skins
0
5
10
15
20
25
30
0 Skins 1 Skin 2 Skins
1 Layer
3 Layers
5 Layers
Applied
Force
Figure 21: Schematic of ASTM
C393 test setup.
924

(a) (b)
Figure 22: Core shear ultimate strength vs. (a) the number of layers for the CLSes with 0,
1, and 2 Skins and (b) the number of skins for the CLSes with 1, 3, and 5 Layers.
The next set of tests performed on the
CLSes was ASTM C363 [15]. This standard
is followed to determine the tensile strength
of the node bond of a honeycomb core
material, which determines whether the
nodes of the honeycomb cores will remain
intact during cutting, machining, and forming
operations. A uniaxial tensile force parallel to
the plane of the honeycomb is applied
through pins that are placed through cell rows
at the top and bottom of the specimen. Figure
23 presents a schematic of the testing
arrangement with an example of a
honeycomb structure loaded into the fixture.
Obstacles had to be navigated to
allow determination of the tensile strength of
the node bonds of the CLSes. First,
performing the procedures outlined in ASTM
C363 on the CLSes was not possible for two
reasons: 1) the standard is designed for
structures with no skins, and the nature of our
investigation requires that some specimens
have one or two skins; and 2) the geometry of
the trusses in the core of the CLSes prevented
the insertion of pins. Therefore, a modified
version of ASTM D638 was employed. As
previously described, tensile properties are
determined in this test by subjecting
specimens to an increasing uniaxial tension.
0
5
10
15
20
1 Layer 3 Layers 5 Layers
Str
ength
(M
Pa)
0 Skins
1 Skin
2 Skins
0
5
10
15
20
0 Skins 1 Skin 2 Skins
1 Layer
3 Layers
5 Layers
Tensile Force
Figure 23: ASTM 363 Testing Arrangement.
925
However instead of testing tensile bars, the specimens were sheets dimensioned in accordance
with ASTM C363. They were just clamped into the tensile tester instead of being held by pins
inserted through the lattice. Additionally, the nature of the node tension test requires that there be
an actual node within the core of the sample. The single-layered specimens did not satisfy this
requirement, so samples with two layers were used instead. Consequently, the types of CLSes
that were tested for node tensile strength differed slightly from the rest of the CLSes tested
previously. Table 10 lists the CLS specimen types.
Table 10: Types of CLS specimens built for the modified ASTM D638 tests.
Label Description
2L0S two layers and no skins
2L1S two layers and one skin
2L2S two layers and two skins
3L0S three layers and no skins
5L0S five layers and no skins
Table 11 displays the values resulting from the modified ASTM D638 tests and plots of
these data follow. Figure 24 displays plots of ultimate tensile node strength with respect to the
number of layers and the number of skins. Each data point is the mean value of results from five
tests, and the error bars represent one standard deviation.
Table 11: Property values obtained from the modified ASTM D638 tests.
Label Ultimate Tensile Node Strength
MPa
2L0S 1.75
2L1S 7.19
2L2S 7.89
3L0S 1.58
5L0S 1.40
926

(a) (b)
Figure 24: Plots of ultimate tensile node strength vs. (a) the number of layers the CLSes
with 0, 1, and 2 Skins and (b) the number of skins for the CLSes with 2, 3, and 5 layers.
Discussion and Next Steps
A substantial amount of data has been presented in this paper. Some plots display trends
that are somewhat predictable. For instance, in Figure 7(a), higher tensile strengths are expected
from specimens with larger cross-sectional areas. Some plots display unexplainable phenomena,
such as the plots in Figure 9(b). The cause for the drops in the compressive strength of the 2 mm
struts from the values obtained during the 1 mm strut tests is unknown. Finally, some of the plots
display no clear trends.
Future work will involve two areas. First, correlations between single strut properties and
lattice structures need to be developed. Upon doing so, the resulting relationships could be
incorporated into the simulation software used during the iterative process used in creating a
CLS. Much data was captured by the outside testing facility, and a more comprehensive study of
the results will provide a broader understanding of causes and effects, which aid in finessing the
behavior predictions made by simulation software.
Next, regarding the bulk properties of the CLSes, there needs to be a comparison made to
the bulk properties of representative samples of solid, non-latticed material. This would help fill
the gap between having the capability to design CLSes and having knowledge of how to best
implement them into both existing designs and those yet to be imagined. To do this, an
experimental plan must be devised to identify those representative samples, and their properties
need to be determined.
Conclusions
To conclude, the work described here has presented the results of numerous ASTM tests
performed on single struts that together make a “peacock” structure as well as tests performed on
bulk CLS structures, both fabricated via SLS. Further studies will deliver more insight on
behavior trends. Another very important observation brought forth by this project is the need for
0
2
4
6
8
10
2 Layers 3 Layers 5 Layers
Str
ength
(M
Pa)
0 Skins
1 Skin
2 Skins
0
2
4
6
8
10
0 Skins 1 Skin 2 Skins
2 Layers
3 Layers
5 Layers
927
standards pertaining to lattice structures fabricated through additive manufacturing. It is evident
that the applicability of already existing ASTM standards varies case-by-case. As the use of CLS
technology increases, rigorous methods of testing representative geometries need to be in place.
Acknowledgements
The research presented here was funded through contract number FA8650-10-C-5705 by
the United States Air Force Research Laboratory with funding provided by the Defense-wide
Manufacturing Science and Technology Program through the Office of the Secretary of Defense,
Manufacturing and Industrial Base Policy.
References
[1] L. J. Gibson and M. F. Ashby, Cellular Solids: Structure and Properties, 1997, Cambridge
University Press, Cambridge, UK.
[2] M. F. Ashby, et al., Metal Foams: A Design Guide, 2000, Butterworth-Heinemann, Woburn,
MA.
[3] S. Engelbrecht, et al., Cellular Structures for Optimal Performance, Solid Freeform
Fabrication Symposium Proceedings, 2009, Austin, TX.
[4] J. Nguyen, et al., Conformal Lattice Structure Design and Fabrication, Solid Freeform
Fabrication Symposium Proceedings, 2012, Austin, TX.
[5] J. Nguyen, S.-I. Park and D. W. Rosen, Cellular structure design for lightweight components,
5th International Conference on Advanced Research and Rapid Prototyping Proceedings,
2011, Leiria, Portugal.
[6] O. Cansizoglu, et al., Properties of Ti-6Al-4V non-stochastic lattice structures fabricated via
electron beam melting, Materials Science and Engineering: A, 2008, 492(1-2), pp. 468-
474.
[7] A. L. Cooke, Selective Laser Sintering (SLS) of Next Gen Unmanned Air Vehicles (UAVs),
RAPID, 2013, Pittsburgh, PA.
[8] ASTM, D638 - 08 Standard Test Method for Tensile Properties of Plastics, 2008.
[9] ASTM, D695 - 10 Standard Test Method for Compressive Properties of Rigid Plastics, 2010.
[10] ASTM, D790 - 10 Standard Test Methods for Flexural Properties of Unreinforced and
Reinforced Plastics and Electrical Insulating Materials, 2010.
[11] ASTM, C297 / C297M - 04(2010) Standard Test Method for Flatwise Tensile Strength of
Sandwich Constructions, 2010.
[12] ASTM, C364 / C364M - 07(2012) Standard Test Method for Edgewise Compressive
Strength of Sandwich Constructions, 2012.
[13] ASTM, C273 / C273M - 11 Standard Test Method for Shear Properties of Sandwich Core
Materials, 2011.
[14] ASTM, C393 / C393M - 11e1 Standard Test Metod for Core Shear Properties of Sandwich
Constructions by Beam Flexure, 2011.
[15] ASTM, C363 / C363M - 09 Standard Test Method for Node Tensile Strength of Honeycomb
Core Materials, 2009.
928