Embed Size (px)
Citation preview
TECHNISCHE MECHANIK, Band 23, Heft 1, (2003), 1-9
Manuskripteingang: 30. Mai 2002
An Investigation of the Chip Segmentation Process Using FiniteElements
M. Baker
A finite element model of a two-dimensional orthogonal metal cutting process is used to simulate theformation of segmented chips. The deformation of the chip during segmentation is studied and thedistribution of deformation energy in chip and shear band is analyzed. It is shown that the plasticdeformation both in the shear band and the segment contribute significantly to the cutting force. Avariation of the thermal conductivity strongly affects the segmentation and indicates that segmentationis energetically favorable.
1 Introduction
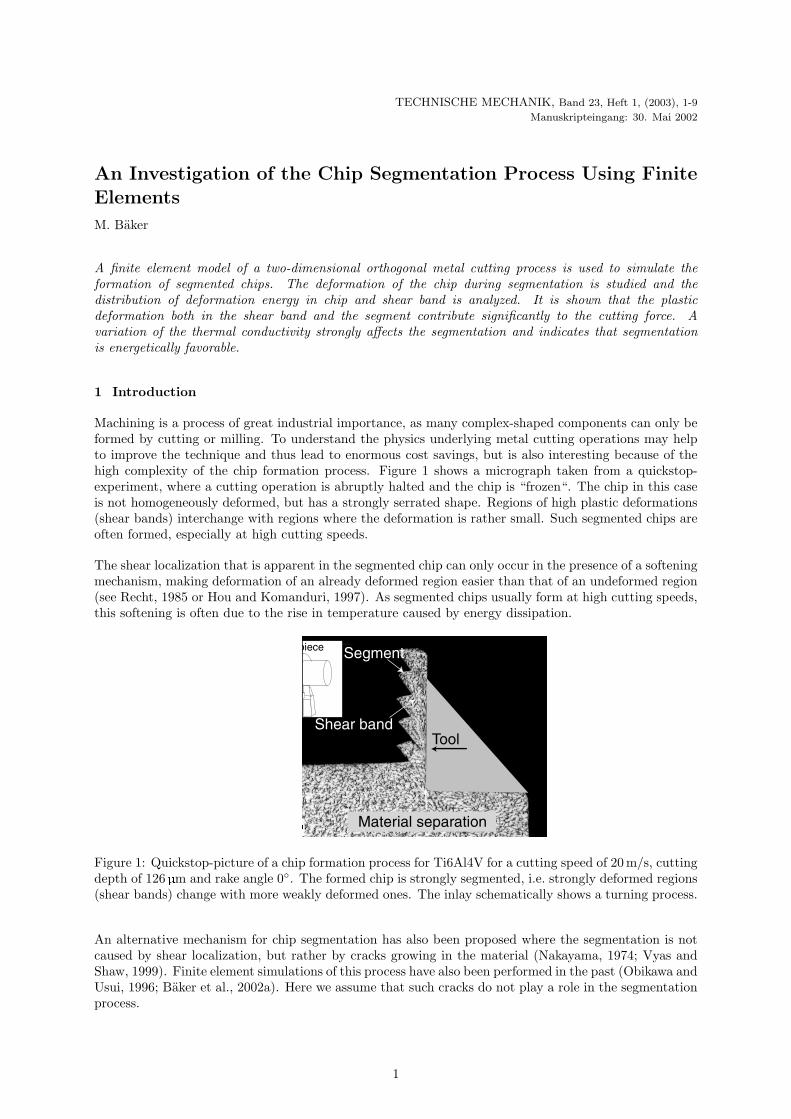
Machining is a process of great industrial importance, as many complex-shaped components can only beformed by cutting or milling. To understand the physics underlying metal cutting operations may helpto improve the technique and thus lead to enormous cost savings, but is also interesting because of thehigh complexity of the chip formation process. Figure 1 shows a micrograph taken from a quickstop-experiment, where a cutting operation is abruptly halted and the chip is “frozen“. The chip in this caseis not homogeneously deformed, but has a strongly serrated shape. Regions of high plastic deformations(shear bands) interchange with regions where the deformation is rather small. Such segmented chips areoften formed, especially at high cutting speeds.
The shear localization that is apparent in the segmented chip can only occur in the presence of a softeningmechanism, making deformation of an already deformed region easier than that of an undeformed region(see Recht, 1985 or Hou and Komanduri, 1997). As segmented chips usually form at high cutting speeds,this softening is often due to the rise in temperature caused by energy dissipation.
Figure 1: Quickstop-picture of a chip formation process for Ti6Al4V for a cutting speed of 20 m/s, cuttingdepth of 126 µm and rake angle 0◦. The formed chip is strongly segmented, i.e. strongly deformed regions(shear bands) change with more weakly deformed ones. The inlay schematically shows a turning process.
An alternative mechanism for chip segmentation has also been proposed where the segmentation is notcaused by shear localization, but rather by cracks growing in the material (Nakayama, 1974; Vyas andShaw, 1999). Finite element simulations of this process have also been performed in the past (Obikawa andUsui, 1996; Baker et al., 2002a). Here we assume that such cracks do not play a role in the segmentationprocess.
1
the workpiece material with the tool. This overlapping material is removed during the next remeshingstep and corresponds to a small strip of roughly 1 µm thickness in a simulation with a cutting depth of35 µm. This overlap leads to an artificial increase in the cutting force as the overlapping material has tobe strained by the tool. Some simulations have also been performed using a node separation technique,where material separation occurs along a predefined node separation line, when the nodes reach a criticaldistance from the tool tip. As material separation in this case occurs in front of the tool tip, the cuttingforce is underestimated. The calculated cutting forces for the node separation model were about 10%smaller in this case, showing that the influence of the separation technique is not too large. Furthermore,the deformation pattern of the chip did not differ significantly between the two models. For furtherdetails, the reader is again referred to Baker et al. (2002b).
2.2 Material Law
During high-speed metal cutting material deforms with extremely high plastic deformation rates. For thecase of Titanium alloys discussed here the deformation rate is of the order of 107 s−1 for a cutting speed of20m/s. High-speed deformation experiments, using, e.g., a split-Hopkinson-bar apparatus, can only reachstrain rates of the order of 104 s−1 and thus have to be extrapolated over several orders of magnitude.Furthermore, the total equivalent strain in the shear zone may reach values of 1000%. Split-Hopkinson-bar experiments, on the other hand, yield only reasonable results when the specimen is homogeneouslydeformed, which, in the case of the alloy Ti6Al4V, means an equivalent plastic strain smaller than 20%.Thus it is not possible to get material data in parameter regions where shear localization occurs. Thisdifficulty poses a severe problem for any finite element simulation of high-speed-cutting processes. Untilthe material behaviour during shear localization at high strain rates is better understood, no finite elementsimulation can be expected to yield quantitatively accurate results in the high-speed cutting regime.
Nevertheless, finite element simulations can give valuable insights into the details of the segmentationprocess, even if a simplified material law is assumed. It will be shown below that the greatest part of thecutting force is needed before shear localization begins, and that after localization starts, the segmentitself is not strongly deformed anymore. This means that the onset of the localization process and thedeformation inside the chip segments is not strongly influenced by the material behaviour during adiabaticshearing. The strength of the segmentation, however, which is determined by the deformation withinthe shear band, probably cannot be predicted reliably with such a model, and only comparisons withexperiments can show whether the overall deformation pattern is realistic or not.
For this study we assume that the plastic behaviour can be described by a simple isotropic v. Mises flowstress law (see HKS (1998b) for details on the mathematical formulation and the numerical implemen-tation of this law into the used finite element software). Similar approaches were used by Marusich andOrtiz (1995), Ng and Aspinwall (2000) and other groups. We use a material law for the alloy Ti6Al4Vdetermined by El-Magd and Treppmann (2001) in a modified form. The isothermal flow stress σ of thematerial is given by
σ(ε, ε, T ) = K(T ) · εn(T ) · (1 + C ln(ε/ε0)) (1)
where ε is the total equivalent plastic strain, ε is the strain rate, K and n are temperature-dependentmaterial parameters, and C and ε0 are constant.
The temperature dependence of the parameters has the form
K(T ) = K∗Ψ(T ) (2)n(T ) = n∗Ψ(T ) (3)
Ψ(T ) = exp(−
(T
TMT
)µ)(4)
K∗, n∗, TMT and µ are fitted from the experiments. This means that the flow stress is extrapolated overfour orders of magnitude in the strain rate and over nearly two orders of magnitude in the strain. Thusit is implicitly assumed that even during adiabatic shearing the plastic deformation can be described byeq. (1). Material parameters are given in Table 1.
The material law proposed by El-Magd and Treppmann (2001) uses a linear instead of a logarithmicstrain rate dependence. In this case the yield strength at high strain rates has extremely large values
3
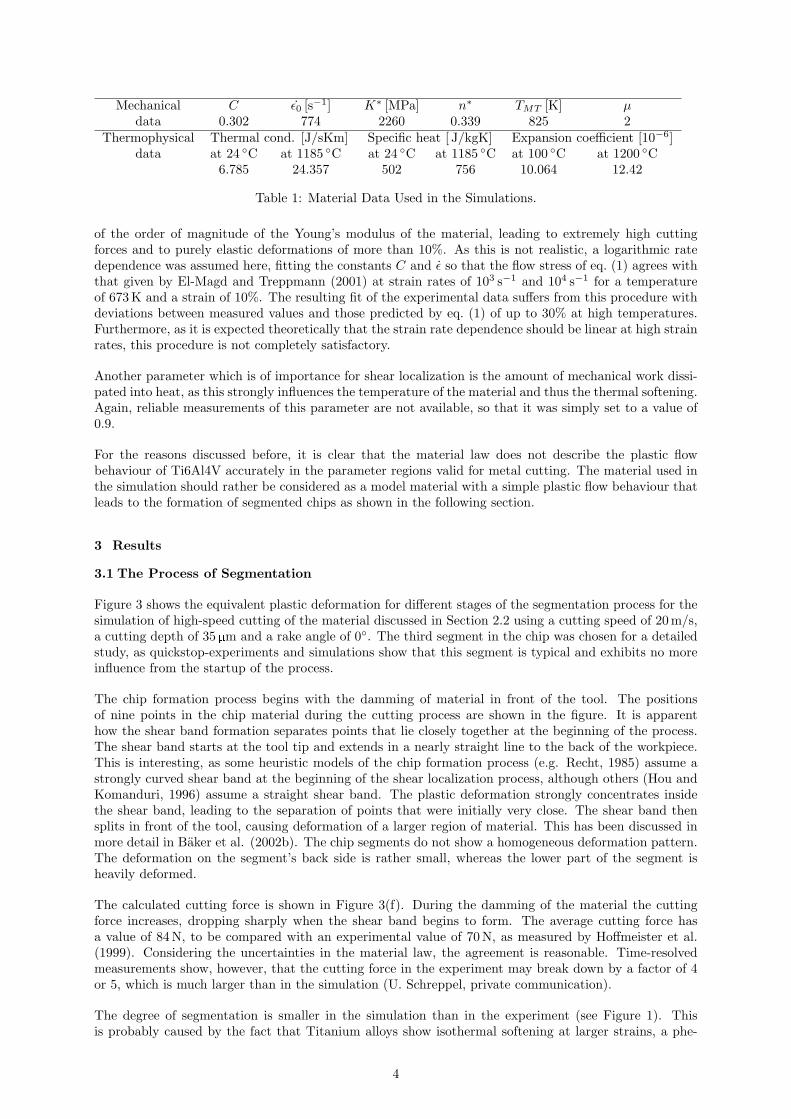
Mechanical C ε0 [s−1] K∗ [MPa] n∗ TMT [K] µdata 0.302 774 2260 0.339 825 2
Thermophysical Thermal cond. [J/sKm] Specific heat [ J/kgK] Expansion coefficient [10−6]data at 24 ◦C at 1185 ◦C at 24 ◦C at 1185 ◦C at 100 ◦C at 1200 ◦C
6.785 24.357 502 756 10.064 12.42
Table 1: Material Data Used in the Simulations.
of the order of magnitude of the Young’s modulus of the material, leading to extremely high cuttingforces and to purely elastic deformations of more than 10%. As this is not realistic, a logarithmic ratedependence was assumed here, fitting the constants C and ε so that the flow stress of eq. (1) agrees withthat given by El-Magd and Treppmann (2001) at strain rates of 103 s−1 and 104 s−1 for a temperatureof 673K and a strain of 10%. The resulting fit of the experimental data suffers from this procedure withdeviations between measured values and those predicted by eq. (1) of up to 30% at high temperatures.Furthermore, as it is expected theoretically that the strain rate dependence should be linear at high strainrates, this procedure is not completely satisfactory.
Another parameter which is of importance for shear localization is the amount of mechanical work dissi-pated into heat, as this strongly influences the temperature of the material and thus the thermal softening.Again, reliable measurements of this parameter are not available, so that it was simply set to a value of0.9.
For the reasons discussed before, it is clear that the material law does not describe the plastic flowbehaviour of Ti6Al4V accurately in the parameter regions valid for metal cutting. The material used inthe simulation should rather be considered as a model material with a simple plastic flow behaviour thatleads to the formation of segmented chips as shown in the following section.
3 Results
3.1 The Process of Segmentation
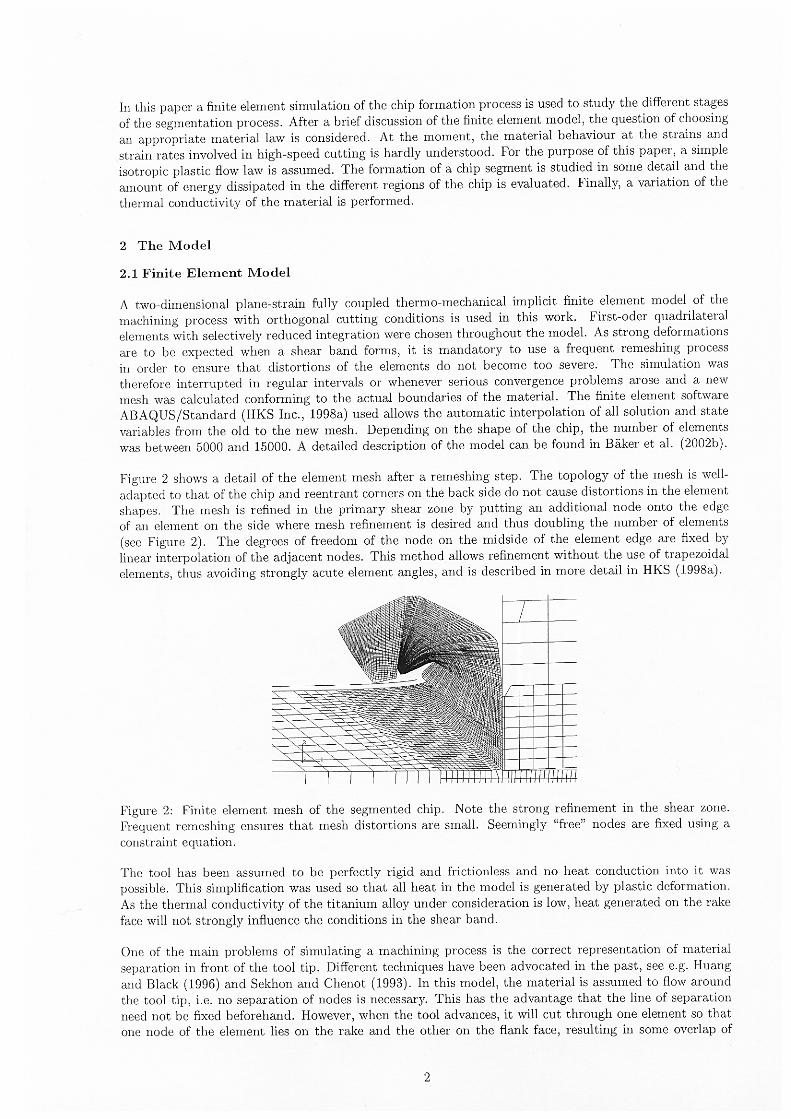
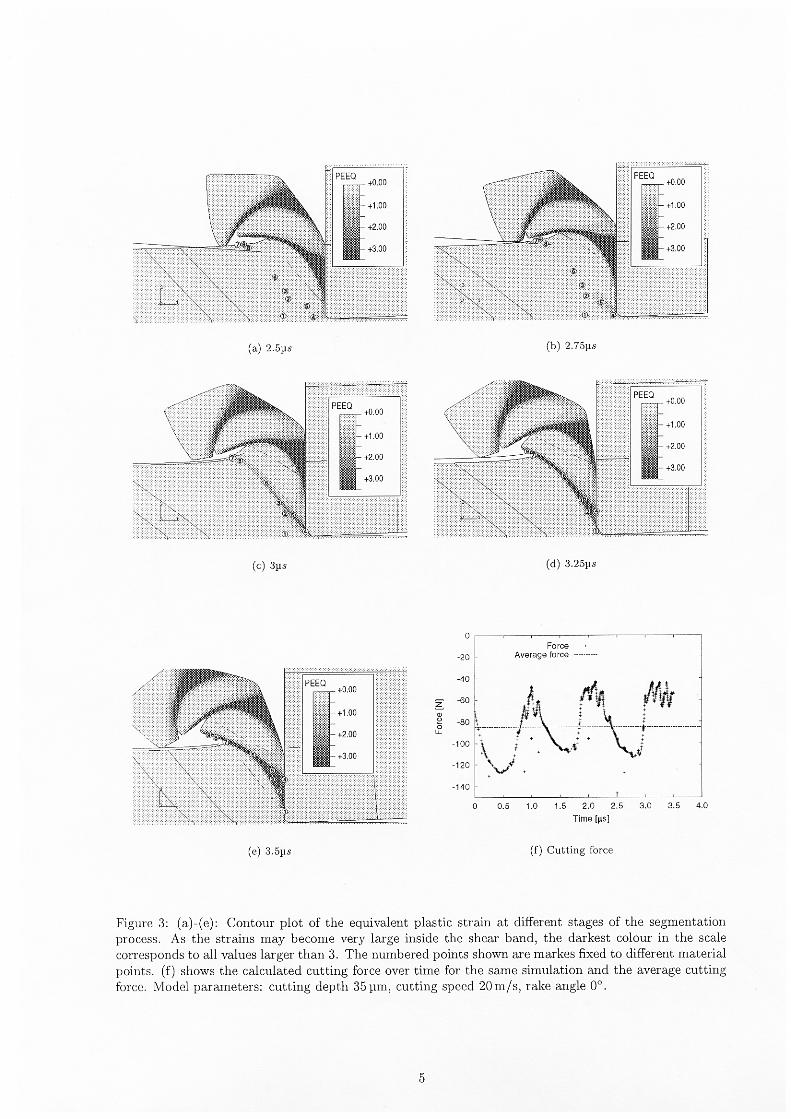
Figure 3 shows the equivalent plastic deformation for different stages of the segmentation process for thesimulation of high-speed cutting of the material discussed in Section 2.2 using a cutting speed of 20m/s,a cutting depth of 35 µm and a rake angle of 0◦. The third segment in the chip was chosen for a detailedstudy, as quickstop-experiments and simulations show that this segment is typical and exhibits no moreinfluence from the startup of the process.
The chip formation process begins with the damming of material in front of the tool. The positionsof nine points in the chip material during the cutting process are shown in the figure. It is apparenthow the shear band formation separates points that lie closely together at the beginning of the process.The shear band starts at the tool tip and extends in a nearly straight line to the back of the workpiece.This is interesting, as some heuristic models of the chip formation process (e.g. Recht, 1985) assume astrongly curved shear band at the beginning of the shear localization process, although others (Hou andKomanduri, 1996) assume a straight shear band. The plastic deformation strongly concentrates insidethe shear band, leading to the separation of points that were initially very close. The shear band thensplits in front of the tool, causing deformation of a larger region of material. This has been discussed inmore detail in Baker et al. (2002b). The chip segments do not show a homogeneous deformation pattern.The deformation on the segment’s back side is rather small, whereas the lower part of the segment isheavily deformed.
The calculated cutting force is shown in Figure 3(f). During the damming of the material the cuttingforce increases, dropping sharply when the shear band begins to form. The average cutting force hasa value of 84 N, to be compared with an experimental value of 70 N, as measured by Hoffmeister et al.(1999). Considering the uncertainties in the material law, the agreement is reasonable. Time-resolvedmeasurements show, however, that the cutting force in the experiment may break down by a factor of 4or 5, which is much larger than in the simulation (U. Schreppel, private communication).
The degree of segmentation is smaller in the simulation than in the experiment (see Figure 1). Thisis probably caused by the fact that Titanium alloys show isothermal softening at larger strains, a phe-
4
nomenon not covered by equation (1), and by the unknown material properties during adiabatic shearing,see Section 2.2. A further discrepancy is observed in the chip curvature, which is much stronger in thesimulation than in the experiment.
The discrepancies between simulation and experiment confirm that the material behaviour during adia-batic shearing is not correctly represented in the model. The global cutting force is not strongly influencedby this, as will be shown below, but its time-dependence and the degree of segmentation are. This againstresses the model character of the material law used for this study.
3.2 Energy Distribution
As dynamic forces and friction are neglected in this study, the total work done by the tool is used todeform the workpiece material. As the elastic strains are small, the work needed to elastically deform thematerial is neglected in the following considerations. Thus, all the stress-work is turned into dissipatedenergy during the deformation.
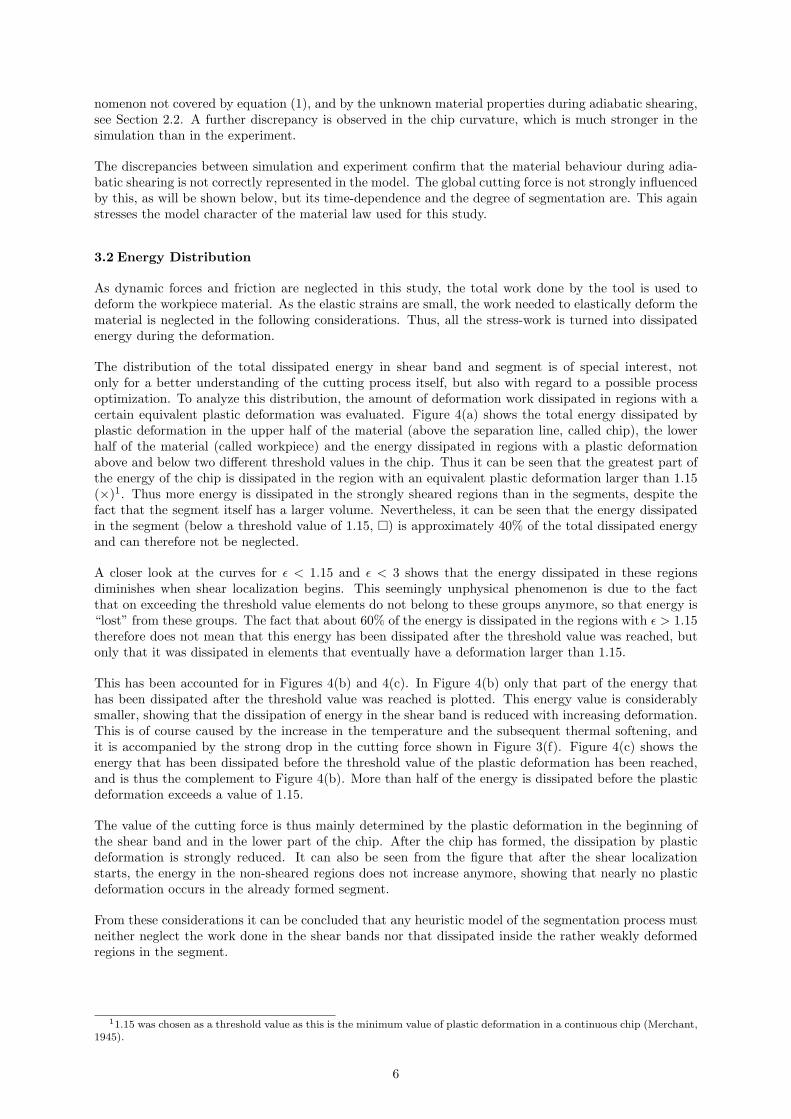
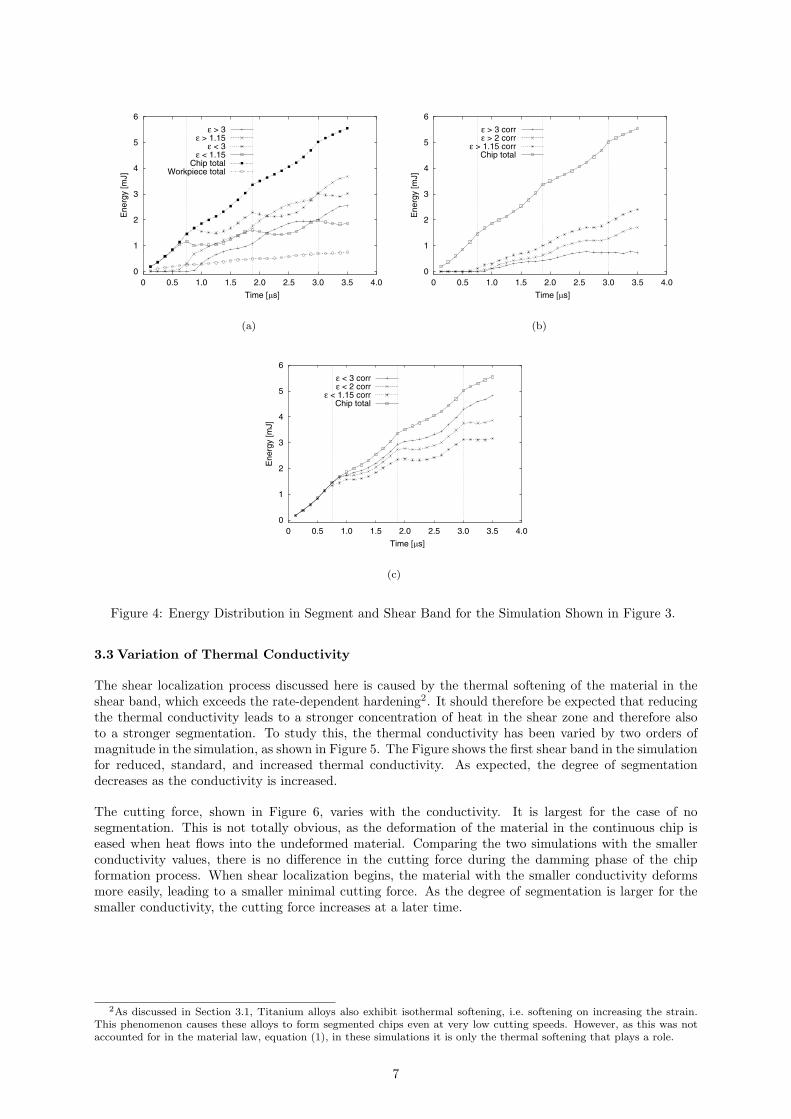
The distribution of the total dissipated energy in shear band and segment is of special interest, notonly for a better understanding of the cutting process itself, but also with regard to a possible processoptimization. To analyze this distribution, the amount of deformation work dissipated in regions with acertain equivalent plastic deformation was evaluated. Figure 4(a) shows the total energy dissipated byplastic deformation in the upper half of the material (above the separation line, called chip), the lowerhalf of the material (called workpiece) and the energy dissipated in regions with a plastic deformationabove and below two different threshold values in the chip. Thus it can be seen that the greatest part ofthe energy of the chip is dissipated in the region with an equivalent plastic deformation larger than 1.15(×)1. Thus more energy is dissipated in the strongly sheared regions than in the segments, despite thefact that the segment itself has a larger volume. Nevertheless, it can be seen that the energy dissipatedin the segment (below a threshold value of 1.15, ¤) is approximately 40% of the total dissipated energyand can therefore not be neglected.
A closer look at the curves for ε < 1.15 and ε < 3 shows that the energy dissipated in these regionsdiminishes when shear localization begins. This seemingly unphysical phenomenon is due to the factthat on exceeding the threshold value elements do not belong to these groups anymore, so that energy is“lost” from these groups. The fact that about 60% of the energy is dissipated in the regions with ε > 1.15therefore does not mean that this energy has been dissipated after the threshold value was reached, butonly that it was dissipated in elements that eventually have a deformation larger than 1.15.
This has been accounted for in Figures 4(b) and 4(c). In Figure 4(b) only that part of the energy thathas been dissipated after the threshold value was reached is plotted. This energy value is considerablysmaller, showing that the dissipation of energy in the shear band is reduced with increasing deformation.This is of course caused by the increase in the temperature and the subsequent thermal softening, andit is accompanied by the strong drop in the cutting force shown in Figure 3(f). Figure 4(c) shows theenergy that has been dissipated before the threshold value of the plastic deformation has been reached,and is thus the complement to Figure 4(b). More than half of the energy is dissipated before the plasticdeformation exceeds a value of 1.15.
The value of the cutting force is thus mainly determined by the plastic deformation in the beginning ofthe shear band and in the lower part of the chip. After the chip has formed, the dissipation by plasticdeformation is strongly reduced. It can also be seen from the figure that after the shear localizationstarts, the energy in the non-sheared regions does not increase anymore, showing that nearly no plasticdeformation occurs in the already formed segment.
From these considerations it can be concluded that any heuristic model of the segmentation process mustneither neglect the work done in the shear bands nor that dissipated inside the rather weakly deformedregions in the segment.
11.15 was chosen as a threshold value as this is the minimum value of plastic deformation in a continuous chip (Merchant,1945).
6
0
1
2
3
4
5
6
0 0.5 1.0 1.5 2.0 2.5 3.0 3.5 4.0
Ene
rgy
[mJ]
Time [ s]
ε > 3ε > 1.15
ε < 3ε < 1.15
Chip totalWorkpiece total
(a)
0
1
2
3
4
5
6
0 0.5 1.0 1.5 2.0 2.5 3.0 3.5 4.0
Ene
rgy
[mJ]
Time [ s]
ε > 3 corrε > 2 corr
ε > 1.15 corrChip total
(b)
0
1
2
3
4
5
6
0 0.5 1.0 1.5 2.0 2.5 3.0 3.5 4.0
Ene
rgy
[mJ]
Time [ s]
ε < 3 corrε < 2 corr
ε < 1.15 corrChip total
(c)
Figure 4: Energy Distribution in Segment and Shear Band for the Simulation Shown in Figure 3.
3.3 Variation of Thermal Conductivity
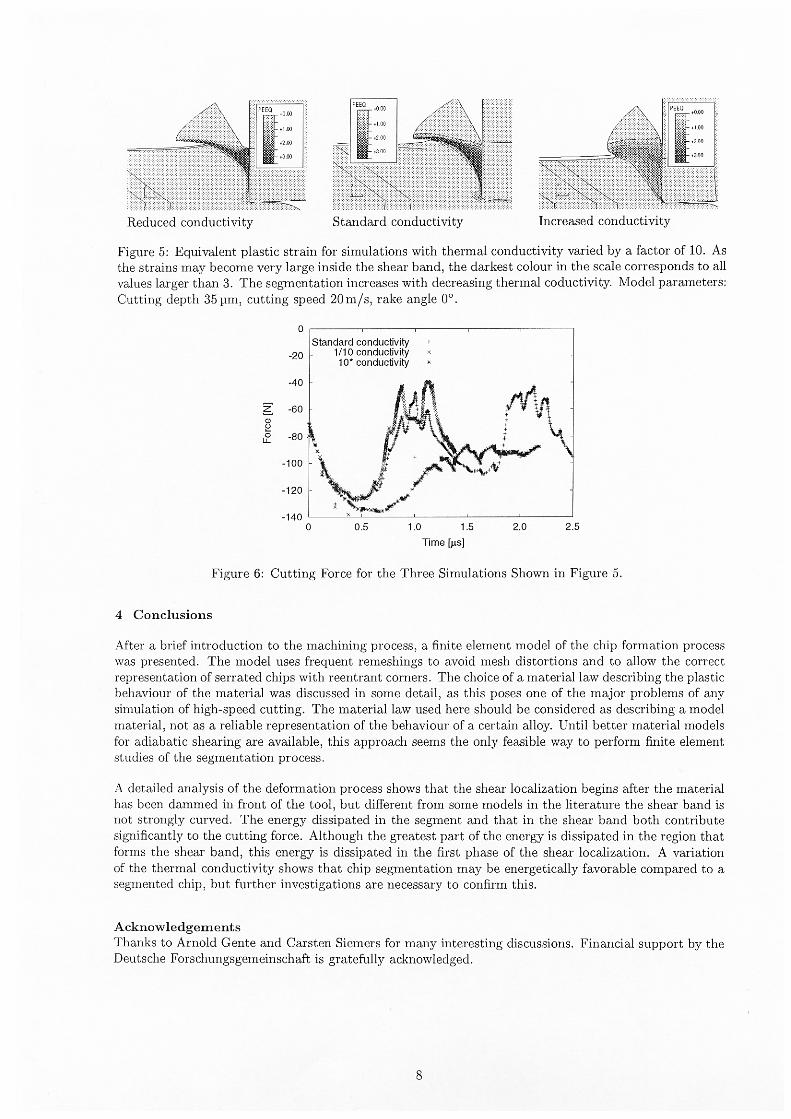
The shear localization process discussed here is caused by the thermal softening of the material in theshear band, which exceeds the rate-dependent hardening2. It should therefore be expected that reducingthe thermal conductivity leads to a stronger concentration of heat in the shear zone and therefore alsoto a stronger segmentation. To study this, the thermal conductivity has been varied by two orders ofmagnitude in the simulation, as shown in Figure 5. The Figure shows the first shear band in the simulationfor reduced, standard, and increased thermal conductivity. As expected, the degree of segmentationdecreases as the conductivity is increased.
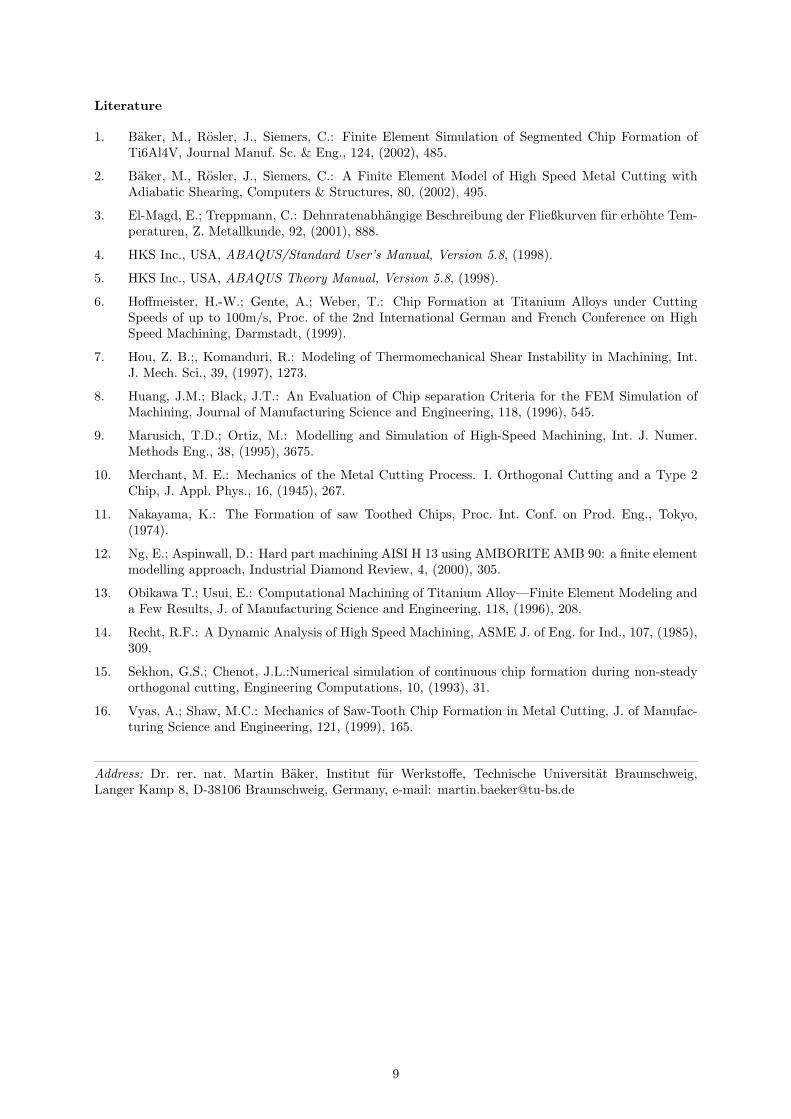
The cutting force, shown in Figure 6, varies with the conductivity. It is largest for the case of nosegmentation. This is not totally obvious, as the deformation of the material in the continuous chip iseased when heat flows into the undeformed material. Comparing the two simulations with the smallerconductivity values, there is no difference in the cutting force during the damming phase of the chipformation process. When shear localization begins, the material with the smaller conductivity deformsmore easily, leading to a smaller minimal cutting force. As the degree of segmentation is larger for thesmaller conductivity, the cutting force increases at a later time.
2As discussed in Section 3.1, Titanium alloys also exhibit isothermal softening, i.e. softening on increasing the strain.This phenomenon causes these alloys to form segmented chips even at very low cutting speeds. However, as this was notaccounted for in the material law, equation (1), in these simulations it is only the thermal softening that plays a role.
7
Literature
1. Baker, M., Rosler, J., Siemers, C.: Finite Element Simulation of Segmented Chip Formation ofTi6Al4V, Journal Manuf. Sc. & Eng., 124, (2002), 485.
2. Baker, M., Rosler, J., Siemers, C.: A Finite Element Model of High Speed Metal Cutting withAdiabatic Shearing, Computers & Structures, 80, (2002), 495.
3. El-Magd, E.; Treppmann, C.: Dehnratenabhangige Beschreibung der Fließkurven fur erhohte Tem-peraturen, Z. Metallkunde, 92, (2001), 888.
4. HKS Inc., USA, ABAQUS/Standard User’s Manual, Version 5.8, (1998).
5. HKS Inc., USA, ABAQUS Theory Manual, Version 5.8, (1998).
6. Hoffmeister, H.-W.; Gente, A.; Weber, T.: Chip Formation at Titanium Alloys under CuttingSpeeds of up to 100m/s, Proc. of the 2nd International German and French Conference on HighSpeed Machining, Darmstadt, (1999).
7. Hou, Z. B.;, Komanduri, R.: Modeling of Thermomechanical Shear Instability in Machining, Int.J. Mech. Sci., 39, (1997), 1273.
8. Huang, J.M.; Black, J.T.: An Evaluation of Chip separation Criteria for the FEM Simulation ofMachining, Journal of Manufacturing Science and Engineering, 118, (1996), 545.
9. Marusich, T.D.; Ortiz, M.: Modelling and Simulation of High-Speed Machining, Int. J. Numer.Methods Eng., 38, (1995), 3675.
10. Merchant, M. E.: Mechanics of the Metal Cutting Process. I. Orthogonal Cutting and a Type 2Chip, J. Appl. Phys., 16, (1945), 267.
11. Nakayama, K.: The Formation of saw Toothed Chips, Proc. Int. Conf. on Prod. Eng., Tokyo,(1974).
12. Ng, E.; Aspinwall, D.: Hard part machining AISI H 13 using AMBORITE AMB 90: a finite elementmodelling approach, Industrial Diamond Review, 4, (2000), 305.
13. Obikawa T.; Usui, E.: Computational Machining of Titanium Alloy—Finite Element Modeling anda Few Results, J. of Manufacturing Science and Engineering, 118, (1996), 208.
14. Recht, R.F.: A Dynamic Analysis of High Speed Machining, ASME J. of Eng. for Ind., 107, (1985),309.
15. Sekhon, G.S.; Chenot, J.L.:Numerical simulation of continuous chip formation during non-steadyorthogonal cutting, Engineering Computations, 10, (1993), 31.
16. Vyas, A.; Shaw, M.C.: Mechanics of Saw-Tooth Chip Formation in Metal Cutting, J. of Manufac-turing Science and Engineering, 121, (1999), 165.
Address: Dr. rer. nat. Martin Baker, Institut fur Werkstoffe, Technische Universitat Braunschweig,Langer Kamp 8, D-38106 Braunschweig, Germany, e-mail: [email protected]
9