Embed Size (px)
Citation preview

An Investigation of Biomarkers in
Laryngopharyngeal Reflux
Dr John M Wood
MBBS BSocSci(Hons) BA(Hons)
A Thesis Submitted for the Degree of
Master Of Surgery
Flinders University of South Australia January 2013
Flinders ENT, Department of Surgery Flinders Medical Centre, Bedford Park South Australia 5042

! ""!
TABLE OF CONTENTS Table of Contents......................................................................................... ii
Acknowledgments ...................................................................................... vi
Declaration ................................................................................................ viii
Preface ......................................................................................................... ix
List of Figures .............................................................................................. x
List of Tables.............................................................................................. xii
List of Abbreviations ................................................................................ xiii
Abstract ...................................................................................................... xv
1 Chapter 1: Introduction......................................................................... 1
1.1 Definition .....................................................................................................2
1.2 Epidemiology ..............................................................................................5
1.3 Anatomy of the Larynx ...............................................................................7
1.4 Extra-oesophageal Reflux: LPR ..............................................................15
1.4.1 Reflux Laryngitis ..................................................................................15
1.4.2 Globus Pharyngeus .............................................................................16
1.4.3 Dysphagia ............................................................................................17
1.4.4 Chronic Cough .....................................................................................18
1.5 Consequences ..........................................................................................19
1.6 Diagnosis...................................................................................................21
1.6.1 pH Monitoring.......................................................................................21
1.6.2 Reflux Symptom Index.........................................................................24

! """!
1.6.3 Reflux Finding Score............................................................................27
1.7 Pathogenesis of Reflux ............................................................................33
1.7.1 Damaging Agents ................................................................................33
1.8 Laryngeal Defences..................................................................................38
1.8.1 Gastroesophageal junction ..................................................................38
1.8.2 Oesophageal motor function and acid clearance.................................40
1.8.3 Upper oesophageal sphincter ..............................................................41
1.8.4 Mucosal Resistance.............................................................................41
1.9 Treatment options for LPR.......................................................................54
1.9.1 Lifestyle Factors...................................................................................54
1.9.2 Proton Pump Inhibitors ........................................................................55
1.9.3 Alginates ..............................................................................................58
1.9.4 Antidepressants ...................................................................................58
1.9.5 Surgical ................................................................................................59
1.10 Conclusions ............................................................................................62
1.11 Hypotheses..............................................................................................63
1.12 Aims .........................................................................................................64
2 Chapter 2: Methods............................................................................. 65
2.1 Patient Recruitment ..................................................................................66
2.2 Tissue Storage ..........................................................................................68
2.3 Patient Groups ..........................................................................................68
2.4 Histological Analysis................................................................................72
2.5 QIAzol RNA Extraction Protocol..............................................................72
2.5.1 Spectrophotometric Assessment of RNA Concentration .....................74
2.6 RNA Bioanalysis .......................................................................................74
2.7 Quantitative Real Time Reverse Transcription Polymerase Chain
Reaction Analysis..............................................................................................75
! "#!
2.7.1 cDNA Synthesis ...................................................................................75
2.7.2 RT2 SYBR Green Mastermix................................................................75
2.7.3 Polymerase Chain Reaction ................................................................76
2.8 Quantitative RT PCR Analysis .................................................................76
3 Chapter 3: Results............................................................................... 79
3.1 Demographics ...........................................................................................80
3.2 Histological Analysis................................................................................81
3.3 PCR Analysis ............................................................................................87
4 Chapter 4: Discussion ....................................................................... 113
4.1 Histopathology........................................................................................114
4.2 Cytokeratins 8 & 14 (KRT8 and 14) .......................................................115
4.3 Inflammatory Markers ............................................................................118
4.3.1 IL-6 and IL-8.......................................................................................118
4.3.2 PTGS2 ...............................................................................................121
4.3.3 MGMT ................................................................................................123
4.3.4 TGF!-1...............................................................................................124
4.3.5 VEGF-A..............................................................................................126
4.4 Laryngeal Defences................................................................................128
4.4.1 Mucins................................................................................................128
4.4.2 Carbonic Anhydrase III ......................................................................129
4.4.3 CRNN.................................................................................................131
4.4.4 CD1d..................................................................................................133
4.4.5 CDH1 (E-cadherin) ............................................................................134
4.5 Laryngeal Sub-sites................................................................................136
4.6 Limitations...............................................................................................139
4.7 Summary .................................................................................................144
4.8 Conclusions ............................................................................................145

! #!
5 Appendices ......................................................................................... 147
5.1 Appendix 1: Reflux Symptom Index......................................................148
5.2 Appendix 2: Reflux Finding Score ........................................................149
5.3 Appendix 3: Professor J Wilson’s Examiner’s Report........................150
5.4 Appendix 4: Response to Professor Wilson’s Report ........................162
5.5 Appendix 5: Mr G Rees’ Examiner’s Report.........................................169
5.6 Appendix 6: Response to Mr Rees’ Report ..........................................177
6 References.......................................................................................... 182

! #"!
ACKNOWLEDGMENTS The work described in this thesis was performed at Flinders ENT,
Department of Surgery, Flinders Medical Centre, Flinders University of
South Australia, Bedford Park, South Australia.
This research was supported by the following funding:
! Garnett Passe and Rodney Williams Memorial Foundation Project
Grant
! Flinders University Faculty of Health Sciences Research Seeding
Grant
I would like to express my sincere thanks to Prof Simon Carney as my thesis
supervisor, teacher and mentor. I greatly appreciate the support he has
provided in clinical and research fields, and in the successful application for
surgical training in Otolaryngology.
Many thanks to my co-supervisor Dr Damian Hussey, for his invaluable
assistance, steerage, his astute and critical analysis at all the landmark
moments, and for welcoming me into his laboratory.
! #""!
I greatly appreciate the support and friendship of Dr Charmaine Woods, from
Flinders ENT, Dept. of Surgery, whose guidance and patience in teaching
me laboratory techniques allowed this project to progress, and for keeping
each other sane in “The Dungeon”.
Many thanks for the work of Dr David Astill, Dept of Anatomical Pathology,
Flinders University in providing expert histological analysis, and to Michelle
Norman for preparing the histology.
To the staff of the Upper GI laboratory, many thanks for all your assistance.
And finally, to my wife Kate, and my children, Eleanor and Isaac, many
thanks for your lasting love, support and enduring my absences.
! #"""!
DECLARATION
I certify that this thesis does not incorporate without acknowledgment
any material previously submitted for a degree or diploma in any
university; and that to the best of my knowledge and belief it does not
contain any material previously published or written by another person
except where due reference is made in the text.
John Melville Wood January 2013
! "$!
PREFACE A portion of this work has been published or presented as follows: Publications Wood JM, Hussey DJ, Woods CM, Watson DI, Carney AS. Biomarkers and
laryngopharyngeal reflux. J Laryngol Otol 2011; 125: 1218-24
Presentations
Wood, JM, Hussey DJ, Woods CM, Astill D, Watson DI, Carney, AS. The
molecular biology of laryngopharyngeal reflux: Anatomical variations within
the larynx. Australian Society of Otolaryngology Head and Neck Surgery
Annual Scientific Meeting, 3rd April 2012, Adelaide, South Australia.
Wood JM, Hussey DJ, Woods CM, Watson DI, Carney AS. Review of
biomarkers in laryngopharyngeal reflux. Australian Society of Otolaryngology
Head and Neck Surgery Annual Scientific Meeting, 7th April 2011,
Melbourne, Victoria.

! $!
LIST OF FIGURES
Figure 1 Montreal Classification of Gastro-oesophageal Reflux Disease%%%%%%%%%&!
Figure 2 Laryngeal Compartments %%%%%%%%%%%%%%%%%%%%%%%%%%%%%%%%%%%%%%%%%%%%%%%%%%%%%%%%%%%%%%%%%%%%%%%%%%%%%%%%%%%%%%%%'!
Figure 3 Anatomy of the larynx. %%%%%%%%%%%%%%%%%%%%%%%%%%%%%%%%%%%%%%%%%%%%%%%%%%%%%%%%%%%%%%%%%%%%%%%%%%%%%%%%%%%%%%%%%%%()!
Figure 4 Histology of the Larynx %%%%%%%%%%%%%%%%%%%%%%%%%%%%%%%%%%%%%%%%%%%%%%%%%%%%%%%%%%%%%%%%%%%%%%%%%%%%%%%%%%%%%%%%%%(&!
Figure 5 Posterior Commissure Hypertrophy%%%%%%%%%%%%%%%%%%%%%%%%%%%%%%%%%%%%%%%%%%%%%%%%%%%%%%%%%%%%%%%%*'!
Figure 6 Laryngeal Pseudosulcus%%%%%%%%%%%%%%%%%%%%%%%%%%%%%%%%%%%%%%%%%%%%%%%%%%%%%%%%%%%%%%%%%%%%%%%%%%%%%%%%%%%%%%%+(!
Figure 7: Lindholm Laryngoscope%%%%%%%%%%%%%%%%%%%%%%%%%%%%%%%%%%%%%%%%%%%%%%%%%%%%%%%%%%%%%%%%%%%%%%%%%%%%%%%%%%%%%%%,'!
Figure 8: Microlaryngeal 2mm Cupped Forceps %%%%%%%%%%%%%%%%%%%%%%%%%%%%%%%%%%%%%%%%%%%%%%%%%%%%%%%%%-)!
Figure 9: Position of Biopsy Collection %%%%%%%%%%%%%%%%%%%%%%%%%%%%%%%%%%%%%%%%%%%%%%%%%%%%%%%%%%%%%%%%%%%%%%%%%%%%%-(!
Figure 10: Histology of all 4 regions in a Non-LPR patient %%%%%%%%%%%%%%%%%%%%%%%%%%%%%%%%%%%%./!
Figure 11: Histology of all 4 regions in an LPR Patient %%%%%%%%%%%%%%%%%%%%%%%%%%%%%%%%%%%%%%%%%%%.,!
Figure 12: HPRT Relative Expression %%%%%%%%%%%%%%%%%%%%%%%%%%%%%%%%%%%%%%%%%%%%%%%%%%%%%%%%%%%%%%%%%%%%%%%%%%%%%%'+!
Figure 13: KRT14 Relative Expression Normalised to HPRT %%%%%%%%%%%%%%%%%%%%%%%%%%%%%%'&!
Figure 14: KRT8 Relative Expression Normalised to HPRT %%%%%%%%%%%%%%%%%%%%%%%%%%%%%%%%%'/!
Figure 13: IL-6 Relative Expression Normalised to HPRT %%%%%%%%%%%%%%%%%%%%%%%%%%%%%%%%%%%%%',!
Figure 14: IL-8 Relative Expression Normalised to HPRT %%%%%%%%%%%%%%%%%%%%%%%%%%%%%%%%%%%%%'-!
Figure 15: PTSG2 Relative Expression Normalised to HPRT %%%%%%%%%%%%%%%%%%%%%%%%%%%%%'.!
Figure 18: CRNN Relative Expression Normalised to HPRT %%%%%%%%%%%%%%%%%%%%%%%%%%%%%%%''!
Figure 19: CD1d Relative Expression Normalised to HPRT %%%%%%%%%%%%%%%%%%%%%%%%%%%%%% ())!
Figure 20: MGMT Relative Expression Normalised to HPRT %%%%%%%%%%%%%%%%%%%%%%%%%%% ()(!
Figure 20: TGF!-1 Relative Expression Normalised to HPRT %%%%%%%%%%%%%%%%%%%%%%%%% ()*!

! $"!
Figure 21: VEGFA Relative Expression Normalised to HPRT%%%%%%%%%%%%%%%%%%%%%%%%%% ()+!
Figure 18: MUC1 Relative Expression Normalised to HPRT%%%%%%%%%%%%%%%%%%%%%%%%%%%%% ()&!
Figure 19: MUC2 Relative Expression Normalised to HPRT%%%%%%%%%%%%%%%%%%%%%%%%%%%%% ()/!
Figure 20: MUC3B Relative Expression Normalised to HPRT %%%%%%%%%%%%%%%%%%%%%%%%% (),!
Figure 21: MUC4 Relative Expression Normalised to HPRT%%%%%%%%%%%%%%%%%%%%%%%%%%%%% ()-!
Figure 22: MUC5B Relative Expression Normalised to HPRT %%%%%%%%%%%%%%%%%%%%%%%%% ().!
Figure 23: MUC6 Relative Expression Normalised to HPRT%%%%%%%%%%%%%%%%%%%%%%%%%%%%% ()'!
Figure 24: MUC7 Relative Expression Normalised to HPRT%%%%%%%%%%%%%%%%%%%%%%%%%%%%% (()!
Figure 26: CA3 Relative Expression Normalised to HPRT %%%%%%%%%%%%%%%%%%%%%%%%%%%%%%%%% (((!
Figure 31: CDH1 Expression Relative Expression Normalised to HPRT%%%% ((*!
! $""!
LIST OF TABLES
Table 1: Mucin Genes in the Aerodigestive Tract ....................................... 53
Table 2: PCR Array Genes ......................................................................... 78
Table 3: Demographics............................................................................... 82
Table 4: Histological Analysis ..................................................................... 83
Table 5: Histological Evidence of Inflammation .......................................... 84
Table 6: Statistical Analysis of HPRT Gene Expression............................ 88
Table 7: Gene Expression Statistical Analysis............................................ 92

! $"""!
LIST OF ABBREVIATIONS AOR Adjusted Odds Ratio
CA Carbonic anhydrase
CD1d Cluster of Differentiation 1d
CDH1 Epithelial cadherin (E-cadherin)
cDNA Complementary DNA
CRNN Cornulin (Squamous epithelial-induced stress protein 53kDa
(SEP 53)
DIS Dilation of intercellular spaces
DNA Deoxyribonucleic acid
DGER Duodenogastroesophageal reflux
GORD Gastroesophageal reflux disease
H and E Haematoxylin and eosin
HPRT Hypoxanthine-guanine phosphoribosyltransferase
IL Interleukin
KRT Cytokeratin
LMA Laryngeal mask airway
LOS Lower oesophageal sphincter
LPR Laryngopharyngeal reflux
MGMT O-6-methylguanine-DNA methyltransferase
MHC Major histocompatibility complex
mRNA Messenger ribonucleic acid
MUC Mucin
NERD Non-erosive reflux disease
NKT Natural killer T cell
PCR Polymerase chain reaction
PPI Proton pump inhibitor
PTGS2 Prostaglandin-endoperoxide synthase-2
qtRT PCR Quantitative real time reverse transcriptase polymerase
chain reaction
RFS Reflux finding scale

! $"#!
RIN RNA integrity number
RSI Reflux symptom index
SSRI Selective serotonin re-uptake inhibitor
TNF-" Tumour necrosis factor - "
UOS Upper oesophageal sphincter
VEGF Vascular endothelial growth factor
VHI Voice Handicap Index
! $#!
ABSTRACT
Laryngopharyngeal reflux (LPR) is an increasingly diagnosed disease in
Otolaryngology, however it is a highly controversial topic. There is no gold
standard diagnostic test and despite a wealth of articles, there is little
understanding of the pathophysiological mechanisms underlying laryngeal
damage. In addition, the response to anti-reflux medical treatment is highly
variable, with a notable proportion failing to have any response. The lack of
comprehension of the pathophysiology and definitive diagnosis limits the
ability to conduct adequate investigation of treatment options. This study
aimed to identify known and novel biomarkers in patients with LPR. Given
evidence suggesting that LPR biomarker expression may vary across
different areas of the larynx, biopsies were collected and analysed from sub-
regions of the larynx.
Recruited patients completed the Reflux Symptom Index and the Reflux
Finding Score was assessed at the time of biopsy collection under general
anaesthetic. Biopsies were collected from 4 anatomically distinct locations
in the larynx in both LPR and non-refluxing control patients. Sections were
sent for histological examination and qRT-PCR analysis was conducted on
20 genes identified as being related to reflux and inflammation, including
interleukins 6 (IL-6) and 8 (IL-8), prostaglandin-endoperoxide synthase-2,
cytokeratins 8 and 14, mucin genes MUC1, 2, 3B, 4, 5B, 6, 7, and carbonic
anhydrase III.
! $#"!
In patients with LPR, site-specific differences in gene expression were
noted. The medial arytenoid area of the larynx was more susceptible to
alterations in gene expression. Statistically significant differences were
noted in genes related to intrinsic defences and inflammation, including
CD1d, TGF!-1 and mucins.
Mucins play an important role in protecting the epithelium from fluctuations
of pH, ionic concentration and hydration. They are also implicated in
renewal and differentiation of the epithelium and modulation of cell-cycle
progression. In patients with LPR, this study demonstrated significantly
lower expression of the secreted gel-forming mucin genes in the medial
arytenoid region (MUC2 and MUC5B) and the posterior commissure
(MUC5B).
Carbonic anhydrase (CA) is an integral component of laryngeal defence,
increasing the pH of the mucosal surface. Expression of CA I, II and III are
present in the normal larynx. Expression of CA-III is known to vary in the
larynx between different locations in response to refluxate. CA3 gene
expression was lower in the false cord region in LPR patients, however this
was not significantly different.
There is also evidence of an inflammatory process, with changes in CD1d
expression, which is known to be decreased in epithelial inflammation and
increase in CRNN and TGF!-1 noted in the medial arytenoid sub-site.

! $#""!
Consequently, there is significant evidence of molecular changes in
laryngeal epithelium between patients with LPR compared to normal
controls. This study identifies that these changes vary according to the sub-
site of the larynx. Whilst the posterior commissure is most commonly
identified as the area demonstrating macroscopic change consistent with
LPR, this study has identified that the medial arytenoid is the area most
likely to demonstrate a molecular change. With identified molecular
changes in mucin expression (MUC2 and 5B), cytokeratin 14 and molecular
markers of inflammation, this study provides increasing evidence for the
diagnosis of LPR and potential markers for therapeutic monitoring.

! "!
1 CHAPTER 1: INTRODUCTION
! #!
1.1 Definition Laryngopharyngeal reflux (LPR) is typically defined as the backflow of
gastric contents in the larynx, pharynx, trachea and bronchus1. The
consequences of such refluxate contribute to a broad spectrum of upper
aerodigestive tract inflammatory symptoms and have been associated with
numerous disorders, including reflux laryngitis, obstructive sleep apnoea,
laryngeal cancer, otitis media with effusion, laryngeal granuloma and
subglottis stenosis2-4.
The idea that gastro-oesophageal reflux could lead to otorhinolaryngological
manifestations was first considered in 1903, when Coffin considered that
“reflux of gas from the stomach” and “hyperacidity” caused laryngeal and
nasal symptoms in patients with voice hoarseness and post-nasal
rhinorhoea5. It has been increasingly recognized over the last 30 years that
extra-oesophageal manifestations of gastro-oesophageal reflux disease
(GORD) lead to a distinct clinical spectrum of symptoms. The term “reflux”
has been synonymous with GORD however it is increasingly clear that the
oesophagus is not the only area damaged by refluxate. There is a
significantly high burden of reflux related disease on the Australian
community and a large health budget expenditure for both health services
and pharmaceuticals6. It is associated with a considerable impairment in
quality of life unless treated effectively. According to a recent global
definition, GORD can cause oesophageal and extra-oesophageal

! $!
symptoms7 and over the last few decades, extra-oesophageal reflux has
also been recognized as an individual identity.
The World Congress of Gastroenterology defined gastro-oesophageal reflux
disease as a “condition which develops when the reflux of stomach contents
causes troublesome symptoms and/or complications7.” This definition has
the benefits of including patients without the classical symptoms such as
heartburn and those who may be suffering from the complications of reflux.
Extra-oesophageal complications were included in the spectrum of the
disease, with the laryngeal symptoms forming one of the clinical syndromes
identified (Figure 1).
Given the common mechanisms of development, GORD and LPR have
been intimately linked, however it is becoming recognized that LPR is
significantly different from GORD, with a pathophysiology that leads to
disparate clinical presentations and response to treatment. Previously
patients presenting with pyrosis and regurgitation have been classified as
“typical” GORD and those with other symptoms, such as laryngeal
manifestations, or chronic cough described as “atypical”. Whilst this is a
useful clinical distinction to make, it implies that the pathophysiology is
similar. Increasingly the term “silent” reflux is being utilized, given the lack
of classic reflux symptoms associated with this disease8.

! %!
Figure 1 Montreal Classification of Gastro-oesophageal Reflux Disease
From Vakil et al. 20067.

! &!
1.2 Epidemiology The prevalence of reflux, both LPR and GORD is difficult to determine.
GORD is one of the most common diseases in the Western world9,10, with
the prevalence estimated at between 26% to 44%11. Such a variety in
estimates identifies the difficulty of determining the true prevalence of GORD
even though it is quite common, so it follows that estimating the true
prevalence of (relatively uncommon) LPR is more of a problem. Numerous
studies have attempted to quantify the incidence of GORD, however this is
often hampered due to a lack of consensus over even the basic definition of
the disease, given no internationally applied definition9.
GORD has been described as a spectrum disease, with many patient
subgroups ranging from symptomatic disease without mucosal lesions (Non-
erosive reflux disease – NERD) to disease with significant complications
including erosive oesophagitis, ulceration, strictures or Barrett’s
esophagus11.
In a recent paper by the Australian Institute of Health and Welfare reviewed
GORD prevalence estimated a rate of between 12.5% and 29.5%. This
latter figure included patients that had GORD symptoms at any time in the
past that may have resolved and consequently included a greater number.
However difficulty remains in finding a true prevalence, given that the
phenomenon of gastroesophageal reflux is common even in an

! '!
asymptomatic population and is identified in 65 – 75% of normal
individuals12.
Similarly it has been difficult to truly define the prevalence of LPR, with part
of the problem being the difficulty of definitive diagnosis. Consequently
much of the literature has considered the rates of LPR in already established
disorders. Kuhn et al.13 noted that, compared to a control group, a greater
number of patients with vocal cord nodules also had LPR. Koufman et al.14
prospectively analysed consecutive, newly presenting patients referred to
their voice centre. Patients with both symptoms and findings consistent with
LPR underwent an ambulatory 24-hour double probe pH monitoring. Nearly
three quarters of those undergoing pH monitoring had abnormal studies,
demonstrating reflux events of less than a pH of 4.0, into the oesophagus. It
is of note that 50% of all these patients presenting with voice symptoms
overall had pH probe demonstrated reflux into the larynx, at a pH less than
4.0, indicating that it is likely to be either a considerable cause, or
confounder in the identification and management of voice and laryngeal
symptoms. Furthermore, signs and symptoms related to reflux have been
identified in 4 to 10% of all patients seen by Otolaryngologists2. Another
study, using questionnaires to identify the prevalence of GORD and LPR,
found 66% of respondents noting either GORD or LPR symptoms and 26%
reporting both GORD and laryngeal symptoms15. This may be an
overestimate given the majority of the community population they surveyed
were recruited in hospital outpatient settings. However despite numerous

! (!
other publications addressing the pathogenesis of LPR, definitive
epidemiological research is lacking.
The true prevalence still remains in doubt, with much controversy
surrounding it. Some physicians suspect an over-diagnosis, and even mis-
diagnosis, in many patients, whilst others believe it is considerably under-
diagnosed16. The latter is more likely, given the lack of “classical” reflux
symptoms associated with LPR, the difficulty in traditional methods for
providing a definitive diagnosis and the lack of accord on the examination
findings. Until a definitive diagnostic tool and substantive epidemiological
data is collected, the actual prevalence and burden of disease remains
unknown.
1.3 Anatomy of the Larynx From the pharynx the upper aerodigestive tract must serve the competing
functions of respiration and swallowing. The larynx is crucial to the
maintenance and protection of the upper airway, toileting of the lower
respiratory tract by coughing and for conducting the Valsalva maneuver.
Sensation of the larynx is also important, providing important information
regarding airway function and purity of the inhaled air, with resultant
reflexes17. The production of voice, whilst important in our society, is not
the primary function of the larynx, however voice disorders have been
associated with significant levels of psychological distress18. Furthermore,
voice disorder symptoms associated with LPR, such as hoarseness, chronic

! )!
cough and throat clearing were found to be associated with a poorer quality
of life, with decreased self-esteem, increased relationship strain, fatigue and
frustration19.
The larynx is composed of 3 single cartilages, 3 paired cartilages, and
intrinsic and extrinsic muscles with a mucosal coverage. It is divided
anatomically, embryological and clinically into three major compartments:
the supraglottis, glottis and subglottis20 (Figure 2). The supraglottic region
includes the epiglottis, arytenoid cartilages, aryepiglottic folds, vestibular
folds and the laryngeal ventricles. The glottis includes the vocal cords with
the anterior and posterior commissure and the subglottic region extends
from 5 to 10mm below the true vocal fold to the inferior rim of the cricoid
cartilage20.

! *!
Figure 2 Laryngeal Compartments
Adapted from American Joint Committee on Cancer Staging Atlas, 200621.

! "+!
E
B C
D
A
F
Figure 3 Anatomy of the larynx.
A: Arytenoid cartilages, B: false vocal cord (laryngeal ventricle), C: true vocal cord, D: subglottis, E: anterior commissure, F: posterior commissure. Photograph from Gastrolab 22
! ""!
There has, however, been some debate and discrepancy in describing both
the anatomy and the histology of the human larynx. Whilst the sub-sites
such as the epiglottis have defined boundaries, the concept of the posterior
commissure has been questioned23 and even proposed as being part of the
subglottis24. The anterior commissure is easily identified, however the
posterior commissure has been described as being based on a “clinical
impression based on indirect and direct visual examination25.” To identify it
as part of the glottis has been argued as being incorrect, given the posterior
end of the glottis is actually a wall. In practice, however, this is likely to be
more semantics than of clinical importance, given researchers in LPR have
described “posterior commissure” changes throughout the literature.
Delahunty, in describing an association between LPR and posterior laryngitis
identified the characteristic “interarytenoid heaping of mucosa26.” This was
further described in the literature by Kambic and Radsel27, with Koufman2
describing it as the most common laryngeal finding in patients with reflux
laryngitis. Belafsky28 described the posterior commissure as being in close
proximity to the oesophageal inlet and hypertrophy of this region typically
being graded as mild, moderate and severe. Mild hypertrophy coincides
with a “mustache-like appearance” of posterior commissure mucosa, with
swollen mucosa creating a straight line across the back of the larynx
identified as being moderate. Severe hypertrophy was described when
there is mucosa bulging into the airway. Consequently for this study the
posterior commissure was identified as the area described by Stell et al.29 in
their morphological study larynx and comprises of the “band” of epithelium
extending from the arytenoid eminences.

! "#!
The mucosal lining of the larynx consists of both squamous and respiratory
type columnar epithelium. There has, however, been a degree of
discrepancy regarding descriptions of the mucosa lining. This may, in part,
be due to the difficulty in accurately defining the sub-sites of the larynx,
which, unlike the oesophagus, do not always possess a definitive “transition
zone” or anatomically distinct landmark to separate distinct areas. The
epiglottis is lined anteriorly with squamous epithelium. In the posterior
aspect, the upper portion of the epiglottis is lined with squamous epithelium.
Some studies have found the entire posterior aspect of the epiglottis to be
lined with squamous mucosa30, however recent consensus is that it
becomes columnar epithelium inferiorly31. The vibratory margin of the vocal
cord is stratified squamous epithelium32. Typically the remainder of the
larynx is described as consisting of ciliated columnar epithelium, with the
transition from squamous epithelium of the vocal cord to the respiratory
epithelium being the landmark for the lower border of the glottic region20.
(Figure 4) Despite this, there is evidence that the vestibular folds (false
vocal cords) possess a variable mucosal lining. Stell et al.30 studied 49 post-
mortem larynges of non-smokers and found the vestibular folds were
covered entirely in respiratory type epithelium in only 50%. Nearly 10%
were noted to be entirely squamous, with the remaining 40% being a mixed
respiratory and squamous epithelium. Unfortunately there is no further
classification of whether these patients suffered from reflux, or had any
laryngeal symptoms to account for any changes in mucosal lining. The
posterior commissure mucosa has been inconsistently described, with some
! "$!
studies identifying it as respiratory columnar epithelium20 and others noting a
solely squamous lining25,29,33. This may be due to the difficulty in identifying
the true boundaries of the posterior commissure, with those defining the
“posterior commissure” of the glottis, along the plane of the anterior
commissure and encompassing the medial wall of the posterior larynx likely
to find respiratory epithelium in continuity with the sub-glottis. However the
current study considers the posterior commissure to be the area of the
larynx between the arytenoid eminences, and, as described by Stell et al.29
is comprised of squamous epithelium.

! "%!
Figure 4 Histology of the Larynx
from Mills 2007 Histology for Pathologists31.

! "&!
1.4 Extra-oesophageal Reflux: LPR LPR is clinically identified by a cluster of signs and symptoms suggestive of
irritation or damage caused by extra-oesophageal reflux. The most common
symptoms associated with LPR have been recognized as excessive phlegm,
globus pharyngeus, throat clearing and sore throat34. Symptoms are likely to
be caused by gastric refluxate, with evidence that not only acid refluxate, at
a pH of less than 4.0, leads to inflammation, but there is evidence non-acid
reflux (pH between 5 and 7) may also lead to injury in the larynx35.
1.4.1 Reflux Laryngitis Posterior laryngitis was first described in 197226 and is the most recognized
of the LPR-associated stigmata and includes pachyderma, erythema and
oedema of the arytenoid mucosa and hyperplastic interarytenoid tissue26,36.
As a finding it has been noted to be highly suggestive of LPR, with one study
finding 15 out of 20 patients with posterior laryngitis having reflux events
during dual-channel pH monitoring37. However it is recognized that such
findings are particularly subjective in nature and the degree of erythema,
oedema and inflammation can be difficult to standardize on examination.
Pseudosulcus is another laryngoscopy finding first described by Koufman,38
it is thought to represent infraglottic oedema, giving the appearance of a
furrow or sulcus subglottically and extends back to the posterior
commissure. It is distinguished from a true sulcus vocalis in that the sulcus
! "'!
is at the free edge of the vocal fold and terminates at the vocal process in
the latter. In a recent study, all patients with pseudosulcus had episodes of
LPR during a 24-hour pH study, with 19 of the 20 patients studied reporting
symptoms commonly associated with LPR. Consequently this study
suggested pseudosulcus had a positive predictive value of 90% for LPR and
as a relatively objective finding has been suggested a useful finding in
diagnosis of LPR36. However in other studies there has been no statistical
difference in the occurrence of pseudosulcus between patients with or
without extra-oesophageal reflux and with or without GORD34.
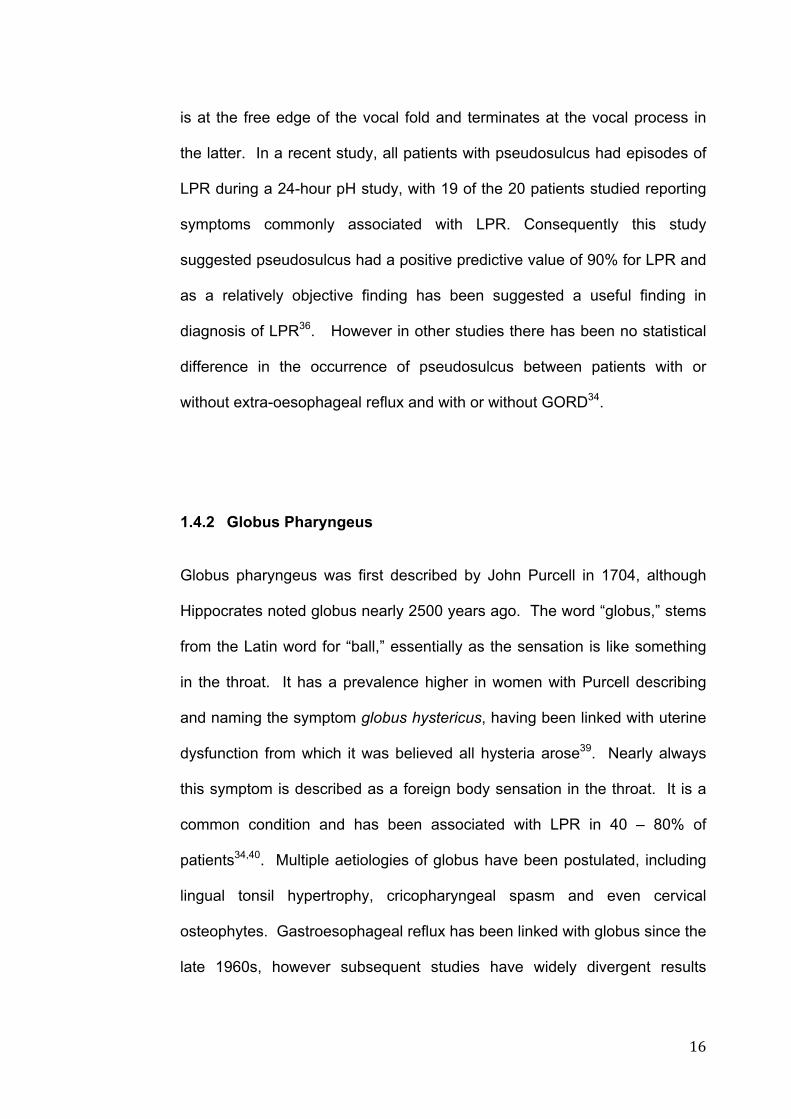
1.4.2 Globus Pharyngeus Globus pharyngeus was first described by John Purcell in 1704, although
Hippocrates noted globus nearly 2500 years ago. The word “globus,” stems
from the Latin word for “ball,” essentially as the sensation is like something
in the throat. It has a prevalence higher in women with Purcell describing
and naming the symptom globus hystericus, having been linked with uterine
dysfunction from which it was believed all hysteria arose39. Nearly always
this symptom is described as a foreign body sensation in the throat. It is a
common condition and has been associated with LPR in 40 – 80% of
patients34,40. Multiple aetiologies of globus have been postulated, including
lingual tonsil hypertrophy, cricopharyngeal spasm and even cervical
osteophytes. Gastroesophageal reflux has been linked with globus since the
late 1960s, however subsequent studies have widely divergent results
! "(!
linking acid reflux to this symptom, with rates varying between 7 to 90% of
patients with globus having acid reflux41. There is significant evidence now
to suggest the role of non-acid reflux and that small amounts of reflux can
lead to the development of LPR symptoms35. Consequently the assessment
of globus by barium swallow and pH monitoring may miss a significant
population suffering extra-oesophageal reflux.
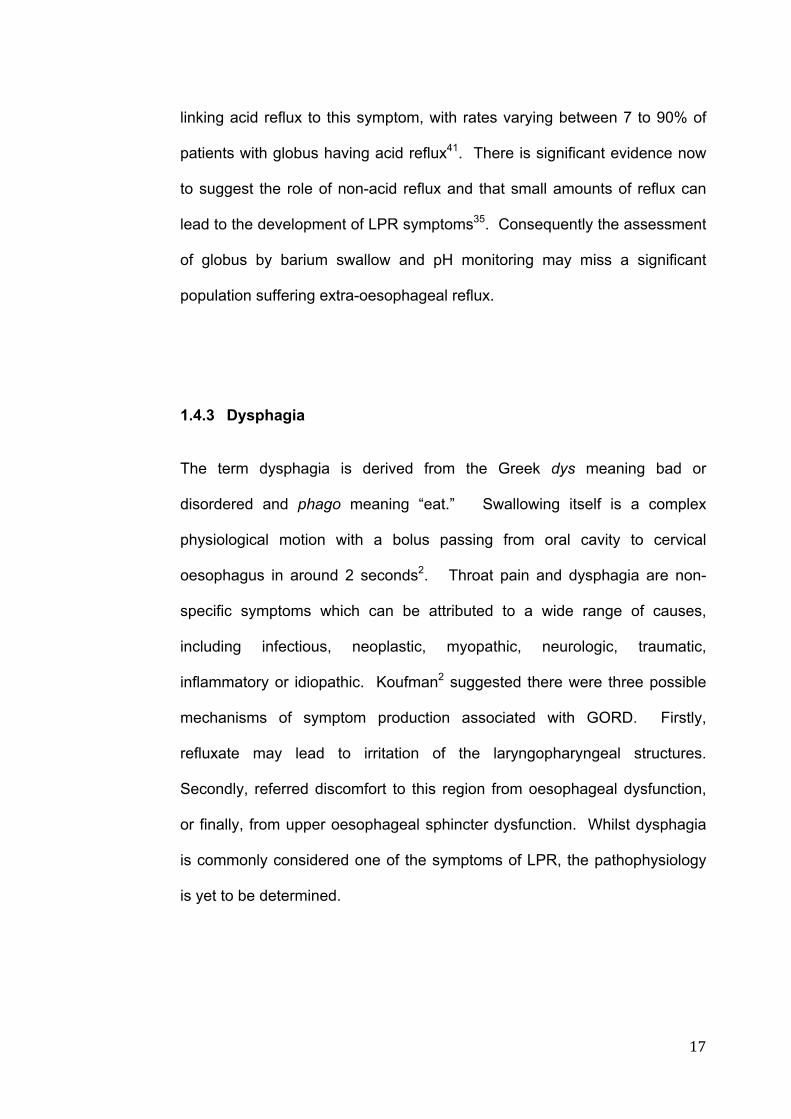
1.4.3 Dysphagia The term dysphagia is derived from the Greek dys meaning bad or
disordered and phago meaning “eat.” Swallowing itself is a complex
physiological motion with a bolus passing from oral cavity to cervical
oesophagus in around 2 seconds2. Throat pain and dysphagia are non-
specific symptoms which can be attributed to a wide range of causes,
including infectious, neoplastic, myopathic, neurologic, traumatic,
inflammatory or idiopathic. Koufman2 suggested there were three possible
mechanisms of symptom production associated with GORD. Firstly,
refluxate may lead to irritation of the laryngopharyngeal structures.
Secondly, referred discomfort to this region from oesophageal dysfunction,
or finally, from upper oesophageal sphincter dysfunction. Whilst dysphagia
is commonly considered one of the symptoms of LPR, the pathophysiology
is yet to be determined.

! ")!
1.4.4 Chronic Cough Chronic cough has been associated with LPR, however is a non-specific
symptom. In the majority of cases this symptom is attributed to asthma,
sinonasal disease or LPR. However it is important to consider less common
causes including chronic pulmonary disease, chemical irritants, congestive
heart failure, medications such as angiotensin-converting enzyme
inhibitors42 and rare conditions such as chronic eosinophilic pneumonia43 .
A number of mechanisms have been proposed by which GORD and LPR
induce cough, with neither mutually exclusive. Firstly aspiration of refluxate
can occur at both a macroscopic and microscopic level. Large amounts of
refluxate may be aspirated into the broncho-pulmonary tract and in these
patients grade 3 or 4 oesophagitis is typically common. Microaspiration is
consistent with small amounts of refluxate passing across the upper
oesophageal sphincter. It is thought that these demonstrate laryngeal
mucosal inflammation and associated cough and hoarseness5.
Secondly the vagus-mediated oesophago-bronchial reflux mechanism has
more recently been proposed and originates from the oesophageal receptors
for cough rather than the laryngeal and bronchial receptors5. In addition to
this stimulation, a “vicious cycle” is instigated, with cough increasing trans-
diaphragm pressure, which induces relaxation of the lower oesophageal
sphincter, increasing the likelihood of further reflux5.
! "*!
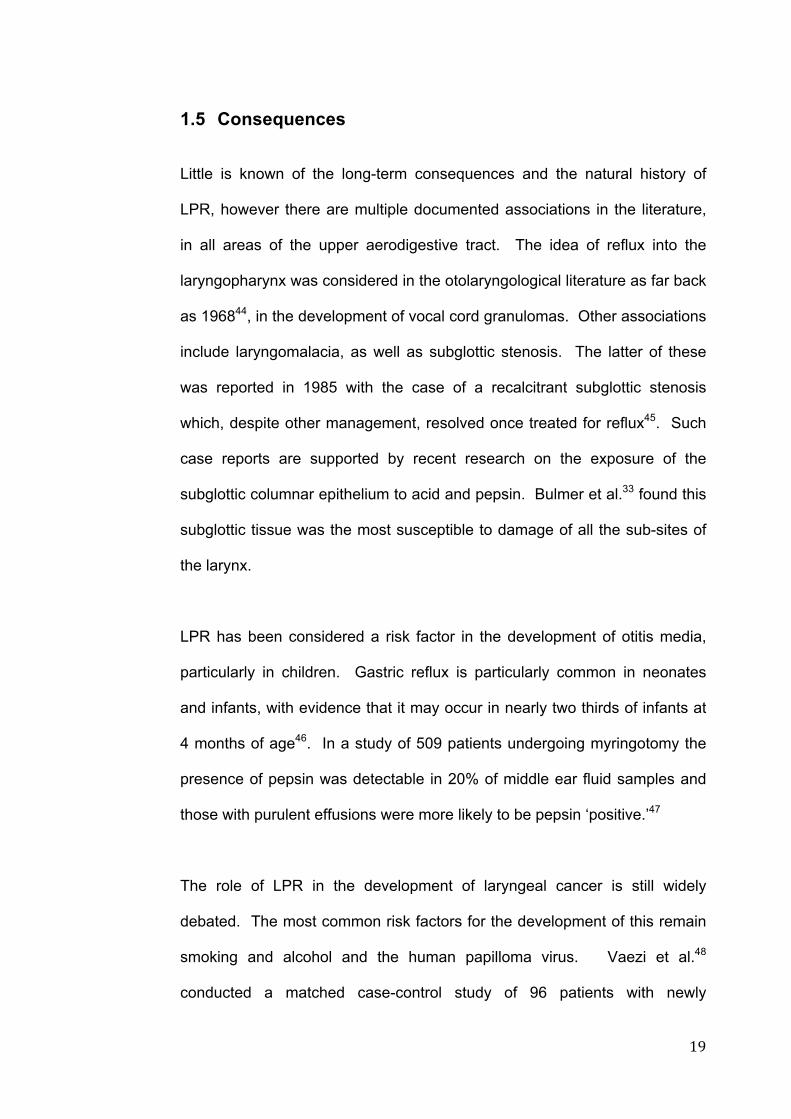
1.5 Consequences Little is known of the long-term consequences and the natural history of
LPR, however there are multiple documented associations in the literature,
in all areas of the upper aerodigestive tract. The idea of reflux into the
laryngopharynx was considered in the otolaryngological literature as far back
as 196844, in the development of vocal cord granulomas. Other associations
include laryngomalacia, as well as subglottic stenosis. The latter of these
was reported in 1985 with the case of a recalcitrant subglottic stenosis
which, despite other management, resolved once treated for reflux45. Such
case reports are supported by recent research on the exposure of the
subglottic columnar epithelium to acid and pepsin. Bulmer et al.33 found this
subglottic tissue was the most susceptible to damage of all the sub-sites of
the larynx.
LPR has been considered a risk factor in the development of otitis media,
particularly in children. Gastric reflux is particularly common in neonates
and infants, with evidence that it may occur in nearly two thirds of infants at
4 months of age46. In a study of 509 patients undergoing myringotomy the
presence of pepsin was detectable in 20% of middle ear fluid samples and
those with purulent effusions were more likely to be pepsin ‘positive.’47
The role of LPR in the development of laryngeal cancer is still widely
debated. The most common risk factors for the development of this remain
smoking and alcohol and the human papilloma virus. Vaezi et al.48
conducted a matched case-control study of 96 patients with newly

! #+!
diagnosed laryngeal cancer, finding GORD was significantly associated with
laryngeal cancer. In their study, symptomatic GORD was significantly higher
in the cancer patients, than controls (13.5% vs 5.7%) and for any given level
of smoking, GORD increased the probability of developing laryngeal cancer.
There was no interaction between smoking and GORD noted however. It is
difficult to determine these causal relationships, as such studies are
retrospective. Additionally the patient numbers required to determine such a
causative association are likely to be much higher than have been currently
studied, given that without following a patient for many years prior to
diagnosis, the only method to determine any correlation would be to
diagnose both the laryngeal cancer and GORD at the same time. By doing
it in retrospect the question of the direction of causality remains open, given
even the psychological impact of a cancer diagnosis may cause GORD49,50.
Despite this, the concept of LPR induced chronic inflammation causing
cancer still remains logical, given a similar aetiology in other cancers.
Recently, one group of researchers, using the Human Cancer Pathway
Finder Super Array found exposure of pepsin altered the expression of 27
genes implicated in carcinogenesis51. Furthermore, in animal models,
exposing hamster cheeks to a known carcinogen, 7,12-
dimethyobenzanthracene, found the application of pepsin lead to a
statistically significant increase in tumour volume52. Overall the evidence
supporting the role of LPR in the causation of cancer remains tenuous, with
the literature remaining divided. In part, adequate studies are limited by
numerous other factors, including the consensus of the definition and
diagnosis of LPR.
! #"!
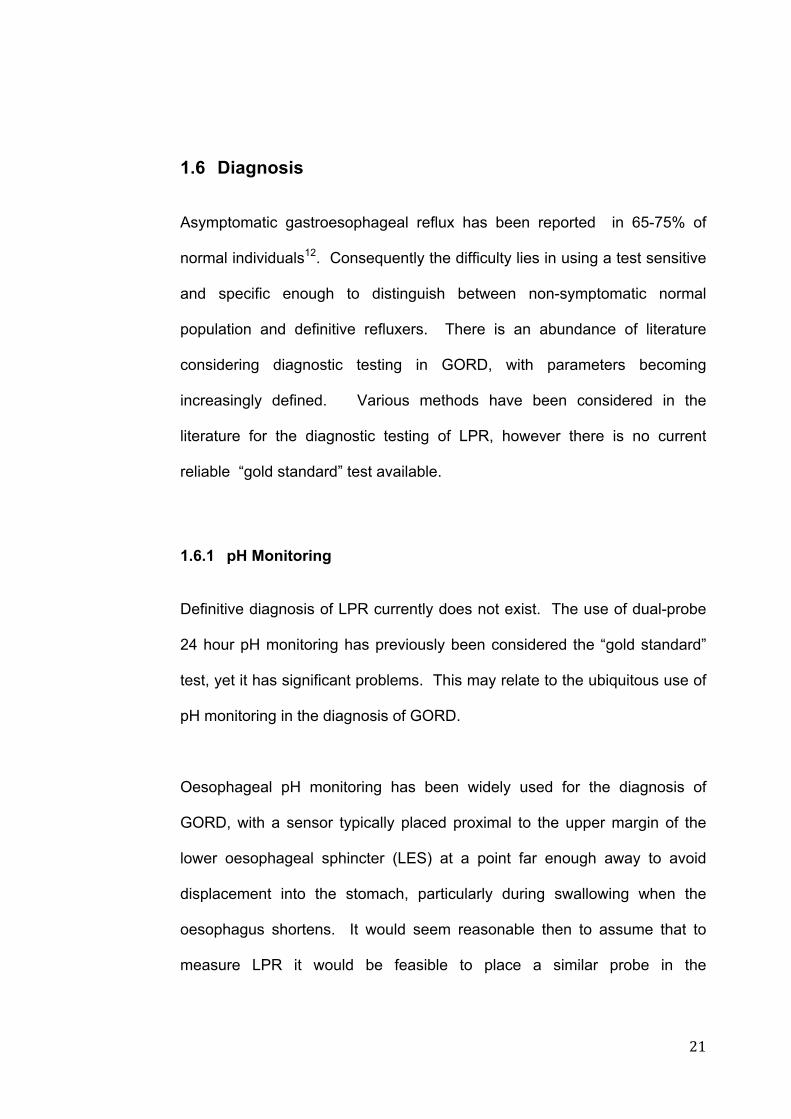
1.6 Diagnosis
Asymptomatic gastroesophageal reflux has been reported in 65-75% of
normal individuals12. Consequently the difficulty lies in using a test sensitive
and specific enough to distinguish between non-symptomatic normal
population and definitive refluxers. There is an abundance of literature
considering diagnostic testing in GORD, with parameters becoming
increasingly defined. Various methods have been considered in the
literature for the diagnostic testing of LPR, however there is no current
reliable “gold standard” test available.
1.6.1 pH Monitoring Definitive diagnosis of LPR currently does not exist. The use of dual-probe
24 hour pH monitoring has previously been considered the “gold standard”
test, yet it has significant problems. This may relate to the ubiquitous use of
pH monitoring in the diagnosis of GORD.
Oesophageal pH monitoring has been widely used for the diagnosis of
GORD, with a sensor typically placed proximal to the upper margin of the
lower oesophageal sphincter (LES) at a point far enough away to avoid
displacement into the stomach, particularly during swallowing when the
oesophagus shortens. It would seem reasonable then to assume that to
measure LPR it would be feasible to place a similar probe in the

! ##!
hypopharynx or proximal oesophagus53. In practice there has been
significant controversy regarding the placement, with some studies
suggesting between 15 to 20cm above the LES, or either just below or up to
2cm above the upper oesophageal sphincter (UES).
Difference of opinion also exists as to the level of “normal” acid reflux. Some
otolaryngologists believe that in some patients, any laryngeal acid exposure
can cause signs and symptoms, even if occurring only once every day (or
even less), particularly given there is no evidence that laryngeal mucosa has
strong protective measure against acid16. Some researchers feel that any
reflux into the larynx is abnormal. One study comparing signs and
symptoms of LPR to pH monitoring found a lack of correlation between
laryngeal symptoms and pH monitored laryngeal reflux54 and this was
consistent with other researchers55.
Additionally, interpretation of pH monitoring results can be difficult and can
depend on who is interpreting it. For example a gastroenterologist call a 24-
hour impedance study normal with four or five episodes of acid reflux (pH
less than 4.0) at a proximal sensor16. Smit et al56 suggested that more than
four episodes of laryngeal reflux is pathological, however, as previously
mentioned, there is no standardized number of “normal” reflux events.
Such studies of LPR and pH monitoring have demonstrated evidence that
LPR is different to GORD. The periods of LPR are shorter in duration

! #$!
(seconds) and less frequent. Additionally they mostly occur in the upright
position.
Other techniques, such as the questionnaire based Reflux Symptom Index
(RSI), have previously been demonstrated to show a strong correlation with
pH-documented reflux57. In addition, such monitoring is a significantly
invasive procedure and is limited by patient compliance. Furthermore, as
already stated, pH monitoring, although considered “gold standard” has a
significant variability in results ranging from 20 to 50% and the guidelines by
the American College of Gastroenterology stated that “available evidence
does not support the routine use of proximal pH monitoring in clinical
practice”58.
Consequently there is a shift towards diagnosis and furthermore
management, of LPR by clinical diagnosis based on a cluster of symptoms
and signs in the larynx. The RSI and a rating scale for physical findings, the
Reflux Finding Score (RFS) consequently provide a quantitative
measurement of such signs and symptoms and are consistently utilized in
literature. Despite well-documented limitations, these still remain the best
standardised measurements of LPR in the light of no single pathognomonic
change. It is well recognized that LPR is difficult to accurately diagnose with
a single investigational modality, and recent studies have suggested that
combining two modalities would increase the likelihood of a correct
diagnosis. Park et al59 studied 57 patients who complained of globus
pharyngeus symptoms for longer than one month, comparing RFS, RSI, 24-

! #%!
hour double-probe pH monitoring and the symptom checklist-90-
revision(SCL-90-R) for each patient. They found individually the RSI had a
sensitivity of 75% and specificity of 18.8%. RFS was found to have a
sensitivity of 87% and specificity of 37%59, suggesting the RFS was more
sensitive than the RSI, but had a higher rate of false positives. 24-hour
double probe pH monitoring was used as the “gold standard” against which
these were compared, which further complicates these figures, given it has a
well-documented significant variability in positive results according to
examiners interpretation and false-positive or false–negative results59.
Furthermore, combination of the RSI and RFS scores demonstrated an
increased specificity, however sensitivity was decreased (sensitivity of 68%,
specificity of 50%). Again this may well be complicated by the physical
process of reflux, with non-acid refluxers still demonstrating signs and
symptoms which are not picked up by the 24-hour dual probes.
1.6.2 Reflux Symptom Index LPR is well recognized as having a cluster of symptoms quite different to
gastroesophageal reflux. As previously mentioned, vocal fatigue,
hoarseness, globus pharyngeus, chronic cough, post-nasal drip are all
included as manifestations. Individually they may have many causes,
however collectively they can provide an indication of LPR. Belafsky et al60
developed a 9 item questionnaire utilising 25 patients with a clinical
diagnosis of LPR and further confirmed with 24-hour double-probe pH
! #&!
monitoring (Appendix 1). Patients were given the RSI and the 30-item Voice
Handicap Index (VHI) at their first visit, then repeated before commencing a
course of anti-reflux medication. Belafsky60 found a high correlation
between pre-treatment scores, concluding the measure possessed a high
level of reproducibility60. At the time of development there was no validated
instrument for the use of the otolaryngologist to assess outcomes in LPR
patients. The RSI was developed as an outcome measure, particularly to
measure the improvement in defined LPR symptoms following a trial of 6
months of anti-reflux medication. Belafsky 60 found that there was a similarity
between the RSI in asymptomatic patients to those treated with 6 months of
anti-reflux medication twice daily. An addition there was a significant
improvement in the ‘functional’ subscale of the VHI and there was a
correlation with improvement in the RSI. Patients who experienced a 5 point
or greater improvement in RSI were 11 times more likely to experience a five
point improvement in VHI60. It is of note that the mean RSI of LPR patients
in this study was 21.2 and improved to 12.8 following treatment. Belafsky
considered a score of greater than 13 as being abnormal, so although the
symptom severity improves significantly, the mean score still lies very close
to the abnormal range. This may suggest that a longer course is required, or
additional management is needed.
Belafsky60 developed the RSI, however the absolute cut off for abnormal
result is arbitrary. His study considered 25 patients diagnosed with LPR on
clinical and 24 hour pH double probe ambulatory monitoring. These
patients were age and gender matched control from an asymptomatic group
! #'!
with no evidence of LPR. In consideration of the control group, the 95%
upper confidence limit for RSI was 13.6. From this figure he suggested that
an RSI of greater than 13 would be abnormal. Despite this, other studies
have utilized other values to determine “abnormal” results. It is particularly
difficult to determine this cut off considering there is no universally accepted
gold standard for the diagnosis of LPR.
In an epidemiological study sampling 2000 general practice patients in the
UK, 30% of patients had an RSI greater than 10, with 75% of these patients
also suffering GORD symptoms61. In addition, they considered BMI,
recognizing 40% of those sampled with a normal BMI. Of the normal BMI
population, 24% had an RSI over 10. This rate increased to 40% with
patients having a BMI between 25-29 and 50% with a BMI greater than 3061.
Oyer62 suggested that although the RSI was a validated outcomes tool, its
predictive value for LPR remained controversial. This was most noted when
considering the effects of anxiety and depression in comparing pH
monitoring measurements and RSI scores. They found that patients
classified with a psychiatric disorder (eg depression or anxiety) had a
significantly higher RSI score than those classified into the non-psychiatric
group, however they had a significantly lower incidence of abnormal probe
studies. This indicates that those with psychiatric disorders may have a
lower threshold for reporting such symptoms. They suggested that an
elevated RSI was a poor predictor for an abnormal pH probe study in the
! #(!
psychiatric group, but a strong predictor for an abnormal probe study in non-
psychiatric patients62.
In addition, some research does not use the RSI at all, citing that most
academic and non-academic otolaryngologists do not frequently use the RSI
in clinical practice, as LPR is a clinical diagnosis of a cluster of symptoms,
with clearly no single pathognomonic finding63.
1.6.3 Reflux Finding Score Laryngeal findings have been identified as being crucial to the diagnosis of
LPR, partly due to the requirement to rule out any other pathology leading to
the laryngeal symptoms. Belafsky et al.57 developed the Reflux Finding
Score (RFS) based on the 8 most common laryngeal findings identified in
their voice centre that were representative of LPR (Appendix 2). The
instrument scores range from a minimum of zero indicating no inflammation,
to a maximum of 26.
Such scales are useful both clinically and from a research perspective to
assist in diagnosis and to monitor improvement following the
commencement of treatment. The RFS has the benefit of grading each of
the laryngeal findings on a scale of severity. This is important to be able to
quantify laryngeal inflammation, but also important given there is no single
laryngeal finding pathognomonic of LPR. Multiple individual laryngeal
findings have been considered as identifying the presence of LPR, with
! #)!
posterior commissure hypertrophy previously being regarded as the sine qua
non of reflux laryngitis, being diagnosed in 74% of patients with LPR28.
(Figure 5) In addition, 15 of 20 patients identified with a posterior laryngitis
were noted to have pharyngeal reflux events on dual-channel pH
monitoring37.

! #*!
Figure 5 Posterior Commissure Hypertrophy
a) normal posterior commissure; b) mild hypertrophy, moderate vocal fold
oedema, pseudosulcus vocalis; c) moderate hypertrophy (straight line
across posterior larynx), pseudosulcus vocalis, moderate vocal fold oedema,
partial ventricular obliteration, diffuse laryngeal oedema; d) severe posterior
commissure hypertrophy, with severe vocal fold oedema, total ventricular
obliteration and diffuse laryngeal oedema.
From Belafsky et al. 200157.

! $+!
Whilst this is recognized as being the most frequent finding associated with
LPR, other findings have also been considered equally important. Other
research has focused on the laryngeal pseudosulcus as a predictor of LPR.
The pseudosulcus refers to oedema of the undersurface of the vocal fold
(Figure 6), and typically extends from the anterior commissure to the
posterior larynx, and is located inferior to the striking zone of the vocal fold64.
Comparatively, a sulcus vocalis stops at the vocal process and is found in
the striking zone. A number of studies have considered the presence of a
pseudosulcus to be predictive of LPR, with one study identifying it as having
a positive predictive value for LPR of 90%, however this lacked a
comparison control group36. Furthermore, other studies have reported a
sensitivity of 70% and specificity of 77% and considered the presence of a
pseudosulcus alone suggestive of LPR. It must be noted, however, that the
ageing larynx can also demonstrate a pseudosulcus, with an inelastic vocal
fold epithelium and atrophic vocal fold musculature64, yet these changes
occur rarely as a single finding in LPR.

! $"!
Figure 6 Laryngeal Pseudosulcus
Image of laryngeal pseudosulcus (arrow) From Hickson et al. 200136
! $#!
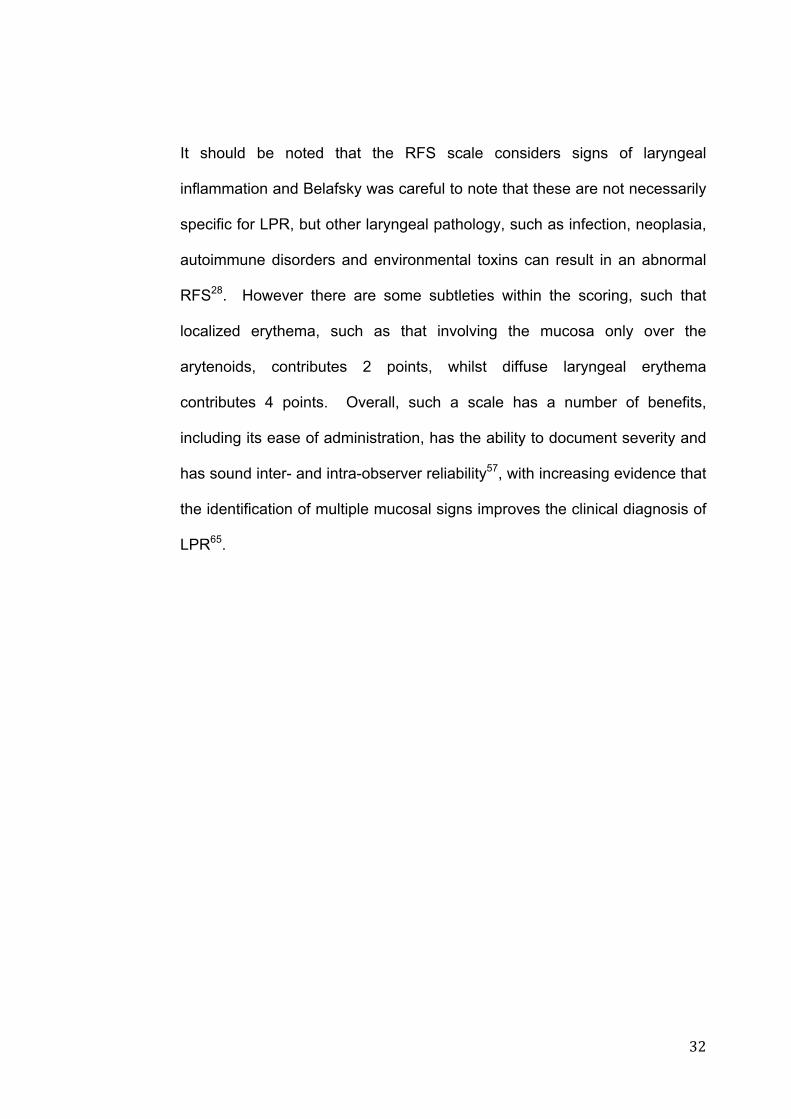
It should be noted that the RFS scale considers signs of laryngeal
inflammation and Belafsky was careful to note that these are not necessarily
specific for LPR, but other laryngeal pathology, such as infection, neoplasia,
autoimmune disorders and environmental toxins can result in an abnormal
RFS28. However there are some subtleties within the scoring, such that
localized erythema, such as that involving the mucosa only over the
arytenoids, contributes 2 points, whilst diffuse laryngeal erythema
contributes 4 points. Overall, such a scale has a number of benefits,
including its ease of administration, has the ability to document severity and
has sound inter- and intra-observer reliability57, with increasing evidence that
the identification of multiple mucosal signs improves the clinical diagnosis of
LPR65.

! $$!
1.7 Pathogenesis of Reflux The study of LPR has been historically linked with GORD, from initial
diagnostic techniques such as pH monitoring, to sharing common
management strategies, such as the commencement of proton pump
inhibitors (PPIs) for treatment. However there are clear differences
between the disease processes, with classically different symptom clusters,
such that the majority of patients with LPR do not suffer heartburn2. For
example, for injury to occur in the larynx from reflux there must be firstly
agents in the refluxate that causes injury and secondly a failure, or loss, of
the any intrinsic, or extrinsic defences. A number of injurious agents have
been considered, including acid and pepsin. In addition Lipan et al.66
described four anti-reflux barriers that exist to protect the larynx from injury:
the gastroesophageal junction, oesophageal motor function and acid
clearance, the upper oesophageal sphincter and laryngopharyngeal mucosal
resistance.
1.7.1 Damaging Agents Gastric refluxate has long been recognized as causing oesophagitis. As
early as 1934, Asher Winkelstein considered that a number of his patients
may be suffering symptoms resulting from the “irritant action on the mucosa
of hydrochloric acid and pepsin67.”
! $%!
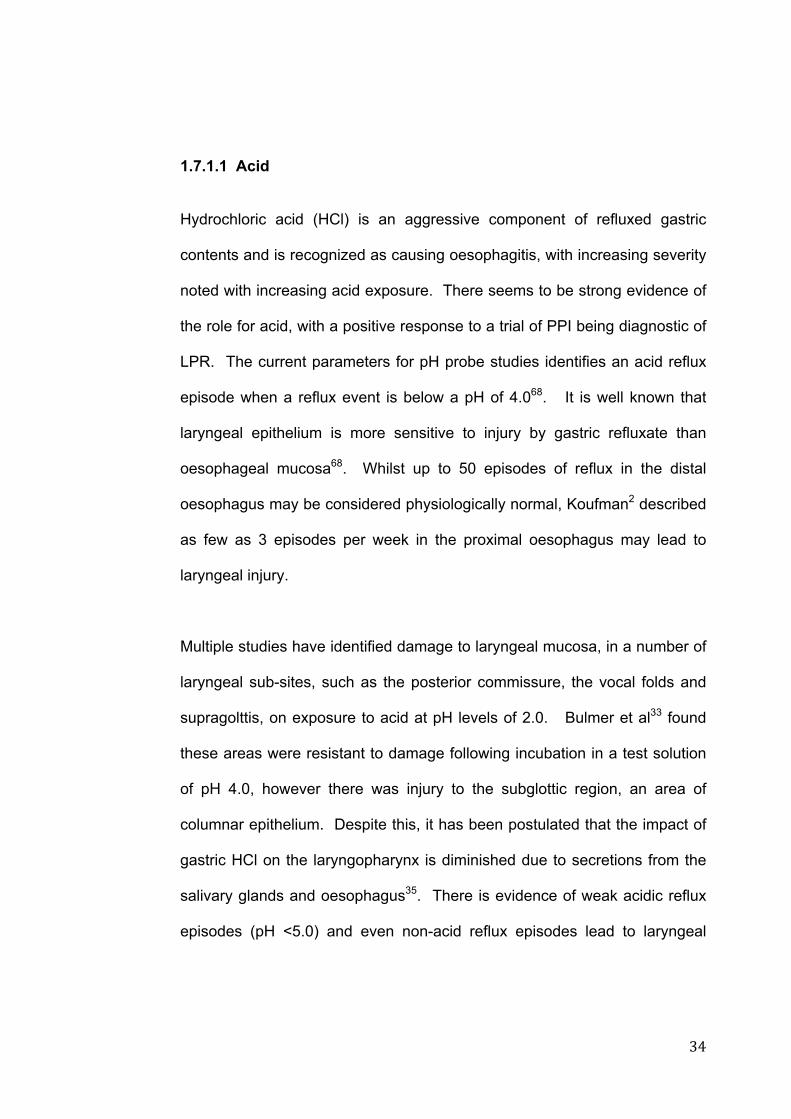
1.7.1.1 Acid Hydrochloric acid (HCl) is an aggressive component of refluxed gastric
contents and is recognized as causing oesophagitis, with increasing severity
noted with increasing acid exposure. There seems to be strong evidence of
the role for acid, with a positive response to a trial of PPI being diagnostic of
LPR. The current parameters for pH probe studies identifies an acid reflux
episode when a reflux event is below a pH of 4.068. It is well known that
laryngeal epithelium is more sensitive to injury by gastric refluxate than
oesophageal mucosa68. Whilst up to 50 episodes of reflux in the distal
oesophagus may be considered physiologically normal, Koufman2 described
as few as 3 episodes per week in the proximal oesophagus may lead to
laryngeal injury.
Multiple studies have identified damage to laryngeal mucosa, in a number of
laryngeal sub-sites, such as the posterior commissure, the vocal folds and
supragolttis, on exposure to acid at pH levels of 2.0. Bulmer et al33 found
these areas were resistant to damage following incubation in a test solution
of pH 4.0, however there was injury to the subglottic region, an area of
columnar epithelium. Despite this, it has been postulated that the impact of
gastric HCl on the laryngopharynx is diminished due to secretions from the
salivary glands and oesophagus35. There is evidence of weak acidic reflux
episodes (pH <5.0) and even non-acid reflux episodes lead to laryngeal

! $&!
injury68. Furthermore multiple studies have identified a synergistic effect of
both acid and pepsin in effecting inflammatory changes in the larynx69,70.
1.7.1.2 Pepsin Pepsin is a proteolytic enzyme, with its precursor, pepsinogen, released in
the stomach from chief cells. It is increasingly implicated in LPR due to its
proposed role in both acid and non-acid reflux. Multi-channel intra-luminal
pH monitoring impedance studies have identified episodes of gastric reflux
that are either non-acidic or weakly acidic in symptomatic patients71,
suggesting mucosal injury might be caused by non-acid refluxate
components such as bile salts and pepsin. The damaging effects of pepsin
in an acidic environment have been well described previously2, with an
optimum activity at a pH of 2.072. Recent research has proposed that pepsin
is a causative agent of laryngeal damage in non-acidic reflux71,73-75.
Whilst pepsin is inactive at a pH of 6.572, it is irreversibly inactivated at a pH
of 8.076. Recently it has been shown that at 37oC pepsin remains stable at a
pH of 7.0 for more than 24 hours, retaining nearly 80% of its original activity
on re-acidification. With a mean pH of 6.875, the larynx may contain stable
‘active’ pepsin, potentially causing more damage with subsequent reflux
episodes. Additionally there is evidence that such pepsin is actively
transported into and remains in, laryngeal epithelial cells75,76. The pH of
intracellular structures such as Golgi bodies and lysosomes lie between 4.0

! $'!
to 5.0. Whilst the laryngeal mucosa is exposed to inactive pepsin,
intracellular uptake into this micro-environment allows for the acidification of
pepsin. This may lead to intracellular injury. 76
Furthermore, a significant association has been found between the presence
of pepsin in laryngeal epithelia in patients with reflux-attributed laryngeal
disease and depletion of two laryngeal protective proteins; carbonic
anhydrase isoenzyme III (CA3) and Sep70, a squamous epithelial stress
protein76,77. It is of note that both of these proteins are depleted after
exposure to pepsin and not in response to low pH alone, suggesting a
specific role for pepsin in laryngeal damage.
1.7.1.3 Bile Whilst recent research has suggested pepsin and acid play a role in the
pathogenesis of LPR, few studies have considered the role of non-acidic
duodenogastroesophageal reflux (DGER). Clinical studies have
demonstrated that duodenal secretions are capable of refluxing into the
stomach and oesophagus78,79. There is also evidence that a bilious reflux
causes injury to the oesophageal mucosa, with a graded increase in
oesophagitis with increasing exposure to biliary pigment in symptomatic
patients. Such duodenal secretions have been demonstrated to be
capable of causing damage, with evidence that bile salts lead to
oesophageal mucosal injury, however there is a variability in injury according

! $(!
to the type of bilious reflux and the acidity of the refluxate. Interestingly
conjugated bile salts had been found to cause mucosal injury at a pH of 1.2
to 1.5, whereas un-conjugated salts were found to increase mucosal
permeability and injury at a pH of 7.0 or higher, but not at a lower pH80. In
an experimental setting, conjugated bile acids are more injurious to mucosa
at an acidic pH, whilst chenodeoxycholic acid is more active at a pH of 5.0 to
8.080.
Furthermore, recent research80 exposed the laryngeal mucosa of rats to
taurocholic acid and chenodeoxycholic acid at a range of pH 1.5 to 7.4.
Using a negative control, this study found taurocholic acid was injurious to
laryngeal mucosa at a pH of 1.5, where as chenodeoxycholic acid caused
the maximum inflammation at a pH of 7.4.
Previous research has demonstrated a role of bile acids in oesophagitis,
Barrett’s metaplasia, dysplasia and oesophageal adenocarcinoma81. In
addition, induction of cyclo-oxygenase-2 (COX-2) expression has been
implicated as a mechanism in carcinogenesis82. Sung et al83 studied the
effect of bile salts on cultured hypopharyngeal cells, finding
chenodeoxycholate induced the up-regulation of mRNA as well as COX-2
protein in a dose-dependent manner.
The above indicates that bile has a mechanism for generating laryngeal
injury, in both acidic and non-acidic environments. However it remains to be
determined whether the same mechanism occurs in the human larynx. In
! $)!
addition, whilst hydrochloric acid and pepsin appear to have a synergistic
effect, the relationship between bile salts and pepsin is more complex. A
number of studies have demonstrated that bile salt, particularly taurine-
conjugated salts, actually reduce pepsin proteolytic activity at a pH of 2.
Furthermore, a recent study noted that whilst pepsin activity was pH
dependent, bile acids did not attenuate the activity of pepsin 84.
Consequently the role and interactions of all these components of refluxate
are yet to be determined.
1.8 Laryngeal Defences
1.8.1 Gastroesophageal junction Ultimately the reflux of gastric contents up the esophagus, and potentially
into the larynx and pharynx, is a failure of the lower oesophageal sphincter
(LOS) to control this retrograde flow. On occasion such retrograde flow is
desirable, for example to allow an urgent expulsion of gas, or emesis of
noxious agents. Consequently the LOS cannot be a simple, unchangeable
one-way valve.
Lying in the chest and abdomen, the LOS is sensitive to intra-thoracic and
intra-abdominal pressure. The LOS pressure itself varies with inspiration,
rising with diaphragmatic contraction secondary to the external force of the
crural fibres85. The transition from intra-thoracic to intra-abdominal sphincter
is noted when measuring with manometric tracing and is recognized as the

! $*!
respiratory inversion point. This is the point at which the pressure of the
oesophagus changes from negative to positive with inspiration, then from
positive to negative with expiration86. Consequently the primary line of
defence against reflux is this integrity, affected by the intrinsic lower
esophageal sphincter, extrinsic compression of the LOS by the crural
diaphragm, the intra-abdominal location of the LOS and integrity of the
phrenoesophgeal ligament.
There are multiple theories emerging on how reflux breaches the
gastroesophageal junction. Firstly, transient depressions in lower
oesophageal sphincter pressure, a recognized physiological phenomenon,
may be increased in frequency in patients with GORD66. GORD symptoms
have been attributed to both increased frequency of LOS sphincter
relaxations and increased frequency of acid reflux during these relaxations.
No study has yet demonstrated a relationship between these relaxations of
sphincter and LPR.
Secondly, hypotension of the lower oesophageal sphincter has been
proposed as playing a role in GORD and LPR. Grossi et al.87 demonstrated
transient relaxations in the lower oesophageal sphincter were the main
cause of distal reflux, also noting that hypotension of the LOS was more
likely to cause proximal reflux. Logically this proximal reflux is more likely to
reach the laryngopharynx88, which may suggest that hypotension of the LOS
is likely to play a causative factor in LPR. Despite this, studies measuring
basal LOS pressures in LPR patients have failed to find a significant
! %+!
difference to those in the control groups88,89. It is possible that due to the
infrequent episodes of reflux required to cause laryngeal inflammation,
monitoring over relatively short periods fails to find a significant difference
between normal and patients refluxing to the laryngopharynx.
1.8.2 Oesophageal motor function and acid clearance Normal motor function of the oesophagus allows boluses to be pushed by a
strong peristaltic motion from the cricopharynx down into the stomach.
These waves are either primary, triggered by the pharyngeal swallow, or
secondary. These secondary waves are triggered by stimulation of the
oesophageal mucosa. Of these it would appear that the primary peristalsis
is the most important for returning refluxate back to the stomach90.
Dysfunctional oesophageal motor function has consequently been
considered of significance in LPR. A number of studies have found impaired
oesophageal motility, measured by oesophageal acid clearance, or
manometric measurement, in patients with LPR91,92. Of further interest was
a conclusion that the primary oesophageal dysfunction associated with LPR
was not as severe as that found in patients with GORD91, this would lead to
less refluxate exposure in patients with LPR. Whilst GORD is manifest by
significant exposure of the oesophagus to acid reflux, a reduced exposure
time experienced by the patients with LPR may provide enough refluxate to
damage the larynx, without causing the typical oesophageal symptoms
associated with GORD66.

! %"!
1.8.3 Upper oesophageal sphincter The upper oesophageal sphincter (UOS) is the high-pressure zone located
between the pharynx and cervical oesophagus, protecting the reflux of food
into the airway and air into the digestive tract. The UOS tonically constricts,
relaxing to allow boluses of food or fluids with swallowing. Studies
measuring UOS pressures found similar average pressure levels in patients
with LPR to controls88,93. However whilst the average pressure itself was not
significantly different, the duration of tonic pressure was nearly double in the
control group compared to a group with GORD66. Torrico et al94 found
nearly all reflux events were associated with such an increase in UOS
pressure. Consequently a shortened period of UOS pressure may allow
greater opportunity for refluxate to enter the laryngopharynx. To date,
however, no studies have measured this.
1.8.4 Mucosal Resistance Once past the upper oesophageal sphincter, intrinsic mucosal defences
remain the sole barrier to refluxate. Significant amounts of research have
concentrated on the role of both damaging agents, and the mucosal
response to refluxate, both in vitro and in vivo studies. Despite this, the role
of inflammatory mediators has yet to be determined, however may play a
role in both the defences and the propagation of signs and symptoms.

! %#!
1.8.4.1 Inflammatory Markers: Damage to mucosal linings of the oesophagus is well recognized on the
macroscopic level, with mucosal ulceration, or columnar-lined distal
oesophagus. At a more subtle level, injuries to this lining can occur at the
histological and microscopic level and is recognized in the presence of
inflammation. Additionally ultra-structural changes in the intercellular gaps
of the mucosa have been recognized on electron microscopy which correlate
with mucosal injury95. Such damage has significant consequences,
particularly given chronic inflammation is associated with carcinogenesis. In
the oesophagus, chronic inflammation of the squamous epithelium from
GORD is recognized as leading to intestinal metaplasia, dysplasia and
eventually oesophageal adenocarcinoma96. Given the aetiology of LPR is
similarly due to the refluxate of gastric contents, it is possible that a
comparable pathological process may ensue, including the potential for
tumourgenesis in the larynx.
Prior to these macroscopic and microscopic changes more subtle molecular
changes alter the expression of genes involved in aspects of the cell cycle
such as cellular repair, proliferation and migration. Consequently research
has suggested that a more sensitive assessment of mucosal injury may lie in
the measurement of the genes involved in these processes96 and progress
our identification of changes beyond subjective viewing with endoscope or
microscope.

! %$!
1.8.4.2 Interleukin 8 At the molecular level, some pathways associated with inflammation are
similar to those involved in carcinogenesis. The nuclear factor-!B is one
such pathway that activates interleukin-8 (IL-8) as a major downstream
product. Nuclear factor-!B is a transcription factor that regulates many
genes involved in the inflammatory process and is known to increase the
expression of genes for many cytokines, enzymes and adhesion molecules
in chronic inflammatory diseases97. It is known to reside in cytoplasm of
most cells as an inactive heterodimer consisting of p50 and RelA subunits
complexed to the inhibitory I!B, which prevents the migration of the
heterodimer into the nucleus. When stimulated NF-!B translocates to the
nucleus and binds to its specific site and up-regulates the transcription of a
variety of genes that are involved in the inflammatory and immune
response98. Further research has suggested NF-!B has a role in regulating
cell proliferation, tumour development and cell transformation, with altered
levels of NF-!B expression seen in a number of tumours98. Several studies
have found NF-!B to have an anti-apoptotic function in breast cancer and
hepatocellular carcinoma99,100. Conversely, inhibition of NF-!B may lead to
cellular apoptosis101. It is now well recognized as having an important role in
progression of cancer of the oesophagus96,98. In fact many studies have
also demonstrated an over-expression by tumour cells of IL-8, a major
product of the NF-!B pathway.
IL-8 is recognized as a unique protein that possesses dual roles in
inflammation and carcinogenesis and is recognized to be directly up-

! %%!
regulated by NF-!B activation102, although additional hormone response
elements and NF-IL-6 consensus site have also been characterized on the
IL-8 gene promoter103. The biological effects of IL-8 are mediated through
binding of IL-8 to two cell-surface G protein-coupled receptors, called
CXCR1 and CXCR2. These two receptors have markedly distinct ligand-
binding pharmacology, with CXCR1 being activated in response to binding of
IL-8 and granulocyte chemotactic protein-2. CXCR2 is activated by multiple
CXC-chemokines, including growth-related oncogenes (GRO", # and $),
neutrophil-activating peptide and granulocyte chemotactic protein-2103.
Oesophageal damage from reflux demonstrates a well-defined progression
from intestinal metaplasia, dysplasia through to oesophageal
adenocarcinoma. In one study considering a wide range of oesophageal
biopsies, a progressive increase in IL-8 mRNA expression was found,
corresponding to worsening mucosal injury, with the highest expression
found in adenocarinoma102. Such findings would suggest that IL-8 is
associated with the progression of mucosal injury in GORD and the
significant increase in IL-8 expression with the development of dysplasia
would suggest a role for IL-8 mRNA levels as a biomarker for disease
progression in patients with intestinal metaplasia102. Consequently as a
marker for inflammation, IL-8 may provide a potential biomarker for similar
refluxate changes in the larynx.
! %&!
1.8.4.3 Interleukin 6 Similarly interleukin-6 (IL-6) is a multifunctional cytokine that plays a pivotal
role in the acute inflammatory pathway. There is evidence that reflux
induced damage in the oesophagus leads to increased gene expression of
IL-6, consistent with an inflammatory state. A recent study considered
changes in gene expression in oesophageal mucosal biopsies from patients,
with non-erosive reflux and erosive reflux groups compared to controls104.
Overall they found expression of IL-6 was increased in both the non-erosive
and erosive reflux groups. In addition, levels of IL-6 increased according to
the degree of reflux pathology, consistent with increasing inflammation.
Similarly, following treatment, such levels decreased.
It would be reasonable to suggest similar patterns of gene expression would
be responsible for mediating inflammation in LPR, which is proposed as
having a similar aetiology, just at a more proximal anatomic site. However
studies into inflammatory gene expression in LPR are scarce in the
literature. One of the few studies investigating inflammatory cytokines in
LPR did so comparing any change between pre- and post-treatment with a
PPI following diagnosis by oesophageal manometry, 24-hour pH monitoring
and videolaryngostroboscopy105. Taking tissue biopsies from the posterior
commissure, changes in gene expression were measured in a number of
common mediators of inflammation, including IL-6, IL-8, transforming growth
factor-# 1 (TGF!-1) and vascular endothelial growth factor (VEGF). They
found no significant change in gene expression of inflammatory cytokines
following a 10-week course of 20mg twice-daily dose of rabeprazole. Given

! %'!
the lack of control group, it was difficult in this study to identify if there was a
true increase in gene expression in the LPR patients prior to treatment. In
addition, a 10-week course at such a dose may not be of sufficient length, or
strength to provided a therapeutic benefit. Furthermore it highlights the
difficulty in diagnosis of LPR for research purposes. Consequently the role
of such acute inflammatory markers remains uncertain in LPR.
1.8.4.4 Transforming Growth Factor # - 1 Transforming growth factor # - 1 (TGF#-1) belongs to a group of cytokines
which have a diverse range of actions, including regulating epithelial cell
growth, differentiation, motility, organization, apoptosis and
tumourgenesis106. Its role in inflammation is complex, with some studies
noting increased levels in fibroproliferative disorders of many organs,
including airways and lung parenchyma107. In addition, a study investigating
subglottic stenosis found TGF#-1 was stimulated in tracheal injury,
promoting the transformation of tracheal fibroblasts into myofibroblasts107.
Furthermore, exposure to gastric juice promoted a similar transformation,
suggesting that such refluxate may play a role in such stimulation. A study
investigating the time of exposure to acid and pepsin in posterior
commissure biopsies and false vocal fold found a significant relationship
between time, level of pH and exposure to pepsin, with statistically
significant changes in expression of TGF!-1 and VEGFA in the posterior
commissure region. It is of interest to note that the false vocal fold was more
sensitive to a pH effect in this study108.
! %(!
1.8.4.5 Carbonic anhydrase III Carbonic anhydrase (CA) is an integral component of the intrinsic defence
system and is effective by catalyzing the reversible hydration of carbon
dioxide. This produces bicarbonate ions that are then actively pumped into
the extracellular space where acidic refluxate can be neutralized. In the
oesophagus this plays a significant role with carbonic anhydrase capable of
increasing the pH of gastroesophageal refluxed residual acid from 2.5 to
close to neutral109.
There are eleven identified carbonic anhydrase isoenzymes110, with
demonstrated differences in activity, susceptibility to inhibitors and tissue
distribution. CAI, II, III and IV have been demonstrated to be expressed by
oesophageal epithelium and changes in distribution occur in inflamed
oesophageal biopsy specimens.110 CAIII has been noted to be both
increased in expression and to undergo a redistribution from the basal to the
suprabasal cell layers in inflamed oesophageal mucosa from patients with
GORD110,111. It is thought that these changes are due to refluxate and
represent attempts to counteract damage112. It has been proposed that an
increase in CAIII expression may be due to basal cell hyperplasia, which is a
histological sign of oesophagitis110.
Recent research has demonstrated that CAI, II and III are present in normal
laryngeal epithelial cells to a variable extent110,113. CAIII has been
demonstrated in the squamous epithelial cells of the oesophagus and in the

! %)!
posterior commissure area of the larynx112. CAI and CAII have been
demonstrated in both the vocal cord and inter-arytenoid areas and CAIII
throughout the laryngeal epithelium. Expression of CAIII in patients with
laryngopharyngeal reflux is noted to differ between laryngeal biopsy
locations110. In the presence of laryngopharyngeal reflux and pepsin in
particular, CAIII expression in the vocal fold is potentially decreased allowing
further damage to occur from acidic refluxate. Conversely CAIII may
increase in the posterior commissure as a response to laryngopharyngeal
reflux74, with symptom severity correlating with CAIII levels113. Given the
larynx possesses areas of respiratory type epithelium in addition to
squamous epithelium, there remains the possibility that certain areas of the
larynx may vary in response to laryngopharyngeal reflux, although a large
scale study looking at epithelial type in all areas of the larynx in LPR is
currently lacking.
1.8.4.6 E-cadherin The cadherin family of molecules are calcium dependent cell-cell adhesion
molecules and mediate homophilic adhesion. E-cadherin is recognized as
having a crucial role in the maintenance of epithelial integrity and barrier
function112. As such, damage to this barrier from refluxate may also lead to
a breach of the mucosal barrier. Pepsin has been proposed to damage
structures by digesting intracellular structures that maintain cohesion
between cells112. Reduced levels of E-cadherin in response to
laryngopharyngeal reflux have been demonstrated114 and it is not clear

! %*!
whether this down-regulation is due to the refluxate components, such as
acid and pepsin, or as a result of an inflammatory response associated with
laryngopharyngeal reflux.
Decreased expression of E-cadherin has been associated with poor
prognostic factors in head and neck squamous cell carcinomas, including
vascular invasion and decreased survival115. There is strong evidence that
E-cadherin is a tumour suppressor, with the loss of E-cadherin being a key
first step in tumour invasion115. Consequently decreased E-cadherin in the
presence of laryngopharyngeal reflux may play a component in the
development of laryngeal symptoms and may contribute to the development
of laryngeal carcinoma in the setting of reflux.
1.8.4.7 Mucins Mucus is a selective physical barrier covering the luminal surfaces of
epithelial organs in the body. It forms a gel which protects the extracellular
milieu on one side and the plasma membrane and cell interior on the other
side. In addition to protection, mucus assists in lubrication and transport.
Throughout the body mucus has specific functions. In the gastrointestinal
tract it protects epithelial cells from autodigestion, where as in the cervix it
protects the uterine cavity and controls the survival and penetration of
spermatozoa116. Clearly, mucins provide multiple functions in a variety of
environments and with interfaces varying from air, food, fluids and
colonization with microorganisms. Such environments are susceptible to

! &+!
diverse ranges of hydration, oxygenation, ionic concentration and pH117. It is
hardly surprising then that there are currently 20 known mucin genes, which
encode the backbone of mucins and of these, 16 have been identified in the
airway116. They have a crucial role in maintaining homeostasis, promoting
cell survival and regulate the local molecular microenvironment near the cell
surface.
Mucins are high molecular weight glycoproteins and possess a protein
backbone and oligosaccharide side chains. These side chains are attached
by O-glycosidic linkages to either a serine or threonine reside. They are
categorized into either secreted, or transmembrane (Table 1). Secreted
mucins can further be classified into gel-forming mucins (such as MUC2,
MUC5A, MUC5B) and non-gel-forming (MUC 7, MUC8).
There is evidence that inflammatory mediators and bacterial products may
affect specific mucin gene expression. Interleukin-9 (IL-9) and 13 have been
demonstrated to up-regulate mucus expression in airway inflammation and
MUC2 expression is up-regulated by tumour necrosis factor - " (TNF-")116.
Furthermore MUC5B expression has demonstrated to be up regulated by IL-
6, 17 in addition to TNF-".
Samuels et al.118 studied laryngeal biopsies from a small group of patients
with laryngopharyngeal reflux (n =3) and controls (n =2). Mucin 1-5, 7, 9, 13,
15, 16, 18-20 were detected in normal laryngeal epithelium, with 6, 8 and 17
absent. Of these, MUC1 and MUC4 were the predominant transmembrane

! &"!
mucins and MUC5AC, MUC5B and MUC2 the major constituents of airway
mucus in the laryngeal epithelium. In the patients with laryngopharyngeal
reflux, there was a decreased expression of MUC5AC, -5B and -2. This
would lead to an overall decrease in mucin secretion from the laryngeal
epithelium resulting in decreased protection from further reflux episodes.
This is consistent with a gastroesophageal reflux disease model in which
oesophageal mucin secretion was also reduced in patients with reflux
oesophagitis119.
Alterations in mucin expression have been identified in a variety of
inflammatory conditions including gastritis, peptic ulcer disease and
intestinal neoplasia and inflammatory bowel diseases. A lower level of
MUC3 expression has also been noted in laryngopharyngeal reflux patient
samples118. MUC3 has been noted to play an active role in epithelial cell
restitution120. Specifically MUC3A mucins are thought to play a role in the
maintenance of intestinal epithelium during hypoxic conditions121 and
modulating cell migration and apoptosis to promote wound healing120.
Recently, mucins were suggested to be involved in the pathogenesis of
cancer. Recent studies have indicated that MUC1 and MUC4 may modulate
various pathways contributing to cell growth122. MUC1 is known to be over-
expressed in pancreatic and colon cancers and over 90% of breast
cancers123. Multiple effects of MUC1 on tumourgenesis are recognised.
Firstly it is known to act as a natural ligand of galectin-3 in human cancer
cells and the interaction between galectin-3 and cancer-associated MUC1

! &#!
enhances cancer cell-endothelial adhesion, which may promote
metastasis124. Secondly, as a transmembrane protein, its cytoplasmic tail
binds with the ErbB family of growth factor receptor tyrosine kinases and
potentiates ErbB-dependent signal transduction in the MUC1 transgenic
breast cancer mouse model. MUC1 activation is thought to increase cell
proliferation by activating extracellular signal-regulated kinases122 and it
plays a role in protection against oxidative stress-induced cell death122.
One study found high expression of MUC1 in patients with laryngeal
dysplasia and cancer125. High expression was also reported in the “control”
patients’ larynx, however these samples were not from healthy controls.
The role of MUC1 in the context of laryngeal pathology remains unclear and
further research is required to characterize MUC1 expression in patients with
laryngopharyngeal reflux through to laryngeal cancer.
MUC4 is expressed in epithelial surfaces of the oral cavity, eye, salivary
glands and many other epithelial surfaces to protect and lubricate. In a
retrospective analysis of laryngeal cancer specimens MUC4 was identified in
nearly half of the specimens126. In this study, the presence of MUC4 was
associated with a trend to better survival in patients with advance stage non-
metastatic laryngeal cancer. In contrast other research has shown
pancreatic, bile duct and lung cancers over-express MUC4 and MUC4 is
associated with a poorer prognosis in these tumours122. Consequently
whilst there are proposed mechanisms for tumour progression in other
cancers, the role of MUC4 in laryngeal cancer is still unclear.
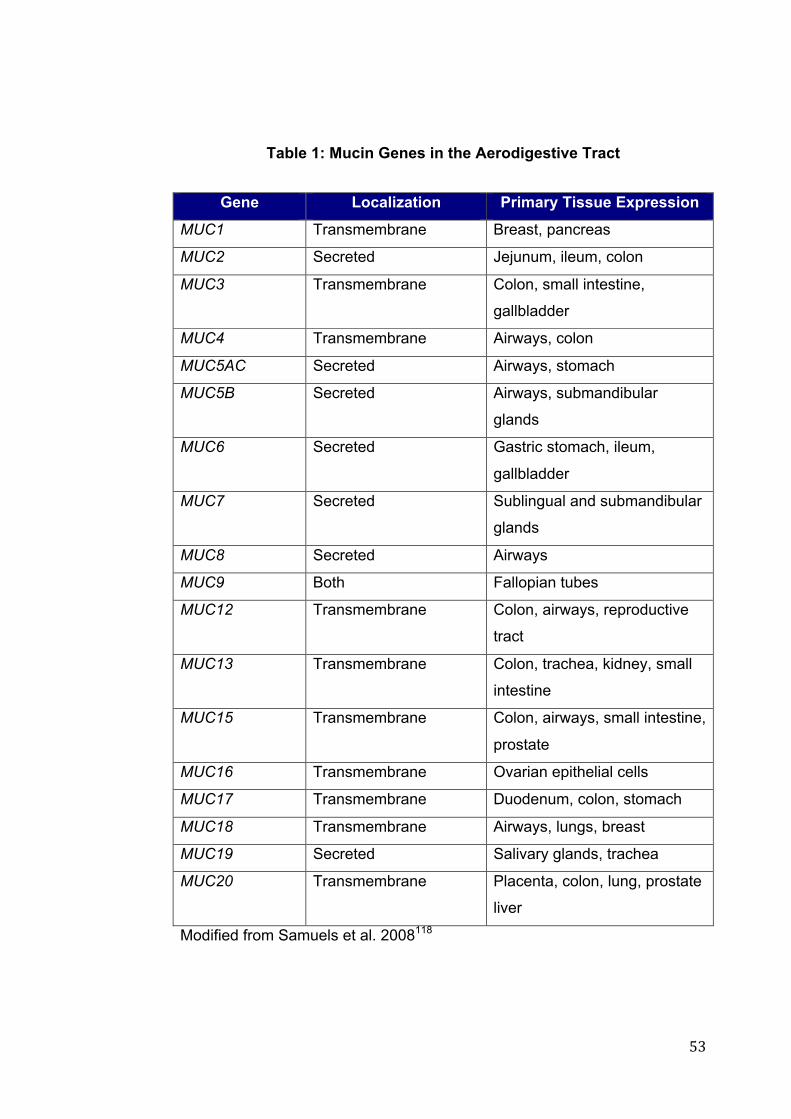
! &$!
Table 1: Mucin Genes in the Aerodigestive Tract
Gene Localization Primary Tissue Expression
MUC1 Transmembrane Breast, pancreas
MUC2 Secreted Jejunum, ileum, colon
MUC3 Transmembrane Colon, small intestine,
gallbladder
MUC4 Transmembrane Airways, colon
MUC5AC Secreted Airways, stomach
MUC5B Secreted Airways, submandibular
glands
MUC6 Secreted Gastric stomach, ileum,
gallbladder
MUC7 Secreted Sublingual and submandibular
glands
MUC8 Secreted Airways
MUC9 Both Fallopian tubes
MUC12 Transmembrane Colon, airways, reproductive
tract
MUC13 Transmembrane Colon, trachea, kidney, small
intestine
MUC15 Transmembrane Colon, airways, small intestine,
prostate
MUC16 Transmembrane Ovarian epithelial cells
MUC17 Transmembrane Duodenum, colon, stomach
MUC18 Transmembrane Airways, lungs, breast
MUC19 Secreted Salivary glands, trachea
MUC20 Transmembrane Placenta, colon, lung, prostate
liver
Modified from Samuels et al. 2008118
! &%!
1.9 Treatment options for LPR
1.9.1 Lifestyle Factors It has long been recognized that food and beverages which contain caffeine,
such as coffee, teas and carbonated beverages, alcohol, chocolate and
peppermints can weaken the oesophageal sphincter127. Even decaffeinated
teas and coffees still contain enough caffeine to affect the sphincters. Acidic
foods may also further complicate symptoms. The majority of foods have a
pH range between 2.5 and 6.0. Foods with a pH above 4.6 are classed as
low-acid foods, examples of which include meats, poultry, seafood, milk and
many fresh vegetables. Franco127 suggested that acid and spicy foods may
directly irritate the throat lining, leading to inflammation and potentially
providing re-activation of the pepsin deposited in the laryngopharynx from
LPR.
Koufman128 conducted a study on patients with LPR recalcitrant to treatment
by PPI twice daily and an H2-receptor antagonist at night. The patients were
placed on a strict low acid diet (defined as no food with a pH below 5), for 2
weeks, to 4 weeks. There was a statistically significant drop in both the RSI
and RFS at follow up. The mean RSI dropped from 14.9 to 8.6, with the
mean RFS dropping from 12.0 to 8.3. Koufman felt one of the main issues
was the acidification of the American diet, related in part to the prevention of
bacterial growth which prolongs shelf life of foods.

! &&!
It seems reasonable to assume that reduction in food and lifestyle factors
which promote reflux are likely to improve LPR symptoms. However there
are few studies confirming this. Koufman’s study highlights that there are
likely to be other, possibly confounding factors which impact on symptoms in
patients with LPR and few studies have considered dietary factors in the
management of LPR.
1.9.2 Proton Pump Inhibitors Given the proposed aetiology of LPR, and the close association with GORD,
the use of acid suppression treatment has had a significant role in the
management of the disease. However such associations are difficult to
confirm, as even pH probe demonstrated reflux, whilst confirming the
presence of refluxate, does not truly prove causality and in addition such
studies have not predicted response to acid-suppression treatment129.
Despite this, a proton pump inhibitor is typically commenced in the clinical
situation, with a satisfactory response being therapeutic for the patient and
also considered diagnostic of LPR. Research investigating the efficacy of
PPI use in LPR is still widely variable, and probably reflects the
heterogeneous clinical response to treatment and the likely wide spectrum of
disease. Furthermore the presence of abnormal proximal reflux on pH
monitoring does not predict response to therapy129.

! &'!
Altman et al.130 reviewed published clinical practice guidelines on the
management of GORD and LPR, identifying 13 key articles, with the majority
of experts agreeing that empirical treatment with PPI is the current
recommendation, however the dose and the length of treatment is widely
debated. Despite this, a meta-analysis reviewing eight randomised
controlled trials found a non-significant symptom reduction compared to
placebo.
Furthermore, the length of time required to treat successfully and the rate of
response is still unknown. Generalised laryngeal oedema and erythema
have been described as responding to appropriate medical therapy, however
there has been no significant change in the degree of posterior commissure
pachyderma in some studies PPI treatment for LPR, even up to over 3 years
of treatment131. It has been proposed that this may represent an irreversible
histopathological transformation. It has been described that exposure to
gastric secretions in this area can promote epithelial hyperplasia of the
prickle and basal cell layers and some keratinisation27. Consequently it may
represent that the patient has been exposed to LPR, however may not
currently be suffering. Furthermore the question remains on whether the
symptoms are due to the reflux event itself, or due to these histopathological
changes.
In addition there are increasingly recognized side effects of PPI use. PPIs
are not without their problems with a number of adverse consequences
reported in the literature. A large (n = 13556) case control study suggested

! &(!
that long term use of PPI significantly increased the risk of hip fracture
(AOR: 2.65), with the strength of association increasing with duration of
therapy132. The proposed mechanism for this was still uncertain, but may
be related to the change in acidity of the stomach environment inhibiting the
release of ionised calcium from insoluble calcium salts.
Furthermore, there is evidence that ongoing use of PPIs may change the
distribution of gastrointestinal tract defences, with use for greater than one
month relaying a ten-fold increase in the risk of developing Campylobacter
related diarrhoea, an increased risk of Salmonella infection and of the
development of Clostridium difficile in hospitalised patients133.
In summary, PPI use is considered the mainstay of treatment for LPR,
however there are a number of issues related to its use. Firstly, there is a
treatment group which remains unresponsive to PPI use. Research into the
characteristics of this group is still pending, and likely to be awaiting a
satisfactory diagnostic test and the ability to monitor treatment outcomes.
Secondly the use of PPI, whilst providing an improvement in symptoms in a
significant population group, still possess risk in prescribing and as such
should be utilised judiciously. Lastly, the time required to provide relief
remains yet to be determined.
! &)!
1.9.3 Alginates Other management strategies studied includes the use of liquid alginate
suspension. Liquid alginates have been utilized for the treatment of gastric
reflux for many years and are thought to work by providing a mechanical
anti-reflux barrier within the fundus of the stomach134. One study compared
the use of 10mL of Gaviscon Advance with a non-treatment group.
Treatment outcomes were measured using the RSI and RFS at 2, 4 and 6
months134. Whilst there was a significant improvement in RSI and RFS
scores from the commencement of the study to month 2, and 6 months in
the treatment group, there was also a statistically significant improvement in
RSI from commencement to both month 2 and 6 for RSI in the non-treatment
group. It was notable that there was no statistically significant improvement
in RFS for the non-treatment group. This would indicate that there may be a
symptomatic improvement, without any significant change in examination
findings. This may be due, in part, to a placebo type effect, or represent
symptomatic improvement predating a significant change in RFS. Despite
this, there was evidence that treatment with Gaviscon Advance
demonstrated statistically significantly greater improvement in RSI than no
treatment after 2 months and 6 months. Further research is required to
determine its role either as a sole agent, or together with a PPI in LPR.
1.9.4 Antidepressants Selective serotonin reuptake inhibitors (SSRIs) such as citalopram 20mg,
have been demonstrated to prolong the acid perfusion time to induce a

! &*!
perception of heartburn. Additionally they have been described as being
highly efficacious in patients with non-cardiac chest pain of presumed
esophageal origin135. Tricyclic antidepressants have also been considered
similarly135. Whilst commencing such medication may provide symptomatic
relief, surely the damage afforded to the area of reflux would still be
occurring. Additionally given GORD typically responds to short courses of
anti-reflux medication, it may well be the case that LPR, which we know
often requires much longer term treatment, may not respond to this at all.
This may be the case given the acid bolus is the sensitising agent in
oesophageal reflux and a delayed time to perception would allow the
esophagus with its typical protection systems, time to clear the bolus. The
pathophysiology of LPR, with its more insidious mechanism, may not prove
responsive to such management and the utilization of such medications has
been hypothesized, but is not routine.
1.9.5 Surgical Fundoplication has been recognized as providing a significant improvement
in patients with typical esophageal reflux symptoms. However patients with
LPR, by definition fall into the atypical symptomatic population.
Consequently there remains uncertainty to the level of improvement
following fundoplication for this population. Undoubtedly there are
subgroups of patients with symptoms who would demonstrate greater
improvements than others. There is a well described and understood
mechanism for typical symptoms of esophageal reflux. Equally much less is
! '+!
known about the pathophysiology for these atypical symptoms and
consequently the results of both medical and surgical managements have
been difficult to qualify, however some studies have proposed that patients
with LPR were a favourable group for successful surgery for reflux136. There
seem to be some factors which make improvement following surgery more
likely.
Similar to patients with GORD, those with LPR symptoms, who
demonstrated a response to pre-operative trial blockers of a PPI, also noted
improvement following fundoplication137. Such improvement was measured
by a greater than 3 point improvement on a 10 point symptom
questionnaire136. In addition, patients who demonstrated acid above the
cricopharyngeal level, demonstrated by dual probe pH testing, also
demonstrated success following fundoplication136. Additionally, other studies
have suggested that pharyngeal pH monitoring may predict patients most
likely to benefit from surgical therapy136,137.
Conceptually fundoplication as the management of LPR should provide
greater improvement than acid suppression alone, given the significance of
pepsin in refluxate. Fundoplication should significantly reduce the volumetric
bolus to the larynx, providing greater defence than PPI alone. However, a
recent review of 893 consecutive patients following fundoplication found
there was variability in improvement. Patients presenting with both throat
and classical GORD symptoms had a similar improvement overall to those
with just classic GORD symptoms. However, patients presenting with only
! '"!
throat symptoms and with objective evidence of reflux on 24-hour pH probe
monitoring had a significantly poorer outcome, with less than 50% of patients
improving following surgery138.
Such heterogeny in treatment outcomes, whether it be PPI use, or
fundoplication, implies a wide spectrum of disease and the likelihood of LPR
sub-groups. At present there is not sufficient understanding of the
pathophysiology to categorise patients, however this may become important
in selecting a successful treatment modality in the future.
! '#!
1.10 Conclusions Despite the abundance of research literature, there are many significant
controversies regarding LPR. It is still not known whether LPR is a laryngeal
symptom extending from GORD, or whether it is a separate clinical entity.
Some experts are suggesting the latter, given a different pattern of
symptoms, with the presence of an upright reflux pattern and typically
normal oesophageal motility testing in patients with LPR130. Additionally,
there is significant discord on what actually constitutes abnormal pharyngeal
exposure to refluxate, with the sensitivity of pH testing reported to be as low
as 40%139,140.
Previous literature supports a variability in mucosal response within the sites
of the larynx, with the most commonly biopsied site typically being the
posterior commissure and the vocal fold. A recently published study
highlights the difficulty in the clinical diagnosis of LPR, particularly on
identifying mucosal signs alone and calls for further research into mucosal
changes in LPR65. In addition, given the histology of the larynx varies
according to the sub-site, no single study has considered mucosal changes
in all sub-sites of the human larynx.

! '$!
1.11 Hypotheses
, The mRNA expression of inflammatory and mucosal defence genes
will differ between patients clinically diagnosed with
laryngopharyngeal reflux and a control population.
, The mucosal expression patterns will vary according to the laryngeal
sub-site between patients clinically diagnosed with laryngopharyngeal
reflux and a control population.
! '%!
1.12 Aims Consequently the aims of this project were to determine if there is a group of
molecular markers which are altered in patients with LPR compared with a
non-refluxing population. Secondly, this study aims to further identify
molecular differences in the sub-sites of the larynx. Previous literature has
noted differing responses throughout the larynx33,74,112 often focusing on the
posterior commissure and vocal fold. Bulmer et al.33 noted a variability
throughout the sub-sites of porcine larynges using histological analysis,
measures of optical density and a DNA assay to quantify tissue damage.
However no study has previously considered all aspects of the human
larynx.
Such markers, or set of markers, together with a specific laryngeal location,
may provide a mechanism for monitoring the response to treatment and
potentially identifying those patients that may fail empirical management.

! '&!
2 CHAPTER 2: METHODS
! ''!
2.1 Patient Recruitment Ethical approval was sought and provided by the Southern Adelaide Clinical
Human Research Ethics Committee (SAC HREC). Patients were recruited
from those referred to the ENT Department at a tertiary teaching hospital
and associated private consulting rooms with a clinical history (including
hoarseness, chronic cough, globus pharyngeus) and examination suggestive
of LPR, and undergoing a panendoscopy or microlaryngoscopy under
general anaesthetic. Given the possibility that chronic irritation from
refluxate may lead to laryngeal cancer48, patients with suspected
malignancies were also identified and included in the initial patient
recruitment group.
Control patients were recruited from patients on elective surgery waiting lists
from Otolaryngology, Orthopaedic and General Surgery units. Patients were
included if they had no clinical history or examination findings consistent with
reflux. Additionally if they had a history of upper aerodigestive tract
inflammatory conditions they were excluded from the control population. For
ethical reasons the examination and collection of research biopsies in the
control group could not alter the type of anaesthetic they would receive for
their primary procedure, including type of endotracheal tube. Consequently
patients undergoing procedures in which the anaesthetist would typically
utilise a supraglottic airway, such as a laryngeal mask airway (LMA) were
excluded from the study due to being unable to assess and biopsy the
! '(!
larynx. Other exclusion criteria included being under the age of 18, or over
80 years of age or a patient decision to withdraw from the study.
Patients were contacted prior to their day of surgery for their primary
procedure, and consented for laryngeal examination and collection of
biopsies from the 4 sub-sites of the larynx. Patients were given the Reflux
Symptom Index (Appendix 1) to complete prior to their procedure.
Laryngoscopy and collection of tissue biopsies were typically conducted by
either myself, or the overseeing consultant ENT surgeon. Laryngeal
examination was conducted under general anaesthetic utilizing appropriate
scopes, typically Storz Lindholm (Figure 7), or Kleinsasser laryngoscopes,
with suspension where available. Assessment of the larynx was conducted
utilizing the previously validated Reflux Finding Score57 (Appendix 2).
Tissue biopsies were taken from the 4 sub-sites with 2mm cupped
microlaryngoscopy biopsy forceps (OP304R: B Braun/Aesculap, Melsungen,
Germany) (Figure 8). Tissue biopsies were collected in a standardized
order, commencing with the true vocal cord (away from the vibrating edge to
avoid any impact on voice), then the false vocal cord, the medial arytenoid
and finally the posterior commissure (Figure 9). Separate biopsy forceps
were utilized to collect each sample to avoid contamination from each site. If
there was evidence of a likely tumour, then biopsies were taken of the lesion
for diagnostic histopathology, and samples taken of the lesion and adjacent
the lesion for research purposes. Haemostasis was achieved with

! ')!
temporary placement of neuropatties soaked in 1:10 000 adrenaline solution
on the mucosa.
2.2 Tissue Storage
Biopsy samples, averaging 0.0015g, were placed in RNAlater% (Ambion
USA), ensuring there was greater than 5 volumes of RNAlater per tissue
sample. The tubes were labeled and catalogued according to site. These
were stored at 4°C overnight, as per the RNAlater manufacturer’s protocol,
before being stored at -20°C for later analysis. A representative piece,
approx 1/3 the size of the specimen was cut to send for histology. If the
specimen size did not allow sufficient material for histological examination,
the entire specimen was kept for RNA processing only.
2.3 Patient Groups
Patients were separated into 3 groups. Patients with a clinical history and
examination consistent with LPR, and an RSI greater than 12, and RFS
greater then 6, were classed as the LPR group57,60. Patients with no history
or examination findings consistent with reflux, were classed in the non-LPR
group. The third group of patients were an intermediate group, however
given the diagnostic difficulty with LPR, this middle group, with an uncertain
diagnosis, were not included in the analysis.

! '*!
Figure 7: Lindholm Laryngoscope
(author’s own photograph)

! (+!
a
b
c
d
Figure 8: Microlaryngeal 2mm Cupped Forceps
a) research biopsy set, b) individual 2mm cupped forcep, c) & d) close up of
cupped forcep tip.
(Photography courtesy of Flinders Medical Centre Dept of Medical
Illustration)

! ("!
Figure 9: Position of Biopsy Collection
Adapted from Gastrolab, 201222.

! (#!
2.4 Histological Analysis
A portion of each specimen, where possible, was sent for histological
analysis. The samples were embedded in paraffin, sectioned, and stained
with haematoxylin and eosin (H and E). These were analysed by an expert
histopathologist, who was blinded to the site and group of the sample.
Samples were assessed for tissue type (squamous or columnar), evidence
of metaplasia or dysplasia, and inflammation
2.5 QIAzol RNA Extraction Protocol
The QIAzol RNA extraction protocol was utilized based on the
recommendation by a QIAGEN technical development representative, to
ensure the downstream integrity for the real-time RT-PCR. All materials
were supplied in QIAGEN miRNeasy Mini Kit (Catalogue No. 217004,
QIAGEN, Valcencia, CA, USA), RNA extraction was conducted according to
the manufacturer’s protocol (QIAGEN, Valencia, CA, USA).
Samples were thawed, and weighed prior to extraction. RNA isolation
commenced with homogenization of tissue in 700µL of QIAzol (QIAGEN,
Valencia, CA, USA), using a plastic pestle attached to a vertical Dremel
rotary drill (Dremel, Illinois, USA). Chloroform was added, enabling
separation of aqueous and organic phases when centrifuged, with minimal
protein and DNA contamination of the RNA.

! ($!
The upper aqueous phase, containing the RNA, was collected, whilst the
remaining interphase and organic phase containing the genomic DNA and
cellular debris and proteins, were stored at -80°C for later use, if required.
The aqueous phase was mixed with 100% ethanol to provide appropriate
binding conditions with the silica-gel membrane when added to the RNAeasy
spin column (QIAGEN, Valencia, CA, USA). Buffer RWT (QIAGEN,
Valencia, CA, USA), a buffer containing guanidine and ethanol was washed
through the column via centrifuge, assisting in protein removal, and enhance
binding of the RNA. As the downstream analysis would be sensitive to very
small amounts of DNA, QIAGEN recommend the utilization of the DNase
digestion protocol. DNase incubation mix was added to the RNA bound to
the membrane on the column, and incubated at 25 - 30°C for 15 minutes.
The DNase incubation mix was then again washed through with Buffer RWT
via centrifuge.
Buffer RPE (500µL), a buffer high in ethanol content, was added to the
column and washed through via centrifuge to remove further salts from the
column. The RNA was then eluted by adding 30µL of RNase free water, into
which it readily dissolves, and centrifuged. From this solution of 30µL, 1µL
was removed and placed in an Eppendorf tube for the spectrophotometric
assessment of the resulting RNA concentration. The remaining RNA sample
was then stored at -20°C for later processing.
! (%!
2.5.1 Spectrophotometric Assessment of RNA Concentration The RNA concentration of each sample was measured using a
Biophotometer (Eppendorf, North Ryde, NSW). The Biophotometer was set
for RNA, with a dilution factor of 1/60, measuring wavelengths at 230, 260,
280 and 320 nm.
2.6 RNA Bioanalysis
It is well recognised that the accuracy of gene expression quantification is
influenced by quality of the RNA, with potentially low quality RNA
compromising the results of downstream processes such as RT-PCR141.
Consequently RNA quality was assessed using the Agilent RNA 6000 Pico
Assay Protocol (Agilent Technologies, Waldbronn, Germany). For analysis
on the Pico-chip samples were first prepared to achieve a concentration of
2.5ng/µL using ultra pure water, and then processed according to the
manufacturer’s protocol. Results were quantified as a RNA Integrity Number
(RIN). In keeping with previous research141,142, samples with a RIN higher
than 5 were considered to be of suitable quality for downstream analysis.
Samples with a RIN lower than 5 were not utilized for further analysis.
! (&!
2.7 Quantitative Real Time Reverse Transcription Polymerase Chain Reaction Analysis
2.7.1 cDNA Synthesis
Complementary DNA (cDNA) derived from messenger RNA (mRNA) is
utilized for quantitative PCR analysis. cDNA was prepared utilizing the RT2
First Strand Kit (Catalogue No. 330401, QIAGEN, Valcencia, CA, USA),
following the manufacturer’s protocol. Where possible as close to 320ng of
RNA (total volume 10uL) was incorporated in each reaction and the
Thermocycler (Eppendorf, North Ryde, NSW, Australia) was used for
incubations. The cDNA was diluted to a final volume of 111uL and stored at
4°C until required.
2.7.2 RT2 SYBR Green Mastermix
All RT2 SYBR Green Mastermix vials (QIAGEN, Valencia, CA) were pooled
to ensure uniformity of reagents throughout the entire protocol. To prepare
individual sample mastermix solutions, 52µL of sample cDNA was added to
260µL of RT2 SYBR Green Mastermix and 208µL of ultra pure water. This
‘sample master mix’ provided enough prepared template for all reactions on
each array. All Mastermix samples were frozen to ensure consistency with
only one freeze/thaw cycle per sample.
! ('!
2.7.3 Polymerase Chain Reaction
A commercially prepared Custom RT2 Profiler PCR Array (SABiosciences,
Corporation, Frederick, MD, USA) for the genes of interest was utilized
(Table 2). Where possible all four samples from each patient were analysed
on the one array. A number of duplicate reactions were also conducted
where space permitted on an array ring to ensure inter-array reliability. PCR
Mastermix samples were thawed for each PCR run. As per the
manufacturer’s protocol, 20µL of PCR Mastermix was pipetted into each
well. Real-time PCR was performed using the Rotor-Gene 6000 (Corbett
Life Science, Sydney, NSW, Australia), commencing at 95°C for 10 minutes,
then 40 cycles of 15 seconds at 95°C then 30 seconds at 60°C. Melt
analysis occurred from 65°C–95°C rising by 1°C/4 sec.
2.8 Quantitative RT PCR Analysis
The cycle take off data and melt curve data were reviewed using Rotor-
Gene Software (Version 1.7; Corbett Life Sciences, Sydney, NSW,
Australia). Take-off values for the positive and negative controls were
analysed to ensure the assays performed satisfactorily and genomic DNA
contamination was not a concern. Melt curves for every gene were
analysed to ensure amplification of a single product for each assay.
Quantitative real-time RT-PCR analysis was then performed using Q-Gene
software143. The expression of each gene was normalized to the commonly
used housekeeping gene HPRT144. GraphPad Prism Version 5.0b for Mac

! ((!
(GraphPad Software, San Diego California, USA, www.graphpad.com) was
used for statistical analysis, using the Mann Whitney U test, with a p value
less than 0.05 considered significant.
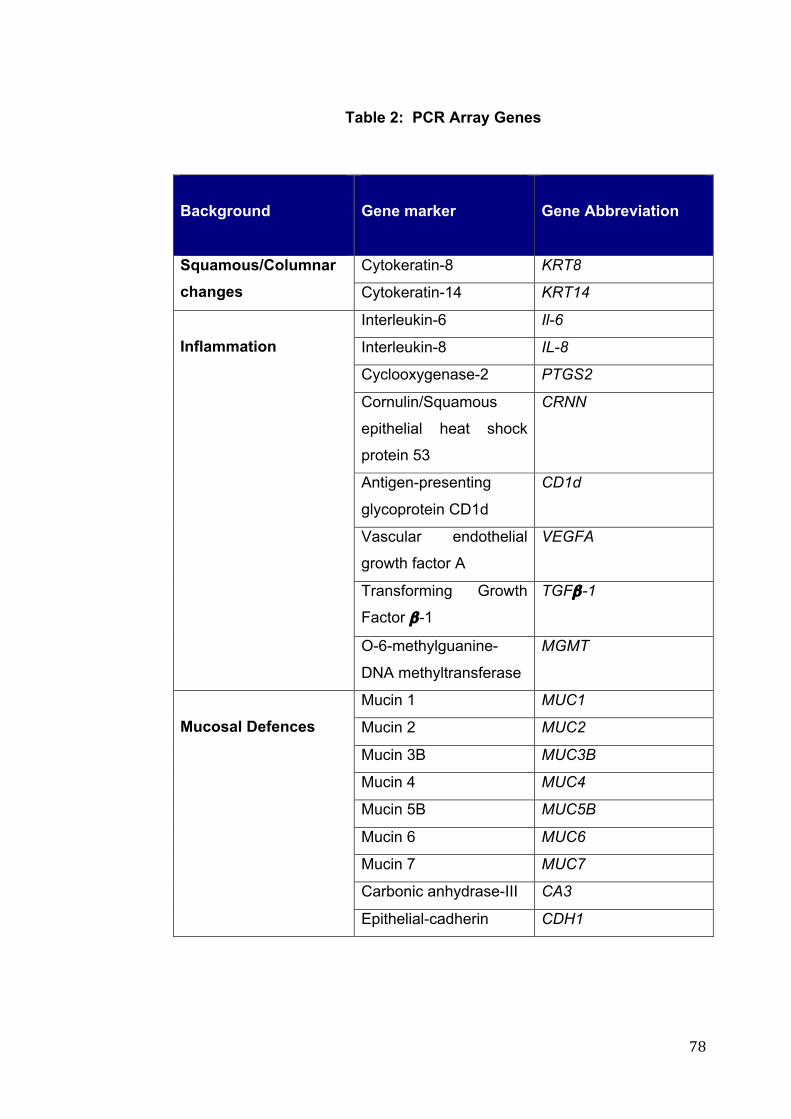
! ()!
Table 2: PCR Array Genes
Background
Gene marker
Gene Abbreviation
Cytokeratin-8 KRT8 Squamous/Columnar changes Cytokeratin-14 KRT14
Interleukin-6 Il-6
Interleukin-8 IL-8
Cyclooxygenase-2 PTGS2
Cornulin/Squamous
epithelial heat shock
protein 53
CRNN
Antigen-presenting
glycoprotein CD1d
CD1d
Vascular endothelial
growth factor A
VEGFA
Transforming Growth
Factor !-1
TGF!-1
Inflammation
O-6-methylguanine-
DNA methyltransferase
MGMT
Mucin 1 MUC1
Mucin 2 MUC2
Mucin 3B MUC3B
Mucin 4 MUC4
Mucin 5B MUC5B
Mucin 6 MUC6
Mucin 7 MUC7
Carbonic anhydrase-III CA3
Mucosal Defences
Epithelial-cadherin CDH1

! (*!
3 CHAPTER 3: RESULTS

! )+!
3.1 Demographics 56 patients were consented for microlaryngoscopy and research biopsy
collection, with the age ranging between 20 and 84 years of age, with a
median age of 50 years. Of these there were 31 males and 25 females. Of
these 10 patients had no tissue collected at the time, due to either a
laryngeal mask airway being utilised, or in one case, an inability to
successfully intubate the patient.
Patients (n = 10) with a history and examination findings consistent with
LPR, and RSI greater than 12, and RFS greater than 6 were included in the
LPR group. The ranges for these patients for the RSI lay between 12 and
45, and for the RFS between 6 and 17. Five patients with other pathology,
such as a diagnosis of laryngeal carcinoma, were excluded from the group
given another pathology was likely contributing to at least the RSI. Of these,
4 were smokers or ex-smokers. The control group (n = 9) consisted of
patients with no history or examination findings consistent with LPR, and RSI
and RFS scores below the above cut off. Non of these patients were
smokers. In practice the RSI for these patients ranged from 0 to 6, well
below the cut off for inclusion in the LPR group, and the highest RFS being 5
(although in a patient with an RSI of 0). The median RFS score for this
group was 1.5, and was 4 for the RSI. The remaining patients remained in
an intermediate group, in which patients had either elevated RSI or RFS.
! )"!
The average age in the LPR group was higher than the non-LPR group,
which was significantly different (p = 0.007) (Table 3). There was higher
ratio of males to females in the LPR group also. There was a significant
difference for the RSI scores (p < 0.0001) and the RFS scores (p < 0.0001)
between the LPR and the non-LPR group.
3.2 Histological Analysis Not all of the samples were of adequate size to be sectioned for histological
analysis. Of all the 78 samples processed, 52 samples were of adequate
size to be sectioned, and categorized in the LPR or non-LPR group.
Histological assessment by an expert pathologist identified sub-site specific
tissue types in the larynx (Table 4). The medial arytenoid and false vocal
cord sub-sites in the non-LPR group were most often found to contain
columnar epithelium (Figure 10). In the LPR group, these two areas were
more likely to demonstrate squamous epithelium. The posterior commissure
region was the only area to histologically demonstrate hyperplasia in 3 of the
specimens. In addition, there was histological evidence of metaplasia in the
medial arytenoid region in the LPR group (Figure 11). Both LPR and non-
LPR group demonstrated evidence of inflammation histologically (Table 5).
No samples demonstrated any evidence of dysplasia.

! )#!
Table 3: Demographics
Non-LPR group
(n = 9)
LPR Group
(n = 10)
p value
Average Age
38
55
p = 0.007*
Male/Female
3/6
12/6
p= 0.1**
Average RSI
3.6
19.5
p < 0.0001*
Average RFS
2
10.3
p < 0.0001*
Demographic data with statistically significant differences highlighted with *
in red box, “p” values for Mann Whitney U test.
** “p” values for Chi-square test.
(RSI = Reflux Symptom Index; RFS = Reflux Finding Score )
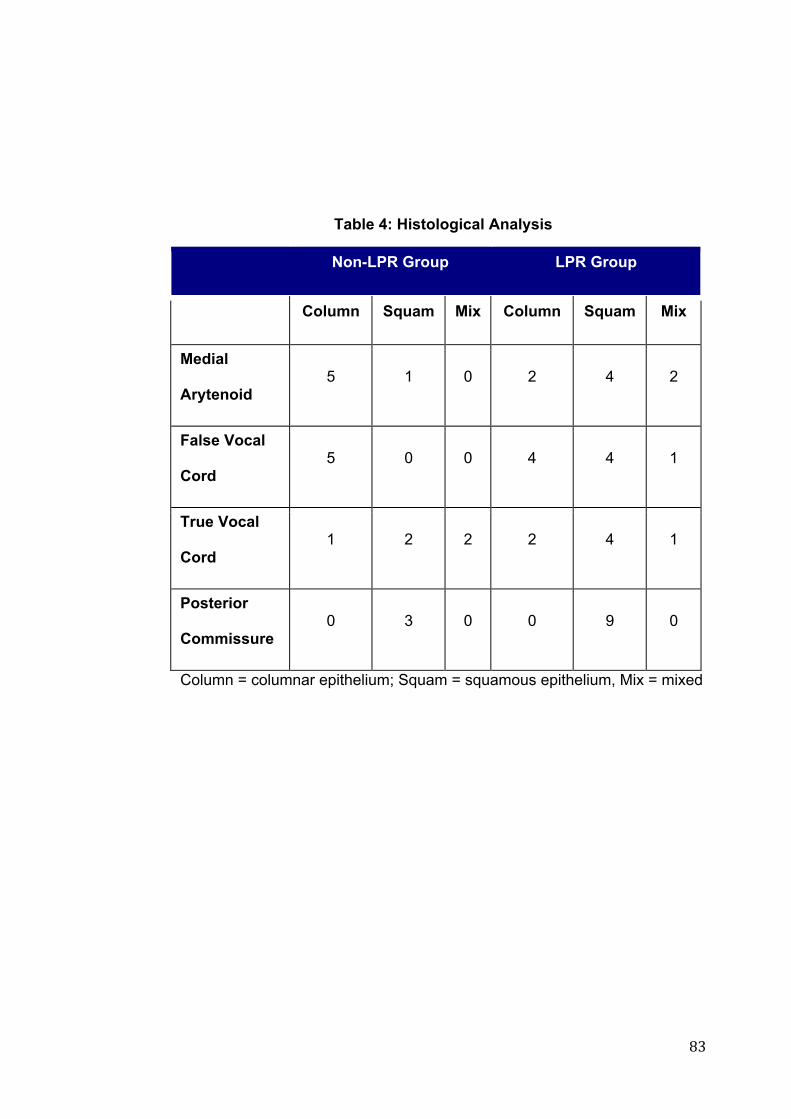
! )$!
Table 4: Histological Analysis
Non-LPR Group LPR Group
Column Squam Mix Column Squam Mix
Medial
Arytenoid 5 1 0 2 4 2
False Vocal
Cord 5 0 0 4 4 1
True Vocal
Cord 1 2 2 2 4 1
Posterior
Commissure 0 3 0 0 9 0
Column = columnar epithelium; Squam = squamous epithelium, Mix = mixed
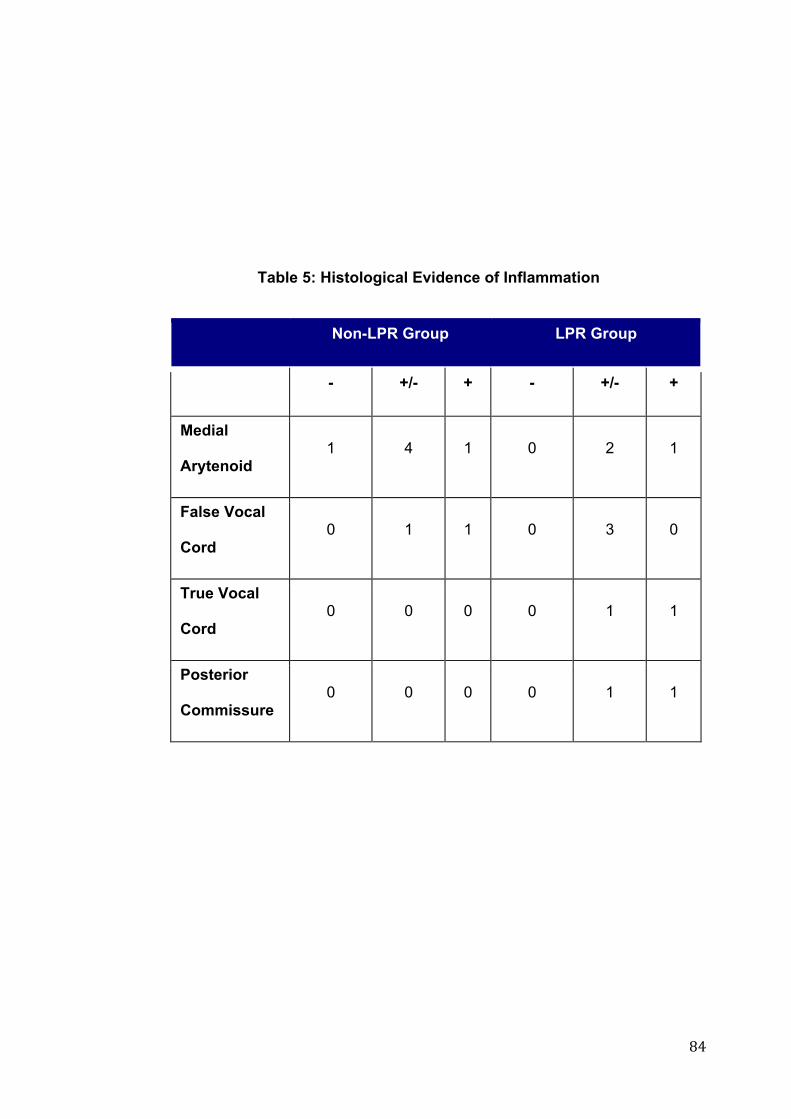
! )%!
Table 5: Histological Evidence of Inflammation
! Non-LPR Group LPR Group
- +/- + - +/- +
Medial
Arytenoid 1 4 1 0 2 1
False Vocal
Cord 0 1 1 0 3 0
True Vocal
Cord 0 0 0 0 1 1
Posterior
Commissure 0 0 0 0 1 1
!!
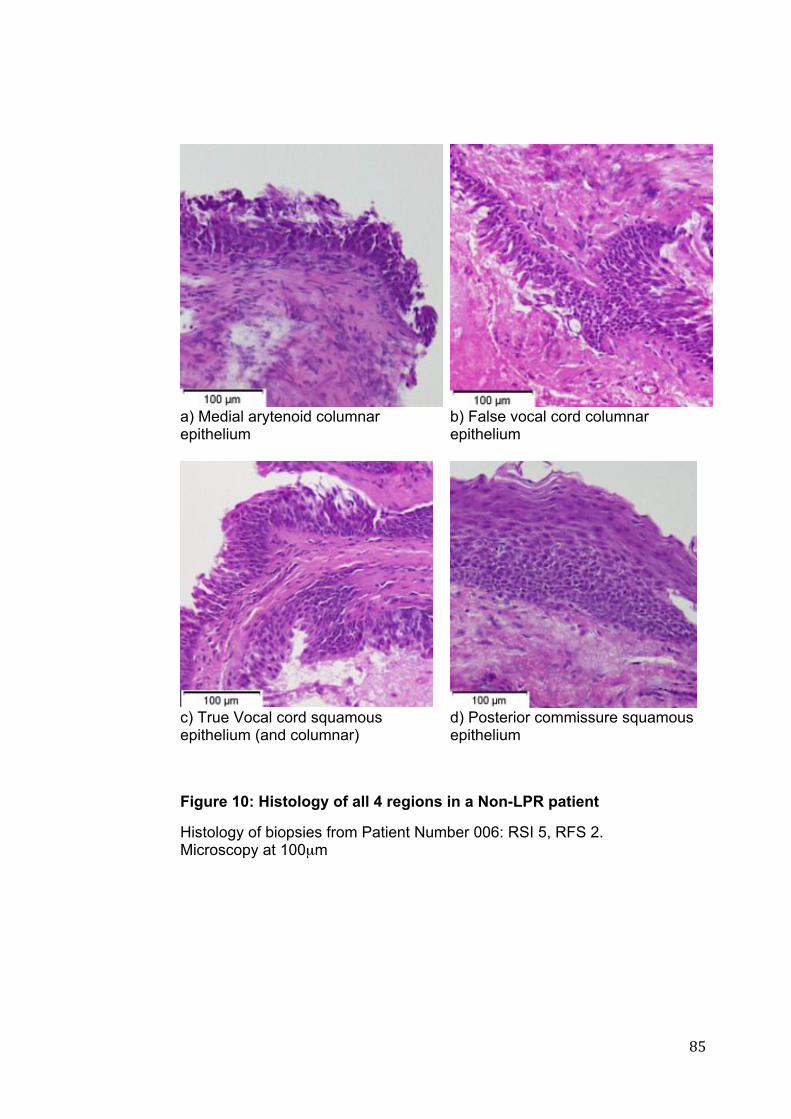
! )&!
a) Medial arytenoid columnar epithelium
b) False vocal cord columnar epithelium
c) True Vocal cord squamous epithelium (and columnar)
d) Posterior commissure squamous epithelium
Figure 10: Histology of all 4 regions in a Non-LPR patient
Histology of biopsies from Patient Number 006: RSI 5, RFS 2. Microscopy at 100µm
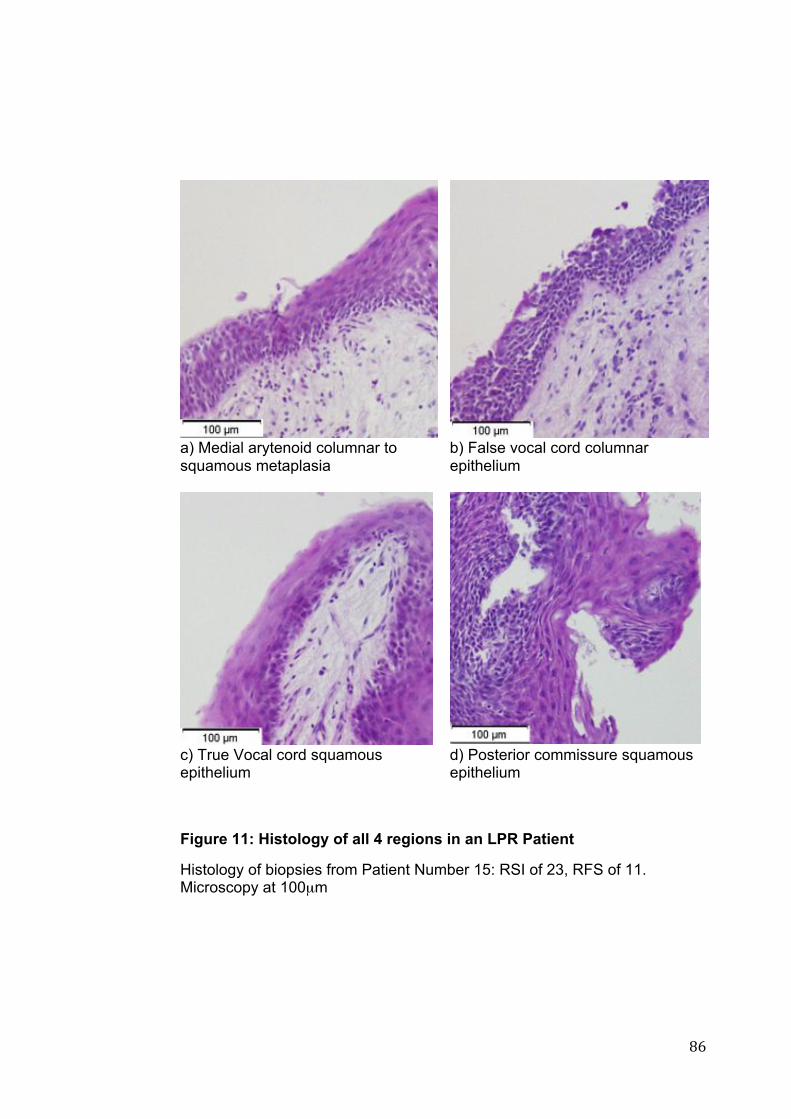
! )'!
a) Medial arytenoid columnar to squamous metaplasia
b) False vocal cord columnar epithelium
c) True Vocal cord squamous epithelium
d) Posterior commissure squamous epithelium
Figure 11: Histology of all 4 regions in an LPR Patient
Histology of biopsies from Patient Number 15: RSI of 23, RFS of 11. Microscopy at 100µm
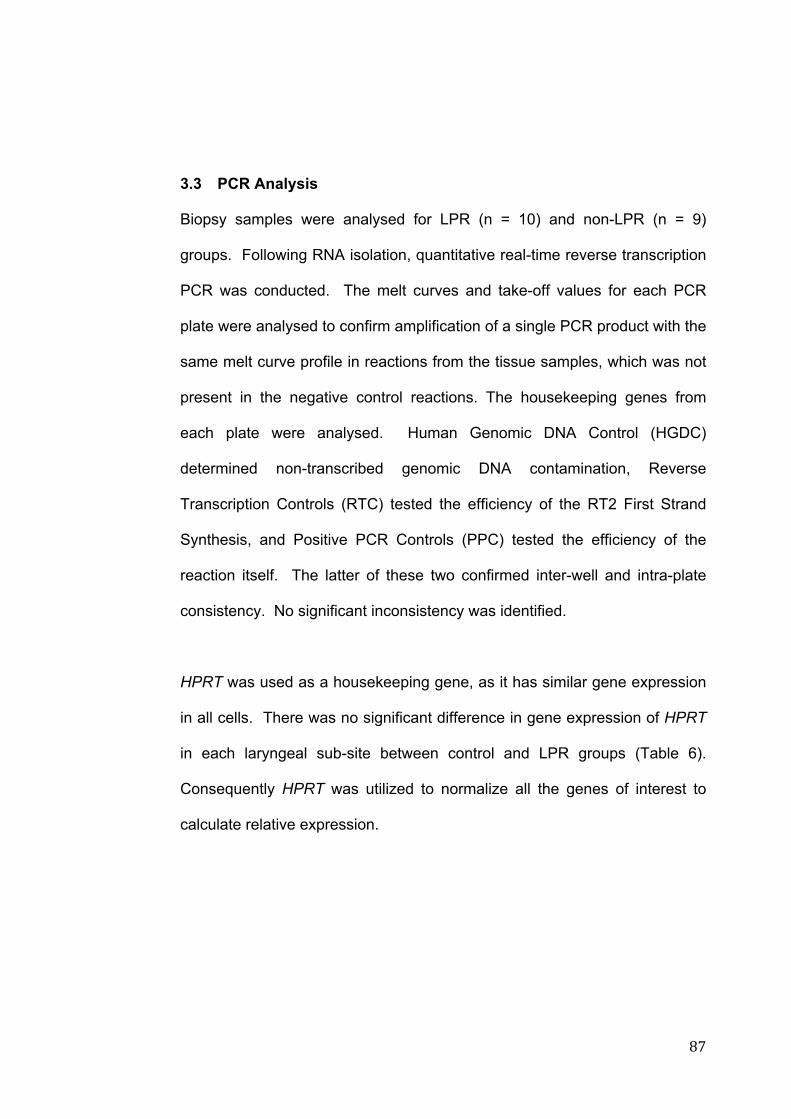
! )(!
3.3 PCR Analysis Biopsy samples were analysed for LPR (n = 10) and non-LPR (n = 9)
groups. Following RNA isolation, quantitative real-time reverse transcription
PCR was conducted. The melt curves and take-off values for each PCR
plate were analysed to confirm amplification of a single PCR product with the
same melt curve profile in reactions from the tissue samples, which was not
present in the negative control reactions. The housekeeping genes from
each plate were analysed. Human Genomic DNA Control (HGDC)
determined non-transcribed genomic DNA contamination, Reverse
Transcription Controls (RTC) tested the efficiency of the RT2 First Strand
Synthesis, and Positive PCR Controls (PPC) tested the efficiency of the
reaction itself. The latter of these two confirmed inter-well and intra-plate
consistency. No significant inconsistency was identified.
HPRT was used as a housekeeping gene, as it has similar gene expression
in all cells. There was no significant difference in gene expression of HPRT
in each laryngeal sub-site between control and LPR groups (Table 6).
Consequently HPRT was utilized to normalize all the genes of interest to
calculate relative expression.

! ))!
Table 6: Statistical Analysis of HPRT Gene Expression
p -value
Medial Arytenoid
0.717
False Vocal Fold
0.949
True Vocal Fold
0.450
Posterior
Commissure
0.328
“p-values” for two-tailed Mann Whitney U test for HPRT Gene expression between LPR and non-LPR groups.

! )*!
Data graphs displaying the relative expression for LPR and non-LPR groups
are presented for each gene in Figure 12 to Figure 31, with statistical
comparisons presented in Table 7. There was no significant difference in
gene expression for IL-6, IL-8, PTGS2 and MGMT between the LPR and
non-LPR group. Expression of KRT14 demonstrated a significant difference
between the LPR and non-LPR groups, with higher levels of expression in
the LPR group, however this was confined to only the medial arytenoid (p =
0.015) and posterior commissure (p = 0.030) sub-sites of the larynx.
Differences in mucin gene expression varied between genes. MUC1, 4, 6
and 7 demonstrated no significant difference between the LPR and non-LPR
groups throughout all the sub-sites of the larynx. MUC3B demonstrated a
trend towards lower expression in the medial arytenoid in the LPR group (p
= 0.084), however this was not statistically significant. Statistically significant
differences in expression were observed for the secretory mucins, MUC2
and MUC5B. The medial arytenoid region demonstrated a significant
difference in gene expression between LPR and non-LPR patients for both
MUC2 (p = 0.0020 and MUC5B (p = 0.0013) with lower expression noted in
the LPR group. There was no significant difference in expression of MUC2
in the other sub-sites of the larynx. In addition to the medial arytenoid,
expression of MUC5B was significantly lower in the LPR group, compared to
the non-LPR group in the posterior commissure (p = 0.041) but not the
remaining sub-sites.

! *+!
CA3 expression demonstrated a trend to be lower in the false vocal cord
region of the larynx in the LPR group (p = 0.086), however this did not
achieve statistical significance. The medial arytenoid, true vocal cord and
posterior commissure did not demonstrate any significant difference in
expression of CA3.
Expression of CRNN was significantly higher in the medial arytenoid region
of the larynx in the LPR group (p = 0.007), however there was no significant
difference in the other sub-sites. The medial arytenoid also demonstrated
significant differences in CD1d (p = 0.024) and TGFß1 (p = 0.042), both
demonstrating lower in expression in LPR patients. The remaining sub-sites
of the larynx did not demonstrate any significant differences. Expression of
CDH1 was significantly higher in the LPR group compared to the non-LPR
group noted in the medial arytenoid (p = 0.049). This elevation was not
noted in the remaining sub-sites of the larynx.
Overall, the medial arytenoid and posterior commissure both demonstrated
statistically significant differences in gene expression between the LPR and
non-LPR groups. It is of note that the medial arytenoid sub-site
demonstrated the most variations in gene expression in the LPR group.
The outliers for each of the genes were assessed, patient records were
reviewed to ensure that there was no confounding factors contributing to
this. The outliers noted in the VEGFA were noted to be of a high expression,
and occurred in both the LPR and non-LPR groups. Further analysis of

! *"!
these outliers identified that within each group they were not related to
individual patients and additionally such changes were not consistent
throughout all genes.

! *#!
Table 7: Gene Expression Statistical Analysis
Background
Gene
Medial Arytenoid
False Vocal
Cord
True Vocal
Cord
Posterior Comm.
KRT14 0.015* 0.165 0.714 0.030* Squamous/
Columnar KRT8 0.247 0.391 0.537 0.623
IL-6 0.536 0.476 0.662 0.539
IL-8 0.613 0.285 0.360 0.902
PTGS2 0.772 0.914 0.360 0.110
CRNN 0.007* 0.114 0.931 0.303
CD1d 0.024* 0.610 0.714 0.540
MGMT 0.181 0.450 0.310 0.935
TGF!-1 0.042* 0.453 0.712 0.806
Inflammation
VEGFA 0.450 0.109 0.314 0.566
MUC1 0.450 0.762 0.926 0.805
MUC2 0.002* 0.476 0.931 0.653
MUC3B 0.084 0.200 0.464 0.221
MUC4 1.00 0.521 0.781 0.326
MUC5B 0.013* 0.352 0.792 0.041*
MUC6 0.954 0.454 0.178 0.712
MUC7 0.613 0.762 0.178 0.653
CA3 0.600 0.086 0.082 0.288
Mucosal
Defences
CDH1 0.049* 0.914 0.855 0.367
: p values for two-tailed Mann Whitney U test for difference in gene
expression between LPR and non-LPR groups normalized to HPRT.
“*” results highlighted in red statistically significant.

! *$!
a) Medial arytenoid Control (n = 7) vs LPR (n = 8)
b) False vocal cord Control (n = 6) vs LPR (n = 4)
c) True vocal cord Control (n = 5) vs LPR (n = 6)
d) Posterior commissure Control (n = 9) vs LPR (n = 10)
Figure 12: HPRT Relative Expression
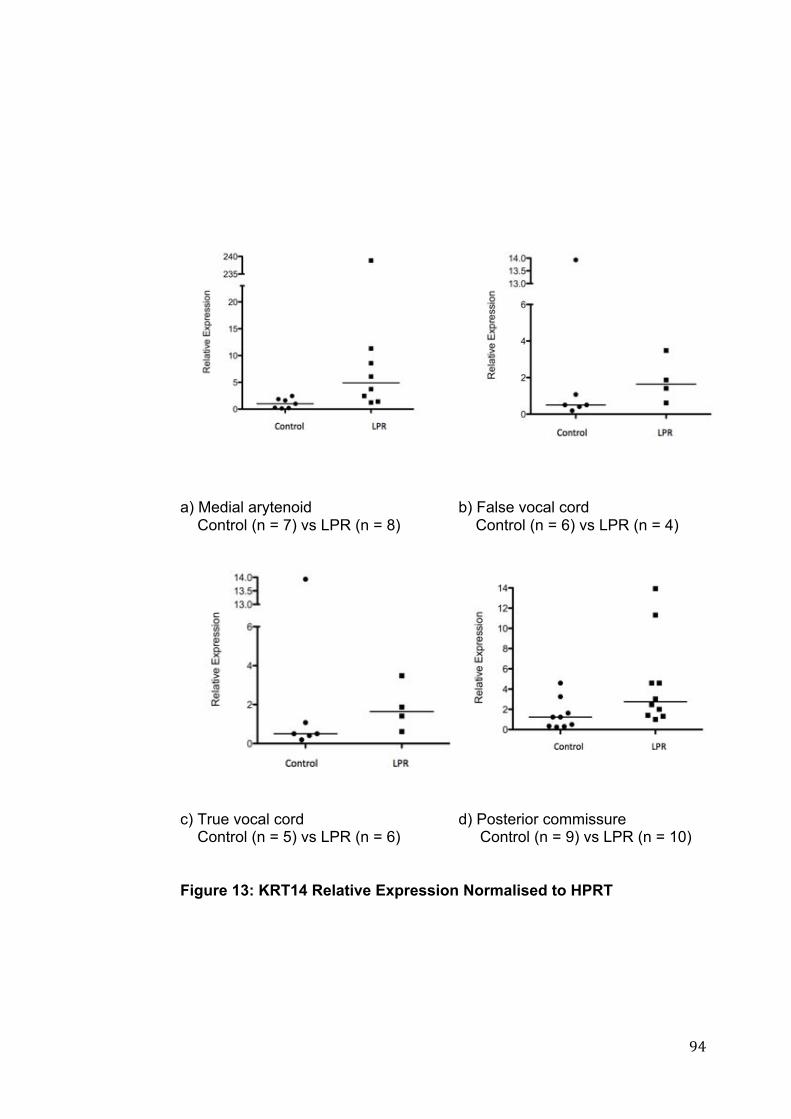
! *%!
a) Medial arytenoid Control (n = 7) vs LPR (n = 8)
b) False vocal cord Control (n = 6) vs LPR (n = 4)
c) True vocal cord Control (n = 5) vs LPR (n = 6)
d) Posterior commissure Control (n = 9) vs LPR (n = 10)
Figure 13: KRT14 Relative Expression Normalised to HPRT
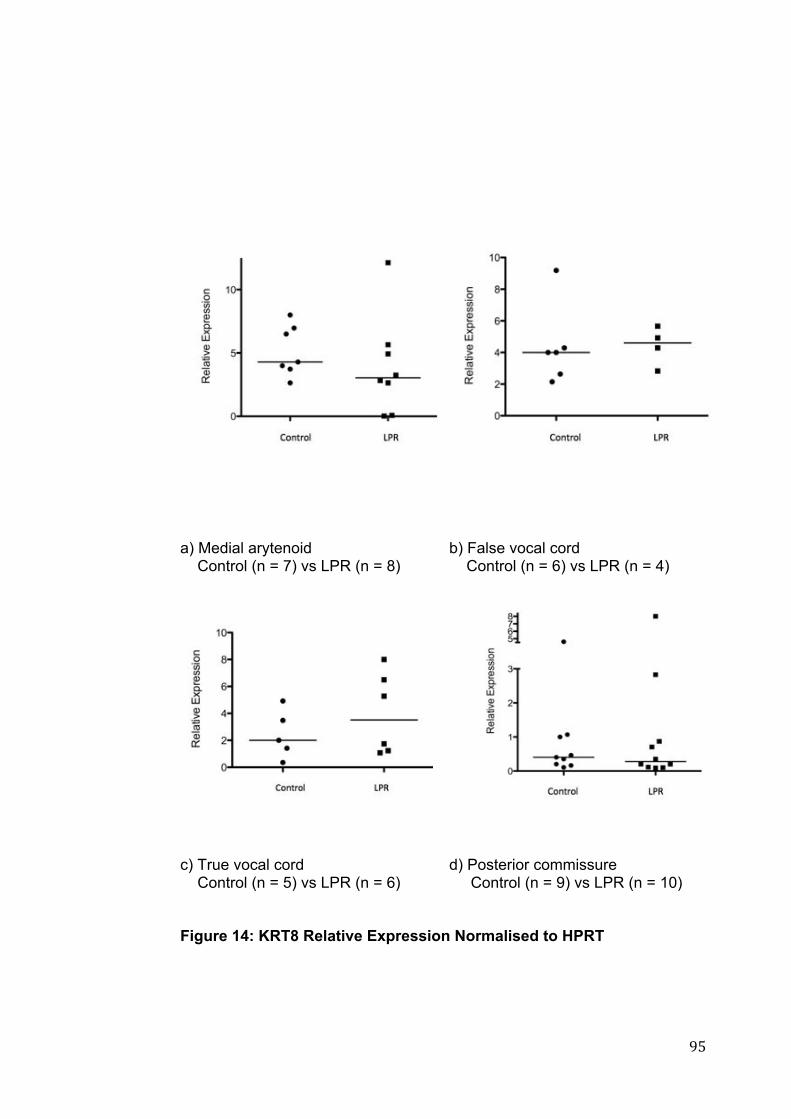
! *&!
a) Medial arytenoid Control (n = 7) vs LPR (n = 8)
b) False vocal cord Control (n = 6) vs LPR (n = 4)
c) True vocal cord Control (n = 5) vs LPR (n = 6)
d) Posterior commissure Control (n = 9) vs LPR (n = 10)
Figure 14: KRT8 Relative Expression Normalised to HPRT
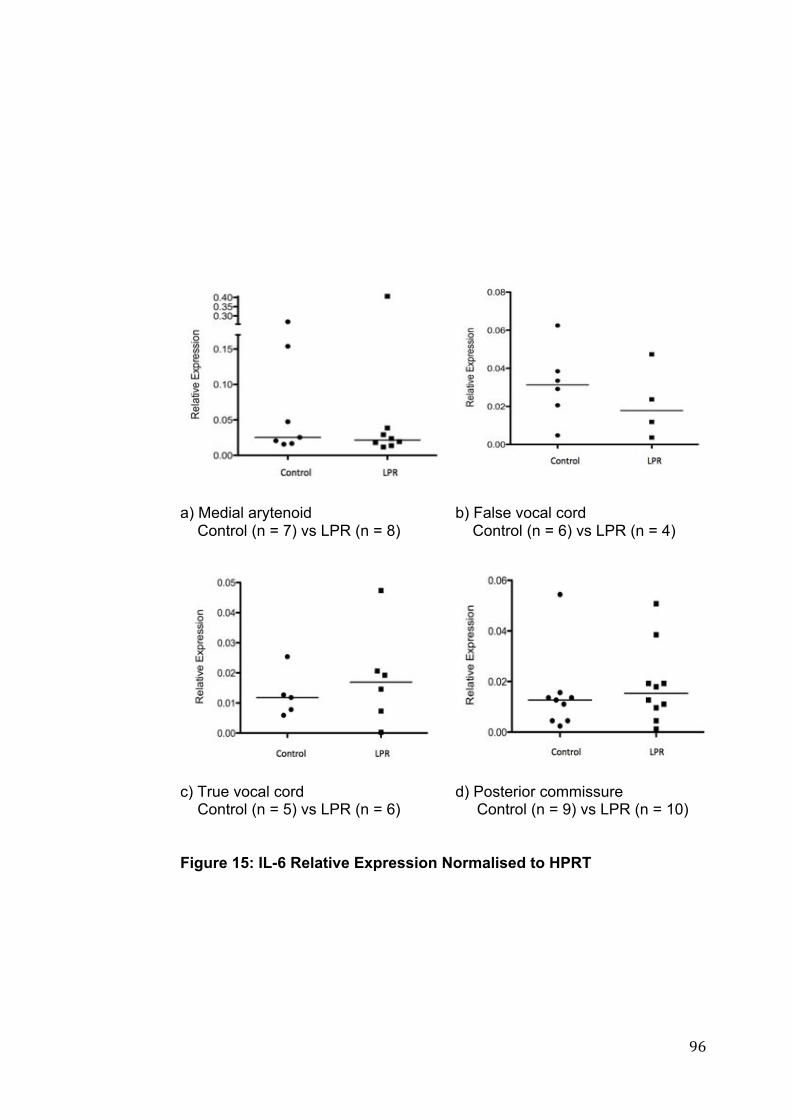
! *'!
a) Medial arytenoid Control (n = 7) vs LPR (n = 8)
b) False vocal cord Control (n = 6) vs LPR (n = 4)
c) True vocal cord Control (n = 5) vs LPR (n = 6)
d) Posterior commissure Control (n = 9) vs LPR (n = 10)
Figure 15: IL-6 Relative Expression Normalised to HPRT

! *(!
a) Medial arytenoid Control (n = 7) vs LPR (n = 8)
b) False vocal cord Control (n = 6) vs LPR (n = 4)
c) True vocal cord Control (n = 5) vs LPR (n = 6)
d) Posterior commissure Control (n = 9) vs LPR (n = 10)
Figure 16: IL-8 Relative Expression Normalised to HPRT
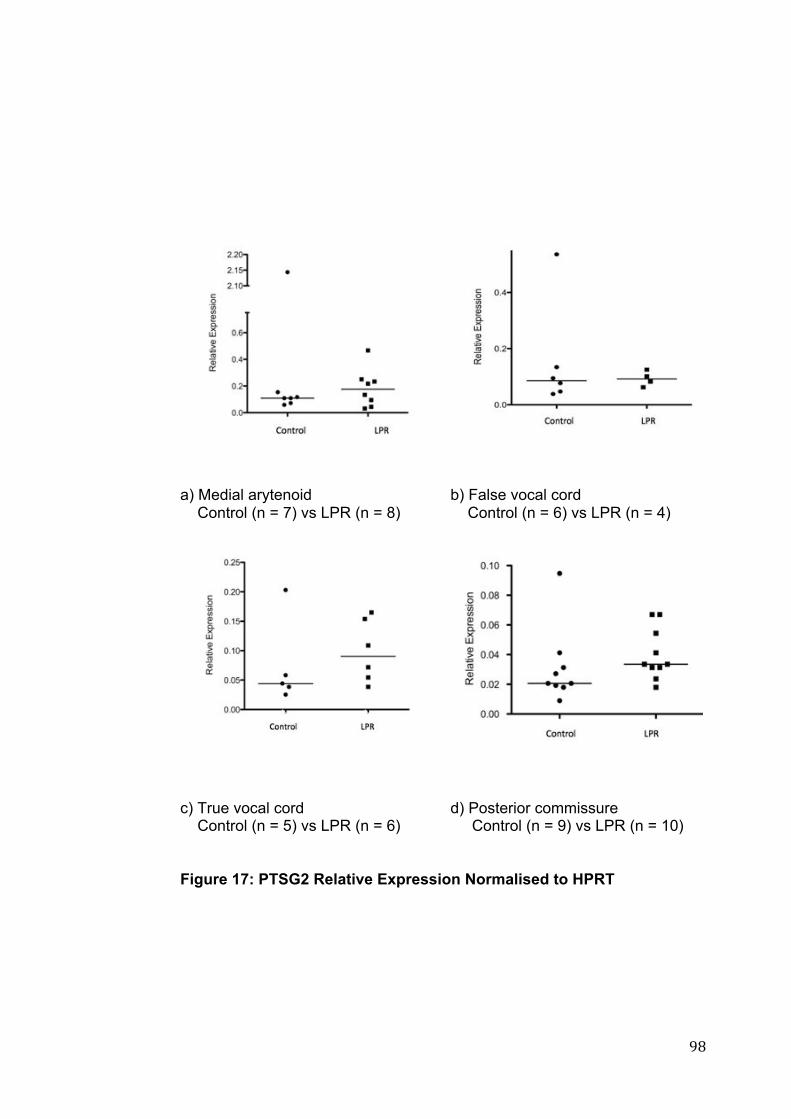
! *)!
a) Medial arytenoid Control (n = 7) vs LPR (n = 8)
b) False vocal cord Control (n = 6) vs LPR (n = 4)
c) True vocal cord Control (n = 5) vs LPR (n = 6)
d) Posterior commissure Control (n = 9) vs LPR (n = 10)
Figure 17: PTSG2 Relative Expression Normalised to HPRT

! **!
a) Medial arytenoid: Control (n = 7) vs LPR (n = 8)
b) False vocal cord Control (n = 6) vs LPR (n = 4)
c) True vocal cord Control (n = 5) vs LPR (n = 6)
d) Posterior commissure Control (n = 9) vs LPR (n = 10)
Figure 18: CRNN Relative Expression Normalised to HPRT

! "++!
a) Medial arytenoid: Control (n = 7) vs LPR (n = 8)
b) False vocal cord Control (n = 6) vs LPR (n = 4)
c) True vocal cord Control (n = 5) vs LPR (n = 6)
d) Posterior commissure Control (n = 9) vs LPR (n = 10)
Figure 19: CD1d Relative Expression Normalised to HPRT
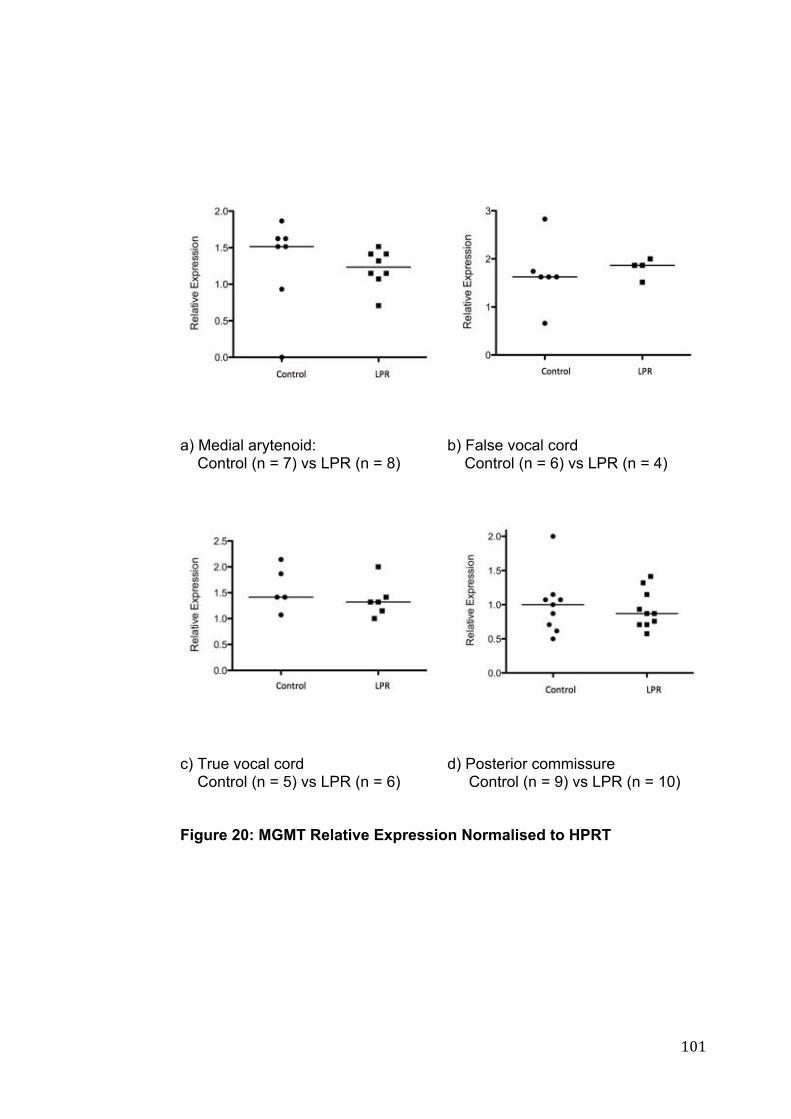
! "+"!
!!
a) Medial arytenoid: Control (n = 7) vs LPR (n = 8)
b) False vocal cord Control (n = 6) vs LPR (n = 4)
c) True vocal cord Control (n = 5) vs LPR (n = 6)
d) Posterior commissure Control (n = 9) vs LPR (n = 10)
Figure 20: MGMT Relative Expression Normalised to HPRT

! "+#!
a) Medial arytenoid: Control (n = 7) vs LPR (n = 8)
b) False vocal cord Control (n = 6) vs LPR (n = 4)
c) True vocal cord Control (n = 5) vs LPR (n = 6)
d) Posterior commissure Control (n = 9) vs LPR (n = 10)
Figure 21: TGF!-1 Relative Expression Normalised to HPRT

! "+$!
a) Medial arytenoid: Control (n = 7) vs LPR (n = 8)
b) False vocal cord Control (n = 6) vs LPR (n = 4)
c) True vocal cord Control (n = 5) vs LPR (n = 6)
d) Posterior commissure Control (n = 9) vs LPR (n = 10)
Figure 22: VEGFA Relative Expression Normalised to HPRT
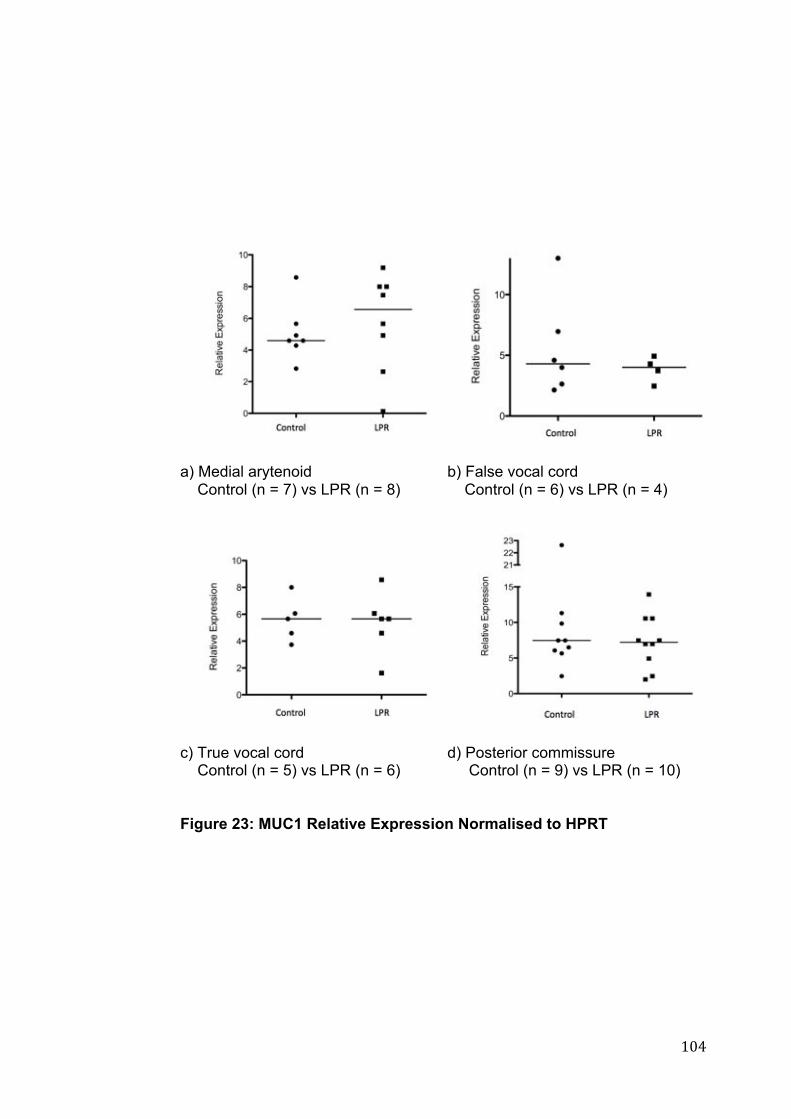
! "+%!
a) Medial arytenoid Control (n = 7) vs LPR (n = 8)
b) False vocal cord Control (n = 6) vs LPR (n = 4)
c) True vocal cord Control (n = 5) vs LPR (n = 6)
d) Posterior commissure Control (n = 9) vs LPR (n = 10)
Figure 23: MUC1 Relative Expression Normalised to HPRT

! "+&!
a) Medial arytenoid Control (n = 7) vs LPR (n = 8)
b) False vocal cord Control (n = 6) vs LPR (n = 4)
c) True vocal cord Control (n = 5) vs LPR (n = 6)
d) Posterior commissure Control (n = 9) vs LPR (n = 10)
Figure 24: MUC2 Relative Expression Normalised to HPRT

! "+'!
!!
a) Medial arytenoid: Control (n = 7) vs LPR (n = 8)
b) False vocal cord Control (n = 6) vs LPR (n = 4)
c) True vocal cord Control (n = 5) vs LPR (n = 6)
d) Posterior commissure Control (n = 9) vs LPR (n = 10)
Figure 25: MUC3B Relative Expression Normalised to HPRT

! "+(!
!
a) Medial arytenoid: Control (n = 7) vs LPR (n = 8)
b) False vocal cord Control (n = 6) vs LPR (n = 4)
c) True vocal cord Control (n = 5) vs LPR (n = 6)
d) Posterior commissure Control (n = 9) vs LPR (n = 10)
Figure 26: MUC4 Relative Expression Normalised to HPRT

! "+)!
a) Medial arytenoid: Control (n = 7) vs LPR (n = 8)
b) False vocal cord Control (n = 6) vs LPR (n = 4)
c) True vocal cord Control (n = 5) vs LPR (n = 6)
d) Posterior commissure Control (n = 9) vs LPR (n = 10)
Figure 27: MUC5B Relative Expression Normalised to HPRT

! "+*!
a) Medial arytenoid: Control (n = 7) vs LPR (n = 8)
b) False vocal cord Control (n = 6) vs LPR (n = 4)
c) True vocal cord Control (n = 5) vs LPR (n = 6)
d) Posterior commissure Control (n = 9) vs LPR (n = 10)
Figure 28: MUC6 Relative Expression Normalised to HPRT
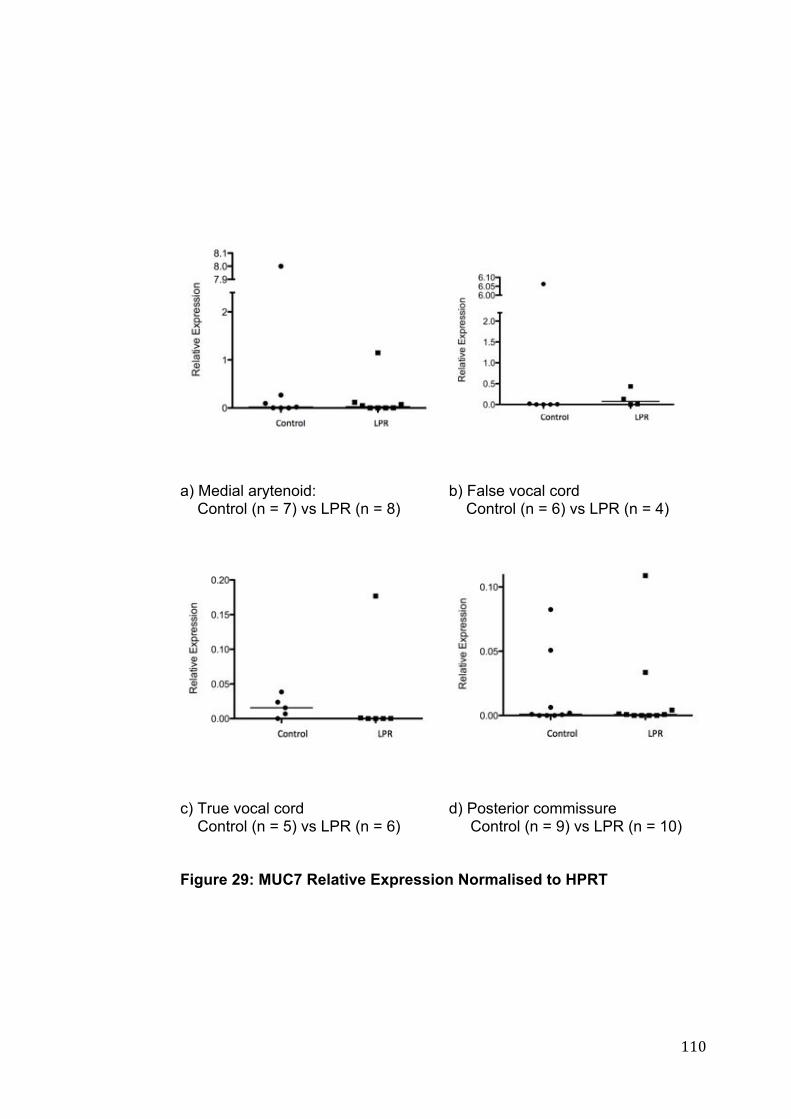
! ""+!
a) Medial arytenoid: Control (n = 7) vs LPR (n = 8)
b) False vocal cord Control (n = 6) vs LPR (n = 4)
c) True vocal cord Control (n = 5) vs LPR (n = 6)
d) Posterior commissure Control (n = 9) vs LPR (n = 10)
Figure 29: MUC7 Relative Expression Normalised to HPRT
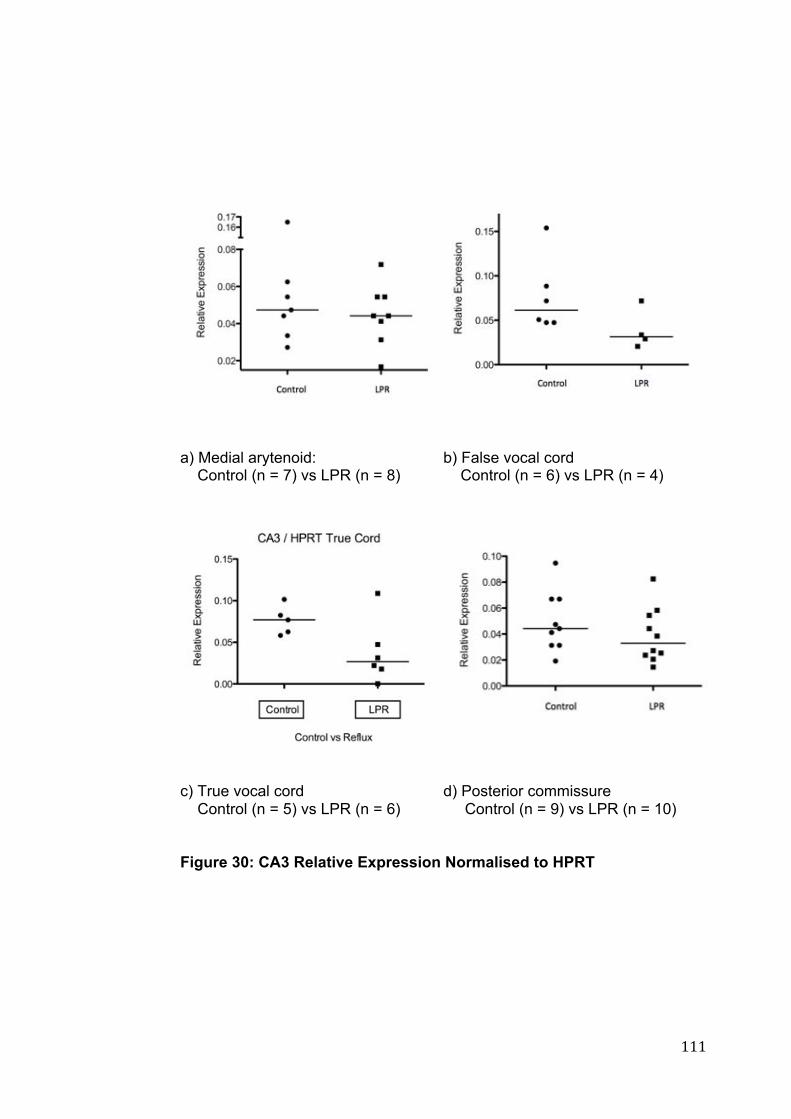
! """!
a) Medial arytenoid: Control (n = 7) vs LPR (n = 8)
b) False vocal cord Control (n = 6) vs LPR (n = 4)
c) True vocal cord Control (n = 5) vs LPR (n = 6)
d) Posterior commissure Control (n = 9) vs LPR (n = 10)
Figure 30: CA3 Relative Expression Normalised to HPRT

! ""#!
a) Medial arytenoid: Control (n = 7) vs LPR (n = 8)
b) False vocal cord Control (n = 6) vs LPR (n = 4)
c) True vocal cord Control (n = 5) vs LPR (n = 6)
d) Posterior commissure Control (n = 9) vs LPR (n = 10)
Figure 31: CDH1 Expression Relative Expression Normalised to HPRT

! ""$!
4 CHAPTER 4: DISCUSSION
! ""%!
This study investigated a clinical population diagnosed with LPR, and
compared them to a group of asymptomatic patients. The results
demonstrated that there are mucosal differences between the two patient
groups and that the medial arytenoid region is the area demonstrating the
most differences between the LPR and control groups.
4.1 Histopathology
Given the widely discrepant descriptions of the mucosal lining of the
supraglottis30 in the literature it was essential to classify the epithelium by
histological examination. Previous literature has reported patches of
squamous mucosa intermixed with ciliated epithelium in both the supraglottis
and subglottic regions31. Stell et al. concluded that the vestibular folds (false
vocal cord) were covered entirely by respiratory epithelium in 50% of cases
and mixed respiratory and squamous epithelium in about 40%30. The
patients in our normal group demonstrated mainly columnar epithelium in the
medial arytenoid and false vocal cord regions, with none of the non-LPR
group demonstrating any squamous epithelium in the false vocal cord area.
The LPR group demonstrated areas of squamous epithelium in both the
medial arytenoid and false vocal cord. It is possible that squamous
metaplasia occurs in response to ongoing LPR induced irritation and
inflammation in the larynx. Stell’s findings may have been due to either
active or passive smoking which was much more prevalent in northern
England at the time of these earlier studies.

! ""&!
4.2 Cytokeratins 8 & 14 (KRT8 and 14)
Given the histological differences noted as a possible consequence of
exposure to refluxate, tissue markers for squamous changes were measured
by PCR, demonstrating a significant increase in cytokeratin 14 (KRT14)
expression in the LPR group, in both the medial arytenoid and posterior
commissure.
Keratins form part of the cytoskeleton of the epithelial cells, providing
structural support in the cytoplasm and protect the cells against mechanical
and non-mechanical stresses. KRT14 is a marker of non-keratinising
squamous epithelium145. As a molecular marker it identifies the earliest
stages of squamous metaplasia, even when not identifiable on routine H & E
staining146. Although squamous metaplasia was noted in some of the
samples on histological examination in this study, it is possible earlier
changes of metaplasia in other individuals might be detectable by KRT14 in
our study group.
There is increasing evidence that such a programmed change occurs by
direct transdifferentiation, as identified in mouse models147. The epithelium
of the developing mouse oesophagus undergoes a change from columnar to
stratified squamous tissue, with an accompanying replacement of markers of
columnar epithelium, cytokeratin 8 and 18 (KRT8 and 18), by KRT14. The
proposed model by Yu et al.147 demonstrated a conversion in the basal layer
! ""'!
from KRT8 to the KRT14 positive cell lineage. Further immunohistochemical
analysis determined a temporal expression for KRT8 and 14 markers during
the course of development from columnar to stratified squamous tissue147.
Initially, as columnar epithelium, the tissue was KRT8 positive, and KRT14
negative. The expression of KRT8 decreased in the basal layers, and was
replaced by KRT14 expressing cells. For a period, however, the suprabasal
layers still consisted of KRT8 positive cells. This may explain the results in
the current study, given there was no significant change in KRT8, yet the
expression of KRT14 in the LPR group was higher.
Our current study demonstrated the medial arytenoid histology as being
mostly columnar epithelium in the non-LPR group, with an increased amount
of squamous epithelium noted in the LPR group. This is also reflected by
the KRT14 expression, with a statistically significant increase in the LPR
group. There was a slight decrease in KRT8 expression in the medial
arytenoid, however this was not significant. Consequently this may
represent evidence of a squamous change in this laryngeal sub-site, with
both the increased expression in the basal layer of KRT14, and the
persisting KRT8 in the suprabasal layers of the medial arytenoid sub-site.
This would be in keeping with a chronic irritation or persistent injury to this
area148. It is of note that the histologist clearly identified an area of
squamous metaplasia in one of the medial arytenoid biopsies from the LPR
group, representing a likely response to chronic irritation.

! ""(!
Histopathology examination of the posterior commissure demonstrated
entirely squamous epithelium in the posterior commissure in both the LPR
and non-LPR patients. This is consistent with the requirement for a more
durable epithelial layer in this area. As such no difference in expression of
the columnar marker KRT8 was expected given there would theoretically be
no metaplastic process. However there was a significant difference in
KRT14 between the two groups. This keratin predominates in the basal
cells in stratified epithelia149. The posterior commissure, by its anatomical
location alone, is the area first in line to damage by refluxate. There is
evidence in the oesophagus that hyperplasia of the basal layer occurs in the
presence of reflux, and has been proposed to be due to epithelial repair
mechanisms in response to this injury104. A recent study on the effect of
refluxate on the oesophageal epithelium found hyperplasia of this basal layer
was associated with increased expression of KRT14, and additionally this
expression correlated with increasing severity of reflux104. Given the
damaging effects of refluxate on the posterior commissure, and the well
described “posterior commissure hypertrophy” it is possible that a similar
response is occurring in this area. Our study found the KRT14 expression
increased in the posterior commissure biopsies in the LPR group,
suggesting a response to injury. Van Roon et al.104 identified that KRT14
could consequently be a surrogate tissue marker of reflux. Examination of
the posterior commissure data revealed 2 outliers, with high expression of
KRT14 in the LPR group. One of these outlying patients had a particularly
high RSI and RFS, however this was not the case for the other patient.
Consequently, whilst KRT14 could be proposed as a marker of LPR, there is

! "")!
no evidence that there is a definitive relationship between severity and
expression, which would add further weight to this argument. Further
research into KRT14 expression may provide further information on its exact
role in the development of hyperplastic and metaplastic change in response
to reflux.
4.3 Inflammatory Markers
4.3.1 IL-6 and IL-8 In the context of repeated episodes of reflux it would be reasonable to
assume that a mucosal inflammatory response would be present. It is well
documented that cytokine mediators have a significant role in the
pathogenesis of inflammatory conditions and levels of these are elevated in
oesophageal mucosa in response to reflux. Recently, research considering
inflammatory markers in GORD found an increase in IL-6, with a graded
expression according to the severity of reflux104. In addition, IL-8 has been
recognised as being elevated in the oesophageal mucosa of patients with
oesophagitis, and has a significant chemotactic activity, attracting
leukocytes, particularly neutrophils150.
IL-6 is typically produced at the site of inflammation, and plays a crucial role
in the acute phase response. Inflammation is a complex phenomenon,
fundamentally a protection response. It is differentiated into acute and
chronic, depending on the nature of the stimuli, and the response. Acute

! ""*!
inflammation is defined as being rapid in onset, of short duration and lasting
for hours to days, with characteristic changes of exudation of fluid and
plasma proteins and emigration of leucocytes (mainly neutrophils)151.
However persisting stimuli, or a failure of the reaction to subside may lead to
chronic inflammation. Other sources of chronic inflammation include
immune-mediated inflammatory diseases and prolonged or repeated
exposure to toxic agents151. IL-6 is well recognized in acute inflammation
where it plays a significant role as an inducer of the production of most of
acute phase proteins. However, IL-6 has a complex role in inflammation,
and its role depends on the type of inflammation.
A recent study by Bathoorn et al152 investigated the effect of pepsin on
bronchial epithelial cells. Using an experimental in vitro model, human
bronchial cells were exposed to pepsin at pH concentrations of 1.5, 2 and
2.5. They found pepsin induced cytotoxicity that was pH-dependent, with the
most significant injury at the lowest pH. In addition, IL-6 and IL-8 release
was greatest at the lower pH levels.
The current study demonstrated no significant difference in expression of IL-
6 and IL-8 between patients with LPR and controls. Whilst the immediate
response to acid and pepsin challenges may demonstrate acute
inflammatory changes in vitro, patients with LPR may have been suffering
symptoms for many months. Consequently, this may be representing a
chronic inflammatory condition, rather than an acute response. There has
been a number of studies finding changes in IL-6 gene expression in GORD,

! "#+!
however such changes have not been able to be replicated in studies
considering LPR105.
Unlike GORD, patients with LPR are likely to have significantly fewer
episodes of refluxate, at a possibly higher pH. Such episodes may not be
severe enough to instigate the acute inflammatory reaction identified in vitro
studies but irritating enough to trigger a low grade, chronic inflammation.
Whist frank ulceration is rare, laryngeal granulomas are not uncommon as a
result of chronic exposure to refluxate153.
Despite the wealth of knowledge of inflammatory mediators in GORD, there
is little understanding of the translation to LPR, which is increasingly
identified as having important differences in the inflammatory
pathophysiology105. It is recognised that there is little objective evidence
investigating inflammation in the posterior commissure105. Previous
experimental work using an in vitro cell culture model found increased
expression of pro-inflammatory markers in response to exposure to pepsin,
even in non-acidic enviroments154.
In vivo experiments have considered changes in IL8 in response to
treatment with the PPI rabeprazole, in LPR patients, but there was no
comparison of gene expression between LPR patients, and a non-refluxing
control group105. IL8 expression was found to be significantly increased in
biopsies from the posterior commissure in patients who had previously been
using PPIs. With the lack of a control group it becomes difficult to identify a

! "#"!
true difference, or if those using PPIs prior to becoming enrolled in the trial
were patients with more severe symptoms, or of longer chronicity of
symptoms leading to greater mucosal changes.
Our study, comparing a non-refluxing population with an LPR population
found no significant difference between any of the sub-sites of the larynx for
gene expression of IL6 and IL8. It is of note that other studies investigating
inflammatory mediators in LPR also failed to find a significant change in
IL6105. IL-6 is released during significant tissue trauma, with multiple studies
identifying an increase in expression in the oesophageal mucosa, with
greater severity of insult104,155, with the levels if IL-6 corresponding to the
degree of trauma to the cell, and predicting the magnitude of cell damage.
Consequently, the severity of mucosal damage from LPR may not reach a
threshold high enough to warrant a measurable change in IL6 gene
expression, however, given this study considered mRNA expression
changes, it may be possible that there is a change in protein.
4.3.2 PTGS2
Prostaglandin-endoperoxide synthase 2 (also known as COX-2) (PTGS2)
has a demonstrated role in the sequence of change from normal squamous
epithelium, metaplasia, dysplasia to invasive neoplasia156. The
cyclooxygenases of which COX-2 is one, are the rate-limiting enzymes
converting arachidonic acid to prostaglandin. This isoform is rapidly induced
by stimuli, and is increasingly recognized as having a role not only in
! "##!
inflammation, but also promoting carcinogenesis, and in the growth of
existing tumours157.
A number of studies have recognized increased expression of COX-2 in
oesophageal mucosa exposed to gastric refluxate in both animals and
humans158 and conversely, in some studies, a COX-2 inhibitor reduced the
risk of developing oesophageal carcinoma159. Over expression of COX-2
has been proposed to induce tumourgenesis and in addition has been found
in squamous cell carcinomas (SCC) of the head and neck157. One study
found COX-2 expression gradually increasing from normal epithelium
through dysplasia to poorly differentiated SCC157. In addition patients with
intestinal metaplasia were also noted to have an increased expression160.
There is a paucity of literature investigating the role of COX-2 in the
laryngopharynx. One of the few studies investigating the expression of
COX-2 in response to LPR collected biopsies from the anterior and posterior
pillars around the palatine tonsils during tonsillectomy83. The tissue was
exposed to bile salts and an increase the expression of COX-2 mRNA was
detected. Such a study highlights the difficulties in collecting adequate
biopsies in the clinical setting for LPR investigations. The indication for the
patients to undergo tonsillectomy was not identified but if from an adult
population, would likely be due to recurrent tonsillitis. Such repeated
infection and resultant inflammation may have altered the true response to
the injurious challenges studied. Additionally, the area from which these
biopsies were collected may not be readily translatable to the human larynx,

! "#$!
particularly as this current study demonstrates a significant variation in
epithelia structure within the larynx alone, let alone much higher up at the
junction of the oral cavity and oropharynx.
Consequently, it is not surprising that this current study did not demonstrate
a significant difference in gene expression between the LPR and non-LPR
group with respect to COX-2. Examination of the outliers of this gene found
that although there was a single patient with increased COX-2 expression in
the control group for each sub-site, these were from separate patients.
Given its role in tumourgenesis, the absence of such a difference between
the two groups may suggest that refluxate into the larynx may not, in itself,
provide a significant enough injury to progress to dysplasia or cancer. It
must be recognized that this study considered mRNA expression, not COX-2
protein levels.
In addition, a number of studies have demonstrated that COX-2 can exert a
regulatory effect on VEGF production156. Both VEGFA and COX-2
demonstrated no significant difference between the LPR and non-LPR
group. This would suggest that the process driving metaplastic changes in
the oesophagus in response to reflux may be different to the mucosal
response in the larynx.
4.3.3 MGMT
O6-Methylguanine-DNA methytransferase (MGMT) is a DNA repair protein,
and whilst its role in LPR is uncertain, it has previously identified

! "#%!
associations with oesophageal squamous cell carcinoma, lung cancer,
melanoma and cancers of the upper aerodigestive tract161. A recent study
identified hypermethylation and expression of MGMT in Barrett’s esophagus,
with hypermethylation detected in 100% of Barrett’s intraepithelial neoplasia,
88.9% of Barrett’s metaplasia, but only 21.4% of normal oesophageal
mucosa161,162. There was also significant down-regulation of MGMT
transcripts and protein expression noted, which correlated with disease
progression. The current study found no significant difference of gene
expression in any of the laryngeal sub-sites between LPR and non-LPR
groups however, as previously mentioned, this study did not measure
protein expression. This would indicate that hypermethylation may not play
a significant role in mucosal injury in LPR but further research is required to
investigate this further.
4.3.4 TGF#-1
There are many other important cytokines involved in inflammation. TGF#-1
has a multitude of functions and as a growth factor is one of the few that
have an inhibitory function73. It is a cytokine recognized as regulating cell
replication and differentiation, bone formation, angiogenesis,
haematopoiesis, cell cycle progression and cellular migration106. TGF#-1 is
known to have a wide range of effects that stimulate mesenchymal cells
however it has a significant inhibitory effect on epithelial proliferation106. A
number of studies have also found the administration of topical TGF#-1
improved healing in ulcers, incisional and excisional wounds163. This
cytokine has regulatory effects on a wide range of cell types, with a role in
! "#&!
regulating epithelial cell growth, differentiation, motility, organisation and
apoptosis106.
Furthermore TGF!-1 may have a role in tumourgenesis, acting as a tumour
suppressor early on. Later however, it is thought to promote angiogenesis
and immunosuppression, providing an environment suitable for rapid tumour
growth by acting both on tumour cells and the local environment106.
Consequently the role of TGF!-1 in any inflammatory condition, including
LPR, appears to be complex with a variety of responses. The current study
identified decreased expression of TGF!-1 in patients with LPR which may
indicate a decreased ability to repair, with the potential for early loss of
tumour suppression. On closer analysis, it is of note that more than half of
the non-LPR group had a relatively elevated expression of TGF!-1
compared to the LPR group, with the resulting statistically significant result.
However there appeared to be a bi-modal distribution in the non-LPR group,
the significance of which is uncertain. Consequently further research is
required to determine the relative expression of TGF!-1 in both a non-LPR
population, and consequently if there is significantly less expression in LPR
patients of TGF!-1 in the medial arytenoid.
There is unfortunately a paucity of studies looking at TGF!-1 considering the
role this cytokine has in LPR105,108. Thibeault et al.105 found a significant
increase in TGF!-1 gene expression following PPI treatment in patients with
LPR but only in the sub-group of patients who had already been taking PPIs.
This may indicate either different phenotypes of disease or greater

! "#'!
inflammation and consequently symptoms in that group. The current study
found a significant decrease in the non-treated LPR group, consistent with
the study conducted by Thibeault et al105. More specifically, there was a
lower gene expression of TGF!-1 in the medial arytenoid region. As an area
typically of columnar epithelium and close to the posterior commissure, this
region would likely receive the majority of the refluxate, and any impairment
in wound healing would be significantly detrimental. Our results confirm that
TGF!-1 remains an important cytokine for future research, especially
regarding the role it may have in carcinogenesis, possibly exacerbated or
initiated by LPR.
4.3.5 VEGF-A
Similar to TGF!-1, Vascular Endothelial growth factor A (VEGFA) has
multiple roles, being a mediator of vascular hyperpermeability, angiogenesis
and inflammation164. There is increasing literature identifying the role of
VEGF in other reflux related diseases, particularly in Barrett’s
oesophagus156. In addition, it is recognized that COX-2 exerts a regulatory
effect on VEGF production. In both Barrett’s oesophagus and colon cancer
it has been reported that COX-2 expression stimulates angiogenesis by
inducing VEGF165. Vallböhmer et al.166 compared oesophageal biopsies
from patients with normal squamous oesophageal mucosa, through to
Barrett’s and adenocarcinoma. They found that expression of both COX-2
and VEGF was significantly up-regulated in patients with metaplasia,
dysplasia and cancer when compared with controls, with a sequential
increase in expression noted between each of these groups. It is of interest
! "#(!
to note that there was no significant change in epidermal growth factor
receptor (EGFR), which is over-expressed in squamous cell carcinoma of
the oesophagus.
VEGF has a significant role in inflammation and repair, with cell migration,
chemotaxis and induction of vascular permeability, epithelialization and
collagen deposition all identified as being stimulated by it167. Its role in LPR
is still unclear, with experimental in vitro studies identifying gene expression
changes in both false vocal fold fibroblast cultures in response to acid bolus
and in post-cricoid fibroblast cultures in response to both acid and pepsin108.
The most significant changes were measured during the first 60 seconds
after exposure. Additionally, there was a noticeable difference between the
post-cricoid and false vocal cord mucosal responses, with the false vocal
cord tissue being more resistant to pepsin than the post-cricoid tissue. Such
a response conflicts with other studies finding significant injury caused by
both acid and pepsin33.
This current study however, did not demonstrate a significant difference
between any of the sub-sites of the larynx in mRNA expression, however
this study did not measure tissue protein levels. It is possible that VEGFA
mediated inflammation may not play a significant role in LPR, however in the
absence of measuring this protein expression it is not possible to be certain
and further work is required to confirm or refute this.

! "#)!
4.4 Laryngeal Defences
4.4.1 Mucins
Mucins consist of high molecular weight glycoproteins. The mucins are
categorised into two primary classes: secreted gel-forming mucins, and
transmembrane mucins. MUC2, 5A, 5B, 6, 7, 8 and 19 are gel-forming
mucins and have been demonstrated to be present in the aerodigestive tract
[Table 4]. Typically expressed in epithelial cell types, they provide
protection in relatively harsh environments such as exposure to fluctuations
in pH, ionic concentration, hydration and oxygenation70. Accordingly whilst
their primary function is of protection, lubrication and transport, there are
further implications that they have a role in the renewal and differentiation of
epithelium, modulation of the cell cycle progression, adhesion and signal cell
transduction118 with a role in cell homeostasis and promotion of cell survival.
It is well described in GORD that the oesophageal mucosa secretes soluble
mucus in response to excessive exposure to acid104. At the primary
protective level this may lead to increased mucosal protection in response to
the refluxate. In addition, alteration in the expression of the transmembrane
mucins may lead to alterations of the cell cycle. This is of note given the
increased expression of MUC1 and MUC3 in the pre-cancerous Barrett’s
oesophagus mucosa104. In addition MUC6 has been identified in normal
oesophageal mucosa, metaplastic columnar oesophageal mucosa and
oesophageal adenocarcinoma104.

! "#*!
Samuels et al.118 identified the mucin expression profile in both the normal
larynx (n =2) and in larynges of patients with LPR (n=3), identified by RSI
and RFS. The normal larynx demonstrated predominant expression of the
transmembrane mucins MUC1 and MUC4, with expression of MUC2, 5A
and 5B as the major airway gel-forming mucins. Other mucins important in
oesophageal reflux, such as MUC6, were not identified in either the control
or LPR groups. However, in addition to the low numbers sampled, only the
posterior commissure area was biopsied. The current study utilised biopsies
from multiple sub-sites of the larynx, and found a significant difference in the
gel-forming mucins MUC2 and 5B, with the gene expression of both
significantly lower in the LPR group, in the medial arytenoid region. In
addition, MUC5B expression was significantly lower in the LPR group in the
posterior commissure.
MUC2 was only significantly different in the medial arytenoid region. Such a
difference may indicate a failing of mucosal defence in the presence of
refluxate. In addition loss of this may reduce the resistance of this area of
the larynx to further reflux boluses.
4.4.2 Carbonic Anhydrase III
It is well recognised that the larynx lacks many of the significant defence
mechanisms that are present in the oesophagus. In addition to the mucins,
the carbonic anhydrases play a role in mucosal defences by catalysing the
reversible hydration of carbon dioxide, allowing bicarbonate ions to be
actively pumped into the extracellular space. Johnston et al. 74 proposed

! "$+!
that this would not only neutralise refluxed gastric acid but, by increasing
luminal pH, indirectly reduce the activity of pepsin present in the refluxate.
Of the eleven isoenzymes the oesophagus has been identified as
expressing carbonic anhydrase I, II, III and IV in the epithelium. There is a
significant buffering effect of carbonic anhydrase system being able to
increase the pH of acid boluses in the oesophagus from 2.5 to nearly
neutral109. In response to refluxate, immunofluorescence studies have
demonstrated a re-localisation of CA-III from the basal layers in normal
oesophageal epithelium to the supra-basal layers in the inflamed
oesophageal tissue. This may represent an increased buffering capacity of
the inflamed tissue, providing greater protection in acid-challenged tissue.
CA-III has been identified in the normal larynx110 and in LPR75. Furthermore,
there is evidence that expression of CA3 may vary throughout sub-sites of
the larynx, particularly in response to refluxate. Expression of CA3 in the
control group demonstrated a slightly higher expression in the true cord than
in the other regions. This may represent one of the few intrinsic defences for
the true cord region, which relies on other areas of the larynx to produce
protective mucin. The variability of expression of CA3 in the normal larynx is
lacking in current literature, however early studies into CA3 expression noted
its depletion in patients with LPR110. Comparing biopsies from the laryngeal
ventricle, vocal fold and posterior commissure, found a depletion of CA3 in
both the ventricle and vocal fold regions, however no significant change in
the posterior commissure74.

! "$"!
This current study found no significant change in the posterior commissure
between LPR and non-LPR groups. Gene expression of CA3 appeared to
decrease in both the true, and false vocal cord biopsies in the LPR group
however this was not statistically significant.
A decrease in CA3 expression in the true and false vocal cords would
concur with previous research suggesting that there is a loss of intrinsic
defences within sub-sites of the larynx in the presence of refluxate. This
loss is not specific to histological tissue type with both the squamous vocal
cord and the columnar ventricle demonstrating this decrease.
The posterior commissure maintained its expression of CA3 and notably, in
an earlier study was actually increased113. Consequently the posterior
commissure appears to display a persistence of the intrinsic defences in the
setting of LPR. This may explain part of the mechanism identifying why
laryngeal pathology, such as carcinoma arising from this region, is such a
rarity113. However the loss of CA3 is not likely to be the sole event, given
there was no significant change in the medial arytenoid region, however
there were multiple other molecular changes in this area.
4.4.3 CRNN
Cellular defence pathways are also thought to play a role in the mucosal
response to LPR77. These have been described as being molecular
“chaperones” which regulate the folding and unfolding of cellular proteins168.
CRNN, also known as squamous epithelial heat shock protein 53 (SEP53) is

! "$#!
one such that has a role in repairing protein damage after cell injury169.
Animal models of oesophageal injury, using porcine epithelium, noted a
significant up-regulation of SEP53 in both hyperplastic and hyperkeratotic
lesions169. Interestingly there was much lower, and dysregulated expression
in oesophageal adenocarcinoma cells.
Whilst it is recognised that these changes were noted in oesophageal
mucosa, an increase in expression in SEP53 is in contrast to Johnston et
al.77 who found significantly decreased levels of SEP70 and slightly less
SEP53 in the posterior commissure area of the larynx when measured by
Western blot analysis. This current study considered further the sub-sites of
the larynx. It is of note that there was higher relative expression of SEP53 in
the posterior commissure region compared to the other regions of the larynx
in both groups. It is possible that this may be due to this area being the
most susceptible to injury through refluxate, in addition to being squamous
epithelium. This study identified a significant difference in SEP53 in the
medial arytenoid region in the LPR group, with higher expression noted in
this group. This may reflect its role as a “molecular chaperone” for cellular
repair processes, or potentially its increasingly recognised role in the
immune system170. Additionally a significant component of such a difference
is likely to be related to the increased level of squamous epithelium, rather
than columnar, found on histological analysis in this study.
! "$$!
4.4.4 CD1d
The mucosal immune response is varied in the presence of LPR. Recent
research has focused on the mucosal immune response to refluxate,
particularly given its position at the junction of the IgA - dominated upper,
and IgG - dominated lower airways171. The mucosal immune response has
increasingly being studied. One study found a significant increase in CD8+
lymphocytes in the laryngeal epithelium biopsied from the true vocal cord,
suggesting that in the this sub-site there may be an accumulation of CD8+ T
cells in the luminal epithelial layer171.
Further investigation into CD1d found significantly more expression in the
superficial (luminal) layers of the vocal cord in patients with LPR. They
described a change in expression from MHC Class IhiCD1dlo in the basal
layers to a gradual transition to MHC Class IloCD1dhi epithelial cells in the
luminal layers. However the role of changes in expression of CD1d in
inflammatory conditions is not entirely clear. CD1d has been associated
with abnormal host immune responses in primary biliary cirrhosis172,
rheumatoid arthritis173 and inflammatory bowel disease. What is known is
that CD1d is a crucial member of the immune system in the presentation of
glycolipid antigens to natural killer T cells (NKT cells)173.
CD1d is ubiquitous in the intestinal epithelium and its down-regulation has
been noted in microscopic colitis174. It was thought that this may be
demonstrating an immunoregulatory dysfunction in the colonic mucosa.
Additionally, CD1d is recognised as inducing production of
! "$%!
immunoregulatory cytokines such as interleukin-10. Consequently reduction
of CD1d may contribute to the pathogenesis of this colitis by reducing the
activation of NKT cells or the production of IL-10.
Our results did not backup the findings of increased expression of CD1d in
the squamous vocal cord as found by Rees et al.171. However their study
utilised a quantitative immunofluoresence technique and their biopsy
samples were of the squamous vocal cord. Our population demonstrated a
significant difference in the medial arytenoid region of the larynx, using a
gene expression method, with a lower expression noted in the LPR group.
However, we did not measure post-transcriptional expression. In addition
other factors can influence the expression of CD1d. A recent study of
cervical epithelium found CD1d down regulated in human papillomavirus –
positive cells, in vivo and in vitro, on flow cytometry, however it is of note that
the CD1d mRNA levels were not affected.
4.4.5 CDH1 (E-cadherin)
Epithelial cadherin (E-cadherin) is encoded by the CDH1 gene and has a
significant role in the intercellular interaction and adhesion. There is also
significant evidence that it is crucial for epithelial integrity and barrier
functions112. It is widely recognised that in both the oesophagus and larynx
abnormal exposure to refluxate can cause increased paracellular
permeability113. As the primary barrier to the passage of solutes through the
paracellular space, permeability can be affected by the integrity of the
intercellular junction. These are composed of an E-cadherin-catenin
! "$&!
complex, known as adherens junctions, with E-cadherins being recognised
as important in cell-cell adhesion and tight junction complex composed of
zonula occludens 1, and occludin. Potentially any damage to these could
contribute to the loss of normal defences, allowing the mucosa to be more
susceptible to further injury.
Dilatation of intercellular spaces (DIS) between squamous epithelial cells
has been identified in studies of reflux exposed oesophageal mucosa. This
is considered a morphological marker of acid damage to this tissue175.
Furthermore, there is evidence it improves following treatment with a PPI176.
One study analysed biopsies from the inter-arytenoid region of the posterior
larynx for evidence of DIS175. Using a computer assisted morphometric
system a statistically significant difference between the patients with LPR
and the control group was identified. Interestingly there was no correlation
between severity of reflux symptoms and the intercellular space distance.
Acid and pepsin have previously been identified as being able to break down
the barrier and affect the epithelial permeability through injury to the
junctional complex in oesophageal mucosa177. In addition, previous studies
have found a decreased expression of E-cadherin in the biopsied areas of
the larynx using immunohistochemical technique112,113. Gill et al.112 found
50% of their samples from the vocal fold, ventricle and posterior commissure
demonstrated either a partial or complete loss of E-cadherin expression.
The pathophysiology of this change is poorly understood, with proposed
mechanisms including exposure to pepsin or secondary to the inflammatory
! "$'!
response associated with LPR112. What is recognised is that E-cadherin is
similarly expressed in both normal squamous epithelium and metaplastic
columnar epithelium of the oesophagus178,179.
This study demonstrated higher expression of CDH1 in the LPR group,
limited to the medial arytenoid region. This is contrary to the findings in
previous literature, where dysplasia of the epithelium demonstrated a
decrease in e-cadherin, most likely a reflection of the deterioration of
squamous defences. Such a change in our study may be related to the
histological differences noted between the two groups in the medial
arytenoid, with the control group demonstrating normal columnar epithelium,
compared to the largely squamous LPR group.
4.5 Laryngeal Sub-sites
The molecular studies regarding LPR can be classified as either animal
studies33,75, in vitro, using human biopsies175 or a combination of these113,180.
Of the work researching human tissue, the majority of these have
considered the posterior commissure and one other sub-site, such as the
vocal cord, or ventricle. This is hardly surprising given this is the area most
noted demonstrating changes indicative of LPR. Fewer studies have
compared more than 2 sub-sites at a time74,112. Subject numbers in each
study are typically small, highlighting the difficulty in recruiting suitable

! "$(!
patients for such studies. Each study has almost unanimously found
differences between laryngeal sub-sites in response to LPR.74
This study concurred with previous research in finding a variability of
mucosal response within the larynx in the presence of LPR. Of most
importance, however, is that the area demonstrating the greatest number of
differences in gene expression was the medial arytenoid. The medial
arytenoid was typically columnar epithelium in the non-LPR group, whereas
the LPR group was noted to have squamous epithelium, or a combination of
both. Such a histological change may well represent an attempt to provide
an epithelium of greater resilience to the repeated, intermittent insult of LPR.
This medial arytenoid region also demonstrated the greatest number of
molecular marker differences between the LPR and non-LPR group, with
significant differences noted in expression of inflammatory genes such as
TGF!-1, CD1d and CRNN. The position of the medial arytenoid region is
closer to the posterior commissure than the false vocal cord biopsies, which
may indicate that this columnar epithelium is receiving more damaging
refluxate than the false vocal cord, leading to greater changes in this region.
Additionally there was a decrease in gene expression of the secretory
mucins MUC2 and MUC5B in the medial arytenoid. Such a difference in one
of the intrinsic mucosal defences between the LPR and non-LPR groups
may represent an impairment, or loss of these defences in this region. Loss
of mucin in this region may allow this area to be more susceptible to further

! "$)!
damage from refluxate. Alternatively, rather than a pathological change with
decrease in laryngeal defences, such a difference may represent an
adaptive change from the less resilient columnar epithelium to the more
durable squamous epithelium. Such differences in MUC2 expression were
specific only to the medial arytenoid, however MUC5B demonstrated this
also in the posterior commissure - already known to be squamous tissue on
histological analysis in both patient groups. It is of note, however, that there
were 2 outliers in the non-refluxing group which, were the groups more
homogenous, may not have provided such a significantly different result.
This change in mucin expression may be complicated by the difference
noted in histology from columnar to squamous tissue which in itself may lead
to such a difference. In one study of Barrett’s oesophagus, MUC2
expression was significantly higher in columnar epithelium with goblet cells,
than in columnar epithelium without181. In another study only mild superficial
staining of MUC1 was noted in the normal squamous epithelium, however
MUC2 was expressed in the Barrett epithelium and in dysplasia182. If the
change in gene expression is purely due to the change in histology, then this
could imply that an adaptive change is occurring, with such tissue being
more protective to the larynx than the columnar epithelium even with the
mucin.
However, within this study, there was a statistically significant difference of
MUC5B of LPR and non-LPR patients in both the medial arytenoid
(columnar epithelium) and also in the posterior commissure, an area entirely

! "$*!
identified as being squamous epithelium. Consequently this may indicate a
failure of laryngeal defences in the presence of LPR however it is likely, on
balance, that there is a combination of both factors finally affecting mucin
expression.
4.6 Limitations
It must be qualified that there were notable differences between the two
groups. Firstly, the average age for the LPR group was 17 years older than
the non-LPR group. Such an age difference may contribute to the difference
between groups. However, in their meta-analysis, Dent et al.9 found the
effect of age on the prevalence of GORD was uncertain. Two studies
identified a slight but significant association. A study from a General
Practitioner database in the United Kingdom found the incidence of GORD
increased in both sexes until the age of 69, then decreased. Such a trend
was also identified in other populations, although at different ages. It is not
entirely clear what percentage of these people would also suffer LPR,
however it is possible a similar distribution exists. Additionally, there is a
suggestion in histological analyses of the larynx that the frequency of
squamous epithelium in the larynx may be related to age30, however the
extent and the temporal parameters at which this occurs is not known. This

! "%+!
may be related to the “older” larynx being exposed to more airway irritants
over time than a younger population.
Other studies have also demonstrated gene expression varies with age. A
recent meta-analysis of 27 data sets, using profiles from mice, rats and
humans, found 55 genes to be consistently over-expressed with age and 17
under-expressed183. It is of interest to note that the majority of over-
expressed genes were related to inflammation and immune responses and
those under-expressed related to energy metabolism, alterations in genes
related to apoptosis and the cell cycle. Consequently it is clear that the age
difference may provide a confounding variable, however it is difficult to
determine the extent it may have influenced results in this study.
In addition, there was a noticeable difference between the ratio male to
female in each group. The impact this has on the data is again difficult to
determine, with a meta-analysis including 4 cross sectional studies and one
longitudinal study, finding no significant association between sex and
GORD9. Whilst it is recognised that LPR is likely a separate entity to GORD,
there is currently a lack of any strong evidence that sex is a contributing
factor for the development of the condition. However it is well recognised
that the larynx is a hormone sensitive organ, with identifiable changes
attributable to testosterone, progesterone and oestrogen184. Furthermore
there is evidence that the greatest voice change after puberty occurs in
females after menopause related to both hormone changes and subsequent
muscular atrophy184 Such changes may be represented by changes in gene
! "%"!
expression throughout the larynx, or even a change in susceptibility to
damaging agents. Consequently as further research identifies specific sub-
groups of LPR, both gender and age may become increasingly important.
With a larger numbers future studies would be able to assess whether such
changes contribute to any significant differences in gene expression in
patients with LPR.
Despite the lack of evidence on prevalence, there is evidence that the
human larynx may demonstrate sex related histological differences. Stell et
al30 in their study of 328 human larynges found the mucosa of the vestibular
folds (false vocal cords) were significantly more likely to be entirely columnar
epithelium and the laryngeal surface of the epiglottis more likely to possess
more extensive, but not greater incidence of, islets of squamous epithelium
in males. This may again provide a confounding variable, with greater
proportion of males in the LPR group and histologically a greater proportion
of squamous epithelium identified in the false vocal cord and medial
arytenoid regions. However Stell’s study was conducted more than 30 years
ago, and as such, practices such as smoking may have had a greater
influence on the male population undergoing autopsy than female. It is of
note that our LPR group did possess a number of smokers. The effect of
chronic irritation on the larynx has been well documented, and may lead to
both squamous changes of respiratory epithelium through to laryngeal
carcinoma30,185. Further examination of the data did not demonstrate that
there was an over representation of smokers in the outliers. Whilst the role
! "%#!
of smoking in tumourgenesis is well documented, further research is now
considering an additive effect of smoking and reflux to laryngeal injury186
It must also be made note of the number of significant outliers identified
throughout many groups. In large population studies these may not
contribute significantly to sway a statistical result, however with the low
subject numbers in this study, including those discounted in the study due to
poor RNA integrity, such outliers may have a significant effect on the
analysis. In addition, such small population numbers may lead to missing a
true statistical difference for some genes, with the false and true vocal cord
biopsies being the most likely affected given their lower numbers of
individual biopsies.
Patients were selected according to clinical history and examination, and on
the RSI and RFS score. The diagnosis of LPR is typically a clinical decision,
based on history and examination, with often a trial of PPI used to confirm.
However to conduct research into LPR does not allow for the latter. The use
of 24-hour pH probe has been utilised in earlier research for diagnosis and
still nominally remains the “gold-standard” for diagnosis. It is becoming
increasingly clear that the use of pH probes is not so much gold-standard
but extremely limited, given that although the probe can detect acidic reflux,
there is now a large body of evidence that this acid is not the sole
aetiological factor with bile, pepsin and even air being considered as other
causative agents176. Newer diagnostic techniques continue to be

! "%$!
developed, particularly multichannel intraluminal impedence monitoring187
however their use is not yet widespread176.
Regardless of these limitations, this study has demonstrated significant
mucosal differences in a clinically diagnosed and symptomatic population
when compared to control tissues from multiple sites in the larynx. To our
knowledge, this is the first study of this type and has been possible because
of the altruistic consent of those control patients who risked some extra
discomfort and possible complication to facilitate this research.
A number of biopsies of the true vocal cord were found to have columnar in
addition to squamous epithelium. This is likely to be due to the fact that
biopsies were collected from the superior (and possibly too lateral) surface
of the vocal fold, to avoid the very real risk of significant voice change if the
free edge of the vocal cord was biopsied. This may well be the contributing
factor why this study did not demonstrate the previously identified
differences in gene expression in this region. In addition, there were a
number of patient biopsies excluded from analysis due to the poor quality of
extracted RNA. This reduction in the final number of tissue samples
available for analysis has no doubt impacted upon the power of the study
and may have affected the results drawn from the true vocal cord samples.
! "%%!
4.7 Summary
Overall, this study demonstrated a number of important differences in gene
expression between a clinical population suffering from LPR and controls.
Previous research has demonstrated that there are differences between the
individual subsites of the larynx, however no single study has considered all
areas together, A population of patients identified with LPR were compared
to an asymptomatic group, with a mixed group. Samples from the 4 subsites
of the larynx were biopsied under general anaesthetic following completion
of the RSI questionnaire. The RFS was scored for each patient at the time
of surgery. Sections of the samples were sent for histological analysis and
prepared for quantitative real time reverse transcription PCR analysis on 20
previously identified genes.
The results from this project identified the mucosa of the medial arytenoid
region of larynx as the sub-site with the most genes demonstrating a
significant difference in gene expression. This is a novel finding, particularly
given a large proportion of the literature on LPR has focussed on the
posterior commissure, due to the well described hypertrophy which occurs in
this area in the presence of LPR. The histopathology demonstrated this
area to be overwhelmingly columnar epithelium in the normal group,
however there was a notable increase in the presence of squamous
epithelium in the patients with LPR, suggesting there may be metaplastic
events occurring. How often, or over what time period is required to develop

! "%&!
this change is still to be determined, as is the point at which this injury
becomes symptomatic. With increasing technology, the ability to both
examine and biopsy the larynx is becoming easier. The advent of transnasal
oesophagoscopy, including the ability to pass biopsy forceps through the
scope would allow for biopsies without general anaesthesia. Such
techniques are now possible, and would allow for possibly not only a
definitive diagnosis, but the opportunity to monitor treatment effect. Our
current findings would suggest that further research should include biopsies
of the medial arytenoid area to identify further molecular changes. This area
would be a safe and entirely suitable site for biopsying in order to monitor or
research treatment effects. In addition, the ability to conduct such biopsies
in as minimally invasive manner as possible would combat the small
numbers limits this study.
4.8 Conclusions
This study has considered the first hypothesis, confirming that there are
significant differences, both histologically and in gene expression, between
the LPR group and the control group. This suggests that in a clinically
diagnosed population, mucosal changes are identifiable in LPR.
In addition to the histological analysis, differences in expression of a number
of inflammatory markers in the LPR group compared with controls was
noted. TGF!-1, CD1d, CRNN and CDH-1 all demonstrated a significant

! "%'!
difference. However, a number of the cytokines related to the NF-!B
inflammatory process demonstrated no significant difference between the
two groups.
Secondly, this study found site-specific changes within the larynx, which are
likely to be related to LPR. Hill et al.131 suggested that the posterior
commissure may not be specific enough to demonstrate changes in
response to treatment. This study would suggest that the medial arytenoid
is a region more sensitive to LPR changes than the posterior commissure for
a number of reasons. Firstly as a mainly columnar epithelium histologically it
is more susceptible to injury and secondly, it demonstrated the greatest
molecular changes. A number of biomarkers have been identified, including
MUC2, 5B, KRT14, and inflammatory markers such as CD1d, SEP53 and
TGF!-1.

! "%(!
5 APPENDICES

! "%)!
5.1 Appendix 1: Reflux Symptom Index Within the last month, how did the following problems affect you? Circle the appropriate response
0 = No Problem 5 = Severe Problem
1. Hoarseness or a problem with your voice
0
1
2
3
4
5
2. Clearing your throat
0
1
2
3
4
5
3. Excess throat mucus or post nasal drip
0
1
2
3
4
5
4. Difficulty swallowing food, liquids, or pills
0
1
2
3
4
5
5. Coughing after you ate, or after lying down
0
1
2
3
4
5
6. Breathing difficulties, or choking episodes
0
1
2
3
4
5
7. Troublesome or annoying cough
0
1
2
3
4
5
8. Sensations of something sticking in your throat, or a
lump in your throat
0
1
2
3
4
5
9. Heartburn, chest pain, indigestion, or stomach acid
coming up
0
1
2
3
4
5
TOTAL =
Belafsky et al. 200260.
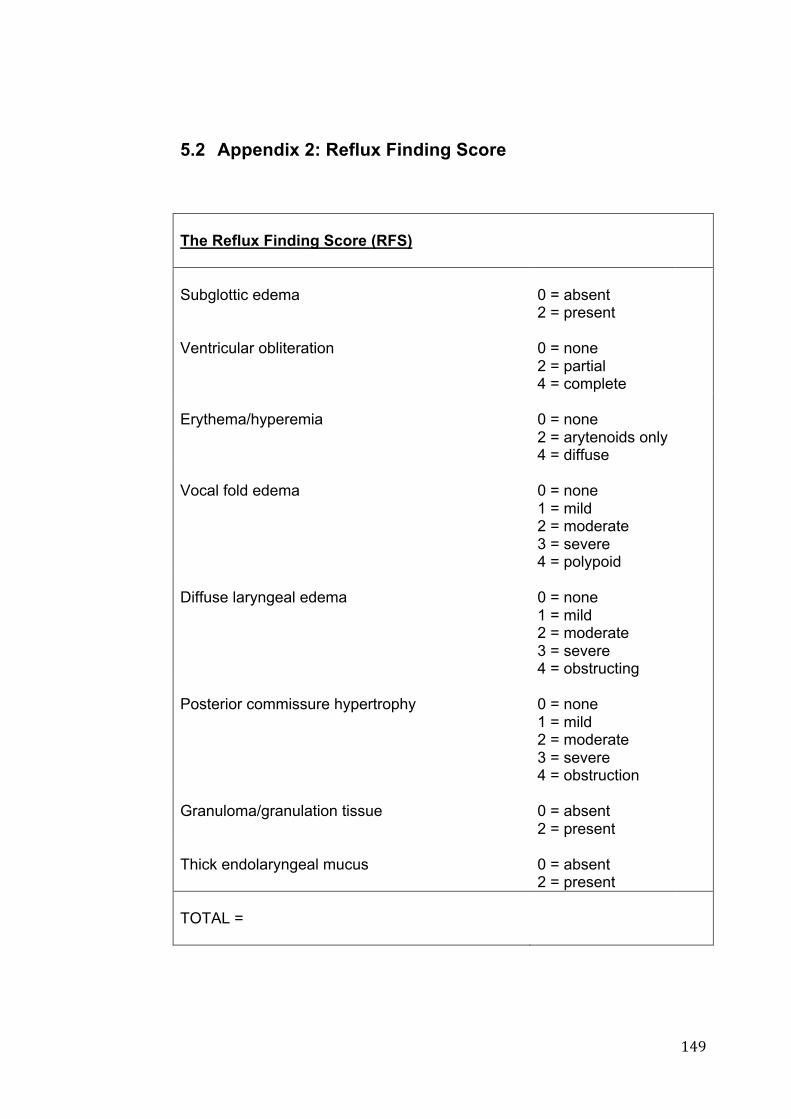
! "%*!
5.2 Appendix 2: Reflux Finding Score
The Reflux Finding Score (RFS) Subglottic edema
0 = absent 2 = present
Ventricular obliteration
0 = none 2 = partial 4 = complete
Erythema/hyperemia
0 = none 2 = arytenoids only 4 = diffuse
Vocal fold edema
0 = none 1 = mild 2 = moderate 3 = severe 4 = polypoid
Diffuse laryngeal edema
0 = none 1 = mild 2 = moderate 3 = severe 4 = obstructing
Posterior commissure hypertrophy
0 = none 1 = mild 2 = moderate 3 = severe 4 = obstruction
Granuloma/granulation tissue
0 = absent 2 = present
Thick endolaryngeal mucus
0 = absent 2 = present
TOTAL =

! "&+!
!!!!!!!!!!!!!
!"# $%%&'()*+#,+-./0&11/.+2+3)41/'51+6*78)'&.51+9&%/.:+
! "&"!
!

! "&#!
!

! "&$!
!
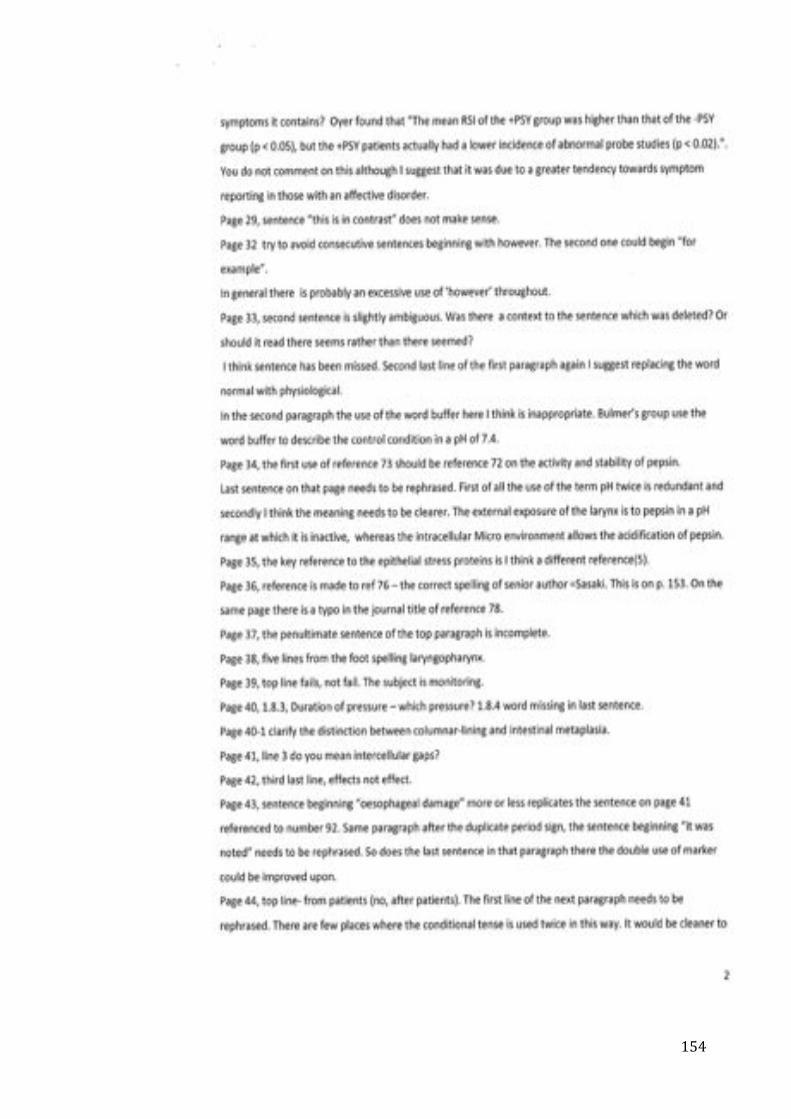
! "&%!
!
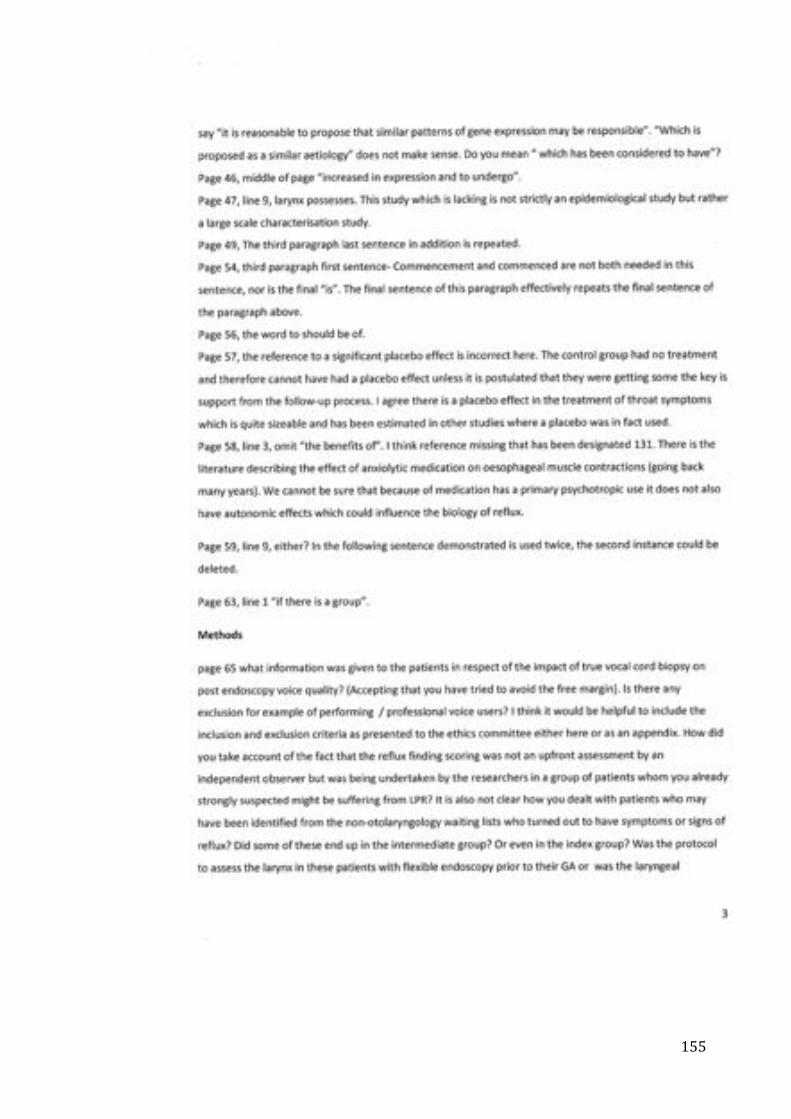
! "&&!
!

! "&'!
!!

! "&(!
!

! "&)!
!
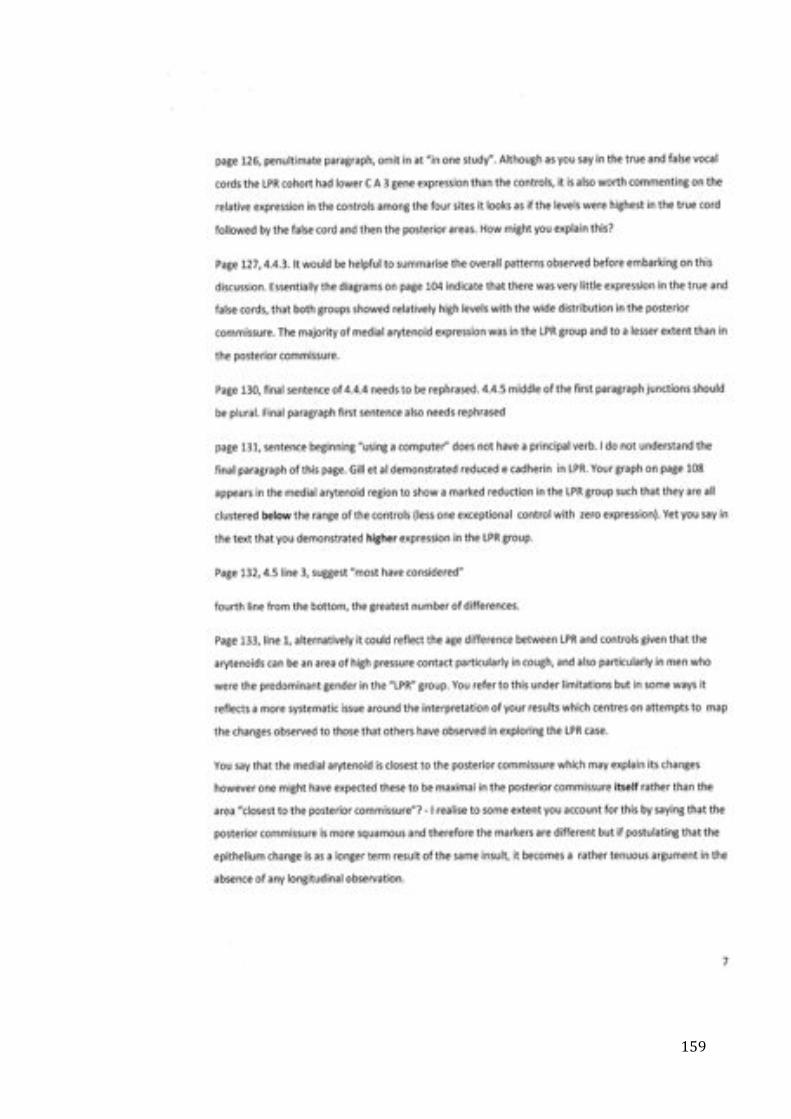
! "&*!
!

! "'+!
!

! "'"!
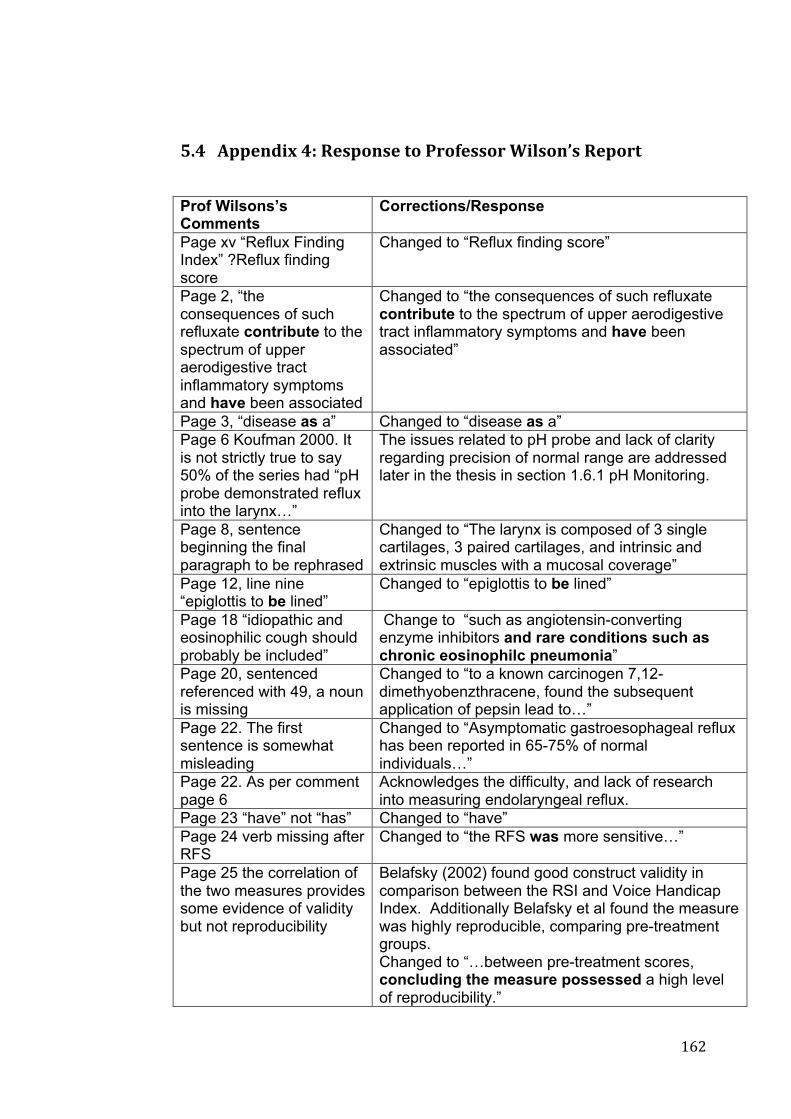
! "'#!
!
!"; $%%&'()*+;,+9&1%/'1&+:/+-./0&11/.+3)41/'51+9&%/.:+
Prof Wilsons’s Comments
Corrections/Response
Page xv “Reflux Finding Index” ?Reflux finding score
Changed to “Reflux finding score”
Page 2, “the consequences of such refluxate contribute to the spectrum of upper aerodigestive tract inflammatory symptoms and have been associated
Changed to “the consequences of such refluxate contribute to the spectrum of upper aerodigestive tract inflammatory symptoms and have been associated”
Page 3, “disease as a” Changed to “disease as a” Page 6 Koufman 2000. It is not strictly true to say 50% of the series had “pH probe demonstrated reflux into the larynx…”
The issues related to pH probe and lack of clarity regarding precision of normal range are addressed later in the thesis in section 1.6.1 pH Monitoring.
Page 8, sentence beginning the final paragraph to be rephrased
Changed to “The larynx is composed of 3 single cartilages, 3 paired cartilages, and intrinsic and extrinsic muscles with a mucosal coverage”
Page 12, line nine “epiglottis to be lined”
Changed to “epiglottis to be lined”
Page 18 “idiopathic and eosinophilic cough should probably be included”
Change to “such as angiotensin-converting enzyme inhibitors and rare conditions such as chronic eosinophilc pneumonia”
Page 20, sentenced referenced with 49, a noun is missing
Changed to “to a known carcinogen 7,12-dimethyobenzthracene, found the subsequent application of pepsin lead to…”
Page 22. The first sentence is somewhat misleading
Changed to “Asymptomatic gastroesophageal reflux has been reported in 65-75% of normal individuals…”
Page 22. As per comment page 6
Acknowledges the difficulty, and lack of research into measuring endolaryngeal reflux.
Page 23 “have” not “has” Changed to “have” Page 24 verb missing after RFS
Changed to “the RFS was more sensitive…”
Page 25 the correlation of the two measures provides some evidence of validity but not reproducibility
Belafsky (2002) found good construct validity in comparison between the RSI and Voice Handicap Index. Additionally Belafsky et al found the measure was highly reproducible, comparing pre-treatment groups. Changed to “…between pre-treatment scores, concluding the measure possessed a high level of reproducibility.”

! "'$!
Page 26 Oyer et al. “The mean RSI of the +PSY group was higher than that of the –PSY group…?
Added “. This indicates that those with psychiatric disorders may have a lower threshold for reporting such symptoms.”
Page 29 sentence “This is in contrast” does not make sense
Changed to “Comparatively, a sulcus vocalis stops at the vocal process and is found in the striking zone.”
Page 32 consecutive sentences beginning with “however”
Changed to “For example,…”
Page 33, “seems” rather than “seemed”
Changed to “there seems to be…”
Page 33 suggest replacing word normal with physiological
Changed to “…may be considered physiologically normal…”
Page 33 inappropriate use of “buffer”
Changed to “following incubation in a test solution of pH 4.0…”
Page 34 First use of ref 73 should be reference 72
Changed to add ref 72.
Page 34: last sentence should be rephrased
Changed to “The pH of intracellular structures such as Golgi bodies and lysosomes lie between 4.0 to 5.0. Whilst the laryngeal mucosa is exposed to inactive pepsin, intracellular uptake into this micro-environment allows for the acidification of pepsin. This may lead to intracellular injury.”
Page 35. Key reference to epithelial stress protein is 5
Key reference is “Effect of pepsin in laryngeal stress protein (Sep 70, Sep53, Hsp 70).
Page 36 ref 76 – author incorrectly spelt, typo Ref 78
Endnote updated, Changed on references
Page 37. Sentence incomplete
Changed to “Furthermore, a recent study noted that whilst pepsin activity was pH dependent, bile acids did not attenuate the activity of pepsin.”
Page 38 typo Changed to “laryngopharynx” Page 39 “fails” not “fail” Changed to “monitoring over short periods fails to
find a significant difference” Page 40 Duration of pressure – which pressure?
Changed to “The UOS tonically constricts, relaxing to allow boluses of food or fluids with swallowing. Studies measuring UOS pressures found similar average pressure levels in patients with LPR to controls88,93. However whilst the average pressure itself was not significantly different, the duration of tonic pressure was nearly double in the control group compared to a group with GORD”
Page 40-1 clarify intestinal metaplasia
Changed to “ injuries to this lining can occur at the histological and microscopic level and is recognized in the presence of inflammation.”
Page 41 “changes in intra- Change to “changes in intercellular gaps”
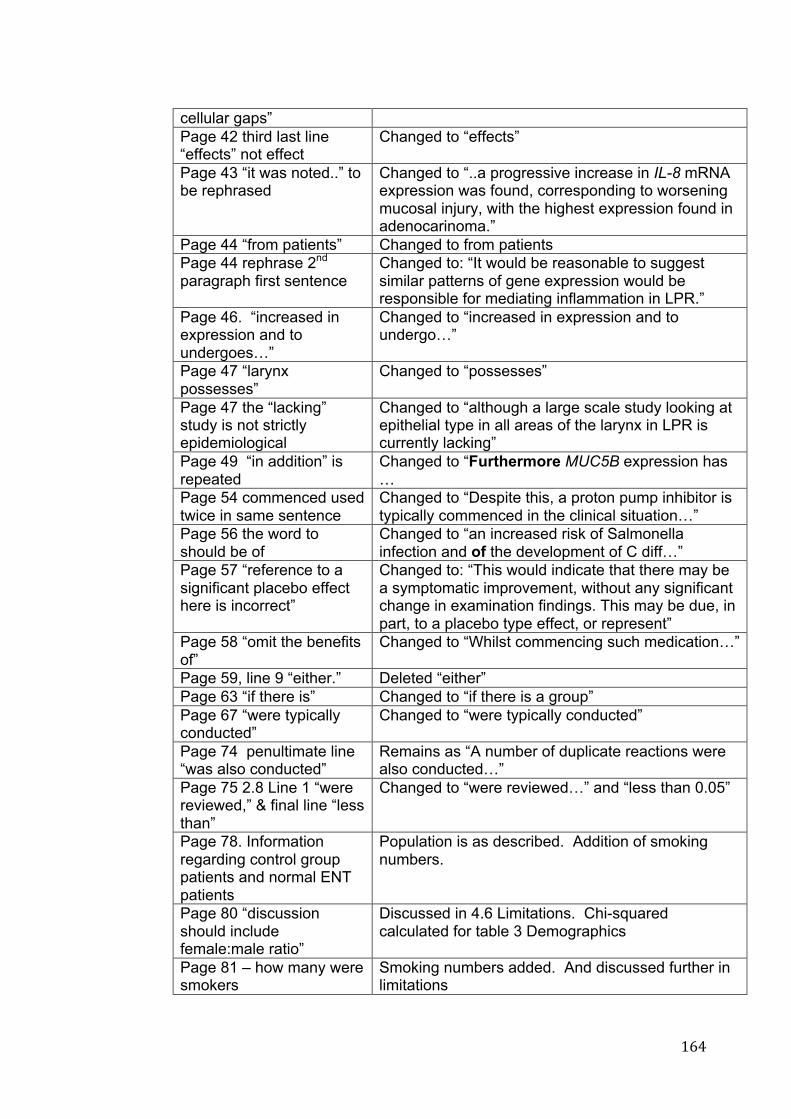
! "'%!
cellular gaps” Page 42 third last line “effects” not effect
Changed to “effects”
Page 43 “it was noted..” to be rephrased
Changed to “..a progressive increase in IL-8 mRNA expression was found, corresponding to worsening mucosal injury, with the highest expression found in adenocarinoma.”
Page 44 “from patients” Changed to from patients Page 44 rephrase 2nd paragraph first sentence
Changed to: “It would be reasonable to suggest similar patterns of gene expression would be responsible for mediating inflammation in LPR.”
Page 46. “increased in expression and to undergoes…”
Changed to “increased in expression and to undergo…”
Page 47 “larynx possesses”
Changed to “possesses”
Page 47 the “lacking” study is not strictly epidemiological
Changed to “although a large scale study looking at epithelial type in all areas of the larynx in LPR is currently lacking”
Page 49 “in addition” is repeated
Changed to “Furthermore MUC5B expression has …
Page 54 commenced used twice in same sentence
Changed to “Despite this, a proton pump inhibitor is typically commenced in the clinical situation…”
Page 56 the word to should be of
Changed to “an increased risk of Salmonella infection and of the development of C diff…”
Page 57 “reference to a significant placebo effect here is incorrect”
Changed to: “This would indicate that there may be a symptomatic improvement, without any significant change in examination findings. This may be due, in part, to a placebo type effect, or represent”
Page 58 “omit the benefits of”
Changed to “Whilst commencing such medication…”
Page 59, line 9 “either.” Deleted “either” Page 63 “if there is” Changed to “if there is a group” Page 67 “were typically conducted”
Changed to “were typically conducted”
Page 74 penultimate line “was also conducted”
Remains as “A number of duplicate reactions were also conducted…”
Page 75 2.8 Line 1 “were reviewed,” & final line “less than”
Changed to “were reviewed…” and “less than 0.05”
Page 78. Information regarding control group patients and normal ENT patients
Population is as described. Addition of smoking numbers.
Page 80 “discussion should include female:male ratio”
Discussed in 4.6 Limitations. Chi-squared calculated for table 3 Demographics
Page 81 – how many were smokers
Smoking numbers added. And discussed further in limitations
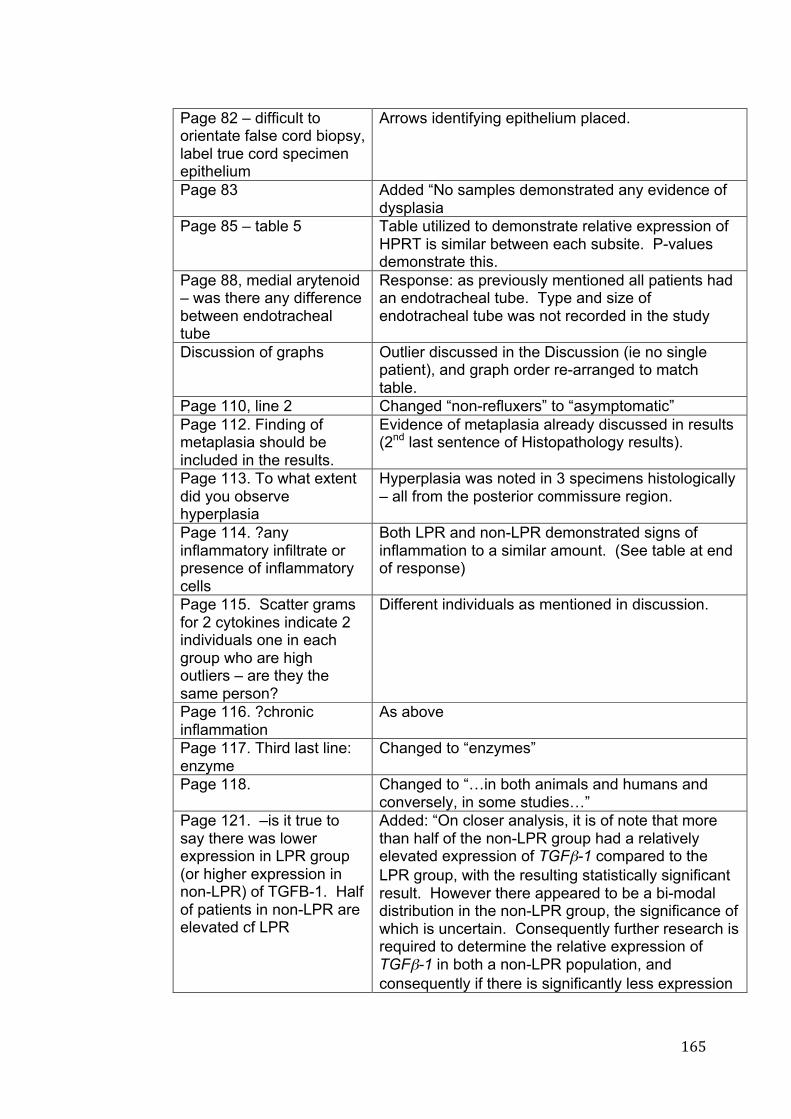
! "'&!
Page 82 – difficult to orientate false cord biopsy, label true cord specimen epithelium
Arrows identifying epithelium placed.
Page 83 Added “No samples demonstrated any evidence of dysplasia
Page 85 – table 5 Table utilized to demonstrate relative expression of HPRT is similar between each subsite. P-values demonstrate this.
Page 88, medial arytenoid – was there any difference between endotracheal tube
Response: as previously mentioned all patients had an endotracheal tube. Type and size of endotracheal tube was not recorded in the study
Discussion of graphs Outlier discussed in the Discussion (ie no single patient), and graph order re-arranged to match table.
Page 110, line 2 Changed “non-refluxers” to “asymptomatic” Page 112. Finding of metaplasia should be included in the results.
Evidence of metaplasia already discussed in results (2nd last sentence of Histopathology results).
Page 113. To what extent did you observe hyperplasia
Hyperplasia was noted in 3 specimens histologically – all from the posterior commissure region.
Page 114. ?any inflammatory infiltrate or presence of inflammatory cells
Both LPR and non-LPR demonstrated signs of inflammation to a similar amount. (See table at end of response)
Page 115. Scatter grams for 2 cytokines indicate 2 individuals one in each group who are high outliers – are they the same person?
Different individuals as mentioned in discussion.
Page 116. ?chronic inflammation
As above
Page 117. Third last line: enzyme
Changed to “enzymes”
Page 118. Changed to “…in both animals and humans and conversely, in some studies…”
Page 121. –is it true to say there was lower expression in LPR group (or higher expression in non-LPR) of TGFB-1. Half of patients in non-LPR are elevated cf LPR
Added: “On closer analysis, it is of note that more than half of the non-LPR group had a relatively elevated expression of TGF!-1 compared to the LPR group, with the resulting statistically significant result. However there appeared to be a bi-modal distribution in the non-LPR group, the significance of which is uncertain. Consequently further research is required to determine the relative expression of TGF!-1 in both a non-LPR population, and consequently if there is significantly less expression

! "''!
in LPR patients of TGF!-1 in the medial arytenoid.” Page 122 Changed to “Its” Page 123 the last few lines belong in results
Moved to end of results section and reworded.
Page 124: first paragraph – change “is” to “are”
Changed to “there are further implications”
Page 126 “omit “in one study”
Changed to “Comparing biopsies from the laryngeal ventricle, vocal fold…”
Page 126 Comment on expression of CAIII in each site
There was a slightly higher expression of CA3 noted in the controls group for the true cord compared with the remainder of the larynx. This may occur as the true cord lacks significant other methods of defences. There are no goblet cells present, such as in the columnar epithelium of the medial arytenoid and false cord. Changed to “Expression of CA3 in the control group demonstrated a slightly higher expression in the true cord than in the other regions. This may represent one of the few intrinsic defences for the true cord region, which relies on other areas of the larynx to produce protective mucin. The variability of expression of CA3 in the normal larynx is lacking in current literature, however early studies into CA3 expression noted its depletion in patients with LPR110.”
Page 126 (Section 4.3.3 CRNN):
Added: “It is of note that there was higher relative expression of SEP53 in the posterior commissure region compared to the other regions of the larynx in both groups. It is possible that this may be due to this area being the most susceptible to injury through refluxate, in addition to being squamous epithelium. This study identified a significant difference in SEP53 in the medial arytenoid region in the LPR group, with higher expression noted in this group”
Page 130, final sentence 4.4.4 to rephrase. 4.4.5 middle 1st paragraph should be plural. Final paragraph first sentence should be rephrased.
Changed to: “, however it is of note that…” Changed to “Dilatation of intercellular spaces (DIS) between squamous epithelial cells has been identified in studies of reflux exposed oesophageal mucosa
Page 131 Sentence starting “using a computer” lacks a verb
Changed to “Using a computer assisted morphometric system a statistically significant difference between the patients with LPR and the control group was identified”
Page 131 – Final paragraph not consistent -
CDH1 graph incorrect results – replaced with correct graph. Text otherwise as intended.
Page 132 4.5 Line 3 Suggest “Most have
Prefer to remain as “…the majority of these have considered…”

! "'(!
considered” Page 132 the “greatest number…”
Changed to “the greatest number of differences….”
Page 133: Could changes be related to age.
The difference between median age in the groups was addressed in the limitation section. It is acknowledged that such a difference may bias the results, particularly given the small sample. In addition, it is acknowledged that the difference in distribution of sex between the two groups may also play a role.
Page 133: Medial arytenoid being closest to post. Commissure: Why don’t you expect the PC to have changes. (second paragraph)
This paragraph compares the results of gene expression between the 2 areas of columnar epithelium – the false cord and the medial arytenoid, and provides a suggestion as to why the MA region demonstrated greater change than the FC, lying closer to the oesophagous. That the posterior commissure is squamous in epithelium means it has a better protection, but still demonstrated evidence of differences in gene expression, consistent with hypertrophy. This study considered each patient only once, and as such the opportunity for identifying longitudinal change was not possible. However this study does now provide the framework for future studies to monitor molecular changes, potentially in response to treatment.
Page 135. Age differences. Why were the patients not matched?
There is a difference between the median ages for each group, which may bias the results. However a matched-pairs design was not intended for the study at this stage. However, the benefits of such a study are recognised, and may provide more robust results.
Page 136: Pts excluded because of poor quality RNA
This is discussed in 2.6 RNA Bioanalysis. Samples, (rather than patients) with RIN less than 5 were not utilised for further analysis. Sentence added to this section to clarify this.
Page 139 Summary is too brief.
Summary expanded. Future possibilities considered. Also consideration of transnasal oesophagoscopy + biopsies considered.
Page 139 Consider age and sex effects
Added: “However it is well recognised that the larynx is a hormone sensitive organ, with identifiable changes attributable to testosterone, progesterone and oestrogen184. Such changes may be represented by changes in gene expression throughout the larynx, or even a change in susceptibility to damaging agents. Furthermore there is evidence that the greatest voice change after puberty occurs in females after menopause related to both hormone changes and subsequent muscular atrophy184 Consequently as further
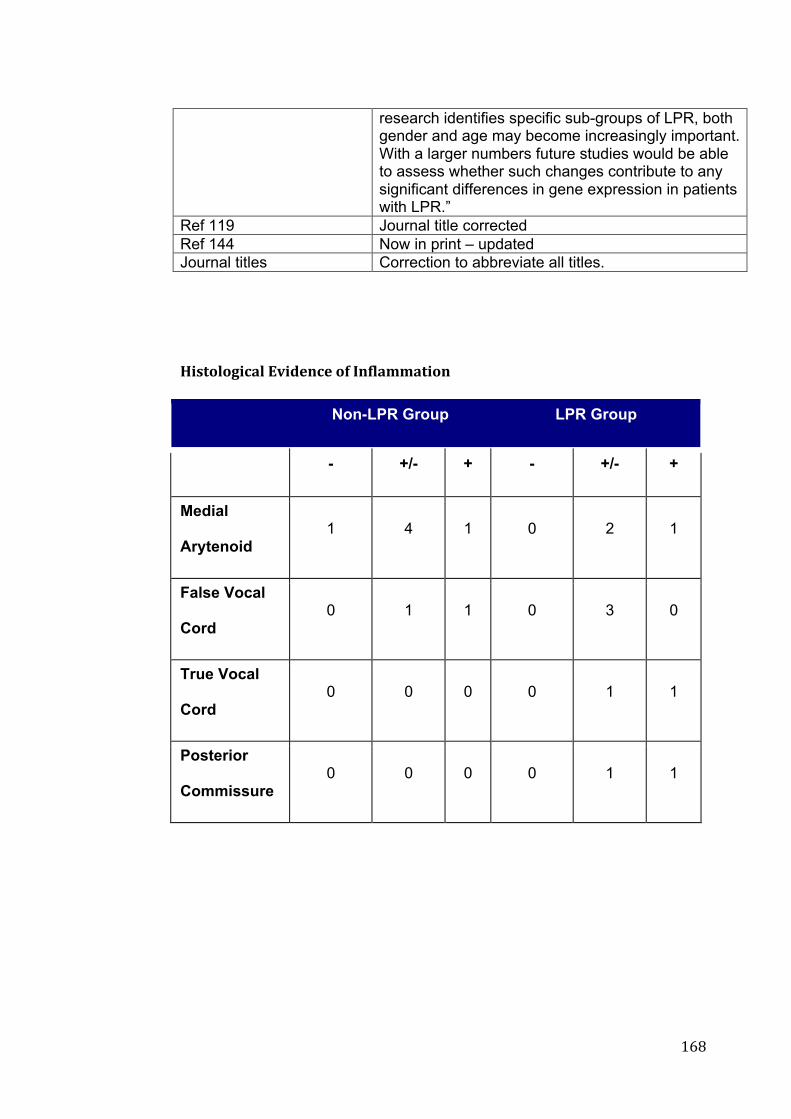
! "')!
research identifies specific sub-groups of LPR, both gender and age may become increasingly important. With a larger numbers future studies would be able to assess whether such changes contribute to any significant differences in gene expression in patients with LPR.”
Ref 119 Journal title corrected Ref 144 Now in print – updated Journal titles Correction to abbreviate all titles.
+++<)1:/4/=)>74+6?)(&'>&+/0+@'047887:)/'+! Non-LPR Group LPR Group
- +/- + - +/- +
Medial
Arytenoid 1 4 1 0 2 1
False Vocal
Cord 0 1 1 0 3 0
True Vocal
Cord 0 0 0 0 1 1
Posterior
Commissure 0 0 0 0 1 1
!!
! "'*!
!!!!!!!!!!!!
!"! $%%&'()*+!,+A.+B+9&&15+6*78)'&.51+9&%/.:+

! "(+!

! "("!

! "(#!

! "($!

! "(%!
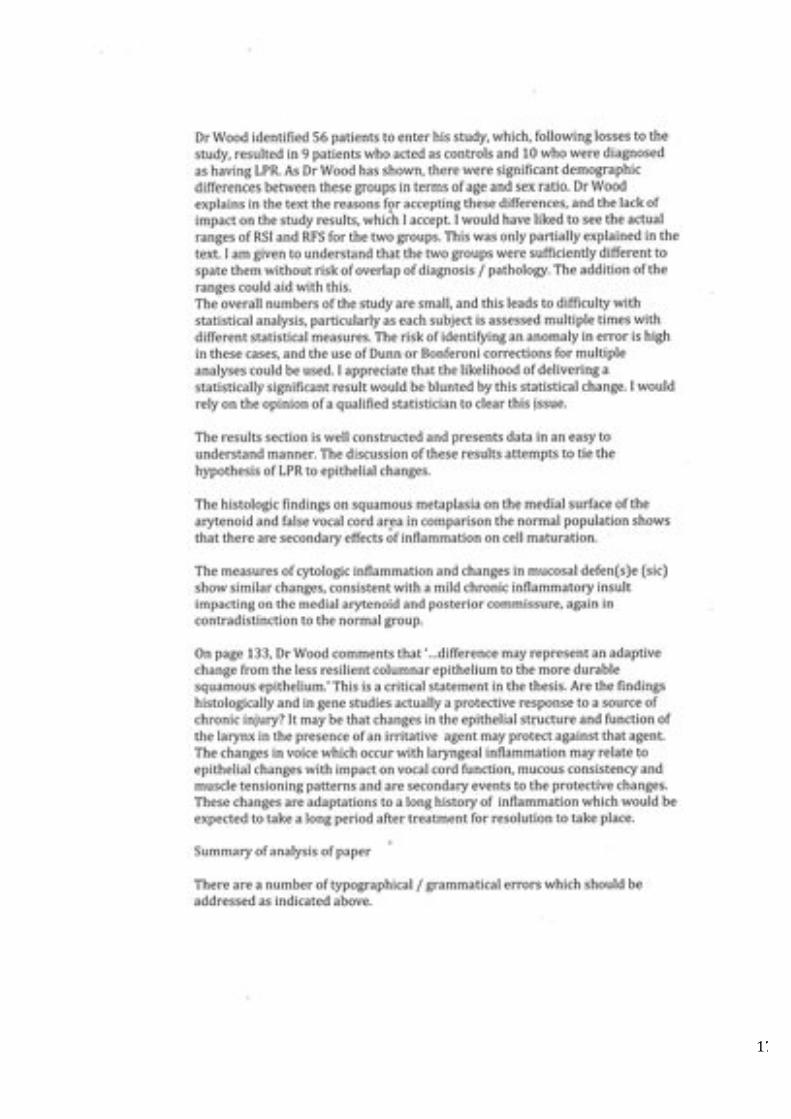
! "(&!

! "('!
!"C

! "((!
!"C++$%%&'()*+C,+9&1%/'1&+:/+A.+9&&15+9&%/.:+
Mr Rees’ comments Corrections/Response Page XV “Laryngopharyngeal reflux (LPR) is an increasingly diagnosed disease in Otolaryngology, however (it) is a highly controversial one.
“it” added to sentence.
Page xvi, para 3, line 1 Carbonic anhydrase (CA) is an integral component of laryngeal defence.
Corrected to: English “defence” utilised throughout thesis for consistency.
Page 16, 1.4.2 Globus Pharyngeal, Line 5 “…and naming symptoms globus hystericus, having been lin(k)ed with uterine dysfunction
Corrected to: “…and naming the symptom globus hystericus, having been linked with uterine dysfunction.
Page 17, 1.4.3 Dysphagia, line 11 “…or finally (, from) upper oesophageal sphincter dysfunction.”
Corrected to: “... or finally, from upper oesophageal sphincter dysfunction
Page 19 1.5 Consequences line 4-5 “The idea of reflux into the laryngopharynx was considered in the otolaryngological literature as far back as 1968” quotation missing?
Quotation added: Delahunty JE, Cherry JC. Experimentally produced vocal cord granulomas. Laryngoscope 1968;78:1941-7.
Page 19, line 7 “The latter of these was reported in 1985 with a case of recalcitrant subglottic stenosis…” ?missing quote
Quotation added: Little FB, Koufman JA, Kohut RI et al Effect of gastric acid on the pathogenesis of subglottic stenosis. Ann Otol Rhinol Laryngol 1985;94:516-519
Page 19, Para 2, Line 6. “..those with purulent effusions were more likely to be pepsin ‘positive’
Apostrophe’s altered
Page 21, 1.6.1 pH Monitoring, line 3-4 ‘…test, yet has demonstrated significant problems, however its use stems from its ubiquitous use in GORD.’ Suggest re-write
Changed to: “…, yet it has significant problems. This may relate to the ubiquitous use of pH monitoring in the diagnosis of GORD.’
Page 23, para 2, line 6 “Despite well documented limitations (,) these still remain the best (,) standardi(z)ed of LPR…” Inconsistent with English vs American text, utilise 1st, not second comma.
Changed to “standardised” First comma utilised, second comma removed.

! "()!
Page 23, Para 2, line 8-9 “It is well know that LPR is difficult to accurately diagnose on a single modality…”
Changed as per recommendation: “It is well know that LPR is difficult to accurately diagnose with a single investigational modality, and recent studies have suggested that combining these two modalities..”
Page 29, line 8 ‘…found in the striking.”
Changed to: ‘…found in the striking zone.’ (as per Prof Wilson).
Page 29 line 14. ‘aging larynx”
Changed to ‘…ageing larynx…’
Page 33 1.7.1.1 Acid, Para 1, line 4 ‘..of the role for acid, with a response to a trial of PPI…”
Changed to ‘..of the role for acid, with a positive response to a trial of PPI…’
Page 33, para1, line 8-9 “Whilst up to 50 episodes of reflux in the oesophagus may be normal, Koufman described as few as 3 episodes per week may lead to laryngeal injury.’
Changed to: “Whilst up to 50 episodes of reflux in the distal oesophagus may be considered physiologically normal, Koufman described as few as 3 episodes per week in the proximal oesophagus may lead to laryngeal injury.’ (also changed with Prof Wilson)
Page 39. 1.8.2, Line 13-17 ‘Whilst GORD is manifest by significant exposure…a reduced exposure time experienced by patients with LPR may provide enough refluxate to damage the larynx…” Quotation needed
Quotation: Lipan MJ, Reidenberg, JS, Laitman JT. Anatomy of reflux: A growing health problem affecting the structures of the head and neck. The Anatomical Record (Part B: New Anat) 2006;289B:261-270.
Page 43, para 2, line 5 ‘…corresponding to worsening mucosal injury98..’
Second fullstop removed. Sentenced altered following Prof Wilson’s comments.
Page 44, para 2, line 3 ‘…as a similar aetiology, just higher anatomically’
Changed to: ‘…as a similar aetiology, just at a more proximal anatomic site.”
Page 72, para 2, line 5 ‘was removed and placed in an eppendorf tube…”
Changed to ‘…was removed and placed in an Eppendorf tube..”
Comment regarding ranges of RSI and RFS in “scientific construct of thesis” response
Ranges added to demographics.

! "(*!
Response to Scientific construct of Thesis:
Diagnosis of LPR:
This thesis proposes that there will be molecular differences between
patients with signs and symptoms consistent with laryngopharyngeal reflux
(LPR), and those who are asymptomatic. In his Examiner’s comments, Mr
Rees suggests that a pre-biopsy 24-hour pH dual probe/multichannel
monitoring to establish the presence and severity of reflux. Furthermore,
treatment of reflux as a therapeutic trial, with repeating RFS and RSI may
have added validity of the diagnosis of LPR.
LPR is undeniably a difficult diagnosis, and lacks a “gold standard” test.
Consequently any research considering LPR will attract commentary
regarding definitive diagnosis. According to Friedman et al188, diagnosis of
LPR was made in a number of ways: (1) symptomatic response to a proton
pump inhibitor (PPI); (2) endoscopic assessment of the larynx; or (3)
observation of acidic reflux events using a pH probe. Of these, the first and
second were utilised in this study using the Reflux Symptom Index60 and
Reflux Finding Score57. 24-Hour pH probe monitoring has been considered
the gold standard189, however is not without significant issues, in addition to
being a further invasive test. Vaezi et al.190 noted whilst proximal
oesophagus pH sensors had a greater than 90% specificity, they had poor
sensitivity and reproducibility. This has been repeated in other studies191-193.
Furthermore Vaezi et al noted that the presence of an abnormal proximal

! ")+!
oesophagus did not predict response to a PPI either194. It is also recognised
that there is a lack of consensus regarding the optimal pH criteria for LPR195,
and even the number of times per week required to cause injury significant
enough to lead to symptoms.
Because of this it is difficult to say without some uncertainty whether
symptoms solely related to LPR. Mr Rees correctly discusses that these
patients are particularly prone to chronic throat clearing, which would tend to
bring the medial arytenoid region and vocal processes together forcibly.
Such an impact may lead to ongoing inflammation, particularly in this region
in which we identified mucosal changes. It could be argued that the
mechanical injury in this population could be the main cause of injury.
Future research, including subgroup analysis of the RSI, identifying patients
who rated highly on the second item “Clearing your throat,” and correlating
this to medial arytenoid changes would be useful in a study with a sufficiently
large enough population. The current study does not have sufficient
population to warrant such a subgroup analysis. Furthermore the symptom
of throat clearing, and even chronic coughing, are typical symptoms of LPR,
and so the symptomatic response to the irritation may also be perpetuating
the symptoms. Such a situation complicates the management. Treating
successfully the underlying cause may still leave a patient with habitual
throat clearing, and continuing physical irritation. Again identifying this
population would be difficult, as mucosal biopsies may well show
inflammatory changes which could potentially be attributed to either

! ")"!
pathophysiology. Ideally a way of demonstrating the continuing presence
of reflux to this area would allow a method of differentiating between the two
groups. Consequently further research would also need to focus on a
method for definitive diagnosis, whether this be through pH monitoring or
newer technologies such as the detection of aerosolised acid in the pharynx,
detecting pepsin in saliva, or high resolution endoscopy with narrow band
imaging196. Such technologies are in the development and research stage
but may allow a differentiation for a more specific diagnosis to be made. In
summary this study progresses the literature of LPR by identifying
biomarkers, and a specific site which demonstrates significant mucosal
change in the larynx.

! ")#!
6 REFERENCES
! ")$!
1. Wang L, Xiung L, Liu Y-L, et al. Correlation of pepsin-measured
laryngopharyngeal reflux disease with symptoms and signs.
Otolaryngol Head Neck Surg 2010;143:765-71.
2. Koufman JA. The otolaryngologic manifestations of gastroesophageal
reflux disease (GERD): A clinical investigation of 225 patients using
ambulatory 24-hour pH monitoring and an experimental investigation
of the role of acid and pepsin in the development of laryngeal injury.
Laryngoscope 1991;101:1-78.
3. Abd El-Fattah AM, Abdul Maksoud GA, Ramadan AS, et al. Pepsin
assay: A marker for reflux in pediatric glue ear. Otolaryngol Head
Neck Surg 2007;136:464-70.
4. Wise SK, Wise JC, DelGaudio JM. Gastroesophageal reflux and
laryngopharyngeal reflux in patients with sleep-disordered breathing.
Otolaryngol Head Neck Surg 2006;135:253-57.
5. De Benedetto M, Monaco G, Marra F. Extra-laryngeal manifestations
of gastro-oesophageal reflux. Acta Otorhinolaryngol Ital 2006;26:256-
59e.
6. Miller G, Pan Y. Gastro-oesophageal reflux disease. In: General
practice in Australia, health priorities and policies 1998 to 2008. Britt
H, Miller G, editors. Canberra: Australian Institute of Health and
Welfare; 2009. p. 269-78.
7. Vakil N, van Zanten SV, Kharilas P, et al. The Montreal definition and
classification of gastroesophageal reflux disease: A global evidence-
based consensus. Am J Gastroenterol 2006;101:1900-20.

! ")%!
8. Wiener GJ, Tsukashima R, Kelly C, et al. Oropharyngeal pH
monitoring for the detection of liquid and aerosolized
supraesophageal gastric reflux. J Voice 2009;23:498-504.
9. Dent J, El-Serag HB, Wallander M-A, et al. Epidemiology of gastro-
oesophageal reflux disease: a systematic review. Gut 2005;54:710-
17.
10. Heading RC. Prevalence of upper gastrointestinal symptoms in the
general population: a systematic review. Scand J Gastroenterol Suppl
1999;231:3-8.
11. Pace F, Bianchi Porro G. Clinical spectrum, natural history and
epidemiology of GERD. In: Gastroesophageal reflux disease.
Granderath FA, Kamolz T, Pointer R, editors. Vienna: Springer; 2006.
p. 1-11.
12. Kotby MN, Hassan OE, El-Makhzangy AMN, et al. Gastroesophageal
reflux/laryngopharyngeal reflux disease: a critical analysis of the
literature. Eur Arch Otorhinolaryngol 2010;267:171 - 79.
13. Kuhn J, Toohill RJ, Ulualp SO, et al. Pharyngeal acid reflux events in
patients with vocal cord nodules. Laryngoscope 1998;108:1146-49.
14. Koufman J, Amin M, Panetti M. Prevalence of reflux in 113
consecutive patients with laryngeal voice disorders. Otolaryngol Head
Neck Surg 2000;123:385-58.
15. Connor NP, Palazzi-Churas KLP, Cohen SB, et al. Symptoms of
extraesophageal reflux in a community-dwelling sample. J Voice
2007;21:189-202.
! ")&!
16. Sataloff RT. Laryngopharyngeal reflux: Concepts and controveries.
Ear Nose Throat J 2008;87:549-54.
17. Woodson GE. Laryngeal and pharyngeal function. In: Cummings
Otolaryngology: Head and Neck Surgery. Flint PW, Haughey BH,
Lund VJ, Niparko JK, Richardson MA, Robbins KT, Thomas JR,
editors 5 ed. Philadelphia: Mosby; 2010.
18. Merrill RM, Anderson AE, Sloan A. Quality of life indicators according
to voice disorders and voice-related conditions. Laryngoscope
2011;121:2004-10.
19. Lenderking WR, Hillson E, Crawley JA, et al. The clinical
characteristics and impact of laryngopharyngeal reflux disease on
health-related quality of life. Value in Health 2003;6:560-65.
20. Thurnher D, Moukarbel RV, Novak CB, et al. The glottis and
subglottis: An otolaryngologist's perspective. Thorac Surg Clin
2007;17:549-60.
21. AJCC. Larynx. In: AJCC Cancer staging atlas. Greene FL, Compton
CC, Fritz AG, Shah J, Winchester DP, editors. New York: Springer;
2006.
22. Gastrolab. Larnyx. In; 2012. p. Larynx
23. Hirano M, Kurita S, Kiyokawa K, et al. Posterior glottis. Morphological
study in excised human larynges. Ann Otol Rhinol Laryngol
1986;95:576-81.
24. McIlwain JC. The posterior glottis. J Otolaryngol 1991;20:1-24.
25. Tucker JA, Tucker ST. Posterior commissure of the human larynx
revisited. J Voice 2010;24:252-59.
! ")'!
26. Delahunty JE. Acid laryngitis. J Laryngol Otol 1972;86:335-42.
27. Kambic V, Radsel Z. Acid posterior laryngitis. Aetiology, histology,
diagnosis, and treatment. J Laryngol Otol 1984;98:1237-40.
28. Belafsky PC. Abnormal endoscopic pharyngeal and laryngeal findings
attributable to reflux. Am J Med 2003;115:90S-96S.
29. Stell PM, Gregory I, Watt J. Morphometry of the epithelial lining of the
human larynx I. The glottis. Clin Otolaryngol 1978;3:13-20.
30. Stell PM, Gudrun R, Watt J. Morphology of the human larnyx III. The
supraglottis. Clin Otolaryngol 1981;6:388-93.
31. Mills SE. Larnyx and Pharynx. In: Histology for Pathologists. Mills SE,
editor 3rd ed. Philadelphia: Lippincott Williams and Wilkins; 2007.
32. Sataloff RT, Heman-Ackah YD, Hawkshaw MJ. Clinical anatomy and
physiology of the voice. Otolaryngol Clin N Am 2007;40:909-29.
33. Bulmer DM, Ali MS, Brownlee IA, et al. Laryngeal mucosa: Its
susceptibility to damage by acid and pepsin. Laryngoscope
2010;120:777-82.
34. Ylitalo R, Lindestad P, Hertegard S. Pharyngeal and laryngeal
symptoms and signs related to extraesophageal reflux in patients with
heartburn in gastroenterology practice: a prospective study. Clinical
Otolaryngology 2005;30:347-52.
35. Pearson JP, Parikh S. Review article: nature and properties of gastro-
oesophageal and extra-oesophageal refluxate. Aliment Pharmacol
Ther 2011;33 (Suppl. 1):2-7.
! ")(!
36. Hickson C, Simpson CB, Falcon R. Laryngeal pseudosulcus as a
predictor of laryngopharyngeal reflux. Laryngoscope 2001;111:1742-
45.
37. Ulualp SO, Toohill R, Hoffmann R, et al. Pharyngeal pH monitoring in
patients with posterior laryngitis. Otolaryngol Head Neck Surg
1999;120:672-77.
38. Koufman JA. Gastroesophageal reflux and voice disorders. In:
Diagnosis and Treatment of Voice Disorders. Rubin, Sataloff, Korovin,
Gould, editors. New York - Tokyo: Igaku-Shoin Publishers; 1995. p.
161-75.
39. Harar R, Kumar S, Saeed M, et al. Management of globus
pharyngeus: review of 699 cases. Journal of Laryngology and Otology
2004;118:522-27.
40. Curran AJ, Barry MK, Callanan V, et al. A prospective study of acid
reflux and globus pharyngeus using a modified symptom index. Clin
Otolaryngol 1995;20:552-54.
41. Harar R, Kumar S, Saeed M, et al. Management of globus
pharyngeus: review of 699 cases. J Laryngol Otol 2004;118:522-27.
42. Murry T, Tabaee A, Aviv JE. Respiratory retraining of refractory cough
and laryngopharyngeal reflux in patients with paradoxical vocal fold
movement disorder. Laryngoscope 2004;114:1341-45.
43. Jaimes-Hernandez J, Mendoza-Fuentes A, Melendez-Mercado CI, et
al. Chronic eosinphilic pneumonia: autoimmune phenomenon or
immunoallergic disease? Case report and literature review.
Reumatologia Clinica 2012;8:145-48.
! "))!
44. Delahunty JE, Cherry JC. Experimentally produced vocal cord
granulomas. Laryngoscope 1968;78:1941-47.
45. Little FB, Koufman JA, Kohut RI, et al. Effect of gastric acid on the
pathogenesis of subglottic stenosis. Ann Otol Rhinol Laryngol
1985;94:516-19.
46. Nelson SP, Chen EH, Syniar GM, et al. Prevalence of symptoms of
gastroesopahgeal reflux during infancy: a pediatric practice based
survery from pediatric practice research group. Arch Pediatr Adolesc
Med 1997;151:569 - 72.
47. O'Reilly RC, He Z, Bloedon E, et al. The role of extraesophageal
reflux in otitis media in infants and children. Laryngoscope
2008;118:1-9.
48. Vaezi MF, Qadeer MA, Lopez R, et al. Laryngeal cancer and
gastroesophageal reflux disease: a case-control study. Am J Med
2006;119:768-76.
49. Ozer E. Which one is the etiologic factor: Gastroesophageal reflux
disease or larynx cancer? Laryngoscope 2005;115:1323-24.
50. Kamolz T, Pointner R. Gastroesophageal reflux disease. Heart-burn
from a psychological view. Minerva Gastroenterol Dietol 2004;50:261-
68.
51. Johnston N. Review article: uptake of pepsin at pH 7 - in non-acid
reflux - causes inflammatory, and perhaps even neoplastic, changes
in the laryngopharynx. . Aliment Pharmacol Ther 2011;33:13 - 20.
! ")*!
52. Allen J, Tinling SP, Johnston N, et al. Review article: effects of pepsin
and alginate in an animal model of squamous cell carcinoma. Aliment
Pharmacol Ther 2011;33:21 - 28.
53. Muderris T, Gokcan MK, Yorulmaz I. The Clinical value of pharyngeal
pH monitoring using a double-probe, triple-sensor catheter in patients
with laryngopharyngeal reflux. Arch Otolaryngol Head Neck Surg
2009;135:163-67.
54. Noordzij JP, Khidr A, Desper E, et al. Correlation of pH Probe-
Measured Laryngopharyngeal Reflux With Symptoms and Signs of
Reflux Laryngitis. Laryngoscope 2002;112:2192-95.
55. Eubanks TR, Omelanczuk PE, Maronian N, et al. Pharyngeal pH
monitoring in 222 patients with suspected laryngeal reflux. J
Gastrointest Surg 2001;5:183-90.
56. Smit CF, Mathus-Vliegen EMH, Devriese PP, et al.
Laryngopharyngeal reflux: monitoring technique and normal values.
Clinical Otolaryngology & Allied Sciences 1998;23:187.
57. Belafsky PC, Postma GN, Koufman J. The validity and reliability of
the reflux finding score. Laryngoscope 2001;111:1313-17.
58. Hirano I, Richter JE. ACG practice guidelines: esophageal reflux
testing. Am J Gastroenterol 2007;102:668-85.
59. Park KH, Choi SM, Kwon S, et al. Diagnosis of Laryngopharyngeal
Reflux Among Globus Patients. Otolaryngol Head Neck Surg
2006;134:81-85.
60. Belafsky PC, Postma GN, Koufman J. Validity and reliability of the
reflux symtom index (RSI). J Voice 2002;16:274-77.
! "*+!
61. Tawakir K, Penney S, Pothula V, et al. The prevalence of
laryngopharyngeal reflux in the population. Clinical Otolaryngology
2009;34 Supplement:97.
62. Oyer SL, Anderson LC, Halum SL. Influence of anxiety and
depression on the predictive value of the Reflux Symptom Index. Ann
Otol Rhinol Laryngol 2009;118:687-92.
63. Vaezi MF. We Should Learn From Important Negative Results.
Laryngoscope 2006;116:1718.
64. Belafsky PC, Postma GN, Amin MR, et al. Symptoms and findings of
laryngopharyngeal reflux. Ear Nose Throat J 2002;81:10 - 13.
65. Powell J, Cocks HC. Mucosal changes in laryngopharyngeal reflux -
prevalence, sensitivity, specificity and assessment. Laryngoscope
2012.
66. Lipan MJ, Reidenberg JS, Laitman JT. Anatomy of reflux: A growing
health problem affecting structures of the head and neck. The
Anatomical Record (Part B: New Anat) 2006;289B:261-70.
67. Bardhan KD, Strugala V, Dettmar PW. Reflux revisited: Advancing the
role of pepsin. Int J Otolaryngol 2012;Vol 2012:13 pages.
68. Zeleník K, Matousek P, Urban O, et al. Globus pharyngeus and
extraesophageal reflux: Simultaneous pH <4.0 and pH <5.0 analysis.
Laryngoscope 2010;120:2160-64.
69. Adhami T, Goldblum JR, Richter JE, et al. The role of gastric and
duodenal agents in laryngeal injury: An experimental canine model.
Am J Gastroenterol 2004;99:2098-106.
! "*"!
70. Wood JM, Hussey DJ, Woods CM, et al. Biomarkers and
laryngopharyngeal reflux. J Laryngol Otol 2011;125:1218-24.
71. Samuels TL, Johnston N. Pepsin as a marker of extraesophageal
reflux. Ann Otol Rhinol Laryngol 2010;119:203-08.
72. Piper DW, Fenton BH. pH stability and activity curves of pepsin with
special reference to their clinical importance. Gut 1965;6:506-08.
73. Ylitalo R, Baugh A, Li W, et al. Effect of acid and pepsin on gene
expression in laryngeal fibroblasts. Ann Otol Rhinol Laryngol
2004;113:866-71.
74. Johnston N, Knight J, Dettmar PW, et al. Pepsin and carbonic
anhydrase isoenzyme III as diagnostic markers for laryngopharyngeal
reflux disease. Laryngoscope 2004;114:2129-34.
75. Johnston N, Dettmar PW, Bishwokarma B, et al. Activity/stability of
human pepsin: Implications for reflux attributed laryngeal disease.
Laryngoscope 2007;117:1036-39.
76. Johnston N, Wells CW, Blumin JH, et al. Receptor-mediated uptake
of pepsin by laryngeal epithelial cells. Ann Otol Rhinol Laryngol
2007;116:934-38.
77. Johnston N, Dettmar PW, Lively MO, et al. Effect of pepsin on
laryngeal stress protein (Sep70, Sep53, and Hsp70) response: Role
in laryngopharyngeal reflux disease. Ann Otol Rhinol Laryngol
2006;115:47-58.
78. Bollschweiler E, Wolfgarten E, Pütz B, et al. Bile reflux into the
stomach and esophagus for volunteers older than 40 years. Digestion
2005;71:63-64.

! "*#!
79. Tack J, Koek G, Demedts I, et al. Gastroesophageal reflux disease
poorly responsive to single-dose proton pump inhibitors in patients
without Barrett's esophagus: acid reflux, bile reflux or both? Am J
Gastroenterol 2004;99:989-90.
80. Saskai CT, Marotta J, Hundal J, et al. Bile-induced laryngitis: is there
a basis in evidence. Ann Otol Rhinol Laryngol 2005;114:192-97.
81. Sfhirvanni VN, Ouatu-Lascar R, Kaur BS, et al. Cyclooxygenase 2
expression in Barrett's esophagus and adenocarcinoma: ex vivo
induction by bile salts and acid exposure. Gastroenterology
2000;118:487-96.
82. Zhang F, Subbaramaiah K, Altorki N, et al. Dihydroxy bile acids
activate the transcription of cyclooxygenase-2. J Biol Chem
1998;273:2424-28.
83. Sung M, Roh H, Park S, et al. Bile acid inducts cyclo-oxygenase-2
expression in cultured human pharyngeal cells: a possible
mechanism of carcinogenesis in the upper aerodigestive tract by
laryngopharyngeal reflux. Laryngoscope 2003;113:1059-63.
84. Ali MS, Parikh S, Chater P, et al. Bile acids in laryngopharyngeal
refluxate: Will they enhance or attenuate the action of pepsin?
Laryngoscope 2012;Oct 15.
85. Merati AL. Reflux and cough. Otolaryngol Clin N Am 2010;43:97-110.
86. Maish M. Esophagus. In: Sabiston Textbook of Surgery: The
Biological Basis of Modern Surgical Practice. Townsend CM,
Beauchamp RD, Evers BM, Mattox KL, editors 18th ed. Philadelphia:
Saunders; 2008.

! "*$!
87. Grossi L, Ciccaglione AF, Marzio L. Transient lower oesophageal
sphincter relaxations play an insignificant role in gastro-oesophageal
reflux to the proximal oesophagus. Neurogastroenterol Motil
2001;13:503-09.
88. Shaker R, Milbrath M, Ren J, et al. Esophagopharyngeal distribution
of refluxed gastric acid in patients wiht reflux laryngitis.
Gastroenterology 1995;109:1575-82.
89. Ylitalo R, Lindestad PA, Ramel S. Symptoms, laryngeal findings, and
24-hour pH monitoring in patients with suspected gastroesophago-
pharyngeal reflux. Laryngoscope 2001;111:1735-41.
90. Bremner RM, Hoeft SF, Costantini M, et al. Pharyngeal swallowing:
the major factor in clearance of esophageal reflux episodes. Ann Surg
1993;218:364-69.
91. Postma GN, Tomek MS, Belafsky PC, et al. Esophageal motor
function in laryngopharyngeal reflux is superior to that in classic
gastroesophageal reflux disease. Ann Otol Rhinol Laryngol
2001;110:1114-16.
92. Knight RE, Wells JR, Parrish RS. Esophageal dysmotility as an
important co-factor in extraesophageal manifestations of
gastroesophageal reflux. Laryngoscope 2000;110:1462-66.
93. Ulualp SO, Toohill RJ, Kern M, et al. Pharyngo-UES contractile reflux
in patients with posterior laryngitis. Laryngoscope 1998;108:1354-57.
94. Torrico S, Kern M, Aslam M, et al. Upper esophageal sphincer
function during gastroesophageal reflux events revisited. Am J
Physiol Gastrointest Liver Physiol 2000;279:G262-G67.

! "*%!
95. Tobey NA, Hosseini SS, Argote CM, et al. Dilated intercellular spaces
and shunt permeability in nonerosive acid-damaged esophageal
epithelium Am J Gastroenterol 2004;99:13-22.
96. Oh DS, DeMeester SR, Vallbohmer D, et al. Reduction of interleukin
8 gene expression in reflux esophagitis and Barretts' esophagus with
antireflux surgery. Arch Surg 2007;142:554-60.
97. Barnes PJ, Karin M. Nuclear factor-!B -- a pivotal transcription factor
in inflammatory disease. New England Journal of Medicine
1997;336:1066-71.
98. Abdel-Latif MMM, O'Riordan J, Windle HJ, et al. NF-!B activation in
esophageal adenocarcinoma: relationship to Barrett's metaplasia,
survival, and response to neoadjuvant chemoradiotherapy. Ann Surg
2004;239:491-500.
99. Sovak MA, Bellas RE, Kim DW, et al. Aberrant nuclear factor-!B/Rel
expression and the pathogenesis of breast cancer. J Clin Invest
1997;100:2952-60.
100. Tai D-I, Tsai S-L, Chang Y-H, et al. Constitutive activation of nuclear
factor B in hepatocellular carcinoma. Cancer 2000;89:2274-81.
101. Beg AA, Baltimore D. An essential role for NF-!B in preventing TNF-"
induced cell death. Science 1996;274:782-84.
102. Oh DS, DeMeester SR, Vallböhmer D, et al. Reduction of interleukin
8 gene expression in reflux esophagitis and Barretts' esophagus with
antireflux surgery. Arch Surg 2007;142:554-60.
103. Waugh DJJ, Wilson C. The interleukin-8 pathway in cancer. Clin
Cancer Res 2008;14:6735-41.
! "*&!
104. Van Roon AH, Mayne GC, Wijnhoven BP, et al. Impact of gastro-
esophageal reflux on mucin mRNA expression in the esophageal
mucosa. J Gastrointest Surg 2008;12:1331-40.
105. Thibeault SL, Smith ME, Peterson K, et al. Gene expression changes
of inflammatory mediators in posterior laryngitis due to
laryngopharyngeal reflux and evolution with PPI treatment: A
preliminary study. Laryngoscope 2007;117:2050-56.
106. Chin D, Boyle G, Parsons P, et al. What is transforming growth factor-
beta (TGF-B). Br J Plast Surg 2004;57:215-21.
107. Jarmuz T, Roser S, Gal A, et al. Transforming growth factor-B1,
myofibroblasts, and tissue remodeling in the pathogenesis of tracheal
injury: Potential role of gastroesophageal reflux. Ann Otol Rhinol
Laryngol 2004;113:488-97.
108. Ylitalo R, Thibeault S. Relationship between time of exposure of
laryngopharyngeal reflux and gene expression in laryngeal
fibroblasts. Ann Otol Rhinol Laryngol 2006;115:775-83.
109. Tobey NA, Powell DW, Schreiner VJ, et al. Serosal bicarbonate
protects against acid injury to rabbit esophagus. Gastroenterology
1989;96:1466-77.
110. Axford SE, Sharp N, Ross PE, et al. Cell biology of laryngeal
epithelial defenses in health and disease: preliminary studies. Ann
Otol Rhinol Laryngol 2001;110:1099 - 108.
111. Christie KN, Thomson C, Xue L, et al. Carbonic anhydrase
isoenzymes I, II, II, and IV are present in human esophageal
epithelium. J Histochem Cytochem 1997;45:35-40.
! "*'!
112. Gill GA, Johnston N, Buda A, et al. Laryngeal epithelial defenses
against laryngopharyngeal reflux: Investigations of E-cadherin,
carbonic anhydrase isoenzyme III, and pepsin. Ann Otol Rhinol
Laryngol 2005;114:913-21.
113. Johnston N, Bulmer D, Gill GA, et al. Cell biology of laryngeal
epithelial defenses in health and disease: Further studies. Ann Otol
Rhinol Laryngol 2003;112:481- 91.
114. Reichel O, Mayr D, Durst F, et al. E-cadherin but not #-catenin
expression is decreased in laryngeal biopsies from patients with
laryngopharyngeal reflux. Eur Arch Otorhinolaryngol 2008;265:937-
42.
115. Kurtz KA, Hoffman HT, ZImmermann MB, et al. Decreased E-
cadherin but not B-catenin expression is associated with vascular
invasion and decreased survival in head and neck squamous
carcinomas. Otolaryngol Head Neck Surg 2006;134:142-46.
116. Ali M, Pearson JP. Upper airway mucin gene expression: A review.
Laryngoscope 2007;117:932-38.
117. Hollingsworth MA, Swanson BJ. Mucins in cancer: protection and
control of the cell surface. Nat Rev Cancer 2004;4:45-60.
118. Samuels TL, Handler E, Syring ML, et al. Mucin gene expression in
human laryngeal epithelia: effect of laryngopharyngeal reflux. Ann
Otol Rhinol Laryngol 2008;117:688-95.
119. Namiot Z, Sarosiek J, Marcinkiewicz M, et al. Declined human
esopahgeal mucin secretion in patients with severe reflux esophagitis.
Dig Dis Sci 1994;39:2523-29.
! "*(!
120. Ho SB, Dvorak LA, Moor RE, et al. Cysteine-rich domains of muc3
intestinal mucin promote cell migration, inhibit apoptosis, and
accelerate wound healing. Gastroenterology 2006;131:1501-17.
121. Louis NA, Hamilton KE, Canny G, et al. Selective induction of mucin-3
by hypoxia in intestinal epithelia. J Cell Biochem 2006;99:1616-27.
122. Bafna S, Kaur S, Batra SK. Membrane-bound mucins: the
mechanistic basis for alteration in the growth and survival of cancer
cells. Oncogene 2010;29:2893-904.
123. Gendler SJ. MUC1, the renaissance molecule. J Mammary Gland Biol
Neoplasia 2001;6:330-53.
124. Zhao Q, Guo X, Nash GB, et al. Circulating galectin-3 promotes
metastasis by modifying MUC1 localization on cancer cell surface.
Cancer Res 2009;69:6799-806.
125. Jeannon J-P, Stafford FW, Soames JV, et al. Altered MUC1 and
MUC2 glycoprotein expression in laryngeal cancer. Otolaryngol Head
Neck Surg 2001;124:199-202.
126. Paleri V, Pearson JP, Bulmer D, et al. Expression of mucin gene
products in laryngeal squamous cancer. Otolaryngol Head Neck Surg
2004;131:84-88.
127. Franco RA. Laryngopharyngeal reflux. Allergy and Asthma
Proceedings 2006;27:21-25.
128. Koufman JA. Low-acid diet for recalcitrant laryngopharyngeal reflux:
Therapeutic benefits and their implications. Ann Otol Rhinol Laryngol
2011;120:281-87.

! "*)!
129. Zerbib F, Stoll D. Management of laryngopharyngeal reflux: an unmet
medical need. Neurogastroenterol Motil 2010;22:109-12.
130. Altman KW, Prufer N, Vaezi MF. A review of clinical practice
guidelines for reflux disease: Toward creating a clinical protocol for
the otolaryngologist. Laryngoscope 2011;121:717-23.
131. Hill RKMD, Simpson CBMD, Velazquez RMDP, et al. Pachydermia is
Not Diagnostic of Active Laryngopharyngeal Reflux Disease.
Laryngoscope 2004;114:1557-61.
132. Yang Y, Lewis J, Epstein S, et al. Long-term proton pump inhibitor
therapy and risk of hip fracture. JAMA 2006;296.
133. Cheung TK, Lam PKY, Wei WI, et al. Quality of life in patients with
laryngopharyngeal reflux. Digestion 2009;79:52-57.
134. McGlashan JA, Johnstone LM, Sykes J, et al. The value of a liquid
alginate suspension (Gaviscon Advance) in the management of
laryngopharyngeal reflux. Eur Arch Otorhinolaryngol 2009;266:243-
51.
135. Lindstrom DRMD, Wallace JMD, Loehrl TAMD, et al. Nissen
Fundoplication Surgery for Extraesophageal Manifestations of
Gastroesophageal Reflux (EER). Laryngoscope 2002;112:1762-65.
136. So JBY, Zeitels SM, Rattner DW. Outcomes of atypical symptoms
attributed to gastroesophageal reflux treated by laparoscopic
fundoplication. Surgery 1998;124:28 - 32.
137. Kaufman JA, Houghland JE, Quiroga E, et al. Long-term outcomes of
laparoscopic antireflux surgery for gastroesophageal reflux disease
(GERD) - related airway disorder. Surg Endosc 2006;20:1824 - 30.

! "**!
138. Ratnasingam D, Irvine T, Thompson SK, et al. Laparoscopic antireflux
surgery in patients with throat symptoms: A word of caution. World J
Surg 2011;35:342-48.
139. Shaker R, Bardan E, Gu C, et al. Intrapharyngeal distribution of
gastric refluxate. Laryngoscope 2003;113:1182-91.
140. Vaezi MF. Treatment with PPIs Should NOT Be Preceded by pH
Monitoring in Patients Suspected of Laryngeal Reflux. Am J
Gastroenterol 2006;101:8-10.
141. Fleige S, Pfaffl MW. RNA integrity and the effect on the real-time
qRT-PCR performance. Molecular Aspects of Medicine 2006;27:126-
39.
142. Schroeder A, Mueller O, Stocker S, et al. The RIN: an RNA integrity
number for assigning integrity values to RNA measurements. BMC
Mol Biol 2006;7:3.
143. Simon P. Q-Gene: Processing quantitative real-time RT-PCR data.
Bioinformatics 2003;19:1439-40.
144. de Jonge HJM, Fehrmann RSN, de Bont ESJM, et al. Evidence
based selection of housekeeping genes. PLoS One 2007;2:e898.
145. Vaidyanathan S, McDicken IW, Mansour P, et al. Detection of early
squamous metaplasia in bladder biopsies of spinal cord injury
patients by immunostaining for cytokeratin 14. Spinal Cord
2003;41:432-34.
146. Ferlito A, Devaney KO, Woolgar JA, et al. Squamous epithelial
changes of the larynx: Diagnosis and therapy. Head Neck
2012;34:1810-16.
! #++!
147. Yu W-Y, Slack JMW, Tosh D. Conversion of columnar to stratified
squamous epithelium in the developing mouse oesophagus.
Developmental Biology 2005;284:157-70.
148. Ferlito A, Devaney KO, Woolgar JA, et al. Squamous epithelial
changes of the larynx: Diagnosis and therapy. Head Neck 2011;[E-
Pub] Accepted 20 May 2011.
149. Porter RM, Lane EB. Phenotypes, genotypes and their contribution to
understanding keratin function. Trends Genet 2003;19:278-85.
150. Harnett KM, Fieder F, Behar J, et al. Viewpoints on acid-induced
inflammatory mediators in esophageal mucosa. J Neurogastroenterol
Motil 2010;16:374-88.
151. Robbins SL, Kumar V. Robbins and Cotran Pathologic Basis of
Disease, 8th ed. Philadelphia: Saunders Elesevier; 2010.
152. Bathoorn E, Daly P, Gaiser B, et al. Cytotoxicity and induction of
inflammation by pepsin in acid in bronchial epithelial cells.
International Journal of Inflammation 2011;(2011):5 pages.
153. Martins DH, Dias NH, Santos DC, et al. Clinical, histological and
electron microscopic aspects of vocal fold granulomas. Braz J
Otorhinolaryngol 2009;75:116-22.
154. Samuels TL, Johnston N. Pepsin as a causal agent of inflammation
during nonacidic reflux. Otolaryngol Head Neck Surg 2009;141:559-
63.
155. Waage A, Brandtzaeg P, Halstensen A, et al. The complex pattern of
cytokines in serum from patients with meningococcal septic shock.

! #+"!
Association between interleukin-6, interleukin-1, and fatal outcome. J
Exp Med 1989;169:333-38.
156. Zampeli E, Karamanolis G, Morfopoulos G, et al. Increased
expression of VEGF, COX-2, and Ki-67 in Barrett's esophagus: Does
the length matter? Dig Dis Sci 2012;57:1190-96.
157. Goto R, Hoshikawa H, Fujii T, et al. Clinicopathological significance of
cyclooxygenase-2 expression in hypopharyngeal squamous cell
carcinoma. Oncology Reports 2008;19:645-50.
158. Singh P, Singh N, Palit G. Analysing the role of COX-2 in acute
oesophagitis and in melatonin-exerted protection against
experimental reflux oesophagitis in rats. J Pharm Pharmacol
2011;63:1572-80.
159. Mayne GC, Watson DI, Hussey DJ. COX-2 mRNA is increased in
oesophageal mucosal cells by a proton pump inhibitor. ANZ J Surg
2012;82:691-96.
160. Erkan G, Gönül II, Kandılcı U, et al. Assessment of COX-2 expression
presence and severity by immunohistochemical method in patients
with chronic active gastritis and intestinal metaplasia. Turk J
Gastroenterol 2012;23:478-84.
161. Doecke J, Zhao ZZ, Panedeya N, et al. Polymorphisms in MGMT and
DNA repair genes and the risk of esophageal adenocarcinoma. Int J
Cancer 2008;123:174-80.
162. Baumann S, Keller G, Puhringer F, et al. The prognostic impact of
O6-methylguanine-DNA methyltransferase (MGMT) promotor
! #+#!
hypermethylation in esophageal adenocarcinoma. Int J Cancer
2006;119:264-68.
163. Beck LS, Deguzman L, Lee WP, et al. TGF-beta 1 accelerates wound
healing: reversal of steroid-impaired healing in rats and rabbits.
Growth Factors 1991;5:295-304.
164. Eming SA, Kreig T. Molecular mechanisms of VEGF-A action during
tissue repair. J Investig Dermatol Symp Proc 2006;11:79-86.
165. Möbius C, Stein HJ, Spieß C, et al. COX2 expression, angiogenesis,
proliferation and survival in Barrett's cancer. European Journal of
Surgical Oncology 2005;31:755-59.
166. Vallböhmer D, Peters JH, Kuramochi H, et al. Molecular determinants
in targeted therapy for esophageal adenocarcinoma. Arch Surg
2006;141:476-82.
167. Bao P, Kodra A, Tomic-Canic M, et al. The role of vascular
endothelial growth factor in wound healing. J Surg Res 2009;153:347-
58.
168. Welch WJ, Brown CR. Influence of molecular and chemical
chaperones on protein folding. Cell Stress Chaperones 1996;1:109-
15.
169. Nelson L, Anderson S, Archibald AL, et al. An animal model to
evaluate the function and regulation of the adaptively evolving stress
protein SEP53 in oesophageal bile damage responses. Cell Stress
Chaperones 2008;13:375-85.
170. Little TJ, Nelson L, Hupp T. Adaptive Evolution of a stress response
protein. PLoS One 2007;2:e1003.
! #+$!
171. Rees LE, Pazmany L, Gutowska-Owsiak D, et al. The mucosal
immune response to laryngopharyngeal reflux. Am J Respir Crit Care
Med 2008;177:1187-93.
172. Tsuneyama K, Yasoshima M, Harad K, et al. Increased CD1d
expression on small bile duct epithelium and epitheliod granuloma in
livers in primary biliary cirrhosis. Hepatology 1998;18:620-23.
173. Kojo S, Tsutsumi A, Goto D, et al. Low expression levels of soluble
CD1d gene in patients with rheumatoid arthritis. J Rheumatol
2003;12:2524-28.
174. Ge Y, Rampy BA, Wang HL, et al. Reduced CD1d expression in
colonic epithelium in microscopic colitis. Appl Immunohistochem Mol
Morphol 2006;14:309-13.
175. Franchi A, Brogelli B, Massi D, et al. Dilation of intercellular spaces is
associated with laryngopharyngeal reflux: an ultrastructural
morphometric analysis of laryngeal epithelium. Eur Arch
Otorhinolaryngol 2007;264:907-11.
176. Park S, Chun HJ, Keum B, et al. An electron microscopic study -
correlation of gastroesophageal reflux disease and laryngopharyngeal
reflux. Laryngoscope 2010;120:1303-08.
177. Tobey NA, Hosseini SS, Caymaz-Bor C, et al. The role of pepsin in
acid injury to esophageal epithelium. Am J Gastroenterol
2001;96:3062-70.
178. Jankowski J, Newham P, Kandemir O, et al. Differential expression of
e-cadherin in normal, metaplastic and dysplastic esophageal mucosa
- a putative biomarker. Int J Oncol 1994;4:441-48.

! #+%!
179. Feith M, Stein HJ, Mueller J, et al. Malignant degeneration of Barrett's
esophagus: the role of the Ki-67 proliferation fraction, expression of
E-cadherin and p53. Dis Esophagus 2004;17:322-27.
180. Gill GA, Buda A, Moorghen M, et al. Characterisation of adherens and
tight junctional molecules in normal animal larynx; determining a
suitable model for studying molecular abnormalities in human
laryngopharyngeal reflux. Journal of Clinical Pathology 2005;58:1265-
70.
181. Hahn JP, Blount PL, Ayub K, et al. Intestinal differentiation in
metaplastic, non-goblet columnar epithelium in the esophagus. Am J
Surg Pathol 2009;33:1006-15.
182. Niv Y, Fass R. The role of mucin in GERD and its complications. Nat
Rev Gastroenterol Hepatol 2012;9:55-59.
183. de Magalhaes JP, Curado J, Church GM. Meta-anaylsis of age-
related gene expression profiles identifies common signatures of
aging. Bioinformatics 2009;25:875-81.
184. Kadakia S, Carlson D, Sataloff RT. The effect of hormones on the
voice. J of Singing 2013;69:571-74.
185. Koskinen W, Brondbo K, Dahlstrand HM, et al. Alcohol, smoking and
human papillomavirus in laryngeal carcinoma: a Nordic prospective
multicenter study. J Cancer Res Clin Oncol 2007;133:673-78.
186. Zen JH, Negro AD, C NJA, et al. Experimental model of smoking and
simulation of reflux with acid and pepsin in rats. Acta Cirurgica
Brazileira 2012;27.
! #+&!
187. Lee BE, Kim GH, Ryu DY, et al. Combined dual channel
impedance/pH-metry in patients with suspected laryngopharyngeal
reflux. J Neurogastroenterol Motil 2010;16:157-65.
188. Friedman M, Hamilton C, Samuelson CG, et al. The value of routine
pH monitoring in the diagnosis and treatment of laryngopharyngeal
reflux. Otolaryngol Head Neck Surg 2012;146:952-58.
189. Friedman M, Hamilton C, Samuelson CG, et al. The value of routine
pH monitoring in the diagnosis and treatment of laryngopharyngeal
reflux. Otolaryngol Head Neck Surg 2012;146:952 - 58.
190. Vaezi MF, Schroeder PL, Richter JE. Reproducibility of proximal
probe pH parameters in 24-hor ambulatory esophageal pH
monitoring. Am J Gastroenterol 1997;92:825-29.
191. Jacob P, Kahrilas P, Herzon G. Proximal esophageal pH-metry in
patients with 'reflux laryngitis'. Gastroentrology 1991;100:305-210.
192. Cool M, Poelmans J, Feenstra L, et al. Characteristics and clinical
relevance of proximal esophageal pH monitoring. Am J Gastroenterol
2004;99:2317-23.
193. Ikuo J, Richter JE. ACG practice guidelines: esophageal reflux
testing. Am J Gastroenterol 2007;102:668-85.
194. Vaezi MF, Richter JE, Stasney CR, et al. Treatment of chronic
posterior laryngitis with esomeprazole. Laryngoscope 2006;116:254-
60.
195. Vailati C, Mazzoleni G, Bondi S, et al. Oropharyngeal pH monitoring
for laryngopharyngeal reflux: Is it a reliable test before therapy? J
Voice 2013;27:84-89.
! #+'!
196. Fox M. Review article: identifying the causes of reflux events and
symptoms - new approaches. Aliment Pharmacol Ther 2011;33:36 -
42.


![Role of Laryngopharyngeal Reflux in the Pathogenesis of ... · laryngopharyngeal reflux (LPR) [1]. One potential cause of OME is the reflux of gastric contents into the region of](https://img.pdfslide.us/doc/110x75/5ce753d788c993082d8c9080/role-of-laryngopharyngeal-reflux-in-the-pathogenesis-of-laryngopharyngeal.jpg)