Embed Size (px)
Citation preview
Teachers College, Columbia University Working Papers in TESOL & Applied Linguistics, Vol. 4, No. 1An Investigation of an ESL Placement Test of Writing
1
An Investigation of an ESL Placement Test of Writing Using Many-facet Rasch Measurement
Taejoon Park1
Teachers College, Columbia University
ABSTRACT
Because performance assessment, such as a composition test, introduces a range of factors thatmay influence the chances of success for a candidate on the test, those in charge of monitoringquality control for performance assessment programs need to gather information that will helpthem determine whether all aspects of the programs are working as intended. In the presentstudy, Many-facet Rasch measurement (Linacre, 1989) was employed to examine the effects ofvarious sources of variability on students’ performance on an ESL placement test of writing andalso to investigate the validity of the assigned scores for students’ essays.
INTRODUCTION
For the past two decades, most research on the evaluation of second language writing hasfocused on the issue of establishing the reliability of scoring among pools of raters (e.g.,Shohamy, Gordon, & Kraemer, 1992; Stansfield & Ross, 1988; Weigle, 1998). In a test ofwriting, this has been of greatest concern because of the reliance on human interpretation inrating students’ compositions. Writing assessment programs have tended to address this matterby carefully refining their scoring guides and their procedures for scoring, by training andmaintaining pools of raters, and by establishing consistent agreement among these raters (i.e.,inter-rater reliability). As Hamp-Lyons (1990) has pointed out, however, establishing andmaintaining inter-rater agreement is only a minimum step toward a reliable and valid assessmentof writing quality. Inter-rater reliability therefore needs to be complemented in testing practiceby additional analyses, because performance assessment, such as a composition test, inevitablyintroduces a range of factors that may influence the chances of success for a candidate on thetest. That is, a candidate’s performance on a writing test can be affected by several factors,including variables related to the writing task itself (e.g., the topic, the expected discourse modeof the response, and the number of discrete writing samples a candidate is asked to provide) andby variables related to the scoring process (e.g., the background and experience of the raters, thenature of the rating scale, and the training given to raters).
1 Taejoon Park is a doctoral student in Applied Linguistics at Teachers College, Columbia University. His currentresearch interests are writing assessment, focusing in particular on rating scale development and validation, and theeffects of method factors on observed ratings. Correspondence should be sent to Taejoon Park, 1230 AmsterdamAve. #613, New York, NY 10027. E-mail: [email protected].
Teachers College, Columbia University Working Papers in TESOL & Applied Linguistics, Vol. 4, No. 1An Investigation of an ESL Placement Test of Writing
2
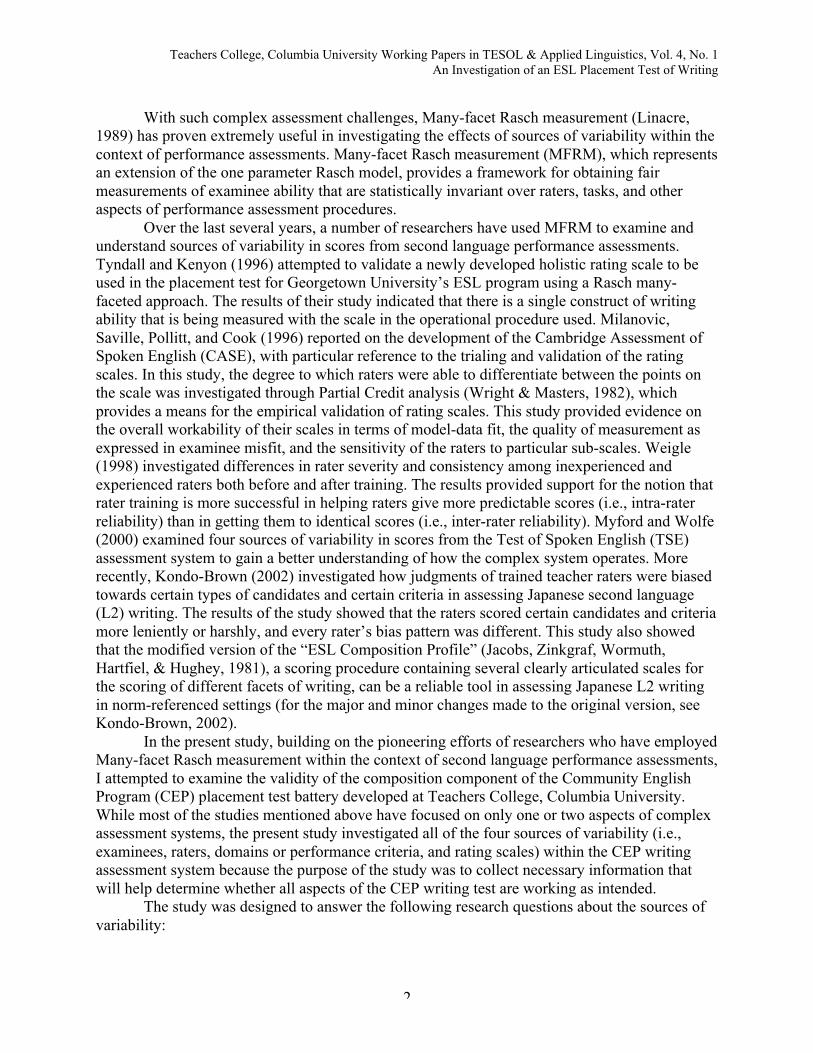
With such complex assessment challenges, Many-facet Rasch measurement (Linacre,1989) has proven extremely useful in investigating the effects of sources of variability within thecontext of performance assessments. Many-facet Rasch measurement (MFRM), which representsan extension of the one parameter Rasch model, provides a framework for obtaining fairmeasurements of examinee ability that are statistically invariant over raters, tasks, and otheraspects of performance assessment procedures.
Over the last several years, a number of researchers have used MFRM to examine andunderstand sources of variability in scores from second language performance assessments.Tyndall and Kenyon (1996) attempted to validate a newly developed holistic rating scale to beused in the placement test for Georgetown University’s ESL program using a Rasch many-faceted approach. The results of their study indicated that there is a single construct of writingability that is being measured with the scale in the operational procedure used. Milanovic,Saville, Pollitt, and Cook (1996) reported on the development of the Cambridge Assessment ofSpoken English (CASE), with particular reference to the trialing and validation of the ratingscales. In this study, the degree to which raters were able to differentiate between the points onthe scale was investigated through Partial Credit analysis (Wright & Masters, 1982), whichprovides a means for the empirical validation of rating scales. This study provided evidence onthe overall workability of their scales in terms of model-data fit, the quality of measurement asexpressed in examinee misfit, and the sensitivity of the raters to particular sub-scales. Weigle(1998) investigated differences in rater severity and consistency among inexperienced andexperienced raters both before and after training. The results provided support for the notion thatrater training is more successful in helping raters give more predictable scores (i.e., intra-raterreliability) than in getting them to identical scores (i.e., inter-rater reliability). Myford and Wolfe(2000) examined four sources of variability in scores from the Test of Spoken English (TSE)assessment system to gain a better understanding of how the complex system operates. Morerecently, Kondo-Brown (2002) investigated how judgments of trained teacher raters were biasedtowards certain types of candidates and certain criteria in assessing Japanese second language(L2) writing. The results of the study showed that the raters scored certain candidates and criteriamore leniently or harshly, and every rater’s bias pattern was different. This study also showedthat the modified version of the “ESL Composition Profile” (Jacobs, Zinkgraf, Wormuth,Hartfiel, & Hughey, 1981), a scoring procedure containing several clearly articulated scales forthe scoring of different facets of writing, can be a reliable tool in assessing Japanese L2 writingin norm-referenced settings (for the major and minor changes made to the original version, seeKondo-Brown, 2002).
In the present study, building on the pioneering efforts of researchers who have employedMany-facet Rasch measurement within the context of second language performance assessments,I attempted to examine the validity of the composition component of the Community EnglishProgram (CEP) placement test battery developed at Teachers College, Columbia University.While most of the studies mentioned above have focused on only one or two aspects of complexassessment systems, the present study investigated all of the four sources of variability (i.e.,examinees, raters, domains or performance criteria, and rating scales) within the CEP writingassessment system because the purpose of the study was to collect necessary information thatwill help determine whether all aspects of the CEP writing test are working as intended.
The study was designed to answer the following research questions about the sources ofvariability:

Teachers College, Columbia University Working Papers in TESOL & Applied Linguistics, Vol. 4, No. 1An Investigation of an ESL Placement Test of Writing
3
1. To what extent has the CEP writing test succeeded in separating examinees into distinctlevels of proficiency?
2. Are there examinees that exhibit unusual profiles of ratings across the four domains ofthe CEP scoring rubric?
3. Do CEP raters differ in the severity with which they rate examinees?4. Are there raters who rate examinee performance inconsistently?5. Can a single summary measure capture the essence of examinee performance across the
different domains of the CEP scoring rubric?6. Are the CEP rating scales functioning appropriately? In other words, are the four 4-point
rating scales appropriately ordered and clearly distinguishable?
It should be noted that a restricted definition of validity was used in this study, one that iscommon in Rasch analysis: if Rasch analysis shows little misfit, there is evidence for theconstruct validity of this measurement procedure (Wright & Masters, 1982; Wright & Stone,1979).
METHOD
Participants
The participants in the present study consist of 99 ESL students with a wide range ofEnglish language proficiency. All of them were enrolled in the CEP at Teachers College,Columbia University at the time of the test administration. The CEP is an integral part of theTESOL program at Teachers College. It provides English instruction to adult learners of diversenationalities and serves as a pedagogical laboratory for teacher preparation and materialsdevelopment. Of the 99 participants, 49% were male and 51% were female.
Instrument
The test used for this study was the writing subtest of the CEP placement test battery thatwas designed for placing adult ESL learners enrolled in the CEP into a class that is appropriatefor their level of language ability. The CEP placement test battery includes five sections:grammar, reading, listening, speaking, and writing. Of these five sections, the first three sections(i.e., grammar, reading, and listening) are scored dichotomously and the performance assessmentsections (i.e., speaking and writing) are scored by trained raters using scoring rubrics (seeAppendix A for the CEP writing scoring rubric). The CEP writing test consists of directions fortest-takers and one prompt that is descriptive in nature (see Appendix B). The writing test can becharacterized as a timed impromptu essay test because test-takers are required to write an essayon the spot in response to a given prompt within a relatively short period of time.

Teachers College, Columbia University Working Papers in TESOL & Applied Linguistics, Vol. 4, No. 1An Investigation of an ESL Placement Test of Writing
4
Procedures
The data for the present study were 99 essay samples collected from 99 students whotook the CEP writing test in February 2003. The students were given 30 minutes to write anessay on the given topic.
Seventeen raters (who were all CEP teachers and graduate students in TESOL or AppliedLinguistics) scored the students’ essays. Most of them had not had experience with compositionrating. Eleven of these raters were native speakers of English and six were non-native speakersof English. Immediately before the scoring session, the raters were all given a program oftraining (i.e., a norming session), consisting of an orientation to the test, a discussion of thescoring rubric, rating practice, and a discussion of several writing samples that represent thewhole range of the CEP scoring rubric.
Each essay was rated by two independent raters using the CEP scoring rubric, whichconsists of the following four domains: overall task fulfillment, topic/content control,organization, and language control. A four-category rating scale (ranging from 1 to 4) was usedfor each domain. No adjudication was made during the scoring session to resolve discrepanciesin ratings, and the final rating pattern used to estimate student writing ability consisted of eightratings (2 raters x 4 domains).
Analyses
Measurement model for the assessment of writing ability
The measurement model underlying the CEP writing test is presented graphically inFigure 1.
FIGURE 1Measurement Model Underlying the CEP Writing Test
(Adapted from Engelhard, Jr., 1992)
Intervening Variables
RaterCharacteristics
PerformanceCriteria in the
RubricStudent Characteristics Structure ofRating Scale
WritingAbility Observed
Ratings

Teachers College, Columbia University Working Papers in TESOL & Applied Linguistics, Vol. 4, No. 1An Investigation of an ESL Placement Test of Writing
5
This model was originally put forth by Engelhard (1992) in an attempt to specify factorsthat influence observed ratings in the assessment of writing ability using an analytic scoringrubric. In Figure 1, the dependent variable is the observed rating. The three major factors thatinfluence the rating are writing ability, rater characteristics, and performance criteria (i.e.,domains) in the scoring rubric. Raters and domains can be viewed as intervening variables thatare used to make the latent variable (writing ability) observable. In this model, the structure ofthe rating scale also affects the value of the rating obtained.
Computer equipment
SPSS version 10.0 was used for computing descriptive statistics, inter-rater reliability,and internal consistency reliability. The Many-facet Rasch measurement (Linacre, 1989) analysiswas conducted using the computer program FACETS, version 2.62 for PC (Linacre, 1999a).
Statistical procedures
First, descriptive statistics were computed to check if the scores in each of the fourdomains (i.e., the performance criteria in the rubric) are normally distributed. Then inter-raterreliability was computed to estimate the degree of agreement between the two independent ratersused to score each student’s writing sample. Internal consistency reliability (alpha) was alsocomputed to examine how the four domains of the scoring rubric performed as a group.
In addition, FACETS analysis was conducted to examine the overall rating patterns interms of main effects for the examinee, rater, and domain facets. In FACETS analysis, individualrating patterns that were unusual in light of expected patterns were identified by examining fitstatistics. Rating scale functionality was also investigated by examining the average examineeproficiency measure and the outfit mean-square index provided by FACETS.
In the many-facet Rasch model (Linacre, 1989), each element of each facet of the testingsituation (e.g., rater, item, rating scale category) is represented by one parameter that representsthe ability of examinees, the severity of raters, the difficulty of items, or the challenge of ratingscale categories. The Partial Credit form of the many-facet Rasch model used for this study was:
log (Pnijk/Pnijk-1) = Bn – Cj – Di – Fik
Pnijk = the probability of examinee n being awarded a rating of k when rated by rater j on item iPnijk-1 = the probability of examinee n being awarded a rating of k-1 when rated by rater j on item iBn = the ability of examinee nCj = the severity of rater jDi = the difficulty of item iFik = the difficulty of achieving a score within a particular score category (k) on a particular item
(i).
In the above model, the four domains of the CEP scoring rubric were treated as items andthe step difficulty of the available scoring categories in each domain was calculatedindependently of the step difficulty of the other domains. This particular model was employed
Teachers College, Columbia University Working Papers in TESOL & Applied Linguistics, Vol. 4, No. 1An Investigation of an ESL Placement Test of Writing
6
for this study because the scoring criteria for the four domains were presumed to be qualitativelydifferent, and thus it was assumed that each domain, or item, has its own step structure.
RESULTS
Descriptive Statistics
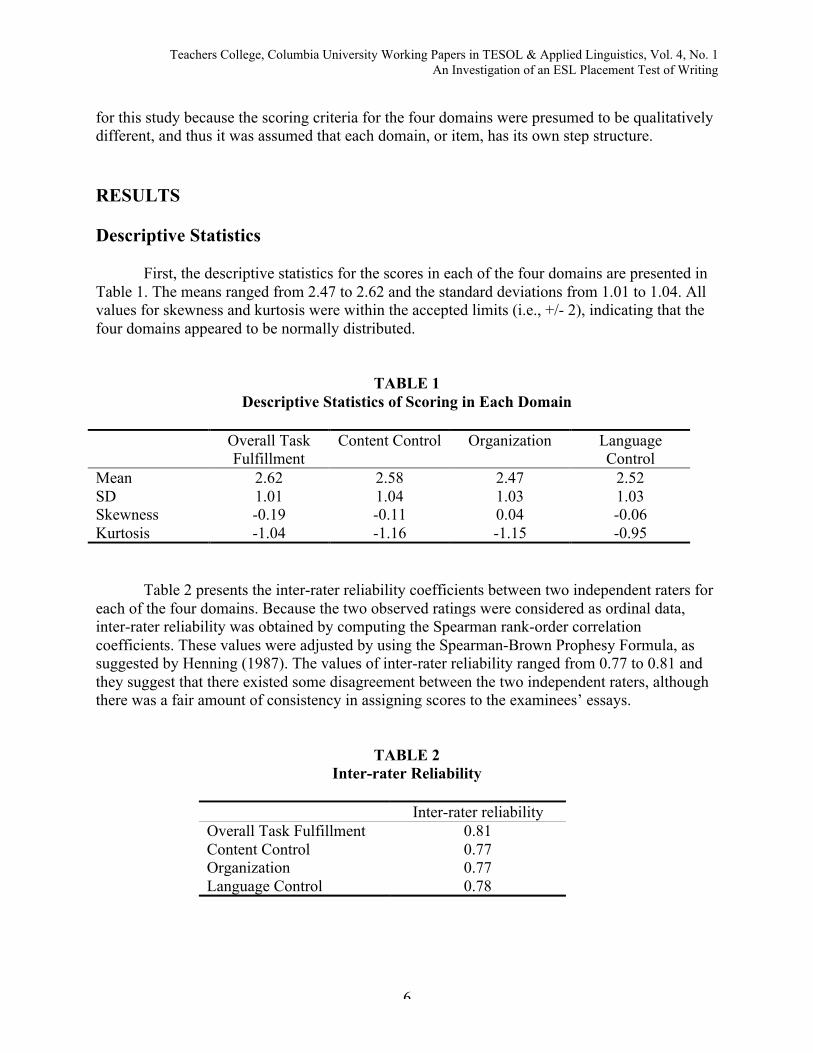
First, the descriptive statistics for the scores in each of the four domains are presented inTable 1. The means ranged from 2.47 to 2.62 and the standard deviations from 1.01 to 1.04. Allvalues for skewness and kurtosis were within the accepted limits (i.e., +/- 2), indicating that thefour domains appeared to be normally distributed.
TABLE 1Descriptive Statistics of Scoring in Each Domain
Overall TaskFulfillment
Content Control Organization LanguageControl
Mean 2.62 2.58 2.47 2.52SD 1.01 1.04 1.03 1.03Skewness -0.19 -0.11 0.04 -0.06Kurtosis -1.04 -1.16 -1.15 -0.95
Table 2 presents the inter-rater reliability coefficients between two independent raters foreach of the four domains. Because the two observed ratings were considered as ordinal data,inter-rater reliability was obtained by computing the Spearman rank-order correlationcoefficients. These values were adjusted by using the Spearman-Brown Prophesy Formula, assuggested by Henning (1987). The values of inter-rater reliability ranged from 0.77 to 0.81 andthey suggest that there existed some disagreement between the two independent raters, althoughthere was a fair amount of consistency in assigning scores to the examinees’ essays.
TABLE 2Inter-rater Reliability
Inter-rater reliabilityOverall Task Fulfillment 0.81Content Control 0.77Organization 0.77Language Control 0.78

Teachers College, Columbia University Working Papers in TESOL & Applied Linguistics, Vol. 4, No. 1An Investigation of an ESL Placement Test of Writing
7
The reliability estimate for internal consistency for the four variables (i.e., overall taskfulfillment, topic/content control, organization, and language control) was relatively high (0.93),suggesting that the same abilities are being measured on each domains of the CEP scoring rubric.
The FACETS Analysis
As mentioned above, FACETS analysis was conducted to examine the overall ratingpatterns in terms of main effects for the examinee, rater, and domain facets.
Figure 2 shows graphically the measures for examinee ability, rater severity, and domaindifficulty. The first column in the map displays the logit scale. The logit scale is a true intervalscale, unlike raw test scores in which the distances between intervals may not be equal. TheFACETS program calibrates the examinees, raters, domains, and rating scales so that all facetsare positioned on the same equal interval scale, creating a single frame of reference forinterpreting the results from the analysis.
The second column displays estimates of examinee ability—single number summaries onthe logit scale of each examinee’s tendency to receive low or high ratings across raters anddomains, given the scales. Higher scoring examinees appear at the top of the column, whilelower scoring examinees appear at the bottom. The column for examinees shows that there is awide range of variation in terms of examinee ability, with estimates ranging from a high of about7 logits to a low of about -8 logits. This column shows that there are a much larger number ofhigher scoring examinees than lower scoring ones. In other words, the examinee ability measuresappear as a negatively skewed distribution.
The third column shows the severity variations among raters. The most severe rater is atthe top and the least severe at the bottom. Figure 2 shows that the harshest rater has a severitymeasure of about 3.2 logits and the most lenient rater has a severity measure of about –2.0 logits,indicating that the raters are not at the same level of severity.
The fourth column compares the four domains of the CEP scoring rubric in terms of theirrelative difficulties. Domains appearing higher in the column were more difficult for examineesto receive high ratings than on domains appearing lower in the column. Figure 2 shows that all ofthe four domains centered around zero. Zero is, by definition, set as the average domaindifficulty on the logit scale. That the four domains centered around zero indicates that althoughthe four domains cannot be considered equivalent, the difficulty span was relatively small.
Columns five through eight graphically describe the four-point rating scales used to scoreexaminee responses. Each domain has its own scale. The horizontal lines across each columnindicate the point at which the likelihood of getting the next higher rating begins to exceed thelikelihood of getting the next lower rating for a given domain (Myford, Marr, & Linacre, 1996,p. 21). For example, when we examine Figure 2, we see that examinees with ability measuresfrom about –4.0 logits up through about 0.25 logits are more likely to receive a rating of 2 thanany other rating on scale 1 (i.e., the overall task fulfillment scale); examinees with abilitymeasures between about 0.25 logits and about 3.7 logits are more likely to receive a rating of 3than any other rating on the overall task fulfillment scale. The issue of rating scale functionalitywill be discussed later in detail.

Teachers College, Columbia University Working Papers in TESOL & Applied Linguistics, Vol. 4, No. 1An Investigation of an ESL Placement Test of Writing
8
FIGURE 2FACETS Summary (Examinee Ability, Rater Severity, Domain Difficulty)
-------------------------------------------------------------------------- Rating scales for each domain
|Logit| Examinee | Rater | Domain |S.1 |S.2 |S.3 |S.4 |--------------------------------------------------------------------------
High Scores Severe Difficult+ 7 + * + + +(4) +(4) +(4) +(4) +| | | | | | | | || | | | | | | | |+ 6 + ** + + + + + + +| | | | | | | | || | * | | | | | | |+ 5 + * + + + + + + +| | * | | | | | | || | **** | | | | | | |+ 4 + * + + + + + + --- +| | **** | | | --- | | | || | ** | 7 | | | --- | --- | |+ 3 + ***** + + + + + + +| | ****** | | | | | | || | ***** | 17 | | | | | 3 |+ 2 + *** + + + 3 + 3 + 3 + +| | ** | 9 | | | | | || | ***** | 15 | | | | | |+ 1 + ******** + + + + + + +| | *** | 4 | | | | | || | * | 1 | organization | --- | --- | --- | --- |* 0 * * 11 16 2 * content language * * * * *| | ***** | 12 8 | overall | | | | || | ***** | 5 | | | | | |+ -1 + ** + + + + + + +| | ** | 14 | | | | | || | * | 10 3 6 | | | 2 | 2 | |+ -2 + + 13 + + 2 + + + 2 +| | * | | | | | | || | ** | | | | | | |+ -3 + *** + + + + + + +| | | | | | | | || | * | | | | | | |+ -4 + *** + + + --- + --- + --- + +| | * | | | | | | --- || | | | | | | | |+ -5 + *** + + + + + + +| | *** | | | | | | || | * | | | | | | |+ -6 + * + + + + + + +| | ** | | | | | | || | * | | | | | | |+ -7 + * + + + + + + +| | | | | | | | || | | | | | | | |+ -8 + ****** + + +(1) +(1) +(1) +(1) +
Low Scores Lenient Easy--------------------------------------------------------------------------
Note. S.1 = Scale for overall task fulfillment S.2 = Scale for topic/content control S.3 = Scale for organization S.4 = Scale for language control

Teachers College, Columbia University Working Papers in TESOL & Applied Linguistics, Vol. 4, No. 1An Investigation of an ESL Placement Test of Writing
9
Examinees
Table 3 provides a summary of selected statistics on the ability scale constructed by theanalysis for 99 examinees. The mean ability of examinees was 0.33 logits, with a standarddeviation of 3.64. The examinee ability measures ranged from –8.06 to 7.03 logits. Theseparation index and test reliability of examinee separation (the proportion of the observedvariance in measurements of ability which is not due to measurement error) were 4.50 and 0.95respectively. This reliability statistic indicates the degree to which the analysis reliablydistinguishes between different levels of ability among examinees. This measure is termed the“Rasch analogue of the familiar KR20 index” by Pollitt and Hutchinson (1987). For examinees,the reliability coefficient of 0.95 indicates that the analysis is fairly reliably separating examineesinto different levels of ability. The chi-square of 1836.90 (df = 91) was significant at p = .00 and,therefore, the null hypothesis that all examinees were equally able must be rejected.
TABLE 3Summary of Statistics on Examinees (N=99)
Mean ability 0.33Standard deviation 3.64Mean Square measurement error 0.79Separation index 4.50Test reliability of examinee separation 0.95Fixed (all same) chi-square 1836.90
(df =91, P = .00)
In order to identify examinees who exhibit unusual profiles of ratings across the fourdomains of the scoring rubric, fit statistics were examined. The FACETS analysis provides twomeasures of fit, or consistency: the infit and the outfit. The infit is the weighted mean-squareresidual that is sensitive to unexpected responses near the point where decisions are being made,whereas the outfit is the unweighted mean-square residuals and is sensitive to extreme scores.For the purposes of this study, only the infit statistics were examined because they are the onesusually considered the most informative, as they focus on the degree of fit in the most typicalobservations in the matrix (McNamara, 1996, p. 172). There are no hard-and-fast rules for settingupper- and lower-control limits for the infit statistics (i.e., infit mean-square index). In general,as Pollitt and Hutchinson (1987) suggest, any individual infit mean-square value needs to beinterpreted against the mean and standard deviation of the set of infit-mean square values for thefacet concerned. Using these criteria, a value lower than the mean minus twice the standarddeviation would indicate too little variation, lack of independence, or overfit. A value greaterthan the mean plus twice the standard deviation would indicate too much unpredictability, ormisfit.
For the examinee facet in this study, the infit mean-square mean was 1.0, with a standarddeviation of 0.6, so a value greater than 2.2 (1.0 + [.6 x 2]) would be misfitting. There were fourmisfitting examinees, representing 4% of the examinees (N=99). The number of misfittingexaminees (although small) is a problem, given that Pollitt and Hutchinson (1987) point out we
Teachers College, Columbia University Working Papers in TESOL & Applied Linguistics, Vol. 4, No. 1An Investigation of an ESL Placement Test of Writing
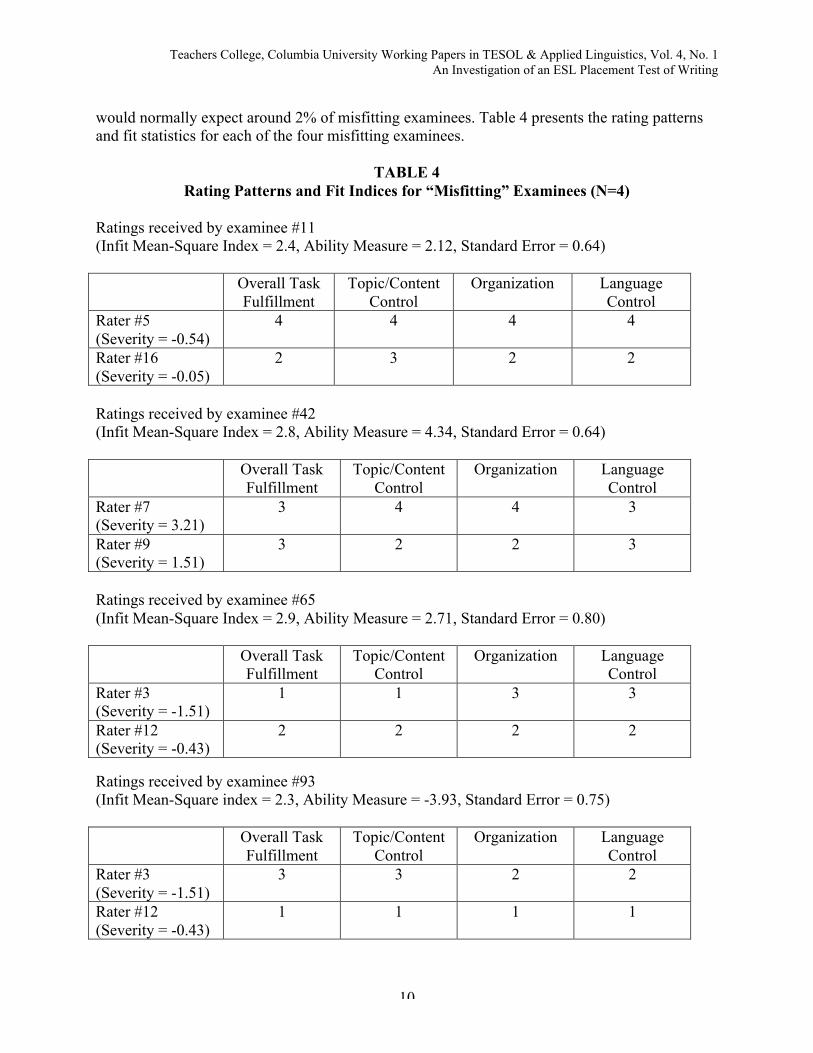
10
would normally expect around 2% of misfitting examinees. Table 4 presents the rating patternsand fit statistics for each of the four misfitting examinees.
TABLE 4Rating Patterns and Fit Indices for “Misfitting” Examinees (N=4)
Ratings received by examinee #11(Infit Mean-Square Index = 2.4, Ability Measure = 2.12, Standard Error = 0.64)
Overall TaskFulfillment
Topic/ContentControl
Organization LanguageControl
Rater #5(Severity = -0.54)
4 4 4 4
Rater #16(Severity = -0.05)
2 3 2 2
Ratings received by examinee #42(Infit Mean-Square Index = 2.8, Ability Measure = 4.34, Standard Error = 0.64)
Overall TaskFulfillment
Topic/ContentControl
Organization LanguageControl
Rater #7(Severity = 3.21)
3 4 4 3
Rater #9(Severity = 1.51)
3 2 2 3
Ratings received by examinee #65(Infit Mean-Square Index = 2.9, Ability Measure = 2.71, Standard Error = 0.80)
Overall TaskFulfillment
Topic/ContentControl
Organization LanguageControl
Rater #3(Severity = -1.51)
1 1 3 3
Rater #12(Severity = -0.43)
2 2 2 2
Ratings received by examinee #93(Infit Mean-Square index = 2.3, Ability Measure = -3.93, Standard Error = 0.75)
Overall TaskFulfillment
Topic/ContentControl
Organization LanguageControl
Rater #3(Severity = -1.51)
3 3 2 2
Rater #12(Severity = -0.43)
1 1 1 1

Teachers College, Columbia University Working Papers in TESOL & Applied Linguistics, Vol. 4, No. 1An Investigation of an ESL Placement Test of Writing
11
Table 4 shows that examinee 11 received unexpectedly high ratings of 4 by rater 5 in allof the four domains. Examinee 93 received unexpectedly low ratings of 1 by rater 12 in all of thefour domains. It should be noted that rater 3 and 12 were responsible for two out of four cases ofmisfitting examinees. This would suggest that adjudication of the scores of these misfittingexaminees and retraining of these raters are called for.
Raters
Rater behavior can be analyzed in terms of relative severity, and also in terms ofconsistency within individual raters (i.e., intra-rater reliability). Table 5 provides a summary ofselected statistics on the rater facet.
TABLE 5Calibration of Rater Facet
RaterID
Rater SeverityMeasure (in logits)
Standard Error Infit Mean-SquareIndex
7 3.21 0.24 1.017 2.43 0.24 0.89 1.51 0.23 1.0
15 1.41 0.29 1.04 0.76 0.23 0.91 0.31 0.42 0.72 0.17 0.24 0.8
11 -0.02 0.26 1.016 -0.05 0.25 1.08 -0.36 0.27 1.0
12 -0.43 0.23 0.95 -0.54 0.25 1.13 -1.51 0.23 1.3
10 -1.83 0.25 1.06 -1.83 0.25 0.9
14 -1.20 0.29 0.813 -2.03 0.46 0.6
Mean 0.00 0.35 0.9SD 0.08 0.01 0.2
Reliability of separation index = 0.97; fixed (all same) chi-square: 627.5, df: 16, significance: p = .00
Table 5 shows rater IDs, rater severity, error, and infit mean-square values. The secondcolumn shows that the severity span between the most lenient rater (Rater 13) and the mostsevere rater (Rater 7) was 5.24 logits. The reliability of separation index (which indicates thelikelihood to which raters consistently differ from one another in overall severity) was high(0.97). For raters, a low reliability is desirable, since ideally the different raters would be equally

Teachers College, Columbia University Working Papers in TESOL & Applied Linguistics, Vol. 4, No. 1An Investigation of an ESL Placement Test of Writing
12
severe. In this case, however, the reliability is 0.97 for all raters, indicating that the analysis isreliably separating raters into different levels of severity. Also, the chi-square of 627.6 (df = 16)was significant at p = .00 and, therefore, the null hypothesis that all raters were equally severemust be rejected. These indicators of the magnitude of severity differences among raters indicatethat significant variation in harshness did exist among the raters: Rater 7 was consistently harsherthan other raters; conversely, Rater 13 was consistently more lenient than other raters. The thirdcolumn shows that the level of error was small. The last column indicates that no raters wereidentified as misfitting: fit values for all raters were within the range of two standard deviationsaround the mean (0.9 +/- [0.2 x 2]). In other words, all raters were self-consistent in scoring.
Domains
Table 6 presents the results of the FACETS analysis for domains.
TABLE 6Calibration of Domain Facet
Domain Difficulty Measure(in logits)
Standard Error Infit Mean-SquareIndex
Organization 0.36 0.12 1.1Language control 0.04 0.13 1.0Content -0.09 0.12 1.1Overall task fulfillment -0.30 0.13 0.8Mean 0.00 0.16 1.0SD 0.26 0.00 0.1Reliability of separation index = 0.64; fixed (all same) chi-square: 11.1, df: 3, significance: p = .01
Table 6 shows the domains, domain difficulty measures, error, and infit mean-squarevalues. The most leniently scored domain was overall task fulfillment, the most harshly scoreddomain was organization, and the difficulty span between these two domains was relativelysmall (0.66), as were the separation index (1.34) and the reliability of domain separation (0.64),suggesting that the domains were relatively similar in difficulty. To further investigate therelationship among the four domains, the infit mean-square indices were examined. They are allwithin the acceptable limits of 0.80 to 1.2 (i.e., the range of two standard deviations around themean: 1.0 +/- [2 x 0.1]). The fact that there is no overfitting domain (the infit mean-square indexlower than 0.80) suggests that none of the domains function in a redundant fashion. That is, thefour domains being scored in the rubric are not too similar. The fact that there is no misfittingitem (the infit mean-square index greater than 1.2) indicates that there is little evidence ofpsychometric multidimensionality. The four domains on the rubric appear to work together;ratings on one domain correspond well to ratings on other domains. That is, a single pattern ofproficiency emerges for these examinees across all domains. Therefore, ratings on the individualdomains can be meaningfully combined; a single summary measure can appropriately capturethe essence of examinee performance across the four domains of the scoring rubric.
Teachers College, Columbia University Working Papers in TESOL & Applied Linguistics, Vol. 4, No. 1An Investigation of an ESL Placement Test of Writing
13
Rating scale
To see if the four 4-point rating scales are appropriately ordered and clearlydistinguishable (i.e., rating scale functionality), the average examinee ability measure and outfitmean-square index provided by FACETS for each rating category for each of the four domainswere examined.
To compute the average examinee ability measure for a rating category, the examineeability measures (in logits) for all examinees receiving a rating in that category on that domainare averaged. If the rating scale for the domain is functioning as intended, then average examineeability measures will increase in magnitude as the rating scale categories increase. When thispattern is borne out in the data, the results suggest that examinees with higher ratings on thedomain are indeed exhibiting more of the variable being measured than examinees with lowerratings on that domain, and therefore the intentions of those who designed the rating scale arebeing fulfilled (Linacre, 1999b).
Table 7 shows the average examinee ability measures along with outfit mean-squareindices by rating scale category for each of the four domains.
TABLE 7Average Examinee Ability Measures and Outfit Mean-square Indices from the FACETS
Output
Domain
Overall TaskFulfillment
Content Control Organization Language Control
CategoryLabel
AverageMeasures
OutfitMnSq
AverageMeasures
OutfitMnSq
AverageMeasures
OutfitMnSq
AverageMeasures
OutfitMnSq
1 -5.30 1.0 -5.35 0.9 -5.61 0.9 -5.67 1.12 -1.59 0.7 -1.23 0.9 -0.95 0.9 -1.79 1.13 2.16 0.8 1.94 1.0 1.64 1.4 2.15 0.94 5.29 0.8 4.93 1.0 4.65 0.9 5.38 0.9
In Table 7, the average examinee ability measures for all of the domains increase as therating scale categories increase. For the overall task fulfillment domain, for example, the averageexaminee proficiency measures increase from –5.30 to 5.29 as the rating scale categoriesincrease.
The outfit mean-square index is also a useful indicator of rating scale functionality. Foreach rating scale category for each domain, FACETS computes the average examinee abilitymeasure (i.e., the observed measure) and an expected examinee ability measure (i.e., theexaminee ability measure the model would predict for that rating category if the data were to fitthe model). When the observed and expected examinee ability measures are close, then the outfitmean-square index for the rating category will be near the expected value of 1.0. The greater thediscrepancy between the observed and expected measures, the larger the mean-square index willbe. For a given rating category, an outfit mean-square index greater than 2.0 suggests that arating in that category for one or more examinees may not be contributing to meaningful
Teachers College, Columbia University Working Papers in TESOL & Applied Linguistics, Vol. 4, No. 1An Investigation of an ESL Placement Test of Writing
14
measurement of the variable (Linacre, 1999b). As shown in Table 7, there was not a singledomain that has outfit mean-square indices greater than 2.0 for any rating category, suggestingthat the rating scales for the four domains seem to be functioning as intended.
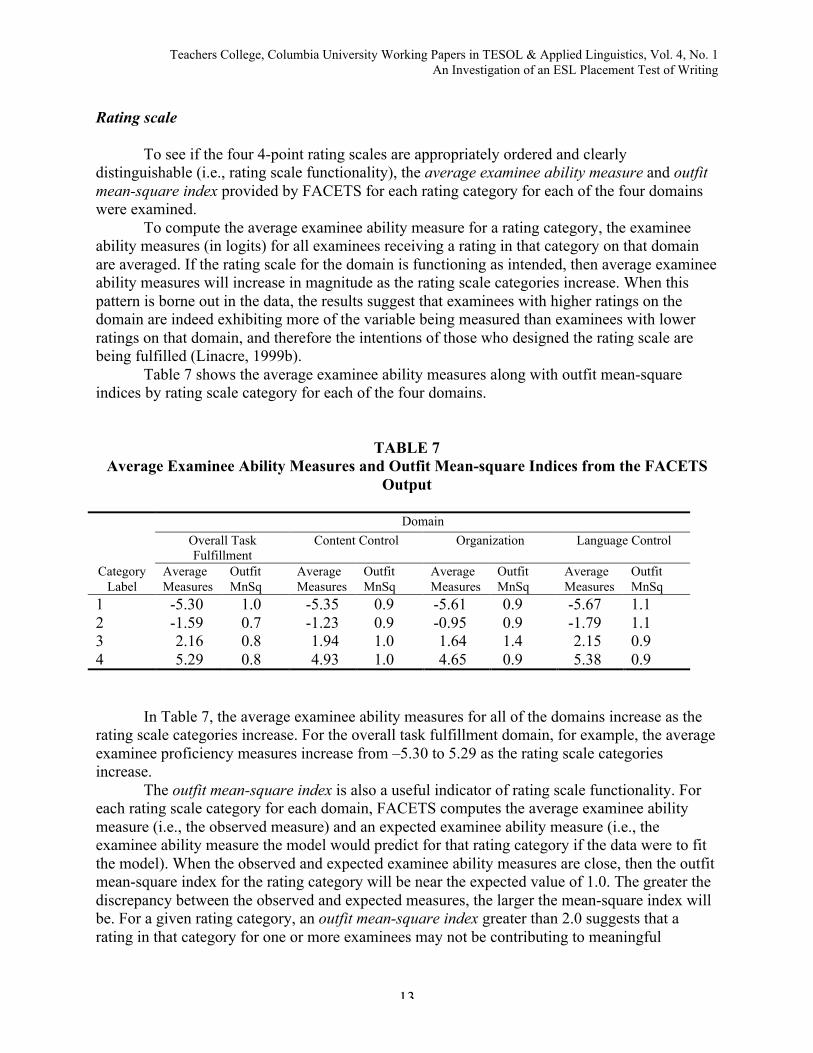
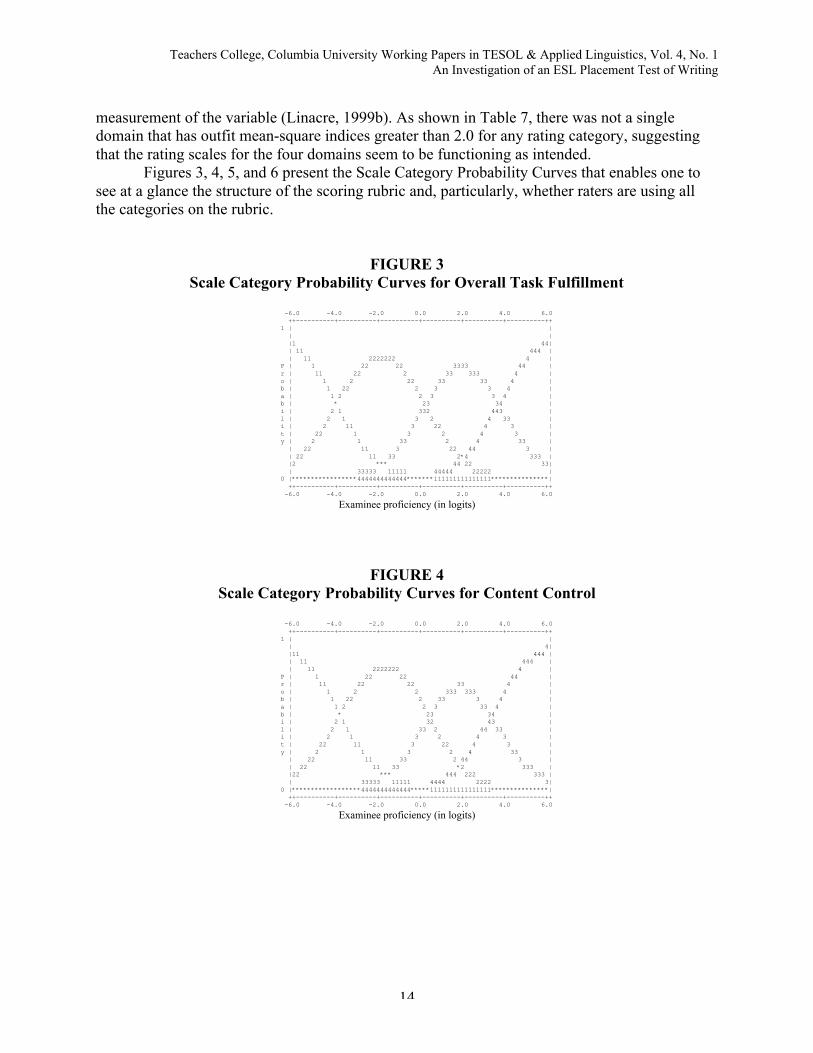
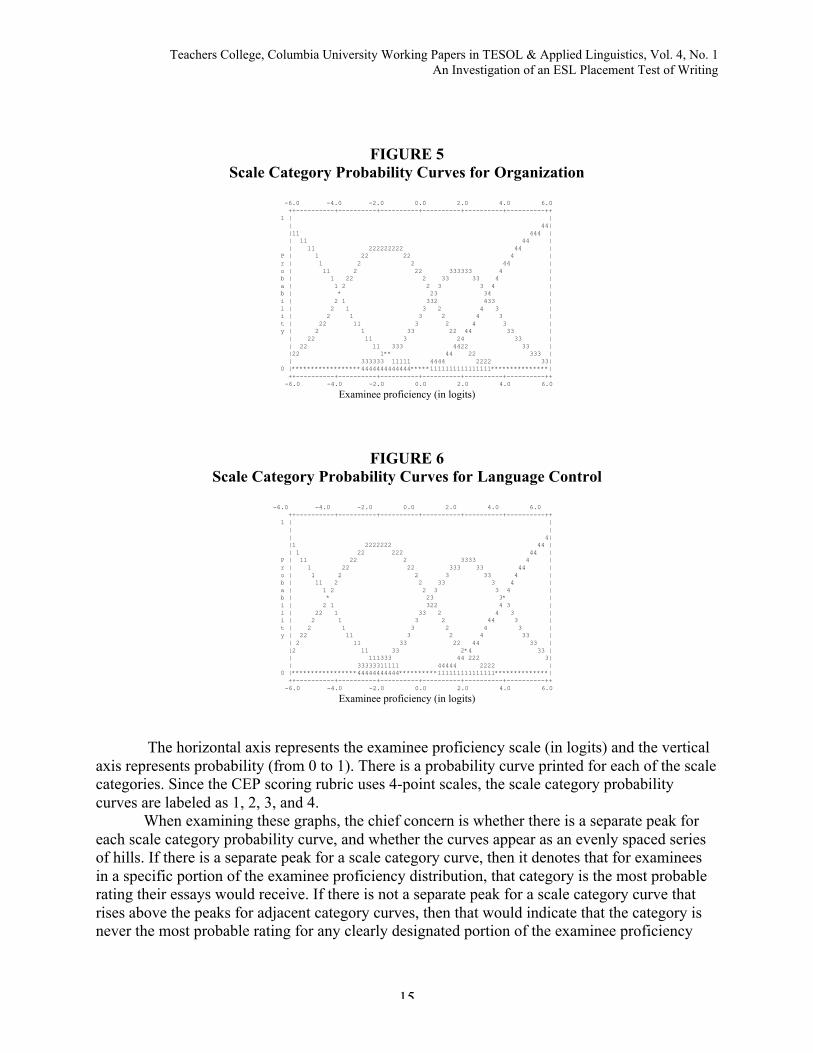
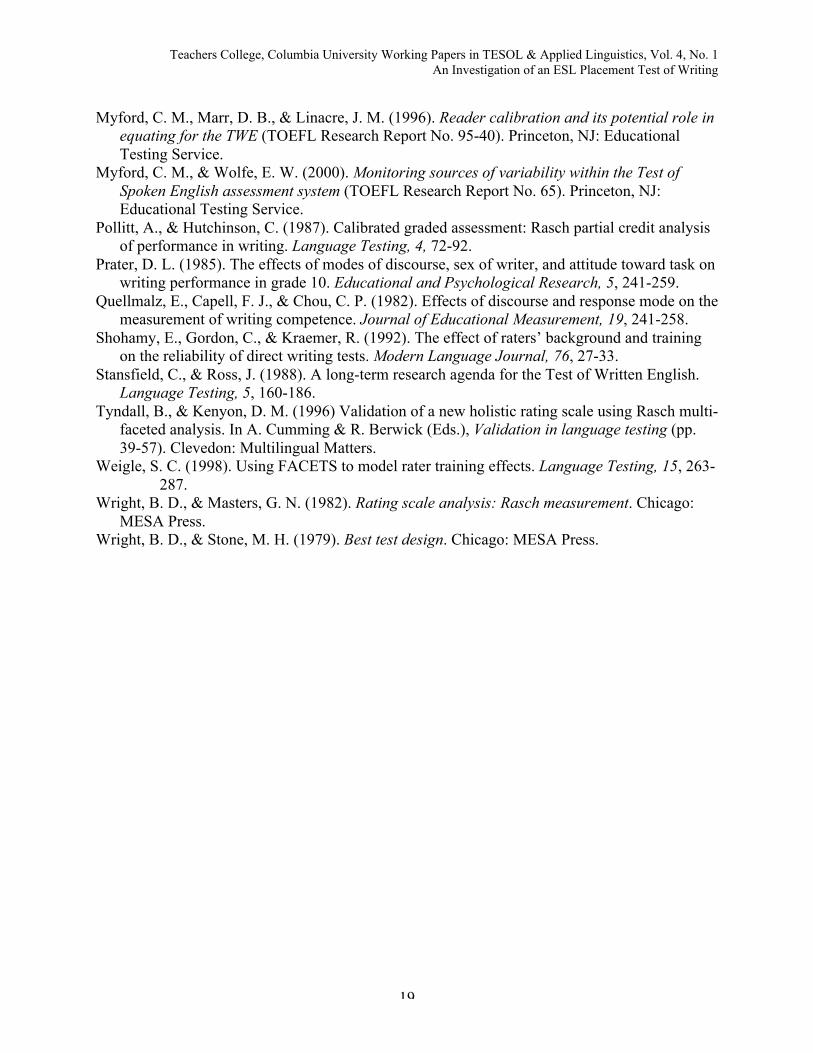
Figures 3, 4, 5, and 6 present the Scale Category Probability Curves that enables one tosee at a glance the structure of the scoring rubric and, particularly, whether raters are using allthe categories on the rubric.
FIGURE 3Scale Category Probability Curves for Overall Task Fulfillment
-6.0 -4.0 -2.0 0.0 2.0 4.0 6.0 ++----------+----------+----------+----------+----------+----------++ 1 | | | | |1 44| | 11 444 | | 11 2222222 4 | P | 1 22 22 3333 44 | r | 11 22 2 33 333 4 | o | 1 2 22 33 33 4 | b | 1 22 2 3 3 4 | a | 1 2 2 3 3 4 | b | * 23 34 | i | 2 1 332 443 | l | 2 1 3 2 4 33 | i | 2 11 3 22 4 3 | t | 22 1 3 2 4 3 | y | 2 1 33 2 4 33 | | 22 11 3 22 44 3 | | 22 11 33 2*4 333 | |2 *** 44 22 33| | 33333 11111 44444 22222 | 0 |*****************4444444444444*******111111111111111***************| ++----------+----------+----------+----------+----------+----------++ -6.0 -4.0 -2.0 0.0 2.0 4.0 6.0
Examinee proficiency (in logits)
FIGURE 4Scale Category Probability Curves for Content Control
-6.0 -4.0 -2.0 0.0 2.0 4.0 6.0 ++----------+----------+----------+----------+----------+----------++ 1 | | | 4| |11 444 | | 11 444 | | 11 2222222 4 | P | 1 22 22 44 | r | 11 22 22 33 4 | o | 1 2 2 333 333 4 | b | 1 22 2 33 3 4 | a | 1 2 2 3 33 4 | b | * 23 34 | i | 2 1 32 43 | l | 2 1 33 2 44 33 | i | 2 1 3 2 4 3 | t | 22 11 3 22 4 3 | y | 2 1 3 2 4 33 | | 22 11 33 2 44 3 | | 22 11 33 *2 333 | |22 *** 444 222 333 | | 33333 11111 4444 2222 3| 0 |******************4444444444444*****1111111111111111***************| ++----------+----------+----------+----------+----------+----------++ -6.0 -4.0 -2.0 0.0 2.0 4.0 6.0
Examinee proficiency (in logits)
Teachers College, Columbia University Working Papers in TESOL & Applied Linguistics, Vol. 4, No. 1An Investigation of an ESL Placement Test of Writing
15
FIGURE 5Scale Category Probability Curves for Organization
-6.0 -4.0 -2.0 0.0 2.0 4.0 6.0 ++----------+----------+----------+----------+----------+----------++ 1 | | | 44| |11 444 | | 11 44 | | 11 222222222 44 | P | 1 22 22 4 | r | 1 2 2 44 | o | 11 2 22 333333 4 | b | 1 22 2 33 33 4 | a | 1 2 2 3 3 4 | b | * 23 34 | i | 2 1 332 433 | l | 2 1 3 2 4 3 | i | 2 1 3 2 4 3 | t | 22 11 3 2 4 3 | y | 2 1 33 22 44 33 | | 22 11 3 24 33 | | 22 11 333 4422 33 | |22 1** 44 22 333 | | 333333 11111 4444 2222 33| 0 |******************4444444444444*****1111111111111111***************| ++----------+----------+----------+----------+----------+----------++
-6.0 -4.0 -2.0 0.0 2.0 4.0 6.0
Examinee proficiency (in logits)
FIGURE 6Scale Category Probability Curves for Language Control
-6.0 -4.0 -2.0 0.0 2.0 4.0 6.0 ++----------+----------+----------+----------+----------+----------++ 1 | | | | | 4| |1 2222222 44 | | 1 22 222 44 | P | 11 22 2 3333 4 | r | 1 22 22 333 33 44 | o | 1 2 2 3 33 4 | b | 11 2 2 33 3 4 | a | 1 2 2 3 3 4 | b | * 23 3* | i | 2 1 322 4 3 | l | 22 1 33 2 4 3 | i | 2 1 3 2 44 3 | t | 2 1 3 2 4 3 | y | 22 11 3 2 4 33 | | 2 11 33 22 44 33 | |2 11 33 2*4 33 | | 111333 44 222 3| | 33333311111 44444 2222 | 0 |*****************44444444444**********111111111111111**************| ++----------+----------+----------+----------+----------+----------++
-6.0 -4.0 -2.0 0.0 2.0 4.0 6.0
Examinee proficiency (in logits)
The horizontal axis represents the examinee proficiency scale (in logits) and the verticalaxis represents probability (from 0 to 1). There is a probability curve printed for each of the scalecategories. Since the CEP scoring rubric uses 4-point scales, the scale category probabilitycurves are labeled as 1, 2, 3, and 4.
When examining these graphs, the chief concern is whether there is a separate peak foreach scale category probability curve, and whether the curves appear as an evenly spaced seriesof hills. If there is a separate peak for a scale category curve, then it denotes that for examineesin a specific portion of the examinee proficiency distribution, that category is the most probablerating their essays would receive. If there is not a separate peak for a scale category curve thatrises above the peaks for adjacent category curves, then that would indicate that the category isnever the most probable rating for any clearly designated portion of the examinee proficiency

Teachers College, Columbia University Working Papers in TESOL & Applied Linguistics, Vol. 4, No. 1An Investigation of an ESL Placement Test of Writing
16
distribution. As shown in Figures 3, 4, 5, and 6, the probability curves for the four scales appearas a fairly evenly spaced series of hills. For each scale category there is a clearly designatedportion of the examinee proficiency distribution for which that category is the most probablerating given.
Bias analysis
In the context of writing performance assessments, there may be an interaction involvinga rater and some other aspect of the rating situation. The identification of these systematic sub-patterns of behavior is achieved in MFRM in so-called bias analysis. In this study, a biasanalysis was carried out on the interaction of raters with domains. This identifies raters who areresponding consistently to a domain in a way that is both different from other raters, anddifferent from their own behavior in relation to other domains.
There were nine instances (13.2% of the total interactions) of significant bias out of 68possible interactions (17 raters x 4 domains). Table 8 presents all of the instances of significantlybiased interactions.
TABLE 8Significantly Biased Rater-Domain Interactions (N=9)
Rater # Domain Z-score2 Organization 2.742 Language control -2.314 Organization -2.065 Language control 2.586 Organization 2.376 Language control -2.237 Organization -2.1211 Organization 2.1011 Language control -2.62
If a z-score value in Table 8 is greater than +2, the domain is triggering a systematicallymore severe behavior than is normal for the rater in question. If a z-score value is smaller than -2, the domain is triggering a systematically more lenient behavior than is normal for the rater inquestion. In Table 8, for example, the interaction between rater #2 and the organization domainproduced a statistically significant bias value (z = 2.74), suggesting that rater #2 is demonstratinga more severe than normal rating pattern with the organization domain. The same rater isdemonstrating a more lenient than normal rating pattern with the language control domain, asindicated by a z-score value that is smaller than -2 (z = -2.31).
It should be noted that significant rater-domain interactions were found in the domains oforganization and language control, but not in the two other domains (overall task fulfillment andtopic/content control). This could mean that the descriptors for organization and language controlwere somehow more difficult to agree on than those for overall task fulfillment and topic/content

Teachers College, Columbia University Working Papers in TESOL & Applied Linguistics, Vol. 4, No. 1An Investigation of an ESL Placement Test of Writing
17
control. This finding suggests that clearer criteria and training for judging the performances ofexaminees especially on these domains might be required.
DISCUSSION AND CONCLUSION
In this study, four sources of variability (i.e., examinee, rater, domain, and rating scale) inscores from the CEP writing test were examined with the help of Many-facet Raschmeasurement. The investigation of the examinee facet showed that the CEP writing test usefullyseparated test-takers into statistically distinct levels of proficiency. A few examinees exhibitedunusual profiles of ratings across the four domains of the CEP scoring rubric. Indeed, about 4%of the examinees showed significant misfits. The rating patterns of these misfitting examineesshould be reviewed before issuing score reports, particularly if an examinee’s measure is near acritical decision-making point in the score distribution. From the decision-maker’s viewpoint, theability measures for individual examinees provided by MFRM are fairer than raw scores becausethey were corrected for differences in raters, domains, and rating scales. For example,adjustments for rater severity improve the objectivity and fairness of the measurement of writingability because unadjusted scores can lead to under- or overestimates of writing ability whenstudents are rated by different raters. MFRM thus provides a sound theoretical framework forobtaining objective and fair measurements of writing ability that generalize beyond the specificraters, domains, and rating scales.
The examination of the rater facet revealed that while the raters differed in the severitywith which they rated examinees, all of them used the CEP scoring rubric in a consistent manner.That is, the raters appeared to be internally consistent but are not interchangeable, confirming thefindings of Weigle (1998) that rater training is more successful in helping raters give morepredictable scores (i.e., intra-rater reliability) than in getting them to give identical scores (i.e.,inter-rater reliability).
The analysis of the domain facet showed that the domains work together; ratings on onedomain correspond well to ratings on the other domains, indicating that a single pattern ofproficiency emerges for these examinees across all domains on the scoring rubric. Therefore,ratings on the individual domains can be meaningfully combined; a single summary measure canappropriately capture the essence of examinee performance across the four domains. With regardto rating scale functionality, the average examinee proficiency measure and the outfit mean-square index indicated that the four 4-point subscales are appropriately ordered and clearlydistinguishable.
The bias analysis carried out on the interactions between raters and domains revealed thatthe descriptors for organization and language control were somehow more difficult to agree uponthan those for the other two domains. This may suggest that clearer criteria and rater training forscoring the examinee performance especially on these domains are required.
In the present study, the essay prompt was not considered as a facet in the FACETSanalysis because only one prompt was used in the current CEP writing test. Ideally, studentsshould be able to respond equally well to different types of writing tasks. However, severalstudies (e.g., Engelard, Gordon, & Gabrielson, 1991; Kegley, 1986; Prater, 1985; Quellmalz,Capell, & Chou, 1982) indicate that some topics elicit better writing than others, and that sometopics are more difficult than others. Because of possible performance fluctuations from topic totopic and/or from one mode of discourse to another, perhaps more than one type of writing task

Teachers College, Columbia University Working Papers in TESOL & Applied Linguistics, Vol. 4, No. 1An Investigation of an ESL Placement Test of Writing
18
should be included in high-stakes assessments as a way of achieving a high level of reliability. Ifadditional prompts are to be used in the CEP writing test, the essay prompt facet should beincorporated into the FACETS analysis. This modification would yield additional information oneach student’s writing ability, resulting in higher score reliability. As Lee, Kantor, and Mollaun(2002) have suggested, in order to maximize score reliability for writing assessments, it wouldperhaps be more cost-efficient to increase the number of tasks rather than the number of ratingsper task.
To conclude, this study showed that the validity of an essay composition test could beinvestigated with the help of Many-facet Rasch measurement. As mentioned earlier, a restricteddefinition of validity was used in the present study: if Rasch analysis shows little misfit, there isevidence for the construct validity of this measurement procedure. Although this definition fallsshort of Messick’s (1989) definition of validity based on the empirical and theoretical rationalesthat support the adequacy and appropriateness of inferences and actions based on the test scores,the FACETS analysis did provide evidence for the construct validity of the CEP writing test.
REFERENCES
Engelhard, G. (1992). The measurement of writing ability with a many-facet Raschmodel. Applied Measurement in Education, 5, 171-191.
Engelhard, G., Gordon, B., & Gabrielson, S. (1991). The influences of mode of discourse,experiential demand, and gender on the quality of student writing. Research in theTeaching of English, 26, 315-336.
Hamp-Lyons, L. (1990). Second language writing: Assessment issues. In B. Kroll (Ed.), Second language writing (pp. 69-87). Cambridge: Cambridge University Press.Henning, G. (1987). A guide to language testing. Boston, MA: Heinle & Heinle.Jacobs, H. L., Zinkgraf, S. A., Wormuth, D. R., Hartfiel, V.F., & Hughey, J. B. (1981).
Testing ESL composition: A practical approach. Rowley, MA: Newbury House.Kegley, P. H. (1986). The effect of mode of discourse on student writing performance:
Implications for policy. Educational Evaluation and Policy Analysis, 8, 147-154.Kondo-Brown, K. (2002). An analysis of rater bias with FACETS in measuring Japanese L2
writing performance. Language Testing, 19, 1-29.Lee, Y., Kantor, R., & Mollaun, P. (2002). Score dependability of the writing and speaking
section of New TOEFL. Paper presented at the annual meeting of National Council onMeasurement in Education (NCME), New Orleans, LA.
Linacre, J. M. (1989). Many-facet Rasch measurement. Chicago: MESA Press.Linacre, J. M. (1999a). FACETS, Version 3.17 [Computer program]. Chicago: MESA Press.Linacre, J. M. (1999b). Investigating rating scale category unity. Journal of Outcome
Measurement, 3, 103-122.McNamara, T. F. (1996). Measuring second language performance. London: Longman.Messick, S. (1989). Validity. In R. L. Linn (Ed.), Educational measurement (pp. 13-103). New
York: Macmillan.Milanovic, M., Saville, N., Pollitt, A., & Cook, A. (1996). Developing rating scales for CASE:
Theoretical concerns and analyses. In A. Cumming & R. Berwick (Eds.), Validation inlanguage testing (pp. 15-38). Clevedon: Multilingual Matters.
Teachers College, Columbia University Working Papers in TESOL & Applied Linguistics, Vol. 4, No. 1An Investigation of an ESL Placement Test of Writing
19
Myford, C. M., Marr, D. B., & Linacre, J. M. (1996). Reader calibration and its potential role inequating for the TWE (TOEFL Research Report No. 95-40). Princeton, NJ: EducationalTesting Service.
Myford, C. M., & Wolfe, E. W. (2000). Monitoring sources of variability within the Test ofSpoken English assessment system (TOEFL Research Report No. 65). Princeton, NJ:Educational Testing Service.
Pollitt, A., & Hutchinson, C. (1987). Calibrated graded assessment: Rasch partial credit analysisof performance in writing. Language Testing, 4, 72-92.
Prater, D. L. (1985). The effects of modes of discourse, sex of writer, and attitude toward task onwriting performance in grade 10. Educational and Psychological Research, 5, 241-259.
Quellmalz, E., Capell, F. J., & Chou, C. P. (1982). Effects of discourse and response mode on themeasurement of writing competence. Journal of Educational Measurement, 19, 241-258.
Shohamy, E., Gordon, C., & Kraemer, R. (1992). The effect of raters’ background and trainingon the reliability of direct writing tests. Modern Language Journal, 76, 27-33.
Stansfield, C., & Ross, J. (1988). A long-term research agenda for the Test of Written English.Language Testing, 5, 160-186.
Tyndall, B., & Kenyon, D. M. (1996) Validation of a new holistic rating scale using Rasch multi-faceted analysis. In A. Cumming & R. Berwick (Eds.), Validation in language testing (pp.39-57). Clevedon: Multilingual Matters.
Weigle, S. C. (1998). Using FACETS to model rater training effects. Language Testing, 15, 263-287.
Wright, B. D., & Masters, G. N. (1982). Rating scale analysis: Rasch measurement. Chicago:MESA Press.
Wright, B. D., & Stone, M. H. (1979). Best test design. Chicago: MESA Press.

Teachers College, Columbia University Working Papers in TESOL & Applied Linguistics, Vol. 4, No. 1An Investigation of an ESL Placement Test of Writing
20
APPENDIX AScoring Rubric for the CEP Writing Test (last updated on Jan. 22, 2003)
Category Level Criteria1. Overall task fulfillment 4 Excellent to
very goodFor this category, the rater reads an essay quickly and thenassigns a score to the text based on “an overall impression.”
3 Good toaverage
This category aims to rate “the overall proficiency level”reflected in a given sample of student writing.
2 Fair to poor1 Very poor
2. Topic/Content control 4 Excellent tovery good
knowledgeable; substantive; thorough development ofargument; relevant to assigned topic
3 Good toaverage
some knowledge of subject; adequate range; limiteddevelopment of argument; mostly relevant to topic, but lacksdetail
2 Fair to poor limited knowledge of subject; little substance; inadequatedevelopment of topic
1 Very poor does not show knowledge of subject; non-substantive; notpertinent; or not enough to evaluate
3. Organization 4 Excellent tovery good
well-organized; logical sequencing; cohesive
3 Good toaverage
loosely organized but main ideas stand out; limited support;logical but incomplete sequencing
2 Fair to poor ideas confused or disorganized; lacks logical sequencing anddevelopment
1 Very poor does not communicate; no organization; or not enough toevaluate
4. Language control(Grammar/Vocabulary)
4 Excellent tovery good
effective complex constructions; few errors in grammar;sophisticated range of vocabulary
3 Good toaverage
effective but simple constructions; minor problems incomplex constructions; several errors in grammar; adequaterange of vocabulary
2 Fair to poor Major problems in simple/complex constructions; frequenterrors in grammar; meaning confused or obscured; limitedrange of vocabulary
1 Very poor virtually no mastery of sentence construction rules;dominated by errors; does not communicate; or not enough toevaluate
Teachers College, Columbia University Working Papers in TESOL & Applied Linguistics, Vol. 4, No. 1An Investigation of an ESL Placement Test of Writing
21
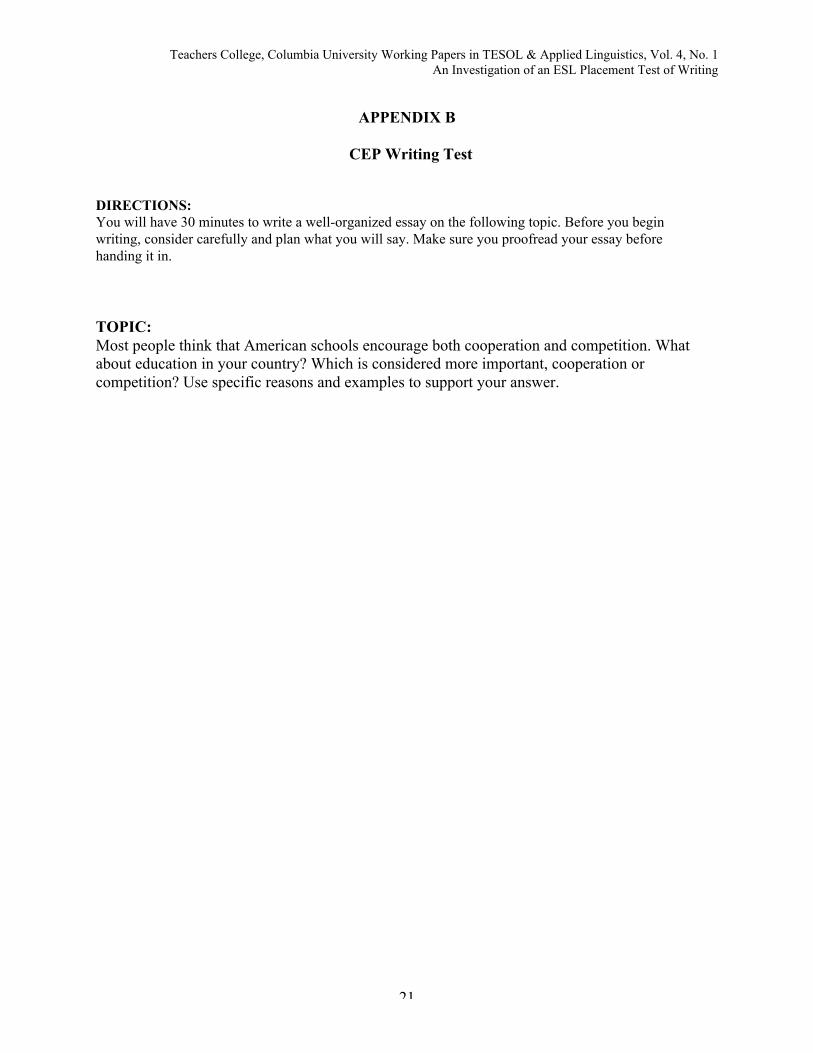
APPENDIX B
CEP Writing Test
DIRECTIONS:You will have 30 minutes to write a well-organized essay on the following topic. Before you beginwriting, consider carefully and plan what you will say. Make sure you proofread your essay beforehanding it in.
TOPIC:Most people think that American schools encourage both cooperation and competition. Whatabout education in your country? Which is considered more important, cooperation orcompetition? Use specific reasons and examples to support your answer.