Embed Size (px)
Citation preview

RAA 2017 Vol. 17 No. 1, 10 (10pp) doi: 10.1088/1674–4527/17/1/10
c© 2017 National Astronomical Observatories, CAS and IOP Publishing Ltd.
http://www.raa-journal.org http://iopscience.iop.org/raa
Research inAstronomy andAstrophysics
An investigation of a magnetic cataclysmic variable with a period of 14.1 ks
Song Wang1,2, Yu Bai1,2, Chuan-Peng Zhang2 and Ji-Feng Liu1,2,3
1 Key Laboratory of Optical Astronomy, National Astronomical Observatories, Chinese Academy of Sciences,
Beijing 100012, China; [email protected], [email protected] National Astronomical Observatories, Chinese Academy of Sciences, Beijing 100012, China3 College of Astronomy and Space Sciences, University of Chinese Academy of Sciences, Beijing 100049, China
Received 2016 August 6; accepted 2016 October 17
Abstract Magnetic cataclysmic variables (CVs) contain a white dwarf (WD) with a magnetic field
strong enough to control the accretion flow from a late type secondary. In this paper, we identify a
magnetic CV (CXOGSG J215544.4+380116) from the Chandra archive data. The X-ray light curves
show a significant period of 14.1 ks, and the X-ray spectra can be described by a multi-temperature hot
thermal plasma, suggesting the source is a magnetic CV. The broad dip in the X-ray light curve is due
to the eclipse of the primary magnetic pole, and the additional dip in the bright phase of the soft and
medium bands may be caused by the accretion stream crossing our line of sight to the primary pole.
Follow-up optical spectra show features of an M2–M4 dwarf dominating the red band and a WD which
is responsible for the weak upturn in the blue band. The mass (∼ 0.4 M⊙) and radius (∼ 0.4 R⊙) for
the M dwarf are obtained using CV evolution models and empirical relations between the orbital period
and the mass/radius. The estimated low X-ray luminosity and accretion rate may suggest the source is a
low-accretion-rate polar. In addition, Very Large Array observations reveal a possible radio counterpart
to the X-ray source, but with a low significance. Further radio observations with high quality are needed
to confirm the radio counterpart and explore the properties of this binary system.
Key words: novae, cataclysmic variables — stars: late-type — stars: magnetic field
1 INTRODUCTION
Cataclysmic variables (CVs) are close binaries includ-
ing a white dwarf (WD) primary accreting matter from a
late-type, Roche lobe-filling donor star (Warner 1995a).
One special subclass, representing around 20% of known
CVs, is magnetic CVs (MCVs). Their magnetic field is
strong enough to control at least the inner part of the ac-
cretion flow. MCVs are divided into two classes, namely
polars, where field strength is high enough to lock the
WD rotation to the binary orbit and prevent the formation
of an accretion disk, and intermediate polars (IPs), where
WDs have a weaker magnetic field so that an outer disk
can form (De Martino et al. 2008). Therefore, MCVs are
important objects for understanding accretion processes
in the presence of a strong magnetic field (Schwarz et al.
2009).
The Chandra X-ray Observatory (hereafter referred
to as Chandra) is one of the most successful X-ray
missions to date. With the unprecedented subarcsec-
ond spatial resolution (e.g., 10 times superior to that
of ROSAT HRI) and low sensitivity limit, Chandra pro-
vides a unique view of the X-ray sky 10–100 times
deeper than what was previously possible (Weisskopf
et al. 2000). Chandra observations have also proved to be
powerful in hunting for coherent or quasi-coherent sig-
nals (Esposito et al. 2013a,b). In this paper, we present
a detailed study of one X-ray point source, CXOGSG
J215544.4+380116 (hereafter CXOGSG J2155), the X-
ray periodicity of which was serendipitously discovered
when we reduced and analyzed Chandra archive data
(Wang et al. 2016). We describe time series analysis and
study of the X-ray spectra in Section 2. To examine the
nature of CXOGSG J2155, we collect optical observa-
tions, and obtain spectroscopic observations with the Li-
Jiang 2.4 m telescope. We present optical data analysis
and results in Section 3, and describe the radio observa-
tions in Section 4. A discussion about the nature of the
binary follows in Section 5.
10–2 S. Wang et al.: Magnetic Cataclysmic Variable
2 X-RAY OBSERVATIONS AND DATA ANALYSIS
CXOGSG J2155 was observed serendipitously by
Chandra three times (ObsIDs 3967, 13218 and 12879)
in observations targeting the Seyfert galaxy 3C 438. The
data were acquired with the Advanced CCD Imaging
Spectrometer (ACIS) in Very Faint imaging (Timed
Exposure) mode, with time resolution around 3.2 s. See
Table 1 for a summary of the observations. All these ob-
servations were reprocessed with the Chandra Interactive
Analysis of Observations software (CIAO, version 4.6).
2.1 Counts and Colors
The wavdetect tool is used to detect the source
(Freeman et al. 2002) and derive the 3σ elliptical source
region. The background-subtracted photon counts with
associated error from wavdetect are 161.0±13.0,
154.0±12.7 and 246.0±16.1 for the three observations,
respectively.
The source event lists are extracted from the 3σ ellip-
tical source region. The vignetting corrected count rate in
0.3–8 keV is 3.39, 3.41 and 3.25 ks−1 respectively, so no
significant long-term variability is found. Three energy
bins are employed to define hardness ratio following Di
Stefano & Kong (2003a): soft (S: 0.1–1.1 keV), medium
(M : 1.1–2 keV) and hard (H : 2–7 keV). With the hierar-
chical classification scheme (Di Stefano & Kong 2003b),
CXOGSG J2155 is identified as a hard source in all the
three observations. Table 1 lists the key parameters for
each observation, including ObsID, exposure time, ob-
servation date, off-axis angle, vignetting factor, detection
significance, background-subtracted photon counts with
error, expected background counts in the source region,
X-ray colors and source classification.
2.2 Timing Analysis
The axbary tool is applied to all observations for
barycenter correction. The light curves of CXOGSG
J2155 display notable pulsed emission (Fig. 1), and we
applied two techniques to search for possible periods.
The first is the fast fourier transform (FFT) method. The
fourier power spectrum is computed with the data set of
ObsID 12879, which has the largest count and longest
exposure, and can be used to perform an effective exam-
ination. A possible signal is found in the power spectrum
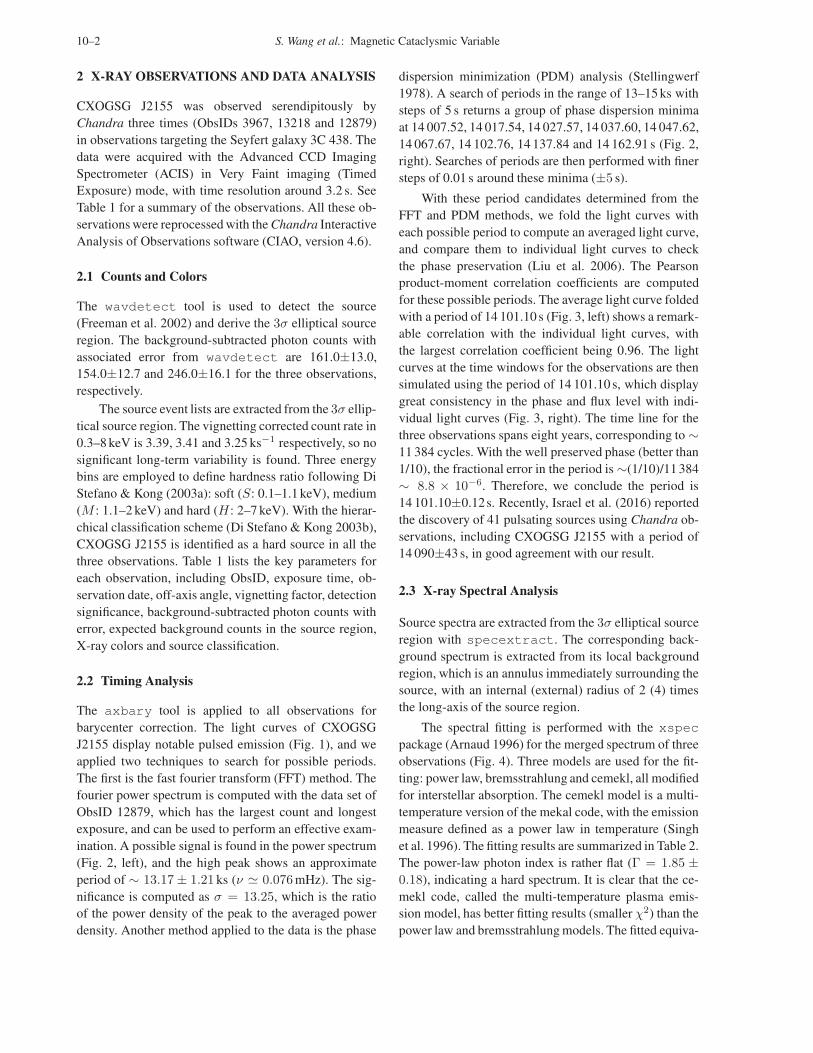
(Fig. 2, left), and the high peak shows an approximate
period of ∼ 13.17 ± 1.21 ks (ν ≃ 0.076 mHz). The sig-
nificance is computed as σ = 13.25, which is the ratio
of the power density of the peak to the averaged power
density. Another method applied to the data is the phase
dispersion minimization (PDM) analysis (Stellingwerf
1978). A search of periods in the range of 13–15 ks with
steps of 5 s returns a group of phase dispersion minima
at 14 007.52, 14 017.54, 14 027.57, 14 037.60, 14 047.62,
14 067.67, 14 102.76, 14 137.84 and 14 162.91 s (Fig. 2,
right). Searches of periods are then performed with finer
steps of 0.01 s around these minima (±5 s).
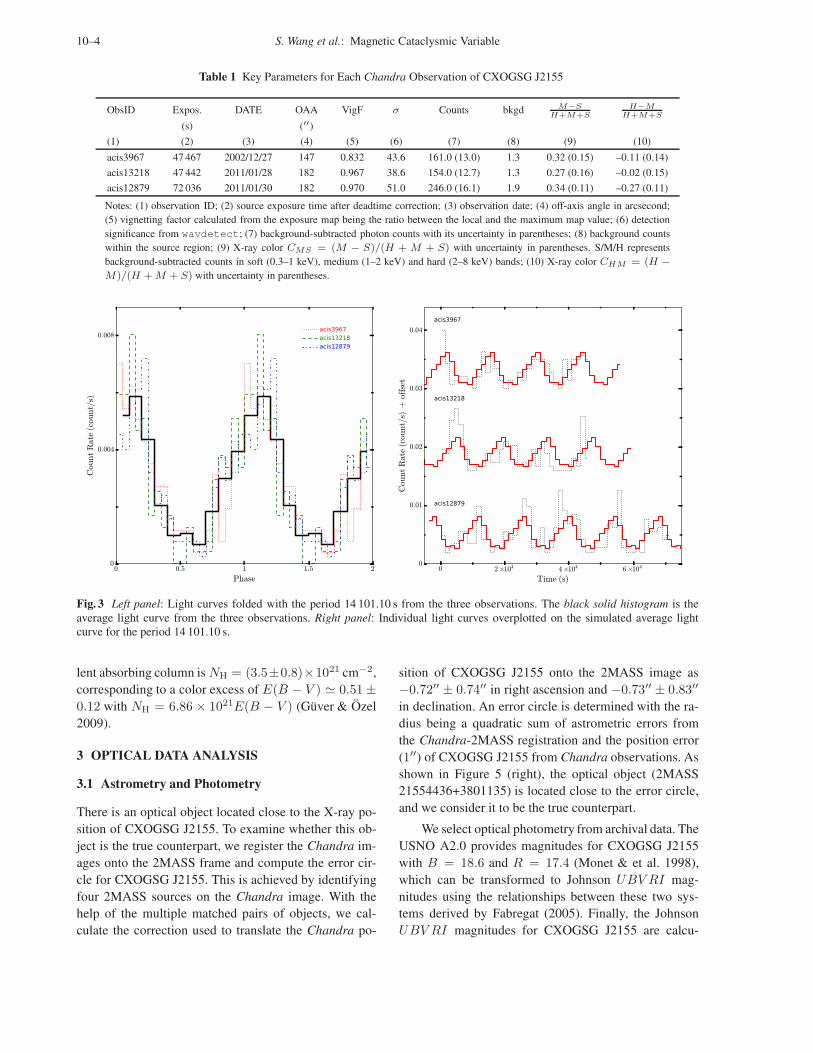
With these period candidates determined from the
FFT and PDM methods, we fold the light curves with
each possible period to compute an averaged light curve,
and compare them to individual light curves to check
the phase preservation (Liu et al. 2006). The Pearson
product-moment correlation coefficients are computed
for these possible periods. The average light curve folded
with a period of 14 101.10 s (Fig. 3, left) shows a remark-
able correlation with the individual light curves, with
the largest correlation coefficient being 0.96. The light
curves at the time windows for the observations are then
simulated using the period of 14 101.10 s, which display
great consistency in the phase and flux level with indi-
vidual light curves (Fig. 3, right). The time line for the
three observations spans eight years, corresponding to ∼
11 384 cycles. With the well preserved phase (better than
1/10), the fractional error in the period is ∼(1/10)/11 384
∼ 8.8 × 10⁻⁶. Therefore, we conclude the period is
14 101.10±0.12s. Recently, Israel et al. (2016) reported
the discovery of 41 pulsating sources using Chandra ob-
servations, including CXOGSG J2155 with a period of
14 090±43 s, in good agreement with our result.
2.3 X-ray Spectral Analysis
Source spectra are extracted from the 3σ elliptical source
region with specextract. The corresponding back-
ground spectrum is extracted from its local background
region, which is an annulus immediately surrounding the
source, with an internal (external) radius of 2 (4) times
the long-axis of the source region.
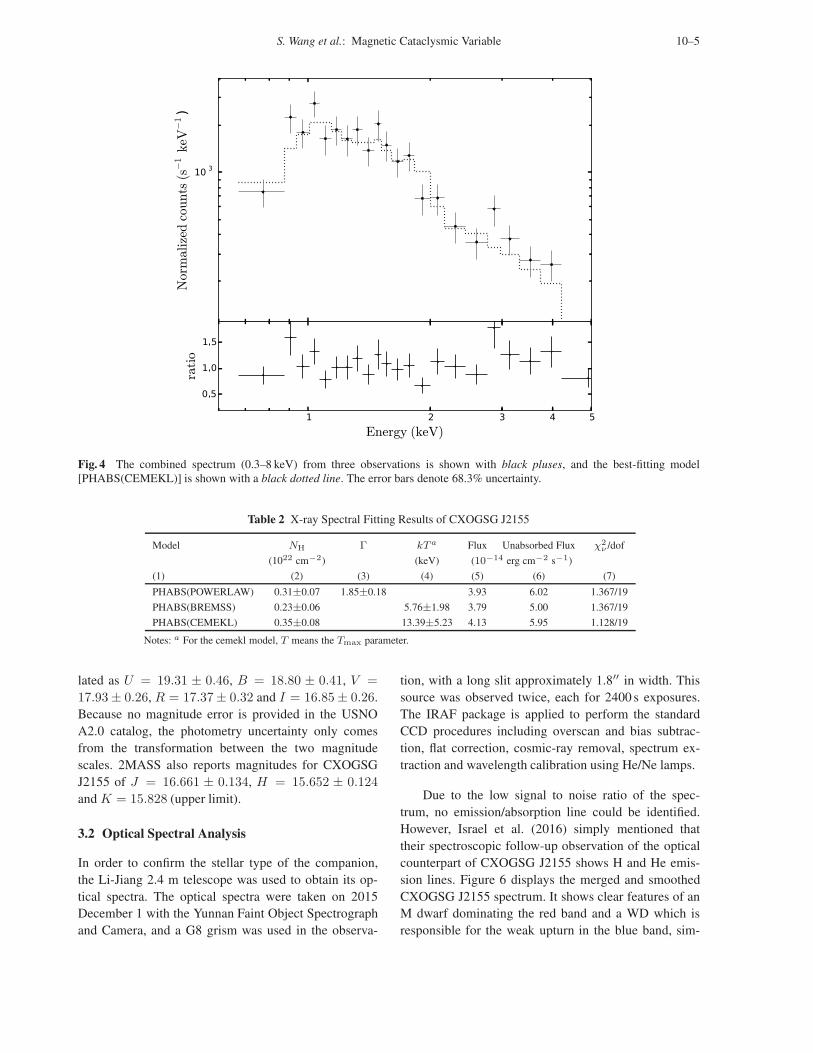
The spectral fitting is performed with the xspec
package (Arnaud 1996) for the merged spectrum of three
observations (Fig. 4). Three models are used for the fit-
ting: power law, bremsstrahlung and cemekl, all modified
for interstellar absorption. The cemekl model is a multi-
temperature version of the mekal code, with the emission
measure defined as a power law in temperature (Singh
et al. 1996). The fitting results are summarized in Table 2.
The power-law photon index is rather flat (Γ = 1.85 ±
0.18), indicating a hard spectrum. It is clear that the ce-
mekl code, called the multi-temperature plasma emis-
sion model, has better fitting results (smaller χ2) than the
power law and bremsstrahlung models. The fitted equiva-
S. Wang et al.: Magnetic Cataclysmic Variable 10–3
Fig. 1 Binned light curve for CXOGSG J2155 in Chandra ACIS observations. The blue and red binned light curves are for all
detected sources and for the total background of S3 chip, respectively, overplotted for comparison, which clearly show that these
eclipses are not caused by detector background or flares but a behavior unique to this source itself.
Fig. 2 Left panel: Power spectrum of CXOGSG J2155 obtained from Chandra ACIS observation (ObsID 12879). A peak at
frequency ν = 1/P ≃ 0.076 mHz (P ≃ 13.17 ± 1.21 ks) can be clearly seen. Right panel: The phase dispersion calculated with
the three Chandra light curves, for the periods from 13 ks to 15 ks, with a step of 5 s. The insert shows several phase dispersion
minima.
10–4 S. Wang et al.: Magnetic Cataclysmic Variable
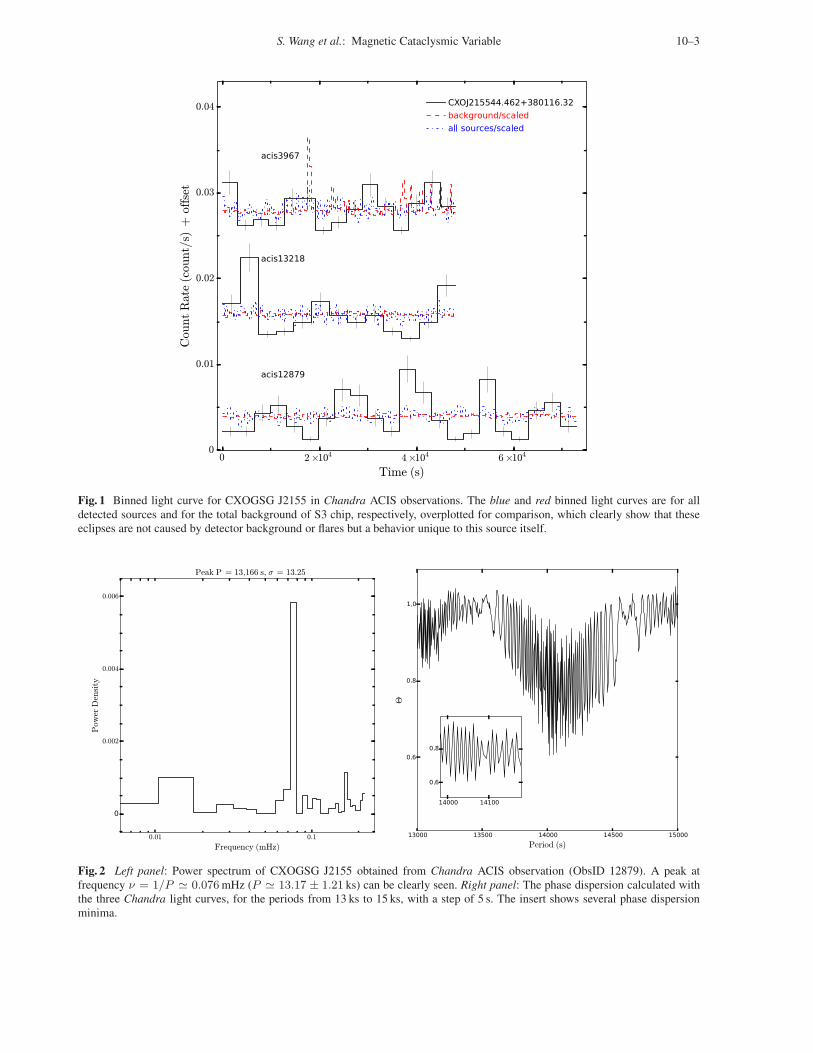
Table 1 Key Parameters for Each Chandra Observation of CXOGSG J2155
ObsID Expos. DATE OAA VigF σ Counts bkgd M−S
H+M+S
H−M
H+M+S
(s) (′′)
(1) (2) (3) (4) (5) (6) (7) (8) (9) (10)
acis3967 47 467 2002/12/27 147 0.832 43.6 161.0 (13.0) 1.3 0.32 (0.15) –0.11 (0.14)
acis13218 47 442 2011/01/28 182 0.967 38.6 154.0 (12.7) 1.3 0.27 (0.16) –0.02 (0.15)
acis12879 72 036 2011/01/30 182 0.970 51.0 246.0 (16.1) 1.9 0.34 (0.11) –0.27 (0.11)
Notes: (1) observation ID; (2) source exposure time after deadtime correction; (3) observation date; (4) off-axis angle in arcsecond;
(5) vignetting factor calculated from the exposure map being the ratio between the local and the maximum map value; (6) detection
significance from wavdetect; (7) background-subtracted photon counts with its uncertainty in parentheses; (8) background counts
within the source region; (9) X-ray color CMS = (M − S)/(H + M + S) with uncertainty in parentheses. S/M/H represents
background-subtracted counts in soft (0.3–1 keV), medium (1–2 keV) and hard (2–8 keV) bands; (10) X-ray color CHM = (H −
M)/(H + M + S) with uncertainty in parentheses.
Fig. 3 Left panel: Light curves folded with the period 14 101.10 s from the three observations. The black solid histogram is the
average light curve from the three observations. Right panel: Individual light curves overplotted on the simulated average light
curve for the period 14 101.10 s.
lent absorbing column is NH = (3.5±0.8)×1021 cm−2,
corresponding to a color excess of E(B − V ) ≃ 0.51 ±
0.12 with NH = 6.86 × 10²¹E(B − V ) (Guver & Ozel
2009).
3 OPTICAL DATA ANALYSIS
3.1 Astrometry and Photometry
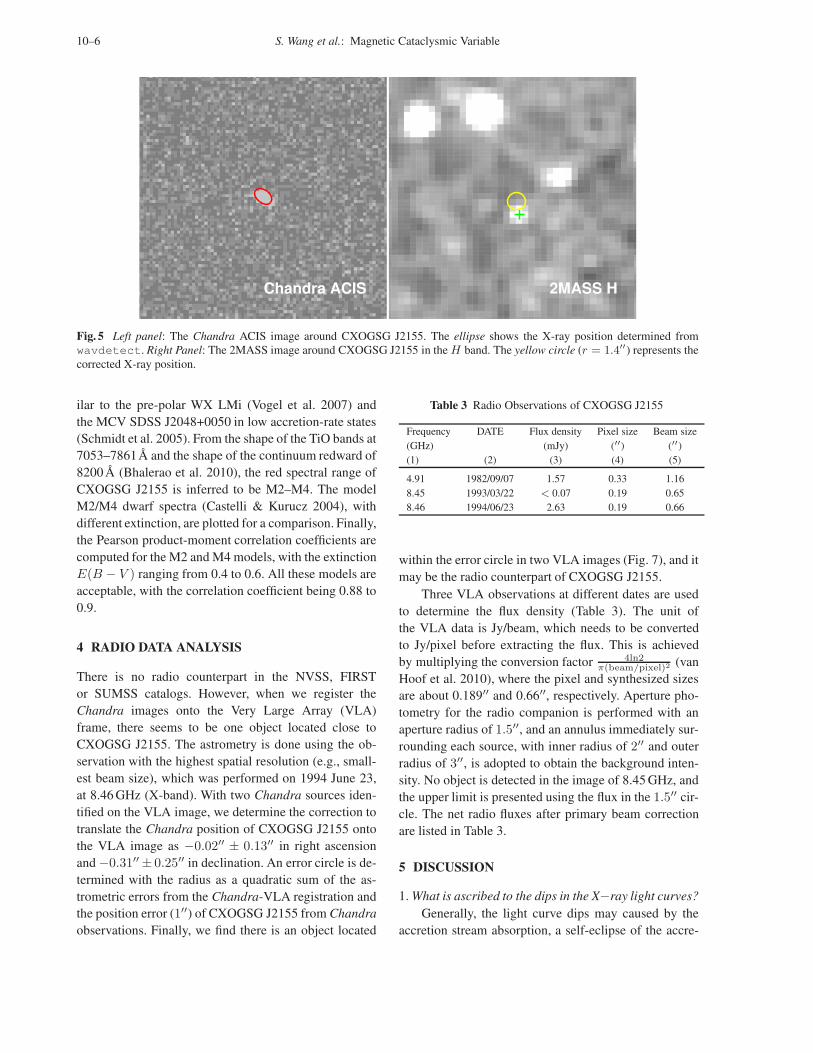
There is an optical object located close to the X-ray po-
sition of CXOGSG J2155. To examine whether this ob-
ject is the true counterpart, we register the Chandra im-
ages onto the 2MASS frame and compute the error cir-
cle for CXOGSG J2155. This is achieved by identifying
four 2MASS sources on the Chandra image. With the
help of the multiple matched pairs of objects, we cal-
culate the correction used to translate the Chandra po-
sition of CXOGSG J2155 onto the 2MASS image as
−0.72′′ ± 0.74′′ in right ascension and −0.73′′ ± 0.83′′
in declination. An error circle is determined with the ra-
dius being a quadratic sum of astrometric errors from
the Chandra-2MASS registration and the position error
(1′′) of CXOGSG J2155 from Chandra observations. As
shown in Figure 5 (right), the optical object (2MASS
21554436+3801135) is located close to the error circle,
and we consider it to be the true counterpart.
We select optical photometry from archival data. The
USNO A2.0 provides magnitudes for CXOGSG J2155
with B = 18.6 and R = 17.4 (Monet & et al. 1998),
which can be transformed to Johnson UBV RI mag-
nitudes using the relationships between these two sys-
tems derived by Fabregat (2005). Finally, the Johnson
UBV RI magnitudes for CXOGSG J2155 are calcu-
S. Wang et al.: Magnetic Cataclysmic Variable 10–5
Fig. 4 The combined spectrum (0.3–8 keV) from three observations is shown with black pluses, and the best-fitting model
[PHABS(CEMEKL)] is shown with a black dotted line. The error bars denote 68.3% uncertainty.
Table 2 X-ray Spectral Fitting Results of CXOGSG J2155
Model NH Γ kT a Flux Unabsorbed Flux χ2ν /dof
(1022 cm−2) (keV) (10−14 erg cm−2 s−1)
(1) (2) (3) (4) (5) (6) (7)
PHABS(POWERLAW) 0.31±0.07 1.85±0.18 3.93 6.02 1.367/19
PHABS(BREMSS) 0.23±0.06 5.76±1.98 3.79 5.00 1.367/19
PHABS(CEMEKL) 0.35±0.08 13.39±5.23 4.13 5.95 1.128/19
Notes: a For the cemekl model, T means the Tmax parameter.
lated as U = 19.31 ± 0.46, B = 18.80 ± 0.41, V =
17.93 ± 0.26, R = 17.37 ± 0.32 and I = 16.85 ± 0.26.
Because no magnitude error is provided in the USNO
A2.0 catalog, the photometry uncertainty only comes
from the transformation between the two magnitude
scales. 2MASS also reports magnitudes for CXOGSG
J2155 of J = 16.661 ± 0.134, H = 15.652 ± 0.124
and K = 15.828 (upper limit).
3.2 Optical Spectral Analysis
In order to confirm the stellar type of the companion,
the Li-Jiang 2.4 m telescope was used to obtain its op-
tical spectra. The optical spectra were taken on 2015
December 1 with the Yunnan Faint Object Spectrograph
and Camera, and a G8 grism was used in the observa-
tion, with a long slit approximately 1.8′′ in width. This
source was observed twice, each for 2400 s exposures.
The IRAF package is applied to perform the standard
CCD procedures including overscan and bias subtrac-
tion, flat correction, cosmic-ray removal, spectrum ex-
traction and wavelength calibration using He/Ne lamps.
Due to the low signal to noise ratio of the spec-
trum, no emission/absorption line could be identified.
However, Israel et al. (2016) simply mentioned that
their spectroscopic follow-up observation of the optical
counterpart of CXOGSG J2155 shows H and He emis-
sion lines. Figure 6 displays the merged and smoothed
CXOGSG J2155 spectrum. It shows clear features of an
M dwarf dominating the red band and a WD which is
responsible for the weak upturn in the blue band, sim-
10–6 S. Wang et al.: Magnetic Cataclysmic Variable
Fig. 5 Left panel: The Chandra ACIS image around CXOGSG J2155. The ellipse shows the X-ray position determined from
wavdetect. Right Panel: The 2MASS image around CXOGSG J2155 in the H band. The yellow circle (r = 1.4′′) represents the
corrected X-ray position.
ilar to the pre-polar WX LMi (Vogel et al. 2007) and
the MCV SDSS J2048+0050 in low accretion-rate states
(Schmidt et al. 2005). From the shape of the TiO bands at
7053–7861A and the shape of the continuum redward of
8200 A (Bhalerao et al. 2010), the red spectral range of
CXOGSG J2155 is inferred to be M2–M4. The model
M2/M4 dwarf spectra (Castelli & Kurucz 2004), with
different extinction, are plotted for a comparison. Finally,
the Pearson product-moment correlation coefficients are
computed for the M2 and M4 models, with the extinction
E(B − V ) ranging from 0.4 to 0.6. All these models are
acceptable, with the correlation coefficient being 0.88 to
0.9.
4 RADIO DATA ANALYSIS
There is no radio counterpart in the NVSS, FIRST
or SUMSS catalogs. However, when we register the
Chandra images onto the Very Large Array (VLA)
frame, there seems to be one object located close to
CXOGSG J2155. The astrometry is done using the ob-
servation with the highest spatial resolution (e.g., small-
est beam size), which was performed on 1994 June 23,
at 8.46 GHz (X-band). With two Chandra sources iden-
tified on the VLA image, we determine the correction to
translate the Chandra position of CXOGSG J2155 onto
the VLA image as −0.02′′ ± 0.13′′ in right ascension
and −0.31′′± 0.25′′ in declination. An error circle is de-
termined with the radius as a quadratic sum of the as-
trometric errors from the Chandra-VLA registration and
the position error (1′′) of CXOGSG J2155 from Chandra
observations. Finally, we find there is an object located
Table 3 Radio Observations of CXOGSG J2155
Frequency DATE Flux density Pixel size Beam size
(GHz) (mJy) (′′) (′′)
(1) (2) (3) (4) (5)
4.91 1982/09/07 1.57 0.33 1.16
8.45 1993/03/22 < 0.07 0.19 0.65
8.46 1994/06/23 2.63 0.19 0.66
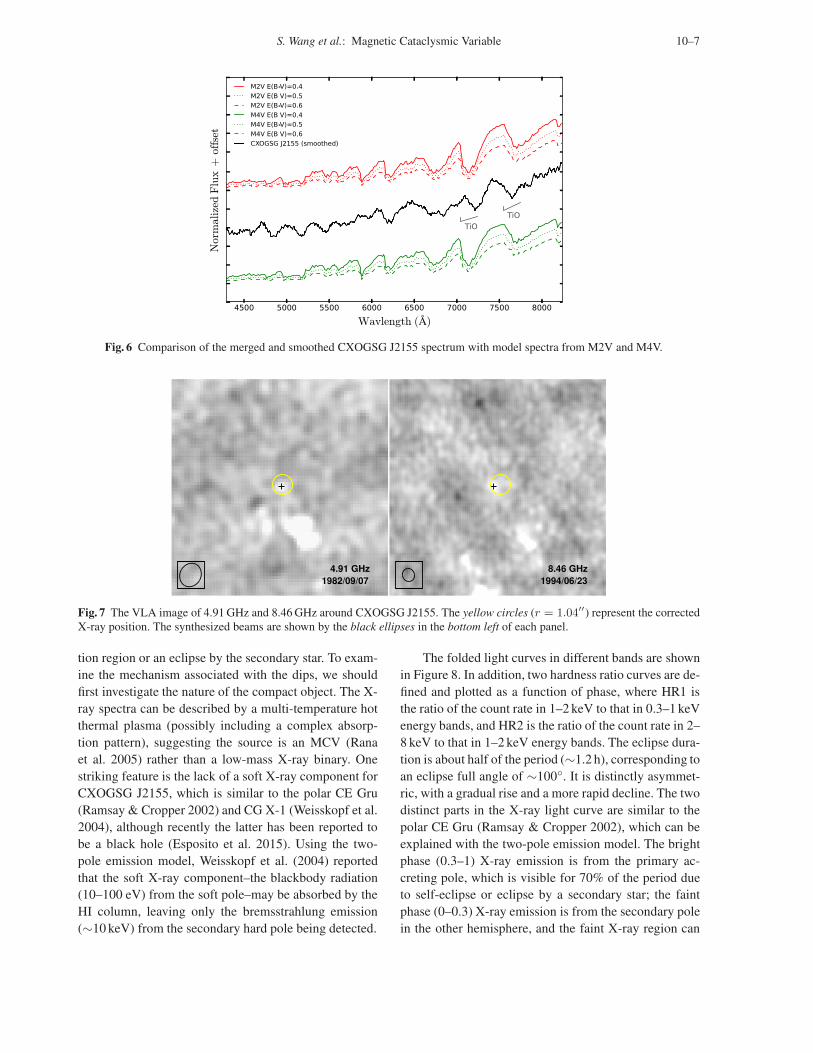
within the error circle in two VLA images (Fig. 7), and it
may be the radio counterpart of CXOGSG J2155.
Three VLA observations at different dates are used
to determine the flux density (Table 3). The unit of
the VLA data is Jy/beam, which needs to be converted
to Jy/pixel before extracting the flux. This is achieved
by multiplying the conversion factor 4ln2π(beam/pixel)2 (van
Hoof et al. 2010), where the pixel and synthesized sizes
are about 0.189′′ and 0.66′′, respectively. Aperture pho-
tometry for the radio companion is performed with an
aperture radius of 1.5′′, and an annulus immediately sur-
rounding each source, with inner radius of 2′′ and outer
radius of 3′′, is adopted to obtain the background inten-
sity. No object is detected in the image of 8.45 GHz, and
the upper limit is presented using the flux in the 1.5′′ cir-
cle. The net radio fluxes after primary beam correction
are listed in Table 3.
5 DISCUSSION
1. What is ascribed to the dips in the X−ray light curves?
Generally, the light curve dips may caused by the
accretion stream absorption, a self-eclipse of the accre-
S. Wang et al.: Magnetic Cataclysmic Variable 10–7
Fig. 6 Comparison of the merged and smoothed CXOGSG J2155 spectrum with model spectra from M2V and M4V.
Fig. 7 The VLA image of 4.91 GHz and 8.46 GHz around CXOGSG J2155. The yellow circles (r = 1.04′′) represent the corrected
X-ray position. The synthesized beams are shown by the black ellipses in the bottom left of each panel.
tion region or an eclipse by the secondary star. To exam-
ine the mechanism associated with the dips, we should
first investigate the nature of the compact object. The X-
ray spectra can be described by a multi-temperature hot
thermal plasma (possibly including a complex absorp-
tion pattern), suggesting the source is an MCV (Rana
et al. 2005) rather than a low-mass X-ray binary. One
striking feature is the lack of a soft X-ray component for
CXOGSG J2155, which is similar to the polar CE Gru
(Ramsay & Cropper 2002) and CG X-1 (Weisskopf et al.
2004), although recently the latter has been reported to
be a black hole (Esposito et al. 2015). Using the two-
pole emission model, Weisskopf et al. (2004) reported
that the soft X-ray component–the blackbody radiation
(10–100 eV) from the soft pole–may be absorbed by the
HI column, leaving only the bremsstrahlung emission
(∼10 keV) from the secondary hard pole being detected.
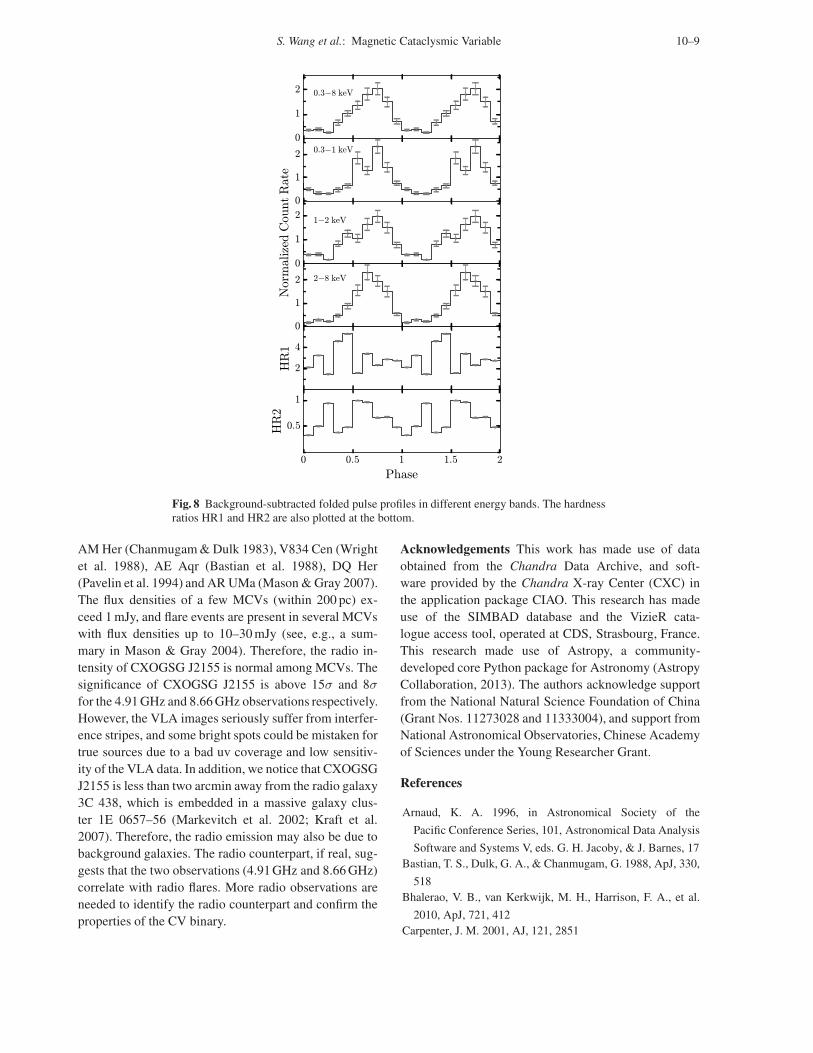
The folded light curves in different bands are shown
in Figure 8. In addition, two hardness ratio curves are de-
fined and plotted as a function of phase, where HR1 is
the ratio of the count rate in 1–2 keV to that in 0.3–1 keV
energy bands, and HR2 is the ratio of the count rate in 2–
8 keV to that in 1–2 keV energy bands. The eclipse dura-
tion is about half of the period (∼1.2 h), corresponding to
an eclipse full angle of ∼100◦. It is distinctly asymmet-
ric, with a gradual rise and a more rapid decline. The two
distinct parts in the X-ray light curve are similar to the
polar CE Gru (Ramsay & Cropper 2002), which can be
explained with the two-pole emission model. The bright
phase (0.3–1) X-ray emission is from the primary ac-
creting pole, which is visible for 70% of the period due
to self-eclipse or eclipse by a secondary star; the faint
phase (0–0.3) X-ray emission is from the secondary pole
in the other hemisphere, and the faint X-ray region can

10–8 S. Wang et al.: Magnetic Cataclysmic Variable
be seen for all the phase. There seems to be one addi-
tional dip in the bright phase of the soft/medium band,
which is characteristic of photoelectric absorption and
has been seen in both polars (Watson et al. 1989) and IPs
(de Martino et al. 2001, 2004). The ballistic stream or
the stream to the secondary faint pole may cross our line
of sight to the primary magnetic pole, thereby absorb-
ing the soft/medium X-rays and causing the additional
dip (Ramsay & Cropper 2002). This is not surprising,
because these more extended, cooler parts of the accre-
tion region, detected in the soft/medium band, are more
likely to be absorbed, while the harder emission region
may only be absorbed by the dense core of the accretion
stream (Traulsen et al. 2014).
2. What are the properties of the binaries?
The period of 14.1 ks discovered in the X-ray light
curve should be the orbital period, which means the bi-
nary system is located above the 2–3 hour so-called “or-
bital period gap.” Many previous studies have reported
a relation between the orbital period and the mass/radius
of the secondary star. Warner (1995b) derived the follow-
ing semi-empirical relations of M2 = 0.065P5/4hr M⊙
and R2 = 0.094P13/12hr R⊙. Smith & Dhillon (1998)
obtained new relations using a carefully selected sample
of CVs with well-measured system parameters: M2 =
(0.038 ± 0.003)P 1.58±0.09hr M⊙ and R2 = (0.081 ±
0.019)P 1.18±0.04hr R⊙. Frank et al. (2002) also presented
the period-mass relation M2∼= 0.11Phr M⊙ and the
period-radius relation R2∼= 7.9 × 10⁹Phr cm for the
donor star. Using these relations, we can get an ap-
propriate estimation of the mass and radius of the sec-
ondary, M2 ≃ 0.36/0.33+0.07−0.06/0.43 M⊙ and R2 ≃
0.41/0.41+0.12−0.11/0.45 R⊙ respectively, corresponding to
an M2-M3 dwarf. The H and He emission features in the
optical spectra (Israel et al. 2016) further lead to the con-
clusion that CXOGSG J2155 is an MCV.
Recently, Knigge et al. (2011) reconstructed the
complete evolutionary path of CVs and presented a full
range of binary and donor properties. With the assump-
tion that the period 14 101.10 s is due to the orbit, we
determine the binary properties from these revised (opti-
mal) CV evolution models in Knigge et al. (2011). This
leads to a binary system with a separation of 1.282 R⊙,
containing a 0.313 M⊙ (M3.5 type) secondary when as-
suming a 0.75 M⊙ WD. The physical properties for the
secondary are R = 0.389 R⊙, Teff = 3443 K, log g
= 4.754 cm2 s−1 and M = 10−8.872 M⊙ yr−1 (mass
loss rate). The spectral type of the secondary is in good
agreement with the conclusion from the optical spectrum
(Sect. 3.2).
Knigge et al. (2011) listed model optical magnitudes
of the secondary, including BV RI magnitudes on the
Johnson-Cousins system and JHKS on the CIT system,
which can be transformed back to the 2MASS system
using the equations given by Carpenter (2001). Based
on these absolute JHKS magnitudes, which are only
from the secondary and not affected by the primary, the
photometric distance is calculated as 64.2+2.44−2.27 pc, and
the extinction is calculated as E(B − V ) = 0.42+0.118−0.117.
This extinction is higher than the absorption by Galactic
HI column density (Kalberla et al. 2005) in this direc-
tion (NH = 1.65 × 1021 cm−2; E(B − V ) = 0.24),
indicating an amount of internal absorption in the bi-
nary system. The distance can be applied to obtain the
X-ray luminosity as LX = 2π fCEMEKLD2≃ 1.5 ×
1028 erg s−1. Assuming this X-ray luminosity is entirely
due to accretion, the accretion rate can be estimated from
LX = GMWDmRWD
. Adopting the model parameters for the
WD MWD = 0.75 M⊙ and RWD = 7.842 × 108 cm
(Knigge et al. 2011), we obtain an accretion rate of 1.9×
10−15 M⊙ yr−1. The low X-ray luminosity and accretion
rate may suggest CXOGSG J2155 is a low-accretion-rate
polar (LARP; Schwope et al. 2002a; Ramsay et al. 2004),
such as DP Leo (LX ≃ 2.5 × 1029 erg s−1; Schwope
et al. 2002b), WX LMi (m ∼ 1.5 × 10⁻¹³ M⊙ yr−1;
Vogel et al. 2007), EF Eri (LX ≃ 2 × 1029 erg s−1;
Schwope et al. 2007) and HU Aqu (LX ≃ 4.7 ×
1028 erg s−1; Schwarz et al. 2009), which is likely the
progenitor of one polar (Schmidt et al. 2005; Webbink &
Wickramasinghe 2005; Kafka et al. 2010).
It seems that there is a significant discrepancy be-
tween the mass-loss rate of the secondary and the mass-
accretion rate of the primary. However, the mass-loss
rate estimated by Knigge et al. (2011) is relevant to long
timescales, and it may not be applicable to some types
of variations occurring on short timescales, such as the
low states of strongly magnetic polars with timescales
of weeks to years (e.g., Hessman et al. 2000; Kafka &
Honeycutt 2005; Knigge et al. 2011). On the other hand,
for an LARP, the secondary is considered to be under-
filling its Roche lobe and the primary is accreting from
the stellar wind of the secondary (Schwope et al. 2002a;
Vogel et al. 2011). That explains why LARPs are in a
permanent low state and implies that the wind mass-loss
rate of the secondary might actually be of the same order
as the mass-accretion rate.
3. Whether the radio counterpart is true?
Surveys of non-magnetic CVs (Cordova et al. 1983;
Fuerst et al. 1986) suggest that they are not radio emit-
ters except in an outburst. However, a number of MCVs
have been confirmed as significant radio emitters, such as
S. Wang et al.: Magnetic Cataclysmic Variable 10–9
Fig. 8 Background-subtracted folded pulse profiles in different energy bands. The hardness
ratios HR1 and HR2 are also plotted at the bottom.
AM Her (Chanmugam & Dulk 1983), V834 Cen (Wright
et al. 1988), AE Aqr (Bastian et al. 1988), DQ Her
(Pavelin et al. 1994) and AR UMa (Mason & Gray 2007).
The flux densities of a few MCVs (within 200 pc) ex-
ceed 1 mJy, and flare events are present in several MCVs
with flux densities up to 10–30 mJy (see, e.g., a sum-
mary in Mason & Gray 2004). Therefore, the radio in-
tensity of CXOGSG J2155 is normal among MCVs. The
significance of CXOGSG J2155 is above 15σ and 8σ
for the 4.91 GHz and 8.66 GHz observations respectively.
However, the VLA images seriously suffer from interfer-
ence stripes, and some bright spots could be mistaken for
true sources due to a bad uv coverage and low sensitiv-
ity of the VLA data. In addition, we notice that CXOGSG
J2155 is less than two arcmin away from the radio galaxy
3C 438, which is embedded in a massive galaxy clus-
ter 1E 0657–56 (Markevitch et al. 2002; Kraft et al.
2007). Therefore, the radio emission may also be due to
background galaxies. The radio counterpart, if real, sug-
gests that the two observations (4.91 GHz and 8.66 GHz)
correlate with radio flares. More radio observations are
needed to identify the radio counterpart and confirm the
properties of the CV binary.
Acknowledgements This work has made use of data
obtained from the Chandra Data Archive, and soft-
ware provided by the Chandra X-ray Center (CXC) in
the application package CIAO. This research has made
use of the SIMBAD database and the VizieR cata-
logue access tool, operated at CDS, Strasbourg, France.
This research made use of Astropy, a community-
developed core Python package for Astronomy (Astropy
Collaboration, 2013). The authors acknowledge support
from the National Natural Science Foundation of China
(Grant Nos. 11273028 and 11333004), and support from
National Astronomical Observatories, Chinese Academy
of Sciences under the Young Researcher Grant.
References
Arnaud, K. A. 1996, in Astronomical Society of the
Pacific Conference Series, 101, Astronomical Data Analysis
Software and Systems V, eds. G. H. Jacoby, & J. Barnes, 17
Bastian, T. S., Dulk, G. A., & Chanmugam, G. 1988, ApJ, 330,
518
Bhalerao, V. B., van Kerkwijk, M. H., Harrison, F. A., et al.
2010, ApJ, 721, 412
Carpenter, J. M. 2001, AJ, 121, 2851

10–10 S. Wang et al.: Magnetic Cataclysmic Variable
Castelli, F., & Kurucz, R. L. 2004, astro-ph/0405087
Chanmugam, G., & Dulk, G. A. 1983, in Astrophysics and
Space Science Library, 101, IAU Colloq. 72: Cataclysmic
Variables and Related Objects, eds. M. Livio, & G. Shaviv,
223
Cordova, F. A., Hjellming, R. M., & Mason, K. O. 1983, PASP,
95, 69
de Martino, D., Matt, G., Mukai, K., et al. 2001, A&A, 377,
499
de Martino, D., Matt, G., Belloni, T., Haberl, F., & Mukai, K.
2004, A&A, 415, 1009
De Martino, D., Matt, G., Mukai, K., et al. 2008,
Mem. Soc. Astron. Italiana, 79, 246
Di Stefano, R., & Kong, A. K. H. 2003a, ApJ, 592, 884
Di Stefano, R., & Kong, A. K. H. 2003b, astro-ph/0311374
Esposito, P., Israel, G. L., Sidoli, L., et al. 2013a, MNRAS,
436, 3380
Esposito, P., Israel, G. L., Sidoli, L., et al. 2013b, MNRAS,
433, 2028
Esposito, P., Israel, G. L., Milisavljevic, D., et al. 2015,
MNRAS, 452, 1112
Fabregat 2005, 8th CoRoT Week Workshop, Toulouse, France,
http://corot-be.obspm.fr/doc/fabregat cw8.pdf
Frank, J., King, A., & Raine, D. J. 2002, Accretion Power
in Astrophysics: Third Edition (Cambridge: Cambridge
University Press), 398
Freeman, P. E., Kashyap, V., Rosner, R., & Lamb, D. Q. 2002,
ApJS, 138, 185
Fuerst, E., Benz, A., Hirth, W., Kiplinger, A., & Geffert, M.
1986, A&A, 154, 377
Guver, T., & Ozel, F. 2009, MNRAS, 400, 2050
Hessman, F. V., Gansicke, B. T., & Mattei, J. A. 2000, A&A,
361, 952
Israel, G. L., Esposito, P., Rodrıguez Castillo, G. A., & Sidoli,
L. 2016, MNRAS, 462, 4371
Kafka, S., & Honeycutt, R. K. 2005, AJ, 130, 742
Kafka, S., Tappert, C., & Honeycutt, R. K. 2010, MNRAS, 403,
755
Kalberla, P. M. W., Burton, W. B., Hartmann, D., et al. 2005,
A&A, 440, 775
Knigge, C., Baraffe, I., & Patterson, J. 2011, ApJS, 194, 28
Kraft, R. P., Forman, W. R., Hardcastle, M. J., Jones, C., &
Nulsen, P. E. J. 2007, ApJ, 664, L83
Liu, J., Di Stefano, R., McClintock, J., et al. 2006, ApJ, 653,
602
Markevitch, M., Gonzalez, A. H., David, L., et al. 2002, ApJ,
567, L27
Mason, P. A., & Gray, C. 2004, in Astronomical Society of the
Pacific Conference Series, 315, IAU Colloq. 190: Magnetic
Cataclysmic Variables, eds. S. Vrielmann, & M. Cropper,
237
Mason, P. A., & Gray, C. L. 2007, ApJ, 660, 662
Monet, D., & et al. 1998, VizieR Online Data Catalog, 1252
Pavelin, P. E., Spencer, R. E., & Davis, R. J. 1994, MNRAS,
269, 779
Ramsay, G., & Cropper, M. 2002, MNRAS, 335, 918
Ramsay, G., Cropper, M., Wu, K., et al. 2004, MNRAS, 350,
1373
Rana, V. R., Singh, K. P., Barrett, P. E., & Buckley, D. A. H.
2005, ApJ, 625, 351
Schmidt, G. D., Szkody, P., Vanlandingham, K. M., et al. 2005,
ApJ, 630, 1037
Schwarz, R., Schwope, A. D., Vogel, J., et al. 2009, A&A, 496,
833
Schwope, A. D., Brunner, H., Hambaryan, V., & Schwarz, R.
2002a, in Astronomical Society of the Pacific Conference
Series, 261, The Physics of Cataclysmic Variables and
Related Objects, eds. B. T. Gansicke, K. Beuermann, &
K. Reinsch, 102
Schwope, A. D., Hambaryan, V., Schwarz, R., Kanbach, G., &
Gansicke, B. T. 2002b, A&A, 392, 541
Schwope, A. D., Staude, A., Koester, D., & Vogel, J. 2007,
A&A, 469, 1027
Singh, K. P., White, N. E., & Drake, S. A. 1996, ApJ, 456, 766
Smith, D. A., & Dhillon, V. S. 1998, MNRAS, 301, 767
Stellingwerf, R. F. 1978, ApJ, 224, 953
Traulsen, I., Reinsch, K., Schwope, A. D., et al. 2014, A&A,
562, A42
van Hoof, P. A. M., van de Steene, G. C., Barlow, M. J., et al.
2010, A&A, 518, L137
Vogel, J., Schwope, A. D., & Gansicke, B. T. 2007, A&A, 464,
647
Vogel, J., Schwope, A. D., & Schwarz, R. 2011, A&A, 530,
A117
Wang, S., Liu, J., Qiu, Y., et al. 2016, ApJS, 224, 40
Warner, B. 1995a, Cataclysmic Variable Stars, 28 (Cambridge:
Cambridge University Press)
Warner, B. 1995b, Ap&SS, 232, 89
Watson, M. G., King, A. R., Jones, M. H., & Motch, C. 1989,
MNRAS, 237, 299
Webbink, R. F., & Wickramasinghe, D. T. 2005, in
Astronomical Society of the Pacific Conference Series, 330,
The Astrophysics of Cataclysmic Variables and Related
Objects, eds. J.-M. Hameury, & J.-P. Lasota, 137
Weisskopf, M. C., Tananbaum, H. D., Van Speybroeck, L. P.,
& O’Dell, S. L. 2000, in Proc. SPIE, 4012, X-Ray Optics,
Instruments, and Missions III, eds. J. E. Truemper, &
B. Aschenbach, 2
Weisskopf, M. C., Wu, K., Tennant, A. F., Swartz, D. A., &
Ghosh, K. K. 2004, ApJ, 605, 360
Wright, A. E., Stewart, R. T., Nelson, G. J., Slee, O. B., &
Cropper, M. 1988, MNRAS, 231, 319