Embed Size (px)
Citation preview

433
© 2018 AESS Publications. All Rights Reserved.
AN INVESTIGATION INTO THE RELATIONSHIP BETWEEN DEGREE OF FINANCIAL LEVERAGE AND FINANCIAL RISK OF FIRMS: A COMPARATIVE STUDY BETWEEN LISTED MNCS AND DOMESTIC COMPANIES OF BANGLADESH
Syed Mohammad Khaled Rahman1
Mohammad Ashraful Ferdous Chowdhury2+
Khan Md. Mohiuddin3
1Associate Professor, Department of Business Administration, Shahjalal University of Science & Technology, Sylhet, Bangladesh
2Assistant Professor, Department of Business Administration, Shahjalal University of Science & Technology, Sylhet, Bangladesh
3Assistant Professor, Army Institute of Business Administration Sylhet, Bangladesh
(+ Corresponding author)
ABSTRACT Article History Received: 10 January 2018 Revised: 2 March 2018 Accepted: 5 March 2018 Published: 7 March 2018
Keywords Financial leverage Financial risk Financing cost Correlation Domestic Multinational.
JEL Classification: G30, G32.
Financial leverage can be defined as the degree to which a company uses debt financing rather than equity financing to magnify earnings of shareholders. It not only can boost a company's returns, but also it increases financial risk. The main objective of the study is to analyze the relationship between degree of financial leverage and financial risk of DSE-listed MNCs & domestic companies of Bangladesh over a 20-year period (1996-2015). The study was based on secondary data. Seven companies from each of the two populations (MNCs and domestic companies) were selected as sample from six industrial sectors. Measures of financial risk are coefficient of variation and mean absolute deviation of EPS to EBIT [FLR (CV) & FLR (MAD)]. Three measures of degree of financial leverage was used; capital structure [DFL (CS)], financing cost structure [DFL(FS)] and general measure [DFL(Gen)]. It was found that average FLR (CV) and FLR (MAD) of domestic companies were 0.804 and 0.832 respectively and that of MNCs were 0.530 and 0.607 respectively. DFLs of domestic companies are higher than that of MNCs in all three measures of DFL in all the years. In case of domestic companies, none of the correlation coefficient between DFL and FLR is significant at 5% significance level. In case of MNCs, correlation coefficient between DFL (FS) and FLR is significant at 5% level. MNCs show comparatively stronger positive relationship between DFL (FS) and FLR as well as between DFL (Gen.) and FLR. On the other hand, domestic companies show comparatively stronger positive relationship between DFL (CS) and FLR. Both types of firms have very less amount of debt in their capital structure which results in less financial risk. Considering the profitability, both types of firms are capable to raise more debt capital to gain financial leverage advantage and to reduce cost of financing.
Contribution/ Originality: This study contributes in the existing literature of capital structure and financial
risk. It uses new estimation methodology to measure degree of financial leverage in terms of capital structure and
financing cost structure. This study is one of very few studies which have investigated co movement of financial
leverage and leverage risk in case of listed manufacturing firms operating in Bangladesh.
Asian Economic and Financial Review ISSN(e): 2222-6737 ISSN(p): 2305-2147 DOI: 10.18488/journal.aefr.2018.83.433.448 Vol. 8, No. 3, 433-448 © 2018 AESS Publications. All Rights Reserved. URL: www.aessweb.com
Asian Economic and Financial Review, 2018, 8(3): 433-448
434
© 2018 AESS Publications. All Rights Reserved.
1. INTRODUCTION
The literal meaning of the term “risk” is the exposure to the possibility of loss, injury, or other adverse or
unwelcome circumstance; a chance or situation involving such a possibility. Financial risk of a firm arises due to
inability to fulfill short term and long term financial obligations. When a firm raises debt capital through
borrowings then payment of interest as well as principal becomes mandatory after a certain period of time
irrespective of financial performance of that firm. So, it can be said that raising debt capital increases financial
riskiness of a firm. In this paper, financial risks of companies are measured by change of EPS with respect to EBIT.
2. STATEMENT OF THE PROBLEM
Financial leverage increases the chance or probability of insolvency. Due to insolvency a levered firm can
legally be forced into liquidation for non-payment of interest charges. According to Pandey (2014) if the insolvency
proceedings actually follow, the levered firm will have to incur costs in the form of liquidation fees and other legal
expenses. If a firm is not liquidated, it may be re-organized. During the re-organization period, its earnings will be
reduced because of the additional costs and reduced sales volume due to the adverse effect on the firm‟s goodwill. If
liquidation becomes unavoidable, the additional costs incurred would result in a decline in the net value of the firm‟s
assets available to the shareholders after the creditors‟ claims have been satisfied. Leverage has both benefits and
costs and it is not an unmixed blessing. As a company increases debt and preferred equities, interest payments
increase, reducing EPS if return on investment does not cover cost of debt. As a result, risk to stockholder return is
increased and they demand a higher expected return for assuming this additional risk, which in turn, raises a
company's costs.
3. LITERATURE REVIEW
Financial leverage increases the chance or probability of insolvency. Due to insolvency a levered firm can
legally be forced into liquidation for non-payment of interest charges. According to Brigham and Michael (2005)
financial risk is the added risk placed on shareholders as a result of financing with borrowed capital. According to
Brealey and Stewart (1984) financial leverage increases risk because it makes the return realized by the investor
more sensitive to any event affecting the performance of the stock. In particular, it makes the realized return more
sensitive to market risks. Financial leverage magnifies the shareholders‟ earnings. The inconsistency of EBIT
causes EPS to oscillate within wider ranges with debt in the capital composition.
Solomon and Muntean (2012) have conducted research on assessment of financial Risk. According to them,
exceedingly low level of debt and lesser value of financial liabilities inferior to own equity make companies not risky
in terms of financial solvency. Using borrowed fund should be made with concern in order not to limit the financial
freedom of firms and reduce further debt opportunities in times of crisis. The aim of the study of Alaghi (2011) was
to analyze the effect of financial leverage on the systematic risk of listed companies in Tehran Stock Exchange.
According to the results obtained, financial leverage has influence on the systematic risk of listed companies. Bhatt
and Jahangir (2012) in their study found that the leverage risk factor performs consistently across different
categories of companies and its impact is more obvious during the recent financial crunch. Effects of leverage risk
are robust to heterogeneity of the firms in the sample. The leverage risk has immense contribution to asset pricing.
The findings indicated that leverage based risk factor can explain a considerable portion of the cross-section of
stock returns.
Gunarathna (2016) in his study examined how debt financing influence financial risk based on the data
collected over ten years (2006-2015) about 15 listed firms in the Colombo Stock Exchange of Sri Lanka. The
findings revealed that financial leverage positively correlated with financial risk. It implies that firms having a
higher financial risk can avoid their risk by varying the capital structure. Ufo (2015) has conducted a research to
study the relationship between leverage and manufacturing firms‟ financial distress in Ethiopia from 1999-2005. It

Asian Economic and Financial Review, 2018, 8(3): 433-448
435
© 2018 AESS Publications. All Rights Reserved.
was found that leverage has negative and significant influence on financial distress. Curtailing the bank borrowings
by equity financing, expediting cash collection and decreasing bad debt expenses are remedy for short term cash
problem. Maia (2010) in her study investigated the potential explanations for the flatness relation between financial
leverage and expected equity returns. She found that low leverage firms have lower cash-flow beta and higher
discount-rate beta than firms with high leverage. Financial distress risk seems to be captured by the sensitivity of
firms' cash flow innovations to market discount rate news.
Aydemir et al. (2007) quantified the impact of financial leverage on stock return volatility in a general
equilibrium economy with debt and equity claims. Findings showed that at the market level, financial leverage has
insignificant impact on the dynamics of stock return instability but for a small firm, it contributes more to the
dynamics of stock return volatility. Yoon and SooCheong (2005) presented an empirical insight into the relationship
between return on equity, financial leverage and size of firms in the restaurant industry for the period 1998 to 2003.
Results suggested that in spite of having lower financial leverage, smaller restaurant firms were considerably more
risky than larger firms. Circiumaru (2011) carried out a survey on several companies listed on Bucharest Stock
Exchange to evaluate traditional and new measures of financial risk. Result showed that turnover, operating profit
and net profit are oscillating for Romanian companies, which affects the ability of traditional instruments to
accurate asses the financial risk. Hussan (2016) conducted a study to find out the impact of leverage on risk of
companies‟ in Bangladesh. He found that there is a positive and significant relationship between leverage and risk
(financial) of a company. Akbari and Mohammadi (2013) conducted a research on Tehran Stock Market listed
firmsto determine if there is any significant relationship between leverage ratios as independent variables and
Systematic risk (Beta) as dependent variables. The results of the study revealed that there is not significant
relationship between the variables.
4. THEORETICAL FRAMEWORK
4.1. Measurement of Financial Leverage Risk (FLR)
For a given degree of variability of EBIT, the variability of EPS and ROE increases with more financial
leverage. The variability of EPS caused by the use of financial leverage is called financial risk. Variability of EPS
and EBIT are measured to determine Financial Leverage Risk (FLR). According to Sinha (2013) the „risk‟ which
may be said to be associated with financing leverage of a corporate firm may be termed as “Financing Leverage
Risk” (FLR) and based on the „stand-alone risk (or total risk) framework‟. He also stated that Financial Leverage
Risk (FLR) can be measured by ratio of coefficient of variation (CV) of EPS to EBIT. It can also be measured by
ratio of mean absolute deviation (MAD) to expected values of EPS and EBIT. Detailed calculation is presented
below:
(i) Ratio of the “Coefficient of Variation” (CV) of EPS to EBIT
(ii) Ratio of “Mean Absolute Deviation” (MAD) to the expected value of EPS and EBIT

Asian Economic and Financial Review, 2018, 8(3): 433-448
436
© 2018 AESS Publications. All Rights Reserved.
MAD (EBIT) = E (| EBITj– E ( EBIT ) |) = E (| ∆ EBITj |)
MAD (EPS) = E (| EPSj– E (EPS)|) = E (| ∆ EPSj |)
4.2. Measurement of Degree of Financial Leverage (DFL)
There are three measurements of Degree of Financial Leverage (DFL)-a) Capital Structure measure b)
Financing Cost Structure measure and c) General measure.
(a) Capital Structure Measure: This is a measure of the cause of the “financing leverage effect” and representing the
“relative proportion of AFFCBC within the “average capital structure” and given by:
DFL(CS)= [AFFCBC/(AFFCBC+AE)] Since, AFFCBC ≥ 0 and AE >0,0≤ DFLCS< 1
(b) Financing Cost Structural Measure: It represent the “relative proportion of FFCBT (or FFCAT) within the
financing cost structure”, given by:
DFL(FS)= { (1 – t ) FFCBT / {(1 – t ) FFCBT + EDAT}, or
(c) General measure: DFL can also be measured as follows:
DFL = EBIT / [EBIT- I- PD/ (1-t)]
Here, PD = Preferred Dividend, I = Interest expense, t= tax rate
5. OBJECTIVE OF THE STUDY
The main objective of the study was to analyze the impact of financial leverage on financial risk. The specific
objectives are:
a. To determine financial leverage risks(FLR) of sample firms and make a comparison between MNCs and
domestic companies for the study period
b. To determine degree of financial leverage(DFL) of sample firms and make a comparison between MNCs
and domestic companies for the study period
c. To explore the significance of relationship between FLR & DFL of sample firms and make a comparison
between MNCs and domestic companies for the study period
6. METHODOLOGY OF THE STUDY
Type of research is explanatory. Cause and effect relationship between debt financing and financial risk was
explored. Nature of research is Empirical and research approach is Quantitative. Population one and two consists of
all DSE listed MNCs and domestic companies respectively which continue operation during the study period. Eight
MNCs and forty five domestic firms were found in 6 industrial sectors. In selecting domestic firms, those industrial
sectors were chosen where there was existence of listed MNC. The research was based on secondary data. Both
time series and cross sectional data were used. Sources of secondary data were journals, company documents,
annual reports of sample firms, reports of Securities and Exchange Commission and Dhaka Stock Exchange (DSE)
and Websites of sample firms and DSE. Study period was from year 1996 to 2015. Stratified sampling method was
applied for selecting MNCs. Populations have been divided into several strata according to type of industry. Firms

Asian Economic and Financial Review, 2018, 8(3): 433-448
437
© 2018 AESS Publications. All Rights Reserved.
were taken from each of the 6 industrial sectors of each population. As the study was a comparative one, so those
domestic blue chip companies were chosen which has sound financial performance. So, Quota sampling method was
applied in selecting domestic firms. The sample in this study consists of 14 companies (7 from each population)
listed in Dhaka Stock Exchange (DSE) . Two companies were selected from Pharmaceuticals & Chemicals
industry and one company was selected from Engineering, Food & Allied, Tannery, Cement and Fuel& Power
industry in each category. Name of the domestic firms are: Aftab Automobiles Ltd. (AAL), Agricultural Marketing
Company Ltd. (AMCL), Beximco Pharmaceuticals Ltd. (BPL), Square Pharmaceuticals Ltd.(SPL), Apex Footwear
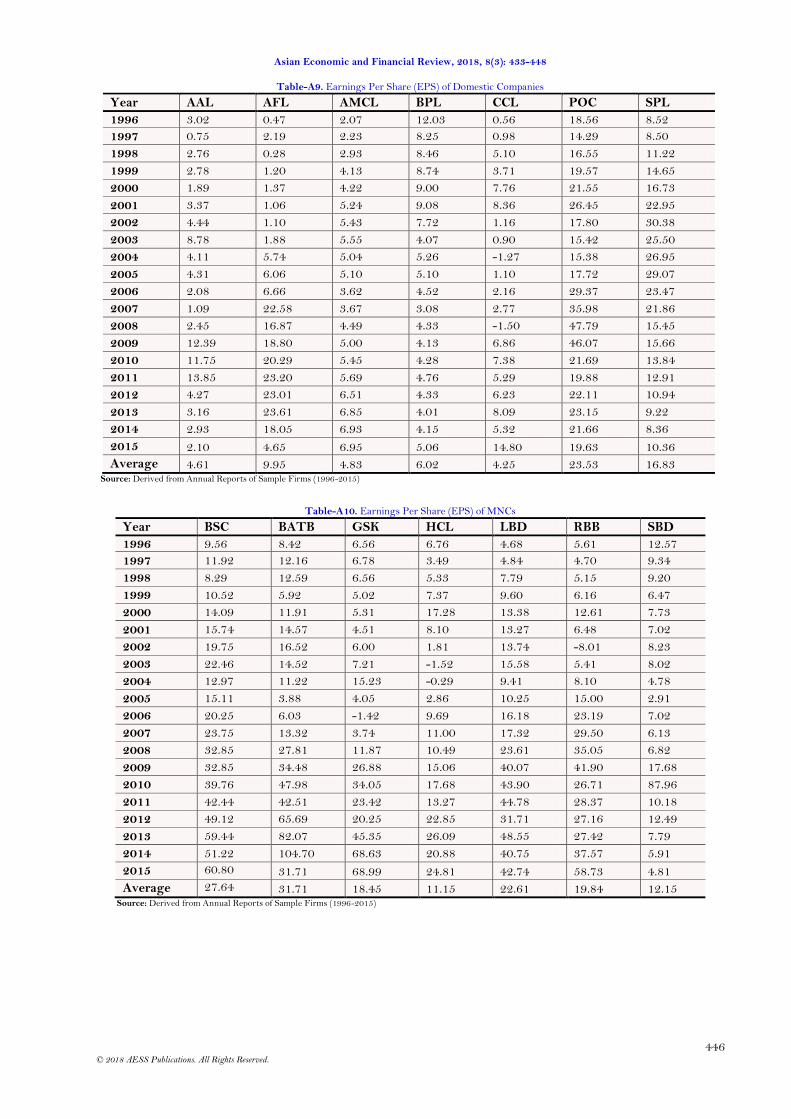
Ltd.(AFL), Confidence Cement Ltd.(CCL), and Padma Oil Company Ltd.(POC). Name of the MNCs are: Singer
Bangladesh Ltd. (SBD), British American Tobacco Bangladesh Company Ltd. (BATB), GlaxoSmithKline
Bangladesh Ltd. (GSK), Reckitt Benckiser (Bangladesh) Ltd. (RBB), Bata Shoe Company Ltd. (BSC), Heidelberg
Cement Bangladesh Ltd. (HCL), and Linde Bangladesh Ltd. (LBD). Some descriptive statistics are used to analyze
data such as mean, standard deviation (SD), mean absolute deviation (MAD), coefficient of variation (CV). Mean is
used to determine yearly average and grand average. Bivariate correlation has been used to measure significance as
well as direction of association between two variables. Collected data has been processed by MS Excel and SPSS
(version 20) software.
7. RESULT & DISCUSSION
7.1. Financial Leverage Risk of Domestic Companies
i. Ratio of the “Coefficient of Variation” (CV) of EPS to EBIT:
From table A1 and A9, mean and SD of EPS and EBIT of each year is determined by taking the mean of seven
domestic companies.
Table-1. Financial Leverage Risk of Domestic Companies Based on CV
Year EBIT (in million Tk.) EPS (in Tk.) FLR(CV)
Mean SD CV Mean SD CV
1996 137.14 168.70 1.23 6.38 6.93 1.09 0.883
1997 160.53 180.90 1.13 5.31 5.14 0.97 0.858 1998 184.88 186.62 1.01 6.76 5.69 0.84 0.834
1999 210.26 214.45 1.02 7.83 6.90 0.88 0.864
2000 242.49 235.59 0.97 8.93 7.64 0.86 0.881
2001 284.35 279.81 0.98 10.93 9.85 0.90 0.916
2002 282.38 352.96 1.25 9.72 10.72 1.10 0.883
2003 282.14 363.45 1.29 8.87 8.81 0.99 0.771
2004 322.38 442.06 1.37 8.74 9.42 1.08 0.785
2005 417.68 575.68 1.38 9.78 9.98 1.02 0.741
2006 454.42 590.07 1.30 10.27 11.27 1.10 0.845
2007 518.83 667.27 1.29 13.00 13.73 1.06 0.821
2008 621.09 775.30 1.25 12.84 16.83 1.31 1.050
2009 872.04 960.13 1.10 15.56 14.54 0.93 0.849
2010 1093.19 1060.27 0.97 12.10 6.95 0.57 0.592
2011 1330.35 1249.05 0.94 12.23 7.40 0.61 0.645
2012 1598.48 1552.51 0.97 11.06 8.17 0.74 0.761
2013 1819.95 1774.34 0.97 11.05 8.67 0.78 0.804
2014 1908.44 2020.20 1.06 9.63 7.28 0.76 0.714
2015 2224.11
2629.12
1.18
9.08
6.25
0.69
0.583 G.Mean 748.26
813.92
1.13
10.00
9.11
0.91
0.804 Source: Derived from table A1 and A9
Note: Computation done on SPSS & Excel
From table 1 it is seen that except year 2008, FLR (CV) of domestic companies was below 1.00. In recent years
FLR (CV) became lower than previous years. Average FLR of domestic companies is 0.804. FLR ranges from 0.583
to 1.050.

Asian Economic and Financial Review, 2018, 8(3): 433-448
438
© 2018 AESS Publications. All Rights Reserved.
ii. Ratio of “Mean Absolute Deviation” (MAD) to the expected value of EPS and EBIT:
From table A1 and A9, average EPS and EBIT as well as Mean Absolute Deviation (MAD) of EBIT of each
year are determined. Table 2 shows Mean Absolute Deviation (MAD) to the expected value of EPS and EBIT.
Except 2007 and 2008, FLR (MAD) of domestic companies was below 1.00 as MAD/Mean of EBIT was greater
than that of EPS. In recent years FLR (MAD) became lower than previous years. Average FLR of domestic
companies is 0.832. FLR ranges from 0.626 to 1.048.
Table-2. Financial Leverage Risk of Domestic Companies based on MAD
Year EBIT (in million Tk.) EPS (in Tk.) FLR(MAD)
Mean MAD MAD/Mean Mean MAD MAD/Mean
1996 137.14 131.39 0.96 6.38 5.70 0.89 0.932
1997 160.53 142.26 0.89 5.31 4.31 0.81 0.916
1998 184.88 148.21 0.80 6.76 4.56 0.67 0.842
1999 210.26 174.30 0.83 7.83 5.57 0.71 0.858
2000 242.49 189.58 0.78 8.93 5.85 0.66 0.838
2001 284.35 223.39 0.79 10.93 7.87 0.72 0.916
2002 282.38 271.40 0.96 9.72 8.21 0.85 0.879
2003 282.14 260.01 0.92 8.87 6.62 0.75 0.810
2004 322.38 316.05 0.98 8.74 7.10 0.81 0.828
2005 417.68 426.12 1.02 9.78 7.78 0.80 0.780
2006 454.42 440.18 0.97 10.27 9.23 0.90 0.928
2007 518.83 450.43 0.87 13.00 11.83 0.91 1.048
2008 621.09 554.88 0.89 12.84 11.88 0.93 1.036
2009 872.04 663.20 0.76 15.56 9.67 0.62 0.817
2010 1093.19 805.00 0.74 12.10 5.58 0.46 0.626
2011 1330.35 933.83 0.70 12.23 5.98 0.49 0.697
2012 1598.48 1272.85 0.80 11.06 6.57 0.59 0.747
2013 1819.95 1490.43 0.82 11.05 7.04 0.64 0.778
2014 1908.44 1633.59 0.86 9.63 5.84 0.61 0.709
2015 2224.11
1905.21
0.86
9.08 5.02 0.55 0.645
G.Mean 748.26
621.62
0.86 10.00 7.11 0.72 0.832
Source: Derived from table A1 and A9 Note: Computation done on SPSS & Excel
Table-3. Financial Leverage Risk of MNCs Based on CV
Year EBIT (in million Tk.) EPS (in Tk.) FLR(CV) Mean SD CV Mean SD CV
1996 191.35 144.11 0.75 7.74 2.69 0.35 0.461
1997 231.63 222.92 0.96 7.60 3.56 0.47 0.486 1998 267.74 287.39 1.07 7.84 2.58 0.33 0.306
1999 217.66 143.50 0.66 7.29 2.03 0.28 0.422 2000 314.09 251.00 0.80 11.76 4.02 0.34 0.428
2001 347.80 388.76 1.12 9.96 4.46 0.45 0.401 2002 309.50 399.28 1.29 8.29 9.50 1.15 0.888
2003 319.71 392.90 1.23 10.24 7.87 0.77 0.626 2004 289.22 336.99 1.17 8.77 5.23 0.60 0.512
2005 245.52 179.42 0.73 7.72 5.61 0.73 0.994 2006 378.09 291.46 0.77 11.56 8.71 0.75 0.977
2007 518.03 432.14 0.83 14.97 9.28 0.62 0.743
2008 728.60 713.93 0.98 21.21 11.44 0.54 0.550 2009 993.49 874.13 0.88 29.85 10.45 0.35 0.398
2010 1480.99 1344.95 0.91 42.58 22.52 0.53 0.582 2011 1306.48 1681.10 1.29 29.28 14.40 0.49 0.382
2012 1643.05 2281.79 1.39 32.75 18.48 0.56 0.406 2013 2128.56 3167.00 1.49 42.39 24.49 0.58 0.388
2014 2376.38 3851.11 1.62 47.09 32.44 0.69 0.425 2015 2674.52 1062.74 1.25 41.80 22.90 0.55 0.437
G.Mean 848.12 922.33 1.06 20.04 11.13 0.56 0.530 Source: Derived from table A2 and A10 Note: Computation done on SPSS & Excel

Asian Economic and Financial Review, 2018, 8(3): 433-448
439
© 2018 AESS Publications. All Rights Reserved.
7.2. Financial Leverage Risk of MNCs
i. Ratio of the “Coefficient of Variation” (CV) of EPS to EBIT:
From table A2 and A10, mean and SD of EPS and EBIT are determined by taking the average of seven MNCs.
From table 3 it is seen that FLR (CV) of MNCs was below 1.00 as CV of EBIT was greater than that of EPS. FLR
(CV) was increased during 2005 to 2007. Average FLR of MNCs is 0.530. FLR ranges from 0.306 to 0.994.
ii. Ratio of “Mean Absolute Deviation” (MAD) to the expected value of EPS and EBIT:
From table A2 and A10, average EPS and EBIT as well as Mean Absolute Deviation (MAD) of EBIT of each
year are determined by taking the average of seven MNCs. Table 4 shows Mean Absolute Deviation (MAD) to the
expected value of EPS and EBIT. From the table it is seen that except year 2005 and 2006, FLR (MAD) of MNCs
was below 1.00 as MAD/Mean of EBIT was greater than that of EPS. FLR (MAD) was increased during 2002 to
2007. Average FLR (MAD) of MNCs is 0.607. FLR ranges from 0.352 to 1.172.
Table-4. Financial Leverage Risk of MNCs Based on MAD
Year EBIT (in million Tk.) EPS FLR(MAD) Mean MAD MAD/Mean Mean MAD MAD/Mean
1996 191.35 98.84 0.52 7.74 2.10 0.27 0.525 1997 231.63 148.55 0.64 7.60 3.03 0.40 0.621 1998 267.74 181.49 0.68 7.84 1.87 0.24 0.352 1999 217.66 109.75 0.50 7.29 1.60 0.22 0.436 2000 314.09 198.06 0.63 11.76 2.99 0.25 0.404 2001 347.80 247.89 0.71 9.96 3.92 0.39 0.552 2002 309.50 270.93 0.88 8.29 7.18 0.87 0.990 2003 319.71 275.28 0.86 10.24 6.24 0.61 0.708 2004 289.22 212.47 0.73 8.77 3.92 0.45 0.609 2005 245.52 133.26 0.54 7.72 4.91 0.64 1.172 2006 378.09 224.83 0.59 11.56 7.12 0.62 1.036 2007 518.03 331.46 0.64 14.97 7.34 0.49 0.766 2008 728.60 491.27 0.67 21.21 9.85 0.46 0.688 2009 993.49 638.62 0.64 29.85 8.55 0.29 0.446 2010 1480.99 1004.76 0.68 42.58 14.89 0.35 0.515 2011 1306.48 1071.33 0.82 29.28 11.97 0.41 0.498 2012 1643.05 1488.52 0.91 32.75 14.09 0.43 0.475 2013 2128.56 2018.26 0.95 42.39 18.82 0.44 0.468 2014 2376.38 2479.26 1.04 47.09 23.79 0.51 0.484 2015 2674.52
675.44 0.80 41.80
18.31 0.44 0.550
G. Mean 848.12
615.01 0.72 20.04
8.62 0.44 0.607 Source: Derived from table A2 and A10 Note: Computation done on SPSS & Excel
7.3. Comparison of FLR between MNCs and Domestic Companies
From the above tables it is observed that both FLR (CV) and FLR (MAD) of domestic companies are higher
than that of MNCs. Average FLR (CV) of domestic companies and MNCs are 0.804 and 0.530 respectively whereas
average FLR (MAD) of domestic companies and MNCs are 0.832 and 0.607 respectively.
7.4. Comparison of Yearly Average DFL between Domestic Companies and MNCs
In this section comparison of yearly average of DFL between domestic companies and MNCs is shown in a
comprehensive way by incorporating all three measures of DFL. Average of yearly DFL of seven companies of each
category is determined to reach at average DFL in each year. Table 5 shows comparison of yearly average of DFL
between domestic companies and MNCs. From the table it is observed that DFLs of domestic companies were
higher than that of MNCs in all three measures of DFL in all the years. Average DFLs (CS) of domestic companies
were higher in initial years of study period than later years. The same holds true for MNCs. Average DFLs (CS) of

Asian Economic and Financial Review, 2018, 8(3): 433-448
440
© 2018 AESS Publications. All Rights Reserved.
domestic companies were at least approximately three to four times higher than that of MNCs in most of the years.
Grand mean DFL (CS) of domestic companies was 0.13 which was much higher than that of MNCs (0.03). Domestic
companies showed more consistency than MNCs in terms of DFL based on financing cost structural measure as
year-wise deviations of domestic companies were less than MNCs.
Table-5. Comparison of Average DFL
Year Domestic Companies MNCs
DFL(CS) DFL(FS) DFL(General) DFL(CS) DFL(FS) DFL(General)
1996 0.23 0.69 3.12 0.05 0.12 1.08
1997 0.17 0.64 2.12 0.04 0.16 1.10
1998 0.17 0.46 4.19 0.06 0.14 1.10
1999 0.16 0.53 2.02 0.06 0.16 1.13
2000 0.13 0.55 2.21 0.04 0.09 1.05
2001 0.15 0.56 2.38 0.03 0.09 1.06
2002 0.16 0.60 2.48 0.02 0.09 1.08
2003 0.16 0.65 2.13 0.03 0.18 0.89
2004 0.19 0.70 1.76 0.04 0.18 0.90
2005 0.19 0.72 2.12 0.05 0.20 1.25
2006 0.14 0.65 1.96 0.04 0.28 1.11
2007 0.11 0.62 2.02 0.03 0.19 1.17
2008 0.09 0.70 1.63 0.03 0.21 1.12
2009 0.09 0.78 1.61 0.02 0.06 1.04
2010 0.09 0.67 1.58 0.01 0.01 1.00
2011 0.08 0.57 1.58 0.01 0.01 1.01
2012 0.08 0.57 1.63 0.01 0.03 1.02
2013 0.08 0.65 1.59 0.00 0.02 1.02
2014 0.07 0.46 1.63 0.00 0.01 1.02
2015 0.10 0.45 1.94 0.01 0.01 1.02
G.Mean 0.13 0.61 2.09 0.03 0.12 1.06 Source: Derived from table A3 - A8, A11- A14
Like DFL (CS), averages of DFL (FS) of domestic companies were at least approximately three to four times
higher than MNCs in most of the years. The differences in DFL (FS) between two types of companies were much
larger in recent years than previous years. Grand mean DFL (FS) of domestic companies (0.61) was much higher
than that of MNCs (0.12). MNCs showed more consistency than domestic companies in terms of DFL (general).
Average DFLs (general) of both types of companies has slightly declined in recent years than previous years.
Average DFLs (general) of domestic companies were at least two times higher than that of MNCs in most of the
years. Grand mean DFL (general) of domestic companies (2.09) was much higher than MNCs (1.06).
7.5. Relationship between DFL and FLR
Relationship between DFL and FLR is measured by the value of correlation coefficients and significance of
coefficients. Average DFL and FLR of each year is determined by taking the arithmetic mean of 7 companies‟ DFL
and FLR
7.5.1. Relationship between DFL and FLR of Domestic Companies
Table 6 depicts relationship between DFL and long term financial risk of domestic companies through Pearson
correlation coefficients.

Asian Economic and Financial Review, 2018, 8(3): 433-448
441
© 2018 AESS Publications. All Rights Reserved.
Table-6. Relationship between DFL and FLR of Domestic Companies
DFL FLR
DFL(CS) DFL(FS) DFL(General)
Coefficient p value Coefficient p value Coefficient p value
FLR(CV) .272 .260 .106 .667 .276 .253 FLR(MAD) .342 .152 .188 .441 .277 .252
Source: Table 1,2& 5 Note: Computation done on SPSS
From the table it is observed that p values of coefficients of between FLR and DFL is greater than 0.05 which
means that at 5% significance level, none of the correlation coefficient is significant. Weak positive correlation is
seen between DFL and FLR.
7.5.2. Relationship between DFL and FLR of MNCs
The table 7 depicts relationship between DFL and long term financial risk of domestic companies through
Pearson correlation coefficients.
Table-7. Relationship between DFL and FLRs of MNCs
DFL FLR
DFL(CS) DFL(FS) DFL(General) Coefficient p value Coefficient p value Coefficient p value
FLR(CV) .149 .544 .571 .011** .376 .112 FLR(MAD) .153 .533 .592 .008*** .397 .093*
Source: Table 3, 4, and 5 Note: Computation done on SPSS *Significant at 10% **Significant at 5% ***Significant at 1%
From the table it is observed that significance or p value of correlation coefficient between DFL (FS) and FLR
is significant at 5% level. Correlation between DFL (General) and FLR (MAD) is significant at 10% level. Weak
positive correlation is seen between DFL (CS) and FLR as well as between DFL (General) and FLR. Moderate
positive relationship is seen between DFL (FS) and FLR.
7.5.3. Comparison of Association between DFL and FLR
From the above table it is seen MNCs showed comparatively stronger positive relationship between DFL (FS)
and FLR as well as between DFL (Gen.) and FLR. On the other hand, domestic companies showed comparatively
stronger positive relationship between DFL (CS) and FLR. Association between DFL (FS) and FLR is significant in
case of MNCs but not significant in case of domestic companies.
8. CONCLUSION
It is expected that the process of liability management will become far more sophisticated in the coming decade
as companies increasingly recognize the connections between balance-sheet decisions and firm‟s leverage risk. It is
evident from the above analysis that FLR of domestic companies based on coefficient of variation and mean absolute
deviation is higher than MNCs. Higher FLR of domestic companies conform with higher proportion of debt capital
in financial structure.
Funding: This study received no specific financial support. Competing Interests: The authors declare that they have no competing interests. Contributors/Acknowledgement: All authors contributed equally to the conception and design of the study.
REFERENCES
Akbari, P. and E. Mohammadi, 2013. A study of the effects of leverages ratio on systematic risk based on the capital asset pr icing
model among accepted companies in Tehran stock market. Journal of Educational and Management Studies, 3(4): 271-
277. View at Google Scholar
Asian Economic and Financial Review, 2018, 8(3): 433-448
442
© 2018 AESS Publications. All Rights Reserved.
Alaghi, K., 2011. Financial leverage and systematic risk. African Journal of Business Management, 5(15): 6648-6650. View at Google
Scholar | View at Publisher
Aydemir, C.A., G. Michael and H. Burton, 2007. Financial leverage and the leverage effect - a market and firm analysis. Working
Paper. Tepper School of Business, Carnegie Mellon University. Retrieved from http://repository.cmu.edu/tepper.
Bhatt, V. and S. Jahangir, 2012. Leverage risk, financial crisis, and stock returns: A comparison among islamic, conventional, and
socially responsible stocks. Islamic Economic Studies, 20(1): 87-143. View at Google Scholar
Brealey, R.A. and M.C. Stewart, 1984. Principles of corporate finance. 2nd Edn., New York: McGraw-Hill.
Brigham, E.F. and E.C. Michael, 2005. Financial management: Text and cases. New Delhi, India: Cengage Learning India Pvt.
Ltd, 487.
Circiumaru, D., 2011. Critics regarding the use of degree of financial leverage in the evaluation of company‟s financial risk .
Annals of the University of Craiova Economic Sciences, 41(39): 49-60.
Gunarathna, V., 2016. How does financial leverage affect financial risk? An empirical study in Sri Lanka. Amity Journal of
Finance, 1(1): 57-66. View at Google Scholar
Hussan, J., 2016. Impact of leverage on risk of the companies. Journal of Civil & Legal Science, 5(4): 200. View at Publisher
Maia, M.V., 2010. Cash-flow risks, financial leverage and the cross section of equity returns. PhD Dissertation, University of
Pennsylvania, USA.
Pandey, I.M., 2014. Financial management. 10th Edn., New Delhi, India: Vikas Publishing House Pvt. Ltd.
Sinha, S., 2013. Financing leverage analysis: A conceptual framework. IOSR Journal of Business and Management, 7(3): 64-91.
Solomon, D.C. and M. Muntean, 2012. Assessment of financial risk in firm‟s profitability analysis. Economy Transdisciplinarity
Cognition, 15(2): 58-67. View at Google Scholar
Ufo, A., 2015. Impact of financial distress on the leverage of selected manufacturing firms of Ethiopia. Industrial Engineering
Letters, 5(10): 6-11.
Yoon, E. and J. SooCheong, 2005. The effect of financial leverage on profitability and risk of restaurant firms. Journal of
Hospitality Financial Management, 13(1): 37-45. View at Google Scholar | View at Publisher
APPENDICES
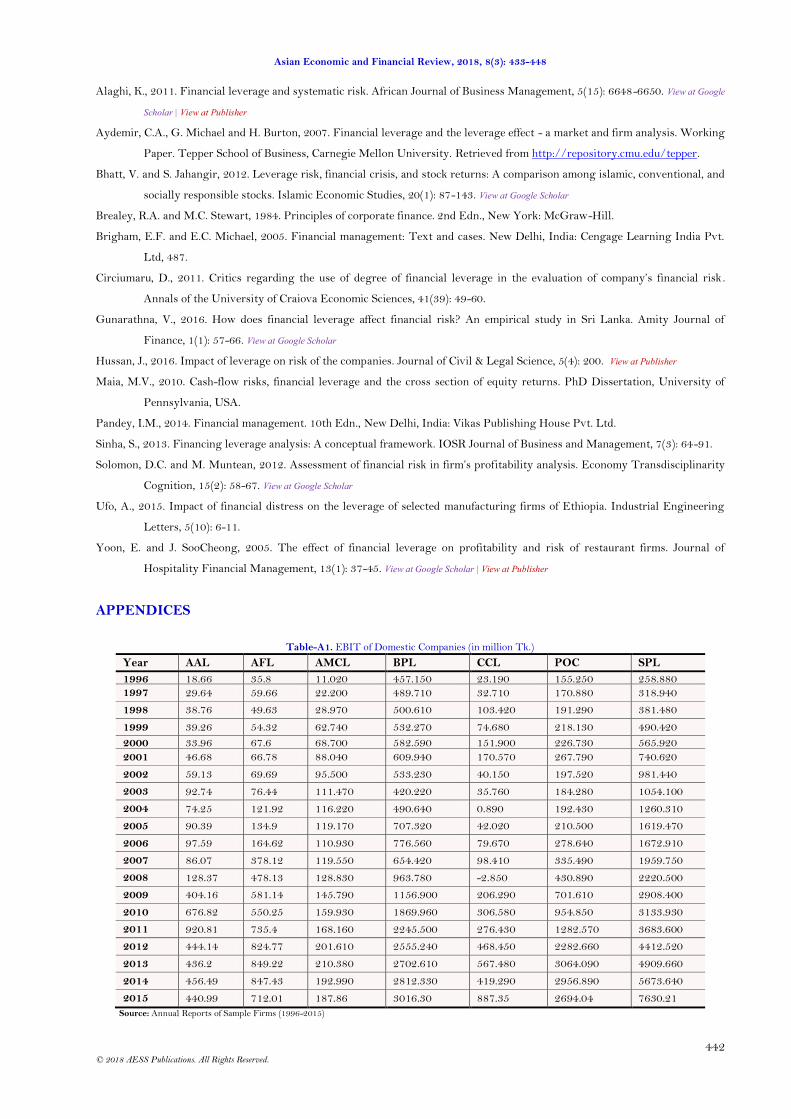
Table-A1. EBIT of Domestic Companies (in million Tk.)
Year AAL AFL AMCL BPL CCL POC SPL
1996 18.66 35.8 11.020 457.150 23.190 155.250 258.880 1997 29.64 59.66 22.200 489.710 32.710 170.880 318.940
1998 38.76 49.63 28.970 500.610 103.420 191.290 381.480
1999 39.26 54.32 62.740 532.270 74.680 218.130 490.420
2000 33.96 67.6 68.700 582.590 151.900 226.730 565.920
2001 46.68 66.78 88.040 609.940 170.570 267.790 740.620
2002 59.13 69.69 95.500 533.230 40.150 197.520 981.440
2003 92.74 76.44 111.470 420.220 35.760 184.280 1054.100
2004 74.25 121.92 116.220 490.640 0.890 192.430 1260.310
2005 90.39 134.9 119.170 707.320 42.020 210.500 1619.470
2006 97.59 164.62 110.930 776.560 79.670 278.640 1672.910
2007 86.07 378.12 119.550 654.420 98.410 335.490 1959.750
2008 128.37 478.13 128.830 963.780 -2.850 430.890 2220.500
2009 404.16 581.14 145.790 1156.900 206.290 701.610 2908.400
2010 676.82 550.25 159.930 1869.960 306.580 954.850 3133.930
2011 920.81 735.4 168.160 2245.500 276.430 1282.570 3683.600
2012 444.14 824.77 201.610 2555.240 468.450 2282.660 4412.520
2013 436.2 849.22 210.380 2702.610 567.480 3064.090 4909.660
2014 456.49 847.43 192.990 2812.330 419.290 2956.890 5673.640
2015 440.99 712.01 187.86 3016.30 887.35 2694.04 7630.21
Source: Annual Reports of Sample Firms (1996-2015)
Asian Economic and Financial Review, 2018, 8(3): 433-448
443
© 2018 AESS Publications. All Rights Reserved.
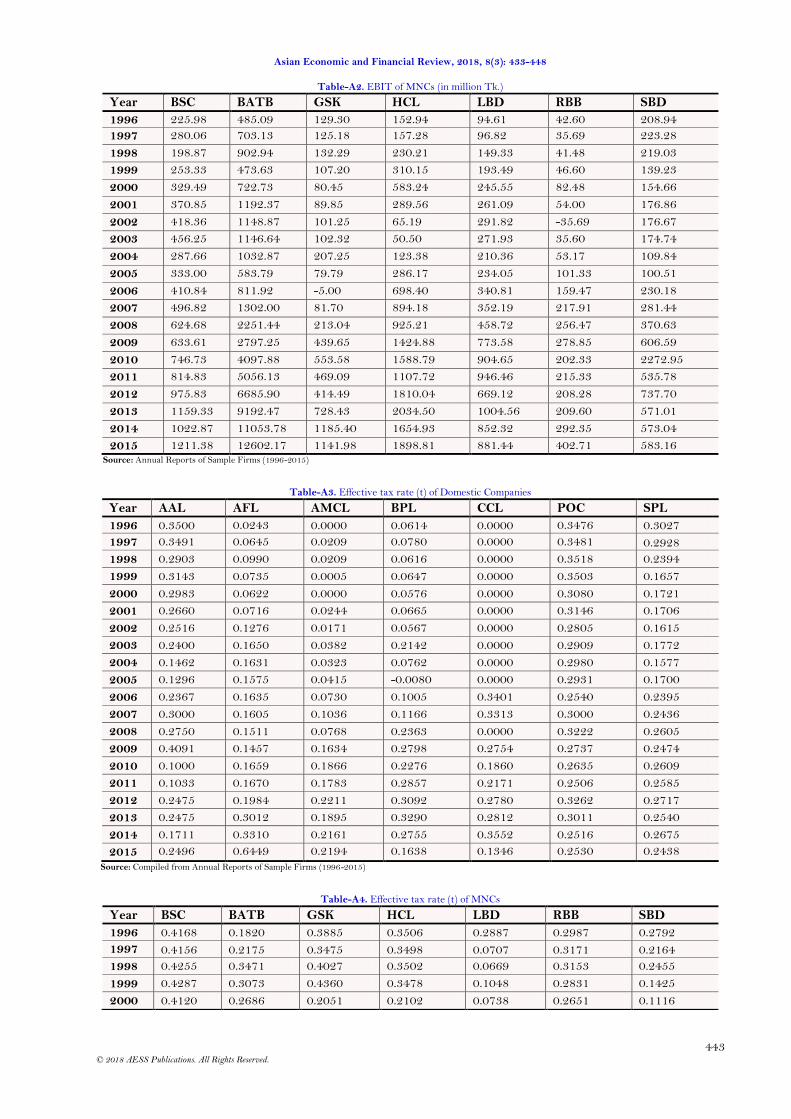
Table-A2. EBIT of MNCs (in million Tk.)
Year BSC BATB GSK HCL LBD RBB SBD
1996 225.98 485.09 129.30 152.94 94.61 42.60 208.94
1997 280.06 703.13 125.18 157.28 96.82 35.69 223.28
1998 198.87 902.94 132.29 230.21 149.33 41.48 219.03
1999 253.33 473.63 107.20 310.15 193.49 46.60 139.23
2000 329.49 722.73 80.45 583.24 245.55 82.48 154.66
2001 370.85 1192.37 89.85 289.56 261.09 54.00 176.86
2002 418.36 1148.87 101.25 65.19 291.82 -35.69 176.67
2003 456.25 1146.64 102.32 50.50 271.93 35.60 174.74
2004 287.66 1032.87 207.25 123.38 210.36 53.17 109.84
2005 333.00 583.79 79.79 286.17 234.05 101.33 100.51
2006 410.84 811.92 -5.00 698.40 340.81 159.47 230.18
2007 496.82 1302.00 81.70 894.18 352.19 217.91 281.44
2008 624.68 2251.44 213.04 925.21 458.72 256.47 370.63
2009 633.61 2797.25 439.65 1424.88 773.58 278.85 606.59
2010 746.73 4097.88 553.58 1588.79 904.65 202.33 2272.95
2011 814.83 5056.13 469.09 1107.72 946.46 215.33 535.78
2012 975.83 6685.90 414.49 1810.04 669.12 208.28 737.70
2013 1159.33 9192.47 728.43 2034.50 1004.56 209.60 571.01
2014 1022.87 11053.78 1185.40 1654.93 852.32 292.35 573.04
2015 1211.38 12602.17 1141.98 1898.81 881.44 402.71 583.16 Source: Annual Reports of Sample Firms (1996-2015)
Table-A3. Effective tax rate (t) of Domestic Companies
Year AAL AFL AMCL BPL CCL POC SPL
1996 0.3500 0.0243 0.0000 0.0614 0.0000 0.3476 0.3027
1997 0.3491 0.0645 0.0209 0.0780 0.0000 0.3481 0.2928
1998 0.2903 0.0990 0.0209 0.0616 0.0000 0.3518 0.2394
1999 0.3143 0.0735 0.0005 0.0647 0.0000 0.3503 0.1657
2000 0.2983 0.0622 0.0000 0.0576 0.0000 0.3080 0.1721
2001 0.2660 0.0716 0.0244 0.0665 0.0000 0.3146 0.1706
2002 0.2516 0.1276 0.0171 0.0567 0.0000 0.2805 0.1615
2003 0.2400 0.1650 0.0382 0.2142 0.0000 0.2909 0.1772
2004 0.1462 0.1631 0.0323 0.0762 0.0000 0.2980 0.1577
2005 0.1296 0.1575 0.0415 -0.0080 0.0000 0.2931 0.1700
2006 0.2367 0.1635 0.0730 0.1005 0.3401 0.2540 0.2395
2007 0.3000 0.1605 0.1036 0.1166 0.3313 0.3000 0.2436
2008 0.2750 0.1511 0.0768 0.2363 0.0000 0.3222 0.2605
2009 0.4091 0.1457 0.1634 0.2798 0.2754 0.2737 0.2474
2010 0.1000 0.1659 0.1866 0.2276 0.1860 0.2635 0.2609
2011 0.1033 0.1670 0.1783 0.2857 0.2171 0.2506 0.2585
2012 0.2475 0.1984 0.2211 0.3092 0.2780 0.3262 0.2717
2013 0.2475 0.3012 0.1895 0.3290 0.2812 0.3011 0.2540
2014 0.1711 0.3310 0.2161 0.2755 0.3552 0.2516 0.2675
2015 0.2496
0.6449
0.2194
0.1638
0.1346
0.2530
0.2438 Source: Compiled from Annual Reports of Sample Firms (1996-2015)
Table-A4. Effective tax rate (t) of MNCs
Year BSC BATB GSK HCL LBD RBB SBD
1996 0.4168 0.1820 0.3885 0.3506 0.2887 0.2987 0.2792
1997 0.4156 0.2175 0.3475 0.3498 0.0707 0.3171 0.2164
1998 0.4255 0.3471 0.4027 0.3502 0.0669 0.3153 0.2455
1999 0.4287 0.3073 0.4360 0.3478 0.1048 0.2831 0.1425
2000 0.4120 0.2686 0.2051 0.2102 0.0738 0.2651 0.1116
Asian Economic and Financial Review, 2018, 8(3): 433-448
444
© 2018 AESS Publications. All Rights Reserved.
2001 0.4106 0.2491 0.3951 0.2285 0.0860 0.4180 0.2780
2002 0.3500 0.1159 0.2864 0.0000 0.2220 0.0000 0.1392
2003 0.3183 0.1551 0.1515 -0.4156 0.0851 0.2811 0.1948
2004 0.3597 0.2604 0.1145 0.0000 0.2663 0.2797 0.2212
2005 0.3570 0.4833 0.3756 0.0059 0.2935 0.3005 0.3656
2006 0.3214 0.4449 0.9393 0.1160 0.2680 0.3128 0.1283
2007 0.3423 0.3641 0.4159 0.2513 0.2470 0.3603 0.2687
2008 0.2747 0.2578 0.3014 0.2995 0.2150 0.3542 0.2909
2009 0.2863 0.2595 0.2621 0.3940 0.2106 0.2900 0.1731
2010 0.2678 0.2967 0.2579 0.3681 0.2604 0.3762 0.1295
2011 0.2684 0.4809 0.3938 0.3231 0.2751 0.3774 0.2413
2012 0.3083 0.3937 0.4040 0.2851 0.2695 0.3839 0.2660
2013 0.2950 0.4591 0.2457 0.2724 0.2623 0.3820 0.2757
2014 0.3117 0.4219 0.3007 0.2872 0.2713 0.3927 0.2772
2015 0.3109 0.5286 0.2701 0.2609 0.2620 0.3109 0.2871 Source: Compiled from Annual Reports of Sample Firms (1996-2015)
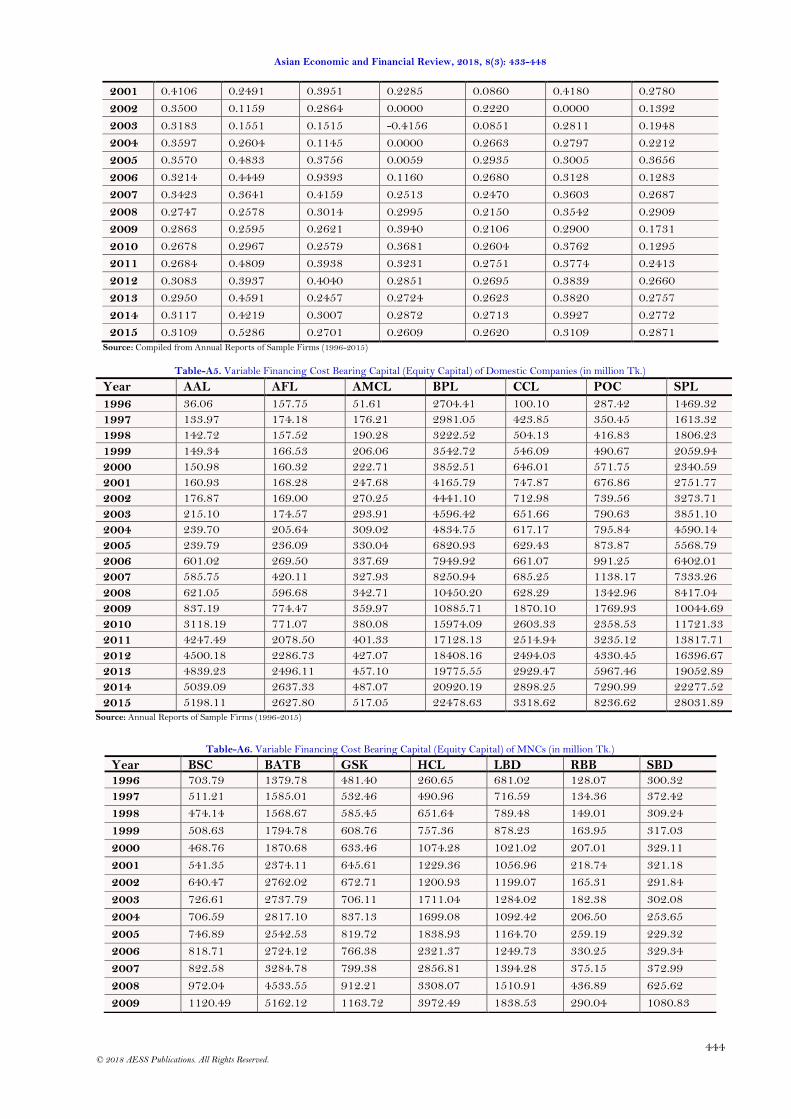
Table-A5. Variable Financing Cost Bearing Capital (Equity Capital) of Domestic Companies (in million Tk.)
Year AAL AFL AMCL BPL CCL POC SPL
1996 36.06 157.75 51.61 2704.41 100.10 287.42 1469.32
1997 133.97 174.18 176.21 2981.05 423.85 350.45 1613.32
1998 142.72 157.52 190.28 3222.52 504.13 416.83 1806.23
1999 149.34 166.53 206.06 3542.72 546.09 490.67 2059.94
2000 150.98 160.32 222.71 3852.51 646.01 571.75 2340.59
2001 160.93 168.28 247.68 4165.79 747.87 676.86 2751.77
2002 176.87 169.00 270.25 4441.10 712.98 739.56 3273.71
2003 215.10 174.57 293.91 4596.42 651.66 790.63 3851.10
2004 239.70 205.64 309.02 4834.75 617.17 795.84 4590.14
2005 239.79 236.09 330.04 6820.93 629.43 873.87 5568.79
2006 601.02 269.50 337.69 7949.92 661.07 991.25 6402.01
2007 585.75 420.11 327.93 8250.94 685.25 1138.17 7333.26
2008 621.05 596.68 342.71 10450.20 628.29 1342.96 8417.04
2009 837.19 774.47 359.97 10885.71 1870.10 1769.93 10044.69
2010 3118.19 771.07 380.08 15974.09 2603.33 2358.53 11721.33
2011 4247.49 2078.50 401.33 17128.13 2514.94 3235.12 13817.71
2012 4500.18 2286.73 427.07 18408.16 2494.03 4330.45 16396.67
2013 4839.23 2496.11 457.10 19775.55 2929.47 5967.46 19052.89
2014 5039.09 2637.33 487.07 20920.19 2898.25 7290.99 22277.52
2015 5198.11 2627.80 517.05 22478.63 3318.62 8236.62 28031.89 Source: Annual Reports of Sample Firms (1996-2015)
Table-A6. Variable Financing Cost Bearing Capital (Equity Capital) of MNCs (in million Tk.)
Year BSC BATB GSK HCL LBD RBB SBD 1996 703.79 1379.78 481.40 260.65 681.02 128.07 300.32
1997 511.21 1585.01 532.46 490.96 716.59 134.36 372.42
1998 474.14 1568.67 585.45 651.64 789.48 149.01 309.24
1999 508.63 1794.78 608.76 757.36 878.23 163.95 317.03
2000 468.76 1870.68 633.46 1074.28 1021.02 207.01 329.11
2001 541.35 2374.11 645.61 1229.36 1056.96 218.74 321.18
2002 640.47 2762.02 672.71 1200.93 1199.07 165.31 291.84
2003 726.61 2737.79 706.11 1711.04 1284.02 182.38 302.08
2004 706.59 2817.10 837.13 1699.08 1092.42 206.50 253.65
2005 746.89 2542.53 819.72 1838.93 1164.70 259.19 229.32
2006 818.71 2724.12 766.38 2321.37 1249.73 330.25 329.34
2007 822.58 3284.78 799.38 2856.81 1394.28 375.15 372.99
2008 972.04 4533.55 912.21 3308.07 1510.91 436.89 625.62
2009 1120.49 5162.12 1163.72 3972.49 1838.53 290.04 1080.83

Asian Economic and Financial Review, 2018, 8(3): 433-448
445
© 2018 AESS Publications. All Rights Reserved.
2010 1322.46 6240.71 1381.15 4756.50 1995.50 227.40 3140.52
2011 1561.07 5911.30 1422.29 5263.20 2165.41 281.68 2198.74
2012 1854.00 7032.94 1485.56 6300.03 2191.37 372.74 2539.59
2013 2256.68 8901.59 1851.11 7491.68 2458.50 431.41 2632.80
2014 2571.02 11463.51 2316.50 6524.00 2606.86 211.42 1527.15
2015 2965.00 14609.51 2603.80 5778.84 2785.56 205.44 1417.33 Source: Annual Reports of Sample Firms (1996-2015)
Table-A7. Fixed Financing Cost Bearing Capital (Long Term Debt & Preferred Stock Capital) of Domestic Companies (in million Tk.)
Year AAL AFL AMCL BPL CCL POC SPL
1996 17.10 68.74 48.37 0.00 77.77 0 0.00
1997 17.10 170.00 40.90 593.57 57.44 0 0.00
1998 17.10 158.50 133.81 633.74 10.30 0 31.50
1999 17.10 124.50 89.43 0.00 24.51 0 177.22
2000 17.10 116.61 54.38 0.00 14.99 0 350.05
2001 17.10 103.84 108.75 656.65 75.85 0 350.10
2002 17.10 90.36 151.77 757.12 62.75 0 70.93
2003 17.10 76.07 185.98 2079.93 22.51 0 65.25
2004 19.10 70.79 156.15 1955.40 0.08 0 36.54
2005 19.10 53.65 165.94 1493.91 4.42 0 389.19
2006 18.10 35.26 152.59 1277.93 10.50 0 602.35
2007 18.10 5.50 114.00 1920.71 1.04 0 492.57
2008 18.10 0.00 92.49 1605.71 0.00 0 602.58
2009 26.92 0.00 136.40 2513.13 0.00 0 449.76
2010 17.10 0.00 192.23 2081.68 8.76 0 1032.63
2011 25.31 249.58 150.70 2106.17 22.33 0 655.65
2012 25.31 628.58 134.95 1745.28 52.66 0 508.78
2013 250.26 605.40 85.53 1477.87 78.73 0 313.42
2014 484.44 940.31 42.71 1305.58 67.04 0 136.44
2015 944.60 562.97 426.50 1377.65 3.15 0 40.08 Source: Annual Reports of Sample Firms (1996-2015)
Table-A8. Fixed Financing Cost Bearing Capital (Long Term Debt & Preferred Stock Capital) of MNCs (In million Tk.)
Year BSC BATB GSK HCL LBD RBB SBD
1996 0.00 0.00 0.00 125.20 0.00 0 0.00
1997 0.00 0.00 0.00 125.20 0.00 0 12.00
1998 0.00 150.00 0.00 125.20 164.66 0 45.36
1999 0.00 0.00 0.00 122.64 124.73 0 16.67
2000 0.00 0.00 0.00 122.64 228.93 0 0.00
2001 0.00 0.00 0.00 122.64 72.57 0 0.00
2002 0.00 0.00 0.00 122.64 0.00 0 0.00
2003 0.00 0.00 0.00 729.80 0.00 0 0.00
2004 0.00 0.00 0.00 525.06 6.81 0 0.00
2005 2.01 18.16 0.00 426.46 4.55 0 47.29
2006 0.23 22.01 5.11 185.03 2.89 0 53.08
2007 0.00 15.34 3.64 135.34 2.23 0 78.11
2008 0.00 18.84 1.30 135.34 0.00 0 127.21
2009 0.00 25.18 4.94 135.34 0.00 0 80.20
2010 0.00 34.90 3.64 135.34 0.00 0 0.00
2011 0.00 17.88 26.94 135.34 0.00 0 0.00
2012 0.00 7.54 21.42 135.34 0.00 0 0.00
2013 0.00 0.00 12.76 135.34 0.00 0 0.00
2014 0.00 0.00 14.87 135.34 0.00 0 0.00
2015 0.00 0.00 8.81 135.34 0.00 0 173.05 Source: Annual Reports of Sample Firms (1996-2015)
Asian Economic and Financial Review, 2018, 8(3): 433-448
446
© 2018 AESS Publications. All Rights Reserved.
Table-A9. Earnings Per Share (EPS) of Domestic Companies
Year AAL AFL AMCL BPL CCL POC SPL
1996 3.02 0.47 2.07 12.03 0.56 18.56 8.52
1997 0.75 2.19 2.23 8.25 0.98 14.29 8.50
1998 2.76 0.28 2.93 8.46 5.10 16.55 11.22
1999 2.78 1.20 4.13 8.74 3.71 19.57 14.65
2000 1.89 1.37 4.22 9.00 7.76 21.55 16.73
2001 3.37 1.06 5.24 9.08 8.36 26.45 22.95
2002 4.44 1.10 5.43 7.72 1.16 17.80 30.38
2003 8.78 1.88 5.55 4.07 0.90 15.42 25.50
2004 4.11 5.74 5.04 5.26 -1.27 15.38 26.95
2005 4.31 6.06 5.10 5.10 1.10 17.72 29.07
2006 2.08 6.66 3.62 4.52 2.16 29.37 23.47
2007 1.09 22.58 3.67 3.08 2.77 35.98 21.86
2008 2.45 16.87 4.49 4.33 -1.50 47.79 15.45
2009 12.39 18.80 5.00 4.13 6.86 46.07 15.66
2010 11.75 20.29 5.45 4.28 7.38 21.69 13.84
2011 13.85 23.20 5.69 4.76 5.29 19.88 12.91
2012 4.27 23.01 6.51 4.33 6.23 22.11 10.94
2013 3.16 23.61 6.85 4.01 8.09 23.15 9.22
2014 2.93 18.05 6.93 4.15 5.32 21.66 8.36
2015 2.10 4.65 6.95 5.06 14.80 19.63 10.36
Average 4.61 9.95 4.83 6.02 4.25 23.53 16.83 Source: Derived from Annual Reports of Sample Firms (1996-2015)
Table-A10. Earnings Per Share (EPS) of MNCs
Year BSC BATB GSK HCL LBD RBB SBD
1996 9.56 8.42 6.56 6.76 4.68 5.61 12.57
1997 11.92 12.16 6.78 3.49 4.84 4.70 9.34
1998 8.29 12.59 6.56 5.33 7.79 5.15 9.20
1999 10.52 5.92 5.02 7.37 9.60 6.16 6.47
2000 14.09 11.91 5.31 17.28 13.38 12.61 7.73
2001 15.74 14.57 4.51 8.10 13.27 6.48 7.02
2002 19.75 16.52 6.00 1.81 13.74 -8.01 8.23
2003 22.46 14.52 7.21 -1.52 15.58 5.41 8.02
2004 12.97 11.22 15.23 -0.29 9.41 8.10 4.78
2005 15.11 3.88 4.05 2.86 10.25 15.00 2.91
2006 20.25 6.03 -1.42 9.69 16.18 23.19 7.02
2007 23.75 13.32 3.74 11.00 17.32 29.50 6.13
2008 32.85 27.81 11.87 10.49 23.61 35.05 6.82
2009 32.85 34.48 26.88 15.06 40.07 41.90 17.68
2010 39.76 47.98 34.05 17.68 43.90 26.71 87.96
2011 42.44 42.51 23.42 13.27 44.78 28.37 10.18
2012 49.12 65.69 20.25 22.85 31.71 27.16 12.49
2013 59.44 82.07 45.35 26.09 48.55 27.42 7.79
2014 51.22 104.70 68.63 20.88 40.75 37.57 5.91
2015 60.80
31.71 68.99 24.81 42.74 58.73 4.81
Average 27.64
31.71 18.45 11.15 22.61 19.84 12.15 Source: Derived from Annual Reports of Sample Firms (1996-2015)

Asian Economic and Financial Review, 2018, 8(3): 433-448
447
© 2018 AESS Publications. All Rights Reserved.
Table-A11. FFCBT (Interest expenses & PD before Tax) of Domestic Companies (in million Tk.)
Year AAL AFL AMCL BPL CCL POC SPL
1996 11.41 32.22 2.73 78.93 17.60 55.71 14.44
1997 23.20 42.09 4.02 93.69 14.15 63.45 18.36
1998 16.93 47.32 5.02 101.83 6.56 66.22 12.81
1999 16.47 44.59 29.65 118.96 4.22 70.54 51.47
2000 18.81 56.62 34.94 159.94 4.48 74.15 60.82
2001 20.87 58.21 45.05 179.52 11.70 78.68 48.98
2002 25.81 60.27 51.34 170.99 18.04 76.32 75.70
2003 27.79 59.53 65.32 156.60 18.58 77.71 124.49
2004 47.15 70.45 74.56 172.05 24.92 85.08 108.67
2005 62.56 80.96 76.64 221.95 21.21 87.66 106.45
2006 51.63 104.94 79.70 253.32 17.34 85.72 139.86
2007 59.68 176.39 86.83 254.74 19.62 83.59 236.85
2008 65.71 254.51 89.89 249.65 25.61 85.36 351.87
2009 77.05 333.52 98.02 289.43 8.39 80.03 397.14
2010 130.51 276.62 106.34 707.48 10.82 89.09 308.86
2011 40.87 422.06 112.80 567.65 23.24 112.82 268.85
2012 55.85 501.85 134.78 645.41 80.08 111.74 433.58
2013 76.98 469.12 142.74 609.02 93.93 106.54 325.28
2014 118.66 543.87 122.29 702.78 48.22 114.53 169.18
2015 172.60 564.59 116.65 679.17 117.71 112.96 34.30 Source: Annual Reports of Sample Firms (1996-2015)
Table-A12. FFCBT (Interest expenses & PD before Tax) of MNCs (in million Tk.)
Year BSC BATB GSK HCL LBD RBB SBD
1996 1.65 73.10 0.00 18.62 11.10 0.41 15.77
1997 0.96 81.47 0.00 18.62 17.61 2.27 25.23
1998 1.46 131.53 0.00 18.62 22.29 5.96 16.38
1999 1.39 131.91 0.00 18.62 30.36 5.99 13.85
2000 1.81 71.14 0.00 18.62 25.67 1.38 10.09
2001 5.57 28.05 0.00 18.62 40.07 1.37 15.21
2002 2.78 27.68 0.00 18.62 22.14 2.14 17.67
2003 5.58 115.34 0.00 145.25 12.73 0.02 9.23
2004 10.48 122.54 0.00 124.49 15.20 0.00 7.93
2005 11.65 133.05 1.56 145.50 13.27 0.00 24.20
2006 2.59 160.50 3.83 108.40 4.39 0.00 96.37
2007 2.89 45.57 4.58 64.04 2.03 0.00 142.22
2008 5.04 3.09 8.43 79.30 0.98 0.00 154.75
2009 3.92 3.62 0.83 20.73 0.97 0.00 126.76
2010 3.76 4.73 0.82 8.27 1.39 0.00 5.61
2011 21.21 142.47 3.76 0.30 6.32 0.00 9.08
2012 4.44 184.44 5.15 3.98 8.63 0.00 69.60
2013 6.05 88.80 4.27 8.56 2.97 0.00 43.44
2014 4.95 187.50 3.09 0.21 1.29 0.00 71.73
2015 4.31 142.56 3.31 1.94 0.10 0.00 66.15 Source: Annual Reports of Sample Firms (1996-2015)

Asian Economic and Financial Review, 2018, 8(3): 433-448
448
© 2018 AESS Publications. All Rights Reserved.
Table-A13. Equity Dividend After Tax Paid by Domestic Companies (in million Tk.)
Year AAL AFL AMCL BPL CCL POC SPL
1996 0.00 18.75 0.00 94.40 4.00 10.50 64.00
1997 0.00 0.00 6.00 88.50 11.00 7.00 65.00
1998 6.75 18.75 16.00 132.75 9.50 14.70 87.50
1999 9.00 0.00 16.00 132.75 47.50 22.05 112.50
2000 9.00 7.50 16.00 88.50 47.50 24.50 137.50
2001 9.00 9.00 16.00 88.50 57.00 24.50 162.50
2002 9.00 7.50 20.00 66.38 57.00 24.50 175.00
2003 10.12 7.50 20.00 22.13 38.00 24.50 187.50
2004 10.12 10.50 19.20 50.89 9.50 24.50 210.00
2005 10.12 15.00 19.20 27.99 9.50 24.50 252.00
2006 11.25 16.50 20.80 143.88 9.50 24.50 332.64
2007 33.74 18.75 20.80 52.05 28.50 29.40 372.60
2008 10.12 18.75 20.80 57.25 28.50 29.40 298.08
2009 0.00 33.75 22.40 125.96 0.00 24.50 357.70
2010 23.20 39.38 23.20 0.00 20.90 49.00 482.89
2011 43.83 45.00 24.00 0.00 81.51 147.00 528.16
2012 113.97 50.63 24.80 0.00 74.99 220.50 588.52
2013 0.00 56.25 24.80 0.00 89.99 429.98 662.09
2014 68.38 61.88 24.80 350.33 123.73 803.72 926.92
2015 162.74 61.88 25.60 367.85 112.48 982.32 1446.00 Source: Annual reports of Sample Firms (1996-2015)
Table-A14. Equity Dividend After Tax Paid by MNCs (in million Tk.)
Year BSC BATB GSK HCL LBD RBB SBD
1996 11.40 240.00 24.09 38.70 50.73 7.88 59.84
1997 355.68 280.00 30.12 25.80 38.05 16.54 83.11
1998 150.48 320.00 21.08 77.40 45.65 12.99 216.08
1999 109.44 200.00 36.14 103.20 57.83 14.18 99.73
2000 164.16 400.00 39.15 129.00 60.87 16.54 116.35
2001 136.80 360.00 42.16 180.60 60.87 18.90 124.66
2002 171.00 660.00 45.17 77.40 66.96 15.59 166.21
2003 210.33 570.00 48.19 12.90 152.18 7.09 124.66
2004 179.55 540.00 48.19 0.00 304.37 14.18 166.21
2005 164.16 450.00 60.23 0.00 76.09 16.54 99.73
2006 205.20 180.00 36.14 39.14 76.09 19.85 16.62
2007 342.00 180.00 12.05 86.10 106.53 94.50 58.17
2008 300.96 420.00 30.12 141.26 258.71 103.95 0.00
2009 300.96 1440.00 72.28 186.46 269.36 108.68 201.95
2010 342.00 1800.00 192.74 214.71 497.64 189.00 67.32
2011 342.00 2880.00 240.93 242.97 532.64 80.33 1346.32
2012 376.20 2820.00 180.70 254.27 456.55 37.80 314.14
2013 410.40 3000.00 180.70 282.52 471.77 70.88 294.51
2014 383.04 3720.00 361.39 2147.14 471.77 401.63 1472.53
2015 437.76 3300.00 505.95 2147.14 471.77 283.50 368.13 Source: Annual reports of Sample Firms (1996-2015)
Views and opinions expressed in this article are the views and opinions of the author(s), Asian Economic and Financial Review shall not be responsible or answerable for any loss, damage or liability etc. caused in relation to/arising out of the use of the content.


![A 3D Rotating Laser-Based Navigation Solution for Micro ...bmchen/papers/US2018-4.pdfaccurate state estimation and environment mapping for navigation [7]. (3) Onboard state feedback](https://img.pdfslide.us/doc/110x75/6128957e6602e56df018ee22/a-3d-rotating-laser-based-navigation-solution-for-micro-bmchenpapersus2018-4pdf.jpg)