Embed Size (px)
Citation preview

An Investigation into the Mechanisms of Sludge Reduction Technologies
David J. Riedel Jr.
Thesis submitted to the faculty of the Virginia Polytechnic Institute and State University in
partial fulfillment of the requirements for the degree of
Master of Science
In
Environmental Engineering
Dr. John T. Novak, Chair
Dr. Gregory D. Boardman
Dr. Charles B. Bott
June 1, 2009
Blacksburg, VA
Keywords: sludge reduction technologies, Cannibal, thermal hydrolysis, shear, sonication,
ozone, anaerobic digestion, biosolids

An Investigation into the Mechanisms of Sludge Reduction Technologies
David J. Riedel Jr.
Abstract
Anaerobic digestion has been the preferred method for reducing and stabilizing waste sludge
from biological wastewater treatment for over a century; however, as sludge volumes and
disposal costs increase, there has been a desire to develop various methods for reducing the
volume of sludge to be treated, improving the performance of the digesters, and increasing the
energy value of the sludge. To this end, there have been numerous pretreatment and side-stream
systems studied and developed over the past several decades with the overall goal of reducing
the volume of biosolids to be disposed of in landfills or by land application. These technologies
can be broken into four large groups: mechanical, thermal, chemical and biological, although
there is often overlap between groups.
This research approached the evaluations of these technologies through several methods in the
hopes of developing effective tools for predicting the performance of each technology. Batch
digestion studies mimicking several of these treatment methods and extensive analytical work on
samples from full-scale installations were conducted to determine the effectiveness of each
technology. From these studies a simple batch digestion methodology was developed to analyze
the effectiveness of the Cannibal solids reduction process on wastewater streams that have never
been exposed to it. Batch digestion of sludges pretreated with ozone, mechanical shear and
sonication provided insight into the effectiveness of each technology. Extensive analytical work
on samples collected from full-scale installations of thermal hydrolysis, mechanical shear and the

Cannibal process provided some insight into the workings of each process and potential leads as
to how to further characterize and evaluate each process.

iv
Acknowledgements: I would like to thank my advisor, Dr. John Novak, for his guidance
throughout this research, the wealth of knowledge that he was able to provide and the freedom to
conduct this research in a way that allowed me to develop further academically and
professionally. I would also like to thank my committee members, Drs. Gregory Boardman and,
especially, Charles Bott whose passion for the field of wastewater engineering was my original
impetus to pursue this degree.
Funding for this research was primarily provided by the Water Environment Research Federation
(WERF). Additional funding was provided by Malcolm Pirnie Inc. and Columbus, OH Water
and Sewer Authority. Additional guidance, advice and information were provided by
CH2MHill, Malcolm Pirnie, Inc., and Siemens Water and Wastewater Technologies. Also, the
operators and managers at the Emporia, Christiansburg, Blacksburg and Pepper’s Ferry, VA
wastewater treatment plants willingly provided samples, data and operational advice.
The Novak research group provided invaluable help with sample collection, reactor monitoring
and analysis, especially Jong Min Kim, Passkorn Khanthongthip and Charan Tej Tanneru.
Special thanks to Chris Wilson for being an invaluable source of advice, an open ear when
needed and a mutual source of sanity. Julie Pertruska and Jody Smiley deserve my special
thanks for all the help, experience and knowledge they provided, not to mention their patience
and willingness to provide advice.
Finally, I would like to thank my parents, family and friends for having the faith in me as I have
pursued my degrees and for being a source of advice and grounding when needed.

v
Table of Contents Abstract……………………………………………………………………………………………ii
Acknowledgements……………………………………………………………………………….iv
1 INTRODUCTION ................................................................................................................... 1
2 LITERATURE REVIEW ........................................................................................................ 3
2.1 Wastewater Treatment: An Overview .............................................................................. 3
2.2 Mechanical Pretreatment .................................................................................................. 5
2.2.1 Introduction ............................................................................................................... 5
2.2.2 Violent Shearing Devices ......................................................................................... 6
2.2.3 Sonication Pretreatment ............................................................................................ 8
2.2.4 Disadvantages of Mechanical Pretreatment ............................................................ 11
2.3 Thermal Pretreatment ..................................................................................................... 12
2.3.1 Introduction ............................................................................................................. 12
2.3.2 Studies of THP ........................................................................................................ 14
2.3.3 Additional Advantages of THP ............................................................................... 16
2.3.4 Disadvantages of THP ............................................................................................ 17
2.4 Ozone Pretreatment ........................................................................................................ 18
2.4.1 Introduction ............................................................................................................. 18
2.4.2 Ozone Usages in Wastewater Treatment ................................................................ 19
2.4.3 Advantages of Ozone Treatment of Wastewater .................................................... 21
2.4.4 Disadvantages of Ozone Treatment of Wastewater ................................................ 22
2.5 Cannibal™ Yield Reduction Technology ...................................................................... 23
2.5.1 Introduction to the Cannibal Process ...................................................................... 23
2.5.2 Design Considerations for the Cannibal Process .................................................... 23
2.6 Summary of Sludge Pretreatment and Reduction Technologies .................................... 25
2.7 References ...................................................................................................................... 26
3 MANUSCRIPT I: “SHORT-TERM ANAEROBIC BATCH STUDIES AS AN
INDICATOR OF THE APPLICABILITY OF THE CANNIBAL™ PROCESS TO A RETURN
ACTIVATED SLUDGE STREAM” ............................................................................................ 32
3.1 Abstract .......................................................................................................................... 32
3.2 Introduction .................................................................................................................... 33

vi
3.3 Materials and Methods ................................................................................................... 35
3.3.1 Sludge Samples ....................................................................................................... 35
3.3.2 Batch Reactor Setup ................................................................................................ 36
3.4 Results and Discussion ................................................................................................... 36
3.5 Conclusions .................................................................................................................... 44
3.6 References ...................................................................................................................... 45
4 MANUSCRIPT II: “BATCH STUDIES ON DIFFERENT SLUDGES TO DETERMINE
THE APPLICABILITY OF SHEAR, SONICATION AND OZONE AS PRETREATMENT
PROCESSES” ............................................................................................................................... 46
4.1 Abstract .......................................................................................................................... 46
4.2 Background .................................................................................................................... 46
4.3 Mechanical Pretreatment ................................................................................................ 47
4.3.1 Violent Shearing Devices ....................................................................................... 48
4.3.2 Sonication Pretreatment .......................................................................................... 49
4.3.3 Disadvantages of Mechanical Shear Pretreatment .................................................. 52
4.4 Ozone Pretreatment ........................................................................................................ 53
4.4.1 Introduction ............................................................................................................. 53
4.4.2 Ozone Uses in Wastewater Treatment .................................................................... 53
4.4.3 Advantages of Ozone Treatment of Wastewater .................................................... 55
4.4.4 Disadvantages of Ozone Treatment of Wastewater ............................................. .. 56
4.5 Materials and Methods ................................................................................................... 57
4.5.1 Columbus Batch Digestion Studies ........................................................................ 57
4.5.2 Blacksburg Area WWTP Batch Digestion Studies ................................................. 59
4.6 Results and Discussion ................................................................................................... 60
4.6.1 Columbus Batch Digestion Studies ........................................................................ 60
4.6.2 Blacksburg Area WWTP Batch Digestion Studies ................................................. 70
4.7 Conclusions .................................................................................................................... 75
4.8 References ...................................................................................................................... 75
5 MANUSCRIPT III: “WEF/WERF 05-CTS-3 EVALUATION OF PROCESSES TO
REDUCE ACTIVATED SLUDGE SOLIDS GENERATION AND DISPOSAL”..................... 80
5.1 Introduction .................................................................................................................... 80
5.2 Materials and Methodology ........................................................................................... 81

vii
5.2.1 Sample Collection ................................................................................................... 81
5.2.2 Sample Preservation................................................................................................ 82
5.2.3 Sample Analysis...................................................................................................... 82
5.3 Results and Discussion ................................................................................................... 85
5.3.1 Thermal Hydrolysis Process (THP) ........................................................................ 85
5.3.2 Mechanical Shear Process....................................................................................... 90
5.3.3 Biological Side-Stream Process .............................................................................. 92
5.4 Conclusions .................................................................................................................... 95
5.5 References ...................................................................................................................... 97
6 SUMMARY AND CONCLUSIONS .................................................................................... 99
7 REFERENCES .................................................................................................................... 101
8 APPENDIX A....................................................................................................................... A1
9 APPENDIX B ........................................................................................................................ B1
10 APPENDIX C .................................................................................................................... C1
11 APPENDIX D ................................................................................................................... D1

viii
List of Tables
Table 2.1- Common Sonication Terminology ................................................................................ 9
Table 2.2- Literature Reported Sonication Values ....................................................................... 10
Table 2.3- Literature review on impacts of thermal treatments on waste activated sludge
mesophilic anaerobic digestion (Bougrier et al. 2008) ................................................................. 15
Table 2.4- Ozone Properties ......................................................................................................... 18
Table 3.1- Treatment Plants Investigated ..................................................................................... 35
Table 3.2- Expected Y for the Conventional Treatment Plants Based on Regressions from
Figure 3.3a……………………………………………………………………………………….42
Table 4.1- Common Sonication Terminology .............................................................................. 51
Table 4.2- Literature Reported Sonication Values ....................................................................... 51
Table 4.3- Ozone Properties ......................................................................................................... 53
Table 5.1- Sampling Locations and Analysis Performed ............................................................. 82
Table 5.2- Sample Analyses ......................................................................................................... 84
Table 5.3- Cambi Plant Operating Characteristics ....................................................................... 85
Table 5.4- Concentration Changes Caused by Cambi THP and Digestion .................................. 88
Table 5.5- Rosedale WWTP Characteristics ................................................................................ 90
Table 5.6- Concentration Changes Caused by Crown Press and Digestion ................................. 91
Table 5.7- Cannibal Plant Characteristics ..................................................................................... 93
Table 5.8- Concentration Changes Caused by Two Cannibal Plants ........................................... 94
Table A1- Emporia SCOD Release……………………………………………………………..A1
Table A2- Peru SCOD Release………………………………………………………………….A1
Table A3- Big Bear SCOD Release……………………………………………………………..A2
Table A4- Morongo SCOD Release…………………………………………………………….A2
Table A5- Pepper’s Ferry SCOD Release…………………………………..…………………..A3
Table A6- Christiansburg SCOD Release……………………………………………………….A3
Table A7- Blacksburg SCOD Release………………………………………………………..…A4
Table A8- Change in TS and VS………………………………………………………………..A4
Table B1- Shear Reactor Data…………………………………………………………………...B1
Table B2- Sonication Reactor Data……………………………………………………………...B1
Table B3- Ozone Reactor Data………………………………………………………………….B2
Table B4- Control Reactor Data…………………………………………………………………B2
Table B5- Feed Sludge Data…………………………………………………………………….B3
Table B6- Cation Data (2/5/09)………………………………………………………………….B3
Table C1- Seed Reactor Data……………………………………………………………………C1
Table C2- Christiansburg 1 min Shear Reactor Data……………………………………………C1
Table C3- Pepper’s Ferry 1 min Shear Reactor Data……………………………………………C1
Table C4- Christiansburg 10 min Reactor Data…………………………………………………C2

ix
Table C5- Pepper’s Ferry 10 min Shear Reactor Data…………………………...……………...C2
Table C6- Christiansburg Ozone Reactor Data………………………………………………….C2
Table C7- Pepper’s Ferry Ozone Reactor Data……………………………………………..…..C3
Table C8- Christiansburg Control Reactor Data………………………………………………...C3
Table C9- Pepper’s Ferry Control Reactor Data………………………………………………..C3
Table C10- Christiansburg 1 min Shear Reactor 2 Data………………………………………...C4
Table C11- Pepper’s Ferry 1 min Shear Reactor 2 Data………………………………………..C4
Table D1- Cannibal Data Summary……………………………………………………………..D2
Table D2- Cambi Data Summary………………………………………………………………..D3
Table D3- Crown Data Summary……………………………………………………………….D4
List of Figures Figure 2.1- Shear Pretreatment Process Flow Diagram .................................................................. 6
Figure 2.2- Cambi Process Flow Diagram .................................................................................... 13
Figure 2.3- Sludge Pretreatment with Ozone Process Flow Diagram .......................................... 19
Figure 2.4- Side-Stream Ozone Treatment Process Flow Diagram .............................................. 20
Figure 2.5- Cannibal Process Flow Diagram ................................................................................ 23
Figure 3.1- Cannibal™ Process Flow Diagram ............................................................................ 33
Figure 3.2 (a and b)- SCOD Release in Cannibal and Conventional Batch Reactors .................. 37
Figure 3.3 (a and b)- Total SCOD and Max SCOD Release Normalized to Time .................. 41
Figure 4.1- Shear Pretreatment Process Flow Diagram ................................................................ 48
Figure 4.2- Sludge Pretreatment with Ozone Process Flow Diagram .......................................... 54
Figure 4.3- Side-Stream Ozone Treatment Process Flow Diagram .............................................. 54
Figure 4.4- (a, b and c)- Columbus TS and VS Profiles ............................................................... 61
Figure 4.5- Columbus VSR........................................................................................................... 63
Figure 4.6 (a, b, c and d)- Total and Soluble COD Profiles ......................................................... 65
Figure 4.7- Initial Plant Samples SCOD ....................................................................................... 67
Figure 4.8 (a, b, c and d)- Scanning Electron Microscope Images of Untreated and Treated WAS
....................................................................................................................................................... 68
Figure 4.9 (a and b)- Christiansburg TS and VS .......................................................................... 71
Figure 4.10 (a and b)- Pepper’s Ferry TS and VS ........................................................................ 73
Figure 4.11- Christiansburg and Pepper’s Ferry TCOD ............................................................... 74
Figure 5.1 (a, b, c and d)- Cambi Feed and Effluent .................................................................... 87
Figure 5.2- Crown Press Effluent ................................................................................................. 90
Figure A1- Change in TS and VS………………………………………………………………A5

1
1 INTRODUCTION
Anaerobic digestion has been the preferred method for reducing and stabilizing waste
sludge from biological wastewater treatment for over a century however, as sludge
volumes and disposal costs increase, there has been a desire to develop various methods
for reducing the volume of sludge to be treated, improving the performance of the digesters
and increasing the energy value of the sludge. To this end there have been numerous
pretreatment and side-stream systems developed and studied over the past several decades
with the overall goal of reducing the volume of biosolids to be disposed of in landfills or
by land application. These technologies can be separated into four large groups:
mechanical, thermal, chemical and biological, although there is often overlap between
groups. The primary goal of the pretreatment technologies is to disrupt sludge flocs and, to
some degree, cause cell rupture or lysis. The reduction in mean particle size caused by
these technologies short-circuits the rate-limiting hydrolysis step of anaerobic digestion
which allows more rapid digestion, increased biogas production, lower volumes and a
more stable product. Side-stream technologies incorporated into the activated sludge
recycle stream are focused on reducing the overall plant yield and, in most cases,
eliminating the need for anaerobic digestion because the sludge volumes for disposal are
minimal.
This thesis investigates many of these technologies in the hopes of providing a thorough
overview of the state of the knowledge and developing methods to evaluate the
applicability of some of these processes to wastewater streams. The first section of this
thesis is devoted to a literature review of each of the four categories discussed above.

2
Following the literature review, the thesis is broken into three chapters that provide the
results of research conducted on several of these technologies. Chapter 2 considers the
Cannibal solids reduction process and the development of a simple batch digestion method
to evaluate the effectiveness of the Cannibal system on an activated sludge stream for
conventional (non-Cannibal) activated sludge systems. Chapter 3 addresses the effect of
ozone, mechanical shear and sonication on several different sludges through the use of
batch digestion reactors. The Chapter 4 presents the results of analytical work that was
conducted on samples collected from treatment plants that have full-scale installations
which use several of these treatment technologies, including thermal hydrolysis,
mechanical shear and the Cannibal system.

3
2 LITERATURE REVIEW
2.1 Wastewater Treatment: An Overview
Over the past two centuries wastewater treatment has developed from a non-existent field
into a huge industry that has helped improve quality of life throughout the world.
Wastewater treatment has developed from simple, small systems into huge treatment plants
that receive millions of gallons of wastewater a day. The first systems were essentially
septic tanks and lagoons, often utilizing anaerobic microorganisms to achieve treatment
objectives (McCarty 2001), whereas the current systems utilize a variety of
microorganisms to achieve stringent discharge limits. One factor that has remained
constant since the beginning of wastewater treatment is the generation of sludge or
biosolids. Within the traditional wastewater treatment plant (WWTP) there are two
locations where sludge is generated: primary clarification and waste biomass from the
activated sludge system/biological process. The sludge that is generated at these two
locations is significantly different: those from the primary clarifier are typically readily
degradable, whereas those from the biological process are more resistant to degradation.
The treatment and disposal of these sludges is often a significant portion of WWTPs’
expenses. Since the early twentieth century anaerobic digestion has been the preferred
method for stabilizing the sludge generated during treatment of wastewater (McCarty
2001).
Anaerobic treatment initially required long residence times to achieve treatment objectives
and, subsequently, huge tank volumes to attain those residence times, because of this need,
anaerobic treatment was largely abandoned for secondary treatment of wastewater.

4
However, it was realized that anaerobic treatment of settled sludges had significant
advantages and, with the installation of heating systems on the anaerobic digesters,
significant reductions in residence times where achieved (McCarty 2001). There are two
significant advantages of anaerobic digestion: the reduction of sludge total and volatile
solids concentrations, which reduces the total volume to be disposed, and the generation of
methane (CH4) as an end product, which can be utilized as an energy source and often
allows the digesters to be net energy generators.
Anaerobic digestion consists of three steps: hydrolysis, acidogenesis and methanogenesis.
Each of these steps have been explained in detail in numerous texts (Grady et al. 1999,
Tchobanoglous et al. 2003) and, other than hydrolysis, will not be covered by this
manuscript. Hydrolysis is of concern because it is typically the rate-limiting step in the
anaerobic digestion of sludges, especially of biological sludges. In hydrolysis the
anaerobes break the sludge floc into smaller, more readily degraded particles. The floc is
difficult to break apart because it contains biopolymers (proteins, polysaccharides, lipids)
and fatty acids which act as a glue holding it together; these compounds are typically
composed of long-chain structures which are difficult to break apart (Cui and Jahng 2006,
Hogan et al. 2004). Once the flocs have been hydrolyzed to smaller particles the
subsequent steps in the digestion process are free to be carried out by their respective
anaerobes. Because of the long duration of the hydrolysis step there has been significant
interest over the past several decades in developing methods to accelerate it from a process
that requires days to complete to one that is achieved in hours or even minutes.
From the research that has been conducted on accelerating the hydrolysis step, four major
categories of pretreatment technologies have been investigated, namely mechanical,

5
thermal, chemical and biological. This manuscript will summarize each of these
technologies and their respective applications to the treatment process. All of these
technologies have one common goal that makes them appealing: the reduction of the final
volume of sludge requiring disposal, and many have the additional benefit of increasing
CH4 production.
2.2 Mechanical Pretreatment
2.2.1 Introduction
Mechanical pretreatment can be divided into two categories, both of which have been
investigated to an extent in this research. One category of mechanical shear typically
utilizes violent shearing methods to try to achieve cell lysis and includes such devices as
stirred-ball mills, high-pressure homogenizers, blenders and other devices that exert high
stresses on the sludge. Sonication is the other category of mechanical shear and could be
considered the more refined and less abusive method; in reality, it can cause much greater
stress on the sludge through localized pressure and temperature extremes around the horn
of the sonicator (Hogan et al. 2004, Tiehm et al. 2001). Both of these types of mechanical
pretreatment technologies have their own advantages and disadvantages that will be
discussed in the following paragraphs. A process flow diagram illustrating a typical plant
design with the installation of a shear device for sludge pretreatment is shown in Figure
2.1.

6
Figure 2.1- Shear Pretreatment Process Flow Diagram
2.2.2 Violent Shearing Devices
Studies have been conducted utilizing several types of violent mechanical shearing devices
including stirred-ball mills and high-pressure homogenizers to determine their feasibility
for sludge pretreatment or for modifying the return activated sludge (RAS) line to reduce
the sludge yield in the activated sludge system (Camacho et al. 2002, Kopp et al. 1997,
Lehne et al. 2000, Novak et al. 2007b, Strunkmann et al. 2006). Of important note is that
mechanical shear devices are best applied only to secondary (biological) sludge because its
degradability is significantly less than primary sludge, which gains little benefits from
mechanical treatment (Lehne et al. 2000). It was found that mechanical shear causes floc
disruption and hydrolysis over a short exposure time (Kopp et al. 1997).
One of the most important considerations with mechanical shearing is the energy imparted
to the sludge because of a direct correlation between the energy imparted and the amount
of cell disruption (Kopp et al. 1997, Liu et al. 2005). Low energy input will cause floc
disruption, which allows the microorganisms within the flocs to access additional organic
matter, and reduction in mean particle size, which can result in increased volatile solids
reduction (VSR) in digesters when used as a pretreatment or a reduction in overall yield in
the activated sludge process when used to treat RAS (Camacho et al. 2002, Kopp et al.

7
1997, Lehne et al. 2000). The one disadvantage to a low energy input is a deterioration in
the settling characteristics of the sludge due to the floc dispersion and lighter particles
(Seka and Verstraete 2003). To achieve cell lysis, higher energy must be imparted to the
sludge which also implies a greater operational cost. However, the degradability is
improved when the cells are lysed (Camacho et al. 2002, Liu et al. 2005).
An example of a propriety shear device is the Microsludge™ system which combines
caustic addition with high-pressure homogenization by passing the sludge through a small
orifice and impacting it on a plate (Novak et al. 2007b). It was found that WAS treated
with this system had an approximately eight percent increase in VS reduction and
elimination of foaming issues in bench scale reactors (Novak et al. 2007b).
One constant factor that several researchers found was when the total solids (TS) of the
sludge were increased there was a decrease in required energy input (Kopp et al. 1997,
Lehne et al. 2000). It was also found that with improved digestion and dewatering
resulting from the mechanical shearing there was an increased concentration of nitrogen
species being returned to the activated sludge system including poorly degradable organic
nitrogen (Kopp et al. 1997, Strunkmann et al. 2006).
In summary, the digestion improving pathway followed by mechanical shear devices and
many of the other pretreatment devices is cell and floc disruption which increases digestion
rate resulting in reduced volatile solids (VS), increased sludge density and improved
dewaterability (Kopp et al. 1997).

8
2.2.3 Sonication Pretreatment
Sonication, or ultrasound, is the use of sound energy between the frequencies of 20 kHz
and 10 MHz which is typically caused by the rapid vibration of an object often referred to
as a horn or transducer (Cao et al. 2006, Hogan et al. 2004). This rapid vibration causes
alternating compression and rarefaction, that is, areas of high and low pressure,
respectively, which result in excessive localized temperature and pressure (>5000°K and
several hundred atmospheres) (Show et al. 2007, Tiehm et al. 2001). These extreme
conditions are caused by the formation of cavitation bubbles that rapidly form and burst.
Cavitation bubbles are classified as stable, where the bubble does not expand to its collapse
radius due to the sound pressure during the rarefaction cycle being insufficient, or transient
cavitation, where the pressure is sufficient enough to cause collapse within a few acoustic
cycles (Show et al. 2007). The collapse or resonant radius is the point where the cavitation
bubble ruptures and causes the localized extremes; it is directly proportional to the
frequency of the sound waves (Tiehm et al. 2001).
The extreme conditions caused by sonication result in floc dispersion and subsequent
reduction of mean particle size often through pyrolysis of volatile compounds (Braguglia
et al. 2008, Hogan et al. 2004, Show et al. 2007, Tiehm et al. 2001). Hydroxyl radicals can
also form during sonication and will react with non-volatile compounds in the bulk liquid
(Tiehm et al. 2001, Zhang et al. 2007).
Researchers have found that the solids concentration of sludge affects the efficiency of
sonication and, as with many of the other pretreatment technologies, a more concentrated
sludge produces better results than a thinner sludge (Mao and Show 2006, Show et al.
2007, Zhang et al. 2008). Another parameter that affects the performance of sonication on

9
sludge is the frequency that the device is operated at with lower frequencies causing more
disruption due largely to the higher hydro-mechanical shearing effects (Tiehm et al. 2001).
When discussing sonication there are several terms which need to be defined and are listed
below in Table 2.1.
Table 2.1- Common Sonication Terminology
Terminology Definition Units Source
Ultrasonic Intensity Power supplied per horn or
transducer area W/cm
2 Tiehm et al.2001
Ultrasonic Density Power supplied per sample
volume W/mL Tiehm et al.2001
Ultrasonic Dose Energy supplied per sample
volume W-s/mL Tiehm et al.2001
Specific Ultrasonic
Dose (SUD)
Power supplied for an
exposure time per unit
volume and mass of sample
W-s/kg-solids Muller 2006
In the literature, there has been no uniform method of reporting the energy imparted to the
sample. Table 2.2 presents literature reported values and where possible provides them in
terms of specific ultrasonic dose to promote uniformity and ease of comparison.

10
Table 2.2- Literature Reported Sonication Values
Source Intensity
(W/cm2)
Density
(W/mL)
Dose (W-
s/mL)
SUD (W-
s/kg-solids) Location
Show et al. 2007 0-92 0-0.52 ND ND Pretreatment
Cao et al. 2006 ND 0.25-0.50 ND ND Recycle
Zhang et al.
2008 125 0.80 1440 9.3x10
7 Pretreatment
Xie et al. 2007 13.70 ND ND ND Pretreatment
Muller 2006 15.03 0.59-0.94 107-170 ND Pretreatment and
Recycle
Riedel 2009 15.03 0.3 90 1.4-1.5x10⁶
Pretreatment to
batch digester
As can be seen in Table 2.2, there is a significant range of reported values which makes it
difficult to decide on an optimal dose. However, of all the available units to report
sonication values in, the SUD allows reproducibility because it accounts for the solids
concentration of the sludge so it can be readily adapted to different sludges.
There are several common equations that are utilized when discussing sonication, the first
of which is specific energy (Espec):
(1)
Where P is power imparted, t is time of treatment, V is volume of sludge treated and TS is
the total solids concentration of the sludge (Braguglia et al. 2008).
Another useful equation is the degree of disintegration equation which has can be
expressed in two ways:

11
(2)
Where SCODtreated and SCODuntreated are the soluble COD of the treated and untreated
sludge, CODmax is the maximum COD after complete chemical mineralization when the
sludge is treated with H2SO4 or NaOH (Braguglia et al. 2008, Tiehm et al. 2001).
The other form of the degree of disintegration equation is as follows:
(3)
Where SCODi and SCODf are the soluble COD before and after treatment and TCODi is
the total COD before treatment (Cui and Jahng 2006). This equation removes the
variability of chemical mineralization, which is due to the use of different chemicals to
achieve complete mineralization.
In summary for sonication treatment of sludge, its primary method for floc and cell
disruption is the formation of cavitation bubbles that implode and cause localized extreme
conditions. There is also some effect from the formation of hydroxyl radicals because they
are strong oxidizing agents that could lyse cells or directly degrade organic matter. The
most import parameters to consider when utilizing sonication is optimizing the solids
concentration and the frequency of the device, typically higher for the former and lower for
the latter provide the best results.
2.2.4 Disadvantages of Mechanical Pretreatment
There are four major disadvantages to mechanical shearing devices. One is the high
energy input required to operate these devices, which is an issue with many of the

12
pretreatment technologies; however, much of this energy can be recouped with the
improved digestion of the sludge and the increased biogas production that can be utilized
for power generation. The second disadvantage is maintenance required for many of these
devices, especially the violent ones, due to the high stresses that are exerted on the
mechanical parts during operation. The third disadvantage is with scaling these devices up
to full-sized applications because many of them have only been utilized in lab-scale
applications and may not be feasible for use in larger applications. The final disadvantage
is that sludge settling and dewatering properties often deteriorate.
2.3 Thermal Pretreatment
2.3.1 Introduction
Thermal pretreatment or the thermal hydrolysis process (THP) is a technology that has
been utilized since the early twentieth century in some form or another (Camacho et al.
2008). THP was first marketed under the names of Zimpro™ and Porteus™ as a method
for reducing digester volumes and residence time by utilizing temperatures in excess of
200°C, however, they were plagued with several problems including fouling of heat
exchangers, odors and refractory compounds in the dewatering centrate that caused issues
throughout the WWTPs where they had been installed (Camacho et al. 2008). Because of
these issues, most installations of these processes were abandoned, but the appeal of THP
remained. Throughout the 1970s and 1980s numerous studies were conducted to
determine the effects of thermal treatment on sludges and in the mid-1990s a new THP
process entered the market under the name of Cambi™. This technology addressed some
of the issues of the previous THP systems by operating at lower temperatures (160-180°C)
and by utilizing steam instead of heat exchangers for primary heating of the sludge. Since

13
then, there have been in excess of a dozen installations of the Cambi system along with the
development of at least one other propriety process (Veolia’s Biothelys™ system) that
operates in a similar fashion. A simplified process flow diagram is illustrated in Figure
2.2.
Figure 2.2- Cambi Process Flow Diagram
In its current installations the THP process consists of four primary steps that are outlined
below:
1. Thickening- WAS and primary sludge is thickened to 15-20% using centrifuges, belt
filter presses or other dewatering devices.
2. Pulping- The thickened sludge is pre-heated to 80-100°C using recycled steam from
the main reactor and is homogenized using a recycle loop and macerator.
3. Reactor- The homogenized sludge is fed from the pulper in batch operation and is
brought to 160-180°C and several bars pressure using steam. The reactor is
maintained at these conditions for approximately 30 minutes and produces a product
that meets Class A biosolids standards and causes no filamentous bulking problems in
the digester.

14
4. Flash Tank- Treated sludge is transferred to this tank by the opening of a valve which
causes a rapid drop in pressure drawing the sludge from one tank to the other and
causing some degree of cell lysing. The sludge is cooled to the digester temperature
in this tank.
2.3.2 Studies of THP
As was mentioned previously, there has been interest in thermal hydrolysis for several
decades, so there are numerous studies that have been conducted to determine optimal
conditions. One of the significant studies was conducted by Stuckey and McCarty in 1984
with the objective of determining the optimal temperature for thermal hydrolysis of sludge.
They conducted batch studies with sludge that was thermally pretreated at temperatures
ranging from 150-275°C then subsequently digested for 34 and 81 days. From this study
they found that a temperature of 175°C is optimal because it balances the hydrolysis of
recalcitrant compounds to soluble ones and soluble organic compounds to insoluble
compounds (Stuckey and McCarty 1984). This statement was also supported by research
conducted by Fdz-Polanco and colleagues who found that the biodegradability of
pretreated sludge decreased after a certain temperature was achieved because of the
increase of these recalcitrant compounds (Fdz-Polanco et al. 2008). Another study found
that temperature is the most important parameter for thermal pretreatment and that
treatment time has little effect (Carrere et al. 2007). Stuckey and McCarty also found that
digestion after pretreatment at mesophilic temperatures (30-40°C) resulted in greater
bioconvertibility at all pretreatment temperatures than digestion at thermophilic
temperatures (>50°C) (Stuckey and McCarty 1984).

15
In their most recent article, Bougrier and colleagues presented a concise summary of most
of the studies that have been undertaken on thermal hydrolysis and the conditions
investigated which is reproduced below in Table 2.3.
Table 2.3- Literature review on impacts of thermal treatments on waste activated
sludge mesophilic anaerobic digestion (Bougrier et al. 2008)
Reference Thermal
Treatment
Anaerobic
Digestion Results
Haug et al.
1978
175°C, 30
min
CSTR, HRT= 15
d
Increase of CH4 production
from 115-186 ml/g CODin
(+62%)
Stuckey and
McCarty 1978
175°C, 60
min Batch, 25 d
Increase of convertibility of
COD to CH4 from 48 to 68%
(+42%)
Li and Noike
1992
175°C, 60
min CSTR, HRT= 5 d
Increase of gas production from
108 to 216 ml/g CODin (+100%)
Tanaka et al.
1997
180°C, 60
min Batch, 8 d
Increase of methane production
(+90%)
Fjordside
2001 160°C CSTR, 15 d
Increase of biogas production
(+60%)
Gavala et al.
2003 70 °C, 7 d Batch
Increase of CH4 production
from 8.30 to 10.45 mmol/g VSin
(+26%)
Barjenbruch
and Kopplow
2003
121 °C, 60
min CSTR, 20 d
Increase of biogas production
from 350 to 420 ml/g VSSin
(+20%)
Kim et al.
2003
121 °C, 30
min Batch, 7 d
Increase of biogas production
from 3657 to 4843 l/m3 WASin
(+32%)
(Dobhanyos et
al. 2004 170 °C, 60 s
Batch, 20 d
Thermophilic
Increase of biogas production
(+49%)
Valo et al.
2004
170 °C, 60
min Batch, 24 d
Increase of biogas production
(+45%)
Valo et al.
2004
170 °C, 60
min CSTR, 20 d
Increase of CH4 production
from 88 to 142 ml/g CODin
(+61%)
Graja et al.
2005
175 °C, 40
min
Fixed film
Reactor, HRT=
2.9 d
65% reduction of TSS
Bougrier et al.
2006a
170 °C, 30
min Batch, 24 d
Increase of CH4 production
from 221 to 333 ml/g CODin

16
(+76%)
Bourgrier et
al. 2006b
170 °C, 30
min CSTR, 20 d
Increase of CH4 production
from 145 to 256 ml/g VSin
(+51%)
Recently, Bougrier and colleagues have conducted several studies on thermal hydrolysis
that are especially concerned with the effects on the proteins, lipids and carbohydrates
contained within the floc and cells (Bougrier et al. 2006b, Bougrier et al. 2007b, Bougrier
et al. 2008). In one of these studies they found that the exocellular carbohydrates that are
contained in the exocellular polymeric substances (EPS) are hydrolyzed at lower
temperatures, whereas proteins, which are typically intracellular, require a higher
temperature to be released by cell lysis. At these higher temperatures the solubilized
carbohydrates react with themselves and the soluble proteins that have been released from
the cells to form organic compounds like melanoidins or Amadori compounds which
contribute to the brown color of the supernatant of thermally treated sludges (Bougrier et
al. 2008).
There has also been research into the effect of chemical pretreatment before thermal
pretreatment, typically utilizing bases such as NaOH and KOH (Bougrier et al. 2006b,
Stuckey and McCarty 1984). Both studies found that alkaline addition had little effect on
biodegradability of sludges treated in the optimal temperature range of 160-180 °C,
however, Bougrier et al. found improvements at a temperature of 130 °C.
2.3.3 Additional Advantages of THP
Additional benefits that have been found for thermal pretreatment include:

17
The improvement of filterability and disintegration of the sludge and the
improvement of digestibility and dewaterability (Barr et al. 2008, Bougrier et al.
2007b, Carrere et al. 2007, Fdz-Polanco et al. 2008);
A final product that meets Class A standards for land application (Camacho et al.
2008);
The high temperatures ensure the destruction of foam causing organisms that can
cause issues in digesters (Barr et al. 2008);
Digester size can be significantly reduced because of the reduced residence time that
is achieved by the acceleration of the hydrolysis phase and the ability to feed a sludge
with a higher TS concentration (Barr et al. 2008);
The system is typically a net energy producer because of the increased biogas
quantity and quality that can be used to heat the boilers and generate power that
exceeds the requirements of the THP system (Barr et al. 2008).
As with most of the other pretreatment technologies, higher solids concentrations result in
better performance (Fdz-Polanco et al. 2008).
2.3.4 Disadvantages of THP
There are several disadvantages to THP systems that need to be considered:
As was mentioned previously, there are higher concentrations of recalcitrant
compounds that are difficult to remove and are recycled to the main biological
process in the dewatering supernatant;
The supernatant also contains high concentrations of nutrients that will affect the
operation of the activated sludge system especially in plants where nutrient removal is
a high priority;

18
Due to the reduced particle size there have been issues with dewatering, especially
using centrifuges, so Cambi typically utilizes belt filter presses for final dewatering
(Barr et al. 2008);
Depending on the influent wastewater stream, there can be issues with the heat
exchangers clogging as happened at the installation in Dublin, Ireland because it was
receiving wastewater with high fiber content from a pulp mill but the issue was
solved by recycling digested sludge to the heat exchangers which raised the pH
(Pickworth et al. 2006).
2.4 Ozone Pretreatment
2.4.1 Introduction
Ozone is a treatment technology that is receiving increased attention in both the water and
wastewater industries primarily as a disinfectant alternative to chlorine species
(Tchobanoglous et al. 2003). The chemical characteristics of ozone are listed in Table 2.4.
Table 2.4- Ozone Properties (Material Safety Data Sheet 2000)
Characteristic Value
Chemical Formula O3
Molecular Weight 48 g/mole
Specific Gravity 2.144 g/L
Vapor Density 1.7
Solubility in Water 0.49 % by wt.
Ozone is a highly reactive, strong oxidant which has the potential to cause explosions
when in contact with many organic compounds and can also create intermediaries that are
as dangerous (Material Safety Data Sheet 2000). It is generated from air or pure oxygen

19
using a high voltage electrical discharge called corona discharge and due to its short life
span it is produced on site (Panda and Mathews 2008).
2.4.2 Ozone Usages in Wastewater Treatment
As was mentioned previously, ozone is receiving attention in wastewater treatment as a
disinfectant before final discharge because of its ability to kill or inactivate bacteria and
protozoa, including ones that are resistant to chlorine, and the lack of disinfection
byproducts formed by it (Panda and Mathews 2008). There are other applications for
ozone that are being investigated for use at wastewater treatment plants including usage as
a pretreatment before digestion and as a side-stream reactor on the recycle loop to reduce
the overall plant yield. Below are process flow diagrams illustrating ozone used as a
pretreatment technology (Figure 2.3) and side-stream recycle (Figure 2.4).
Figure 2.3- Sludge Pretreatment with Ozone Process Flow Diagram

20
Figure 2.4- Side-Stream Ozone Treatment Process Flow Diagram
As a pretreatment for digestion of sludge, ozone serves to cause floc and cell disruption
allowing better, more-rapid digestion (Ahn et al. 2002, Bernal-Martinez et al. 2007,
Bougrier et al. 2006a, Bougrier et al. 2007a, Carballa et al. 2007, Chu et al. 2008,
Manterola et al. 2008, Mines et al. 2008, Yeom et al. 2002, Zhao et al. 2007). There have
also been studies investigating the usage of ozone pretreated sludge and dewatering
centrate as a carbon source for nitrification (Ahn et al. 2002, Lee et al. 2005, Sakai et al.
1997, Yeom et al. 2002, Zhao et al. 2007). It has been investigated as a side-stream
process attached to the return activated sludge line to treat a percentage of the RAS with
the intention of minimizing sludge yield in the activated sludge process (Ahn et al. 2002,
Boehler and Siegrist 2006, Kamiya and Hirotsuji 1998, Lee et al. 2005, Yeom et al. 2002).
Of important consideration for ozone treatment are the effects of temperature, dissolved
oxygen and total solids upon the mass transfer coefficient (Manterola et al. 2008, Panda
and Mathews 2008). The dose also affects the results of treatment of wastewater with
ozone with literature reported values ranging from 0.05 to 0.50 g O3/g TS (Bougrier et al.
2006a, Chu et al. 2008, Dogruel et al. 2007, Manterola et al. 2008, Mines et al. 2008, Sakai
et al. 1997, Zhao et al. 2007). Typically, with higher ozone doses there is a greater

21
solubilization of organic matter (Ahn et al. 2002, Manterola et al. 2008). When using
ozone as a yield reduction technology on the return line in activated sludge processes there
is a minimum dose required to achieve yield reduction (Kamiya and Hirotsuji 1998).
Ozone has direct and indirect treatment pathways which include the direct oxidation of
organic material to carbon dioxide and the formation of hydroxyl radicals which react
indirectly with compounds and organic material (Carballa et al. 2007, Chu et al. 2008).
2.4.3 Advantages of Ozone Treatment of Wastewater
Ozone treatment of wastewater has several advantages that make it an appealing
technology, especially with increasingly stringent regulations. As a strong oxidant, ozone
can break down or increase the bioavailability of many polycyclic aromatic hydrocarbons
(PAHs), pharmaceutical and personal care products (PPCPs), dyes and other industrial
byproducts that are becoming more prevalent in wastewaters and typically are not removed
by conventional biological treatment (Bernal-Martinez et al. 2007, Carballa et al. 2007,
Chu et al. 2008). It can help control the growth of bulking organisms in both the activated
sludge process and digesters (Ahn et al. 2002). When used as a pretreatment technology
prior to anaerobic digestion, it can potentially increase the production of methane
(Bougrier et al. 2007a, Carballa et al. 2007). It also causes floc disruption and cell
hydrolysis which releases soluble proteins and carbohydrates to the bulk liquid and
improves degradability (Ahn et al. 2002, Zhao et al. 2007). Other advantages include:
Decreased viscosity, improved settleablity and reduced odors (Bougrier et al. 2007a);
Yield reduction in activated sludge systems (Kamiya and Hirotsuji 1998, Lee et al.
2005, Sakai et al. 1997);

22
Potential carbon source for denitrification with equivalent energy to glucose (Ahn et
al. 2002, Lee et al. 2005, Sakai et al. 1997, Yeom et al. 2002, Zhao et al. 2007);
Increased mineralization of organic material (Bougrier et al. 2007a).
2.4.4 Disadvantages of Ozone Treatment of Wastewater
As with the other pretreatment technologies there are disadvantages to the use of ozone in
wastewater treatment, which are listed below:
Increased inert and colloidal COD due to the disintegration of sludge flocs and cells
which often increases the non-biodegradable COD in the plant effluent due to
recycling of dewatering centrate to the biological process or the use of ozone
treatment on the RAS line (Boehler and Siegrist 2006);
Decreased dewaterability, increased sludge volume index (SVI) and capillary suction
time (CST) of digested sludge because of smaller particles (Ahn et al. 2002, Bougrier
et al. 2006a, Bougrier et al. 2007a, Carballa et al. 2007);
Decreased pH due to formation of carboxylic acid from organic material and
consumption of alkalinity by the oxidation or organic material (Bougrier et al.
2007a);
When used to minimize yield, phosphorus removal is reduced because one of the
primary removal mechanisms is sludge wasting (Sakai et al. 1997);
Ozone generation is an energy intensive process and requires significant capital
investment in machinery (Panda and Mathews 2008);
Mass transfer kinetics need to be optimized to the sludge characteristics (Lee et al.
2005, Panda and Mathews 2008).

23
2.5 Cannibal™ Yield Reduction Technology
2.5.1 Introduction to the Cannibal Process
The Cannibal solids reduction process is a proprietary technology that utilizes an anaerobic
side-stream reactor to treat part of the RAS flow with the intention of reducing the overall
plant yield. It has been installed in some form or another at more than twenty plants
throughout the United States. An illustration of how the system is typically set up is
presented in Figure 2.5.
Figure 2.5- Cannibal Process Flow Diagram
2.5.2 Design Considerations for the Cannibal Process
The concept behind this system is that the anaerobic reactor, referred to as the interchange
reactor, will select for different organisms than the activated sludge system. These
organisms break down the aerobic sludge flocs releasing floc-bound EPS that is
subsequently utilized as organic material for them to grow. The excess microorganisms
from the interchange reactor are then recycled to the activated sludge system where they
are degraded by the aerobes which regenerate the EPS and other organic material
(Easwaran 2006, Novak et al. 2007a). The net result is a system that maintains a relatively
constant substrate concentration through the release and uptake of different organic
material depending on the zone, in essence cannibalizing itself.

24
The key component to maintaining a steady suspended solids concentration throughout the
system is the optimization of the interchange rate through the interchange reactor.
Through several studies conducted by Novak the optimal interchange rate has been
determined to be around ten percent of the return sludge flow (Chon 2005, Easwaran 2006,
Novak et al. 2007a).
Despite the installation of the Cannibal system at numerous plants it is not fully
understood, but there are several characteristics that seem to affect the operational
performance:
The configuration of the activated sludge system has a significant effect on system
efficiency with plug flow systems performing better than complete mix systems;
There is no specific “Cannibal” microorganism, rather a unique microbial community
develops that includes slower growing microorganisms that are typically washed out
in conventional activated sludge systems; these microbes could include fermenters,
iron reducers, polyphosphate accumulating organisms (PAOs) and Anamox
organisms (Chon 2005, Goel and Noguera 2006, Novak et al. 2007a);
The operation of the solids separating unit, which includes fine screens and cyclone
grit removal, is essential in preventing the accumulation of inorganic material in the
system, especially when there is no primary clarification, however this solids removal
is a small portion of the overall plant yield;
Endogenous decay contributes to the overall yield reduction (Goel and Noguera
2006).
Additional design considerations for the Cannibal process include:

25
The applicability of the system to particular wastewater streams and treatment setups,
e.g. industrial wastewaters and advanced treatment systems like membranes;
The nutrient removal capabilities, especially phosphorus, since there is little wasting
that allows for the removal of excess PAOs and the possible formation of inorganic
phosphorus compounds due to higher cation concentrations both resulting in the build
up of phosphorus in the system and increased levels in the plant effluent (Goel and
Noguera 2006);
The applicability of the system to larger treatment plants.
2.6 Summary of Sludge Pretreatment and Reduction Technologies
Each of the systems investigated in this literature review have their respective advantages
and disadvantages that have been covered in depth previously, however several of the key
ones will be summarized here:
Advantages:
o Improvement of sludge digestibility and dewaterability (pretreatment) or yield
reduction (side-stream treatment)
o Decreased digester and solids handling footprint
o Reduction of odors
o Production of stable product that meets many regulations for land application and
is appealing for that use
o Energy self-sustaining and often provider with proper utilization of increased
biogas production
o Potential carbon source for nutrient removal

26
Disadvantages:
o Production of recalcitrant byproducts that are difficult to remove
o Increased nutrient recycle to activated sludge process
o Energy intensive, especially if not properly recouped through co-generation
o Scale-up issues, both from lab to full-scale and small to large scale
o Additional odors during pretreatment requiring advanced treatment
o Minimal number of full-scale installations for comparison
Cost-benefit analyses of these technologies are essential to determining the applicability of
each to specific treatment plants; however, as treatment costs and volumes continue to rise
while available area decreases, these technologies will become more appealing.
2.7 References
Ahn, K. H., Yeom, I. T., Park, K. Y., Maeng, S. K., Lee, Y., Song, K. G., and Hwang, J. H.
(2002). "Reduction of sludge by ozone treatment and production of carbon source for
denitrification." Water Science and Technology, 46(11-12), 121-125.
Barjenbruch, M., and Kopplow, O. (2003). "Enzymatic, mechanical and thermal pretreatment of
surplus sludge." Advanced Environmental Research, 7(3), 715-720.
Barr, K. G., Solley, D. O., Starrenburg, D. J., and Lewis, R. G. (2008). "Evaluation, selection and
initial performance of a large scale centralised biosolids facility at Oxley Creek Water
Reclamation Plant, Brisbane." Water Science and Technology, 57(10), 1579-1586.
Bernal-Martinez, A., Carrere, H., Patureau, D., and Delgenes, J.-P. (2007). "Ozone pre-treatment
as improver of PAH removal during anaerobic digestion of urban sludge." Chemosphere,
68(6), 1013-1019.
Boehler, M., and Siegrist, H. (2006). "Potential of activated sludge ozonation." 4th International
Conference on Oxidation Technologies for Water and Wastewater Treatment, I W a
Publishing, Goslar, GERMANY, 181-187.
Bougrier, C., Albasi, C., Delgenes, J. P., and Carrere, H. (2006a). "Effect of ultrasonic, thermal
and ozone pre-treatments on waste activated sludge solubilisation and anaerobic
biodegradability." Chemical Engineering and Processing, 45(8), 711-718.

27
Bougrier, C., Battimelli, A., Delgenes, J.-P., and Carrere, H. (2007a). "Combined ozone
pretreatment and anaerobic digestion for the reduction of biological sludge production in
wastewater treatment." Ozone: Science and Engineering, 29(3), 201-206.
Bougrier, C., Delgenes, J. P., and Carrere, H. (2006b). "Combination of thermal treatments and
anaerobic digestion to reduce sewage sludge quantity and improve biogas yield." Process
Safety and Environmental Protection, 84(4 B), 280-284.
Bougrier, C., Delgenes, J. P., and Carrere, H. (2007b). "Impacts of thermal pre-treatments on the
semi-continuous anaerobic digestion of waste activated sludge." Biochemical
Engineering Journal, 34(1), 20-27.
Bougrier, C., Delgenes, J. P., and Carrere, H. (2008). "Effects of thermal treatments on five
different waste activated sludge samples solubilisation, physical properties and anaerobic
digestion." Chemical Engineering Journal, 139(2), 236-244.
Braguglia, C. M., Mininni, G., and Gianico, A. (2008). "Is sonication effective to improve biogas
production and solids reduction in excess sludge digestion?" Water Science and
Technology, 57(4), 479-483.
Camacho, P., Ewert, W., Kopp, J., Panter, K., Perez-Elvira, S. I., and Piat, E. (2008). "Combined
experiences of thermal hydrolysis and anaerobic digestion– latest thinking on thermal
hydrolysis of secondary sludge only for optimum dewatering and digestion."
WEFTEC08, Water Environment Federation, Chicago.
Camacho, P., Geaugey, V., Ginestet, P., and Paul, E. (2002). "Feasibility study of mechanically
disintegrated sludge and recycle in the activated-sludge process." Water Science and
Technology, 46(10), 97-104.
Cao, X. Q., Chen, J., Cao, Y. L., Zhu, J. Y., and Hao, X. D. (2006). "Experimental study on
sludge reduction by ultrasound." 5th World Water Congress of the International-Water-
Association, I W a Publishing, Beijing, PEOPLES R CHINA, 87-93.
Carballa, M., Manterola, G., Larrea, L., Ternes, T., Omil, F., and Lema, J. M. (2007). "Influence
of ozone pre-treatment on sludge anaerobic digestion: Removal of pharmaceutical and
personal care products." Chemosphere, 67(7), 1444-1452.
Carrere, H., Bougrier, C., Castets, D., and Delgenes, J. P. (2007). "Impact of initial
biodegradability on sludge anaerobic digestion enhancement by thermal pretreatment."
IWA Specialist Conference on Facing Sludge Diversities, Taylor and Francis Inc,
Antalya, TURKEY, 1551-1555.
Chon, D. H. (2005). "Performance and mechanisms of excess sludge reduction in the CannibalTM
process," Virginia Polytechnic Institute and State University Blacksburg.

28
Chu, L. B., Yan, S. T., Xing, X. H., Yu, A. F., Sun, X. L., and Jurcik, B. (2008). "Enhanced
sludge solubilization by microbubble ozonation." Chemosphere, 72(2), 205-212.
Cui, R., and Jahng, D. (2006). "Enhanced methane production from anaerobic digestion of
disintegrated and deproteinized excess sludge." Biotechnology Letters, 28(8), 531-538.
Dogruel, S., Sievers, M., and Germirli-Babuna, F. (2007). "Effect of ozonation on
biodegradability characteristics of surplus activated sludge." Ozone-Sci. Eng., 29(3), 191-
199.
Dohanyos, M., Zabranska, J., Kutil, J., and Jenicek, P. (2004). "Improvement of anaerobic
digestion of sludge." Water Science and Technology, 49(10), 89-96.
Easwaran, S. P. (2006). "Developing a mechanistic understanding and optimization of the
CannibalTM
process phase II," Virginia Polytechnic Institute and State University,
Blacksburg.
Fdz-Polanco, F., Velazquez, R., Perez-Elvira, S. I., Casas, C., del Barrio, D., Cantero, F. J., Fdz-
Polanco, M., Rodriguez, P., Panizo, L., Serrat, J., and Rouge, P. (2008). "Continuous
thermal hydrolysis and energy integration in sludge anaerobic digestion plants." Water
Science and Technology, 57(8), 1221-1226.
Fjordside, C. (2001). "An operating tale from Naeested Sewage Treatment plant."
MunicipalWastewater Treatment Nordic Conference, Copenhagen.
Gavala, H. N., Yenal, U., Skiadas, I. V., Westermann, P., and Ahring, B. K. (2003). "Mesophilic,
thermophilic anaerobic digestion of primary and secondary sludge. Effect of pre-
treatment at elevated temperature." Water Research, 37, 4561-4572.
Goel, R. K., and Noguera, D. R. (2006). "Evaluation of sludge yield and phosphorus removal in
a Cannibal solids reduction process." Journal of Environmental Engineering, 132(10),
1331-1337.
Grady, C. P. L., Daigger, G. T., and Lim, H. C. (1999). Biological Wastewater Treatment, 2nd
Ed., Marcel Dekker, New York.
Graja, S., Chauzy, J., Fernandes, P., Patria, L., and Cretenot, D. (2005). "Reduction of sludge
production from WWTP using thermal pretreatment and enhanced anaerobic
methanisation." Water Science and Technology, 52(1-2), 267-273.
Haug, R. T., Stuckey, D. C., Gossett, J. M., and McCarty, P. L. (1978). "Effect of thermal
pretreatment on digestibility and dewaterability of organic sludges." Journal Water
Pollution Control Federation, 73-85.
Hogan, F., Mormede, S., Clark, P., and Crane, M. (2004). "Ultrasonic sludge treatment for
enhanced anaerobic digestion." Water Science and Technology, 50(9), 25-32.
29
Kamiya, T., and Hirotsuji, J. (1998). "New combined system of biological process and
intermittent ozonation for advanced wastewater treatment." Water Science and
Technology, 38(8-9 pt 7), 145-153.
Kim, J., Park, C., Kim, T. H., Lee, M., Kim, S., Kim, S. W., and Lee, J. (2003). "Effects of
various pretreatments for enhanced anaerobic digestion with waste activated sludge."
Journal of Bioscience and Bioengineering, 95(3), 271-275.
Kopp, J., Mueller, J., Dichtl, N., and Schwedes, J. (1997). "Anaerobic digestion and dewatering
characteristics of mechanically disintegrated excess sludge." Water Science and
Technology, 36(11), 129-136.
Lee, J. W., Cha, H.-Y., Park, K. Y., Song, K. G., and Ahn, K. H. (2005). "Operational strategies
for an activated sludge process in conjunction with ozone oxidation for zero excess
sludge production during winter season." Water Research, 39, 1199-1204.
Lehne, G., Muller, A., and Schwedes, J. (2000). "Mechanical disintegration of sewage sludge."
1st World Water Congress of the International-Water-Association (IWA), Paris, France,
19-26.
Li, Y. Y., and Noike, T. (1992). "Upgrading of anaerobic digestion of waste activated sludge by
thermal pretreatment." Water Science and Technology, 26, 857-866.
Liu, Q.-S., Liu, Y., Tay, J.-H., and Kuan, Y. S. (2005). "Responses of sludge flocs to shear
strength." Process Biochemistry, 40(10), 3213-3217.
Manterola, G., Uriarte, I., and Sancho, L. (2008). "The effect of operational parameters of the
process of sludge ozonation on the solubilisation of organic and nitrogenous
compounds." Water Research, 42(12), 3191-3197.
Mao, T., and Show, K. Y. (2006). "Performance of high-rate sludge digesters fed with sonicated
sludge." 5th World Water Congress of the International-Water-Association, I W a
Publishing, Beijing, PEOPLES R CHINA, 27-33.
Material Safety Data Sheet, M. (2000). "Ozone MSDS."
<http://www.ozoneapplications.com/info/ozone_msds.htm> (2/10/2009, 2009).
McCarty, P. L. (2001). "The developmental of anaerobic treatment and its future." Water Science
and Technology, 44(8), 149-156.
Mines, R. O., Northenor, C. B., and Murchison, M. (2008). "Oxidation and ozonation of waste
activated sludge." J. Environ. Sci. Health Part A-Toxic/Hazard. Subst. Environ. Eng.,
43(6), 610-618.

30
Muller, C. D. (2006). "Shear Forces, Floc Structure and their Impact on Anaerobic Digestion and
Biosolids Stability," Dissertation, Virginia Polytechnic Institute and State University,
Blacksburg.
Novak, J. T., Chon, D. H., Curtis, B. A., and Doyle, M. (2007a). "Biological solids reduction
using the Cannibal process." Water Environment Research, 79(12), 2380-2386.
Novak, J. T., Park, C., Higgins, M., J,, Chen, Y., Morton, R., Gary, D., Forbes, R., and Erdal, Z.
(2007b). "WERF Odor Study Phase III: Impacts of the MicroSludge Process on Odor
Causing Compounds." In: WEF Residuals and Biosolids Management Conference, Water
Environment Federation.
Panda, K. K., and Mathews, A. P. (2008). "Mass transfer of ozone in a novel in situ ozone
generator and reactor." J. Environ. Eng.-ASCE, 134(10), 860-869.
Pickworth, B., Adams, J., Panter, K., and Solheim, O. E. (2006). "Maximising biogas in
anaerobic digestion by using engine waste heat for thermal hydrolysis pre-treatment of
sludge." Water Science and Technology, 54(5), 101-108.
Sakai, Y., Fukase, T., Yasui, H., and Shibata, M. (1997). "Activated sludge process without
excess sludge production." Water Science and Technology, 36(11), 163-170.
Seka, M. A., and Verstraete, W. (2003). "Test for assessing shear sensitivity of activated sludge
flocs: A feasibility study." Water Research, 37(14), 3327-3334.
Show, K. Y., Mao, T. H., and Lee, D. J. (2007). "Optimisation of sludge disruption by
sonication." Water Research, 41(20), 4741-4747.
Strunkmann, G. W., Muller, J. A., Albert, F., and Schwedes, J. (2006). "Reduction of excess
sludge production using mechanical disintegration devices." Water Science and
Technology, 54(5), 69-76.
Stuckey, D. C., and Carty, P. L. M. (1978). "Thermochemical pretreatment of nitrogenous
materials to increase methane yield." Biotechnology and Bioengineering Symposium,
219-233.
Stuckey, D. C., and McCarty, P. L. (1984). "Effect of thermal pretreatment on the anaerobic
biodegradability and toxicity of waste activated sludge." Water Research, 18(11), 1343-
1353.
Tanaka, S., Kobayashi, T., Kamiyama, K. I., and Bildan, L. N. (1997). "Effects of
thermochemical pretreatment on the anaerobic digestion ofwaste activated sludge." Water
Science and Technology, 35(8), 209-215.
Tchobanoglous, G., Burton, F. L., and Stensel, H. D. (2003). Wastewater engineering : treatment
and reuse, 4th Ed., McGraw-Hill,, Boston.
31
Tiehm, A., Nickel, K., Zellhorn, M., and Neis, U. (2001). "Ultrasonic waste activated sludge
disintegration for improving anaerobic stabilization." Water Research, 35(8), 2003-2009.
Valo, A., Carrere, H., and Delgenes, J. P. (2004). "Thermal, chemical and thermo-chemical pre-
treatment of waste activated sludge for anaerobic digestion." Journal of Chemical
Technology and Biotechnology, 79, 1197-1203.
Xie, R., Xing, Y., Ghani, Y. A., Ooi, K. E., and Ng, S. W. (2007). "Full-scale demonstration of
an ultrasonic disintegration technology in enhancing anaerobic digestion of mixed
primary and thickened secondary sewage sludge." J. Environ. Eng. Sci., 6(5), 533-541.
Yeom, I. T., Lee, K. R., Lee, Y. H., Ahn, K. H., and Lee, S. H. (2002). "Effects of ozone
treatment on the biodegradability of sludge from municipal wastewater treatment plants."
Water Science and Technology, 46(4-5), 421-425.
Zhang, G. M., Zhang, P. Y., Yang, J., and Liu, H. Z. (2008). "Energy-efficient sludge sonication:
Power and sludge characteristics." Bioresour. Technol., 99(18), 9029-9031.
Zhang, G. M., Zhang, P. Y., Yang, J. M., and Chen, Y. M. (2007). "Ultrasonic reduction of
excess sludge from the activated sludge system." Journal of Hazardous Materials,
145(3), 515-519.
Zhao, Y. X., Yin, J., Yu, H. L., Han, N., and Tian, F. J. (2007). "Observations on ozone
treatment of excess sludge." Water Science and Technology, 56(9), 167-175.

32
3 MANUSCRIPT I: “SHORT-TERM ANAEROBIC BATCH
STUDIES AS AN INDICATOR OF THE APPLICABILITY OF
THE CANNIBAL™ PROCESS TO A RETURN ACTIVATED
SLUDGE STREAM”
3.1 Abstract
The Cannibal™ solids reduction process is a proprietary technology that utilizes an
anaerobic side-stream reactor to treat part of the return activated sludge (RAS) flow with
the intention of reducing the overall sludge yield. It has been installed in some form or
another at more than twenty plants throughout the United States.
The objective of this study was to develop a method for easily evaluating the applicability
of the Cannibal system to a wastewater stream that has never used a Cannibal system. To
achieve this goal, small, short-term batch digestion studies were conducted and were
analyzed daily for SCOD. It was thought that a greater release of soluble COD might
indicate that the system was more susceptible to solids reduction using the Cannibal
process. Sludges from operating Cannibal plants, lab Cannibal systems and non-Cannibal
plants were assessed. From these data clear correlations could be observed with better
operating Cannibal systems typically having a greater SCOD release. Several
conventional treatment plants were used to test this model and similar release patterns were
observed for these plants, which were interpreted to indicate the relative applicability of
the Cannibal system.

33
3.2 Introduction
The Cannibal™ solids reduction process is a proprietary technology that utilizes an
anaerobic side-stream reactor to treat part of the return activated sludge (RAS) flow with
the intention of reducing the overall sludge yield. It has been installed in some form or
another at more than twenty plants throughout the United States. An illustration of how
the system is typically set up is presented in Figure 3.1.
Figure 3.1- Cannibal Process Flow Diagram
The concept behind this system is that the anaerobic reactor, referred to as the interchange
reactor, will select for different organisms than the activated sludge system. These
organisms break down the aerobic sludge flocs releasing floc-bound EPS that is
subsequently utilized as organic material for them to grow. The excess microorganisms
from the interchange reactor are then recycled to the activated sludge system where they
are degraded by the aerobes which regenerate the EPS and other organic material
(Easwaran 2006, Novak et al. 2007a). The net result is a system that maintains a relatively
constant substrate concentration through the release and uptake of different organic
material depending on the zone, in essence cannibalizing itself.
The key component to maintaining a steady suspended solids concentration throughout the
system is the optimization of the interchange rate through the interchange reactor.

34
Through several studies conducted by Novak the optimal interchange rate has been
determined to be around ten percent of the return sludge flow (Chon 2005, Easwaran 2006,
Novak et al. 2007a).
Despite the installation of the Cannibal system at numerous plants it is not fully
understood, but there are several characteristics that seem to affect the operational
performance:
The configuration of the activated sludge system has a significant effect on system
efficiency with plug flow systems performing better than complete mix systems;
There is no specific “Cannibal” microorganism, rather a unique microbial community
develops that includes slower growing microorganisms that are typically washed out
in conventional activated sludge systems; these microbes could include fermenters,
iron reducers, polyphosphate accumulating organisms (PAOs) and Anamox
organisms (Chon 2005, Goel and Noguera 2006, Novak et al. 2007a);
The operation of the solids separating unit, which includes fine screens and cyclone
grit removal, is essential in preventing the accumulation of inorganic material in the
system, especially when there is no primary clarification, however this solids removal
is a small portion of the overall plant yield;
Endogenous decay contributes to the overall yield reduction (Goel and Noguera
2006).
The objective of this study was to develop a simple method for quickly evaluating the
efficacy of installing a Cannibal interchange reactor on the RAS stream of a treatment
plant to reduce the overall plant yield. To achieve this goal short-term anaerobic batch
studies were conducted on several sludges provided from full-scale installations of the

35
Cannibal system, lab scale versions of the Cannibal system and on several treatment plants
that had never been exposed to Cannibal conditions.
3.3 Materials and Methods
3.3.1 Sludge Samples
Samples of sludge were provided by several plants that have been operating the Cannibal
system. These samples were collected from the feed to the interchange reactor and were
transported to the lab under conditions that maintained 4°C to minimize biological activity.
For the non-Cannibal plants, the samples were collected from the RAS line. Details of the
plants are included in Table 3.1.
Table 3.1- Treatment Plants Investigated
Plant Name and
Location Treatment System
Treated
Flow
(MGD)
Pre-
Cannibal
Yield (lb
TSS/lb
BOD)
Post-
Cannibal
Yield (lb
TSS/lb
BOD)
Peru, Indiana
Anoxic Selctor + 3
Siemens VLRs in series
(upgrade w/ Cannibal)
4.0 0.8 0.1
Emporia, Virginia
Oxidation ditches in
series with 2 Cannibal
reactors
0.9 0.60 0.35
Big Bear, California No data on plant
configuration. 2.0 1.0 0.8
Morongo, California
SBR (only operated for
short period before
Cannibal came on line)
0.2 Unknown 0.1-0.2
Pepper’s Ferry,
Radford, Virginia Approaching plug flow 3.0 1.21 N/A
Christiansburg,
Virginia Approaching plug flow 2.0 0.61 N/A
Blacksburg, Virginia Complete mix 5.4 1.89 N/A

36
3.3.2 Batch Reactor Setup
The setup for the batch studies utilized 500 mL bottles that were filled with approximately
450 mL of sludge. The bottles were sealed with rubber stoppers and gas was vented
through water traps.
Each reactor was sampled at least once daily and, during the initial several days after
startup, twice daily. Samples were centrifuged and the centrate was filtered through 0.45
m nitrocellulose filters for soluble COD analysis.
COD analysis was conducted photometrically using Hach High Range COD tubes (Hach
Company, Loveland, CO) which had a range of 20-1500 mg/L COD and are USEPA
approved.
Initial and final total and volatile solids were measured according to Standard Methods
(A.P.H.A. et al. 1995).
3.4 Results and Discussion
Data from the lab reactors compared to yield data from the full-scale processes provided
insight into the effectiveness of the Cannibal system and led to the development of a
method for determining how a plant will respond to the installation of the Cannibal
process. Raw data is provided in Appendix A. Results for the SCOD release are presented
in Figure 3.2a and b.

37
Figure 3.2(a) Cannibal and (b) Conventional SCOD Release in Batch Reactors
a
b

38
Before discussing Figure 3.2 a and b in detail, it is important to clarify the differences
between the plants. Some details of each plant’s configuration were provided in the
materials and methods section; however, in this section additional information about plant
performance is provided. The plants at Peru, Indiana and Morongo, California are two of
the best operating Cannibal installations in the United States and Big Bear, California and
Emporia, Virginia are two of the worst performing. The Peru plant operates with an
anoxic selector system followed by a Siemens VLR system which is essentially an
oxidation ditch on its side. Emporia is a high sludge age system (SRT> 35 days) with two
oxidation ditches in series. Morongo, California is a sequencing batch reactor (SBR)
system. No additional information was provided for Big Bear, although the change in yield
is primarily assumed to be due to the additional screenings and grit separation for the
Cannibal system. The Fast and Slow Lab SBRs are two side-by-side sequencing batch
reactors that are being operated by one of the author’s colleagues in the lab. The Fast SBR
mimics a well operating Cannibal system with a high substrate pressure that is achieved by
a short feeding time period. The Slow SBR mimics a poorly operating system with a low
substrate pressure which is achieved by feeding the same overall concentration as the Fast
SBR but over a longer time period. Blacksburg, Christiansburg and Pepper’s Ferry are
three plants that have never been exposed to the Cannibal process.
Data in Figure 3.2a show the results of SCOD release over time for the Cannibal plants and
the distinction between the well and poorly operating plants is readily apparent. The data
points for the lab SBRs were collected by the researcher operating those reactors, who
conducted similar batch experiments, although SCOD was not directly measured. To
estimate the COD release, the protein, polysaccharide and total VFAs on an oxygen
39
demand basis were summed together and multiplied by a conversion factor of 2 to produce
an accurate surrogate for SCOD. The conversion factor was based on an estimated average
COD for the organics tested. In Figure 3.2b the results of the batch studies conducted on
the conventional treatment plants are presented. All data series have trend lines drawn in
to provide an approximate average.
With the full-scale Cannibal sludges the release rate is fairly similar until almost three days
into the operation, at which point the Peru sludge showed a significant increase in the
SCOD concentration which, at the end of the test period, resulted in a final concentration
of close to 800 mg/L higher than the poorly functioning plants. After about 5 days of
operation, Big Bear underwent a dramatic decrease in SCOD release. This was assumed to
be due to biodegradation. Although the Emporia tests were concluded much earlier than
the other reactors, it may have followed a similar pattern to Big Bear if it had been allowed
to continue operating. The two lab reactors followed smoother and more regular trends
over their operation, although they started at higher concentrations than any of the full-
scale samples. Both lab reactors mimic their respective performance category with regards
to general concentration range, i.e. the slow feed SBR remained in the 200-300 mg/L range
while the fast feed SBR released up to 800 mg/L. Despite being one of the best operating
Cannibal plants, Morongo tended to follow the trends of the poorer operating plants.
There are two possible explanations for this occurrence:
1. Because it is operating so well, most of the organic material has already been
degraded in the activated sludge process.

40
2. The yield without a Cannibal system could have been low. This plant was designed
and operated as a Cannibal system so there were no data for “conventional” operation
for comparison. For this reason, it was not included in the assessment.
When looking at the release over time of SCOD in the non-Cannibal sludges in Figure
3.2b, all three plants have more irregular release patterns, but three distinct trends can be
observed. Blacksburg and Pepper’s Ferry appear to follow a similar pattern with a lower
release rate than Christiansburg and a more significant tailing off near the end of operation;
Christiansburg has a much greater release and does not tail off as significantly as the other
two plants. From this assessment of these three plants it is possible to hypothesize that
Blacksburg and Pepper’s Ferry would not function as well as Christiansburg if Cannibal
systems were installed at each plant.
a

41
Figure 3.3 (a) Total SCOD Release Normalized to Time vs. Y, (b) Expected Y for
Conventional Plants and (c) Max SCOD Release Normalized to Time vs. Y
b
c

42
Figure 3.3a presents the total change in SCOD over the experiment time for each Cannibal
plant and the lab SBRs plotted against the change in yield that each plant has observed
since the installation of the Cannibal system. A liner regression was run on the full-scale
Cannibal plants and the derived equation was used to predict the changes in yield for the
three conventional plants studied as illustrated in Figure 3.3b. These expected yields are
also provided in Table 3.2. Figure 3.3c presents the data for the maximum SCOD change
normalized to the time required to achieve that value. This provided a better R2 value for
the liner regression on the Cannibal plants. The change in yields calculated for the
conventional plants based on this regression were slightly higher for Blacksburg and
Pepper’s Ferry, but unrealistically high for Christiansburg (i.e. Y= 2.04 lb TSS/lb BOD).
The change in yield values for the conventional plants calculated by the liner regression in
Figure 3.3a reinforce the conclusion that of the three conventional plants tested,
Christiansburg would likely experience the greatest benefit from an upgrade to a Cannibal
system.
Table 3.2- Expected Y for the Conventional Treatment Plants Based on Regressions
from Figure 3.3a
Conventional
Treatment Plant Expected Y from Figure 3.3a
(lb TSS/lb BOD)
Blacksburg 0.20
Pepper’s Ferry 0.41
Christiansburg 0.59
There are several other analyses that could provide valuable insight into the operation of
Cannibal systems, but, unfortunately, these could not be pursued in this study. The first of
these analyses is a purely observational investigation and consists of determining when a
sludge turns black in these batch digesters because when that occurs it has been found to

43
indicate that the microorganisms have become acclimated to the anaerobic environment
and the Cannibal “phenomenon” has begun (Chon 2005). This blackening of the sludge
could also be correlated to oxidation reduction potential values and would likely be at a
highly negative or reduced value when this occurred. This environment would result in the
reduction of iron and sulfate which explains the blackening of the reactors. Although the
blackening characteristic was not rigorously observed during these studies, it was noted for
several of the reactors and it was found that the sludges that had been previously exposed
to the Cannibal environment turned black more rapidly than those from conventional
systems (e.g. Morongo was black within 3 days, while the conventional reactors required
1-2 weeks). Within the conventional systems, there was a difference in blackening times,
with Pepper’s Ferry being the first to change and Christiansburg being the last, which, if
this is an indication of applicability of Cannibal to a system, contradicts the hypothesis
presented based on SCOD release. However, several of the lab studies conducted on
Cannibal systems have found that there is an approximately 30 day acclimatization period
for wastewater that has never being exposed to Cannibal conditions (Chon 2005, Easwaran
2006, Goel and Noguera 2006, Novak et al. 2007a), which helps to explain the longer time
frame for the sludges in these batch reactors to turn black. This is an aspect of the
Cannibal system that should be investigated further and has potential to be a good indicator
for Cannibal applicability to a treatment plant.
Two, the reason the fast feed system works better than the slow feed system is thought to
be due to the presence of a high substrate concentration during the feeding period. High
substrate concentrations would also occur for a plug flow system at the head of the reactor
where the feed entered. Therefore, one possible indicator of the potential for Cannibal to be

44
successful is the flow pattern in the activated sludge system. It was observed that the
Blacksburg plant is a complete mix plant while Christiansburg is more plug flow. Pepper’s
Ferry appears to be somewhat in between. This observed flow pattern is consistent with the
soluble COD release amount shown in Figure 3.2b. Proof of this would require that the
flow configuration be determined more precisely from dye studies and that a Cannibal
system be implemented at each of these plants.
This is also consistent with the Peru, IN plant where a selector was used. In the selector, a
higher substrate concentration is maintained and this likely influenced the characteristics of
the sludge, making it more amenable to solids destruction by the Cannibal process.
3.5 Conclusions
From this study several conclusions can be derived:
Successfully operating Cannibal plants tend to have a greater SCOD release from the
feed to the interchange reactor than poorer performing plants as measured in small
batch reactors. These SCOD releases over time can be compared to SCOD releases
that occur in similar batch reactors using conventional activated sludge and it is
possible that a preliminary assessment of the effectiveness of Cannibal based on
soluble COD release can be made.
Further studies are needed to determine the overall success of this approach.
Along with the SCOD release, there are several other characteristics including reactor
blacking, SVI and plant effluent quality that could potentially be used to judge a
Cannibal plant’s effectiveness and that could be utilized to create a more
45
comprehensive model for evaluating the applicability of the Cannibal system to a
conventional treatment plant including release of iron or measurement of biologically
reducible iron.
3.6 References
APHA, AWWA, WPCF and WEF (1995) Standard methods for the examination of water
and wastewater. APHA, Washington, D.C.
Novak, J. T., Chon, D. H., Curtis, B. A., and Doyle, M. (2007a). "Biological solids
reduction using the Cannibal process." Water Environment Research, 79(12), 2380-
2386.
Goel, R. K., and Noguera, D. R. (2006). "Evaluation of sludge yield and phosphorus
removal in a Cannibal solids reduction process." Journal of Environmental
Engineering, 132(10), 1331-1337.
Easwaran, S. P. (2006). "Developing a mechanistic understanding and optimization of the
CannibalTM
process phase II," Virginia Polytechnic Institute and State University,
Blacksburg.
Chon, D. H. (2005). "Performance and mechanisms of excess sludge reduction in the
CannibalTM
process," Virginia Polytechnic Institute and State University
Blacksburg.

46
4 MANUSCRIPT II: “BATCH STUDIES ON DIFFERENT
SLUDGES TO DETERMINE THE APPLICABILITY OF
SHEAR, SONICATION AND OZONE AS PRETREATMENT
PROCESSES”
4.1 Abstract
This study was undertaken to determine the digestibility of several different sludges that
had been pretreated with shear, sonication or ozone. The study was conducted by
exposing each sludge to the different pretreatment methods then digesting them for
extended time periods in batch digesters.
Several conclusions were derived from these experiments and included a more rapid
increase of SCOD in digesters that are fed with pretreated WAS. The most significant
changes in concentrations (TS, VS, and COD) tended to occur during the first week of
batch digestion. There appeared to be a degree of floc disruption and EPS disintegration
caused by pretreating the WAS with the different technologies, with the greatest effect
from shearing and ozone. None of the pretreatment methods resulted in an increase in
overall digestion but they tended to increase the rate of digestion early in the digestion
process.
4.2 Background
This study was undertaken to determine the effect of several pretreatment technologies on
the digestibility of several different sludges that had been pretreated with shear, sonication
or ozone. The first set of tests was conducted using two activated sludges from local
WWTPs that were exposed to two different shear durations or a dose of ozone. The

47
second set of tests was conducted on sludge from one of the WWTPs in Columbus, OH,
which was primarily interested in the applicability of shear and sonication to their sludge;
however ozone was added to the experiment to provide additional data.
Below is a review of the available literature on the three pretreatment technologies
followed by the results and conclusions found in this study.
4.3 Mechanical Pretreatment
Mechanical pretreatment can be divided into two categories: “violent” or “refined”.
Violent pretreatment refers to those methods that utilize mechanical devices that smash,
accelerate, or shear sludge and include stirred-ball mills, high-pressure homogenizers,
blenders and other devices that exert high stresses on the sludge. Sonication is the other
category of mechanical shear and could be considered the more refined and less abusive
method; in reality it can cause much greater stresses on the sludge through localized
pressure and temperature extremes around the horn of the sonicator (Hogan et al. 2004,
Tiehm et al. 2001). Both of these types of mechanical pretreatment technologies have
their own advantages and disadvantages and these will be discussed in the following
paragraphs. A process flow diagram illustrating a typical plant design with the installation
of a shear device for sludge pretreatment is shown in Figure 4.1.

48
Figure 4.1- Shear Pretreatment Process Flow Diagram
4.3.1 Violent Shearing Devices
Studies have been conducted utilizing several types of violent mechanical shearing devices
including stirred-ball mills and high-pressure homogenizers to determine their feasibility
for sludge pretreatment or for modifying the return activated sludge (RAS) line to reduce
the sludge yield in the activated sludge system (Camacho et al. 2002, Kopp et al. 1997,
Lehne et al. 2000, Novak et al. 2007b, Strunkmann et al. 2006). Of important note is that
mechanical shear devices are best applied only to secondary (biological) sludge because its
degradability is significantly less than primary sludge, which gains little benefits from
mechanical treatment (Lehne et al. 2000). It was found that mechanical shear causes floc
disruption and hydrolysis over a short exposure time (Kopp et al. 1997).
One of the most important considerations with mechanical shearing is the energy imparted
to the sludge because of a direct correlation between the energy imparted and the amount
of cell disruption (Kopp et al. 1997, Liu et al. 2005). Low energy input will cause floc
disruption, which allows the microorganisms within the flocs to access additional organic
matter, and reduction in mean particle size, which can result in increased volatile solids
reduction (VSR) in digesters when used as a pretreatment or a reduction in overall yield in

49
the activated sludge process when used to treat RAS (Camacho et al. 2002, Kopp et al.
1997, Lehne et al. 2000). The one disadvantage to a low energy input is a deterioration in
the settling characteristics of the sludge due to the floc dispersion and lighter particles
(Seka and Verstraete 2003). To achieve cell lysis, higher energy must be imparted to the
sludge which also implies a greater operational cost. However, the degradability is
improved when the cells are lysed (Camacho et al. 2002, Liu et al. 2005).
One constant factor that several researchers found was when the total solids (TS) of the
sludge were increased there was a decrease in required energy input (Kopp et al. 1997,
Lehne et al. 2000). It was also found that with improved digestion and dewatering
resulting from the mechanical shearing there was an increased concentration of nitrogen
species being returned to the activated sludge system including poorly degradable organic
nitrogen (Kopp et al. 1997, Strunkmann et al. 2006).
In summary, the digestion improving pathway followed by mechanical shear devices and
many of the other pretreatment devices is cell and floc disruption which increases digestion
rate resulting in reduced volatile solids (VS), increased sludge density and improved
dewaterability (Kopp et al. 1997).
4.3.2 Sonication Pretreatment
Sonication, or ultrasound, is the use of sound energy between the frequencies of 20 kHz
and 10 MHz which is typically caused by the rapid vibration of an object often referred to
as a horn or transducer (Cao et al. 2006, Hogan et al. 2004). This rapid vibration causes
alternating compression and rarefaction, that is, areas of high and low pressure,
respectively, which result in excessive localized temperature and pressure (>5000°K and

50
several hundred atmospheres) (Show et al. 2007, Tiehm et al. 2001). These extreme
conditions are caused by the formation of cavitation bubbles that rapidly form and burst.
Cavitation bubbles are classified as stable, where the bubble does not expand to its collapse
radius due to the sound pressure during the rarefaction cycle being insufficient, or transient
cavitation, where the pressure is sufficient enough to cause collapse within a few acoustic
cycles (Show et al. 2007). The collapse or resonant radius is the point where the cavitation
bubble ruptures and causes the localized extremes; it is directly proportional to the
frequency of the sound waves (Tiehm et al. 2001).
The extreme conditions caused by sonication result in floc dispersion and subsequent
reduction of mean particle size often through pyrolysis of volatile compounds (Braguglia
et al. 2008, Hogan et al. 2004, Show et al. 2007, Tiehm et al. 2001). Hydroxyl radicals can
also form during sonication and will react with non-volatile compounds in the bulk liquid
(Tiehm et al. 2001, Zhang et al. 2007).
Researchers have found that the solids concentration of sludge affects the efficiency of
sonication and, as with many of the other pretreatment technologies, a more concentrated
sludge produces better results than a thinner sludge (Mao and Show 2006, Show et al.
2007, Zhang et al. 2008). Another parameter that affects the performance of sonication on
sludge is the frequency that the device is operated at with lower frequencies causing more
disruption due largely to the higher hydro-mechanical shearing effects (Tiehm et al. 2001).
When discussing sonication there are several terms which need to be defined and are listed
below in Table 4.1.

51
Table 4.1- Common Sonication Terminology
Terminology Definition Units Source
Ultrasonic Intensity Power supplied per horn or
transducer area W/cm
2 Tiehm et al.2001
Ultrasonic Density Power supplied per sample
volume W/mL Tiehm et al.2001
Ultrasonic Dose Energy supplied per sample
volume W-s/mL Tiehm et al.2001
Specific Ultrasonic
Dose (SUD)
Power supplied for an
exposure time per unit
volume and mass of sample
W-s/kg-solids Muller 2006
In the literature, there has been no uniform method of reporting the energy imparted to the
sample. Table 4.2 presents literature reported values and where possible provides them in
terms of specific ultrasonic dose to promote uniformity and ease of comparison.
Table 4.2- Literature Reported Sonication Values
Source Intensity
(W/cm2)
Density
(W/mL)
Dose (W-
s/mL)
SUD (W-
s/kg-solids) Location
Show et al. 2007 0-92 0-0.52 ND ND Pretreatment
Cao et al. 2006 ND 0.25-0.50 ND ND Recycle
Zhang et al.
2008 125 0.80 1440 9.3x10
7 Pretreatment
Xie et al. 2007 13.70 ND ND ND Pretreatment
Muller 2006 15.03 0.59-0.94 107-170 ND
Pretreatment and
Recycle
Riedel 2009 15.03 0.3 90 1.4-1.5x10
6
Pretreatment to
batch digestion

52
As can be seen in Table 4.2, there is a significant range of reported values which makes it
difficult to decide on an optimal dose. However, of all the available units to report
sonication values in, the SUD allows reproducibility because it accounts for the solids
concentration of the sludge so it can be readily adapted to different sludges.
In summary, for sonication treatment of sludge, its primary method for floc and cell
disruption is the formation of cavitation bubbles that implode and cause localized extreme
conditions. There is also some effect from the formation of hydroxyl radicals. The most
import parameters to consider when utilizing sonication is optimizing the solids
concentration and the frequency of the device, typically higher for the former and lower for
the latter provide the best results.
4.3.3 Disadvantages of Mechanical Shear Pretreatment
There are three major disadvantages to mechanical shearing devices. One is the high
energy input required to operate these devices, which is an issue with many pretreatment
technologies, however, much of this energy can be recouped with the improved digestion
of the sludge and the increased biogas production that can be utilized for power generation.
The second disadvantage is maintenance required for many of these devices, especially the
violent ones, due to the high stresses that are exerted on the mechanical parts during
operation. The final disadvantage is with scaling these devices up to full-sized
applications because many of them have only been utilized in lab-scale applications and
may not be feasible for use in larger applications.

53
4.4 Ozone Pretreatment
4.4.1 Introduction
Ozone is a treatment technology that is receiving increased attention in both the water and
wastewater industries primarily as a disinfectant alternative to chlorine species
(Tchobanoglous et al. 2003). The chemical characteristics of ozone are listed in Table 4.3.
Table 4.3- Ozone Properties (Material Safety Data Sheet 2000)
Characteristic Value
Chemical Formula O3
Molecular Weight 48 g/mole
Specific Gravity 2.144 g/L
Vapor Density 1.7
Solubility in Water 0.49 % by wt.
Ozone is a highly reactive, strong oxidant which has the potential to cause explosions
when in contact with many organic compounds and can also create intermediaries that are
as dangerous (Material Safety Data Sheet 2000). It is generated from air or pure oxygen
using a high voltage electrical discharge called corona discharge and due to its short life
span it is typically produced on site (Panda and Mathews 2008).
4.4.2 Ozone Usages in Wastewater Treatment
As was mentioned previously, ozone is receiving attention in wastewater treatment as a
disinfectant before final discharge because of its ability to kill or inactivate bacteria and
protozoa, including ones that are resistant to chlorine, and the lack of disinfection
byproducts formed by it (Panda and Mathews 2008). There are other applications for
ozone that are being investigated for use at wastewater treatment plants including usage as
a pretreatment before digestion and as a side-stream reactor on the recycle loop to reduce

54
the overall plant yield. Below are process flow diagrams illustrating ozone used as a
pretreatment technology (Figure 4.2) and side-stream recycle (Figure 4.3).
Figure 4.2- Sludge Pretreatment with Ozone Process Flow Diagram
Figure 4.3- Side-Stream Ozone Treatment Process Flow Diagram
As a pretreatment for digestion of sludge, ozone serves to cause floc and cell disruption
allowing better, more-rapid digestion (Ahn et al. 2002, Bernal-Martinez et al. 2007,
Bougrier et al. 2006a, Bougrier et al. 2007a, Carballa et al. 2007, Chu et al. 2008,
Manterola et al. 2008, Mines et al. 2008, Yeom et al. 2002, Zhao et al. 2007). There have
also been studies investigating the usage of ozone pretreated sludge and dewatering
centrate as a carbon source for nitrification (Ahn et al. 2002, Lee et al. 2005, Sakai et al.
1997, Yeom et al. 2002, Zhao et al. 2007). It has been investigated as a side-stream

55
process attached to the return activated sludge line to treat a percentage of the RAS with
the intention of minimizing sludge yield in the activated sludge process (Ahn et al. 2002,
Boehler and Siegrist 2006, Kamiya and Hirotsuji 1998, Lee et al. 2005, Yeom et al. 2002).
Of important consideration for ozone treatment are the effects of temperature, dissolved
oxygen and total solids upon the mass transfer coefficient (Manterola et al. 2008, Panda
and Mathews 2008). The dose also affects the results of treatment of wastewater with
ozone with literature reported values ranging from 0.05 to 0.50 g O3/g TS (Bougrier et al.
2006a, Chu et al. 2008, Dogruel et al. 2007, Manterola et al. 2008, Mines et al. 2008, Sakai
et al. 1997, Zhao et al. 2007). Typically, with higher ozone doses there is a greater
solubilization of organic matter (Ahn et al. 2002, Manterola et al. 2008). When using
ozone as a yield reduction technology on the return line in activated sludge processes there
is a minimum dose required to achieve yield reduction (Kamiya and Hirotsuji 1998).
Ozone has direct and indirect treatment pathways which include the direct oxidation of
organic material to carbon dioxide and the formation of hydroxyl radicals which react
indirectly with compounds and organic material (Carballa et al. 2007, Chu et al. 2008).
4.4.3 Advantages of Ozone Treatment of Wastewater
Ozone treatment of wastewater has several advantages that make it an appealing
technology, especially with increasingly stringent regulations. As a strong oxidant, ozone
can break down many polycyclic aromatic hydrocarbons (PAHs), pharmaceutical and
personal care products (PPCPs), dyes and other industrial byproducts that are becoming
more prevalent in wastewaters and typically are not removed by conventional biological
treatment (Bernal-Martinez et al. 2007, Carballa et al. 2007, Chu et al. 2008). It can help
56
control the growth of bulking organisms in both the activated sludge process and digesters
(Ahn et al. 2002). When used as a pretreatment technology prior to anaerobic digestion, it
can potentially increase the production of methane (Bougrier et al. 2007a, Carballa et al.
2007). It also causes floc disruption and cell hydrolysis which releases soluble proteins
and carbohydrates to the bulk liquid and improves degradability (Ahn et al. 2002, Zhao et
al. 2007). Other advantages include:
Decreased viscosity, improved settleablity and reduced odors (Bougrier et al. 2007a);
Yield reduction in activated sludge systems (Kamiya and Hirotsuji 1998, Lee et al.
2005, Sakai et al. 1997);
Potential carbon source for denitrification with equivalent energy to glucose (Ahn et
al. 2002, Lee et al. 2005, Sakai et al. 1997, Yeom et al. 2002, Zhao et al. 2007);
Increased mineralization of organic material (Bougrier et al. 2007a).
4.4.4 Disadvantages of Ozone Treatment of Wastewater
As with the other pretreatment technologies there are disadvantages to the use of ozone in
wastewater treatment, which are listed below:
Increased inert and colloidal COD due to the disintegration of sludge flocs and cells
which often increases the non-biodegradable COD in the plant effluent due to
recycling of dewatering centrate to the biological process or the use of ozone
treatment on the RAS line (Boehler and Siegrist 2006);
Decreased dewaterability, increased sludge volume index (SVI) and capillary suction
time (CST) of digested sludge because of smaller particles (Ahn et al. 2002, Bougrier
et al. 2006a, Bougrier et al. 2007a, Carballa et al. 2007);

57
Decreased pH due to formation of carboxylic acid from organic material and
consumption of alkalinity by the oxidation of organic material (Bougrier et al.
2007a);
When used to minimize yield, phosphorus removal is reduced because one of the
primary removal mechanisms is sludge wasting (Sakai et al. 1997);
Ozone generation is an energy intensive process and requires significant capital
investment in machinery (Panda and Mathews 2008);
Mass transfer kinetics need to be optimized to the sludge characteristics (Lee et al.
2005, Panda and Mathews 2008).
4.5 Materials and Methods
4.5.1 Columbus Batch Digestion Studies
Thickened WAS, primary sludge and digested sludge were collected from the Columbus
WWTP and shipped to Blacksburg. The WAS was treated in the following manners:
10 minute shearing with a Warring blender at 8-10,000 rpm, 10 minute cooling in
water-jacketed beaker;
5 minute sonication at 20kHz, 166 W and sonication density of 0.33 W/mL using a
Dukane DPC I 2120 generator and a Dukane 41C27 20kHz mounted probe with a tip
diameter of 37.5 mm and no additional focusing horn, 5 minute cooling in water
jacketed beaker;
Ozone dose of approximately 0.13 mg O3/mg TS using a Xetin Air Zone XT301
ozone generator with a generation rate of 300 mg O3/h;
Untreated control.

58
The initial reactors were 1 L Corning glass bottles with approximately 800 mL of sludge
blended with a ratio of 1:1.5:1.5 digested:primary:WAS. Gas was collected in Tedlar bags
and the volume was measured when the reactors were sampled. Reactors were maintained
at 37 °C in a constant temperature room and mixed daily by hand agitation.
After approximately three and a half weeks of operation, the reactors were scaled up to
4000 mL of sludge in 10,000 mL Corning bottles. The initial reactors were sampled and
the remaining 700 mL was used as seed for the new reactors. The difference was made up
with 300 mL of digested sludge, 1500 mL of primary sludge and 1500 mL of treated WAS.
These reactors were allowed to operate for approximately two weeks at which point 3000
mL was removed and replaced with 1500 mL of primary sludge and 1500 mL of treated
WAS. Operation continued as before, except with weekly sampling for total and volatile
solids, total and soluble COD, pH, ORP and gas volume measurement.
COD analysis was conducted photometrically using Hach High Range COD tubes (Hach
Company, Loveland, CO) which had a range of 20-1500 mg/L COD and are USEPA
approved. Soluble COD was measured on samples that were centrifuged long enough to
have a supernatant that could be passed through a 0.45 m nitrocellulose membrane filter.
Initial and final total and volatile solids, were measured according to Standard Methods
(A.P.H.A. et al. 1995). Gas volume was measured by timed withdrawal from the Tedlar
bags with a calibrated peristaltic pump. pH and ORP were analyzed using the appropriate
probes from Accumet and Thermo Fisher. pH was adjusted as necessary with caustic or
sodium bicarbonate addition.

59
Microscopy of treated and untreated WAS was conducted using a FEI Quanta 600
scanning electron microscope in low-vacuum mode. Samples were diluting 1:25 in
distilled water and fixed on a 0.45 m nitrocellulose membrane filter by vacuuming for 10
minutes. The filters with fixed samples were allowed to dry overnight in a desiccator.
4.5.2 Blacksburg Area WWTP Batch Digestion Studies
Thickened WAS was collected from two local WWTPs (Pepper’s Ferry and
Christiansburg) and transported to the lab. Both of these sludges were treated in the
following manners:
1 minute shearing with a Warring blender at 8-10,000 rpm, no cooling;
10 minute shearing with a Warring blender at 8-10,000 rpm, 10 minute cooling in
water-jacketed beaker;
Ozone dose of approximately 0.13 mg O3/mg TS using a Xetin Air Zone XT301
ozone generator with a generation rate of 300 mg O3/h;
Untreated control.
Reactors were approximately 500 mL in volume with 360 mL of sludge plus 90 mL of a
seed sludge which was a 50:50 mix of primary and secondary sludge treated for 15 days at
37 °C and 2 days at 55 °C. All reactors were completely mixed and maintained at
approximately 37 °C in an incubator. Gas was vented through water traps but not
collected. Sampling occurred on days 0, 7, 14, 21, and 57.
COD analysis was conducted photometrically using Hach High Range COD tubes (Hach
Company, Loveland, CO) which had a range of 20-1500 mg/L COD and are USEPA
approved.
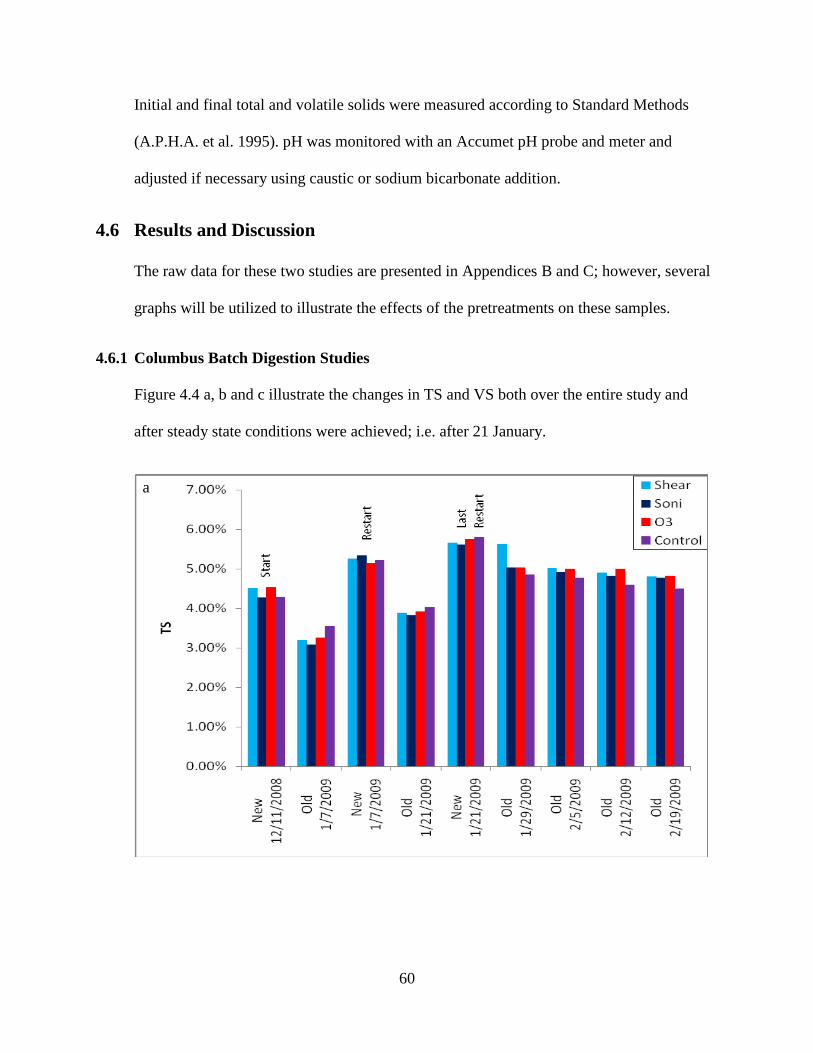
60
Initial and final total and volatile solids were measured according to Standard Methods
(A.P.H.A. et al. 1995). pH was monitored with an Accumet pH probe and meter and
adjusted if necessary using caustic or sodium bicarbonate addition.
4.6 Results and Discussion
The raw data for these two studies are presented in Appendices B and C; however, several
graphs will be utilized to illustrate the effects of the pretreatments on these samples.
4.6.1 Columbus Batch Digestion Studies
Figure 4.4 a, b and c illustrate the changes in TS and VS both over the entire study and
after steady state conditions were achieved; i.e. after 21 January.
a

61
Figure 4.4- (a) %TS, (b) %VS and (c) 21 January to 19 February %TS and %VS
Profiles for the Columbus Batch Reactors
b
c

62
From Figure 4.4a it can be observed that three of the reactors had a similar drop in TS
within the first week, but the reactor with the mechanically sheared WAS lagged behind by
about a week. Also, it can be seen that the control reactor started with a similar
concentration as the ozonated reactor, but saw a more significant decrease in TS and was
consistently lower in concentration than any of the other reactors.
Figure 4.4b illustrates the change in VS for every sampling event. It can be seen that there
is a decrease in VS in the weeks after each reactor change-out which should occur when it
is allowed to digest for several weeks. Figure 4.4c provides an illustration of the last four
weeks of operation where the reactors were sampled. From this figure, it is quite clear that
there is no significant improvement caused by any of the pretreatment technologies. In
fact, shearing caused that reactor to lag behind the other three in VS reduction. This could
be due to separation of some of the organisms, preventing efficient transfer of hydrogen
from the hydrogen generators to the hydrogen utilizers (McCarty and Smith 1986).
Although only the WAS was treated, it has been found that WAS contains a rich
population of methanogenic archaea (Kim et al. 2004).

63
Figure 4.5- Columbus Batch Reactor Volatile Solids Reduction
Figure 4.5 illustrates the differences in VS reduction over the expiremental time period and
it can be seen that the control reactor had the greatest reduction, which further reinforces
the conclusion that these pretreatment technologies do little to improve the overall
digestibility of the sludge at extended digestion times.

64
b
a

65
Figure 4.6 (a) TCOD, (b) SCOD and (c and d) 21 January to 19 February TCOD
and SCOD Profiles for the Columbus Batch Reactors
c
d

66
The TCOD profile illustrated in Figure 4.6a presents a pattern that is consistent with the
pattern shown by the TS profile. There is some reactor dependent variability from week to
week. Figure 4.6b is of particular interest because most of these pretreatment technologies
claim to solubilize flocs and cells which results in a greater concentration of SCOD in the
bulk liquid. This unbound SCOD is thought to degrade more rapidly than with
conventional digestion. This can be seen clearly when looking at the data from 21 January
onward: all three reactors fed with the pretreated sludge have a significantly higher
concentration of SCOD for the beginning which steadily increases until 5 February after
which point the concentrations begin to decrease to a point were it remains fairly constant.
The control reactor, on the other hand, starts from a much lower concentration and is never
able to achieve the concentrations of SCOD that are achieved by the ozonated or sonicated
reactors, although it does finally exceed the concentrations in the other reactors on 19
February. Figure 4.6c and d illustrate the TCOD and SCOD profiles for the last four
weeks of operation. From these two figures it is again apparent that the pretreatment
technologies have minimal improvement on the digestibility of the WAS, in fact the shear
treatment seems to have a negative effect on SCOD after about 10 days of operation. The
major effect of these pretreatment technologies is an initial increase in SCOD release
which is readily apparent when the individual samples are compared as in Figure 4.7.

67
Figure 4.7- Initial Plant Samples SCOD
The percentages on each of the pretreated bars indicate the percent increase in SCOD when
compared to the untreated WAS. From these numbers, it can readily be seen that
sonication has little effect on the WAS, whereas the shear and ozone increased the initial
soluble COD concentration.
Figure 4.8 presents images taken with a scanning electron microscope (SEM) in low
vacuum mode of the treated and untreated WAS samples, all were diluted 1:25 and the
magnification was approximately 2000-2500x. Figure 4.8a is an image of the untreated
WAS in which the EPS is clearly present and in abundance. Figure 4.8b is an example of
the sonicated WAS in which the floc structure and EPS is much more dispersed and in
many sections not even present. Figure 4.8c is an image of WAS that had been sheared
and which has the most dramatic lack of EPS of any of the images. Finally, Figure 4.8b is

68
an example of the ozone treated WAS and in which there is also a distinct lack of EPS and
floc material, but also some sort of multi-cellular organism that has been clearly damaged
by the ozone treatment.
Figure 4.8 (a) Control, (b) Sonicated, (c) Mechanically Sheared and (d) Ozonated
Scanning Electron Microscope Images of Samples Diluted 1:25 and Magnified
Approximately 2000-2500X
d b
a c
d

69
There were some issues with the pH of the reactors dropping to 6.2 and below during the
January draw-downs and refills; the ozone reactor dropped to 5.2-5.3 on two occasions.
This was remedied initially by the addition of 1N NaOH to bring the pH up to near neutral
levels but, when the pH continued to drop, NaHCO3 as an approximately 1000 mg/L slurry
as CaCO3 was added to provide additional alkalinity. After that point, the pH remained
above 7.
Gas collection was unsuccessful, with little volume accumulating in the Tedlar bags over
the course of a week. This was more than likely due to poor sealing around the caps and
on the vent lines to the bags. The volume of biogas produced can be estimated
stoichiometrically based on the VSR and several chemical formulas for volatile solids,
including C5H7O2N, C10H19O3N, C16H24O5N4, and CH2O (Grady et al. 1999). Table 4.4
presents a range of theoretical biogas volumes for each reactor based on the VSR values
compared to the measured values. As can be seen, the measured volumes were typically
less than the theoretical volume, which reinforces the conclusion that the collection system
was inadequate.
Table 4.4- Theoretical Biogas Volume Based on VSR and Measured Biogas Volume
Reactor Theoretical Vol.
Biogas Produced
(L)
Measured Vol.
Biogas Produced
(L)
Control 43-80 48
Shear 33-62 27
Sonicated 37-69 15
Ozone 40-75 9

70
4.6.2 Blacksburg Area WWTP Batch Digestion Studies
As was mentioned in the materials and methods section, this study focused on comparing
the effects of shear time and ozone dosing on two different sludges from local treatment
plants. Both plants receive primarily municipal wastewater, although the Pepper’s Ferry
plant receives some additional industrial wastewater. Christiansburg is designed for a 4
MGD flow, but currently only treats 2 MGD; Pepper’s Ferry treats 3 MGD.
Due to inadequate experimental planning, positive controls were not provided when the
reactors were initially set up. To remedy this, an additional control was added and the 1
minute shear reactor can be considered to be a control because it was apparent that there
was little difference in the sludge caused by the minute of shearing and the control which
was set up later. Because of this the data from the control reactors is not presented and the
original 1 minute shear reactors were treated as a control.

71
Figure 4.9 (a) TS and (b) VS Concentrations for Christiansburg Batch Reactors
b
a

72
As can be seen from Figure 4.9a, there is a decrease in TS during the initial week of
operation, but after that point the TS remains fairly constant. There is also no significant
difference between the treated and untreated reactors. In Figure 4.9b, the VS
concentrations mirror the TS concentrations and what is significant is that there appears to
be little overall decrease in VS over time after the initial week of digestion.

73
Figure 4.10 (a) TS and (b) VS Concentrations for Pepper’s Ferry Batch Reactors
a
b

74
Figure 4.10 shows that there was little effect from any of the pretreatment technologies on
the Pepper’s Ferry sludge, although there was a slight decrease for the 10 minute shear and
ozone reactors during the first week of operation. After that first week of operation, the TS
and VS changed minimally. The initial significant drop in the ozone concentrations is
likely due to inaccuracies in the measurement. It is not clear why the ozonation would
influence the TS measurement while the other pretreatment techniques did not have this
same effect.
Figure 4.11- Christiansburg and Pepper’s Ferry TCOD
Figure 4.11 illustrates a general decline in TCOD concentrations over the duration of the
test. The most significant changes occurred during the first week of operation, which
concurs with the TS and VS data presented above. It also shows that the 10 minute shear
and ozone had little effect when compared with the 1 minute shear/control. The only

75
unusual data series in this figure is the Pepper’s Ferry ozone, which has an extreme initial
decrease in concentration that is followed by and increase back to the range of the other
Pepper’s Ferry reactors. This could have caused by analytical error, so the dashed line was
added as a hypothetical trend for that section of the data series. It is also important to note
that the Pepper’s Ferry reactors had a greater change in TCOD over the digestion period
when compared to the Christiansburg reactors; this could be due to the higher initial TS
concentrations in the Pepper’s Ferry WAS.
4.7 Conclusions
Based on the data collected from these two studies there are several general conclusions
that can be derived and are presented below:
There is little difference in the overall improvement in digestibility of pretreated
WAS compared to untreated WAS;
The most significant changes in concentrations (TS, VS, and COD) tend to occur
during the first week of batch digestion;
Ozone had a greater initial impact on VS and SCOD than, shear which typically had a
greater impact than sonication;
Apparent floc disruption and EPS disintegration was observable when micrographs of
the untreated and pretreated WAS were compared. Visually, it appeared that shear
and ozone had greater effects on the floc structure than sonication did.
4.8 References
APHA, AWWA, WPCF and WEF (1995) Standard methods for the examination of water
and wastewater. APHA, Washington, D.C.

76
Ahn, K. H., I. T. Yeom, K. Y. Park, S. K. Maeng, Y. Lee, K. G. Song and J. H. Hwang
(2002) Reduction of sludge by ozone treatment and production of carbon source for
denitrification. Water Science and Technology, 46(11-12), 121-125.
Bernal-Martinez, A., H. Carrere, D. Patureau and J.-P. Delgenes (2007) Ozone pre-
treatment as improver of PAH removal during anaerobic digestion of urban sludge.
Chemosphere, 68(6), 1013-1019.
Boehler, M. and H. Siegrist (2006) Potential of activated sludge ozonation. 4th
International Conference on Oxidation Technologies for Water and Wastewater
Treatment, pp. 181-187. I W a Publishing, Goslar, GERMANY.
Bougrier, C., C. Albasi, J. P. Delgenes and H. Carrere (2006a) Effect of ultrasonic, thermal
and ozone pre-treatments on waste activated sludge solubilisation and anaerobic
biodegradability. Chemical Engineering and Processing, 45(8), 711-718.
Bougrier, C., A. Battimelli, J.-P. Delgenes and H. Carrere (2007a) Combined ozone
pretreatment and anaerobic digestion for the reduction of biological sludge
production in wastewater treatment. Ozone: Science and Engineering, 29(3), 201-
206.
Braguglia, C. M., G. Mininni and A. Gianico (2008) Is sonication effective to improve
biogas production and solids reduction in excess sludge digestion? Water Science
and Technology, 57(4), 479-483.
Camacho, P., V. Geaugey, P. Ginestet and E. Paul (2002) Feasibility study of mechanically
disintegrated sludge and recycle in the activated-sludge process. Water Science and
Technology, 46(10), 97-104.
Cao, X. Q., J. Chen, Y. L. Cao, J. Y. Zhu and X. D. Hao (2006) Experimental study on
sludge reduction by ultrasound. 5th World Water Congress of the International-
Water-Association, pp. 87-93. I W a Publishing, Beijing, PEOPLES R CHINA.
Carballa, M., G. Manterola, L. Larrea, T. Ternes, F. Omil and J. M. Lema (2007) Influence
of ozone pre-treatment on sludge anaerobic digestion: Removal of pharmaceutical
and personal care products. Chemosphere, 67(7), 1444-1452.
Chu, L. B., S. T. Yan, X. H. Xing, A. F. Yu, X. L. Sun and B. Jurcik (2008) Enhanced
sludge solubilization by microbubble ozonation. Chemosphere, 72(2), 205-212.
Dogruel, S., M. Sievers and F. Germirli-Babuna (2007) Effect of ozonation on
biodegradability characteristics of surplus activated sludge. Ozone-Sci. Eng., 29(3),
191-199.

77
Hogan, F., S. Mormede, P. Clark and M. Crane (2004) Ultrasonic sludge treatment for
enhanced anaerobic digestion. Water Science and Technology, 50(9), 25-32.
Kamiya, T. and J. Hirotsuji (1998) New combined system of biological process and
intermittent ozonation for advanced wastewater treatment. Water Science and
Technology, 38(8-9 pt 7), 145-153.
Kim, M., W. Bae and R. E. Speece (2004) Improved anaerobic process efficiency using
mesophilic and thermophilic elutriated phased treatment. J. Environ. Eng.-ASCE,
130(9), 960-966.
Kopp, J., J. Mueller, N. Dichtl and J. Schwedes (1997) Anaerobic digestion and
dewatering characteristics of mechanically disintegrated excess sludge. Water
Science and Technology, 36(11), 129-136.
Lee, J. W., H.-Y. Cha, K. Y. Park, K. G. Song and K. H. Ahn (2005) Operational strategies
for an activated sludge process in conjunction with ozone oxidation for zero excess
sludge production during winter season. Water Research, 39, 1199-1204.
Lehne, G., A. Muller and J. Schwedes (2000) Mechanical disintegration of sewage sludge.
1st World Water Congress of the International-Water-Association (IWA), pp. 19-
26. Paris, France.
Liu, Q.-S., Y. Liu, J.-H. Tay and Y. S. Kuan (2005) Responses of sludge flocs to shear
strength. Process Biochemistry, 40(10), 3213-3217.
Manterola, G., I. Uriarte and L. Sancho (2008) The effect of operational parameters of the
process of sludge ozonation on the solubilisation of organic and nitrogenous
compounds. Water Research, 42(12), 3191-3197.
Mao, T. and K. Y. Show (2006) Performance of high-rate sludge digesters fed with
sonicated sludge. 5th World Water Congress of the International-Water-
Association, pp. 27-33. I W a Publishing, Beijing, PEOPLES R CHINA.
Material Safety Data Sheet, M. (2000) Ozone MSDS [online].
http://www.ozoneapplications.com/info/ozone_msds.htm [accessed 2/10/2009
2009]
McCarty, P. L. and D. P. Smith (1986) Anaerobic waste-water treatment .4. Environ. Sci.
Technol., 20(12), 1200-1206.
Mines, R. O., C. B. Northenor and M. Murchison (2008) Oxidation and ozonation of waste
activated sludge. J. Environ. Sci. Health Part A-Toxic/Hazard. Subst. Environ.
Eng., 43(6), 610-618.

78
Muller, C. D. (2006) Shear Forces, Floc Structure and their Impact on Anaerobic Digestion
and Biosolids Stability. Civil and Environmental Engineering. Virginia Polytechnic
Institute and State University, Blacksburg.
Novak, J. T., C. Park, M. Higgins, J,, Y. Chen, R. Morton, D. Gary, R. Forbes and Z. Erdal
(2007b) WERF Odor Study Phase III: Impacts of the MicroSludge Process on Odor
Causing Compounds. WEF Residuals and Biosolids Management Conference.
Water Environment Federation.
Panda, K. K. and A. P. Mathews (2008) Mass transfer of ozone in a novel in situ ozone
generator and reactor. J. Environ. Eng.-ASCE, 134(10), 860-869.
Sakai, Y., T. Fukase, H. Yasui and M. Shibata (1997) Activated sludge process without
excess sludge production. Water Science and Technology, 36(11), 163-170.
Seka, M. A. and W. Verstraete (2003) Test for assessing shear sensitivity of activated
sludge flocs: A feasibility study. Water Research, 37(14), 3327-3334.
Show, K. Y., T. H. Mao and D. J. Lee (2007) Optimisation of sludge disruption by
sonication. Water Research, 41(20), 4741-4747.
Strunkmann, G. W., J. A. Muller, F. Albert and J. Schwedes (2006) Reduction of excess
sludge production using mechanical disintegration devices. Water Science and
Technology, 54(5), 69-76.
Tchobanoglous, G., F. L. Burton and H. D. Stensel (2003) Wastewater engineering :
treatment and reuse. McGraw-Hill,, Boston.
Tiehm, A., K. Nickel, M. Zellhorn and U. Neis (2001) Ultrasonic waste activated sludge
disintegration for improving anaerobic stabilization. Water Research, 35(8), 2003-
2009.
Xie, R., Y. Xing, Y. A. Ghani, K. E. Ooi and S. W. Ng (2007) Full-scale demonstration of
an ultrasonic disintegration technology in enhancing anaerobic digestion of mixed
primary and thickened secondary sewage sludge. J. Environ. Eng. Sci., 6(5), 533-
541.
Yeom, I. T., K. R. Lee, Y. H. Lee, K. H. Ahn and S. H. Lee (2002) Effects of ozone
treatment on the biodegradability of sludge from municipal wastewater treatment
plants. Water Science and Technology, 46(4-5), 421-425.
Zhang, G. M., P. Y. Zhang, J. Yang and H. Z. Liu (2008) Energy-efficient sludge
sonication: Power and sludge characteristics. Bioresour. Technol., 99(18), 9029-
9031.

79
Zhang, G. M., P. Y. Zhang, J. M. Yang and Y. M. Chen (2007) Ultrasonic reduction of
excess sludge from the activated sludge system. Journal of Hazardous Materials,
145(3), 515-519.
Zhao, Y. X., J. Yin, H. L. Yu, N. Han and F. J. Tian (2007) Observations on ozone
treatment of excess sludge. Water Science and Technology, 56(9), 167-175.

80
5 MANUSCRIPT III: “WEF/WERF 05-CTS-3 EVALUATION
OF PROCESSES TO REDUCE ACTIVATED SLUDGE
SOLIDS GENERATION AND DISPOSAL”
5.1 Introduction
The generation of sludge has been a continual issue for every WWTP because of the
increasing cost of handling and disposal (Tchobanoglous et al. 2003). Over the past
several decades there have been numerous studies conducted to evaluate different methods
for reducing the volume of sludge that has to be disposed. These studies have focused on
two main pathways for reducing sludge volume: acceleration of the hydrolysis step of
anaerobic digestion by thermally, mechanically or chemically short circuiting the process
from a step that requires days to one that is completed in hours or even minutes; or
reduction of yield from the activated sludge system by biological, mechanical or chemical
treatment of a portion of the return sludge.
This study was undertaken with the objective of evaluating several of these pretreatment
and side-stream technologies with the hope of developing a methodology for evaluating
the feasibility of a particular treatment technology to a wastewater that has never been
exposed to one of these technologies. It was hoped that this methodology would reduce
the necessity of conducting costly and time-consuming pilot studies of these technologies
by determining unique characteristics of sludges treated with these technologies.
A review of the available literature and the selection of the technologies to investigate was
previously conducted, so this manuscript will focus on the results found from analytical
work conducted on several sludges from different wastewater treatment plants that utilize

81
the technologies (Sandino et al. 2008). The technologies selected for this work are as
follows:
Thermal hydrolysis, specifically Cambi™ THP;
Mechanical shear, specifically Biogest AG Crown™ Press system;
Biological side-stream yield reduction, specifically Cannibal™.
Difficulties arose in acquiring samples of these technologies because, of the three being
investigated, only Cannibal has installations in the United States; the other two
technologies, along with several others that were desired for investigation, have
installations in other countries throughout the world. In addition to the full-scale
applications of these technologies, the authors had access to data from a Cambi pilot study
and lab-scale digestion study being conducted for District of Columbia Water and Sewer
Authority (DCWASA).
5.2 Materials and Methodology
5.2.1 Sample Collection
Sample coolers, bottles and instructions were provided and shipped by CH2MHill’s
Corvallis, OR laboratories to the treatment plants that were utilizing one of the selected
treatment processes. Most of these plants were located outside the United States; however
there was one Cannibal™ plant within driving distance of Virginia Tech, which provided
the opportunity to collect multiple samples and to witness how the process had been
installed and the plant modified to optimize operation.

82
5.2.2 Sample Preservation
Depending on the analysis being performed on a sample, certain preservation procedures
were implemented. All samples were shipped on ice to hinder additional biological
activity. For iron and aluminum analysis a volume of sample was preserved using
concentrated nitric acid. For COD analysis a volume of sample was preserved with
concentrated sulfuric acid. Upon arrival, a volume of the non-acidified samples was
centrifuged at approximately 17,700 x G on a Beckman-Coulter Avanti-JE high-speed,
refrigerated centrifuge for 15 minutes; the centrate was filtered through a 0.45 m
nitrocellulose membrane filter and frozen until analysis for soluble COD, protein,
polysaccharides, cations, anions and volatile fatty acids (VFAs). All other samples were
stored in a 4 °C refrigerator until analysis. Analysis of samples was conducted within a
week of arrival, with priority given to those procedures that required shorter hold times as
specified by Standard Methods (A.P.H.A. et al. 1995).
5.2.3 Sample Analysis
Samples were collected from numerous locations throughout the plant and analyzed for
pertinent characteristics as shown in Table 5.1.
Table 5.1- Sampling Locations and Analysis Performed
Sample Location pH TS/TSS
VS/VSS
COD/
SCOD
Soluble
Cations/
Anions
VFAs Total
Fe/Al
Protein
Polysacchar
ides
Raw Influent X TSS/VSS X X X
Primary Sludge X TS/VS X X X X X
Mixed Liquor X TSS/VSS X X X X X
WAS/Process
Feed
X TS/VS X X X X X
Post Process X TS/VS X X X X X
Digested Sludge X TS/VS X X X X X
Dewatering
Centrate/Filtrate
X TSS/VSS X X X
Final Effluent X TSS/VSS X X X

83
Analyses were conducted according to the methods described in Table 5.2. All samples
for soluble fraction analyses (SCOD, cations, anions, proteins, polysaccharides and VFAs)
were centrifuged and the centrate was filtered through 0.45 m nitrocellulose membrane
filters as previously described.

84
Table 5.2- Sample Analyses
Analysis Method Reference
pH Accumet electrode with AgCl
filling solution N/A
Total and Volatile Solids
Total and Volatile Suspended
Solids (TS/VS and TSS/VSS)
Standard Methods 2450 A, B, D, E (A.P.H.A. et al. 1995)
Total and Soluble Chemical
Oxygen Demand (COD)
Hach High Range COD tubes (20-
1500 mg/L COD)
(Hach Company,
Loveland, CO)
Soluble Cations
Dionex DX-120 Ion
Chromatograph with IonPac either
CS16 5x250 mm or CS12 5x250
mm columns, CG16 5x50 mm
guard column and either 25 mM
methane sulfonic acid or 10 mN
sulfuric acid as the eluents
N/A
Soluble Anions
Dionex DX-120 Ion
Chromatagoraph with IonPac AS9-
HC 4x250 mm column, AG9-HC
4x50 mm guard column and 9 mM
sodium bicarbonate as the eluent
N/A
Volatile Fatty Acids (VFAs)
HP 5890 with flame ionization
detector and Nukol Silca Capillary
Column, 15 m x 0.53 mm x 0.5
mm film thickness; carrier gas
pressurers: He= 17 mL/min N2= 13
mL/min, Air= 450 mL.min, H2= 45
mL/min; column pressure= 15 psi
N/A
Total Aluminum
Perkins-Elmer 5100 Flame Atomic
Adsorption Spectrophotometer;
gases= nitrous oxide, acetylene;
wavelength= 309.3 nm, method
detection limits= 5-100 mg/L
N/A
Total Iron
Perkins-Elmer 5100 Flame Atomic
Adsorption Spectrophotometer;
gases= air, acetylene; wavelength=
248.3nm, method detection limits=
0.3-10 mg/L
N/A
Protein
Frolund et al. modification of
Lowry method, utilizing bovine
serum albumin (BSA) and humic
acid as standards;
Bradford protein assay utilizing
BSA as standard
(Bradford 1976,
Frolund et al. 1995)
Polysaccharides
Colorimetric analysis using
sulfuric acid and phenol with
glucose as standard (Dubois et al. 1956)
*N/A= not applicable

85
5.3 Results and Discussion
The results presented herein are divided into three sections based on the technology being
investigated. Due to the nature of these results, the majority of them are presented as
tables in Appendix D; however pertinent data points will be provided in these sections.
5.3.1 Thermal Hydrolysis Process (THP)
For the Cambi THP system there was only one full-scale installation available for this
study, however, the authors also had access to data collected from the pilot and lab studies
being conducted for DCWASA. The samples from the full-scale installation of Cambi
were shipped from the treatment plant that serves Naestved, Denmark, which was one of
the first installations of Cambi in the world. The DCWASA samples are from a small pilot
study being conducted in two locations: the THP system is setup in Pennsylvania and the
Cambi treated sludge is being digested in bench-scale mesophilic reactors at Virginia Tech.
Table 5.3 contains the pertinent operating data for both applications.
Table 5.3- Cambi Plant Operating Characteristics
Characteristic Naestved DCWASA
Influent Plant Flow 5 MGD ~400 MGD
Flow to Cambi ND ~1 gal/batch
Flow to Digesters 12,310 gpd 1 L/day
Dry Solids to Disposal 9,666 lb/day ~60 g/day**
*ND= no data available
**Lab digesters
In its current installations the THP process consists of four primary steps that are outlined
below:
1. Thickening- WAS and primary sludge is thickened to 15-20% using centrifuges, belt
filter presses or other dewatering devices.

86
2. Pulping- The thickened sludge is pre-heated to 80-100°C using recycled steam from
the main reactor and is homogenized using a recycle loop and macerator.
3. Reactor- The homogenized sludge is fed from the pulper in batch operation and is
brought to 160-180°C and several bars pressure using steam. The reactor is
maintained at these conditions for approximately 30 minutes and produces a product
that meets Class A biosolids standards and causes no filamentous bulking problems in
the digester.
4. Flash Tank- Treated sludge is transferred to this tank by the opening of a valve which
causes a rapid drop in pressure drawing the sludge from one tank to the other and
causing some degree of cell lysing. The sludge is cooled to the digester temperature
in this tank.
Due to the size of the DCWASA pilot study, these steps are most likely combined into one
or two steps at the pilot plant and the digestion is separated by shipping time from the pilot
plant to Virginia Tech.
Figure 5.1 presents several images of Cambi treated sludge.

87
b d
a c

88
Figure 5.1 (a) Naestved Cambi Feed, (b) Naestved Cambi Effluent, (c) and (d) SEM
Micrographs of DCWASA Cambi Effluent
Figure 5.1a and b are photographs of the influent and effluent of the Naestved Cambi
process. As can be observed in Figure 5.1a, the influent has been thickened before being
fed to the pulper, while the effluent shown in Figure 5.1b is much thinner due to the steam
dilution, and more homogeneous in consistency due to the temperature and pressure
increase. Figure 5.1c and d present low vacuum scanning electron microscope (SEM)
images of a 1:25 dilution of the effluent from the DCWASA 150°C pilot unit at a 2000x
magnification, which illustrates the dispersed nature and small size of the flocs. The long,
string-like structures shown in Figure 5.1d could be some form of cellulose that was not
degraded in the activated sludge and not destroyed by the heat and pressure. Although a
picture of the discharge from the DCWASA pilot is not presented, it appeared to have a
less homogeneous consistency when compared to the Naestved discharge.
Table 5.4- Concentration Changes Caused by Cambi THP and Digestion
Characteristic Change Caused by
Cambi (Naestved)
Change Caused by
Digestion (Naestved)
Change Caused by
Digestion
(DCWASA)
TS -40.9% -42.6% -40.3%
VS -34.5% -45.4% -57.8%
TCOD 9.17% -20.3% -55.6%
SCOD -39.8% -74.2% ND
Polysaccharides 101 % -55.6% ND
Lowery Protein 1227% -78.1% ND
Bradford Protein 68.7% -42.5% ND
Total VFAs
(on HAc basis) 398% -94.7% -92.1%
*Negative (-) implies decrease
*ND= No Data Available

89
As can be seen in Table 5.4, the full-scale installation of the Cambi process and both the
full-scale and lab-scale digesters cause a significant decrease in the TS and VS of the
sludge. The decrease in TS and VS that occurred in the Cambi process is due to the direct
injection of steam into the sludge in the reaction vessel which is the method utilized for
increasing the temperature and pressure in the vessel. With the full-scale Cambi system,
there is an increase in the total COD but a decrease in the soluble COD caused by the
Cambi system. The decrease in SCOD does not seem to correlate with the dramatic
increase in proteins and polysaccharides that are caused by the THP, nor does it correlate
with the claims of cell hydrolysis and floc dispersion. The dramatic increase in proteins
and polysaccharides does indicate a dispersion of flocs and rupturing of cells, so it is
possible that the SCOD data could be inaccurate but, since there is no additional data with
which to compare, it is impossible to make a conclusive statement about the change in
SCOD caused by the THP process. The decrease of TCOD witnessed by both the full-
scale and lab-scale digesters, along with the significant decrease in SCOD, proteins and
polysaccharides, all indicate successful digestion of the Cambi treated sludge.
The changes in VFAs also correlate with what occurs in the Cambi process and with the
digesters, i.e. the VFAs increase dramatically in the Cambi process due to the hydrolysis of
a significant portion of the organic material in the feed sludge and are decreased by
conversion to CH4 and CO2 in the digesters. The increase in VFAs caused by the THP
correlates with the strong odors of the treated sludge which require appropriate capture and
treatment of the headspace gases from the pressure vessel.
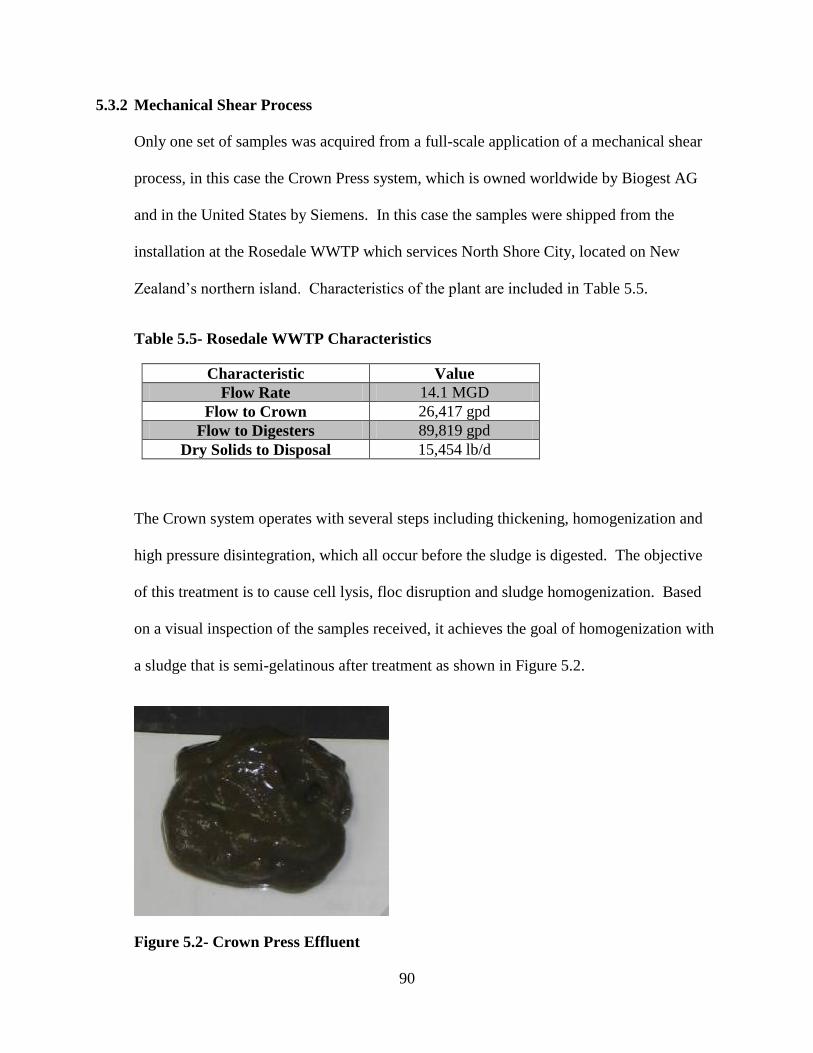
90
5.3.2 Mechanical Shear Process
Only one set of samples was acquired from a full-scale application of a mechanical shear
process, in this case the Crown Press system, which is owned worldwide by Biogest AG
and in the United States by Siemens. In this case the samples were shipped from the
installation at the Rosedale WWTP which services North Shore City, located on New
Zealand’s northern island. Characteristics of the plant are included in Table 5.5.
Table 5.5- Rosedale WWTP Characteristics
Characteristic Value
Flow Rate 14.1 MGD
Flow to Crown 26,417 gpd
Flow to Digesters 89,819 gpd
Dry Solids to Disposal 15,454 lb/d
The Crown system operates with several steps including thickening, homogenization and
high pressure disintegration, which all occur before the sludge is digested. The objective
of this treatment is to cause cell lysis, floc disruption and sludge homogenization. Based
on a visual inspection of the samples received, it achieves the goal of homogenization with
a sludge that is semi-gelatinous after treatment as shown in Figure 5.2.
Figure 5.2- Crown Press Effluent

91
A summary of the increase or decrease of several characteristics of the sludge that were
caused by the Crown press and by digestion is shown in Table 5.6.
Table 5.6- Concentration Changes Caused by Crown Press and Digestion
Characteristic Change Caused by
Crown
Change Caused by
Digestion
TS 2.24% -39.6%
VS 3.05% -38.5%
TCOD 16.3% -29.1%
SCOD 46.2% -61.5%
Polysaccharides 255% -88.2%
Lowery Protein 711% -77.8%
Bradford Protein 246% -78.2%
Total VFAs (on HAc basis) 6.74% -43.9%
*Negative (-) implies decrease
For all the above listed characteristics there was an increase caused by the Crown press
which, in some cases, was dramatic. The three characteristics that can potentially provide
the greatest insight into the efficacy of the Crown press are soluble COD, polysaccharides
and proteins. Polysaccharides are often considered to be primarily bound in the sludge floc
structure, while proteins are typically more prevalent within cells. Such dramatic increases
in the concentrations of both of these compounds give creditability to claims of cell lysis
and floc disruption and correlate to the increased SCOD concentrations. The increase in
VFA concentration is typical for many of the pretreatment technologies and is attributable
to the breaking up of cells and floc structure.
Within the digester all characteristics were significantly reduced with the least being
TCOD. Without knowing how effective the digesters were before the installation of the
Crown system it is impossible to comment on any improvement in digester performance,

92
however the VS reduction is slightly lower than the generally held value of 50% for
conventional digestion.
5.3.3 Biological Side-Stream Process
Of all the technologies investigated, the biological side-stream process, which has been
realized commercially as the Cannibal System, provided the most samples and the best
potential for developing a method for readily evaluating the system effectiveness and
applicability to new or retrofitted treatment plants. The primary reason for this success
was that Cannibal has been installed mainly in the United States and Virginia Tech has
prior experience working with US Filter and Siemens on the Cannibal technology, which
has allowed greater access to samples and treatment plants. The Cannibal system utilizes a
side-stream anaerobic bioreactor on a part of the RAS stream to effect release of floc-
bound polymeric substances which serve as a carbon source for the anaerobes and iron
compounds. After several hours of residence time in this side-stream reactor, the treated
RAS is returned to the activated sludge process where the anaerobes are degraded by the
aerobes and the floc is regenerated utilizing the free iron compounds. The overall effect is
a sort of endogenous decay with a reduction of plant yield of up to 50% or greater and a
sludge age that is significantly higher than most conventional treatment systems.
As with the previous two technologies investigated, this section focuses on data collected
from extensive analysis of field samples acquired from two treatment plants, one where
Cannibal has been a success, the other where it has not achieved the desired yield
reduction. The development of a simple and effective method for evaluating Cannibal’s
effectiveness is presented in another manuscript and includes an additional two Cannibal

93
plants, two lab scale Cannibal systems and several conventional activated sludge plants.
Characteristics of the Cannibal plants included in this manuscript are listed in Table 5.7.
Table 5.7- Cannibal Plant Characteristics
Characteristic Peru, IN Emporia, VA
Influent Flow 8.0 MGD 0.8 MGD
Plant Configuration Anoxic + 3 Siemens VLRs in series 2 oxidation ditches in series,
Pre-Cannibal Yield 0.8 0.60
Post-Cannibal Yield 0.1 0.35
As was previously mentioned in Chapter 3, these two plants are near the extremes of the
operating effectiveness of the Cannibal system, Peru being one of the best operating
installations while Emporia is one of the worst operating. This statement is reinforced by
the change in yield that was witnessed after Cannibal was installed at each plant: Peru
achieved almost 90% yield reduction while Emporia had less then 50%. Previous research
conducted at Virginia Tech, along with this study, has found that the Cannibal system
apparently works better when installed at plants were the activated sludge process
approaches plug flow and worse when installed on systems that are more complete mix.
This evaluation is reinforced by the results found from running the short-term batch
digestion studies that are discussed in the other manuscript in this thesis that focuses purely
on the Cannibal system.
Presented in Table 5.8 are a selection of the results of the extensive analyses conducted on
these two Cannibal plants and that provide a good indication of the operational
effectiveness of these plants.

94
Table 5.8- Concentration Changes Caused by Two Cannibal Plants
Characteristic Change Caused by Cannibal Bioreactor Peru, IN Emporia, VA
TS 51.0% 29.7%
VS 47.2% 31.4%
TCOD -72.2% 4.8%
SCOD -0.640% 61.4%
Polysaccharides -22.6% -27.0%
Lowery Protein ND 123%
Bradford Protein 244% 1170%
Total VFAs (on HAc basis) 54.8% 39.3%
*Negative (-) implies decrease
*ND= No Data Available
Unfortunately, based on these numbers there appears to be no ready correlation as to what
is occurring in the Cannibal reactor, however there are a few basic assessments that can be
made based on the differences between the two plants. Of first note is the difference in the
increases of TS and VS in the two plants, Peru’s increase in both characteristics is
significantly greater than the increase at Emporia. The TS concentration at Peru is
approximately 42% greater than at Emporia in both the influent and effluent of the
Cannibal bioreactor and the VS concentration is approximately 34% greater as well. This
difference along with several of the other differences between the two plants and the
apparently poor performance of the Emporia plant can be attributed to the excessively
over-sized capacity of the activated sludge system which results in conditions approaching
an extended aeration configuration where a significant portion of the organic material is
already degraded before it enters the Cannibal bioreactor.
In regards to the other characteristics, Peru mimics what would occur in a conventional
anaerobic digester where there is a decrease in TCOD, SCOD and floc bound polymeric

95
substances, although based on the Bradford protein number there is a release of bound
proteins which could indicate some cell degradation. On the other hand, Emporia witnesses
almost a completely opposite effect on all characteristics especially SCOD. The Bradford
protein concentration at Emporia increases almost five-fold compared to Peru, but when
the actual concentrations are compared the effluent concentrations from both plants are
similar (Emporia= 1.83 mg/L, Peru= 1.96 mg/L) and the influent concentration to Peru is
about five times greater than to Emporia (Emporia= 0.144 mg/L, Peru= 0.540 mg/L). Both
plants witnessed increases in the VFA concentrations, with Peru being greater by
approximately 30%. This increase in VFAs can be attributed to the incomplete anaerobic
digestion that occurs within the Cannibal bioreactor caused by the relatively short
residence time which allows, at most, partial hydrolysis and acidogenesis. Other than the
raw influent, both plants have low concentrations of VFAs throughout the plant and
according to the operators at the Emporia plant almost no odor issues, which is an
appealing characteristic.
5.4 Conclusions
Due to the lack of available samples with which to compare between each process, it is
difficult to make many conclusive statements about each process; however, there are
several statements that can be made to help direct future work.
For the Cambi system the conclusions from this study are as follows:
1. Based on visual and microscopic analysis of the Cambi treated sludge, the process
does affect a degree of destruction of flocs and cells and produces a well
homogenized digester feedstock. The increase in soluble proteins and

96
polysaccharides cause by the process does indicate a dispersion of flocs and cell lysis.
Whether the degree of cell lysis is as extreme as marketed is hard to conclude from
this research.
2. VS reduction over the Cambi process and the digesters correlates with many of the
reports on full-scale Cambi applications. It also has the added benefit of the potential
to decrease digester SRT, as illustrated by the DCWASA study where 15 days of
digestion achieves as much or greater than typical 20+ day digestion.
3. Although not investigated in this research, the treatment of the dewatering centrate
from the Cambi treated sludge poses issues due to its high concentrations of nitrogen
species and recalcitrant compounds that are largely attributed to the brown color of
the centrate.
For the Crown system the conclusion from this study are as follows:
1. The Crown process does achieve a degree of floc dispersion and cell destruction that
improves the digestibility of the sludge; however, without a frame of reference, it is
difficult to make any conclusions on how successful it has been. This is a technology
that requires additional investigation, especially in regards to digester performance
before and after the installation of the Crown system.
For the Cannibal system the conclusions from this study are as follows:
1. Of the three technologies investigated, Cannibal is the one that the authors have the
greatest understanding of due to previous and concurrent work being conducted in the
labs and a greater access to WWTPs that utilize this technology.

97
2. Based on a purely analytic investigation of the two plants, there is little to be stated
conclusively about the Cannibal process; however, there is the distinct issue of the
difference in operating performance. In reality, even though the Emporia plant is
“not working well” it achieved an almost 50% decrease in plant yield because of the
Cannibal system. In this respect, it is a successful installation of the Cannibal process
although the performance needs to be improved to achieve the desired yield
reduction. Therein lies the key to successful Cannibal operation, it does not require
any special organisms to operate successfully once the system has acclimated;
however, it seems to work better with particular activated sludge configurations (e.g.
plug flow).
3. This research led to the development of a simple method for evaluating the
effectiveness of the Cannibal system utilizing small batch reactors and comparing
SCOD release over time. This method is discussed in detail in a preceding chapter in
this thesis, although it requires additional refinement that could be achieved with a
comprehensive comparison of all the treatment plants that are currently operating the
Cannibal system.
5.5 References
APHA, AWWA, WPCF and WEF (1995) Standard methods for the examination of water
and wastewater. APHA, Washington, D.C.
Bradford, M. M. (1976) A Rapid and Sensitive Method for the Quantitation of Microgram
Quantities of Protein Utilizing the Principle of Protein-Dye Binding. Analytical
Biochemistry, 72, 248-254.
Dubois, M., K. A. Gilles, J. K. Hamilton, P. A. Rebers and F. Smith (1956) Colorimetric
Method for Determination of Sugars and Related Substances. Analytical Chemistry,
28, 350-356.

98
Frolund, B., T. Griebe and P. H. Nielsen (1995) ENZYMATIC-ACTIVITY IN THE
ACTIVATED-SLUDGE FLOC MATRIX. Appl. Microbiol. Biotechnol., 43(4),
755-761.
Sandino, J., R. Roxburgh, D. Whitlock and L. Fillmore (2008) CURRENT STATE OF
THE PRACTICE OF SLUDGE REDUCTION TECHNOLOGIES. WEF Residuals
and Biosolids Conference. Water Environment Federation.
Tchobanoglous, G., F. L. Burton and H. D. Stensel (2003) Wastewater engineering :
treatment and reuse. McGraw-Hill,, Boston.

99
6 SUMMARY AND CONCLUSIONS
This research derived several conclusions that can be utilized to guide further research into
the evaluation of sludge reduction technologies:
The Cannibal biological side-stream yield reduction process can be evaluated by
small, short-term batch reactors where the SCOD is analyzed daily. From these
measurements a comparison can be developed that produces a trend based on how
well the Cannibal system is performing. This trend is reflected by conventional
treatment plants based on their operational configuration, so a correlation can be
drawn between conventional plants that would perform well with an upgrade to the
Cannibal system and those that would not. This comparison needs further
development that can be realized by analyzing more Cannibal plants using the short-
term batch methodology and analyzing for SCOD as well as monitoring the
blackening of the reactors and the ORP. Additional clarity to this model can also be
realized by investigating the effluent quality of the Cannibal treatment plants.
In this study, ozone, shear and sonication had clear effects on the floc structure of
sludge and potentially cause cell rupture or lysis. These processes should improve the
digestibility of sludge, although, with the conditions utilized in this study, there was
little difference between the pretreated and untreated WAS digestibility. It appeared
that the greatest effect of these technologies on digestion occurred during the first
week of operation.
Thermal hydrolysis seems to have similar effects as ozone, shear and sonication on a
microscopic level (i.e. floc dispersion). It results in significant release of bound

100
proteins and polysaccharides that are subsequently fed to the digester. Significant
VSR (greater than 45-50%) is achieved during digestion, at a shorter SRT
Two additional considerations based on the initial project objectives are presented below.
Extensive evaluation of a particular technology should be undertaken before
installation because of the costs associated with each process and the issues that arise
on a case by case level.
A purely analytical approach to determining a characteristic or several characteristics
that stand out for each pretreatment technology has potential to be a method for
determining the applicability of a certain pretreatment technology to a sludge,
however, due to the lack of sludges to compare, this was not realized in this study.

101
7 REFERENCES
A.P.H.A., A.W.W.A., W.P.C.F. & W.E.F. (1995) Standard methods for the examination of
water and wastewater. APHA, Washington, D.C.
Ahn, K. H., I. T. Yeom, K. Y. Park, S. K. Maeng, Y. Lee, K. G. Song & J. H. Hwang
(2002) Reduction of sludge by ozone treatment and production of carbon source for
denitrification. Water Science and Technology, 46(11-12), 121-125.
Barjenbruch, M. & O. Kopplow (2003) Enzymatic, mechanical and thermal pretreatment
of surplus sludge. Advanced Environmental Research, 7(3), 715-720.
Barr, K. G., D. O. Solley, D. J. Starrenburg & R. G. Lewis (2008) Evaluation, selection
and initial performance of a large scale centralised biosolids facility at Oxley Creek
Water Reclamation Plant, Brisbane. Water Science and Technology, 57(10), 1579-
1586.
Bernal-Martinez, A., H. Carrere, D. Patureau & J.-P. Delgenes (2007) Ozone pre-treatment
as improver of PAH removal during anaerobic digestion of urban sludge.
Chemosphere, 68(6), 1013-1019.
Boehler, M. & H. Siegrist (2006) Potential of activated sludge ozonation. 4th International
Conference on Oxidation Technologies for Water and Wastewater Treatment, pp.
181-187. I W a Publishing, Goslar, Germany.
Bougrier, C., C. Albasi, J. P. Delgenes & H. Carrere (2006a) Effect of ultrasonic, thermal
and ozone pre-treatments on waste activated sludge solubilisation and anaerobic
biodegradability. Chemical Engineering and Processing, 45(8), 711-718.
Bougrier, C., A. Battimelli, J.-P. Delgenes & H. Carrere (2007a) Combined ozone
pretreatment and anaerobic digestion for the reduction of biological sludge
production in wastewater treatment. Ozone: Science and Engineering, 29(3), 201-
206.
Bougrier, C., J. P. Delgenes & H. Carrere (2006b) Combination of thermal treatments and
anaerobic digestion to reduce sewage sludge quantity and improve biogas yield.
Process Safety and Environmental Protection, 84(4 B), 280-284.
Bougrier, C., J. P. Delgenes & H. Carrere (2007b) Impacts of thermal pre-treatments on
the semi-continuous anaerobic digestion of waste activated sludge. Biochemical
Engineering Journal, 34(1), 20-27.

102
Bougrier, C., J. P. Delgenes & H. Carrere (2008) Effects of thermal treatments on five
different waste activated sludge samples solubilisation, physical properties and
anaerobic digestion. Chemical Engineering Journal, 139(2), 236-244.
Bradford, M. M. (1976) A Rapid and Sensitive Method for the Quantitation of Microgram
Quantities of Protein Utilizing the Principle of Protein-Dye Binding. Analytical
Biochemistry, 72, 248-254.
Braguglia, C. M., G. Mininni & A. Gianico (2008) Is sonication effective to improve
biogas production and solids reduction in excess sludge digestion? Water Science
and Technology, 57(4), 479-483.
Camacho, P., W. Ewert, J. Kopp, K. Panter, S. I. Perez-Elvira & E. Piat (2008) Combined
experiences of thermal hydrolysis and anaerobic digestion– latest thinking on
thermal hydrolysis of secondary sludge only for optimum dewatering and
digestion., WEFTEC08. Water Environment Federation, Chicago.
Camacho, P., V. Geaugey, P. Ginestet & E. Paul (2002) Feasibility study of mechanically
disintegrated sludge and recycle in the activated-sludge process. Water Science and
Technology, 46(10), 97-104.
Cao, X. Q., J. Chen, Y. L. Cao, J. Y. Zhu & X. D. Hao (2006) Experimental study on
sludge reduction by ultrasound. 5th World Water Congress of the International-
Water-Association, pp. 87-93. I W a Publishing, Beijing, PEOPLES R CHINA.
Carballa, M., G. Manterola, L. Larrea, T. Ternes, F. Omil & J. M. Lema (2007) Influence
of ozone pre-treatment on sludge anaerobic digestion: Removal of pharmaceutical
and personal care products. Chemosphere, 67(7), 1444-1452.
Carrere, H., C. Bougrier, D. Castets & J. P. Delgenes (2007) Impact of initial
biodegradability on sludge anaerobic digestion enhancement by thermal
pretreatment. IWA Specialist Conference on Facing Sludge Diversities, pp. 1551-
1555. Taylor & Francis Inc, Antalya, TURKEY.
Chon, D. H. (2005) Performance and mechanisms of excess sludge reduction in the
CannibalTM
process. Civil and Environmental Engineering. Virginia Polytechnic
Institute and State University Blacksburg.
Chu, L. B., S. T. Yan, X. H. Xing, A. F. Yu, X. L. Sun & B. Jurcik (2008) Enhanced
sludge solubilization by microbubble ozonation. Chemosphere, 72(2), 205-212.
Cui, R. & D. Jahng (2006) Enhanced methane production from anaerobic digestion of
disintegrated and deproteinized excess sludge. Biotechnology Letters, 28(8), 531-
538.

103
Dogruel, S., M. Sievers & F. Germirli-Babuna (2007) Effect of ozonation on
biodegradability characteristics of surplus activated sludge. Ozone-Sci. Eng., 29(3),
191-199.
Dohanyos, M., J. Zabranska, J. Kutil & P. Jenicek (2004) Improvement of anaerobic
digestion of sludge. Water Science and Technology, 49(10), 89-96.
Dubois, M., K. A. Gilles, J. K. Hamilton, P. A. Rebers & F. Smith (1956) Colorimetric
Method for Determination of Sugars and Related Substances. Analytical Chemistry,
28, 350-356.
Easwaran, S. P. (2006) Developing a mechanistic understanding and optimization of the
CannibalTM
process phase II. Department of Civil and Environmental Engineering.
Virginia Polytechnic Institute and State University, Blacksburg.
Fdz-Polanco, F., R. Velazquez, S. I. Perez-Elvira, C. Casas, D. del Barrio, F. J. Cantero,
M. Fdz-Polanco, P. Rodriguez, L. Panizo, J. Serrat & P. Rouge (2008) Continuous
thermal hydrolysis and energy integration in sludge anaerobic digestion plants.
Water Science and Technology, 57(8), 1221-1226.
Fjordside, C. (2001) An operating tale from Naeested Sewage Treatment plant.
MunicipalWastewater Treatment Nordic Conference. Copenhagen.
Frolund, B., T. Griebe & P. H. Nielsen (1995) Enzymatic-activity in the activated-sludge
floc matrix. Appl. Microbiol. Biotechnol., 43(4), 755-761.
Gavala, H. N., U. Yenal, I. V. Skiadas, P. Westermann & B. K. Ahring (2003) Mesophilic,
thermophilic anaerobic digestion of primary and secondary sludge. Effect of pre-
treatment at elevated temperature. Water Research, 37, 4561-4572.
Goel, R. K. & D. R. Noguera (2006) Evaluation of sludge yield and phosphorus removal in
a Cannibal solids reduction process. Journal of Environmental Engineering,
132(10), 1331-1337.
Grady, C. P. L., G. T. Daigger & H. C. Lim (1999) Biological Wastewater Treatment.
Marcel Dekker, New York.
Graja, S., J. Chauzy, P. Fernandes, L. Patria & D. Cretenot (2005) Reduction of sludge
production from WWTP using thermal pretreatment and enhanced anaerobic
methanisation. Water Science and Technology, 52(1-2), 267-273.
Haug, R. T., D. C. Stuckey, J. M. Gossett & P. L. McCarty (1978) Effect of thermal
pretreatment on digestibility and dewaterability of organic sludges. Journal Water
Pollution Control Federation, 73-85.

104
Hogan, F., S. Mormede, P. Clark & M. Crane (2004) Ultrasonic sludge treatment for
enhanced anaerobic digestion. Water Science and Technology, 50(9), 25-32.
Kamiya, T. & J. Hirotsuji (1998) New combined system of biological process and
intermittent ozonation for advanced wastewater treatment. Water Science and
Technology, 38(8-9 pt 7), 145-153.
Kim, J., C. Park, T. H. Kim, M. Lee, S. Kim, S. W. Kim & J. Lee (2003) Effects of various
pretreatments for enhanced anaerobic digestion with waste activated sludge.
Journal of Bioscience and Bioengineering, 95(3), 271-275.
Kim, M., W. Bae & R. E. Speece (2004) Improved anaerobic process efficiency using
mesophilic and thermophilic elutriated phased treatment. J. Environ. Eng.-ASCE,
130(9), 960-966.
McCarty, P. L. & D. P. Smith (1986) Anaerobic waste-water treatment .4. Environ. Sci.
Technol., 20(12), 1200-1206.
Kopp, J., J. Mueller, N. Dichtl & J. Schwedes (1997) Anaerobic digestion and dewatering
characteristics of mechanically disintegrated excess sludge. Water Science and
Technology, 36(11), 129-136.
Lee, J. W., H.-Y. Cha, K. Y. Park, K. G. Song & K. H. Ahn (2005) Operational strategies
for an activated sludge process in conjunction with ozone oxidation for zero excess
sludge production during winter season. Water Research, 39, 1199-1204.
Lehne, G., A. Muller & J. Schwedes (2000) Mechanical disintegration of sewage sludge.
1st World Water Congress of the International-Water-Association (IWA), pp. 19-
26. Paris, France.
Li, Y. Y. & T. Noike (1992) Upgrading of anaerobic digestion of waste activated sludge by
thermal pretreatment. Water Science and Technology, 26, 857-866.
Liu, Q.-S., Y. Liu, J.-H. Tay & Y. S. Kuan (2005) Responses of sludge flocs to shear
strength. Process Biochemistry, 40(10), 3213-3217.
Manterola, G., I. Uriarte & L. Sancho (2008) The effect of operational parameters of the
process of sludge ozonation on the solubilisation of organic and nitrogenous
compounds. Water Research, 42(12), 3191-3197.
Mao, T. & K. Y. Show (2006) Performance of high-rate sludge digesters fed with
sonicated sludge. 5th World Water Congress of the International-Water-
Association, pp. 27-33. I W a Publishing, Beijing, Peoples R China.
Material Safety Data Sheet, M. (2000) Ozone MSDS [online].
http://www.ozoneapplications.com/info/ozone_msds.htm [accessed 2/10/2009
2009]

105
McCarty, P. L. (2001) The developmental of anaerobic treatment and its future. Water
Science and Technology, 44(8), 149-156.
McCarty, P. L. & D. P. Smith (1986) Anaerobic waste-water treatment .4. Environ. Sci.
Technol., 20(12), 1200-1206.
Mines, R. O., C. B. Northenor & M. Murchison (2008) Oxidation and ozonation of waste
activated sludge. J. Environ. Sci. Health Part A-Toxic/Hazard. Subst. Environ.
Eng., 43(6), 610-618.
Muller, C. D. (2006) Shear Forces, Floc Structure and their Impact on Anaerobic Digestion
and Biosolids Stability. Civil and Environmental Engineering. Virginia Polytechnic
Institute and State University, Blacksburg.
Novak, J. T., D. H. Chon, B. A. Curtis & M. Doyle (2007a) Biological solids reduction
using the Cannibal process. Water Environment Research, 79(12), 2380-2386.
Novak, J. T., C. Park, M. Higgins, J,, Y. Chen, R. Morton, D. Gary, R. Forbes & Z. Erdal
(2007b) WERF Odor Study Phase III: Impacts of the MicroSludge Process on Odor
Causing Compounds. WEF Residuals and Biosolids Management Conference.
Water Environment Federation.
Panda, K. K. & A. P. Mathews (2008) Mass transfer of ozone in a novel in situ ozone
generator and reactor. J. Environ. Eng.-ASCE, 134(10), 860-869.
Pickworth, B., J. Adams, K. Panter & O. E. Solheim (2006) Maximising biogas in
anaerobic digestion by using engine waste heat for thermal hydrolysis pre-
treatment of sludge. Water Science and Technology, 54(5), 101-108.
Sakai, Y., T. Fukase, H. Yasui & M. Shibata (1997) Activated sludge process without
excess sludge production. Water Science and Technology, 36(11), 163-170.
Sandino, J., R. Roxburgh, D. Whitlock & L. Fillmore (2008) Current state of the practice
of sludge reduction technologies. WEF Residuals and Biosolids Conference. Water
Environment Federation.
Seka, M. A. & W. Verstraete (2003) Test for assessing shear sensitivity of activated sludge
flocs: A feasibility study. Water Research, 37(14), 3327-3334.
Show, K. Y., T. H. Mao & D. J. Lee (2007) Optimisation of sludge disruption by
sonication. Water Research, 41(20), 4741-4747.
Strunkmann, G. W., J. A. Muller, F. Albert & J. Schwedes (2006) Reduction of excess
sludge production using mechanical disintegration devices. Water Science and
Technology, 54(5), 69-76.

106
Stuckey, D. C. & P. L. McCarty (1978) Thermochemical pretreatment of nitrogenous
materials to increase methane yield. Biotechnology and Bioengineering
Symposium, pp. 219-233.
Stuckey, D. C. & P. L. McCarty (1984) Effect of thermal pretreatment on the anaerobic
biodegradability and toxicity of waste activated sludge. Water Research, 18(11),
1343-1353.
Tanaka, S., T. Kobayashi, K. I. Kamiyama & L. N. Bildan (1997) Effects of
thermochemical pretreatment on the anaerobic digestion ofwaste activated sludge.
Water Science and Technology, 35(8), 209-215.
Tchobanoglous, G., F. L. Burton & H. D. Stensel (2003) Wastewater engineering :
treatment and reuse. McGraw-Hill,, Boston.
Tiehm, A., K. Nickel, M. Zellhorn & U. Neis (2001) Ultrasonic waste activated sludge
disintegration for improving anaerobic stabilization. Water Research, 35(8), 2003-
2009.
Valo, A., H. Carrere & J. P. Delgenes (2004) Thermal, chemical and thermo-chemical pre-
treatment of waste activated sludge for anaerobic digestion. Journal of Chemical
Technology and Biotechnology, 79, 1197-1203.
Xie, R., Y. Xing, Y. A. Ghani, K. E. Ooi & S. W. Ng (2007) Full-scale demonstration of
an ultrasonic disintegration technology in enhancing anaerobic digestion of mixed
primary and thickened secondary sewage sludge. J. Environ. Eng. Sci., 6(5), 533-
541.
Yeom, I. T., K. R. Lee, Y. H. Lee, K. H. Ahn & S. H. Lee (2002) Effects of ozone
treatment on the biodegradability of sludge from municipal wastewater treatment
plants. Water Science and Technology, 46(4-5), 421-425.
Zhang, G. M., P. Y. Zhang, J. Yang & H. Z. Liu (2008) Energy-efficient sludge sonication:
Power and sludge characteristics. Bioresour. Technol., 99(18), 9029-9031.
Zhang, G. M., P. Y. Zhang, J. M. Yang & Y. M. Chen (2007) Ultrasonic reduction of
excess sludge from the activated sludge system. Journal of Hazardous Materials,
145(3), 515-519.
Zhao, Y. X., J. Yin, H. L. Yu, N. Han & F. J. Tian (2007) Observations on ozone treatment
of excess sludge. Water Science and Technology, 56(9), 167-175.

A1
Appendix A: Cannibal Batch Digestion Study Data
Table A1- Emporia SCOD Release
Sample SCOD1 SCOD2 Avg SCOD1 SCOD2 Avg Avg SCOD
0:00:00 45 40 42.5 45 40 42.5 42.5
3:45:00 68 65 66.5 42 36 39 52.8
18:15:00 166 164 165 156 144 150 157.5
26:40:00 230 230 230 182 194 188 209.0
44:15:00 331 335 333 281 258 269.5 301.3
66:30:00 369 369 369 357 364 360.5 364.8
74:40:00 505 497 501 452 456 454 477.5
77:40:00 450 442 446 403 400 401.5 423.8
93:00:00 476 473 474.5 423 416 419.5 447.0
117:45:00 513 509 511 484 470 477 494.0
138:30:00 569 573 571 571 515 515 543.0
149:45:00 579 577 578 510 527 518.5 548.3
Reactor 1 Reactor 2
Table A2- Peru SCOD Release
Sample SCOD1 SCOD2 Avg SCOD1 SCOD2 Avg Avg SCOD
0:00:00 49 54 51.5 49 54 51.5 51.5
20:00:00 394 402 398 156 170 163 280.5
25:30:00 384 420 402 538 541 539.5 470.8
46:25:00 698 679 688.5 299 280 289.5 489.0
67:10:00 750 742 746 290 312 301 523.5
74:25:00 990 969 979.5 409 410 409.5 694.5
91:55:00 1504 1484 1494 1208 1172 1190 1342.0
96:55:00 1550 1522 1536 1206 1246 1226 1381.0
115:25:00 1574 1548 1561 1238 1204 1221 1391.0
121:40:00 1078 1110 1094 440 516 478 786.0
140:25:00 1178 1204 1191 552 556 554 872.5
163:10:00 1288 1286 1287 632 644 638 962.5
187:10:00 1304 1316 1310 706 680 693 1001.5
215:45:00 1304 1319 1311.5 778 794 786 1048.8
233:30:00 1204 1212 1208 852 854 853 1030.5
Reactor 1 Reactor 2

A2
Table A3- Big Bear SCOD Release
Sample SCOD1 SCOD2 Avg SCOD1 SCOD2 Avg Avg SCOD
0:00:00 54 53 53.5 54 53 53.5 53.5
25:00:00 347 343 345 326 329 327.5 336.3
47:15:00 422 423 422.5 423 427 425 423.8
71:10:00 454 457 455.5 456 474 465 460.3
96:15:00 462 459 460.5 479 480 479.5 470.0
170:30:00 647 645 646 640 635 637.5 641.8
194:00:00 209 208 208.5 263 263 263 235.8
280:00:00 411 403 407 383 379 381 394.0
326:30:00 385 376 380.5 335 340 337.5 359.0
352:30:00 281 283 282 299 286 292.5 287.3
Table A4- Morongo SCOD Release
Sample SCOD1 SCOD2 Avg SCOD1 SCOD2 Avg Avg SCOD
0:00:00 60 56 58 60 56 58 58.0
24:15:00 244 239 241.5 203 205 204 222.8
48:10:00 371 370 370.5 349 354 351.5 361.0
73:15:00 405 410 407.5 409 405 407 407.3
147:30:00 589 593 591 589 590 589.5 590.3
171:00:00 232 232 232 241 241 241 236.5
267:00:00 398 392 395 289 290 289.5 342.3
313:30:00 283 282 282.5 350 346 348 315.3
339:30:00 288 285 286.5 292 270 281 283.8
Reactor 1 Reactor 2
Reactor 1 Reactor 2

A3
Table A5- Peppers Ferry SCOD Release
Sample SCOD1 SCOD2 Avg SCOD1 SCOD2 Avg Avg SCOD
0:00:00 40 44 42 40 44 42 42.0
18:30:00 644 656 650 637 649 643 646.5
25:40:00 782 764 773 718 746 732 752.5
42:00:00 776 794 785 834 860 847 816.0
47:00:00 1114 1122 1118 1000 1018 1009 1063.5
68:45:00 1385 1445 1415 1050 1090 1070 1242.5
114:30:00 884 886 885 630 638 634 759.5
139:45:00 1466 1432 1449 892 894 893 1171.0
163:20:00 1664 1446 1555 1534 1516 1525 1540.0
186:45:00 1336 1314 1325 1286 1296 1291 1308.0
282:40:00 1368 1344 1356 670 668 669 1012.5
306:35:00 1004 1008 1006 782 808 795 900.5
Table A6- Christiansburg SCOD Release
Sample SCOD1 SCOD2 Avg SCOD1 SCOD2 Avg Avg SCOD
0:00:00 17 12 14.5 17 12 14.5 14.5
18:30:00 1185 1208 1196.5 1298 1334 1316 1256.3
25:40:00 1338 1374 1356 1380 1416 1398 1377.0
42:00:00 1232 1262 1247 1282 1310 1296 1271.5
47:00:00 1614 1586 1600 1670 1688 1679 1639.5
68:45:00 1280 522 901 890 904 897 899.0
114:30:00 1144 1166 1155 784 802 793 974.0
139:45:00 1256 1238 1247 1166 1158 1162 1204.5
163:20:00 1398 1388 1393 1354 1360 1357 1375.0
186:45:00 1396 1420 1408 1028 1022 1025 1216.5
282:40:00 1260 1230 1245 1198 1164 1181 1213.0
306:35:00 1292 1318 1305 1024 1020 1022 1163.5
Reactor 1 Reactor 2
Reactor 1 Reactor 2

A4
Table A7- Blacksburg SCOD Release
Sample SCOD1 SCOD2 Avg SCOD1 SCOD2 Avg Avg SCOD
0:00:00 92 100 96 92 100 96 96.0
18:30:00 581 583 582 584 598 591 586.5
25:40:00 624 642 633 714 732 723 678.0
42:00:00 766 778 772 816 838 827 799.5
47:00:00 1010 1014 1012 1012 1028 1020 1016.0
68:45:00 846 836 841 594 588 591 716.0
114:30:00 686 692 689 814 794 804 746.5
139:45:00 1010 998 1004 1038 1078 1058 1031.0
163:20:00 798 784 791 708 806 757 774.0
186:45:00 1020 988 1004 836 836 836 920.0
282:40:00 682 704 693 692 688 690 691.5
306:35:00 722 714 718 504 566 535 626.5
Table A8- Change in TS and VS
SampleTS
(mg/L)
VS
(mg/L)
TS/Time
(mg/L/h)
VS/Time
(mg/L/h)
Emporia 1 1,889 1,322 11.29 7.91
Emporia 2 2,211 1,433 13.22 8.57
Peru 1 3,856 1,356 16.51 5.81
Peru 2 5,611 2,544 24.03 10.90
Big Bear 1 1,378 2,078 3.91 5.89
Big Bear 2 1,611 722 4.57 2.05
Morongo 1 1,750 483 5.15 1.42
Morongo 2 2,011 883 5.92 2.60
Pep Frry 1 4,011 3,844 13.08 12.54
Pep Frry 2 4,700 4,389 15.33 14.32
Cburg 1 1,811 1,872 5.91 6.11
Cburg 2 1,678 1,711 5.47 5.58
Bburg 1 2,811 2,844 9.17 9.28
Bburg 2 2,978 2,822 9.71 9.21
Reactor 1 Reactor 2

A5
Figure A1- Change in TS and VS
0
0.0005
0.001
0.0015
0.002
0.0025
0.003
0.0035
0.004
0.0045
0.005
TS (%
)
TS
VS

B1
Appendix B: Columbus Batch Digestion Studies Data
Note: Red = CCOD data
Table B1- Shear Reactor Data
DateOld/
NewTS (%) VS (%)
TCOD
(mg/L)
CCOD\
SCOD
(mg/L)
SCOD/
TCODpH ORP
Gas Vol
(L)
12/11/2008 New 4.52% 3.44% 63,117 6,218 9.85% 6.48 ND ND
1/7/2009 Old 3.20% 2.24% 54,685 13,590 24.85% 5.94 ND 7.75
1/7/2009 New 5.26% 4.11% 60,852 11,730 19.28% 6.12 ND ND
1/21/2009 Old 3.89% 2.72% 68,145 17,770 26.08% 6.64 ND 12.46
1/21/2009 New 5.66% 4.56% 78,820 14,580 18.50% 6.04 ND ND
1/29/2009 Old 5.63% 3.92% 77,468 20,450 26.40% 7.3 -269 9.14
2/5/2009 Old 5.02% 3.38% 70,691 22,240 31.46% 7.25 -249 3.45
2/12/2009 Old 4.91% 3.06% 73,220 20,000 27.31% 7.43 -261 6.2965
2/19/2009 Old 4.81% 3.16% 70,809 20,400 28.81% 7.69 -272 8.0955
2/26/2009 Old 4.86% 3.12% ND ND ND ND ND ND
3/5/2009 Old 5.23% 3.51% ND ND ND ND ND ND
Table B2- Sonication Reactor Data
DateOld/
NewTS (%) VS (%)
TCOD
(mg/L)
CCOD\
SCOD
(mg/L)
SCOD/
TCODpH ORP
Gas Vol
(L)
12/11/2008 New 4.28% 3.29% 59,891 9,178 15.32% 6.4 ND ND
1/7/2009 Old 3.08% 2.10% 37,582 11,545 30.72% 6.98 ND ND
1/7/2009 New 5.34% 4.18% 64,724 8,710 13.46% 6.26 ND ND
1/20/2009 Old 3.82% 2.71% 63,358 15,240 24.05% 6.69 ND 9.97
1/20/2009 New 5.62% 4.52% 82,461 11,280 13.68% 5.96 ND ND
1/29/2009 Old 5.03% 3.22% 73,236 22,610 30.87% 7.29 -278 10.19
2/5/2009 Old 4.91% 3.09% 70,234 25,980 36.99% 7.4 -300 1.27
2/12/2009 Old 4.83% 3.05% 72,391 23,200 32.05% 7.39 -246 2.40
2/19/2009 Old 4.77% 2.97% 66,759 24,520 36.73% 7.44 -239 0.599667
2/26/2009 Old 4.92% 2.98% ND ND ND ND ND ND
3/5/2009 Old 4.79% 2.95% ND ND ND ND ND ND

B2
Table B3- Ozone Reactor Data
DateOld/
NewTS (%) VS (%)
TCOD
(mg/L)
CCOD\
SCOD
(mg/L)
SCOD/
TCODpH ORP
Gas Vol
(L)
12/11/2008 New 4.53% 3.53% 60,412 36,585 60.56% ND ND ND
1/7/2009 Old 3.26% 2.35% 63,937 21,270 33.27% 5.3 ND ND
1/7/2009 New 5.15% 4.05% 46,049 12,115 26.31% 5.92 ND ND
1/22/2009 Old 3.92% 2.80% 76,554 24,300 31.74% 5.24 ND 6.30
1/22/2009 New 5.75% 4.65% 84,524 16,660 19.71% 5.44 ND ND
1/29/2009 Old 5.04% 3.19% 79,946 25,930 32.43% 7.01 -267 2.79
2/5/2009 Old 5.00% 3.16% 60,152 31,690 52.68% 7.12 -277 1.95
2/12/2009 Old 5.00% 3.12% 71,490 27,040 37.82% 7.65 -270 2.40
2/19/2009 Old 4.83% 2.89% 65,752 23,300 35.44% 7.78 -283 1.98
2/26/2009 Old 5.03% 3.05% ND ND ND ND ND ND
3/5/2009 Old 5.28% 2.87% ND ND ND ND ND ND
Table B4- Control Reactor Data
DateOld/
NewTS (%) VS (%)
TCOD
(mg/L)
CCOD\
SCOD
(mg/L)
SCOD/
TCODpH ORP
Gas Vol
(L)
12/11/2008 New 4.28% 3.32% 61,404 9,965 16.23% 6.25 ND ND
1/7/2009 Old 3.55% 2.47% 38,561 15,750 40.84% 6.34 ND 2.92
1/7/2009 New 5.23% 4.09% 52,426 8,120 15.49% 6.34 ND ND
1/20/2009 Old 4.04% 2.85% 61,746 16,220 26.27% 6.98 ND 33.28
1/20/2009 New 5.80% 4.70% 82,593 8,900 10.78% 6.03 ND ND
1/29/2009 Old 4.85% 3.16% 72,628 18,220 25.09% 7.23 -260 38.71
2/5/2009 Old 4.78% 3.06% 68,969 23,790 34.49% 7.53 -290 3.45
2/12/2009 Old 4.59% 2.87% 65,297 20,820 31.88% 7.36 -256 3.30
2/19/2009 Old 4.51% 2.79% 63,166 24,880 39.39% 7.35 -243 2.70
2/26/2009 Old 4.70% 2.88% ND ND ND ND ND ND
3/5/2009 Old 4.53% 2.82% ND ND ND ND ND ND

B3
Table B5- Feed Sludge Data
DateOld/
NewTS (%) VS (%)
TCOD
(mg/L)
CCOD\
SCOD
(mg/L)
SCOD/
TCODpH
12/11/2008 Primary 4.79% 4.00% 64,801 5,105 7.88% ND
1/7/2009 Primary 6.21% 5.22% 78,176 4,715 6.03% 5.29
1/20/2009 Primary 6.52% 5.57% 81,491 4,270 5.24% 5.13
12/11/2008 WAS 5.88% 4.34% 69,316 11,835 17.07% ND
1/7/2009 WAS 6.15% 4.80% 80,373 9,025 11.23% 6.37
1/20/2009 WAS 5.94% 4.74% 91,856 12,100 13.17% 5.96
12/11/2008 Shear 5.71% 4.28% 77,844 16,140 20.73% ND
1/7/2009 Shear 6.15% 4.73% 54,015 19,180 35.51% ND
1/20/2009 Shear 5.74% 4.62% 80,099 22,970 28.68% 5.96
12/11/2008 Soni 5.70% 4.23% 72,712 24,660 33.91% ND
1/7/2009 Soni 6.16% 4.72% 79,549 10,330 12.99% 6.15
1/20/2009 Soni 5.99% 4.82% 93,183 13,390 14.37% 6.03
12/11/2008 O3 5.76% 4.30% 72,269 20,325 28.12% ND
1/7/2009 O3 6.14% 4.74% 85,156 15,980 18.77% 6.15
1/20/2009 O3 6.23% 4.98% 78,455 23,150 29.51% 5.73
12/11/2008 DS 2.64% 1.61% 18,742 2,255 12.03% ND
1/7/2009 DS 3.36% 2.10% 30,436 1,040 3.42% ND
Table B6- Cation Data (2/5/09)
SampleCa (mg/L)
Mg
(mg/L) K (mg/L)
NH4
(mg/L)
Na
(mg/L)
Shear 313.2 336.8 534.8 1304.3 228.3
Soni 340.3 316.5 477.2 892.4 222.8
O3 354.3 330.3 509.0 1041.8 224.0
Control 357.6 320.1 480.1 859.0 224.6

C1
Appendix C: Blacksburg Area Batch Digestion Studies Data
Note: Red Italics = SCOD data
Table C1- Seed Reactor Data
Sample TS (%) VS (%)
TCOD
(mg/L)
CCOD
(mg/L)
Day 0 3.53% 2.18% 22,707 88
Day 8 3.32% 2.05% 27,075 5,152
Day 15 3.07% 1.76% 29,700 4,815
Day 27 3.07% 1.83% 26,700 5,558
Day 57 3.24% 1.72% 19,550 3,600
Table C2- Christiansburg 1 min Shear Reactor Data
Sample TS (%) VS (%)
TCOD
(mg/L)
CCOD
(mg/L)
Untrtd WAS 11/3 1.22% 1.04% 11,077 664
Trtd WAS 11/4 1.21% 1.09% 15,625 151
Day 0 1.71% 1.29% 18,718 2,637
Day 8-1 1.36% 0.92% 15,238 3,556
Day 8-2 1.07% 0.69% 11,850 2,994
Day 15-1 1.21% 0.81% 13,800 2,770
Day 15-2 1.30% 0.86% 14,225 2,238
Day 27-1 1.13% 0.68% 12,400 2,445
Day 27-2 1.25% 0.78% 12,525 2,030
Day 57-1 1.03% 0.63% 3,100 1,635
Day 57-2 1.20% 0.75% 2,900 1,945
Table C3- Peppers Ferry 1 min Shear Reactor Data
Sample TS (%) VS (%)
TCOD
(mg/L)
CCOD
(mg/L)
Untrtd WAS 11/3 2.17% 1.62% 19,418 7,545
Trtd WAS 11/4 1.23% 1.06% 21,557 199
Day 0 1.62% 1.22% 26,390 1,185
Day 8-1 2.36% 1.55% 25,175 2,680
Day 8-2 1.48% 1.03% 17,088 2,854
Day 15-1 1.88% 1.22% 20,050 2,575
Day 15-2 1.95% 1.27% 20,100 2,800
Day 27-1 1.78% 1.11% 18,800 2,213
Day 27-2 1.83% 1.17% 18,475 2,623
Day 57-1 1.74% 1.08% 8,300 2,110
Day 57-2 1.83% 1.15% 6,900 2,910

C2
Table C4- Christiansburg 10 min Reactor Data
Sample TS (%) VS (%)
TCOD
(mg/L)
CCOD
(mg/L)
Untrtd WAS 11/3 1.22% 1.04% 11,077 664
Trtd WAS 11/4 1.97% 1.49% 15,850 2,252
Day 0 2.11% 1.53% 20,590 2,754
Day 8-1 1.48% 0.98% 15,138 2,824
Day 8-2 0.92% 0.57% 10,675 3,278
Day 15-1 1.20% 0.80% 12,550 2,070
Day 15-2 1.21% 0.80% 13,450 2,458
Day 27-1 1.13% 0.74% 11,625 1,973
Day 27-2 1.14% 0.74% 11,875 2,383
Day 57-1 1.14% 0.71% 6,350 1,210
Day 57-2 1.11% 0.69% 4,750 1,825
Table C5- Peppers Ferry 10 min Shear Reactor Data
Sample TS (%) VS (%)
TCOD
(mg/L)
CCOD
(mg/L)
Untrtd WAS 11/3 2.17% 1.62% 19,418 7,545
Trtd WAS 11/4 1.95% 1.44% 23,582 2,215
Day 0 2.23% 1.58% 27,317 2,665
Day 8-1 1.90% 1.24% 17,913 3,276
Day 8-2 2.13% 1.41% 22,100 3,322
Day 15-1 1.88% 1.25% 17,900 2,885
Day 15-2 2.00% 1.28% 19,550 3,078
Day 27-1 1.84% 1.16% 17,725 2,435
Day 27-2 1.87% 1.18% 17,875 2,685
Day 57-1 1.86% 1.15% 6,500 2,735
Day 57-2 1.56% 0.94% 4,700 2,865
Table C6- Christiansburg Ozone Reactor Data
Sample TS (%) VS (%)
TCOD
(mg/L)
CCOD
(mg/L)
Untrtd WAS 11/3 1.22% 1.04% 11,077 664
Trtd WAS 11/4 0.99% 0.83% 13,082 410
Day 0 1.68% 1.27% 14,100 1,661
Day 8-1 0.88% 0.60% 10,588 3,026
Day 8-2 1.19% 0.82% 14,338 2,704
Day 15-1 1.31% 0.86% 14,050 2,230
Day 15-2 1.15% 0.75% 12,600 1,858
Day 27-1 1.27% 0.82% 12,575 1,880
Day 27-2 1.11% 0.71% 11,650 1,553
Day 57-1 1.24% 0.78% 5,750 1,125
Day 57-2 1.09% 0.66% 5,150 900

C3
Table C7- Peppers Ferry Ozone Reactor Data
Sample TS (%) VS (%)
TCOD
(mg/L)
CCOD
(mg/L)
Untrtd WAS 11/3 2.17% 1.62% 19,418 7,545
Trtd WAS 11/4 2.05% 1.60% 17,457 117
Day 0 2.36% 1.73% 23,921 1,605
Day 7-1 0.96% 0.65% 10,288 1,284
Day 7-2 1.05% 0.73% 9,338 1,356
Day 14-1 2.04% 1.32% 20,175 1,690
Day 14-2 1.63% 1.07% 15,850 1,375
Day 26-1 2.06% 1.34% 19,050 1,463
Day 26-2 2.18% 1.42% 22,400 1,143
Day 57-1 2.01% 1.35% 5,550 700
Day 57-2 2.16% 1.35% 4,050 560
Table C8- Christiansburg Control Reactor Data
Sample TS (%) VS (%)
TCOD
(mg/L)
CCOD
(mg/L)
Untrtd WAS 1/26 3.20% 2.85% 42,351 1,765
Day 0 2.62% 2.32% 26,533 1,995
Day 7-1 2.80% 2.39% 44,171 5,525
Day 7-2 2.37% 1.99% 41,622 6,243
Day 14-1 2.21% 1.50% 42,122 24,850
Day 14-2 2.90% 1.69% 37,851 23,350
Day 21-1 3.28% 1.74% 41,983 22,540
Day 21-2 2.81% 1.60% 38,468 20,180
Table C9- Peppers Ferry Control Reactor Data
Sample TS (%) VS (%)
TCOD
(mg/L)
CCOD
(mg/L)
Untrtd WAS 1/26 2.96% 2.35% 27,020 105
Day 0 3.05% 2.35% 35,010 895
Day 7-1 2.72% 1.99% 41,283 5,573
Day 7-2 2.41% 1.77% 35,421 5,128
Day 14-1 2.33% 1.66% 31,390 7,225
Day 14-2 2.19% 1.56% 26,693 6,485
Day 21-1 2.27% 1.57% 29,129 4,980
Day 21-2 2.04% 1.40% 26,460 4,140

C4
Table C10- Christiansburg 1 min Shear Reactor 2 Data
Sample TS (%) VS (%)
TCOD
(mg/L)
CCOD
(mg/L)
Trtd WAS 1/26 3.73% 3.42% 59,983 1,825
Day 0 2.70% 2.33% 34,863 2,520
Day 7 2.30% 1.98% 39,012 6,693
Day 14 2.94% 1.77% 38,280 18,690
Day 21 2.69% 1.52% 37,284 19,780
Table C11- Peppers Ferry 1 min Shear Reactor 2 Data
Sample TS (%) VS (%)
TCOD
(mg/L)
CCOD
(mg/L)
Trtd WAS 1/26 4.23% 3.39% 57,258 1,190
Day 0 3.49% 2.87% 41,328 1,495
Day 7 2.94% 2.13% 47,795 10,075
Day 14 2.89% 2.04% 43,944 13,050
Day 21 2.62% 1.79% 37,267 8,900

D1
Appendix D: WEF/WERF Waste Activated Sludge Solids Reduction Process Study Data Summary
Abbreviations:
ND = No Data Available
BDL = Below Detection Limit
Polysacc = Polysaccharide
Lowery = Lowery Protein Assay
Bradford = Bradford Protein Assay

D2
Table D1- Cannibal Data Summary
Biopolymer Soluble Cations Soluble Anions Volatile Fatty Acids
Tmt Plant- Date
Smpl Lctn
TSS\TS
VSS\VS
TCODSCOD
Polysac
Lowery
Bradford
Humic
Tot Fe
Tot Al
NH4 +
K + Na +M
g 2+Ca 2+
Cl -NO
2 -
NO3 -
SO4 2-
PO4 3-
Acetic
Proprionic
Isobutyric
Butyric
Isovaleric
Valeric
Isocaproic
Hexanoic
Heptanoic
Total VFA
Tmt Plant- Date
Smpl Lctn % mg/L % mg/L mg/L mg/L mg/L mg/L mg/L mg/L mg/L mg/L mg/L mg/L mg/L mg/L mg/L mg/L mg/L mg/L mg/L mg/L mg/L mg/L mg/L mg/L mg/L mg/L mg/L mg/L mg/L
mg/L as
Hac
Empr- 6/17 Raw Inf 6.24% 357 4.15% 120 687 177 ND ND ND ND 2.80 5.11 71.2 19.7 88.4 3.90 27.0 ND ND ND ND ND 52.3 3.88 0.715 0.445 0.836 0.202 BDL 0.122 BDL 56.3
Empr, VA- 8/14Raw Inf 5.62% 357 4.49% 59.9 487 253 ND ND ND ND 1.34 0.790 44.6 44.6 44.6 44.6 44.6 115.36 BDL 17.6 BDL 5.12 72.5 8.37 1.16 1.61 1.35 1.72 BDL BDL BDL 81.6
Peru, IN- 4/25Raw Inf 1.30% 45.3 0.17% 39.3 ND ND ND ND ND ND 0.64 0.637 ND ND ND ND ND ND ND ND ND ND ND ND ND ND ND ND ND ND ND ND
Peru, IN- 10/3Raw Inf 2.27% 70.0 1.807% 14.3 199 95 ND ND ND ND ND ND 10.7 8.53 146 34.2 60.9 346 BDL BDL 78.7 BDL 5.63 0.829 0.468 0.699 0.333 0.636 0.388 1.27 4.41 10.2
Empr- 6/17 Mxd Lqr 2.12% 3,635 1.63% 795 3,900 21.5 0.264 9.04 ND 2.22 26.0 46.7 BDL 20.6 82.2 0.695 23.3 ND ND ND ND ND 2.89 0.069 0.056 0.102 BDL BDL BDL BDL BDL 3.03
Empr, VA- 8/14Mxd Lqr 2.14% 4,140 1.498% 1,240 4,350 37 2.36 5.28 0.233 4.32 106 212 BDL 24.2 93.5 BDL 30.6 96.9 BDL 44.2 6.85 5.66 1.47 0.459 BDL BDL BDL BDL BDL BDL BDL 1.79
Peru, IN- 4/25Mxd Lqr 2.87% 5,003 0.62% 3,560 ND ND 8.96 0.166 ND 2.93 153 85.6 ND ND ND ND ND ND ND ND ND ND ND ND ND ND ND ND ND ND ND ND
Peru, IN- 10/3Mxd Lqr 1.44% 14,156 0.752% 6,744 16,800 61.5 3.30 ND 0.263 ND ND ND BDL 11.6 132 41.5 52.6 247 BDL BDL 53.6 BDL 1.76 0.128 0.107 0.205 0.021 0.068 0.900 0.139 0.290 2.72
Empr- 6/17 Cann Inf 0.794% 7,756 0.600% 1,889 8,760 44.0 3.35 2.28 ND 1.29 33.5 101 BDL 20.8 81.0 1.47 24.6 --- --- --- --- --- 3.02 0.051 0.062 BDL BDL BDL BDL BDL BDL 3.10
Empr, VA- 8/14Cann Inf 0.662% 5,989 0.446% 1,956 7,200 42 3.35 3.25 0.144 2.46 102 203 BDL 25.6 93.7 BDL 30.0 98.3 BDL 47.0 3.94 BDL 1.79 BDL BDL BDL BDL BDL BDL BDL BDL 1.79
Peru, IN- 4/25Cann Inf 2.15% 20,943 1.06% 10,629 ND ND 10.4 ND ND 3.25 249 160 ND ND ND ND ND ND ND ND ND ND ND ND ND ND ND ND ND ND ND ND
Peru, IN- 10/3Cann Inf 2.26% 23,550 1.18% 11,267 25,167 78.5 3.30 ND 0.570 ND ND ND 34.4 43.5 144 50.7 31.7 263 BDL BDL BDL 11.6 1.45 0.087 0.171 0.235 0.112 0.019 0.619 0.156 0.097 2.24
Empr- 6/17 Cann Eff 0.848% 8,367 0.646% 1,989 9,724 60.0 0.835 6.56 ND 10.4 36.3 106 86.7 33.4 76.5 6.05 9.97 --- --- --- --- --- 3.93 0.051 0.242 0.036 BDL BDL BDL BDL BDL 4.13
Empr, VA- 8/14Cann Eff 1.04% 10,233 0.728% 3,067 7,000 78 4.06 5.76 1.83 11.2 47.3 113 41.5 51.9 85.9 12.5 17.4 90.4 BDL 15.6 BDL 41.0 2.67 BDL BDL BDL BDL BDL BDL BDL BDL 2.67
Peru, IN- 4/25Cann Eff 3.29% 32,010 1.63% 16,200 ND ND 6.53 0.435 ND 5.15 228 173 ND ND ND ND ND ND ND ND ND ND ND ND ND ND ND ND ND ND ND ND
Peru, IN- 10/3Cann Eff 3.37% 33,456 1.67% 16,867 7,000 78.0 4.07 ND 1.96 ND ND ND 205.4 109 118 BDL BDL 213 BDL BDL BDL 24.4 2.36 0.090 0.495 0.302 0.107 0.055 0.635 0.166 0.238 3.47
Empr- 6/17 Final Eff 0.176% 15.0 0.577% ND 21.0 10.5 ND ND ND ND 0.037 0.293 BDL 20.9 80.3 BDL 22.0 --- --- --- --- --- 1.44 BDL BDL BDL BDL BDL BDL BDL BDL 1.44
Empr, VA- 8/14Final Eff 0.638% 4.92 0.529% 83.3% 32.5 30.5 ND ND ND ND ND ND BDL 26.7 92.9 BDL 28.9 100 BDL 47.7 9.75 BDL 0.123 BDL BDL BDL BDL BDL BDL BDL BDL 0.12
Peru, IN- 4/25Final Eff ND ND ND ND ND ND ND ND ND ND 0.576 1.02 ND ND ND ND ND ND ND ND ND ND ND ND ND ND ND ND ND ND ND ND
Peru, IN- 10/3Final Eff 0.506% 6.13 0.463% 53.3% 63.0 62.0 ND ND ND ND ND ND BDL 10.7 135 32.7 61.9 268 BDL 0.68 83.5 BDL 2.35 0.352 BDL 0.378 0.171 0.207 0.691 0.237 0.354 3.63
Notes: The red data points indicate TSS/VSS
Tmt Plant- Date
Smpl Lctn

D3
Table D2- Cambi Data Summary
Biopolymer Soluble Cations Soluble Anions Volatile Fatty Acids
Tmt Plant- Date
Smpl Lctn
TSS\TS
VSS\VS
TCOD\
CCODSCOD
Polysac
Lowery
Bradford
Humic
Tot Fe
Tot AlNH
4 +
(total)K + Na +
Mg 2+
Ca 2+Cl -
NO2 -
NO3 -
SO4 2-
PO4 3-
Acetic
Proprionic
Isobutyric
Butyric
Isovaleric
Valeric
Isocaproic
Hexanoic
Heptanoic
Total VFA
Tmt Plant- Date
Smpl Lctn % mg/L % mg/L mg/L mg/L mg/L mg/L mg/L mg/L mg/L mg/L mg/L mg/L mg/L mg/L mg/L mg/L mg/L mg/L mg/L mg/L mg/L mg/L mg/L mg/L mg/L mg/L mg/L mg/L mg/L
mg/L as
Hac
Nstvd- 5/10Raw Inf 5.81% 229 3.73% 75.5 ND ND ND ND ND ND 1.49 3.85 ND ND ND ND ND ND ND ND ND ND ND ND ND ND ND ND ND ND ND ND
Nstvd- 10/9Raw Inf 5.65% 351 4.18% 92.0 605 106 ND ND ND ND ND ND 13.0 7.44 61.8 10.6 40.5 108 BDL 2.37 28.0 4.51 6.16 0.55 BDL BDL BDL 3.28 3.38 5.48 7.80 16.12
Nstvd- 5/10WAS 0.64% 6,219 0.40% 2,267 ND ND 139 1,082 ND 411 382 449 ND ND ND ND ND ND ND ND ND ND ND ND ND ND ND ND ND ND ND ND
Nstvd- 10/9WAS 0.49% 6,183 0.27% 2,700 1,650 382 232 ND 7.17 ND ND ND 9.31 35.2 147 39.0 98.4 255 BDL 28.0 101 49.2 16.6 2.19 BDL BDL BDL 0.943 1.67 2.29 3.37 22.1
Nstvd- 5/10THP Inf 13.4% ND 8.63% ND ND ND 210 178 ND 292 308 312 ND ND ND ND ND ND ND ND ND ND ND ND ND ND ND ND ND ND ND ND
Nstvd- 10/9THP Inf 13.8% ND 8.38% ND 28,900 15,400 1,337 ND 201 ND ND ND 233 409 137 104 122 133 BDL 27.8 96.2 71.2 518 226 15.6 4.67 21.8 5.49 0.21 4.44 1.98 707
Nstvd- 2005THP Inf 14.0% ND 8.40% ND ND ND ND ND ND ND ND ND ND ND ND ND ND ND ND ND ND ND ND ND ND ND ND ND ND ND ND ND
Nstvd- 5/10THP Eff 2.92% 28,543 2.40% 5,105 ND ND 421 2,360 ND 1,629 246 292 ND ND ND ND ND ND ND ND ND ND ND ND ND ND ND ND ND ND ND ND
Nstvd- 10/9THP Eff 3.17% ND 2.54% ND 31,550 9,270 184 ND 340 ND ND ND 667 415 123 136 123 167 BDL 28.0 107 353 2,308 654 327 482 303 91.9 45.0 21.2 79.1 3,519
Nstvd- 2005THP Eff 8.10% ND 4.86% ND 972,025 27,375 ND ND ND ND ND ND ND ND ND ND ND ND ND ND ND ND ND ND ND ND ND ND ND ND ND ND
DCWASA THP Eff 9.86% ND 7.57% ND 161,627 ND ND ND ND ND ND ND ND ND ND ND ND ND ND ND ND ND 2,278 593 329 52 95 BDL 31.5 BDL BDL 2,985
Nstvd- 5/10Digested 4.28% 55,743 2.33% 19,048 ND ND 269 517 ND 286 248 364 ND ND ND ND ND ND ND ND ND ND ND ND ND ND ND ND ND ND ND ND
Nstvd- 10/9Digested 5.85% ND 2.85% ND 6,000 5,100 105 ND 195 ND ND ND BDL 423 111 BDL 32.6 136 BDL 27.9 BDL 119 167 BDL 15.8 BDL BDL BDL BDL 3.54 17.7 187
Nstvd- 2005Digested 5.80% ND 2.78% ND 793,713 4,338 ND ND ND ND ND ND 2.05 ND ND ND ND ND ND ND ND ND ND ND ND ND ND ND ND ND ND ND
DCWASA Digested 5.89% ND 3.20% ND 71,840 ND ND ND ND ND ND ND 2,446 ND ND ND ND 82.1 BDL BDL 1300 4.67 188 6.59 60.8 3.98 BDL 0.78 4.87 5.51 BDL 236
Nstvd- 5/10Centrate 5.81% 535 2.80% 277 ND ND 37.4 63.2 ND 175 7.88 8.69 ND ND ND ND ND ND ND ND ND ND ND ND ND ND ND ND ND ND ND ND
Nstvd- 10/9Centrate 2.43% 321 1.33% 147 3,300 1,926 ND ND ND ND ND ND 1,101 251 136 BDL 35.0 200 BDL 28.1 124 103 53.4 3.91 8.02 0.24 0.54 0.44 2.15 1.50 8.68 67.3
Nstvd- 5/10Final Eff ND ND ND ND ND ND ND ND ND ND 35.2 412 ND ND ND ND ND ND ND ND ND ND ND ND ND ND ND ND ND ND ND ND
Nstvd- 10/9Final Eff 1.05% 12.6 0.46% 7.30 45.0 31.5 ND ND ND ND ND ND BDL 20.8 138 21.8 82.6 237 BDL 7.31 58.1 11.7 4.05 BDL BDL 0.18 0.38 BDL BDL BDL 0.18 4.44
Notes: Nstvd- 2005 is average data for 2005 provided by the plant
The blue TS and VS data points for the Naestved THP effluent are va lues that do not correlate with the plant data or typica l Cambi operation
The red data points indicate TSS/VSS, CCOD or tota l ni trogen
Tmt Plant- Date
Smpl Lctn
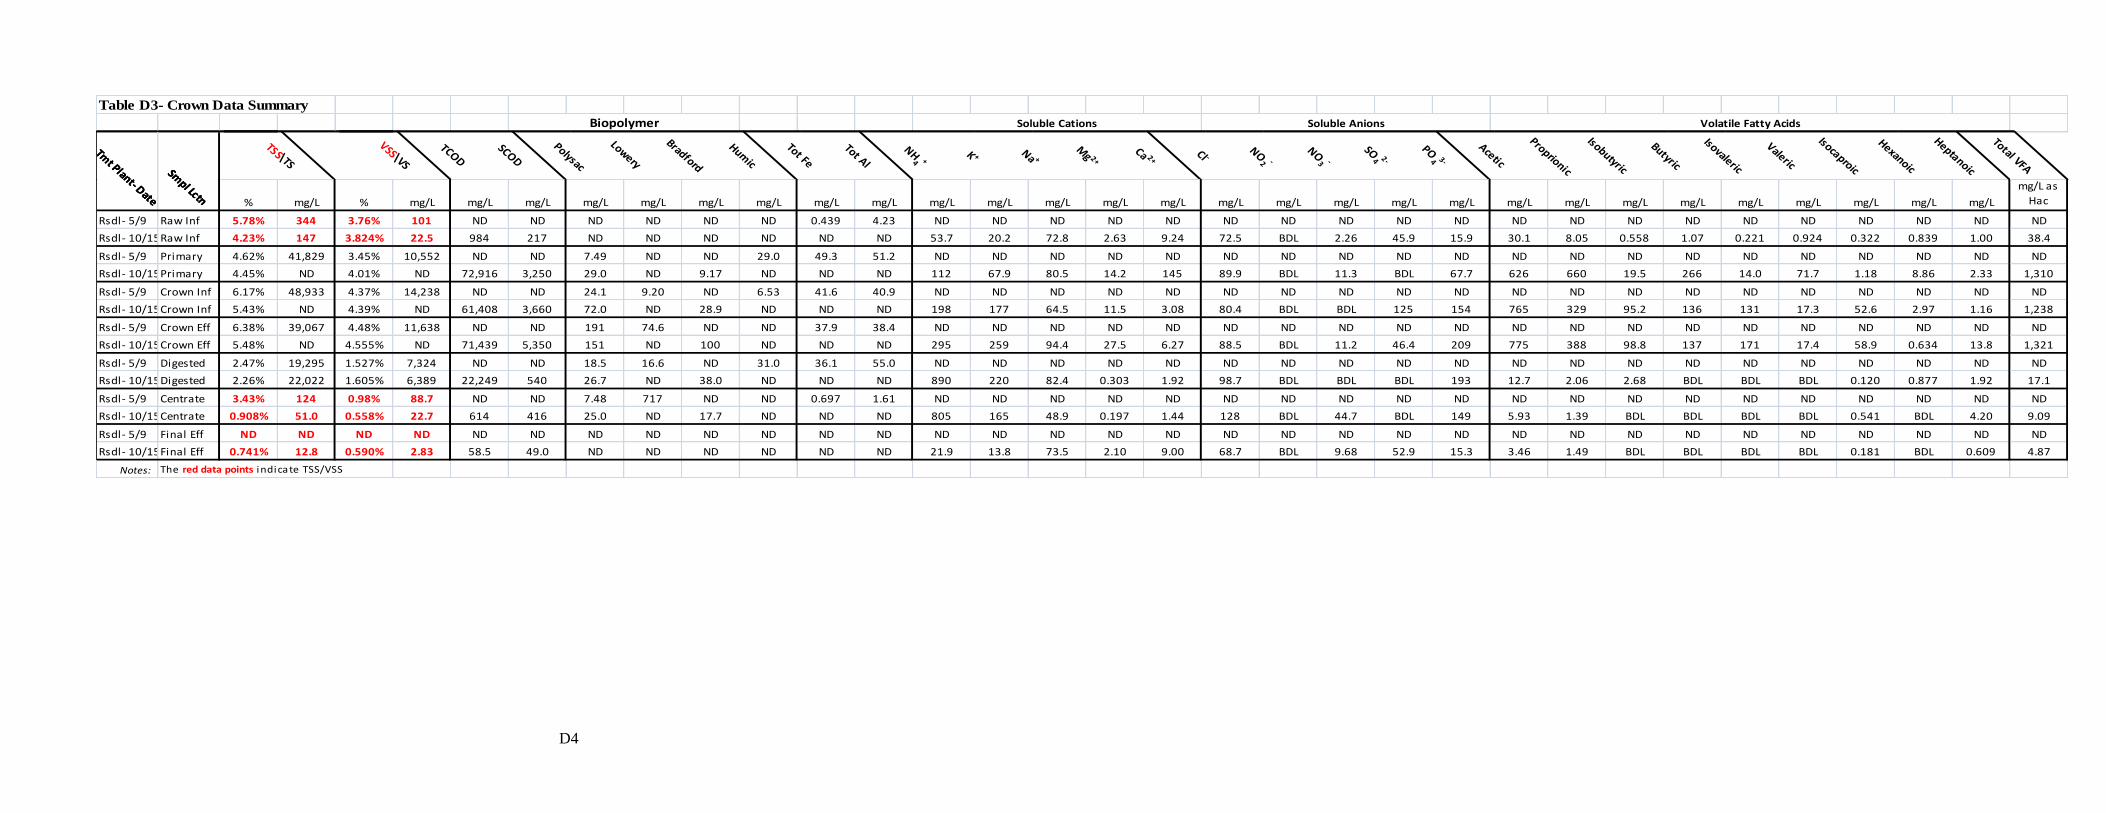
D4
Table D3- Crown Data Summary
Biopolymer Soluble Cations Soluble Anions Volatile Fatty Acids
Tmt Plant- Date
Smpl Lctn
TSS\TS
VSS\VS
TCODSCOD
Polysac
Lowery
Bradford
Humic
Tot Fe
Tot Al
NH4 +
K + Na +M
g 2+Ca 2+
Cl -NO
2 -
NO3 -
SO4 2-
PO4 3-
Acetic
Proprionic
Isobutyric
Butyric
Isovaleric
Valeric
Isocaproic
Hexanoic
Heptanoic
Total VFA
Tmt Plant- Date
Smpl Lctn % mg/L % mg/L mg/L mg/L mg/L mg/L mg/L mg/L mg/L mg/L mg/L mg/L mg/L mg/L mg/L mg/L mg/L mg/L mg/L mg/L mg/L mg/L mg/L mg/L mg/L mg/L mg/L mg/L mg/L
mg/L as
Hac
Rsdl- 5/9 Raw Inf 5.78% 344 3.76% 101 ND ND ND ND ND ND 0.439 4.23 ND ND ND ND ND ND ND ND ND ND ND ND ND ND ND ND ND ND ND ND
Rsdl- 10/15Raw Inf 4.23% 147 3.824% 22.5 984 217 ND ND ND ND ND ND 53.7 20.2 72.8 2.63 9.24 72.5 BDL 2.26 45.9 15.9 30.1 8.05 0.558 1.07 0.221 0.924 0.322 0.839 1.00 38.4
Rsdl- 5/9 Primary 4.62% 41,829 3.45% 10,552 ND ND 7.49 ND ND 29.0 49.3 51.2 ND ND ND ND ND ND ND ND ND ND ND ND ND ND ND ND ND ND ND ND
Rsdl- 10/15Primary 4.45% ND 4.01% ND 72,916 3,250 29.0 ND 9.17 ND ND ND 112 67.9 80.5 14.2 145 89.9 BDL 11.3 BDL 67.7 626 660 19.5 266 14.0 71.7 1.18 8.86 2.33 1,310
Rsdl- 5/9 Crown Inf 6.17% 48,933 4.37% 14,238 ND ND 24.1 9.20 ND 6.53 41.6 40.9 ND ND ND ND ND ND ND ND ND ND ND ND ND ND ND ND ND ND ND ND
Rsdl- 10/15Crown Inf 5.43% ND 4.39% ND 61,408 3,660 72.0 ND 28.9 ND ND ND 198 177 64.5 11.5 3.08 80.4 BDL BDL 125 154 765 329 95.2 136 131 17.3 52.6 2.97 1.16 1,238
Rsdl- 5/9 Crown Eff 6.38% 39,067 4.48% 11,638 ND ND 191 74.6 ND ND 37.9 38.4 ND ND ND ND ND ND ND ND ND ND ND ND ND ND ND ND ND ND ND ND
Rsdl- 10/15Crown Eff 5.48% ND 4.555% ND 71,439 5,350 151 ND 100 ND ND ND 295 259 94.4 27.5 6.27 88.5 BDL 11.2 46.4 209 775 388 98.8 137 171 17.4 58.9 0.634 13.8 1,321
Rsdl- 5/9 Digested 2.47% 19,295 1.527% 7,324 ND ND 18.5 16.6 ND 31.0 36.1 55.0 ND ND ND ND ND ND ND ND ND ND ND ND ND ND ND ND ND ND ND ND
Rsdl- 10/15Digested 2.26% 22,022 1.605% 6,389 22,249 540 26.7 ND 38.0 ND ND ND 890 220 82.4 0.303 1.92 98.7 BDL BDL BDL 193 12.7 2.06 2.68 BDL BDL BDL 0.120 0.877 1.92 17.1
Rsdl- 5/9 Centrate 3.43% 124 0.98% 88.7 ND ND 7.48 717 ND ND 0.697 1.61 ND ND ND ND ND ND ND ND ND ND ND ND ND ND ND ND ND ND ND ND
Rsdl- 10/15Centrate 0.908% 51.0 0.558% 22.7 614 416 25.0 ND 17.7 ND ND ND 805 165 48.9 0.197 1.44 128 BDL 44.7 BDL 149 5.93 1.39 BDL BDL BDL BDL 0.541 BDL 4.20 9.09
Rsdl- 5/9 Final Eff ND ND ND ND ND ND ND ND ND ND ND ND ND ND ND ND ND ND ND ND ND ND ND ND ND ND ND ND ND ND ND ND
Rsdl- 10/15Final Eff 0.741% 12.8 0.590% 2.83 58.5 49.0 ND ND ND ND ND ND 21.9 13.8 73.5 2.10 9.00 68.7 BDL 9.68 52.9 15.3 3.46 1.49 BDL BDL BDL BDL 0.181 BDL 0.609 4.87
Notes: The red data points indicate TSS/VSS
Tmt Plant- Date
Smpl Lctn