Embed Size (px)
Citation preview
AN INVESTIGATION INTO THE IMPACT OF
CULTURE ON CONSTRUCTION PROJECT
PERFORMANCE
by
Nii Amponsah Ankrah
A thesis submitted in partial fulfilment of the requirements of the University
of Wolverhampton for the degree of Doctor of Philosophy (PhD)
June 2007
This work or any part thereof has not previously been submitted in any form to the
University or to any other body whether for the purpose of assessment, publication or
for any other purpose. Save for any express acknowledgements, references and/or
bibliographies cited in the work, I confirm that the intellectual content of the work is
the result of my own efforts and no other person.
The right of Nii Amponsah Ankrah to be identified as author of this work is asserted
in accordance with ss. 77 and 78 of Copyright, Designs and Patents Act 1988. At
this date copyright is owned by the author.
Signature……………………………………
Date………………………………………….
31 August 2007

ii
Abstract
For many years, government backed reports have continued to deplore the poor performance of the construction industry with many projects failing to exceed or live up to the expectations of clients. There is a common belief that the culture of the construction industry is one of the factors that has an impact on its performance. The culture of the construction industry at the project level is often associated with such attributes as fragmentation, antagonism, mistrust, poor communication, short-term mentality, blame culture, casual approaches to recruitment, machismo and sexism. These attributes are in turn associated with project outcomes like litigation, poor health and safety performance, and inferior quality. Whilst such associations are helpful to the extent that they focus attention on the failings of the industry, and point to aspects that need to be improved, they are arbitrary and often based on no more than anecdotal evidence, and as such do not provide a systematic basis for assessing the real impact of culture on performance. This research was thus undertaken to look for empirical evidence of a relationship between cultural orientations and project performance outcomes. Adopting social cognitive theory and defining culture as the unique configuration of solutions – embodied in attitudes, behaviours and conditions – that a construction project organisation and its members adopt in dealing with problems at the project level, a quantitative research methodology was employed in investigating the culture within the project coalition, also referred to in this thesis as the construction project organisation (CPO). CPOs were profiled to determine their cultural orientations. Several project performance indicators were also assessed and the relationships between these performance measures and the cultural orientations were examined. Analysis revealed five principal dimensions of culture along which project organisations differ. These dimensions are workforce orientation, performance orientation, team orientation, client orientation and project orientation. With the exception of performance and client orientation, the other dimensions of culture were found to be significantly associated with project performance outcomes. These associations were modelled using multiple regression, and from these models it can be inferred inter alia that projects with higher workforce orientation have better participant satisfaction and innovation and learning outcomes. Projects with higher team orientation have better participant satisfaction and health & safety and quality outcomes. Likewise projects with higher project orientation have better health & safety and quality outcomes. Although causality cannot be assumed, these findings support the thesis that culture matters. It is therefore recommended that project participants – and in particular contractors, devote more effort and resources towards improving the orientations of their CPOs in respect of the dimensions of culture identified as having significant association with project performance outcomes, particularly workforce, team and project orientations.

iii
Dedication
This thesis is dedicated to my wife, Akosua for her love and support and to
my whole family.
iv
Acknowledgements
I am grateful to my Director of Studies, Prof. David Proverbs whose excellent
guidance, encouragement and patience has led to the successful completion
of this research.
Sincere thanks are also extended to Dr. Yaw Debrah for his encouragement
and advice in undertaking this research.
I would like to thank the School of Engineering and the Built Environment,
University of Wolverhampton for financially supporting this research. I also
acknowledge all staff of the School of Engineering and the Built Environment
and colleague researchers for their cooperation, assistance and empathy.
Further, I acknowledge the Overseas Research Students Award Scheme
(ORSAS) for their financial support in the second year of this research.
Finally, my very sincere and special thanks again to Prof. David Proverbs for
his unwavering faith in my ability to undertake this research, and for giving
me the confidence to write this thesis. I hope this thesis meets your
expectations.
v
Table of Contents
Abstract........................................................................................................................ ii
Dedication ..................................................................................................................iii
Acknowledgements .................................................................................................. iv
Table of Contents........................................................................................................ v
List of Figures ..........................................................................................................xiv
List of Tables ...........................................................................................................xvii
CHAPTER 1: INTRODUCTION .............................................................................. 1
1.0 INTRODUCTION ...................................................................................... 1
1.1 RESEARCH BACKGROUND .................................................................. 1
1.2 AIM AND OBJECTIVES............................................................................ 4
1.3 SCOPE OF STUDY..................................................................................... 5
1.4 METHODOLOGY ...................................................................................... 5
1.5 CONTRIBUTION TO KNOWLEDGE..................................................... 7
1.6 STRUCTURE OF THESIS.......................................................................... 8
1.7 SUMMARY ............................................................................................... 11
CHAPTER 2: THE UK CONSTRUCTION INDUSTRY AND PROJECT
PERFORMANCE...................................................................................................... 13
2.0 INTRODUCTION .................................................................................... 13
2.1 A PROFILE OF THE UK CONSTRUCTION INDUSTRY.................. 13
2.1.1 Structure and economic significance of the UK construction
industry ............................................................................................................. 16
2.2 THE CONSTRUCTION PROCESS ........................................................ 19
2.2.1 The Construction Project Organisation (CPO)............................. 20
2.2.2 The Delivery Process ....................................................................... 21
2.3 THE PERFORMANCE OF THE UK CONSTRUCTION INDUSTRY ..
..................................................................................................................... 22
2.4 FACTORS INFLUENCING PROJECT PERFORMANCE – A
REVIEW OF SOME CRITICAL SUCCESS FACTORS.................................... 26
Table of Contents
vi
2.4.1 Procurement route ........................................................................... 28
2.4.2 Contracts............................................................................................ 29
2.4.3 Variations .......................................................................................... 29
2.4.4 Project complexity............................................................................ 29
2.4.5 Segregation........................................................................................ 30
2.4.6 Management philosophies.............................................................. 31
2.4.7 Process-related issues ...................................................................... 31
2.4.8 Health and Safety policies............................................................... 31
2.4.9 Quality management policy ........................................................... 32
2.4.10 Specific company programmes...................................................... 32
2.5 A ‘SOFTER’ PERSPECTIVE.................................................................... 33
2.6 SUMMARY ............................................................................................... 35
CHAPTER 3: THE ROLE OF CULTURE IN DETERMINING
PERFORMANCE OUTCOMES.............................................................................. 37
3.0 INTRODUCTION .................................................................................... 37
3.1 CULTURE AND PERFORMANCE ....................................................... 37
3.2 THE PHENOMENON OF CULTURE .................................................. 39
3.2.1 An overview of culture.................................................................... 39
3.2.2 Theories of culture ........................................................................... 41
3.2.3 Other perspectives of culture ......................................................... 47
3.3 CULTURE IN ORGANISATIONS......................................................... 48
3.3.1 Importance of culture ...................................................................... 56
3.3.2 Composition of culture.................................................................... 58
3.3.3 Diagnosing culture........................................................................... 61
3.3.4 Implications for current research................................................... 69
3.4 CULTURE WITHIN THE CONSTRUCTION INDUSTRY ................ 72
3.5 CULTURE RESEARCH IN CONSTRUCTION – A REVIEW............ 75
3.5.1 Cross-cultural research.................................................................... 76
3.5.2 Occupational and organisational differences............................... 78
3.5.3 Other related research ..................................................................... 80
3.6 IMPLICATIONS FOR FURTHER RESEARCH.................................... 81
Table of Contents
vii
3.7 SUMMARY ............................................................................................... 83
CHAPTER 4: CULTURE AND PERFORMANCE – A CONCEPTUAL
FRAMEWORK.......................................................................................................... 85
4.0 INTRODUCTION .................................................................................... 85
4.1 CONCEPTUAL MODELS....................................................................... 85
4.2 ‘ANTECEDENTS’ .................................................................................... 87
4.2.1 Recruitment strategy and composition of the CPO .................... 88
4.2.2 Training initiatives ........................................................................... 89
4.2.3 Size and other project characteristics ............................................ 89
4.2.4 The industry characteristics............................................................ 90
4.2.5 Significant events and procurement.............................................. 90
4.2.6 Technology and primary function................................................. 92
4.2.7 Dominant group............................................................................... 92
4.2.8 Goals and objectives ........................................................................ 93
4.2.9 Macro cultures .................................................................................. 93
4.2.10 Location ............................................................................................. 94
4.2.11 Summary ........................................................................................... 94
4.3 ‘BEHAVIOURS’........................................................................................ 96
4.3.1 Leadership......................................................................................... 98
4.3.2 Client focus........................................................................................ 99
4.3.3 Process and team fragmentation.................................................. 102
4.3.4 Delivering quality .......................................................................... 102
4.3.5 Commitment to people.................................................................. 103
4.3.6 Relevance of dimensions identified............................................. 103
4.4 ‘CONSEQUENCES’ ............................................................................... 104
4.5 A CONCEPTUAL FRAMEWORK OF CULTURE AND
PERFORMANCE................................................................................................ 105
4.5.1 Measuring organisational culture – A social cognitive approach
........................................................................................................... 109
4.5.2 Measuring performance ................................................................ 111
4.6 SUMMARY ............................................................................................. 116

Table of Contents
viii
CHAPTER 5: RESEARCH METHODOLOGY ................................................... 118
5.0 INTRODUCTION .................................................................................. 118
5.1 INVESTIGATING THE RELATIONSHIP BETWEEN CULTURE
AND PERFORMANCE – THE RESEARCH PARADIGM........................... 118
5.2 THE QUALITATIVE PHASE ............................................................... 121
5.2.1 Interviews........................................................................................ 123
5.2.2 Implications for conceptual model .............................................. 131
5.3 THE QUANTITATIVE PHASE............................................................ 131
5.3.1 ‘Desk research’................................................................................ 131
5.3.2 Experimentation ............................................................................. 132
5.3.3 Survey research .............................................................................. 132
5.4 PILOT SURVEY ...................................................................................... 138
5.4.1 Respondent characteristics ........................................................... 139
5.4.2 Impact of analysis on questionnaire development for main
survey ........................................................................................................... 140
5.5 SAMPLING FOR MAIN SURVEY....................................................... 141
5.6 THE MAIN SURVEY ............................................................................. 143
5.6.1 Response rate .................................................................................. 144
5.6.2 Margin of error ............................................................................... 145
5.6.3 Respondent profile......................................................................... 145
5.6.4 Data editing..................................................................................... 146
5.6.5 Sample splitting.............................................................................. 147
5.7 SUMMARY ............................................................................................. 148
CHAPTER 6: PROJECT CHARACTERISTICS AND THE CULTURE OF THE
CONSTRUCTION PROJECT ORGANISATION............................................... 150
6.0 INTRODUCTION .................................................................................. 150
6.1 STATISTICAL PROCEDURES AND ANALYSES ............................ 150
6.2 PROJECT CHARACTERISTICS........................................................... 153
6.2.1 Project type...................................................................................... 154
6.2.2 Complexity...................................................................................... 155
6.2.3 Location ........................................................................................... 155

Table of Contents
ix
6.2.4 Procurement.................................................................................... 156
6.2.5 Contract price.................................................................................. 157
6.2.6 Contract duration ........................................................................... 158
6.2.7 Average number of workers on site ............................................ 158
6.2.8 Previous work with client ............................................................. 159
6.2.9 Involvement in design................................................................... 160
6.2.10 Influence of participants................................................................ 160
6.2.11 The performance ethos .................................................................. 161
6.3 SUMMARY OF PROJECT CHARACTERISTICS .............................. 163
6.4 AN ANALYSIS OF THE RELATIONSHIPS BETWEEN PROJECT
CHARACTERISTICS ......................................................................................... 164
6.5 DIAGNOSING THE CULTURE OF CPOs ......................................... 165
6.5.1 Index construction.......................................................................... 166
6.5.2 Index scoring................................................................................... 166
6.5.3 A profile of the general cultural orientation of CPOs............... 167
6.6 IDENTIFYING THE UNDERLYING FACTORS............................... 173
6.6.1 Workforce orientation ................................................................... 178
6.6.2 Performance orientation................................................................ 179
6.6.3 Team orientation ............................................................................ 180
6.6.4 Client orientation............................................................................ 181
6.6.5 Project orientation .......................................................................... 182
6.7 TYPOLOGIES OF PROJECT CULTURE............................................. 183
6.7.1 The five-cluster solution................................................................ 186
6.7.2 Profiles of the clusters.................................................................... 188
6.7.3 Implications for project management and performance .......... 189
6.8 PROJECT-DEPENDENT FACTORS AND THE CULTURE OF CPOs
................................................................................................................... 191
6.8.1 The effect of project characteristics.............................................. 192
6.8.2 The effect of dominant participants............................................. 193
6.8.3 The effect of procurement ............................................................. 193
6.8.4 The effect of project objectives ..................................................... 194
Table of Contents
x
6.8.5 The effect of location...................................................................... 195
6.8.6 The effect of other factors.............................................................. 195
6.8.7 Discussion of the effects of project-dependent factors ............. 196
6.9 SUMMARY ............................................................................................. 200
CHAPTER 7: PROJECT PERFORMANCE OUTCOMES ................................. 202
7.0 INTRODUCTION .................................................................................. 202
7.1 STATISTICAL PROCEDURES AND ANALYSES ............................ 202
7.2 AN EVALUATION OF PERFORMANCE OUTCOMES ................. 204
7.2.1 Cost performance (CP) .................................................................. 204
7.2.2 Time performance (TP).................................................................. 208
7.2.3 Quality performance (QP)............................................................. 212
7.2.4 Health and safety (H&S) ............................................................... 214
7.2.5 Client satisfaction with service..................................................... 215
7.2.6 Satisfaction of operatives .............................................................. 216
7.2.7 Collaborative working................................................................... 217
7.2.8 Productivity .................................................................................... 219
7.2.9 Other performance measures ....................................................... 221
7.3 IDENTIFYING THE PRINCIPAL PERFORMANCE MEASURES . 223
7.3.1 Satisfaction of participants............................................................ 226
7.3.2 H&S and quality outcomes........................................................... 227
7.3.3 Innovation and learning................................................................ 228
7.3.4 Time and cost outcomes................................................................ 229
7.4 EXAMINING PERFORMANCE DIFFERENCES ACROSS
PROJECTS ........................................................................................................... 230
7.5 SUMMARY ............................................................................................. 233
CHAPTER 8: THE CULTURE OF THE CONSTRUCTION PROJECT
ORGANISATION AND PROJECT PERFORMANCE...................................... 235
8.0 INTRODUCTION .................................................................................. 235
8.1 THE RESEARCH HYPOTHESIS AND STATISTICAL ANALYSIS235
8.1.1 Correlation ...................................................................................... 236
8.1.2 Multiple regression ........................................................................ 237
Table of Contents
xi
8.2 THE CULTURE – PERFORMANCE CORRELATION..................... 242
8.3 MODELLING THE RELATIONSHIP BETWEEN CULTURE AND
PERFORMANCE................................................................................................ 244
8.3.1 Culture and participant satisfaction outcomes.......................... 245
8.3.2 Culture and H&S and quality outcomes .................................... 250
8.3.3 Culture and innovation and learning outcomes........................ 255
8.3.4 Culture and time and cost outcomes........................................... 260
8.3.5 Culture and overall performance ................................................ 261
8.4 VALIDATION OF MODELS ................................................................ 265
8.5 DISCUSSION .......................................................................................... 267
8.6 SUMMARY ............................................................................................. 276
CHAPTER 9: RESEARCH VALIDATION.......................................................... 278
9.0 INTRODUCTION .................................................................................. 278
9.1 THE RESEARCH PROCESS AND VALIDITY .................................. 278
9.2 EXTERNAL VALIDATION.................................................................. 279
9.2.1 Replication....................................................................................... 279
9.2.2 Convergence analysis .................................................................... 280
9.2.3 Boundary search............................................................................. 289
9.3 INTERNAL VALIDATION .................................................................. 289
9.3.1 Convergence of research findings and published research ..... 290
9.3.2 Convergence of research findings and academic validation ... 293
9.3.3 Convergence of published research and academic validation 294
9.4 SUMMARY ............................................................................................. 295
CHAPTER 10: CONCLUSIONS AND RECOMMENDATIONS .................... 297
10.0 INTRODUCTION .................................................................................. 297
10.1 SUMMARY OF THE RESEARCH ....................................................... 297
10.1.1 The UK construction industry and the performance deficit .... 298
10.1.2 The importance of culture............................................................. 298
10.1.3 A conceptual model of culture and performance...................... 299
10.1.4 A methodology for investigating culture and performance.... 300
Table of Contents
xii
10.1.5 An analysis of project characteristics and the cultural
orientations of the CPOs ............................................................................... 301
10.1.6 An appraisal of project performance........................................... 303
10.1.7 The relationship between culture and project performance.... 303
10.1.8 Validation of the research ............................................................. 304
10.2 CONCLUSIONS OF THE RESEARCH............................................... 305
10.3 CONTRIBUTION TO KNOWLEDGE................................................. 307
10.4 A REFLECTION ON THE RESEARCH.............................................. 309
10.5 LIMITATIONS........................................................................................ 311
10.6 RECOMMENDATIONS FOR INDUSTRY......................................... 312
10.7 RECOMMENDATIONS FOR FUTURE RESEARCH ....................... 314
10.8 SUMMARY ............................................................................................. 316
REFERENCES ......................................................................................................... 317
BIBLIOGRAPHY .................................................................................................... 348
Appendix A Details of publications .................................................................... 355
Appendix B Preliminary questionnaire survey ................................................. 356
Appendix C Interview schedule .......................................................................... 359
Appendix D Main questionnaire survey ............................................................ 361
Appendix E Calculation of the margin of error................................................. 370
Appendix F Missing Value Analysis................................................................... 371
Appendix G Project types covered in survey..................................................... 374
Appendix H Indexes (dimensions) of culture constructed from questionnaire
items ......................................................................................................................... 379
Appendix I Factor Analysis of cultural variables.............................................. 380
Appendix J Cluster analysis output for dimensions of culture....................... 383
Appendix K Kruskal-Wallis and Mann-Whitney ANOVA, and Bivariate
correlation results for culture and contextual factors ....................................... 385
Appendix L Correlation matrix of the performance measures ....................... 387
Appendix M Factor analysis of performance measures................................... 389
Appendix N Kruskal-Wallis and Mann-Whitney ANOVA, and Bivariate
correlation results for performance and contextual factors ............................. 391

Table of Contents
xiii
Appendix O Scatterplots of the cultural dimensions and performance
measures .................................................................................................................. 393
Appendix P Results from the analysis of the hold-back data.......................... 394
Appendix Q Summary report sent to survey respondents.............................. 399
Appendix R Results from respondent feedback................................................ 404
xiv
List of Figures
Figure 1.1 The research process [Adapted from Serpell and Rodriguez (2002)]
....................................................................................................................................... 6
Figure 1.2 Organisation of the thesis ....................................................................... 9
Figure 2.1 The composition of the construction industry [Adapted from
Pearce (2003)] ............................................................................................................ 14
Figure 2.2 Number of firms by size (3rd Quarter, 2004)..................................... 17
Figure 2.3 The process for delivering a construction project [Adapted from
Lim and Mohamed (1999)]...................................................................................... 21
Figure 2.4 Factors influencing contractor performance...................................... 28
Figure 3.1 A typology of the concepts of culture [Source: Allaire and Firsirotu
(1984)]......................................................................................................................... 43
Figure 3.2 Hofstede’s manifestations of culture [Source: Hofstede (2001)]..... 59
Figure 3.3 Schein and Hatch's models of culture................................................. 59
Figure 3.4 The cultural web [Source: Tharp (2005)] ............................................ 60
Figure 3.5 Summary of literature and implications for investigating the
culture of CPOs......................................................................................................... 71
Figure 3.6 Competing Values Framework: An example of frameworks being
used in ‘culture-in-construction’ research [Source: Quinn (1998)] ................... 79
Figure 4.1 A conceptual model of the impact of culture on performance and
satisfaction [Source: Robbins (1998)] ..................................................................... 86
Figure 4.2 A framework for conceptualising the development of the
organisational culture of a CPO............................................................................. 95
Figure 4.3 Factors influencing project performance outcomes: the role of
culture [Adapted from Ankrah et al. (2005a)] .................................................... 104
Figure 4.4 A conceptual model for investigating the influence of
organisational culture on construction project performance........................... 106
Figure 4.5 A reciprocal determinism model for the measurement of cultural
orientation ............................................................................................................... 110

List of Figures
xv
Figure 4.6 A proposed approach for choosing performance measures ......... 113
Figure 5.1 A conciliatory methodology for assessing the organisational
culture of CPOs....................................................................................................... 121
Figure 5.2 Descriptors of culture provided by inteviewees ............................. 126
Figure 5.3 Factors influencing the culture of the CPO (NVivo NUDIST output)
................................................................................................................................... 127
Figure 5.4 Dimensions of culture which are relevant from a construction
perspective as identified by interviewees (NVivo NUDIST output).............. 129
Figure 5.5 Company designation on construction project for pilot survey... 139
Figure 5.6 Company designation on construction project ............................... 145
Figure 6.1 Frequency distribution of respondents on the variable complexity
................................................................................................................................... 155
Figure 6.2 Locations of projects............................................................................ 156
Figure 6.3 Number of projects by procurement route ...................................... 156
Figure 6.4 Average number of workers on construction site........................... 159
Figure 6.5 The overall cultural profile of CPOs ................................................. 169
Figure 6.6 Scree plot showing component extraction criterion ....................... 176
Figure 6.7 Dendrogram of cultural typologies using complete linkage ........ 185
Figure 6.8 Cultural orientations of the five clusters of CPOs .......................... 186
Figure 6.9 Difference of the mean orientations of the five clusters................. 187
Figure 6.10 Mean project orientation for the different UK regions................. 195
Figure 6.11 Mean contract price for different clients ........................................ 197
Figure 7.1 Distribution of defects......................................................................... 212
Figure 7.2 Frequency distribution of absenteeism ........................................... 221
Figure 7.3 Scree plot for factor extraction........................................................... 224
Figure 7.4 Mean H&S and quality outcomes for different project types ....... 232
Figure 8.1 Histogram of standardised residuals for participant satisfaction
model ....................................................................................................................... 247
Figure 8.2 Normal P-P plot of regression standardised residual for participant
satisfaction model................................................................................................... 247

List of Figures
xvi
Figure 8.3 Scatterplot of standardised residual against predicted value for
participant satisfaction model .............................................................................. 248
Figure 8.4 Histogram of standardised residuals for H&S and quality model
................................................................................................................................... 252
Figure 8.5 Normal P-P plot of regression standardised residual for H&S and
quality model .......................................................................................................... 252
Figure 8.6 Scatterplot of standardised residual against predicted value for
H&S and quality model......................................................................................... 253
Figure 8.7 Histogram of standardised residuals for innovation and learning
model ....................................................................................................................... 257
Figure 8.8 Normal P-P plot of regression standardised residual for innovation
and learning model ................................................................................................ 258
Figure 8.9 Scatterplot of standardised residual against predicted value for
innovation and learning model............................................................................ 258
Figure 8.10 Histogram of standardised residuals for overall performance
model ....................................................................................................................... 263
Figure 8.11 Normal P-P plot of regression standardised residual for overall
performance model................................................................................................ 263
Figure 8.12 Scatterplot of standardised residual against predicted value for
overall performance model................................................................................... 264
Figure 8.13 A pictorial representation of the regression results...................... 269
Figure 9.1 A comparison of projects by sectors ................................................. 281
Figure 9.2 A comparison of projects by type of work....................................... 281
Figure 9.3 A comparison of the cultural profiles of the samples .................... 282
xvii
List of Tables
Table 2.1 Number of firms by size [Source: DTI (2005)]..................................... 17
Table 3.1 Definitions of culture and linkages to organisational and
management literature [Adapted from Allaire and Firsirotu (1984)]............... 51
Table 3.2 Dimensions of organisational culture .................................................. 64
Table 3.3 Typologies of culture .............................................................................. 67
Table 4.1 Project-dependent and project-independent determinants of culture
..................................................................................................................................... 95
Table 4.2 Dimensions associated with the Egan agenda for change .............. 100
Table 4.3 Dimensions derived from the Egan agenda for change and their
associated performance measures ....................................................................... 114
Table 5.1 Dimensions of culture identified by interviewees............................ 130
Table 5.2 Dimensions of culture and their associated performance measures
derived from literature and the interviews ........................................................ 134
Table 5.3 Main survey response rate ................................................................... 144
Table 5.4 Number of cases held back for validation purposes ........................ 148
Table 6.1 Project characteristics............................................................................ 154
Table 6.2 Contract price of projects surveyed .................................................... 158
Table 6.3 Duration of projects surveyed ............................................................. 158
Table 6.4 Previous work with client .................................................................... 159
Table 6.5 Involvement in design .......................................................................... 160
Table 6.6 Level of influence of project participants........................................... 161
Table 6.7 Friedman test on levels of influence of project participants ........... 161
Table 6.8 Priority levels for various project objectives ..................................... 162
Table 6.9 Friedman test on project priorities...................................................... 162
Table 6.10 Descriptive statistics for the dimensions of culture ....................... 168
Table 6.11 Overall level of cultural orientation.................................................. 170
Table 6.12 Tests of the suitability of the data for factor analysis..................... 174
Table 6.13 Total variance explained by extracted factors................................. 177
List of Tables
xviii
Table 6.14 Rotated component matrix................................................................. 178
Table 6.15 Kruskal-Wallis Test Statistics for differences between clusters.... 187
Table 7.1 A comparison of actual cost and contract sum ................................. 204
Table 7.2 Wilcoxon Signed Ranks Test................................................................ 204
Table 7.3 Descriptive statistics of cost performance measures........................ 205
Table 7.4 Frequency distribution of banded cost performance (CP3) ............ 206
Table 7.5 Frequency distribution of banded cost performance (CP4) ............ 206
Table 7.6 Descriptive statistics of cost satisfaction measure ............................ 207
Table 7.7 Frequency distribution of cost satisfaction measure........................ 207
Table 7.8 A comparison of actual duration and planned duration................. 209
Table 7.9 Wilcoxon Signed Ranks Test................................................................ 209
Table 7.10 Descriptive statistics of time performance measures..................... 210
Table 7.11 Frequency distribution of banded time performance (TP3).......... 210
Table 7.12 Frequency distribution of banded time performance (TP4).......... 210
Table 7.13 Descriptive statistics of time satisfaction measure ......................... 211
Table 7.14 Frequency distribution of time satisfaction measure..................... 211
Table 7.15 Delay period (weeks) .......................................................................... 213
Table 7.16 Descriptive statistics of satisfaction with quality ........................... 213
Table 7.17 Frequency distribution of satisfaction with quality ....................... 213
Table 7.18 Descriptive statistics of health and safety performance ................ 214
Table 7.19 Frequency distribution of client satisfaction with service............. 215
Table 7.20 Descriptive statistics of client satisfaction with service ................. 215
Table 7.21 Frequency distribution of employee satisfaction with facilities... 216
Table 7.22 Descriptive statistics of employee satisfaction................................ 216
Table 7.23 Frequency distribution of employee satisfaction with wages ..... 217
Table 7.24 Descriptive statistics of disputes ....................................................... 218
Table 7.25 Frequency distribution of satisfaction with harmony................... 218
Table 7.26 Descriptive statistics of satisfaction with harmony........................ 218
Table 7.27 Descriptive statistics of productivity................................................ 219
Table 7.28 Frequency distribution of productivity........................................... 220
Table 7.29 Descriptive statistics of absenteeism ................................................ 220
List of Tables
xix
Table 7.30 Descriptive statistics of learning and innovation ........................... 222
Table 7.31 Descriptive statistics of satisfaction with profitability................... 222
Table 7.32 Frequency distribution of project profitability............................... 222
Table 7.33 KMO and Bartlett's Test results......................................................... 224
Table 7.34 Total variance explained by factors extracted................................. 225
Table 7.35 Rotated Component Matrix ............................................................... 226
Table 8.1 Pearson’s product-moment correlation matrix of cultural
dimensions and performance outcomes............................................................. 243
Table 8.2 Regression analysis results for participant satisfaction ................... 245
Table 8.3 Regression analysis results for H&S and quality outcomes............ 250
Table 8.4 Regression analysis results for innovation and learning................. 256
Table 8.5 Regression analysis results for overall performance........................ 261
Table 8.6 Predictive fit of the regression models ............................................... 267
Table 9.1 A comparison of different project characteristics ............................. 282
Table 9.2 A comparison of the cultural profiles of the samples: ANOVA
results for L1 – C6................................................................................................... 283
Table 9.3 A comparison of the performance outcomes of the two samples .. 285
Table 9.4 References cited in journal and conference papers .......................... 295

1
CHAPTER 1: INTRODUCTION
1.0 INTRODUCTION
In undertaking any research, it is necessary to initially establish the need for
such a study and to clearly set out the intentions of the research. By so doing,
a point of reference is provided against which the outcomes of the research
can be assessed. This is the intention of this chapter in which the research
context is set, and the aim and objectives are defined. A brief discussion of the
scope of the research, research methodology and main contribution to
knowledge of the study is also presented followed by an outline of the way
the thesis is structured.
1.1 RESEARCH BACKGROUND
UK construction industry reports since the Simon report of 1944 have
continued to deplore the poor performance of the construction industry with
many projects failing to exceed or even live up to the expectations of clients.
As a result, performance improvement has remained a recurring theme in all
the major reports including Sir John Egan’s landmark ‘Rethinking
Construction’ report (Egan, 1998). For this improvement in project
performance to be achieved, it is essential to investigate the factors that cause
poor project performance.
Studies conducted in this field so far have focused mainly on the influence of
such factors as procurement routes, management systems and techniques,
and construction methods (e.g. Larson, 1997; Proverbs et al., 1999). Beyond
these, it has been suggested, mainly on the basis of anecdotal evidence, that
‘softer’ factors such as organisational culture also have a significant impact on
Introduction
2
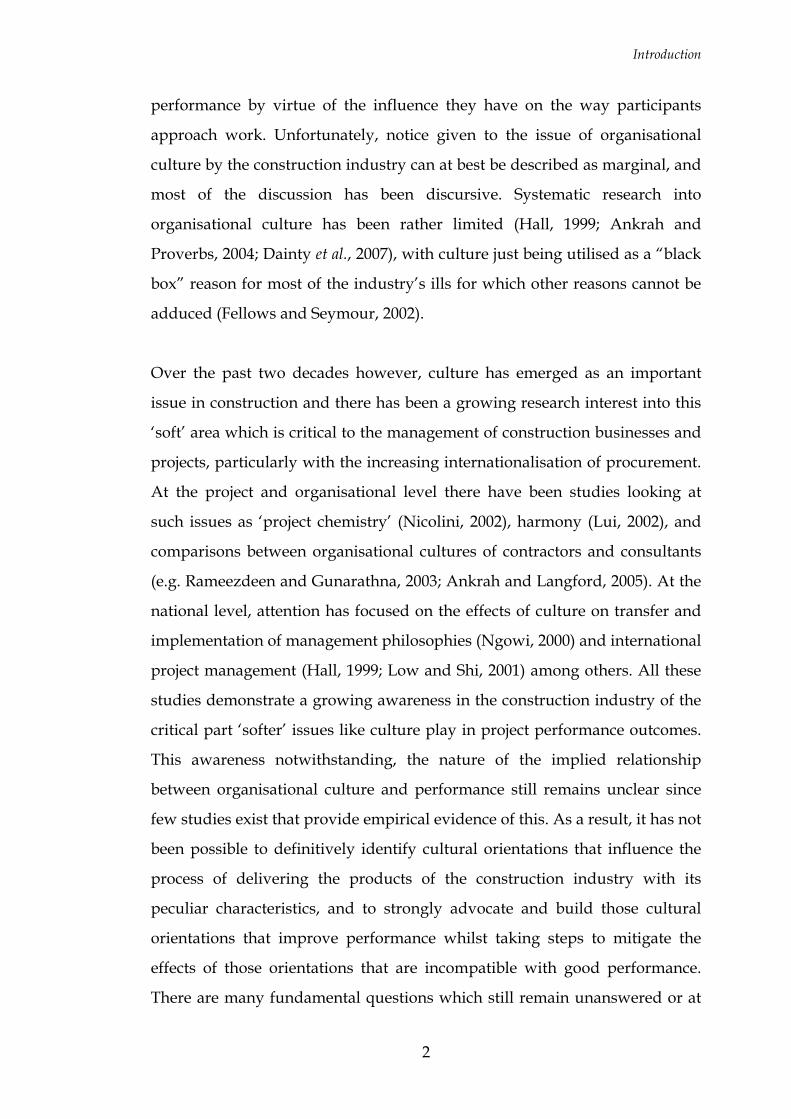
performance by virtue of the influence they have on the way participants
approach work. Unfortunately, notice given to the issue of organisational
culture by the construction industry can at best be described as marginal, and
most of the discussion has been discursive. Systematic research into
organisational culture has been rather limited (Hall, 1999; Ankrah and
Proverbs, 2004; Dainty et al., 2007), with culture just being utilised as a “black
box” reason for most of the industry’s ills for which other reasons cannot be
adduced (Fellows and Seymour, 2002).
Over the past two decades however, culture has emerged as an important
issue in construction and there has been a growing research interest into this
‘soft’ area which is critical to the management of construction businesses and
projects, particularly with the increasing internationalisation of procurement.
At the project and organisational level there have been studies looking at
such issues as ‘project chemistry’ (Nicolini, 2002), harmony (Lui, 2002), and
comparisons between organisational cultures of contractors and consultants
(e.g. Rameezdeen and Gunarathna, 2003; Ankrah and Langford, 2005). At the
national level, attention has focused on the effects of culture on transfer and
implementation of management philosophies (Ngowi, 2000) and international
project management (Hall, 1999; Low and Shi, 2001) among others. All these
studies demonstrate a growing awareness in the construction industry of the
critical part ‘softer’ issues like culture play in project performance outcomes.
This awareness notwithstanding, the nature of the implied relationship
between organisational culture and performance still remains unclear since
few studies exist that provide empirical evidence of this. As a result, it has not
been possible to definitively identify cultural orientations that influence the
process of delivering the products of the construction industry with its
peculiar characteristics, and to strongly advocate and build those cultural
orientations that improve performance whilst taking steps to mitigate the
effects of those orientations that are incompatible with good performance.
There are many fundamental questions which still remain unanswered or at
Introduction
3
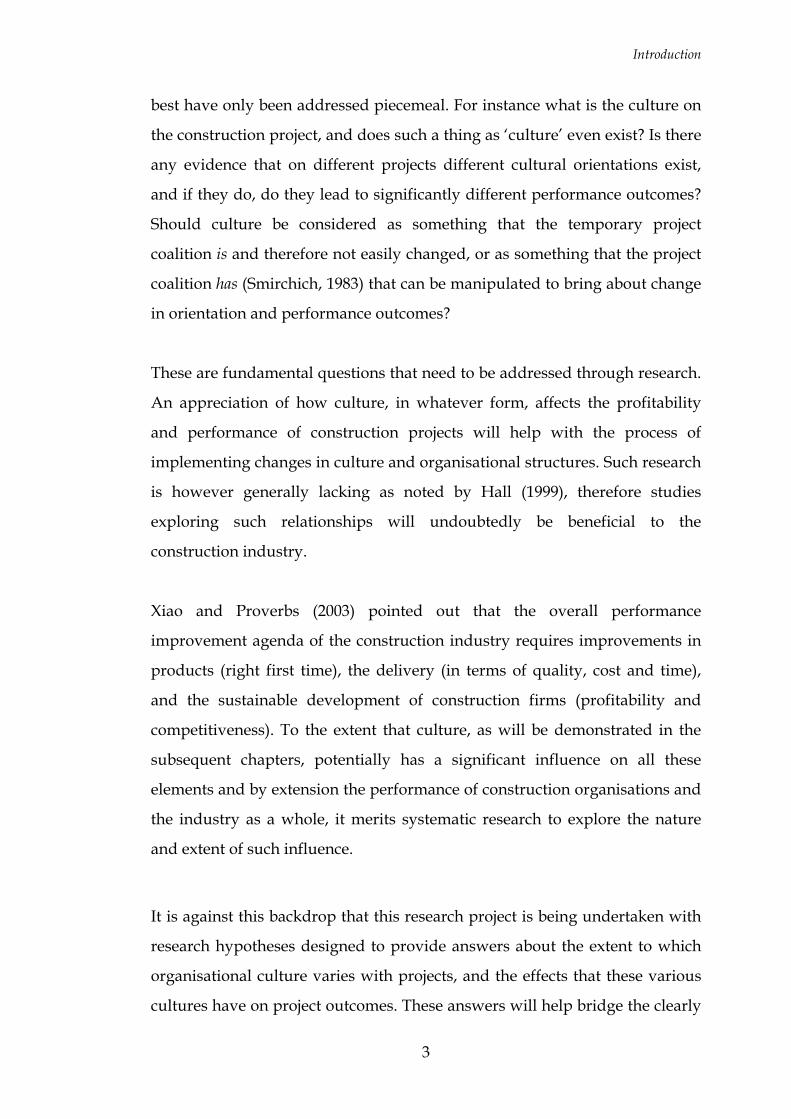
best have only been addressed piecemeal. For instance what is the culture on
the construction project, and does such a thing as ‘culture’ even exist? Is there
any evidence that on different projects different cultural orientations exist,
and if they do, do they lead to significantly different performance outcomes?
Should culture be considered as something that the temporary project
coalition is and therefore not easily changed, or as something that the project
coalition has (Smirchich, 1983) that can be manipulated to bring about change
in orientation and performance outcomes?
These are fundamental questions that need to be addressed through research.
An appreciation of how culture, in whatever form, affects the profitability
and performance of construction projects will help with the process of
implementing changes in culture and organisational structures. Such research
is however generally lacking as noted by Hall (1999), therefore studies
exploring such relationships will undoubtedly be beneficial to the
construction industry.
Xiao and Proverbs (2003) pointed out that the overall performance
improvement agenda of the construction industry requires improvements in
products (right first time), the delivery (in terms of quality, cost and time),
and the sustainable development of construction firms (profitability and
competitiveness). To the extent that culture, as will be demonstrated in the
subsequent chapters, potentially has a significant influence on all these
elements and by extension the performance of construction organisations and
the industry as a whole, it merits systematic research to explore the nature
and extent of such influence.
It is against this backdrop that this research project is being undertaken with
research hypotheses designed to provide answers about the extent to which
organisational culture varies with projects, and the effects that these various
cultures have on project outcomes. These answers will help bridge the clearly
Introduction
4
identified gaps in knowledge that have informed this investigation, relating
for instance to the existence or otherwise of differences in cultural
orientations on construction projects, and if the existence of such differences
lead to significantly different performance outcomes. Such an empirical study
of the relationship between organisational culture and project performance
will provide a significant contribution to the body of knowledge on culture in
construction and project performance.
1.2 AIM AND OBJECTIVES
The principal aim of this research is to determine empirically the extent to
which organisational culture influences construction project performance and
the nature of this influence, and to develop a model (or models) that will
assist construction project organisations to assess, in terms of performance,
the possible outcomes of their cultural orientation.
To achieve this, the study would seek to:
1. Critically review literature on performance to develop an
understanding of the factors influencing project performance and the
role of culture;
2. Trace the definition and evolution of the construct of ‘culture’ with
particular emphasis on organisational culture;
3. Develop a conceptual model of the relationship between organisational
culture and performance;
4. Develop an instrument for measuring and diagnosing the
organisational cultures of project organisations, and also for measuring
the performance of project organisations;
5. Assess project organisations to establish their specific cultural
orientations and levels of performance;
Introduction
5
6. Explore empirically the possible relationships between each specific
cultural attribute and the performance of the project organisations; and
7. Develop a model (or models) that relates organisational culture with
performance and helps identify cultural attributes that are significantly
associated with an improved construction project performance.
1.3 SCOPE OF STUDY
In pursuing this research the focus of attention is on the temporary project
coalition engaged to deliver a construction project and the construction
project itself. The construction project is thus the unit of analysis. Thus the
research covers both private and public sector work, civil engineering and
building projects, as well as the different types of facilities (e.g. commercial or
educational). The study focuses on construction projects within and across
the UK to ensure that potential variations due to the national context are
controlled for and kept uniform as much as possible, and to ensure that
findings reflect the general trend across the UK.
1.4 METHODOLOGY
The research methodology for this study is to a large extent positivist
(quantitative), which implies that the research process is largely deductive.
Within this general positivist framework, elements of the phenomenological
(qualitative) approach are also incorporated to provide alternative insight
into the phenomenon of culture from a practitioner perspective. Starting with
basic observations and theoretical insights derived from literature, conceptual
models and research hypotheses are developed and tested with the progress
of the research. Research methods applied include a literature survey, with
the primary data collected through interviews and questionnaire surveys.
Introduction
6
The study commences with an in-depth literature review focusing on the
areas of performance, organisational culture and its measurement, and the
performance criteria and measurement frameworks for construction projects
in the UK. This forms the basis for the development of a conceptual model of
the relationship between culture and performance. This framework is refined
by in-depth semi-structured interviews, and followed by a UK-wide
questionnaire survey of contractors and other project management personnel
to collect data on specific cultural attributes and performance.
Data analysis is undertaken using descriptive statistics at the preliminary
stages to provide useful insights, with more detailed analysis done using
factor analysis, ANOVA, correlation analysis, and other statistical tests of
significance. Appropriate statistical analysis software are employed, where
necessary, to aid analysis. Using a suitable modelling technique in the form of
multiple regression analysis, comprehensive model(s) depicting the nature
and extent to which organisational culture influences construction project
performance are developed. These models then form the basis for identifying
cultural attributes suited to the peculiar nature of construction projects.
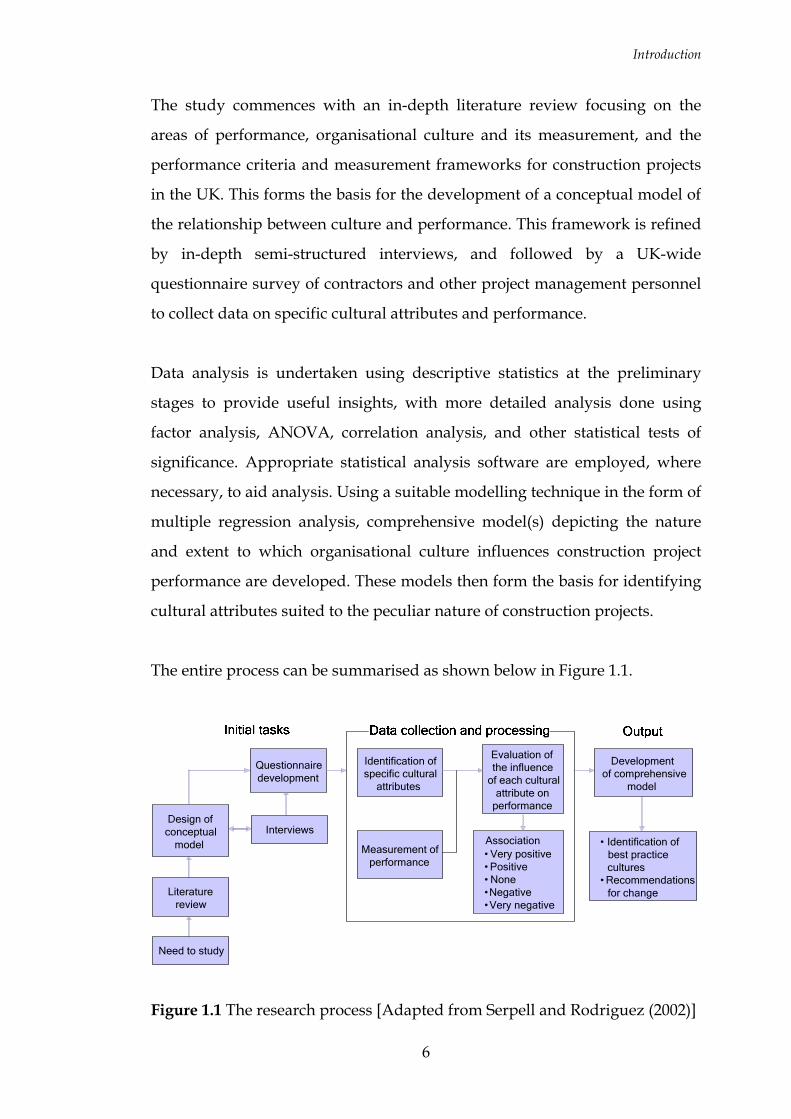
The entire process can be summarised as shown below in Figure 1.1.
Questionnaire development
Design of conceptual
model
Developmentof comprehensive
model
• Identification of best practicecultures
• Recommendationsfor change
Identification of specific cultural
attributes
Measurement of performance
Evaluation of the influence
of each cultural attribute on
performance
Association• Very positive• Positive• None•Negative•Very negative
Interviews
Literaturereview
Need to study
Figure 1.1 The research process [Adapted from Serpell and Rodriguez (2002)]
Introduction
7
1.5 CONTRIBUTION TO KNOWLEDGE
Building on the existing knowledge on organisational culture, this research
has provided greater insight into organisational culture within a construction
project context, in particular providing empirical evidence that different
project teams have different cultural orientations and that these different
cultural orientations are associated with different levels of performance. It has
also demonstrated that workforce, team and project orientations are the
specific dimensions of culture which have the most association with project
performance outcomes and as such are the dimensions that require the
attention and resources of the organisations involved in the project. Four (4)
statistical models have also been developed to represent the relationships
between the cultural orientations and performance outcomes, and though
their predictive utility is limited, these models do provide some guidance on
the likely project performance outcomes given a specific cultural orientation.
This implies that project teams can undertake an assessment of their cultural
orientations and based on that, forecast the probable project performance.
Where necessary, action can then be taken to improve the cultural orientation.
By empirically associating various cultural orientations with project
performance outcomes, this research has provided evidence that culture does
matter in the quest for performance improvement on construction projects.
The findings can thus be used as a basis for recommending or encouraging
cultural change in construction organisations. It can also be used as a basis for
encouraging researchers of project performance to devote more attention to
the ‘softer’ aspects such as culture.
Beyond the direct output of the research discussed above, the research has
also made significant contribution by moving the discussion of organisational
culture within the construction research context from the traditional ‘black
box’ approach towards more empirically grounded discourse.
Introduction
8
As a result of the research undertaken, ten (10) technical papers have been
published (or will soon be) in refereed international construction journals and
conference proceedings. Full bibliographic details are provided in Appendix
A. Several more are under development.
1.6 STRUCTURE OF THESIS
The thesis consists of ten (10) chapters, organised as shown in Figure 1.2.
Chapter 1 outlines the context within which the research is undertaken, and
sets out the aim and objectives. The scope and the research methodology
applied are also briefly outlined, and then the main contributions of the
research to knowledge are presented.
Chapter 2 presents a review of the literature focusing on the structure and
profile of the UK construction industry, the project delivery process, the
performance of the UK construction industry, and the factors influencing
performance. In particular, this chapter seeks to highlight the performance
deficit that still exists in the UK construction industry, and the lack of
emphasis and research on the role of ‘softer’ factors like the culture within the
project organisation, on the quest for performance improvement.
Chapter 3 continues the review of literature but focuses on the concept of
culture, the role that it plays in determining organisational outcomes, and the
theories underpinning its conceptualisation and investigation. The chapter
also interrogates literature within the construction domain on research
undertaken in this genre with the aim being to establish how it is conceived
in construction management research, the extent to which it has actually been
researched in construction, and the scope that still exists for further research.
In particular, this chapter seeks to draw attention to the paucity of empirical
research on culture and its impact on project performance.

Introduction
9
Conclusions and recommendation
Research validation
The culture of the construction project organisation (CPO) and project performance
Project performance outcomesProject characteristics and the culture of construction project organisations
(CPOs)
Research methodology
Culture and performance – A conceptual model
The role of culture in determining performance outcomes
Introduction
The UK construction industry and contractor performance
Figure 1.2 Organisation of the thesis
In order to investigate systematically this empirical relationship between
culture and performance, it is necessary to have a conceptual framework that
brings together in a logical manner all the essential aspects to be investigated,
and provides appropriate parameters and points of reference for
investigating culture within a construction project context. In Chapter 4, the

Introduction
10
discussion addresses the development of a conceptual model which is
intended to aid the identification of appropriate hypotheses, data collection
and hypotheses testing.
In Chapter 5, an outline of the research methodology adopted for
undertaking this research is presented; in this case a quantitative research
methodology, with aspects of the qualitative approach incorporated to
support and improve the research design. Arguments are presented justifying
this choice of a conciliatory approach and the specific research methods
applied to collect data. The data collection process is detailed in this chapter.
Chapter 6 presents the first part of the data analysis, with discussions
outlining the characteristics of the projects surveyed to set the context within
which the project organisations had operated. The purpose of this analysis is
to make it possible to specify the kind of projects for which the inferences
drawn from this research are applicable. The chapter also presents an analysis
of the data on the cultural orientations of these project organisations and
gives an overview of the general cultural profile of project organisations
working within the UK. Further evaluation to identify differences in the
cultural orientations of the project organisations is also presented. The
relationships between project features and the cultural orientations within the
sample are also examined, and inferences are drawn.
In order to evaluate the impact of cultural orientations on project
performance outcomes, it is necessary to assess the performance of
construction projects in the UK, where performance is the degree to which the
project objectives are achieved. The performance of the construction projects
as assessed on the basis of the various outcomes pursued by stakeholders
including inter alia cost, time, quality, health and safety, disputes, and
productivity outcomes, is discussed in Chapter 7.
Introduction
11
Chapter 8 explores the potential relationships between the operating cultures
within the project organisations and the project performance outcomes to
determine whether or not any significant associations exist. Models of the
relationships are developed and presented in this chapter to help identify
orientations that are associated with better performance outcomes.
The extent to which the findings reported in a research study can be trusted
relies on the process of validation undertaken to confirm (or disconfirm) the
findings of the research. Chapter 9 is thus devoted to the description of the
validation process that was undertaken in respect of this research, and the
conclusions drawn from the findings.
After summarising the entire research, Chapter 10 – the final chapter, outlines
the main findings of the research. A critical reflection of the entire research
process, highlighting the limitations of the research and aspects where there
is potential for improvement, is provided. The chapter concludes with some
recommendations for construction industry practitioners, and some
recommendations for future research.
1.7 SUMMARY
The performance of the construction industry has been berated consistently
over the years and a lot of effort through initiatives like the Constructing
Excellence programme and through extensive research, has been devoted
towards engendering performance improvement on construction projects.
Although there is a strong perception that ‘softer’ factors like culture also
influence performance outcomes, a lot of the discussions about this subject
have been discursive, and it is within this context that this research is being
undertaken. This chapter has set out the aim and objectives of the study. The
Introduction
12
scope and the research methodology to be applied are briefly outlined, and
then the main contributions of the research to knowledge are presented.
In line with the structure proposed for this thesis, the following chapter
presents a review of the UK construction industry, pointing out the
performance deficit, examining the factors influencing performance
outcomes, and assessing the extent to which the role of culture is recognised
in the performance literature.
13
CHAPTER 2: THE UK CONSTRUCTION INDUSTRY AND PROJECT PERFORMANCE
2.0 INTRODUCTION
The construction industry is significant in its contribution to the UK
economy. The industry as a whole (together with all its associated services)
contributes up to 10% of Gross Domestic Product (GDP)1 (Pearce, 2003). This
implies that its performance in delivering its products and services is
important. In this chapter, the UK construction industry is profiled to assess
its structure and performance. Various factors impacting on its performance
as per the literature are also reviewed in a bid to establish whether or not the
role of organisational culture in determining performance outcomes has been
captured in project performance research. This review thus addresses the first
key objective of this research which was to critically review literature on
performance to develop an understanding of the factors influencing project
performance.
2.1 A PROFILE OF THE UK CONSTRUCTION INDUSTRY
The UK construction industry is concerned primarily with the planning,
regulation, design, manufacture, construction and maintenance of buildings
and other structures (Harvey and Ashworth, 1997; ONS, 2002). In terms of
size and structure, the industry can be viewed as having a narrow and a
broad definition (Pearce, 2003). As shown in Figure 2.1 below, the narrow
definition focuses attention on the actual on-site construction activities of 1 Gross Domestic Product (GDP) - Sum of all value added across all sectors in the economy
(ONS, 2006).

The construction industry and project performance
14
contractors whilst the broad definition, which actually covers the true extent
of the construction industry, draws in the quarrying of construction raw
materials, manufacture of building materials, the sale of construction
products, and the services provided by the various associated professionals
(Pearce, 2003).
Figure 2.1 The composition of the construction industry [Adapted from
Pearce (2003)]
Irrespective of the definition or where the emphasis is placed, the main aim of
the construction industry is to deliver and maintain the built environment.
The built environment comprises housing, educational, industrial,
commercial, and infrastructure facilities. Infrastructure is a generic term
covering the provision of electricity, communications, water, sewerage, gas,
air, railways, harbours, roads and the like (ONS, 2002). This definition of
construction is based on the Department of Trade & Industry classifications
(DTI, 2005), and also on the definition of the construction industry as per the
Standard Industrial Classification (SIC) 45 category of the Office for National
Statistics (ONS, 2002).
All these facilities may be either public work procured by a public authority
such as government departments, public utilities, nationalised industries,
On-site assembly: buildings & infrastructure
(contractors)
On-site assembly by non-contractors
Manufacture of products, materials & assemblies
Quarrying of construction materials
Professional services
THE BUILT ENVIRONMENT
Sale of products, materials & assemblies
The construction industry and project performance
15
universities, the Post Office, new town corporations, and housing
associations, or private work procured by a private owner or organisation or
by a private developer. Such private work includes work carried out by firms
on their own initiative or where the private sector carries the majority of the
risk (DTI, 2005). Work may also be classified as new work, repair and
maintenance, or additions and alterations.
The industry’s ability to deliver this built environment is
influenced/moderated by a number of characteristics peculiar to construction
including, as identified by Harvey and Ashworth (1997) and Fellows et al.
(2002), the fact that:
products have to be delivered at the client’s premises;
products tend to be physically large & expensive;
production is exposed to the elements;
usually there are no prototype models or precedents;
design is separated from construction;
there is fragmentation and extensive specialisation;
there is risk and uncertainty;
price determination is typically based on a system of bidding; and
labour is often recruited casually.
These characteristics mean that the delivery of the built environment is
project-based with the involvement of numerous participants whose
responsibilities are set out in contracts. There is also limited control over the
production environment. The risk and uncertainty associated with this
method of production and method of price determination also means that
margins are thin, uncertain and easily eroded, and considering the fact that
an individual project can often represent a large proportion of the turnover of
a participant in any year (Harvey and Ashworth, 1997; Fellows et al., 2002),
there is inevitably mistrust among the participants because everyone is
The construction industry and project performance
16
struggling to avoid making a loss, and as a result relationships are very often
adversarial.
Notwithstanding these challenges, the UK construction industry is still
economically very significant, and its contribution to the UK economy is
examined in more detail below.
2.1.1 Structure and economic significance of the UK construction industry
In examining the structure of the construction industry, various indicators
can be employed as the basis of analysis. Among these are number of firms,
output and employment. As highlighted by Pearce (2003), each of these
indicators reveals part of the story that is relevant to our understanding of the
state of the construction industry. The distinction between the broad and
narrow definitions becomes very significant when examining these
indicators.
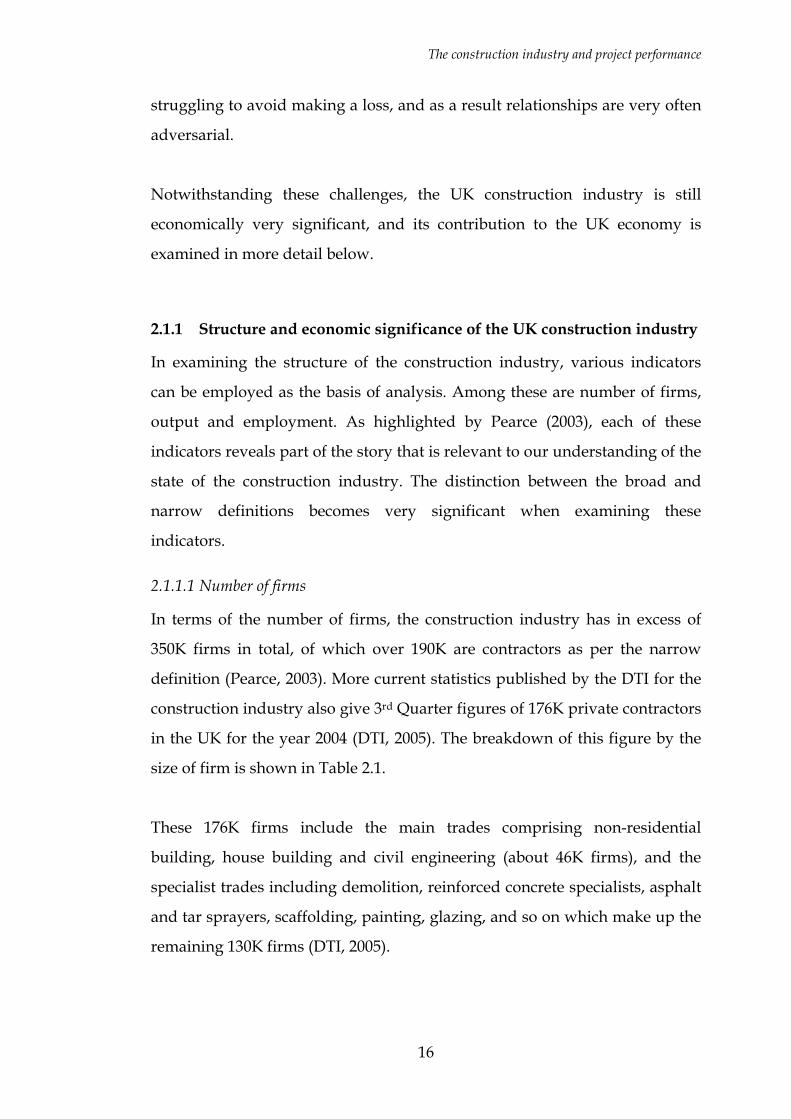
2.1.1.1 Number of firms
In terms of the number of firms, the construction industry has in excess of
350K firms in total, of which over 190K are contractors as per the narrow
definition (Pearce, 2003). More current statistics published by the DTI for the
construction industry also give 3rd Quarter figures of 176K private contractors
in the UK for the year 2004 (DTI, 2005). The breakdown of this figure by the
size of firm is shown in Table 2.1.
These 176K firms include the main trades comprising non-residential
building, house building and civil engineering (about 46K firms), and the
specialist trades including demolition, reinforced concrete specialists, asphalt
and tar sprayers, scaffolding, painting, glazing, and so on which make up the
remaining 130K firms (DTI, 2005).

The construction industry and project performance
17
Table 2.1 Number of firms by size [Source: DTI (2005)] 3rd Quarter Each Year
1995 1996 1997 1998 1999 2000 2001 2002 2003 2004
By Size of Firm
1 99,099 81,363 86,269 87,837 88,018 87,712 77,926 71,431 70,370 71,620
02-03 64,837 56,106 47,644 47,918 49,350 48,773 50,653 50,306 53,022 55,027
04-07 20,288 15,317 15,737 16,391 16,969 16,584 22,455 23,963 25,704 26,865
08-13 4,021 4,366 3,787 3,988 4,148 3,790 8,044 9,819 10,508 10,982
14-24 2,828 2,952 3,101 3,274 3,271 3,104 4,920 5,427 5,892 6,161
25-34 938 1,103 1,176 1,201 1,332 1,201 1,782 1,809 1,932 1,985
35-59 968 984 1,156 1,263 1,188 1,109 999 1,782 1,821 1,906
60-79 307 325 396 419 397 364 354 457 583 550
80-114 258 263 296 319 304 271 304 425 451 464
115-299 337 348 381 405 379 341 433 520 535 560
300-599 105 101 107 125 105 91 129 123 135 148
600-1,199 51 54 60 56 58 51 68 62 75 75
1,200 and Over 33 33 38 40 42 35 56 57 64 60
All Firms 194,070 163,315 160,148 163,236 165,561 163,426 168,123 166,181 171,092 176,403
Figure 2.2 below gives a revealing insight into the structure of the industry
where over 87% of all firms are small, employing less than 7 persons, with
almost half of these being one-person firms.
Number of firms by size (3rd Quarter, 2004)
40.60%
31.19%
15.23%
3.26%3.49%
6.23%
1
2-3
4-7
8-13
14-24
25-34
35-59
60-79
80-114
115-299
300-599
600-1,199
1,200 and Over Figure 2.2 Number of firms by size (3rd Quarter, 2004)
2.1.1.2 Output
Another useful indicator of the economic significance of construction is the
contribution to UK’s Gross Domestic Product (GDP). Pearce (2003) estimated
this to be about 5% as at 2002 for contractors (the narrow definition) and 10%
The construction industry and project performance
18
for the broader definition. Although no distinction is drawn between the
narrow and broad definitions, the DTI also gives a contribution to GDP of
about 8.2%, with value of construction output by all agencies2 for 2005 given
as £107B (DTI, 2006).
Surprisingly the 87% of contractors employing less than 7 persons account for
just over 10% of all the construction output (DTI, 2005).
As indicated previously, construction output can be classified by sector
(public or private), by type (new work or repair and maintenance) or by use
(housing or non-housing). DTI data from 1994 to 2004 (DTI, 2005) shows that
by value of work, the private sector accounts for up to 66.5% of output whilst
the public sector accounts for 33.5%. These figures are comparable to Pearce’s
(2003) estimate of 31% public sector work in UK construction industry output
and the more recent estimate of 40% public sector work by Sullivan (2006).
New work accounts for about 53% whilst repair and maintenance (R&M)
work accounts for about 47% (Fellows et al., 2002; DTI, 2005). Housing
currently constitutes about 40% of output.
2.1.1.3 Employment
As noted in a World Bank report on the wealth of nations, the output of any
nation, or in the context of this study the construction industry,
fundamentally depends on its human resources – i.e. “the skill, dexterity, and
judgment of its labour” (World Bank, 1997). Although figures vary from
source to source, it is estimated that between 1.4 – 2.0M people are employed
in the UK construction industry. Pearce (2003) estimated that as at 2001,
contractor employment was of the order of 1.7M, accounting for about 6% of
total UK employment. Ive et al. (2004)and HSE (2006) also provide more
current estimates of about 2M and 2.2M employees respectively, representing 2 Output by contractors (including estimates of unrecorded output by small firms and self-
employed workers) and output by public sector direct labour departments.
The construction industry and project performance
19
over 7% of the UK’s total labour force (Ive et al., 2004). Of this number,
women are represented by only 9% and ethnic minorities by only 2 – 3%
(CITB, 2002; DTI, 2005).
Clearly by all counts, the construction industry is highly significant in its size
and structure. This is true even when considering only the narrow definition
of the industry which is concerned with contractors and speculative
housebuilders who construct, repair and maintain buildings or engineering
works in situ. When this is juxtaposed against the fact that all other sectors
depend on the output of the construction industry to undertake their
activities, it becomes clear why good performance is required from the
construction industry in the delivery of its products.
2.2 THE CONSTRUCTION PROCESS
The construction process starts with a client realising a need for a
construction product (a constructed facility). Various participants then need
to be engaged to contribute towards the realisation of this particular facility.
Construction is thus a project-based activity (Fellows et al., 2002). According
to Turner (2006), a project is a temporary undertaking which involves the
bringing together of various resources to achieve a specific short-term
objective. Another formal definition provided by Hobday (2000) is that a
project is any activity with a defined set of resources, goals and time limit.
Newcombe (2003) defines a project as a coalition of powerful individuals and
interest groups. This coalition is necessary because of the extensive
fragmentation and specialisation within construction as pointed out earlier.
This coalition, also referred to as a supply chain must be constituted to bring
together the various specialisations, labour, capital and other resources
required for the project. Given that organisations are generally groups of
people cooperating and/or working together to achieve specific objectives
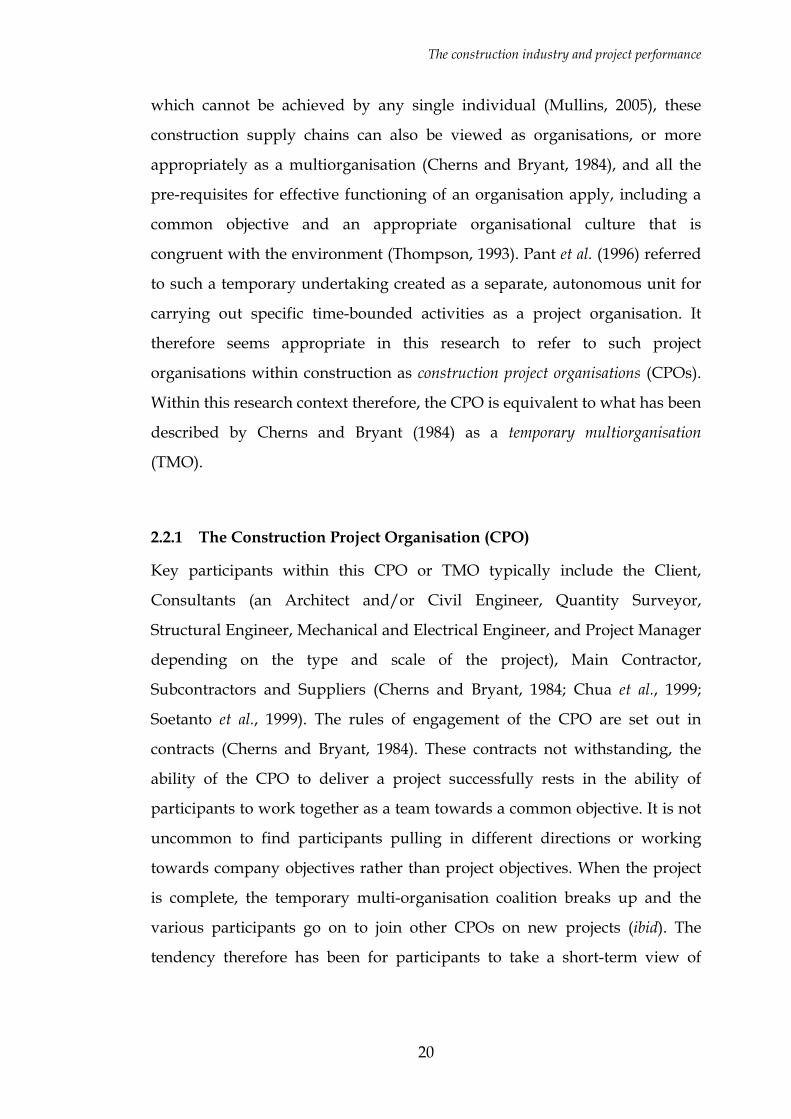
The construction industry and project performance
20
which cannot be achieved by any single individual (Mullins, 2005), these
construction supply chains can also be viewed as organisations, or more
appropriately as a multiorganisation (Cherns and Bryant, 1984), and all the
pre-requisites for effective functioning of an organisation apply, including a
common objective and an appropriate organisational culture that is
congruent with the environment (Thompson, 1993). Pant et al. (1996) referred
to such a temporary undertaking created as a separate, autonomous unit for
carrying out specific time-bounded activities as a project organisation. It
therefore seems appropriate in this research to refer to such project
organisations within construction as construction project organisations (CPOs).
Within this research context therefore, the CPO is equivalent to what has been
described by Cherns and Bryant (1984) as a temporary multiorganisation
(TMO).
2.2.1 The Construction Project Organisation (CPO)
Key participants within this CPO or TMO typically include the Client,
Consultants (an Architect and/or Civil Engineer, Quantity Surveyor,
Structural Engineer, Mechanical and Electrical Engineer, and Project Manager
depending on the type and scale of the project), Main Contractor,
Subcontractors and Suppliers (Cherns and Bryant, 1984; Chua et al., 1999;
Soetanto et al., 1999). The rules of engagement of the CPO are set out in
contracts (Cherns and Bryant, 1984). These contracts not withstanding, the
ability of the CPO to deliver a project successfully rests in the ability of
participants to work together as a team towards a common objective. It is not
uncommon to find participants pulling in different directions or working
towards company objectives rather than project objectives. When the project
is complete, the temporary multi-organisation coalition breaks up and the
various participants go on to join other CPOs on new projects (ibid). The
tendency therefore has been for participants to take a short-term view of
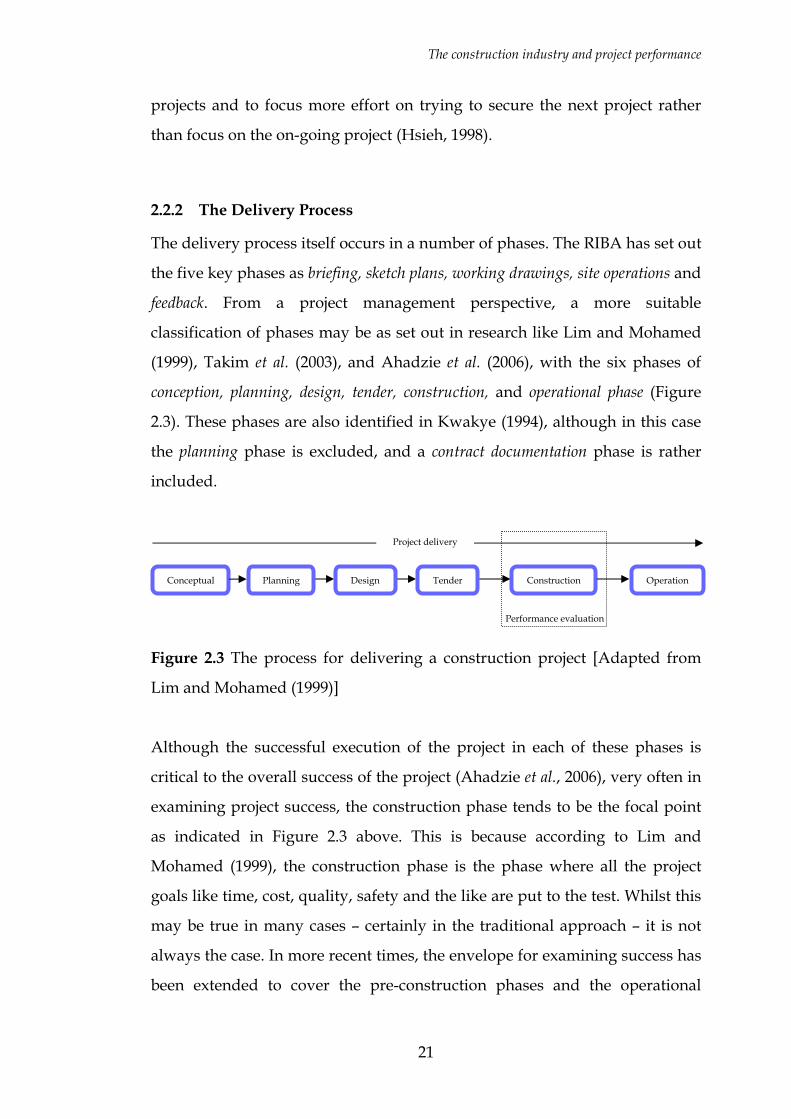
The construction industry and project performance
21
projects and to focus more effort on trying to secure the next project rather
than focus on the on-going project (Hsieh, 1998).
2.2.2 The Delivery Process
The delivery process itself occurs in a number of phases. The RIBA has set out
the five key phases as briefing, sketch plans, working drawings, site operations and
feedback. From a project management perspective, a more suitable
classification of phases may be as set out in research like Lim and Mohamed
(1999), Takim et al. (2003), and Ahadzie et al. (2006), with the six phases of
conception, planning, design, tender, construction, and operational phase (Figure
2.3). These phases are also identified in Kwakye (1994), although in this case
the planning phase is excluded, and a contract documentation phase is rather
included.
Figure 2.3 The process for delivering a construction project [Adapted from
Lim and Mohamed (1999)]
Although the successful execution of the project in each of these phases is
critical to the overall success of the project (Ahadzie et al., 2006), very often in
examining project success, the construction phase tends to be the focal point
as indicated in Figure 2.3 above. This is because according to Lim and
Mohamed (1999), the construction phase is the phase where all the project
goals like time, cost, quality, safety and the like are put to the test. Whilst this
may be true in many cases – certainly in the traditional approach – it is not
always the case. In more recent times, the envelope for examining success has
been extended to cover the pre-construction phases and the operational
Conceptual Construction Operation
Project delivery
Performance evaluation
Planning Tender Design
The construction industry and project performance
22
phases; a situation that can be attributed in part to such developments as
whole-life costing, PFI and other modern ways of approaching project
delivery. Generally however, the construction phase still remains the key
phase for examining performance outcomes as reflected in many discussions
on the performance of the construction industry.
2.3 THE PERFORMANCE OF THE UK CONSTRUCTION INDUSTRY
Performance can be considered as an evaluation of how well individuals,
groups of individuals or organisations have done in pursuit of a specific
objective (Ankrah and Proverbs, 2005). These objectives vary significantly,
but from an industry or organisational perspective, they generally revolve
around satisfying the key stakeholders notably customers, employees,
shareholders, the various suppliers, government and society as a whole.
Mullins (2005) described performance as relating to such factors as increasing
profitability, improved service delivery or obtaining the best results in
important areas of organisational activities. In construction, because of the
numerous participants who contribute towards the achievement of project
objectives, performance has been defined in one sense as a participant’s
(client, architect or contractor) contribution to the execution of the task
required to complete the project (Soetanto, 2002). Indeed most of the research
published in the construction management literature on performance in the
construction context mainly focus attention on the contractor’s role (cf. Assaf
et al., 1996; Baldry, 1996; Belassi and Tukel, 1996; Straight, 1999; Proverbs and
Faniran, 2001; Kashiwagi and Byfield, 2002; Xiao and Proverbs, 2002a; 2002b;
Costa and Formoso, 2004).
It has been argued by Ankrah et al. (2005a) that performance in this context
may also be approached from two perspectives; the first relating to the
The construction industry and project performance
23
business performance of the contractor and the second relating to the
performance on projects. The former is very rarely the subject of construction
management research and is normally assessed using financial results and
ratios, productivity figures, comprehensive self-assessment tools such as the
balanced scorecard (Kaplan and Norton, 1992), or a synthesis of some of the
existing generic self-assessment tools (Mbugua, 2000). In many cases however
as observed by Bassioni et al. (2004), references to performance (whether
contractor or construction industry performance) and research in this genre
have been focused on project performance (cf. Soetanto et al., 2002; Xiao and
Proverbs, 2003). This has been the case because the characteristics of the
industry are such that a project is often a major business endeavour
representing a major investment by the client (Hobday, 2000), and
representing a major part of a participant’s annual turnover (Fellows et al.,
2002). This implies that ultimately it is the project performance that
determines overall business performance. These characteristics make project
performance critical.
Because the client is the principal stakeholder in the construction process,
good performance has been defined typically in terms of the delivery of
projects on time, to specification and within budget, providing good service
and achieving reasonable life-cycle costs. More recently, the requirements of
the other stakeholders such as employees and society have come into focus
with the need to promote sustainable construction and corporate social
responsibility, and this is reflected in a more comprehensive set of industry
Key Performance Indicators (KPIs) of project performance covering such
issues as environmental protection and respect for people (DTI, 2004).
Although the construction industry in the UK is considered world class at it’s
best (Egan, 2002), it is also true that over the years and irrespective of the
KPIs assessed, construction projects in the UK have in the main failed to
satisfy stakeholders, and this has led to the publication of such reports as the
The construction industry and project performance
24
Rethinking Construction (Egan, 1998) and the Accelerating Change (Egan,
2002) reports, all calling for performance improvement in the industry. These
reports represent the latest manifestations of continuous end-user
dissatisfaction which according to Cain (2004) can be traced back at least 70
years. Reports on the construction industry stemming from Simon (1944)
have recounted the same industry failures time and time again.
Attempts have been made to quantify the poor performance of the
construction industry and these computations have revealed, for instance,
that unnecessary costs of construction projects exceed 30% of the capital costs
(Latham, 1994). Cain (2004) put this figure at around 42%. As of 1999, a
significant proportion of projects were late (58.4%), over budget (32.2%) and
had defects (90% - including major and minor defects). This was according to
a survey reported in CCF/CBPP (1999). When compared with more recent
reports such as Kashiwagi et al. (2006) which also stated that only 45% of
clients in the UK indicated that the costs were on target and 62% of projects
on time, it can be seen that there is still much room for improvement in
project performance.
Beyond these manifestations of poor performance, Pearce (2003) also reported
that in absolute terms from 1998/1999 to 2000/01, construction had the worst
record for the number of fatalities (33%) and major non-fatal injuries (34.4%)
in all industries, imposing a social cost of over £2 billion a year on the UK
economy. Entry into construction-related university degree programmes is
also declining (Pearce, 2003). These are all symptomatic of an industry
performing poorly.
The story of the construction industry is not just a tale of woe as there are
examples of world class projects that have been delivered by the industry.
Some examples of such projects have been identified in Reisner (2005).
However, the many high profile cases of poor performance have
The construction industry and project performance
25
overshadowed the good achievements of the industry. The well-documented
tales of the Scottish Parliament which was ten times over budget and two
years behind schedule (cf. Clark and Barrick, 2003) and the saga of the new
Wembley stadium (BBC, 2002; 2006) are recent and current high profile
examples of the inability of the industry to deliver projects that meet the
requirements of key stakeholders. It is believed that the perpetuation of this
poor performance is because the industry continues to be blind to its failings
(Cain, 2004).
Following Latham (1994) and especially Egan (1998), it has become more
difficult to “misinterpret, ignore or shrug off” calls for performance
improvement (Cain, 2004), and more so because these calls for change have
been client driven and specific targets that have been defined for the industry
to pursue, and also because powerful organisations such as the Construction
Clients Forum, Rethinking Construction organisation, Movement for
Innovation (M4I), and the Constructing Excellence programme have been set
up to push forward the performance improvement agenda (Cain, 2004).
These initiatives have led to some improvements in performance although
data to quantify these improvements is still limited because of the limited
implementation of performance measurement. The surveys conducted by
CCF/CBPP (1999) and CIB (1999) for instance provided evidence of a 16%
overall performance improvement from 1995 to 1999, with as many as 8 out
of 10 repeat clients in 1999, happy to use the same contractors on future
commissions. There is however a lot more room for improvement.
Within the research environment, the under-achievement has inspired
extensive research on construction project performance examining the factors
that influence it in the hope that through measurement and benchmarking,
changes can be made to these factors to improve the services offered by the
construction industry. Studies conducted in this field so far have focused on
demonstrating the influence of such factors as procurement routes,
The construction industry and project performance
26
management systems and techniques, and construction methods (cf. Larson,
1997; Proverbs et al., 1999; Tam et al., 2000; Soetanto, 2002). The range of
factors captured in the literature on performance are considered in the
following section.
2.4 FACTORS INFLUENCING PROJECT PERFORMANCE – A REVIEW OF SOME CRITICAL SUCCESS FACTORS
The performance of a construction project is influenced by a multitude of
inter-related factors some of which are referred to in the literature as critical
success (or failure) factors (Fortune and White, 2006). These factors may be
classified as being project-related, organisation-related, industry-related or
external factors as shown in Figure 2.4 which summarises the foregoing
discussions on the way in which performance is typically perceived and
factors influencing performance. The factors captured in Figure 2.4, which are
by no means exhaustive, have been compiled from sources including Assaf et
al. (1996), Belassi and Tukel (1996), Ching Ming and Harris (1996), Russell et
al. (1997), Hatush and Skitmore (1997b), Ng and Skitmore (1999), Chan et al.
(2004), Belout and Gauvreau (2004) and Dainty et al. (2004). In a review of
some 63 articles on the critical success factors (CSFs) of projects (including
non-construction projects) covering some of the sources cited above, Fortune
and White (2006) identified at least 27 CSFs comprising factors like support
from senior management, clear realistic objectives, detailed plan kept up to
date, good communication, user/client involvement, skilled and sufficient
staff, competent project manager, proven technology, realistic schedules, past
experience, project size and complexity. This list of factors reinforced a
previous list of 24 empirically derived CSFs in White and Fortune (2002).
Although not specifically addressing the construction project context, these
factors generally hold true for construction projects as well and are consistent
with those factors identified in Figure 2.4. By definition, CSFs are areas of
The construction industry and project performance
27
activity that should receive constant and careful attention from management
to ensure attainment of organisational goals (Rockart, 1979 in Fortune and
White, 2006). This implies that in seeking to improve performance on
construction projects, it is necessary to understand each of these factors and
to investigate how they each impact on performance outcomes and how they
interact also to influence performance outcomes. A lot of research has been
undertaken in this domain in respect of each of these factors, and these
studies have yielded valuable insights. Notable examples include studies like
Majid and McCaffer (1998), Proverbs et al. (1999), Xiao and Proverbs (2002c),
and Moselhi et al. (2005).
When considering the role that the various project participants can play in
influencing the above-mentioned factors, it is useful to classify these factors
into uncontrollable and controllable factors (Soetanto, 2002). From a project
perspective, uncontrollable factors include the external constraints and
industry factors as shown in Figure 2.4. By definition, these are beyond the
control of project participants and hence may be difficult, if not impossible to
influence at a project level in trying to improve performance.
Of particular relevance are the controllable factors which include such project
and organisation-related factors as procurement route, contracts, variations,
project complexity, project duration and cost, design time, plant and
equipment, personnel, interaction between project participants, some process-
related issues, skills and capability, health and safety, quality and specific
company programmes (Soetanto, 2002). These are factors on which at least
one of the participants within the CPO can bring to bear some amount of
control and as a result influence the course of a project. To highlight a few of
the commonly recognised and widely researched factors, some of these
factors are examined in greater detail below to give a sense of the manner in
which researchers have established that they influence the delivery of
projects.
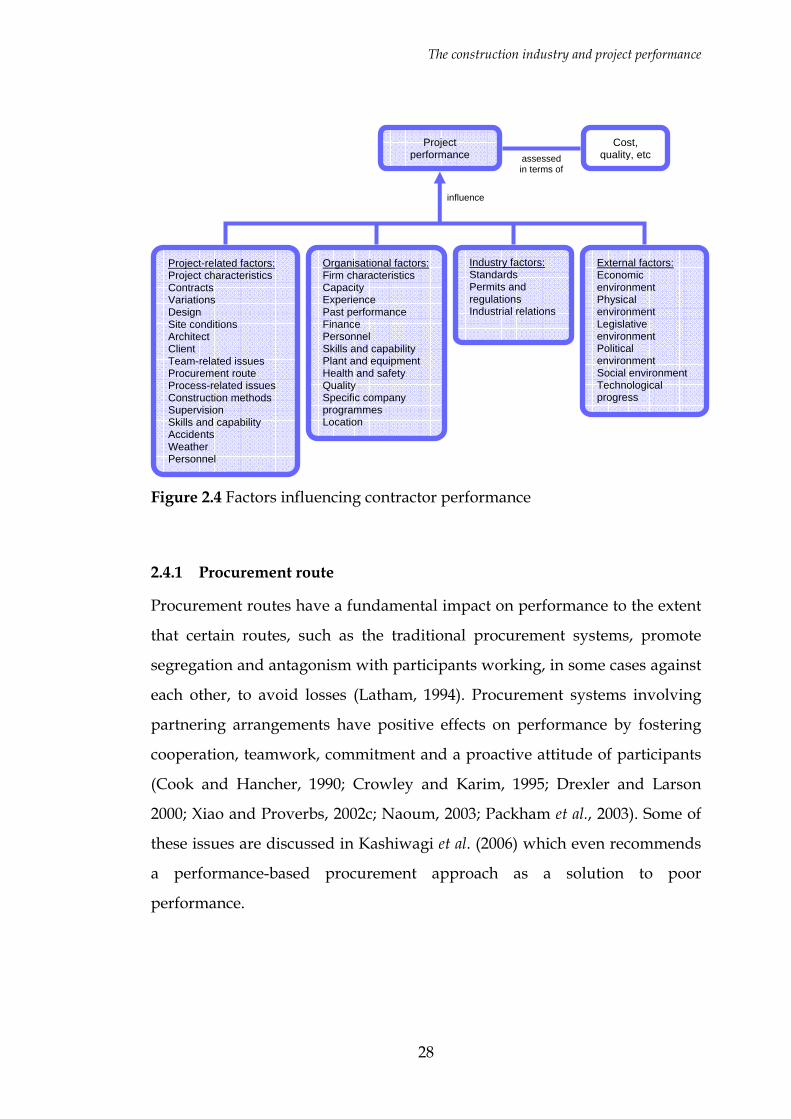
The construction industry and project performance
28
Figure 2.4 Factors influencing contractor performance
2.4.1 Procurement route
Procurement routes have a fundamental impact on performance to the extent
that certain routes, such as the traditional procurement systems, promote
segregation and antagonism with participants working, in some cases against
each other, to avoid losses (Latham, 1994). Procurement systems involving
partnering arrangements have positive effects on performance by fostering
cooperation, teamwork, commitment and a proactive attitude of participants
(Cook and Hancher, 1990; Crowley and Karim, 1995; Drexler and Larson
2000; Xiao and Proverbs, 2002c; Naoum, 2003; Packham et al., 2003). Some of
these issues are discussed in Kashiwagi et al. (2006) which even recommends
a performance-based procurement approach as a solution to poor
performance.
assessed in terms of
influence
Project performance
Cost, quality, etc
Project-related factors: Project characteristics Contracts Variations Design Site conditions Architect Client Team-related issues Procurement route Process-related issues Construction methods Supervision Skills and capability Accidents Weather Personnel
Organisational factors: Firm characteristics Capacity Experience Past performance Finance Personnel Skills and capability Plant and equipment Health and safety Quality Specific company programmes Location
Industry factors: Standards Permits and regulations Industrial relations
External factors: Economic environment Physical environment Legislative environment Political environment Social environment Technological progress

The construction industry and project performance
29
2.4.2 Contracts
Contracts, a feature in all procurement arrangements, are instruments for
recording obligations and responsibilities and allocating risks (Soetanto,
2002). The form and clarity of contracts, the quality of documentation, and the
method of payment have significant impacts on performance. Ambiguous
and inappropriate contracts that allocate risks wrongly, lead to disputes and
conflicts, and these detract from the pursuit of project goals resulting in poor
performance (Godfrey, 1996; Artama Wiguna and Scott, 2006). Among other
factors, Chua et al. (1999) identified proper contractual arrangements which
identify and allocate risks equitably, provide realistic obligations and clear
objectives and targets, provide for formal dispute resolution processes, and
also include motivation and incentives to the contracting parties, as a critical
success factor for construction projects.
2.4.3 Variations
Variations have been identified in Kaming et al. (1997) as significant
influences on time and cost performance. Variations arise from a variety of
sources including the client, architect, management errors and other
unforeseen circumstances or events that arise during construction (Akinsola,
1997). Firstly, their valuation can lead to conflicts and disputes. Secondly,
they may result in delays and reworking with their attendant costs and
programme disruption. There are also indirect cost and time implications
associated with claims documentation. Through these various effects,
variations reduce labour productivity significantly (Sutrisna and Potts, 2002),
and by extension, project performance.
2.4.4 Project complexity
Project complexity influences contractor performance to the extent that a
project may require specialised skills or specialised plant and equipment.
Where these are unavailable, the effect on project delivery may be increased
The construction industry and project performance
30
duration and cost, and compromised quality. Factors related to complexity
include percentage design completed prior to work on site, design time,
project duration and cost, plant and equipment, and personnel. Percentage
design completed prior to work on site introduces an element of complexity
and additional burden on participants (Soetanto, 2002). It affects planning
and programming and may result in considerable delays. Design time, project
duration and cost, which are also measures of project complexity, influence
performance in like manner. The correct choice of plant and its availability
and by extension the policy of the contractor as regards plant and equipment
ownership could also potentially have an impact on performance especially
where specialised plant and equipment are necessary to undertake work.
Likewise the personnel factor which covers the manpower resources available
on the project, the qualification, experience, skills and expertise,
organisational structure as well as the management capabilities of key
personnel (Dozzi et al., 1996; Hatush and Skitmore, 1997b). Project success is
dependent on having the right personnel on the project in a labour intensive
industry like construction. This has implications for recruitment of personnel.
2.4.5 Segregation
Segregation between participants and roles is one of the principal causes of
poor performance hence Latham’s (1994) “Constructing the team” report.
Interaction between the project participants, particularly early in the
construction process promotes buildability, and this reduces the likelihood of
variations, defects and associated reworking, delays, additional costs and
conflicts. This factor covers harmonious working relationships which
according to Soetanto et al. (2001) is an essential ingredient of project success,
and also covers the level and quality of communication that occurs between
participants. The provision of an appropriate network and necessary data to
all key workers is one of ten key factors influencing project success (Belout
and Gauvreau, 2004).
The construction industry and project performance
31
2.4.6 Management philosophies
Management philosophy relating to such issues as supply chain management
and total quality management (TQM) affects the way a project is managed on
site. TQM for instance is about the quest for customer satisfaction, increased
competitiveness, continuous improvement in quality, leadership, teamwork
and empowerment (Ngowi, 2000; Thomas et al., 2002). Although it is often
perceived in construction only as a marketing tool (Thomas et al., 2002), this
philosophy when applied effectively influences performance positively
(Ngowi, 2000; Love et al., 2004). According to Laszlo (1998), TQM leads to
improvements in efficiency, product and service quality levels, as well as
excellence in thinking and high quality work methods.
2.4.7 Process-related issues
Process-related issues capture many of the CSFs including decision-making,
monitoring and control procedures, recording and reporting systems,
management support, and involvement of participants (Lim and Mohammed,
1999). Globerson and Zwikael (2002) for instance captured the importance of
monitoring and control mechanisms for proper project completion. The more
efficient and effective the systems that regulate these issues, the better the
overall performance of a project. These factors facilitate the flow of
information, feedback and teamwork, and allow knowledge to be drawn
from all parts of the value chain.
2.4.8 Health and Safety policies
The health and safety (H&S) policy of the project organisation (often dictated
by the dominant participant) influences the likelihood of accidents occurring
on the project. The construction industry as highlighted previously has a bad
reputation in relation to H&S (Pearce, 2003). With H&S increasingly
becoming an important measure of performance, as reflected in the various
contractor selection frameworks (cf. Hatush and Skitmore, 1997a; 1997b), the
The construction industry and project performance
32
H&S policy in place to prevent the occurrence of accidents takes on greater
significance. In identifying factors influencing performance Chan et al. (2004)
identified the implementation of an effective safety programme as a critical
success factor of construction projects. Assaf et al. (1996) likewise identified
adherence to safety rules and regulations within such a programme as
important. Fewer accidents, which a good policy ensures, not only improves
the reputation of the contractor, but also reduces delays and adds to the
overall satisfaction of project participants.
2.4.9 Quality management policy
The quality management policy of the contractor employed in the
management of the project determines the quality outcomes of the project
and has implications for the number of defects, amount of reworking
required and their associated delays and costs (Xiao and Proverbs, 2002c). It is
for these reasons that Chan et al. (2004) recognised the implementation of an
effective quality assurance programme as a critical success factor in project
delivery. Indeed quality management has evolved from quality control (QC)
which is reactive and concerned with error detection, through quality
assurance (QA) which is concerned with error prevention, to TQM which is
proactive and concerned with continuous improvement (Thomas et al., 2002).
It is suggested ibid that the construction industry is only just beginning to
make the transition from QC to QA. Even fewer construction organisations
are going further to embrace TQM. This implies that different quality policies
are likely to exist with different consequences for quality outcomes.
2.4.10 Specific company programmes
Specific company programmes such as formal training regimes are an
important indicator of the value placed on employees by the organisation.
They serve to improve the skills and capabilities or competence (as defined in
The construction industry and project performance
33
Dainty et al. (2004)) of employees, and this results in improved workmanship,
project management and performance.
The above discussion provides an indication of the range of factors
influencing performance. These factors are inter-related in very fundamental
ways with for instance procurement route influencing the choice of contract,
and the project complexity influencing number of variations. Research on
these factors abound in the construction management literature, with some of
these studies highlighting the choices being made by project participants in
respect of these factors and the resultant outcomes. Love et al. (2004) for
instance examine the implementation of TQM and its outcomes for eight
Australian construction organisations, drawing lessons from their
experiences. The extensive research not withstanding, it can be argued from
the deficit that still exists in performance that there is a need for fresh
perspectives to complement the existing research and provide new insights
for improving performance.
2.5 A ‘SOFTER’ PERSPECTIVE
Some of the factors influencing performance like management support,
communication, relationships, involvement of participants and decision-
making (cf. Belassi and Tukel, 1996; Chua et al., 1999; Chan et al., 2004;
Fortune and White, 2006) are what may be described as ‘soft’ factors relating
to attitudes and behaviours of participants within the CPO. In the
management and organisational behaviour literature, such factors are often
captured under the organisational culture construct (Hampden-Turner, 1994;
Egan, 1998; Alvesson, 2002; Ankrah and Langford, 2005). This construct
(borrowing from Smircich (1983)) provides a rich instrument for perceiving
and understanding the operation of the CPO. Whilst organisational
behaviour and management scholars have derived huge benefits from the
The construction industry and project performance
34
rich imagery and metaphors associated with this construct to facilitate
understanding and communication of their organisational experiences and
also to explore organisational effectiveness and performance, the same cannot
be said for the construction project experience. This situation may be due in
part to the fact that reading through the performance literature,
organisational culture as a construct does not receive much mention as a
factor influencing performance. Although it is identified in Dozzi et al. (1996)
and Chua et al. (1999) as a performance influencing factor, this mention is not
commonplace. The implication has been that the construct of culture has not
received as much attention as some of the other factors like procurement
route or construction methods in the quest for performance improvement.
This construct of culture is however coming to the fore within construction
circles with construction industry reports like Latham (1994) and Egan (1998),
and other published research berating the culture of the construction industry
and blaming it for many of the industry ills, in particular the adversarial and
antagonistic aspects that according to them have persistently plagued the
industry and affected performance. The general consensus is that there is a
need for cultural change within the construction industry for performance to
be improved.
Although there is increasing interest in construction research in the culture
domain (e.g. Serpell and Rodriguez; 2002), this research into the phenomenon
of culture and particularly its effects on performance which can/should
inform such cultural change has so far been disparate and inadequate as will
be demonstrated in the following chapter. Its specific role in contractor
performance is still not clearly apparent. Where it has been suggested as
influencing performance outcomes (cf. Dozzi et al., 1996; Chua et al., 1999), the
nature of the implied relationships between organisational culture and
performance still remain unclear and as a result, it has not been possible to
identify ‘best practice’ cultures most suited to the peculiar nature and needs

The construction industry and project performance
35
of construction. This fact is also recognised by Phua and Rowlinson (2004)
who point to the lack of rigorous and empirical support for the supposed
positive relationship between culture and project success, with the general
tendency being to ‘black box’ culture and use it when no other reasons can be
adduced to explain the issues concerned (Fellows and Seymour, 2002). As a
result, it has been difficult to advocate and build those cultural orientations
associated with improved performance, and to take steps to mitigate the
effects of those orientations associated with poor performance.
This situation implies therefore that further studies of the complex
relationships between culture and performance are very much needed and
would provide a significant contribution to the body of knowledge on
construction project performance. As argued in Chua et al. (1999), it is the
identification of key factors affecting construction project success that ensures
the appropriate allocation of limited resources. It would be illogical to devote
resources to cultural change initiatives without any evidence of its usefulness
in improving project performance.
2.6 SUMMARY
The construction industry is responsible for the delivery of the UK’s built
environment. Current turnover for the industry (in respect of contractors’
output alone) exceeds £107B, and it employs by some counts up to 2M
people. Clearly, this industry is significant in its size and structure, and more
importantly in its contribution to the UK economy. Clients expect products
that meet clearly specified requirements. Unfortunately, the industry has by
and large failed to meet these client requirements. This state of affairs has
inspired a significant amount of research into the performance of the
construction industry and factors influencing performance outcomes with the
emphasis being on project performance. Some of these factors have been
The construction industry and project performance
36
discussed in this review. Whilst several of the factors identified in the
literature are ‘soft’ factors which stem from the culture that exists within the
CPO, few direct references to organisational culture are made in the
performance literature. Even where references to organisational culture are
made in the performance literature, the extent of its impact are not set out.
This situation inevitably implies a difficulty in assessing the likely
performance outcomes of cultural change, and shows that there is a gap in
the knowledge on cultural orientation and performance that needs to be
explored. The next chapter begins this exploration process by delving into
this construct of organisational culture and examining its impacts on
performance generally and in particular from a construction project
perspective.
37
CHAPTER 3: THE ROLE OF CULTURE IN DETERMINING PERFORMANCE OUTCOMES
3.0 INTRODUCTION
It was suggested in the preceding chapter that factors like ‘culture’ need to be
taken more seriously when looking at improving effectiveness and
performance in construction. To demonstrate the importance of this
phenomenon of culture and to address the second key objective of this
research, this chapter is devoted to a critical review of (organisational)
culture; in particular the role that it plays in determining organisational
outcomes, and the theories underpinning its conceptualisation and
investigation. The chapter also interrogates literature within the construction
domain on research undertaken in this genre, the aim being to establish how
it is conceived in construction management research, the extent to which it
has actually been researched in construction, and the scope that still exists for
further research.
3.1 CULTURE AND PERFORMANCE
It has long been recognised that organisational culture plays a significant role
in performance outcomes. This recognition has been implicitly and explicitly
expressed in several quarters, mainly in the mainstream organisational
behaviour and management literature (cf. Baker, 2002; Smith, 2003; Tharp,
2005). According to Smircich (1983) and Hatch (1993), the idea that business
organisations have a cultural quality that is relevant for performance was
recognized as far back as the 1970s as evidenced by the publication in 1980 of
Business Week with the cover story “Corporate culture: The hard-to-change
The role of culture
38
values that spell success or failure” (Business Week, 1980 in Smircich (1983)).
In particular, Deal and Kennedy (1982) and Peters and Waterman (1982) were
instrumental in popularising this notion that certain cultural orientations lead
to organisational effectiveness and strong performance. Others (cf. Ouchi,
1981; Schein, 1985; Kotter and Heskett, 1992; Alvesson, 2002; Smith, 2003) also
made similar assertions, although many of these assertions were based only
on anecdotal evidence, which rightly or wrongly were described as being
selective (Denison and Mishra, 1995).
Empirical studies to confirm the relationships between culture and
performance have been relatively limited, and generally not well received
(Wilderom et al., 2000). This, according to Denison and Mishra (1995), has
been mainly as a result of the critique of the application of positivist
approaches to the social sciences. Where such studies have been conducted
(cf. Denison and Mishra, 1995), it has been found for instance that the cultural
traits of involvement and adaptability were strong predictors of growth
whilst consistency and mission were strong predictors of profitability.
Christensen and Gordon (1999) and Wilderom et al. (2000) also catalogued
other empirical studies that uncovered similar relationships.
Beyond just particular cultural orientations, it has also been noted by Deal
and Kennedy (1982) and Kotter and Heskett (1992) that there are correlations
between strong cultures and the strong performance of some organisations.
Here a strong culture is measured by the degree to which all sections of the
organisation buy into key aspects of the culture (Thompson, 1993).
Clearly, there is sound basis in the literature for the hypothesis that the
performance of construction projects is influenced by the culture of the CPO.
This represents the main hypothesis that this research seeks to explore. As a
first step in this direction, it is necessary to understand this phenomenon of
culture and how it comes to be so important in performance outcomes.
The role of culture
39
3.2 THE PHENOMENON OF CULTURE
As pointed out in Ankrah and Proverbs (2004), considerable effort has gone
into attempts to develop a definitive interpretation of culture. However, this
goal appears to have eluded the many researchers exploring this area, and
this situation can be attributed to the various perspectives from which the
concept of culture can be approached and the various theories underpinning
these perspectives. The evidence of this is in the plethora of definitions
available, with Kroeber and Kluckhohn (1952, in Bodley 1994) for instance
reported to have compiled a list of over 160 different definitions of culture. In
many ways, the study of culture can be likened to the story of the six blind
men and the elephant as narrated by Saxe (1963), and as used metaphorically
by Roberts and Boyacigiller (1993) when they questioned whether the
elephant (culture) was too large or researchers were too blind.
Whether the elephant (culture) is too large or the researcher too blind, the
specific concept of culture that a particular researcher adopts is an important
matter as it influences the research questions asked, the problems
investigated, the methods applied and the interpretation of results (Bodley,
1994). This implies that in undertaking any critical investigation into any
aspect of culture, the researcher needs to define the perspective of culture
being assumed and its underpinning theories in order to set the context
within which the research can be considered as being valid.
3.2.1 An overview of culture
Barthorpe et al. (2000), in presenting an overview of culture, examined the
evolution of the term and pointed to its initial historical association with the
cultivation of land and production of crops, and breeding of animals. This
perspective has gradually evolved to current views of culture as the totality
of socially transmitted behaviour patterns, arts, beliefs, institutions, and all
The role of culture
40
other products of human work and thought (American Heritage Dictionary,
2000). Its modern definition of socially patterned human thought and
behaviour is attributed to renowned anthropologist Edward Tylor, who is
believed to have first used the term in its true anthropological sense (Payne,
1996; Barthorpe et al., 2000). Tylor’s definition of culture is captured in Rooke
(2001) as “that complex whole which includes knowledge, belief, art, morals,
laws, custom, and any other capabilities and habits acquired by man as a
member of society”.
A cross-disciplinary definition of culture proposed in Hofstede (2001) is that
culture is “transmitted and created content and patterns of values, ideas, and
other symbolic-meaningful systems as factors in the shaping of human
behaviour and the artefacts produced through behaviour.”
Another well-known definition takes culture to be patterned ways of
thinking, feeling and reacting, acquired and transmitted mainly by symbols,
constituting the distinctive achievements of human groups, including their
embodiments in artefacts (Kroeber and Kluckhohn, 1978 in Hofstede, 2001).
This definition is akin to Bodley’s (1994) simplified representation of culture
as “what people think, what they do, and the material products they
produce.” Hofstede (2001) also defined culture as “the collective
programming of the mind that distinguishes the members of one group or
category of people from another.”
Culture acts like a template and shapes behaviour and consciousness within a
human society from generation to generation (Miraglia et al., 1999).
Essentially, it operates as a decodifier (Serpell and Rodriguez, 2002), defining
situations and words, and giving them new meaning.
Culture exists in a constant state of change (Miraglia et al., 1999), and this may
to some extent account for the difficulty in defining it. The various
The role of culture
41
perspectives and definitions notwithstanding, a number of themes are
common to all the different interpretations which are fundamental to
understanding culture viz:
Culture is learned and shared;
Culture is determined by contextual factors, implying that it is peculiar
only to the group to whom these factors apply;
The underlying basic problems are common and include relation to
authority, concept of masculinity and femininity, and ways of dealing
with conflicts; and
Culture shapes behaviour and manifests in the form of values and
practices.
Perhaps the most important theme of all is the universal recognition that such
a phenomenon or concept as culture does indeed exist.
According to Allaire and Firsirotu (1984), the various definitions fall into very
well demarcated schools of thought on culture in anthropology with specific
conceptual assumptions and approaches to cultural investigation. This
implies that accepting a particular definition imposes a commitment to the
specific conceptual and theoretical underpinnings of that definition and ways
of studying culture.
3.2.2 Theories of culture
Historically the study of culture is rooted in the fields of anthropology and
social anthropology. According to Hatch (1993) the cultural phenomena has
been dealt with more outrightly by anthropologists than by any other group
of scientists or scholars. It is therefore logical in studying this phenomenon,
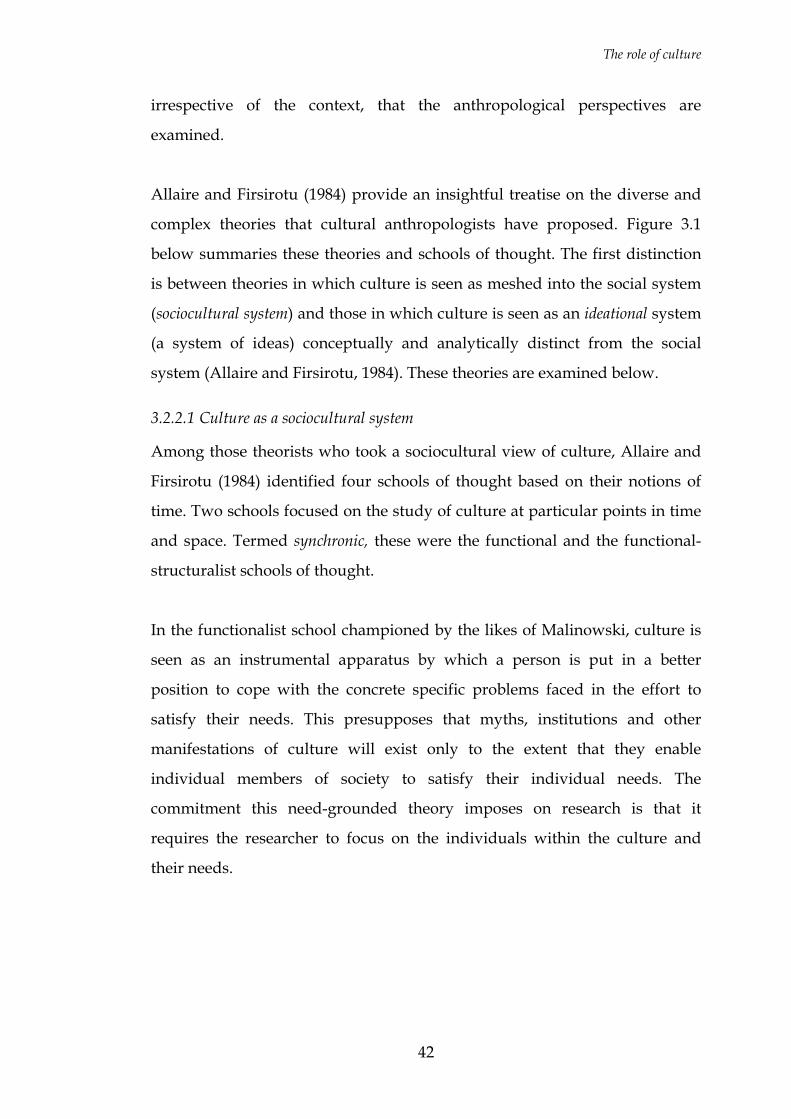
The role of culture
42
irrespective of the context, that the anthropological perspectives are
examined.
Allaire and Firsirotu (1984) provide an insightful treatise on the diverse and
complex theories that cultural anthropologists have proposed. Figure 3.1
below summaries these theories and schools of thought. The first distinction
is between theories in which culture is seen as meshed into the social system
(sociocultural system) and those in which culture is seen as an ideational system
(a system of ideas) conceptually and analytically distinct from the social
system (Allaire and Firsirotu, 1984). These theories are examined below.
3.2.2.1 Culture as a sociocultural system
Among those theorists who took a sociocultural view of culture, Allaire and
Firsirotu (1984) identified four schools of thought based on their notions of
time. Two schools focused on the study of culture at particular points in time
and space. Termed synchronic, these were the functional and the functional-
structuralist schools of thought.
In the functionalist school championed by the likes of Malinowski, culture is
seen as an instrumental apparatus by which a person is put in a better
position to cope with the concrete specific problems faced in the effort to
satisfy their needs. This presupposes that myths, institutions and other
manifestations of culture will exist only to the extent that they enable
individual members of society to satisfy their individual needs. The
commitment this need-grounded theory imposes on research is that it
requires the researcher to focus on the individuals within the culture and
their needs.
The role of culture
43
CULTURE
As an ideational system: cultural and social realms are distinct but interrelated. Culture is located in:
As a sociocultural system: culture is a component of the social system, manifested in behaviour (ways-of-life) and products of behaviour. The study of sociocultural systems may be:
Synchronic Diachronic
Functionalist Functionalist-structuralist
Ecological-adaptationist
Historical-diffusionist
The minds of culture-bearers
The products of minds (shared meanings and symbols)
Cognitive Structuralist SymbolicMutual equivalenceSCHOOLS:
MAJOR THEORISTS: Goodenough Lévi-Strauss Wallace Geertz, Schneider Malinowski Radcliffe-Brown Boas, Benedict,
Kluckhohn, Kroeber
White, Service,
Rappoport, Vayda, Harris
Figure 3.1 A typology of the concepts of culture [Source: Allaire and Firsirotu (1984)]
The role of culture
44
In the structural-functionalist school of thought, culture is an adaptive
mechanism by which people are enabled to live a social life as an ordered
community in a given society (Allaire and Firsirotu, 1984). Structural-
functionalists posit society as an integration of institutions (such as family
and government) with culture as the system of normative beliefs that
reinforces these social institutions (Hammond, 1978; Infoplease, 2005).
The other two schools; the historical-diffusionist and the ecological-adaptationist
schools, consider the time dimension as well and focus on the processes
involved in the development of a culture. These are classified as diachronic
(Allaire and Firsirotu, 1984). The historical-diffusionist school regards culture
as consisting of temporal, interactive, superorganic and autonomous forms
produced by historical circumstances and processes (Allaire and Firsirotu,
1984). Many early anthropologists conceived of culture as a collection of traits
and studied the diffusion, or spread, of these traits from one society to
another. Critics of diffusionism, however, pointed out that the theory failed to
explain why certain traits spread and others do not (Infoplease, 2005).
The ecological-adaptationist school of thought perceives culture as a system
of socially transmitted behaviour patterns that serve to relate human
communities to their ecological settings. Ecological approaches explain the
different ways that people live around the world not in terms of their degree
of evolution but rather as distinct adaptations to the variety of environments
in which they live. They also demonstrate how ecological factors may lead to
cultural change, such as the development of technological means to harness
the environment (Hammond, 1978; Infoplease, 2005). As explained in Allaire
and Firsirotu (1984), the sociocultural system and the environment are
involved in a process of reciprocal causality, each an active influence on the
other; their interaction representing an important feature of this school.

The role of culture
45
3.2.2.2 Culture as an ideational system
And then there are the ideational theories. Among the ideational theorists
where the emphasis is on the cognitive, Keesing (1974) distinguished three
very different schools; the cognitive, structuralist and symbolic schools. Allaire
and Firsirotu (1984) also isolated a further fourth school of thought which
was termed the mutual equivalence school. These four schools can be classified
into two groups. For the first group, culture is located in the minds of the
culture-bearers. There are three schools of thought within this group; the
cognitive, structuralist and mutual equivalence schools (refer to Figure 3.1).
The cognitive school views culture as a system of knowledge, of learned
standards for perceiving, believing, evaluating and acting (Allaire and
Firsirotu, 1984). Within this school, culture is clearly not considered to be a
material phenomenon (Goodenough, 1961 in Keesing, 1974) or about patterns
of recurring events (Goodenough, 2003). Rather, Goodenough (2003) defines
culture as:
“consisting of criteria for categorising phenomena as meaningful,…deciding
what can be,…deciding how one feels about things (preferences and
values),…deciding what to do about things,…deciding how to go about doing
things, and the skills needed to perform acceptably.”
For the structuralist school, culture is made up of shared symbolic systems
that are cumulative products of the mind, a reflection of unconscious
processes of mind that underlie cultural manifestations (Allaire and Firsirotu,
1984). Here the essence of studying culture is to uncover those principles of
mind that generate cultural elaborations like myths, art, kinship and language
(Keesing, 1974).
Within the mutual equivalence school, culture is seen as a set of standardised
cognitive processes which create the general framework for the mutual

The role of culture
46
prediction of behaviour among individuals interacting in a social setting
(Allaire and Firsirotu, 1984).
The second group considers culture to be made up of shared meanings and
symbols. This group has the symbolic school of thought in which culture is
seen in the “meanings and thinkings shared by social actors” (Allaire and
Firsirotu, 1984; Geertz, 2001). Here the focus is on examining shared codes of
meaning (Keesing, 1974) or how people's mental constructs guide their lives
(Infoplease, 2005). In Keesing’s (1974) treatise on theories of culture this
perspective, as well as the others, is elaborated at length.
As emphasised in Keesing (1974), “culture does not have some true and
sacred and eternal meaning [that theorists] are trying to discover”. What
these various perspectives and theories have sought to do is to enable
researchers address key anthropological questions summarised ibid as: how
have cultures developed and what forces have shaped them? How are
cultures learned? How do shared symbolic systems transcend individual
thought worlds? How different and unique are cultures? Do universal
patterns underlie diversity? How is cultural description to be possible? The
various theories offer alternative ways of investigating and addressing these
questions. Indeed, whilst some researchers have advocated a synthesis of
various theories to evolve a more holistic framework for understanding
culture and its effects (cf. Allaire and Firsirotu, 1984), others have maintained
that it is preferable to have even narrower conceptions of culture so that it
includes less but reveals more (Hall and Neitz, 1993; Geetz 2001). This latter
position is one with which this thesis concurs. This whole dilemma again is
akin to the dilemma of investigating and describing the elephant (see Saxe,
1963).
The role of culture
47
3.2.3 Other perspectives of culture
Beyond the theoretical or definitional differences that have been discussed
above, the study of this phenomenon of culture can also be approached from
a number of different perspectives. For instance, it can be approached from
the levels at which the phenomenon is observed (Erez and Gati, 2004) or from
a convergence or divergence perspective (Abu Bakar, 1998).
3.2.3.1 The levels of culture
Arguably, culture can be observed at a regional (Hofstede, 1984), national
(Trompenaars and Hampden-Turner, 1997; Hofstede, 2001), industry (Riley
and Clare-Brown, 2001), organisational (Peters and Waterman, 1982; Deal and
Kennedy, 1982; Hampden-Turner, 1994; Handy, 1995; Hofstede, 1997) as well
as at the occupational level (Root, 2002; Rameezdeen and Gunarathna, 2003;
Ankrah and Langford, 2005). According to Hofstede (2001), the word culture
can be applied to any human collectivity or category such as an organisation,
a profession, an age group, an entire gender, or a family. This particular
perspective is important because it shows clearly that the construct of culture
is applicable to a CPO context. From a dynamic view of culture espoused by
the likes of Erez and Gati (2004), these various levels of culture influence each
other in a “top-down, bottom-up” fashion, and inconsistencies between levels
may instigate change and cultural adaptation or lead to conflict. What this
means is that although culture is often portrayed as homogeneous, because of
the existence of sub-groups within the wider collectivity, sub-cultures are
likely to exist within the wider culture (Goodenough, 2003; Erez and Gati,
2004).
3.2.3.2 Convergence or divergence perspective
Another set of perspectives, which also reflects in culture research, is the
convergence or divergence perspective (Abu Bakar, 1998) which focus on
finding commonalities or differences in cultural characteristics. Trompenaars
and Hampden-Turner (1997) referred to a situation of ‘glocalisation’ (derived
from globalisation and localisation) vis-à-vis this dilemma of convergence or
The role of culture
48
divergence. Along these same lines, Martin (1992) reports the integration,
differentiation and fragmentation perspectives in organisational culture
research.
These perspectives reflect the myriad of approaches that can be adopted in
cultural studies and any such approaches adopted in research must be clearly
identified and justified to avoid ambiguity and over-generalisation. In this
study where the emphasis is on organisations (i.e. CPOs), it is important to
examine the implications of these various theories for cultural studies of
organisations and for understanding organisational culture. This will help
clarify the appropriate approaches for this study.
3.3 CULTURE IN ORGANISATIONS
As indicated previously, the construct of organisational culture was
popularised by the publication of such articles as Peters and Waterman’s
(1982) ‘In search of excellence’ and Deal and Kennedy’s (1982) ‘Corporate
cultures: the rites and rituals of corporate life’. Before then, it was not considered
important for organisational performance. However since these seminal
publications, it has become an important issue in mainstream management
(Smircich, 1983; Hatch, 1993; Barthope, 2002). In construction, it has only now
begun, in the last two decades, to assume the importance it has in mainstream
management.
Organisations are widely regarded as societies writ small (Allaire and
Firsirotu, 1984). As little societies, organisations are imbued with similar
structures and systems as the wider society. It is within this context that
Allaire and Firsirotu (1984) argue that the concept of culture in organisations
takes significance. Like societies, organisations are unique and their
individuality may be expressed in terms of their cultures, much like the
The role of culture
49
uniqueness of individuals is often expressed in their personalities (Eldridge
and Crombie, 1974; Allaire and Firsirotu, 1984; McNamara, 1999). According
to Deal and Kennedy (1982), every organisation has a culture, even if this
culture is fragmented and difficult to read. This is also true for construction
project organisations (CPOs). It has been argued in Ankrah et al. (2005b) that
organisational behaviour within CPOs is not random which, extrapolating
from Hofstede (1984), presupposes that there are cultures within CPOs that
regulate behaviour. An implicit reference to this culture is made in Cherns
and Bryant (1984) who posited that the relationships between the parties
within the CPO is supplemented and moderated by informal understandings
and practices which have evolved to cope with the difficulties that
characterise construction projects. Evidence of such culture is also more
explicitly reported in Thomas et al. (2002) who examined “project culture”
and its impact on quality outcomes, and in Dainty et al. (2002) who examined
its impact on women on construction sites – referring to a “site culture.”
Regardless of the label used in the construction domain, organisational
culture is the concept of relevance and it is important to understand how it
operates.
Like the generic concept of culture, various organisational behaviour theorists
have different views on an appropriate definition for this phenomenon. This
is probably because as indicated in Smircich (1983) the concept of culture has
been borrowed from anthropology where, as shown from the previous
section, no consensus on its meanings exists.
Schneider (2000) describes this as the problem of culture – being almost
anything and thus being everything depending on who is conducting the
specific piece of research. A loose definition of organisational culture has
been presented as the way we do things around here to succeed (Schneider,
2000). More formally, it is defined as a pattern of shared basic assumptions
that is learned by a group within an organisational setting through solving its
The role of culture
50
problems of external adaptation and internal integration, which having
worked well enough, is considered valid and taught to new members as the
correct way to perceive, think, and feel in relation to particular problems
(Schein, 1985). Eldridge and Crombie (1974) defined it as the unique
configuration of norms, values, beliefs, ways of behaving and so on that
characterise the manner in which groups and individuals combine to get
things done. Hofstede (1997) also defined it as the collective mental
programming that distinguishes the members of one organisation from
another. McNamara (1999) argued that organisational culture comprised of
the assumptions, values, norms and tangible signs (artefacts) of organisation
members and their behaviours, with new members of an organisation,
consciously or unconsciously, soon coming to sense the particular culture of
the organisation just as they would another person.
It is an organisation’s way of behaving, identity, pattern of dynamic
relationships, ‘reality’, or genetic code, and it has everything to do with
implementation of management ideas and how success is actually achieved
(Schneider, 2000). It is often based on one or more philosophies related to the
various stakeholders (Thompson, 1993), and is learned by new members
through a process of socialisation. It can also be defined as the set of elements
of an organisation that determines its way of acting, being, decision-making,
communication and others (Serpell and Rodriguez, 2002).
Clearly these definitions have some resonance with the various theories of
culture examined in the previous sections (see Table 3.1), and demonstrate as
indicated by Smircich (1983) that the organisational culture concept has
indeed been borrowed from anthropology. Indeed, as there is no consensus
on culture’s meaning in anthropology, it is not surprising that there is also a
multiplicity of definitions and applications in the field of organisational
studies. These definitions however provide a useful starting point for
understanding organisational culture.
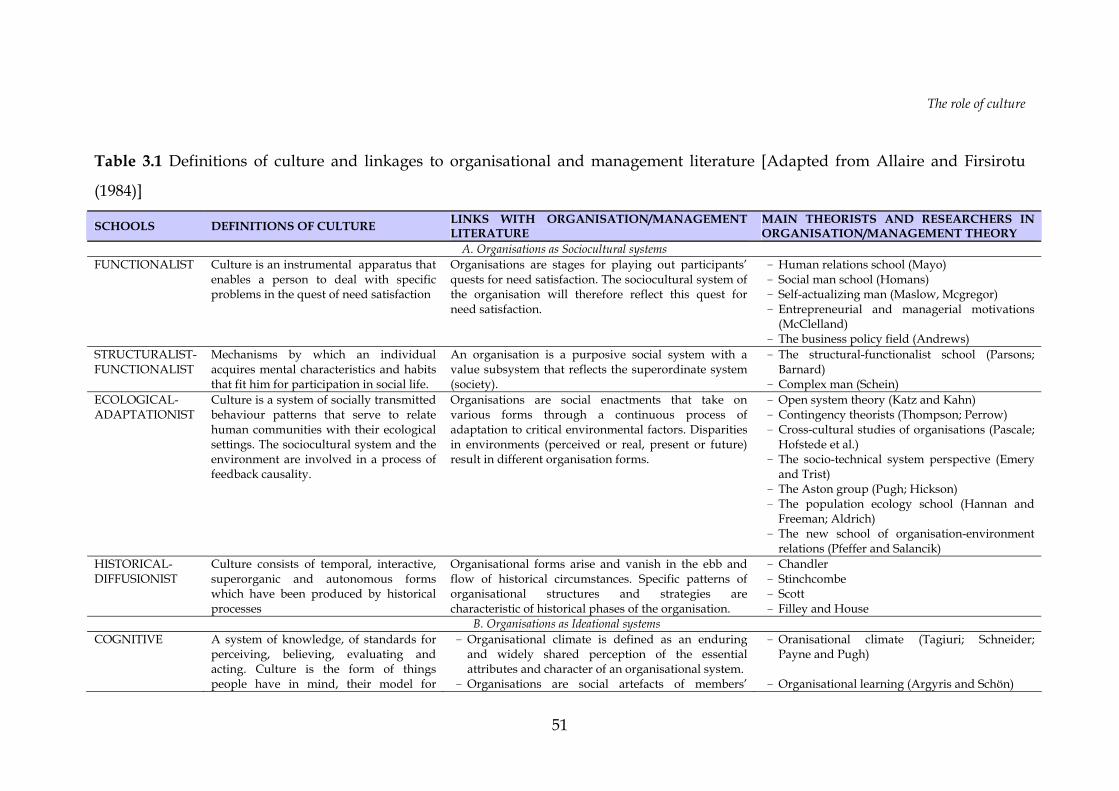
The role of culture
51
Table 3.1 Definitions of culture and linkages to organisational and management literature [Adapted from Allaire and Firsirotu
(1984)]
SCHOOLS DEFINITIONS OF CULTURE LINKS WITH ORGANISATION/MANAGEMENT LITERATURE
MAIN THEORISTS AND RESEARCHERS IN ORGANISATION/MANAGEMENT THEORY
A. Organisations as Sociocultural systems FUNCTIONALIST Culture is an instrumental apparatus that
enables a person to deal with specific problems in the quest of need satisfaction
Organisations are stages for playing out participants’ quests for need satisfaction. The sociocultural system of the organisation will therefore reflect this quest for need satisfaction.
- Human relations school (Mayo) - Social man school (Homans) - Self-actualizing man (Maslow, Mcgregor) - Entrepreneurial and managerial motivations
(McClelland) - The business policy field (Andrews)
STRUCTURALIST-FUNCTIONALIST
Mechanisms by which an individual acquires mental characteristics and habits that fit him for participation in social life.
An organisation is a purposive social system with a value subsystem that reflects the superordinate system (society).
- The structural-functionalist school (Parsons; Barnard)
- Complex man (Schein) ECOLOGICAL-ADAPTATIONIST
Culture is a system of socially transmitted behaviour patterns that serve to relate human communities with their ecological settings. The sociocultural system and the environment are involved in a process of feedback causality.
Organisations are social enactments that take on various forms through a continuous process of adaptation to critical environmental factors. Disparities in environments (perceived or real, present or future) result in different organisation forms.
- Open system theory (Katz and Kahn) - Contingency theorists (Thompson; Perrow) - Cross-cultural studies of organisations (Pascale;
Hofstede et al.) - The socio-technical system perspective (Emery
and Trist) - The Aston group (Pugh; Hickson) - The population ecology school (Hannan and
Freeman; Aldrich) - The new school of organisation-environment
relations (Pfeffer and Salancik) HISTORICAL-DIFFUSIONIST
Culture consists of temporal, interactive, superorganic and autonomous forms which have been produced by historical processes
Organisational forms arise and vanish in the ebb and flow of historical circumstances. Specific patterns of organisational structures and strategies are characteristic of historical phases of the organisation.
- Chandler - Stinchcombe - Scott - Filley and House
B. Organisations as Ideational systems COGNITIVE A system of knowledge, of standards for
perceiving, believing, evaluating and acting. Culture is the form of things people have in mind, their model for
- Organisational climate is defined as an enduring and widely shared perception of the essential attributes and character of an organisational system.
- Organisations are social artefacts of members’
- Oranisational climate (Tagiuri; Schneider; Payne and Pugh)
- Organisational learning (Argyris and Schön)
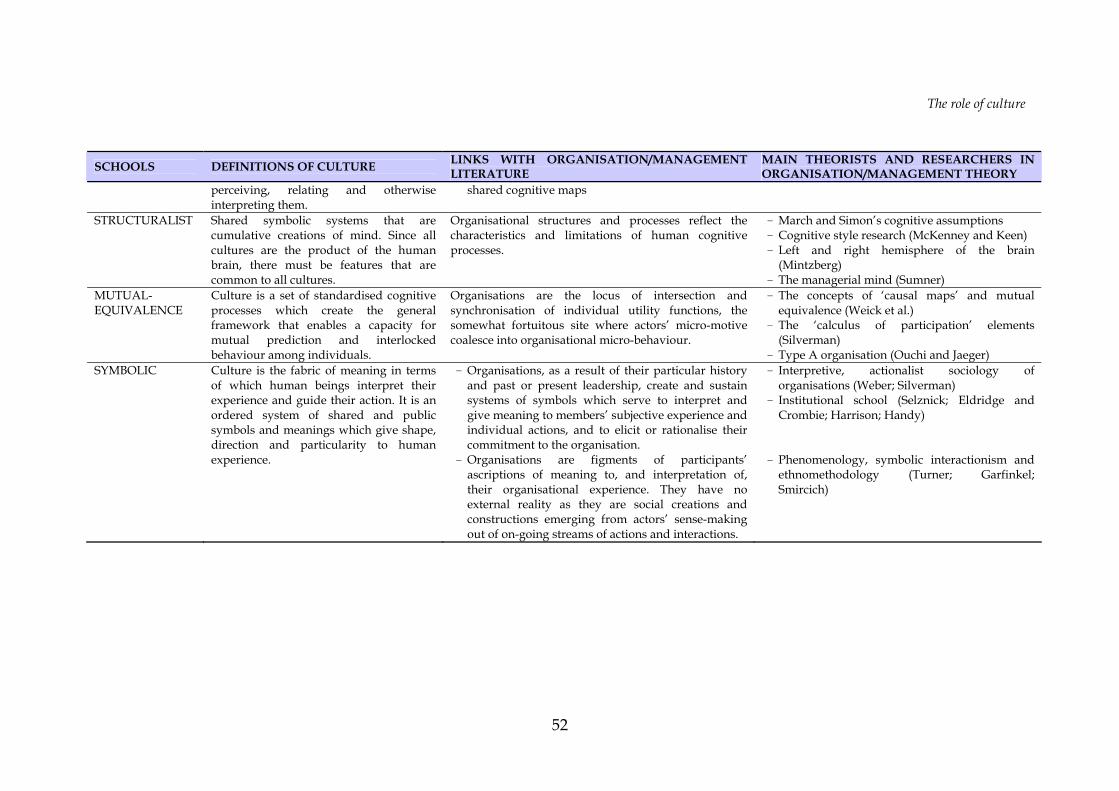
The role of culture
52
SCHOOLS DEFINITIONS OF CULTURE LINKS WITH ORGANISATION/MANAGEMENT LITERATURE
MAIN THEORISTS AND RESEARCHERS IN ORGANISATION/MANAGEMENT THEORY
perceiving, relating and otherwise interpreting them.
shared cognitive maps
STRUCTURALIST Shared symbolic systems that are cumulative creations of mind. Since all cultures are the product of the human brain, there must be features that are common to all cultures.
Organisational structures and processes reflect the characteristics and limitations of human cognitive processes.
- March and Simon’s cognitive assumptions - Cognitive style research (McKenney and Keen) - Left and right hemisphere of the brain
(Mintzberg) - The managerial mind (Sumner)
MUTUAL-EQUIVALENCE
Culture is a set of standardised cognitive processes which create the general framework that enables a capacity for mutual prediction and interlocked behaviour among individuals.
Organisations are the locus of intersection and synchronisation of individual utility functions, the somewhat fortuitous site where actors’ micro-motive coalesce into organisational micro-behaviour.
- The concepts of ‘causal maps’ and mutual equivalence (Weick et al.)
- The ‘calculus of participation’ elements (Silverman)
- Type A organisation (Ouchi and Jaeger) SYMBOLIC Culture is the fabric of meaning in terms
of which human beings interpret their experience and guide their action. It is an ordered system of shared and public symbols and meanings which give shape, direction and particularity to human experience.
- Organisations, as a result of their particular history and past or present leadership, create and sustain systems of symbols which serve to interpret and give meaning to members’ subjective experience and individual actions, and to elicit or rationalise their commitment to the organisation.
- Organisations are figments of participants’ ascriptions of meaning to, and interpretation of, their organisational experience. They have no external reality as they are social creations and constructions emerging from actors’ sense-making out of on-going streams of actions and interactions.
- Interpretive, actionalist sociology of organisations (Weber; Silverman)
- Institutional school (Selznick; Eldridge and Crombie; Harrison; Handy)
- Phenomenology, symbolic interactionism and
ethnomethodology (Turner; Garfinkel; Smircich)

The role of culture
53
A dilemma, similar to whether one ought to conceive culture as an ideational
or sociocultural system, when trying to understand its operation in
organisations is whether culture is something that an organisation ‘is’ or
something that an organisation ‘has’ (Smircich, 1983; Ashkanasy et al., 2000).
Whilst some theorists like Schein (1985) have favoured the former conception
of organisational culture where culture is seen as something an organisation
is, or as put by Smircich (1983) as a “root metaphor”, it is clear from the
literature that most researchers prefer to see it as something that the
organisation has (cf. Deal and Kennedy, 1982; Peters and Waterman, 1982), a
variable (Smircich, 1983), or as put by Hofstede et al. (1993) “…an assumed
characteristic of an entire organisation”.
When perceived this way, it can be presented as another variable that can be
managed, controlled or manipulated by the organisation to achieve particular
ends. This perspective has proved particularly attractive for organisational
behaviour researchers and managers alike (Smircich, 1983), because it offers
potentially another tool in the management arsenal for influencing the course
of organisations. Smircich (ibid) identified two main strands of organisational
research which have embraced this conception of organisational culture;
these are the cross-cultural or comparative management strand and the
corporate culture strand. Although this perspective can be criticised for
reducing the concept of culture to just another management fad, its utility in
helping to describe and make sense of the organisational experience is
unquestionable. Table 3.1 adapted from Allaire and Firsirotu (1984) outlines
some of the lines of enquiry emanating from this perspective and the
researchers pursuing them. These are captured under the sociocultural
paradigm.
When conceived as something an organisation is, the attention shifts from
concerns about what organisations accomplish and how they can accomplish
it more efficiently, to how organisation is accomplished and what it means to

The role of culture
54
be organised (Smircich, 1983). Examples of research emanating from this line
of enquiry include organisational cognition, organisational symbolism, and
unconscious processes and organisation, which are more in line with the
ideational perspectives of culture.
As can be seen from Schein’s (1985) definition, organisational culture is
rooted in the basic and universally shared problems (Schein, 1985; Hofstede,
2001), dilemmas (Trompenaars and Hampden-Turner, 1999) or contradictions
(Quinn, 1988) which all groups or organisations have to deal with. Efforts
made by the group to resolve these problems often yield solutions that are
reliable and repeatable, and reflect the groups underlying cultural paradigm
(Schein, 1985). Groups of people are faced with the same fundamental
problems, but it is the unique solutions they find for these problems that sets
them apart from each other, and is perceived as their culture (Hofstede, 2001).
From the anthropological view of culture discussed previously, this
perspective clearly sits very comfortably with the sociocultural schools of
thought, in particular the functionalist and ecological-adaptationist theories
of culture in which the environmental or situational contexts are emphasized,
although unlike the functionalist view, organisational culture is not about the
individual or their specific individual needs.
Again organisational culture from the definitions examined is about basic
assumptions (Schein, 1985; McNamara, 1999), values and norms (Eldridge
and Crombie, 1974; McNamara, 1999), beliefs (Eldridge and Crombie, 1974),
and mental programmes (Hofstede, 1997). These reflect an acceptance of the
cognitive or, more generally, the ideational aspects that anthropologists like
Geertz (2001) and Goodenough (2003) have offered.
But organisational culture is also about artefacts (McNamara, 1999), ways of
behaving (Eldridge and Crombie, 1974; Mullins, 2005), and how things are
done (Schneider, 2000), which is again in the realm of the sociocultural.
The role of culture
55
Bringing these perspectives together it is reasonable to propose that
organisational culture is that unique configuration of solutions – collectively
evolved by organisational members – that an organisation and its members
adopt in dealing with various organisational problems. The specific solutions
chosen by an organisation represent “preferred” or “dominant”
(Trompenaars and Hampden-Turner, 1999) behaviours and value
orientations, and are the manifestation of the organisation’s culture. In the
context of this research, one CPO can be distinguished from another CPO by
the specific solutions chosen to solve the same problems. This is consistent
with Eldridge and Crombie (1994) who refer to the constant exercise of choice
as being responsible for the individuality or cultural distinctiveness of
organisations. From this definition, if the fundamental problems that
organisations like CPOs contend with daily can be identified, then ‘what is?’
questions can be asked to help identify the solutions employed in dealing
with these issues. Such solutions will be a reflection of the culture.
Prior to the emergence of the organisational culture construct, organisational
climate was the dominant construct for describing the organisational
experience. Organisational climate can therefore generally be viewed as just
an older term for organisational culture (Hofstede et al., 1993). The
relationship between these two terms is however slightly more complex than
that. In studies of climate, the emphasis is on current state of organisations
and the cognitive aspects – attitudes and perceptions, of individual
organisational members. Organisational culture has a much deeper remit, as
can be seen from the preceding discussions. Climate has been described as an
artefact of culture (Schein, 2000). Payne (2000) even argued that it is possible
to claim that climate is a way of measuring culture to the extent that it
provides a useful generaliseable (although less accurate and specific)
description of an organisation that is comparable with other organisations.
The role of culture
56
Hofstede et al. (1993) saw climate as being a short-term state and culture a
longer-term state of an organisation. In an exposition of the relationships
between the culture and climate paradigms, Denison (1996) concluded that
the two research traditions should be viewed as differences in interpretation
rather than differences in the phenomenon. It is therefore safe to agree with
Hofstede et al. (1993) that organisational climate and culture are broadly
complimentary constructs.
3.3.1 Importance of culture
The culture that exists within an organisation is important for a number of
reasons. According to Thompson (1993) and also Kotter and Heskett (1992),
for an organisation to be effective, congruence must exist between the
organisation’s values, its resources and the environment. Indeed it is common
to find references to culture as an obstacle to change and problem resolution
(Bate, 1984). The culture within the organisation reflects in the way that
people perform tasks, set objectives and administer the necessary resources to
achieve these objectives (Thompson, 1993). It also affects the way people
make decisions, think, feel and act in response to the opportunities and
threats affecting the organisation (Thompson, 1993).
The fit between cultural characteristics and management practices is
considered to be another important factor in the successful implementation of
management practices (Erez and Gati, 2004). According to Mullins (1993), a
strong culture is crucial for successful management. It was noted in Deal and
Kennedy (1982) that a strong culture sets out the system of informal rules
which determines how people are to behave most of the time. A strong,
unique, and appropriate corporate culture, in the view of Tharp (2005), has
the ability to:
The role of culture
57
reduce uncertainty by creating a common way to interpret events and
issues;
create a sense of order in that members know what is expected;
create a sense of continuity;
provide a common identity and a unity of commitment; and
provide a vision of the future around which the company can rally.
Tharp (2005) also notes that organisational culture is now understood as an
asset that should be managed and that can be leveraged in support of
company goals. This is clearly in line with the school of thought that
considers culture to be a variable or something the organisation has.
For Schein (2000), where culture matters most is in its impacts on the ‘hard’
stuff like strategy and structure. An existing culture tends to constrain and
direct management behaviour, which subsequently affects overall
performance through the mechanism of day-to-day practices such as
decision-making, problem solving, and strategy formulation (Christensen and
Gordon, 1999). Svensson and Wood (2003) also speak of the ‘softer’ aspects
like business ethics which are a function of culture.
It manifests in folkways, mores, and the ideology to which organisation
members defer, as well as in the strategic choices made by the organisation as
a whole (Eldridge and Crombie, 1974). The choices organisational members
make will be contingent on their culture.
As argued earlier, organisations are communities of people with a mission,
and each organisation has its own core culture, character, nature and identity.
These basic characteristics are so fundamental and deep in hierarchy that they
tend to be much more powerful than business processes, financial systems,
business strategy, marketing plans, team behaviour and corporate
governance (Schneider, 2000). Culture defines appropriate behaviour,
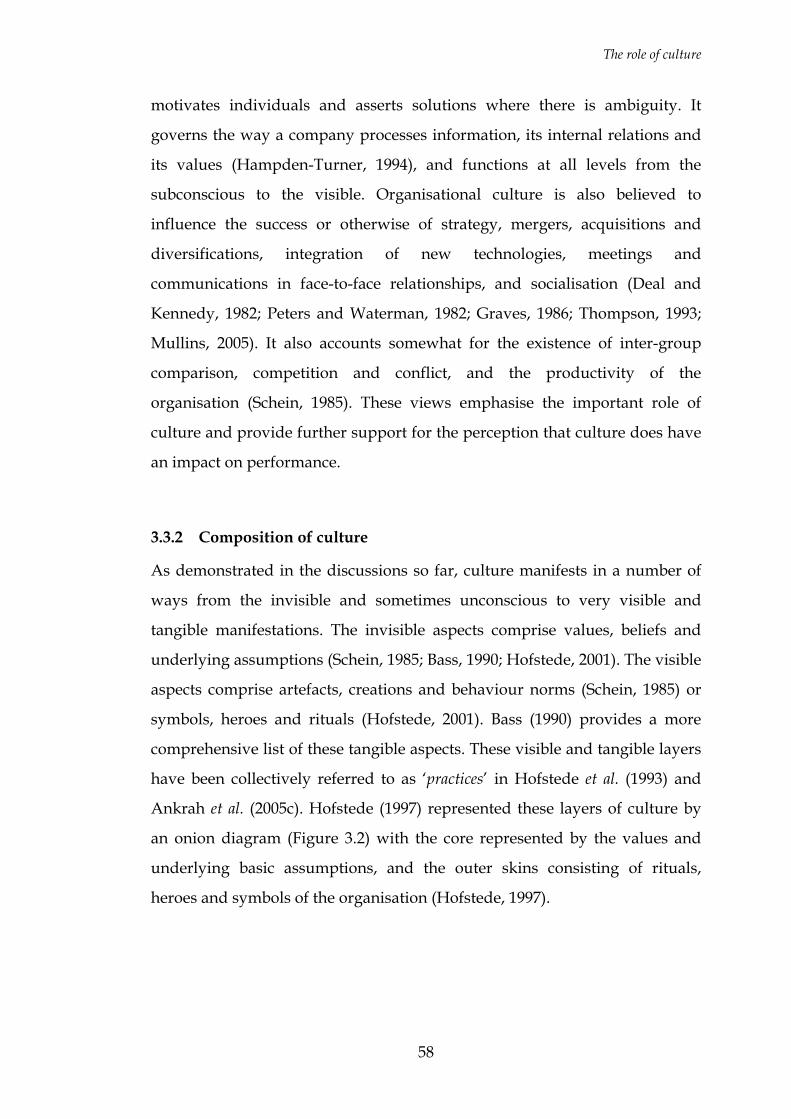
The role of culture
58
motivates individuals and asserts solutions where there is ambiguity. It
governs the way a company processes information, its internal relations and
its values (Hampden-Turner, 1994), and functions at all levels from the
subconscious to the visible. Organisational culture is also believed to
influence the success or otherwise of strategy, mergers, acquisitions and
diversifications, integration of new technologies, meetings and
communications in face-to-face relationships, and socialisation (Deal and
Kennedy, 1982; Peters and Waterman, 1982; Graves, 1986; Thompson, 1993;
Mullins, 2005). It also accounts somewhat for the existence of inter-group
comparison, competition and conflict, and the productivity of the
organisation (Schein, 1985). These views emphasise the important role of
culture and provide further support for the perception that culture does have
an impact on performance.
3.3.2 Composition of culture
As demonstrated in the discussions so far, culture manifests in a number of
ways from the invisible and sometimes unconscious to very visible and
tangible manifestations. The invisible aspects comprise values, beliefs and
underlying assumptions (Schein, 1985; Bass, 1990; Hofstede, 2001). The visible
aspects comprise artefacts, creations and behaviour norms (Schein, 1985) or
symbols, heroes and rituals (Hofstede, 2001). Bass (1990) provides a more
comprehensive list of these tangible aspects. These visible and tangible layers
have been collectively referred to as ‘practices’ in Hofstede et al. (1993) and
Ankrah et al. (2005c). Hofstede (1997) represented these layers of culture by
an onion diagram (Figure 3.2) with the core represented by the values and
underlying basic assumptions, and the outer skins consisting of rituals,
heroes and symbols of the organisation (Hofstede, 1997).
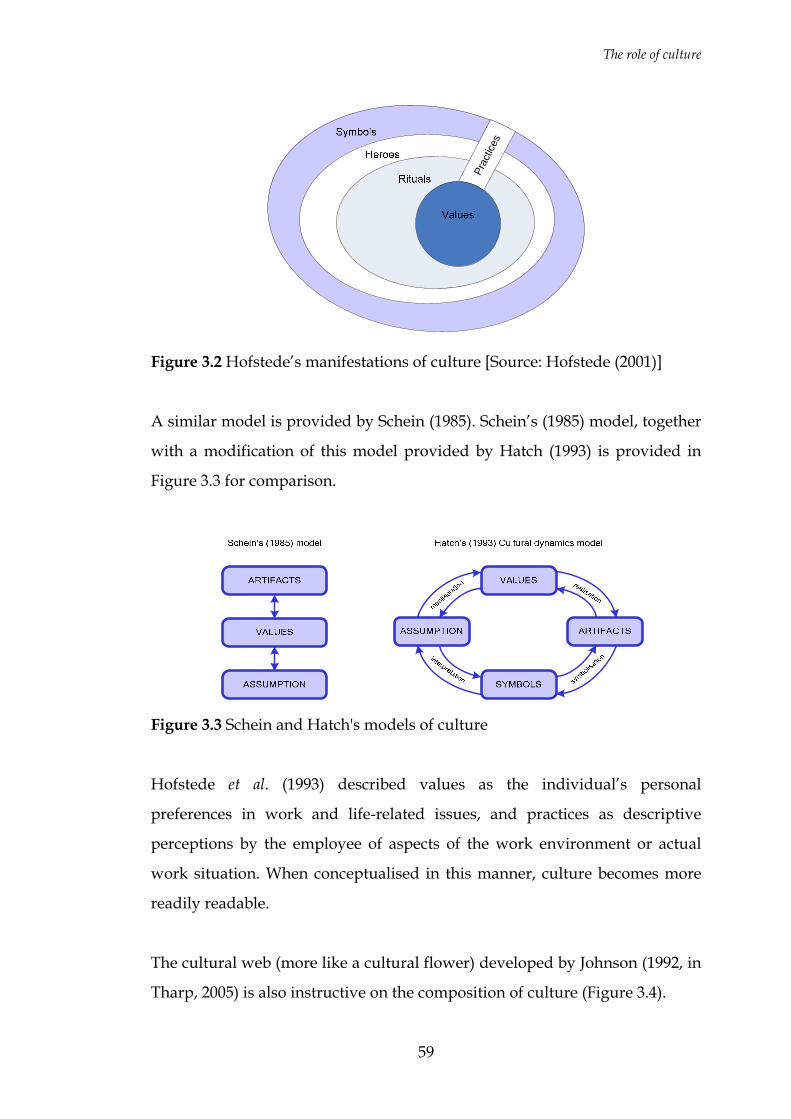
The role of culture
59
Prac
tices
Figure 3.2 Hofstede’s manifestations of culture [Source: Hofstede (2001)]
A similar model is provided by Schein (1985). Schein’s (1985) model, together
with a modification of this model provided by Hatch (1993) is provided in
Figure 3.3 for comparison.
Figure 3.3 Schein and Hatch's models of culture
Hofstede et al. (1993) described values as the individual’s personal
preferences in work and life-related issues, and practices as descriptive
perceptions by the employee of aspects of the work environment or actual
work situation. When conceptualised in this manner, culture becomes more
readily readable.
The cultural web (more like a cultural flower) developed by Johnson (1992, in
Tharp, 2005) is also instructive on the composition of culture (Figure 3.4).
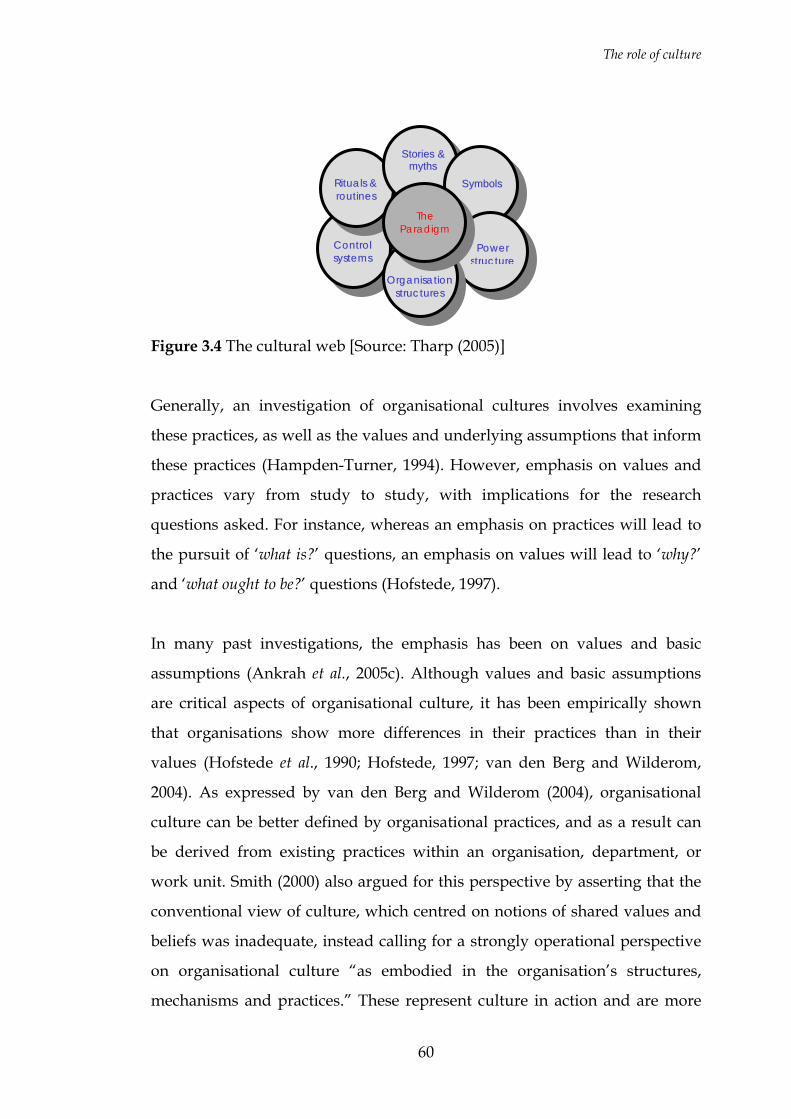
The role of culture
60
Figure 3.4 The cultural web [Source: Tharp (2005)]
Generally, an investigation of organisational cultures involves examining
these practices, as well as the values and underlying assumptions that inform
these practices (Hampden-Turner, 1994). However, emphasis on values and
practices vary from study to study, with implications for the research
questions asked. For instance, whereas an emphasis on practices will lead to
the pursuit of ‘what is?’ questions, an emphasis on values will lead to ‘why?’
and ‘what ought to be?’ questions (Hofstede, 1997).
In many past investigations, the emphasis has been on values and basic
assumptions (Ankrah et al., 2005c). Although values and basic assumptions
are critical aspects of organisational culture, it has been empirically shown
that organisations show more differences in their practices than in their
values (Hofstede et al., 1990; Hofstede, 1997; van den Berg and Wilderom,
2004). As expressed by van den Berg and Wilderom (2004), organisational
culture can be better defined by organisational practices, and as a result can
be derived from existing practices within an organisation, department, or
work unit. Smith (2000) also argued for this perspective by asserting that the
conventional view of culture, which centred on notions of shared values and
beliefs was inadequate, instead calling for a strongly operational perspective
on organisational culture “as embodied in the organisation’s structures,
mechanisms and practices.” These represent culture in action and are more
RRiittuuaallss && rroouuttiinneess
SSttoorriieess && mmyytthhss
TThhee
PPaarraaddiiggmm CCoonnttrrooll ssyysstteemmss
PPoowweerr ssttrruuccttuurree
OOrrggaanniissaattiioonn ssttrruuccttuurreess
SSyymmbboollss
The role of culture
61
credible reflections of the organisation’s culture than statements of values and
beliefs which may be out of step with culture as implemented (Smith, 2000).
Taken together, these arguments lead to the conclusion of Christensen and
Gordon (1999) that consistent and widespread practices are reflections of
organisational culture. Approaching culture through the study of
organisational practices is advantageous because practices are more readily
observable and measurable and can thus be compared across companies and
can be directly related to individual and organisational performance
(Christensen and Gordon, 1999). This approach is also consistent with
Fellows and Lui (2000) and Wilson (1999) who argued that behaviour
provides the active and dynamic expressions of culture and therefore
provides data through which culture may be studied.
The implication this has for defining organisational culture so that it can be
operationalised and employed in a framework for assessing the culture of
CPOs, is that rather than focusing so much on values, the emphasis must be
on practices. This argument is consistent with the definition proposed
previously in which organisational culture is seen as being embedded in the
solutions employed by CPOs in dealing with fundamental problems. ‘What
is?’ questions are therefore appropriate in this research context to identify
and draw out the practices or solutions that CPOs have evolved for dealing
with their problems. The values and underlying assumptions that govern
these practices or solutions can subsequently be inferred from these.
3.3.3 Diagnosing culture
Hampden-Turner (1994) and Denison and Mishra (1995) have argued that if
necessary and within certain limits, organisational culture is measurable and
describable. Diagnoses in this regard may be classified as being either
qualitative or quantitative.
The role of culture
62
3.3.3.1 Qualitative approaches to diagnosing culture
Qualitative methods have been the traditional approach adopted in classical
anthropological studies of culture which have sought to describe as
empathetically and as comprehensively as possible why and how members of
the culture go about their business. They employ ethnomethodological
methods which generally involve protracted periods of living within the
group and gathering data from within by interacting with people in as
natural a manner as possible and by observing the behaviour of the subjects
unobtrusively (Columbia Encyclopedia, 2005), and where appropriate, by the
analysis of documents. They are fundamentally interpretive (Geertz, 2001).
Schein (1985) prescribed one such method, referred to as “clinical iterative”
interviewing, for assessing organisational cultures.
Such ethnomethodological studies offer a very practical way of assessing
organisational culture and allow in-depth analysis to be undertaken. They
enable the researcher to capture very comprehensively, the ‘language’ and
‘meanings’ of the organisation with minimal bias on the outcome of the
investigation. Such studies inevitably raise, as pointed out by Hofstede (1997),
questions of reliability (would another observer have perceived the same
phenomena?) especially as the point of reference is always the researcher’s
own culture, and questions of generalisability (how does this case help to
understand other cases?). Whilst ethnomethodological approaches are useful
in the discovery of values and underlying assumptions of people (the essence
of culture), it has been shown that these values and underlying assumptions
are insensitive to differences between organisations within the same national
culture (Hofstede et al., 1993; Delobbe et al., 2002). Moreover such aspects,
which frequently exist at an unconscious level, are difficult to quantify
(Cooper, 1998; Columbia Encyclopedia, 2005). Although the methodology
may be appropriate for the bespoke diagnosis of the culture of an individual
organisation, it offers little help in comparative studies as the parameters
vary from organisation to organisation. It also has the disadvantage of being
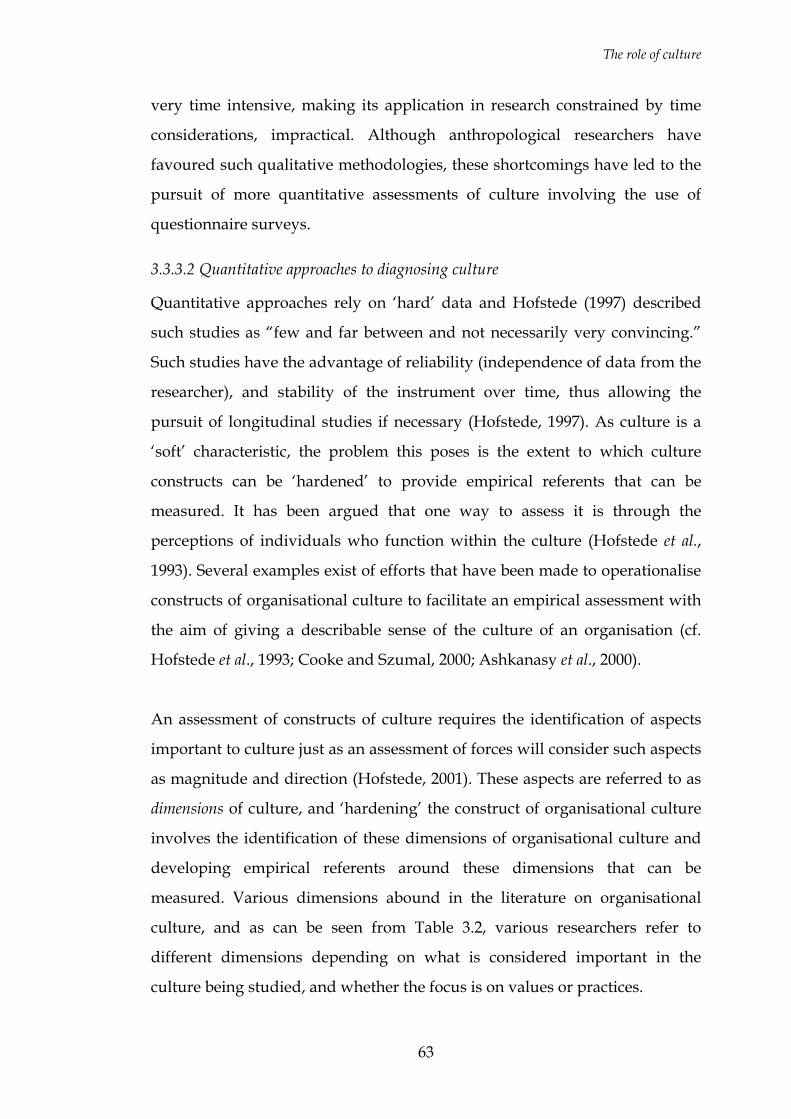
The role of culture
63
very time intensive, making its application in research constrained by time
considerations, impractical. Although anthropological researchers have
favoured such qualitative methodologies, these shortcomings have led to the
pursuit of more quantitative assessments of culture involving the use of
questionnaire surveys.
3.3.3.2 Quantitative approaches to diagnosing culture
Quantitative approaches rely on ‘hard’ data and Hofstede (1997) described
such studies as “few and far between and not necessarily very convincing.”
Such studies have the advantage of reliability (independence of data from the
researcher), and stability of the instrument over time, thus allowing the
pursuit of longitudinal studies if necessary (Hofstede, 1997). As culture is a
‘soft’ characteristic, the problem this poses is the extent to which culture
constructs can be ‘hardened’ to provide empirical referents that can be
measured. It has been argued that one way to assess it is through the
perceptions of individuals who function within the culture (Hofstede et al.,
1993). Several examples exist of efforts that have been made to operationalise
constructs of organisational culture to facilitate an empirical assessment with
the aim of giving a describable sense of the culture of an organisation (cf.
Hofstede et al., 1993; Cooke and Szumal, 2000; Ashkanasy et al., 2000).
An assessment of constructs of culture requires the identification of aspects
important to culture just as an assessment of forces will consider such aspects
as magnitude and direction (Hofstede, 2001). These aspects are referred to as
dimensions of culture, and ‘hardening’ the construct of organisational culture
involves the identification of these dimensions of organisational culture and
developing empirical referents around these dimensions that can be
measured. Various dimensions abound in the literature on organisational
culture, and as can be seen from Table 3.2, various researchers refer to
different dimensions depending on what is considered important in the
culture being studied, and whether the focus is on values or practices.
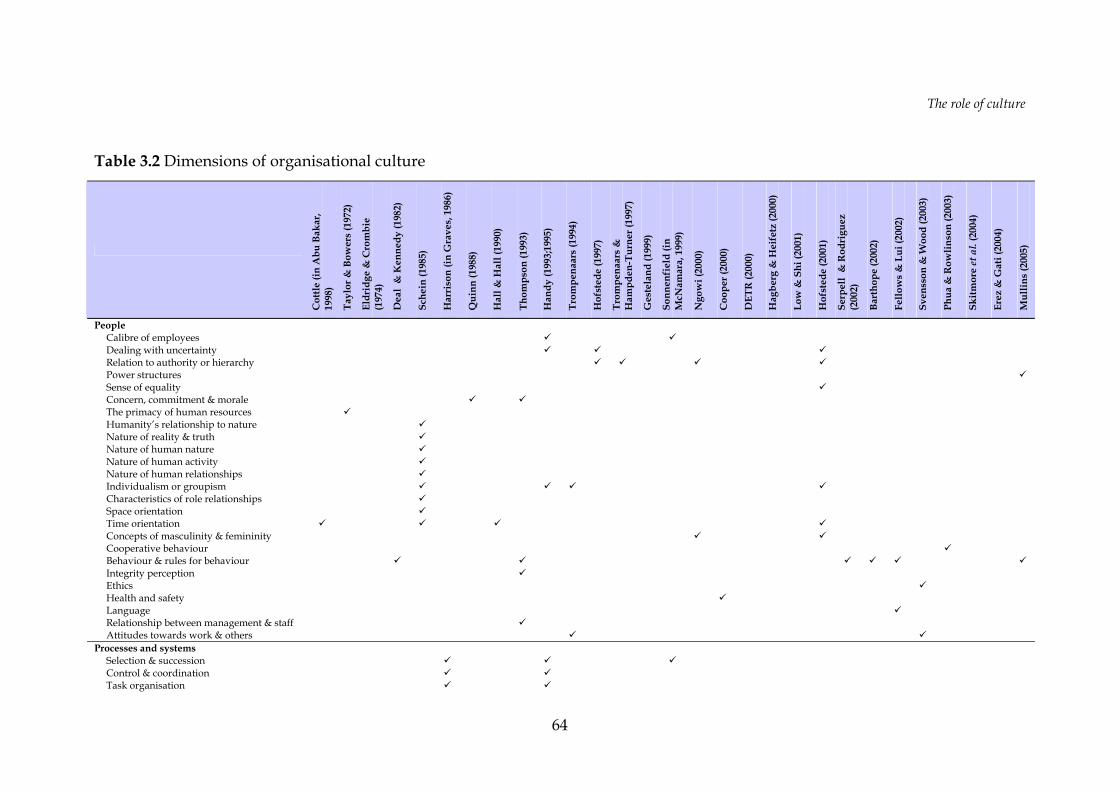
The role of culture
64
Table 3.2 Dimensions of organisational culture
Cot
tle (i
n A
bu B
akar
, 19
98)
Tayl
or &
Bow
ers
(197
2)
Eldr
idge
& C
rom
bie
(197
4)
Dea
l &
Ken
nedy
(198
2)
Sche
in (1
985)
Har
riso
n (in
Gra
ves,
198
6)
Qui
nn (1
988)
Hal
l & H
all (
1990
)
Thom
pson
(199
3)
Han
dy (1
993;
1995
)
Trom
pena
ars
(199
4)
Hof
sted
e (1
997)
Trom
pena
ars
&
Ham
pden
-Tur
ner (
1997
)
Ges
tela
nd (1
999)
Sonn
enfi
eld
(in
McN
amar
a, 1
999)
Ngo
wi (
2000
)
Coo
per (
2000
)
DET
R (2
000)
Hag
berg
& H
eife
tz (2
000)
Low
& S
hi (2
001)
Hof
sted
e (2
001)
Serp
ell
& R
odri
guez
(2
002)
Bart
hope
(200
2)
Fello
ws
& L
ui (2
002)
Sven
sson
& W
ood
(200
3)
Phua
& R
owlin
son
(200
3)
Skitm
ore
et a
l. (2
004)
Erez
& G
ati (
2004
)
Mul
lins
(200
5)
People Calibre of employees Dealing with uncertainty Relation to authority or hierarchy Power structures Sense of equality Concern, commitment & morale The primacy of human resources Humanity’s relationship to nature Nature of reality & truth Nature of human nature Nature of human activity Nature of human relationships Individualism or groupism Characteristics of role relationships Space orientation Time orientation Concepts of masculinity & femininity Cooperative behaviour Behaviour & rules for behaviour Integrity perception Ethics Health and safety Language Relationship between management & staff Attitudes towards work & others
Processes and systems Selection & succession Control & coordination Task organisation
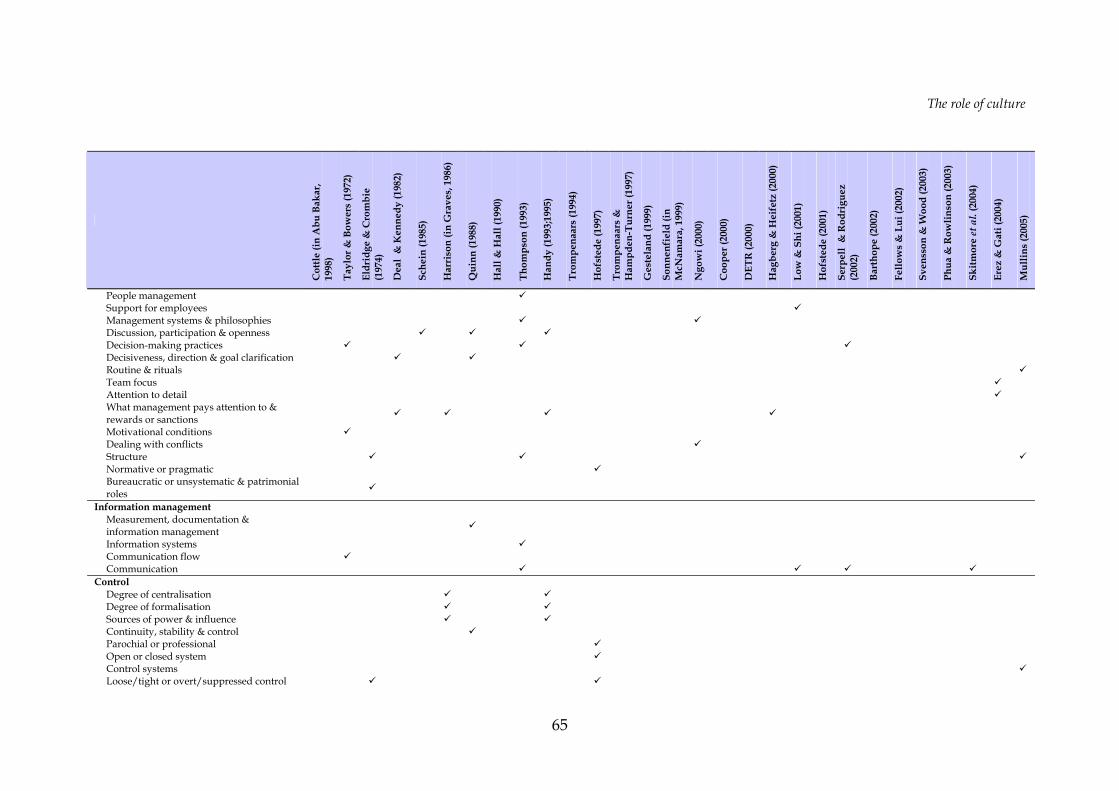
The role of culture
65
Cot
tle (i
n A
bu B
akar
, 19
98)
Tayl
or &
Bow
ers
(197
2)
Eldr
idge
& C
rom
bie
(197
4)
Dea
l &
Ken
nedy
(198
2)
Sche
in (1
985)
Har
riso
n (in
Gra
ves,
198
6)
Qui
nn (1
988)
Hal
l & H
all (
1990
)
Thom
pson
(199
3)
Han
dy (1
993;
1995
)
Trom
pena
ars
(199
4)
Hof
sted
e (1
997)
Trom
pena
ars
&
Ham
pden
-Tur
ner (
1997
)
Ges
tela
nd (1
999)
Sonn
enfi
eld
(in
McN
amar
a, 1
999)
Ngo
wi (
2000
)
Coo
per (
2000
)
DET
R (2
000)
Hag
berg
& H
eife
tz (2
000)
Low
& S
hi (2
001)
Hof
sted
e (2
001)
Serp
ell
& R
odri
guez
(2
002)
Bart
hope
(200
2)
Fello
ws
& L
ui (2
002)
Sven
sson
& W
ood
(200
3)
Phua
& R
owlin
son
(200
3)
Skitm
ore
et a
l. (2
004)
Erez
& G
ati (
2004
)
Mul
lins
(200
5)
People management Support for employees Management systems & philosophies Discussion, participation & openness Decision-making practices Decisiveness, direction & goal clarification Routine & rituals Team focus Attention to detail What management pays attention to & rewards or sanctions
Motivational conditions Dealing with conflicts Structure Normative or pragmatic Bureaucratic or unsystematic & patrimonial roles
Information management Measurement, documentation & information management
Information systems Communication flow Communication
Control Degree of centralisation Degree of formalisation Sources of power & influence Continuity, stability & control Parochial or professional Open or closed system Control systems Loose/tight or overt/suppressed control

The role of culture
66
Cot
tle (i
n A
bu B
akar
, 19
98)
Tayl
or &
Bow
ers
(197
2)
Eldr
idge
& C
rom
bie
(197
4)
Dea
l &
Ken
nedy
(198
2)
Sche
in (1
985)
Har
riso
n (in
Gra
ves,
198
6)
Qui
nn (1
988)
Hal
l & H
all (
1990
)
Thom
pson
(199
3)
Han
dy (1
993;
1995
)
Trom
pena
ars
(199
4)
Hof
sted
e (1
997)
Trom
pena
ars
&
Ham
pden
-Tur
ner (
1997
)
Ges
tela
nd (1
999)
Sonn
enfi
eld
(in
McN
amar
a, 1
999)
Ngo
wi (
2000
)
Coo
per (
2000
)
DET
R (2
000)
Hag
berg
& H
eife
tz (2
000)
Low
& S
hi (2
001)
Hof
sted
e (2
001)
Serp
ell
& R
odri
guez
(2
002)
Bart
hope
(200
2)
Fello
ws
& L
ui (2
002)
Sven
sson
& W
ood
(200
3)
Phua
& R
owlin
son
(200
3)
Skitm
ore
et a
l. (2
004)
Erez
& G
ati (
2004
)
Mul
lins
(200
5)
Control or influence of lower levels Technology
Technological readiness to change Technology
Business focus Growth, external support & resource acquisition
Profit/impact, productivity & accomplishment
Process or results orientation Employee or job/task orientation Outcome orientation Strategies Target orientation Deal or relationship focus Risk-taking Client or market focus Reaction of suppliers & customers
Learning and innovation Innovation Insight, innovation & adaptation Learning Speed & degree of feedback
Environment Sustainability Environmental awareness
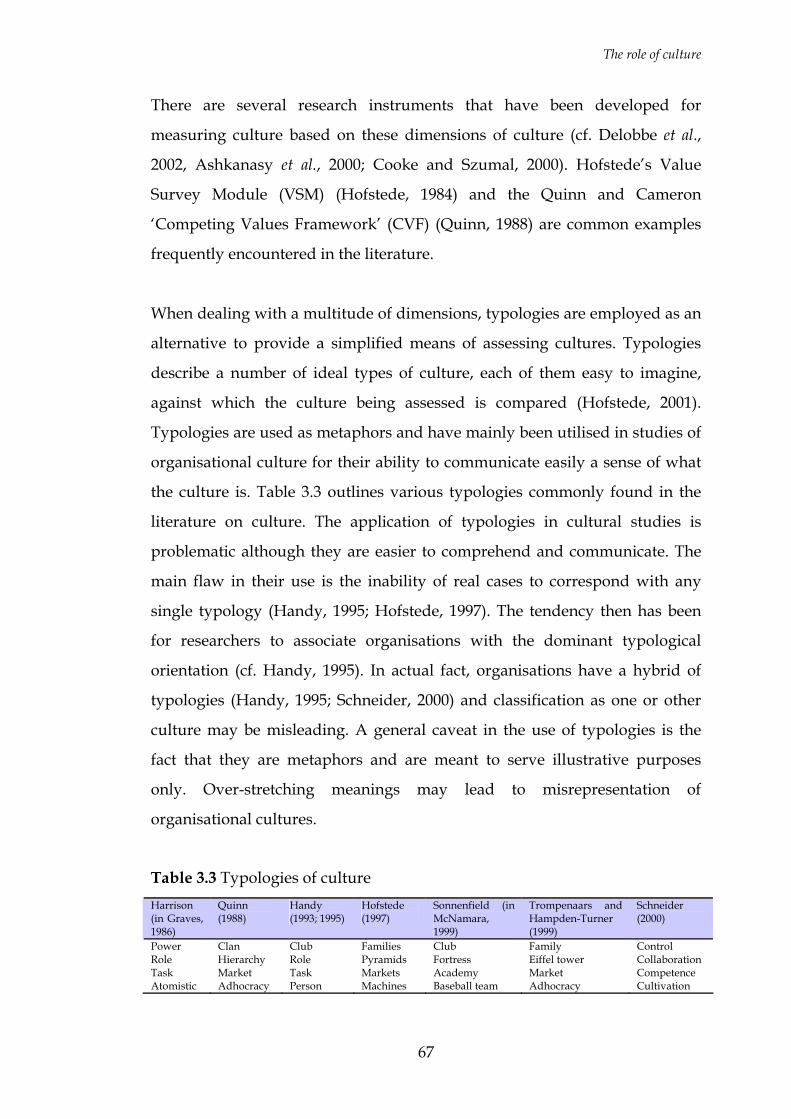
The role of culture
67
There are several research instruments that have been developed for
measuring culture based on these dimensions of culture (cf. Delobbe et al.,
2002, Ashkanasy et al., 2000; Cooke and Szumal, 2000). Hofstede’s Value
Survey Module (VSM) (Hofstede, 1984) and the Quinn and Cameron
‘Competing Values Framework’ (CVF) (Quinn, 1988) are common examples
frequently encountered in the literature.
When dealing with a multitude of dimensions, typologies are employed as an
alternative to provide a simplified means of assessing cultures. Typologies
describe a number of ideal types of culture, each of them easy to imagine,
against which the culture being assessed is compared (Hofstede, 2001).
Typologies are used as metaphors and have mainly been utilised in studies of
organisational culture for their ability to communicate easily a sense of what
the culture is. Table 3.3 outlines various typologies commonly found in the
literature on culture. The application of typologies in cultural studies is
problematic although they are easier to comprehend and communicate. The
main flaw in their use is the inability of real cases to correspond with any
single typology (Handy, 1995; Hofstede, 1997). The tendency then has been
for researchers to associate organisations with the dominant typological
orientation (cf. Handy, 1995). In actual fact, organisations have a hybrid of
typologies (Handy, 1995; Schneider, 2000) and classification as one or other
culture may be misleading. A general caveat in the use of typologies is the
fact that they are metaphors and are meant to serve illustrative purposes
only. Over-stretching meanings may lead to misrepresentation of
organisational cultures.
Table 3.3 Typologies of culture Harrison (in Graves, 1986)
Quinn (1988)
Handy (1993; 1995)
Hofstede (1997)
Sonnenfield (in McNamara, 1999)
Trompenaars and Hampden-Turner (1999)
Schneider (2000)
Power Role Task Atomistic
Clan Hierarchy Market Adhocracy
Club Role Task Person
Families Pyramids Markets Machines
Club Fortress Academy Baseball team
Family Eiffel tower Market Adhocracy
Control Collaboration Competence Cultivation

The role of culture
68
Dimensions are therefore the preferable option in assessing organisational
culture. However, as demonstrated by Hofstede (1984), a weakness in the use
of these dimensions is the fact that they are subject to the influence of the
researcher and tend to be value laden. This implies that dimensions
developed in one national or industry context may not necessarily be
appropriate in another setting. However, where appropriate dimensions can
be identified, they represent the most realistic way of undertaking cross-
cultural comparative studies. Typologies may be used to compliment these
dimensions, but for this to be done, cases must be scored unambiguously
using indexes and scales and sorted into clusters with similar scores. These
clusters can then form the basis of the typologies (Hofstede, 1997).
Quantitative approaches permit data collection across a large number of
organisations, and this facilitates cross-organisational analysis. Their
usefulness in this direction therefore makes them worth considering when
contemplating comparative studies.
Just as in the case of the qualitative approaches, these quantitative
approaches have limitations. It has been argued in many quarters that they
are at best superficial, not giving enough depth to aid the understanding of
the underlying assumptions that define culture. It is believed that most
questionnaire measurements of culture have actually only provided an
assessment of organisational climate as opposed to the actual organisational
culture (Cooper, 1998; Hofstede, 2001). However as argued previously,
climate is itself a useful way of assessing culture (Payne, 2000). Such
quantitative studies, irrespective of the measuring approaches and
instruments, make culture discussible (Hale, 2000) and provide an
opportunity to maximise the values of systematisation, repeatability and
comparability.
The role of culture
69
3.3.3.3 An alternative approach to diagnosing culture
To circumvent the limitations of either approach, it is also possible to
synthesise the two approaches by starting with a qualitative orientation,
followed by a quantitative verification (Hofstede et al., 1990) or vice versa.
Hofstede et al.’s (1990) application of in-depth interviews and “paper-and-
pencil” surveys, and a similar study reported in van den Berg and Wilderom
(2004) are instructive, and provide examples of what can be achieved through
a synthesis of qualitative and quantitative methodologies. Within
construction management research, the evidence from literature suggests that
such research on organisational culture, which incorporates both qualitative
and quantitative elements, is lacking. Research in this vain is not only
feasible, as seen in Hofstede et al. (1990) and van den Berg and Wilderom
(2004), but also necessary.
3.3.4 Implications for current research
It is clear from the literature that the phenomenon of culture does exist and
does operate at the organisational level, implying that an investigation into
this phenomenon within the context of a CPO is a viable line of enquiry. The
review of literature on culture has also demonstrated that there is sound basis
for hypothesising that culture does have an effect on performance outcomes.
The theoretical arguments presented of how culture may be conceived are
summarised in Figure 3.5. This figure captures the different
conceptualisations of culture from an anthropological and organisational
perspective, and the different types of enquiry that the different conceptions
lead to. It also shows the composition of culture which is split between
practices and values/underlying assumptions, with practices aligned with
the “culture as variable” perspective and values/underlying assumptions
more closely aligned with the “root metaphor” perspective (Smircich, 1983).
According to Smircich (ibid) organisational researchers aligned with the
“culture as variable” perspective tend to be more concerned with prediction,
The role of culture
70
generalisability, causality, and control. These are key issues with which this
research is concerned especially as the aim is to examine cultures across
construction projects and explore their relationships with outcomes. A
“culture as variable” perspective (ibid) is thus appropriate in this research.
It can be argued that this mode of enquiry should be a precursor to any
enquiry into the more fundamental issues of meaning and the processes by
which organisational life is possible which is the concern of those researchers
aligned with the “root metaphor” perspective (Smircich, 1983). In other
words, before starting to look for underlying assumptions or meanings and
trying to draw cognitive maps it is important to know firstly what the culture
is, as manifested in practices.
As shown in Figure 3.5 which summarises the implications for questions
asked and sources of cultural data, the research will focus on ‘what is?’
questions, to draw out responses on existing practices, as opposed to ‘what
ought to be?’ or ‘why?’ questions which lead to responses on preferences and
values. In asking these ‘what is?’ questions, the research will examine those
solutions adopted in addressing problems as manifested in organisational
structures, information and control systems, organisational processes,
behaviours, myths, legends, stories, and charters, among other aspects
(Taylor and Bowers, 1972; Schein, 1985; Thompson, 1993).
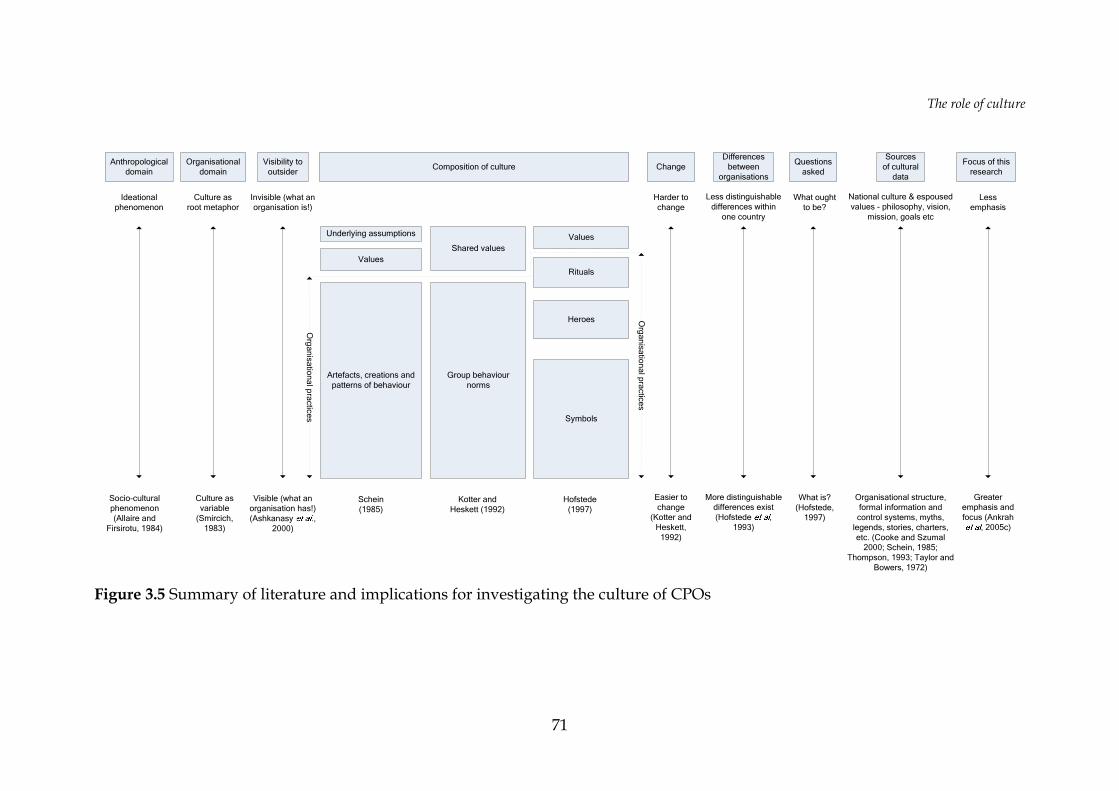
The role of culture
71
Underlying assumptions
Values
Artefacts, creations and patterns of behaviour
Shared values
Group behaviour norms
Rituals
Heroes
Symbols
Values
Visibility to outsider
Composition of culture ChangeDifferences
between organisations
Sources of cultural
data
Organisational domain
Questions asked
Focus of this research
Invisible (what an organisation is!)
Visible (what an organisation has!) (Ashkanasy .,
2000)
Schein (1985)
Kotter and Heskett (1992)
Hofstede (1997)
Organisational practices
Harder to change
Less distinguishable differences within
one country
Easier to change
(Kotter and Heskett,
1992)
More distinguishable differences exist (Hofstede ,
1993)
Organisational structure, formal information and control systems, myths,
legends, stories, charters, etc. (Cooke and Szumal
2000; Schein, 1985; Thompson, 1993; Taylor and
Bowers, 1972)
Culture as variable
(Smircich, 1983)
National culture & espoused values - philosophy, vision,
mission, goals etc
Culture as root metaphor
What ought to be?
Less emphasis
What is? (Hofstede,
1997)
Greater emphasis and focus (Ankrah
, 2005c)
Organisational practices
Anthropological domain
Socio-cultural phenomenon (Allaire and
Firsirotu, 1984)
Ideational phenomenon
Figure 3.5 Summary of literature and implications for investigating the culture of CPOs

The role of culture
72
3.4 CULTURE WITHIN THE CONSTRUCTION INDUSTRY
According to Newcombe (2003), the stakeholders within the project coalition
interact with the project in two primary arenas; cultural and political, with
the cultural arena represented by the ideology or shared values of the project
participants. Cultural issues are therefore always at the fore (Ofori, 2000). In
trying to give more flesh to this cultural arena Abeysekera (2002) defined
culture within construction to be about the “characteristics of the industry,
approaches to construction, competence of craftsmen and people who work
in the industry, and the goals, values and strategies of the organisations they
work in”. In essence, culture within construction is about what is carried out,
how and when it is done, who is involved and why certain things are done
the way they are. These perceptions of culture as applied to construction are
consistent with the earlier generic definitions of culture posited by the likes of
Bodley (1994). The insight derived from Abeysekera (2002) is particularly
useful as it fulfils the need to see culture through the eyes of construction
industry members.
As demonstrated from the discussion so far, culture must be an important
consideration for every organisation in every industry. In construction, this
becomes more critical because of the nature of contracting,
internationalisation of procurement, joint venturing, and the transfer and
implementation of innovative philosophies and practices such as partnering,
JIT management, Supply Chain Management and TQM from relatively more
successful industries such as manufacturing and retail (Riley and Clare-
Brown, 2001). As aptly stated by Hall (1999), the project-based arrangements
that characterise the production of the built environment make the potential
impact of culture even more pronounced than in any other industry.
The role of culture
73
A number of important contributions have been made in support of this
argument. Maloney and Federle (1990) for instance pointed out the fact that
the culture of a construction organisation was a primary determinant of
performance within that organisation. It was also found to have an influence
on the degree of participation and openness, approaches to decision-making,
the quality of communications and working relationships (Hall, 1999; Low
and Shi, 2001; Skitmore et al., 2004), rendering otherwise successful managers
and organisations ineffective and frustrated when working across cultures.
They demonstrated that any organisation that wanted to carry out or manage
a construction project successfully in another country had to understand the
culture of the host country clearly. According to Ofori (2000) culture had an
influence on the choice of foreign parties in joint ventures. Ngowi (2000) also
showed the difficulties associated with the implementation of such foreign
philosophies as TQM in developing countries, with their successful
implementation usually requiring changes to the shared assumptions, frames
of reference and understandings that most organisations have developed.
This is because these philosophies and practices are invariably embedded
with their own set of cultural beliefs, norms, values and assumptions (cf.
Riley and Clare-Brown, 2001). Similar findings were also reported in Pant et
al. (1996), although in this case the emphasis was on the incompatibility of
imported project organisational structures with local attitudes and values in
Nepal.
Culture has also been found to be a potential source of competitive advantage
by some researchers, especially in the face of increasing globalisation.
Through a survey of Australian contractors working internationally, Jefferies
et al. (2002) found cultural awareness to be an element of competitive
advantage.
The cases of the Bangkok Expressway extension project (Handley, 1997;
Masaoka, 2003) and the rebuilding of the Croatian motorway from Zagreb to

The role of culture
74
Split following years of war (Eaton Consulting Group Inc., 2002), also provide
further evidence that besides institutional gaps, cultural gaps hamper the
efficient execution of projects. In the former case for instance, cultural
differences between the Japanese contractor Kumagai Gumi, their local
partners, and the client influenced project delivery and eventual outcomes. In
the latter case also, which involved nine different nation-state cultures and
two starkly different corporate cultures, the human interaction elements
tended to detract focus from either schedule or budget.
At the project level, Soetanto et al. (1999) also found that quality of
interrelationships between project participants ultimately determines overall
project performance and individual participant performance. Although these
interrelationships were not examined within the context of research into
culture, it is reasonable to infer that culture must be an important factor. It
also has an influence on the propensity for litigation (Fenn et al., 1997; Phua
and Rowlinson, 2003), and the attitudes and behaviours towards such aspects
as health and safety (Cooper, 2000).
These influences can lead to positive or negative outcomes (Hampden-
Turner, 1994; Handy, 1995), and to this extent culture merits serious
consideration. However, research into these issues within the construction
research community has been very limited and disparate (Ankrah and
Proverbs, 2004). Whilst some industries have had the benefit of research
drawing from the general principles and models espoused by culture
researchers for industry-specific research, for instance food retail (Ogbonna
and Harris, 2002) and manufacturing and services (Guest et al., 2003), quite a
significant body of the existing literature on culture in construction tends to
be anecdotal. Barthorpe et al. (2000) for instance presented a profile of the UK
construction industry, citing the hierarchical structure, wage structure and
confrontational nature of contracting as factors setting the tone for the culture
of the industry, but failed to produce any systematic research to justify these
The role of culture
75
assertions or to show the extent to which these factors impact the culture and
output of the industry.
This and many other literature including renowned construction industry
reports such as Latham (1994) and Egan (1998) have highlighted the more
negative aspects of culture within the construction industry, in particular
traits such as being litigious, antagonistic, dangerous and dirty, sexist and
discriminatory (cf. Latham, 1994; Egan, 1998; Barthope et al., 2000; Duncan et
al., 2002; Loosemore, 2002; Rooke et al., 2004). This has fuelled the negative
stereotyping of the culture of the construction industry. Whilst culture has a
wider scope than suggested by these stereotypes (cf. Abeysekera, 2002), there
is little by way of systematic research into culture to show what the full extent
of the culture of the industry is, and to examine empirically, the extent to
which it affects the output of the industry. As Barthorpe et al. (2000)
suggested, this provides a fascinating field of study of the industry within the
context of culture.
3.5 CULTURE RESEARCH IN CONSTRUCTION – A REVIEW
Despite the established need for research in this field, the state of research on
culture in the construction industry is generally still at the pioneering stage
(Serpell and Rodriguez, 2002). The main focus of research into the role and
impact of culture in construction is reported by Fellows and Seymour (2002)
as being two-fold, namely:
“National differences as they affect efforts to change industry practice
in the country concerned or as they affect international collaboration;
and
The role of culture
76
Occupational and organisational differences, how they affect
receptivity to new practices and technologies, and inter-firm
collaboration.”
Other issues being covered in research, though to a lesser extent, include the
linking of culture with power and the exploration of negative effects of
cultural homogenisation, and methodologies associated with research in
culture (Fellows and Seymour, 2002).
3.5.1 Cross-cultural research
Indeed a significant proportion of the research uncovered on culture in
construction is on national differences and their potential effects on project
delivery. For instance Abu Bakar (1998) studied the extent to which Western
and Eastern values have shaped the organisational culture and management
practices of Malaysian contractors, and Hall (1999) looked at the challenges
different cultures posed to expatriate staff working abroad and the training
and support made available to them by their organisations. The cultural
dimension was found to be an important factor whose effects were difficult to
quantify but indisputable, and that inadequate strategic approaches were
adopted by construction firms in dealing with this dimension. The research
adopted both quantitative and qualitative approaches.
Pant et al. (1996) provided an interesting piece of research on culture also
addressing the effects of national differences in cross-cultural working
environments. This was a quantitative study that sought to compare the
bureaucratic orientation of ‘Western’ managers and Nepalese managers, and
the bureaucratic orientation of project-based and non project-based
organisations. Although bureaucracy represents a significant aspect of
culture, it is only one of several dimensions along which differences may
exist. As the research provided no theoretical basis for focusing on
The role of culture
77
bureaucratic orientation it is open to the criticism of being too narrow,
although some might argue like Geetz (1973, in Keesing, 1974) that narrow is
better. A similar study was also conducted by Phua and Rowlinson (2004),
although in this case, the study was more firmly grounded theoretically.
Drawing on social identity theory, this study focused on individualist-
collectivist orientations of Chinese and Anglo-Saxon senior managers and the
effects of these orientations on inter-organisational differentiation and
consequently on in-group favouritism and out-group discrimination.
Another study of culture within this same context is reported in Skitmore et
al. (2004). This was in fact a report of two studies conducted simultaneously
examining cultural diversity among ‘Far Eastern’ and ‘Anglo’ construction
project participants and its impact on intercultural communication. Ngowi
(2000) also found that culture had a profound influence on the
implementation of management philosophies and practices (like TQM) which
were developed in other contexts, because these management philosophies
and practices were already embedded with cultural beliefs, norms, values
and assumptions that were not compatible with the new context into which
they were being introduced. Unlike the previous studies discussed, this was a
qualitative study delving into TQM implementation and the cultural barriers
in Botswana. Abeysekera (2002) developed a conceptual framework to aid
understanding of the nature of culture in the international construction
context, through literature surveys and interviews. There are other similar
cross-cultural studies of this same ilk (cf. Low and Shi, 2001). Although all
these studies are conducted in different countries and address different
issues, they demonstrate abundantly that there are insights that can be drawn
about cultural diversity and its effects in a multi-cultural project context.
There are many lessons for managing multi-cultural projects. Many of such
cross-cultural studies rely on frameworks developed by the likes of
Trompenaars and Hampden-Turner (1997) and Hofstede (2001) as the basis
for evaluating cultural differences, implying that they automatically retain
The role of culture
78
the weaknesses inherent in those frameworks some of which are identified in
Hofstede (2001).
3.5.2 Occupational and organisational differences
Among those studies relating to occupational and organisational differences,
notable pieces of research undertaken include that of Serpell and Rodriguez
(2002) which presented the findings of a research investigating the critical
cultural elements of construction firms and the strategic action areas that
could potentially influence these elements. This was a qualitative study based
only on one case study raising questions about the generalisability of the
findings. Other researchers who have also favoured this qualitative
ethnographic approach which is rooted in anthropology include Dainty et al.
(2002), Duncan et al. (2002), Loosemore (2002), Rooke and Seymour (2002),
and Rooke et al. (2004). These approaches typically involve participant
observation or in-depth interviews where the main aim is for the researcher
to either learn the culture in the same way that members of that culture do or
by having in-depth discussions with informants (Rooke and Seymour, 2002).
As has been noted previously, these approaches do not facilitate comparison
of cultures across organisations. Different researchers would also observe and
draw different conclusions, making the findings difficult to generalise.
Moreover, according to Rooke and Seymour (2002) there are very few of such
ethnographic studies, and even where they exist, they tend to be theoretical,
and as a result fail to describe the main features of the construction industry
culture.
In trying to overcome these shortcomings of the qualitative approaches, a
number of attempts have been made at assessing the cultures within
construction quantitatively. Here also, the research is limited. The limited
quantitative research undertaken in this area have mainly involved the direct
application of generic organisational behaviour frameworks such as the
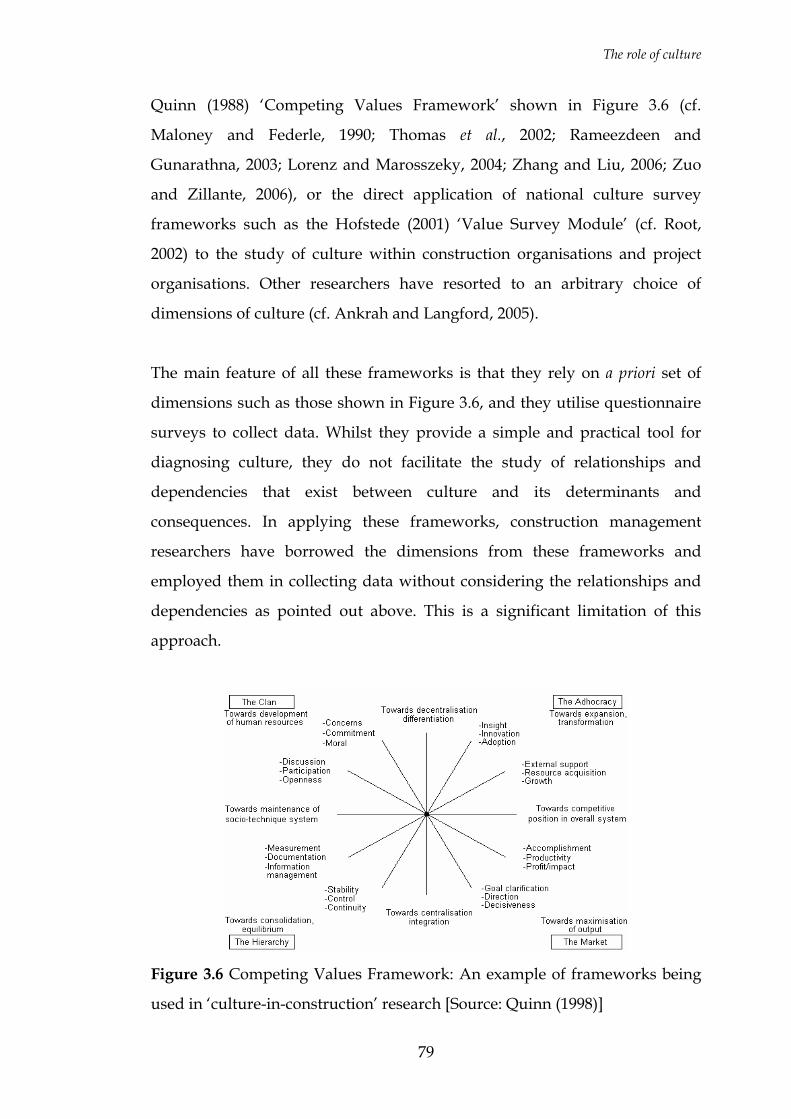
The role of culture
79
Quinn (1988) ‘Competing Values Framework’ shown in Figure 3.6 (cf.
Maloney and Federle, 1990; Thomas et al., 2002; Rameezdeen and
Gunarathna, 2003; Lorenz and Marosszeky, 2004; Zhang and Liu, 2006; Zuo
and Zillante, 2006), or the direct application of national culture survey
frameworks such as the Hofstede (2001) ‘Value Survey Module’ (cf. Root,
2002) to the study of culture within construction organisations and project
organisations. Other researchers have resorted to an arbitrary choice of
dimensions of culture (cf. Ankrah and Langford, 2005).
The main feature of all these frameworks is that they rely on a priori set of
dimensions such as those shown in Figure 3.6, and they utilise questionnaire
surveys to collect data. Whilst they provide a simple and practical tool for
diagnosing culture, they do not facilitate the study of relationships and
dependencies that exist between culture and its determinants and
consequences. In applying these frameworks, construction management
researchers have borrowed the dimensions from these frameworks and
employed them in collecting data without considering the relationships and
dependencies as pointed out above. This is a significant limitation of this
approach.
Figure 3.6 Competing Values Framework: An example of frameworks being
used in ‘culture-in-construction’ research [Source: Quinn (1998)]
The role of culture
80
Schein (2000) has also described this use of a priori set of dimensions as
objectionable as it does not allow the net to be cast widely enough. However
it is also a fact that without a specified set of dimensions, and without the
strategic focus they provide (Kotter and Heskett, 1992 in Schneider (2000)), it
will not be possible to undertake comparative studies. Indeed the studies
described above are very instructive to the extent that they make culture
discussible and comparable along certain specific dimensions.
Another major criticism with the use of these frameworks is the fact that all
existing frameworks are context specific (Hofstede, 2001; Ankrah et al., 2005c),
and since none of these frameworks were developed within a construction
context, it can be argued that the dimensions they propose may not reflect the
realities of the CPO which has characteristics significantly different from
other organisations. In short, these frameworks may fail to reveal the culture
of project organisations along relevant dimensions of culture.
A very useful framework developed with the construction project context in
mind is that in Kumaraswamy et al. (2002). This framework focuses on the
determinants of project culture and incorporates the peculiarities of the
construction industry making it possible to understand how the culture
within a CPO develops. Unlike the other frameworks applied in construction
management research, it does not however specify dimensions along which
the culture that develops is likely to manifest and therefore provides limited
help in diagnosing culture.
3.5.3 Other related research
A number of studies have also targeted specific aspects of culture. Nicolini
(2002) for instance developed the concept of “project chemistry”. Lui (2002)
explored “harmony” within the context of construction projects. Although the
discussions of appropriate research approaches for investigating cultural

The role of culture
81
phenomenon like harmony are insightful, Lui (ibid) failed to demonstrate
these in practice. Kadefors (2004) examined trust in project relationships in an
article that, though insightful, was also fundamentally theoretical. There are
also the usual collection of articles purporting to offer suitable frameworks
for culture research in construction (Kumaraswamy et al., 2002), those
discussing research methodologies (cf. Tijhuis, 2001), and those which are in
essence just reviews (cf. Barthorpe et al., 2000; Fellows and Lui, 2002).
These articles together represent the range of studies focusing on the national,
organisational and project perspectives of culture and how potentially, they
affect attitudes and approaches to work and relationships on projects. These
studies reflect the disparity in this research domain. They also reflect the
limited research into the phenomenon of culture and its potential influence
on the construction process. Insightful though these studies are, they still
leave many fundamental questions unanswered. From a project perspective,
questions relating to the relevant dimensions of culture to be assessed in
research, appropriate and rigorous research approaches, what the culture of
the industry is, and the relationship between culture and project outcomes
inter alia are all not fully addressed.
3.6 IMPLICATIONS FOR FURTHER RESEARCH
The paucity of research on culture in construction highlighted by the likes of
Hall (1999) and Phua and Rowlinson (2004) implies a wide scope of
possibilities for further research in this genre. Fundamentally, research needs
to be undertaken to reveal the cultural orientation of construction project
organisations. Such studies must be on-going in view of the transient and
dynamic nature of culture (Svensson and Wood, 2003). Findings from such
studies will throw light on some of the subtle motivations that shape the
behaviour of participants and the nature of the industry. Such studies will
The role of culture
82
also make it possible to assess the changes in culture over time. As pointed
out by Maloney and Federle (1990) and Serpell and Rodriguez (2002), one of
the possible benefits of measuring culture is that it makes it possible to assess
the success or otherwise of various interventions to change culture. For this to
be done, there is a need to develop an appropriate and theoretically sound
framework, incorporating dimensions of culture that are relevant to the
construction project context. As has been shown from the literature reviewed,
the existing frameworks are inadequate in this respect.
There is also potential for investigating the impact of culture on performance
outcomes especially at the project level. An appreciation of how culture, in
whatever form; national, organisational or occupational, affects the
competitiveness, profitability and performance of project organisations
within the industry will help with the process of implementing changes in
culture and organisational structures. Since such research is generally lacking,
as demonstrated by the review, studies exploring such relationships will
undoubtedly be beneficial to the industry. According to Tijhuis (2001),
construction industry participants need to become more aware of the
importance of this phenomenon and its manifestation and impact “on the
process and product of construction business.” Tijhuis (2001) calls for
stimulation of this awareness through further research based on the
continuous improvement and adaptation of existing frameworks.
Xiao and Proverbs (2003) pointed out that the overall performance
improvement agenda of the construction industry requires improvements in
products (right first time), the delivery (in terms of quality, cost and time),
and the sustainable development of construction firms (profitability and
competitiveness). To the extent that culture directly or indirectly, as implied
by the review, has a significant influence on all these elements and by
extension the performance of the industry as a whole, culture merits
systematic research to explore the nature and extent of such influence.

The role of culture
83
3.7 SUMMARY
The consensus of views, established through the review of culture, suggests
that culture comprises the values and system of meanings peculiar to a group
of people, that are learned and shared by all the individuals in the group
through dealing with the basic problems of life and through their interaction
with the contextual factors relating to the environment in which they live.
Culture therefore has the ability to shape the behaviour of, not just
individuals, but groups of people as in organisations, industries and
countries. This innate ability of culture to shape behaviour has particular
relevance for the construction industry because of the industry’s peculiar
nature of contracting and product delivery, requiring the cooperation of a
myriad of participants who sometimes have different and conflicting
objectives. Unfortunately, for a long time, its importance has been
understated and references made about its influence have been mainly
anecdotal. Although many of the inexplicable construction industry ills have
been attributed to this phenomenon, not much has been shown by way of
formalised research into culture to show the extent of its impact.
This trend has been changing over the past decade, particularly with the
publication of landmark reports such as Latham (1994) and Egan (1998)
which made strong cases about the potential of culture to undermine
performance. Together with the successes of other industries, which the
construction industry has sought to emulate, these reports have raised
awareness of the importance of culture in construction. This growing
awareness is evidenced by the increasing research interest and publications
on culture and related issues, though much of this remains anecdotal.
Research on culture in construction has been focused on national differences
as they affect industry practice and international collaboration, and
occupational and organisational differences as they affect receptivity to new

The role of culture
84
practices and inter-firm collaboration (Fellows and Seymour, 2002). However,
there is still relatively a lot more to be done. Fundamental questions of what
the cultures of CPOs are and what impacts these cultures have on
performance outcomes are yet to be investigated. As pointed out by Tijhuis
(2001), construction industry participants need to become more aware of the
importance of this phenomenon and its manifestation and impact “on the
process and product of construction business.” This can only be achieved
through research, and for this to be undertaken it is necessary to develop
appropriate frameworks based on continuous improvement and adaptation
of existing frameworks (Tijhuis, 2001). The next chapter is devoted to the
development of such a framework for this research, and indeed for any other
systematic research into the culture of the construction industry; research that
is essential in the quest for performance improvement in the construction
industry.
85
CHAPTER 4: CULTURE AND PERFORMANCE – A CONCEPTUAL FRAMEWORK
4.0 INTRODUCTION
It was shown in the preceding chapter that there are grounds for
hypothesising that culture does have an impact on performance, and that this
relationship can be captured empirically. In order to investigate
systematically this empirical relationship between culture and performance, it
is necessary to have a conceptual framework that brings together in a logical
manner all the essential aspects to be investigated, and provides appropriate
parameters and points of reference for investigating culture within a
construction project context. This chapter focuses on the development of such
a conceptual framework and on the development of empirical referents to aid
the development of appropriate hypotheses, data collection and hypotheses
testing. This chapter thus addresses the third objective of this research which
was to develop a conceptual framework of the relationship between
organisational culture and performance.
4.1 CONCEPTUAL MODELS
In trying to understand social systems, irrespective of the context, models are
used (Hofstede, 2001). Models are considered as simplified designs for
visualising objects, processes, systems or concepts too complex to grasp
(Fellows and Lui, 1997). As indicated by Hofstede (2001), in this
simplification process associated with the development of models, a certain
level of subjectivity enters the process. This not withstanding, the model must
capture and represent the reality being modelled as closely as practical and
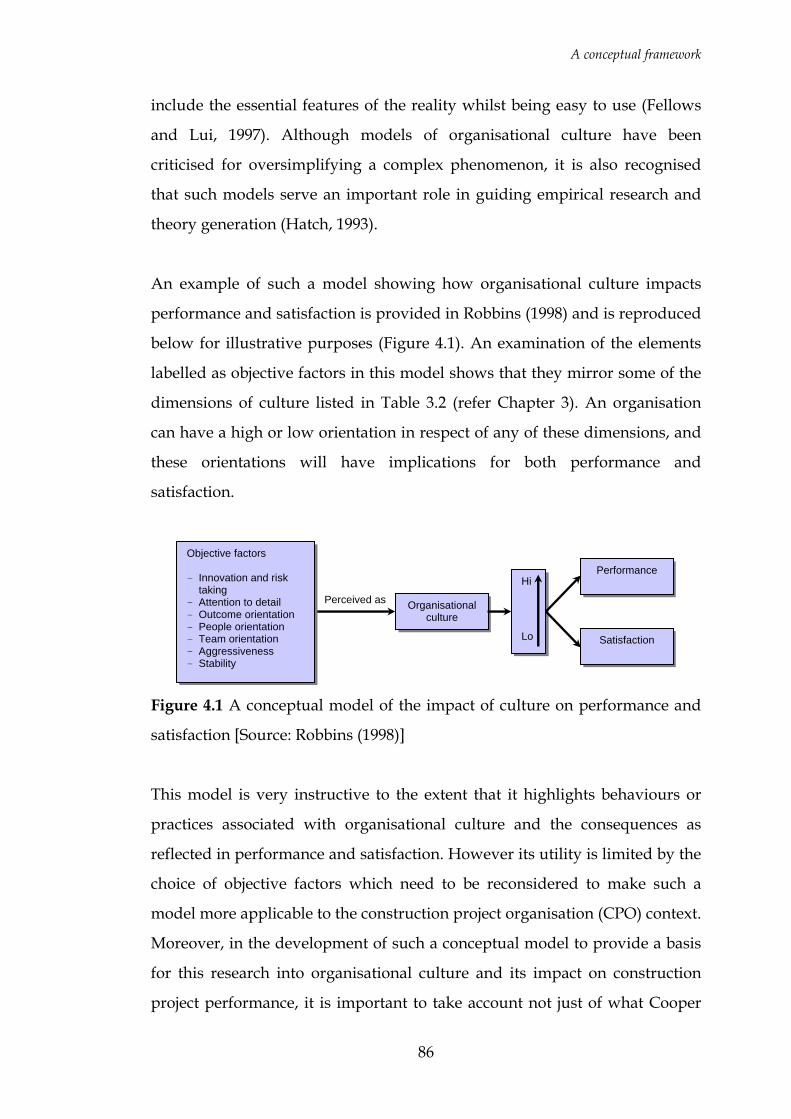
A conceptual framework
86
include the essential features of the reality whilst being easy to use (Fellows
and Lui, 1997). Although models of organisational culture have been
criticised for oversimplifying a complex phenomenon, it is also recognised
that such models serve an important role in guiding empirical research and
theory generation (Hatch, 1993).
An example of such a model showing how organisational culture impacts
performance and satisfaction is provided in Robbins (1998) and is reproduced
below for illustrative purposes (Figure 4.1). An examination of the elements
labelled as objective factors in this model shows that they mirror some of the
dimensions of culture listed in Table 3.2 (refer Chapter 3). An organisation
can have a high or low orientation in respect of any of these dimensions, and
these orientations will have implications for both performance and
satisfaction.
Figure 4.1 A conceptual model of the impact of culture on performance and
satisfaction [Source: Robbins (1998)]
This model is very instructive to the extent that it highlights behaviours or
practices associated with organisational culture and the consequences as
reflected in performance and satisfaction. However its utility is limited by the
choice of objective factors which need to be reconsidered to make such a
model more applicable to the construction project organisation (CPO) context.
Moreover, in the development of such a conceptual model to provide a basis
for this research into organisational culture and its impact on construction
project performance, it is important to take account not just of what Cooper
Organisational culture
Hi
Lo
Performance
Satisfaction
Objective factors - Innovation and risk
taking - Attention to detail - Outcome orientation - People orientation - Team orientation - Aggressiveness - Stability
Perceived as
A conceptual framework
87
(2000) described as the ‘behaviour(s)’ (captured in Figure 4.1 as objective
factors) and ‘consequence(s)’ (captured in Figure 4.1 as performance and
satisfaction), but also to take account of the ‘antecedent states’ (Cooper, 2000)
associated with this organisational phenomenon. All these aspects are critical
to understanding the cause and effect relationships and dependencies that
exist between organisational culture, its context and consequences. In trying
to develop a simple but practical tool for this empirical research, these three
aspects are examined within a construction project context.
4.2 ‘ANTECEDENTS’
Organisational culture develops incrementally, evolving gradually over time
(Meudell and Gadd, 1994) as the organisation contends with the various
pressures arising from both internal and external sources. Reconciling these
pressures sets the tone for jobs and cultures (Handy, 1993). It has been argued
that the culture of CPOs needs to be examined against the background that
they are in actual fact ‘short life organisations’ (SLOs) (Ankrah et al., 2005b)
and as such feel different pressures, and feel them differently from
conventional organisations. Drawing from theory on SLOs (cf. Meudell and
Gadd, 1994; Mullins, 2005) as well as theory from the traditional management
views on culture and its determinants (cf. Graves, 1986; Kotter and Heskett,
1992; Thompson, 1993; Handy, 1993; Hampden-Turner, 1994; Mullins, 2005),
the main determinants of the organisational culture within CPOs can be
identified as broadly comprising recruitment strategies and the composition
of the CPO, training initiatives, project characteristics, project manager and
dominant groups, significant events, procurement approach, macro-culture,
industry characteristics, location, and technology and primary function.
These determinants are discussed in more detail below.
A conceptual framework
88
4.2.1 Recruitment strategy and composition of the CPO
From studies of typical SLOs, Meudell and Gadd (1994) found that rather
than any other factors, the recruitment strategy was one of the two key
determinants of the culture of the organisation. The way and manner in
which people are screened and selected for employment influences the sort of
people who are recruited and become members of the organisation, and the
values and behaviour they bring to the organisation. If these values and
behaviour fit in with the organisation, then it leads to a perpetuation of the
culture, otherwise it could lead to conflict and/or changes (Graves, 1986;
Handy, 1993; Mullins, 2005). Moreover as highlighted by Kotter and Heskett
(1992), ideas or solutions that become embedded in a culture can originate
from all members of the organisation. It can be argued therefore that the
composition of CPOs, influenced by its recruitment strategy, will be crucial to
its culture.
The composition of CPOs can be differentiated along lines of gender,
ethnicity, age profile and educational levels. Statistics from the CITB
estimates that women make up only 9% and ethnic minorities make up only
2% (CITB, 2002). In terms of age and available skills, although there has been
a decline in the 16–29 year age range, possibly attributable to the economic
downturn of the 1990s, the profile is still young, with about 46% having an
NVQ-equivalent level 3 or above (Pearce, 2003). Different behaviours are
possible where variations in employee profiles (such as number of female
participants) exist within the CPO. With particular regards to females, it has
been noted that beyond reasons of social equality, women possess attitudes
and attributes that organisations need (Handy, 1994 in Barthorpe et al., 2000).
A more “female” culture in the construction industry has also been advocated
for by Langford et al. (1995 in Barthorpe et al., 2000). Some of the desirable
characteristics of the feminine culture in the workplace are identified as the
use of intuition and consensus, a stress on equality, solidarity, and quality of
work life, resolution of conflicts by compromise and negotiation, caring,
A conceptual framework
89
compassion, generosity, and sensitivity (Hofstede, 1997; Wilson, 1999). It has
been noted also by Wilson (1999) that minority groups also possess such
attributes. This seems to suggest that the greater the proportion of females or
minority groups, the greater the likelihood of developing a culture that
manifests these behaviours. However it has been established that, with a
profile such as that described above, the culture of CPOs is skewed towards a
“macho” young white male behaviour (Wilson, 1999; Barthorpe et al., 2000;
Serpell and Rodriguez, 2002). This is a situation that prevails widely across
the construction industry. Moreover according to Wilson (1999), women in
such male-dominated areas tend to adopt masculine traits.
4.2.2 Training initiatives
Another key factor identified by Meudell and Gadd (1994) as an important
tool for cultivating a desired culture was training. This is echoed in Mullins
(2005). Training initiatives can be used to transmit and embed in employees
what is important and should be prioritised, what the goals and objectives of
the organisation are, what the expected behaviour is, the relevant
terminologies, what the various roles are and the extent of their
responsibilities, and the communication networks (Meudell and Gadd, 1994).
It can also be used to improve project leadership and management skills.
With construction characterised by casual employment where employees
often fail to identify with the project and its successful completion (Barthope
et al., 2000), and typically involving a myriad of participants who often have
divergent objectives and cultures (Chua et al., 1999; Hsieh, 1998), training is a
useful way of re-orienting project participants.
4.2.3 Size and other project characteristics
In a typical organisation, increasing size leads to departmentalisation and/or
“split-site” operations (Mullins, 2005). This is inevitably accompanied by
communication and coordination difficulties, and necessitates the

A conceptual framework
90
formalisation of mechanisms for communication, control and coordination, as
well as the structure of the organisation. Decreasing size also has its impact.
Handy (1993) describes size as being perhaps the single most important
variable in determining the culture of an organisation. CPOs also vary in size
and this is in relation to project scale, type, complexity and clients served.
This has an influence on the composition of the CPO, who manages the
project, the duration of the project, as well as communication networks,
organisation structure, and control and coordination mechanisms. It is logical
therefore to propose that in an industry where each project is unique, the
different project characteristics will lead to different cultural orientations.
4.2.4 The industry characteristics
This determinant of culture considers the stability or dynamism, and
standardisation or diversity of the environment and also takes into account
threats and dangers in the form of take-overs, mergers, nationalisation and
economic recessions (Graves, 1986; Kotter and Heskett, 1992; Handy, 1993). In
order to be effective, organisations must be responsive to these external
environmental influences (Mullins, 2005). Significant changes in the
environment may require changes in the culture to avoid a long-term
deterioration of economic performance. It can be argued that this influencing
factor is independent of the project and all CPOs are affected by the state of
the economic or business environment.
4.2.5 Significant events and procurement
Any organisation with history has a culture (Schein, 1985). This factor
considers the reason and manner in which the organisation was formed, and
the extent to which an organisation has had to be flexible, adaptable and
sensitive. It also considers the merger history and managerial changes that
have occurred in a firm (Handy, 1993). Crises, in the form of key events such
as a merger, major re-organisation, new management, diversification into
A conceptual framework
91
very different businesses or geographical expansion may bring in its wake, a
change in culture (Kotter and Heskett, 1992; Mullins, 2005). Conversely,
continued success leads to the emergence of a culture that reflects the vision
or strategy that led to the success. The age of an organisation is therefore an
important consideration. In the case of CPOs, history can be said to be
limited, because of the project-oriented nature of the industry. However, to
the extent that significant events, in the form of disputes and/or project
management changes (cf. Low and Shi, 2001) can occur even during the
relatively short project durations, cultural changes can result (Loosemore,
1998). For instance, a culture of mistrust, antagonism and conflict can develop
following a dispute on a construction project site. It can be proposed therefore
that when significant events such as disputes or project management changes
occur, changes in the culture and the way a project proceeds can
subsequently occur.
In modern procurement of construction projects, it is becoming popular to
have arrangements which allow for partnering (relational contracting, serial
contracting or alliancing), implying that though CPOs still remain SLOs, there
is arguably, some history that informs the culture that prevails in the CPO. It
has been argued elsewhere that through partnering, expertise is developed
and knowledge is accumulated and transmitted from project to project
(Packham et al., 2003). The same argument can be made for an approach to
work, an acceptable way of behaviour, an attitude, or more appropriately, a
culture which develops from project to project and becomes pervasive. This
culture is often associated with a spirit of collaboration, open interaction,
trust, commitment, mutual advantage, learning, innovation and productivity
(Cook and Hancher, 1990; Crowley and Karim, 1995; Drexler and Larson
2000; Naoum, 2003), and this contrasts sharply with the traditional culture of
antagonism, conflict and disputes. It can be seen from this that the
procurement approach is likely to have an impact on the culture of the CPO,
with different procurement approaches leading to different cultures.
A conceptual framework
92
4.2.6 Technology and primary function
The technological processes and methods of undertaking work are
determined by the primary function of the organisation (Mullins, 2005).
Although the type of technology does not necessarily lead to the
development of one or other culture, it is clear that certain technologies
appear to be more suitable for certain cultures (Handy, 1993). In the
construction industry, the bespoke nature of projects implies that the primary
function and associated technology may be dependent on project
characteristics as already discussed. However generally speaking, the
technology adopted by an organisation is dependent on the industry in which
it is operating. In this context therefore construction technology can be
considered as being determined by the construction industry as a whole.
4.2.7 Dominant group
This factor concerns founders, leaders or dominant groups and includes such
issues as the founders’ values, philosophy and dominance, nature of
ownership, and extent to which the organisation has been centralised since its
inception (Kotter and Heskett, 1992; Handy, 1993; Mullins, 2005). Strong
founders and strategic leaders are important in establishing organisational
cultures that are both internally consistent and fit the environmental
conditions (Kotter and Heskett, 1992). As mentioned before, ideas and
solutions that become embedded in culture originate from various quarters
within the organisation. However, more often than not, these ideas seem to
be associated with leaders, particularly founders or other early leaders who
articulate them as a vision, strategy or philosophy (Kotter and Heskett, 1992).
Within the context of a construction project, the leaders are often project
managers or the main contractor. Other dominant groups may also emerge,
and where these are linked with particular occupations, the approach to work
adopted by this occupation (their culture) may form the perspective from
which this dominant group will seek to direct the approach to work on the

A conceptual framework
93
construction project. Where for instance the dominant group takes health and
safety seriously, the rest of the CPO will be more inclined to adopt a more
health and safety conscious cultural orientation. It can thus be proposed that
though they have limited time to exert influence on projects, the dominant
group can influence cultural orientation in the CPO.
4.2.8 Goals and objectives
Differences in goals can be decisive in determining what the culture of an
organisation would be. Goals such as quality of product, good place of work,
centre of employment, service to community, and growth influence different
cultural orientations in organisations (Handy, 1985; Mullins, 2005). A charity
with community service goals will not have the same culture as an airline
with profit goals. In relation to construction projects, CPOs pursue a variety
of project-related goals such as achieving adequate quality, minimising cost,
health and safety, and innovation. The prioritisation of these goals and
objectives influences the organisational culture of the CPO.
4.2.9 Macro cultures
It has been suggested that different macro cultures also have an influence on
the development of organisational culture (Handy, 1985; Hampden-Turner,
1994; Abu Bakar, 1998; Hofstede and Fink, 2007) and this is because the
organisation is a microcosm of society and bears similarities in some respects
to society. Within a construction project context, there are a myriad of
organisations involved. Potentially these organisations may have different
nationalities and therefore different national cultures. By limiting the scope of
this research to construction projects in the UK undertaken by UK registered
construction organisations, it is expected that the UK national culture will be
the dominant macro-culture influencing individual behaviour. Using
Hofstede’s (2001) framework, the typical individual in a CPO will be
expected to have a low power distance, individualistic, masculine orientation
A conceptual framework
94
and weak uncertainty avoidance. Admittedly, there may be construction
organisations with foreign ownership working on construction projects in the
UK. However such organisations are a minority and as found in Dickson et al.
(2000), such organisations exhibit little difference in organisational culture
from local organisations. Moreover there is even evidence to suggest a
growing homogeneity of business practices and managerial values across
national cultures (Neuijen, 2002).
4.2.10 Location
Geographical location can have an influence on the types of clients served
and the staff employed by the organisation, as well as opportunities for
development. The physical characteristics of the location such as a busy city
centre or a rural area are important considerations. These can all have a
significant influence on culture (Mullins, 2005). Construction in the UK takes
place all over the country, in various settings. Of some significance are the
regional variations in construction output which are well documented (cf.
Harvey and Ashworth, 1997; DTI, 2005). Such variations could potentially
influence approaches to work, making location another relevant factor.
4.2.11 Summary
For the purposes of this research, it is possible to classify these determinants
of culture in two ways; those that are dependent on the project and vary from
CPO to CPO, and those that are independent of the project and are a
characteristic of the construction industry and the environment as a whole,
exerting pressure the same way irrespective of the CPO under consideration.
These are listed in Table 4.1.
In developing a framework that gives an understanding of how the culture of
CPOs develop, this distinction is very useful as it makes it possible to
distinguish between those contextual factors that are the same irrespective of

A conceptual framework
95
the project under consideration, and which push all CPOs towards certain
specific cultural orientations, and those factors which vary from project to
project and push CPOs in different cultural directions. These elements are
captured in the simple framework shown in Figure 4.2.
Table 4.1 Project-dependent and project-independent determinants of culture
Project-dependent factors Project-independent factors Recruitment strategies & Composition of CPO Macro-culture Training initiatives Industry characteristics Project characteristics Technology & primary function Project Manager or dominant group Significant events Procurement approach Goals and objectives Location
Research into CPO culture requires the collection of data on these various
antecedents of organisational culture. Generally, the contextual data
associated with the project-independent factors are well documented and can
be derived from the literature. Therefore, the contextual data that a survey
needs to focus on principally are the project-dependent factors, which will be
the most useful in explaining the cultural differences that exist between
CPOs.
Externalities/Project-independent factors:Macro-culture
Industry characteristicsTechnology & primary function
Organisational culture of CPOs
influence Performanceinfluences
Project-dependent factors:
Other factors influencing performance cf. Ching Ming and Harris, 1996; Chan et al., 2004; Belout and Gauvreau, 2004)
Project characteristics
Composition of CPO
Project Manager/dominant groups
Procurement approach
Goals and objectives
Location
Significant events
Training strategy
Figure 4.2 A framework for conceptualising the development of the
organisational culture of a CPO
A conceptual framework
96
It is significant to note that the factors identified as determinants of
organisational culture are inter-related in fundamental ways (Brown, 1998).
Leaders (project managers or dominant groups) for instance are influenced by
the macro-cultures, and they in turn set the goals and objectives of the CPO.
Another useful framework which also sought to identify culture’s
antecedents from a construction project perspective is that in Kumaraswamy
et al. (2002). Also theoretical in content, this framework identified
organisational, operational, professional and individualistic sub-cultures as
the principal elements that come together to evolve the culture within the
CPO through a process of ‘negotiation’. As can be seen, the factors identified
in this chapter are consistent with the Kumaraswamy et al. (ibid) framework
demonstrating the validity of the arguments presented.
4.3 ‘BEHAVIOURS’
In terms of the manner in which organisational culture influences
construction project performance, it has been suggested by several
researchers that it influences attributes such as the propensity for litigation,
the degree of participation and openness, approaches to decision-making, the
quality of communications and working relationships, recruitment and
human resource policies, management philosophies and practices adopted on
construction projects, strategy, and approaches to construction (cf. Fenn et al.,
1997; Cooper, 2000; Riley and Clare-Brown, 2001; Low and Shi, 2001; Phua
and Rowlinson, 2003; Skitmore et al., 2004). This list of attributes or
‘behaviours’ is by no means exhaustive and it is necessary to broaden and
categorise these factors to provide a comprehensive framework for
investigating the influence of organisational culture on construction project
performance.
A conceptual framework
97
These attributes of organisational culture have been severally referred to as
indices of culture (Taylor and Bowers, 1972), aspects of culture (Thompson,
1993), traits of culture (Lui, 1999), indicators of culture (Handy, 1995;
Hagberg and Heifetz, 2000), as well as elements of culture (Rameezdeen and
Gunarathna, 2003). More commonly, as seen in the preceding chapter, these
attributes are referred to as dimensions of culture (Schein, 1985; Trompenaars
and Hampden-Turner, 1999; Hofstede, 2001).
Table 3.2 in the preceding chapter shows various empirically derived and
theory-based dimensions compiled from the literature and include
dimensions related to national culture as well as those related specifically to
organisations. The former are also important as organisations are generally a
microcosm of society as a whole. These dimensions are categorised under the
headline dimensions of people, processes and systems, information
management, control, technology, business focus, learning and innovation,
and environment. It can be argued in line with Hofstede (2001) that these
dimensions have been developed and applied in contexts and for specific
reasons which may not necessarily apply within a construction project
context. Further, they do not all focus on organisational practices in line with
the findings and arguments of Hofstede et al. (1990), Smith (2000) and van
den Berg and Wilderom (2004). This suggests a need to identify dimensions
which are more relevant for this research.
To identify construction project-specific dimensions, it is first of all necessary
to examine the sources of dimensions. As dimensions of culture are rooted in
the fundamental problems that groups of people have to deal with or find
solutions to (Schein, 1985; Hofstede, 2001), it can be argued that a useful
source of information when looking for dimensions of CPO culture is to
examine the fundamental problems of CPOs. The problems of CPOs are
numerous and well documented, and nowhere better articulated than in the
major construction industry reports that have been published since the Simon

A conceptual framework
98
(1944) report. These reports have examined the problems of the construction
industry, and have in the main recounted the same industry failures time and
time again, and none more so than the landmark Egan (1998) report which
subsequent reports have also echoed.
In identifying the drivers for change for improving the performance of the
construction industry, this report (Egan, 1998) provides pointers to the main
fundamental problems ailing the industry. The report notes that for
performance improvement, changes are required within the areas of:
Leadership;
Client focus;
Process and team fragmentation;
Quality delivery; and
Commitment to people.
These problem areas are examined below, and the dimensions from the
organisational culture literature which are associated with these problems are
highlighted. It is important to emphasise the inter-relatedness of the problems
and the dimensions they give rise to, and the solutions that are adopted in
respect of these dimensions. Table 4.2 catalogues these dimensions of culture
and their corresponding definitions.
4.3.1 Leadership
Egan (1998) expressed a lack of widespread evidence of the commitment of
leadership to raise quality and efficiency required to improve performance.
This point was also reiterated by Kashiwagi et al. (2004) who identified “a
lack of leadership” in the construction industry and associated the project
delivery process with a management rather than a leadership culture, arguing
further that the use of a leadership oriented process minimised inefficiencies,
A conceptual framework
99
thereby leading to performance improvement. This is an argument in favour
of a more committed leadership orientation, a view shared by Chan and Chan
(2005) who also point to transformational leadership as being a prerequisite
for engendering improved performance. According to Liu et al. (2003) good
leadership has motivational function.
A number of dimensions of culture may arise out of this need for more
committed leadership. As captured in Table 4.2, these could include support
for employees, people management, loose/tight or overt/suppressed control,
decision-making practices, decisiveness, direction and goal clarification,
process or results orientation, employee or task orientation, influence of
lower levels, dealing with uncertainty and risk, and communication.
4.3.2 Client focus
According to Egan (1998) the customer drives everything in the best
companies. Not so in the construction industry. The tendency rather has been
to focus on the next job and the next employer. This is because of the nature
of construction business which requires that constructors always focus on
trying to secure new orders and maintaining a full order book to assure on-
going work. In a study conducted by Dainty et al. (2005) to assess the
competencies of project managers, it was found for instance that customer
service orientation (a desire to meet customer needs) was of primary
importance. Although the context in this case is slightly different, the import
is the same as Egan (1998); that client focus is important for performance
improvement.
Dimensions from the literature that can be associated with this particular
problem include research into end-user wants/needs, education of clients,
auditing client satisfaction, deal or relationship focus, client or market focus,
reaction of customers (Table 4.2).
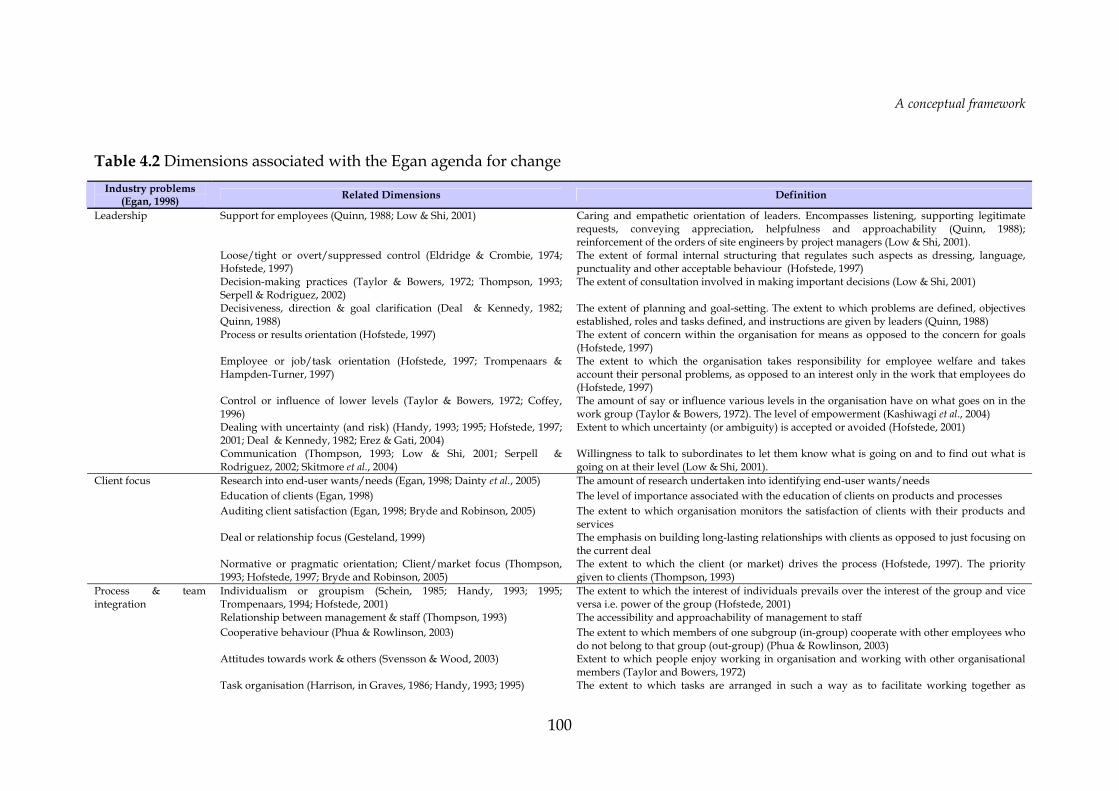
A conceptual framework
100
Table 4.2 Dimensions associated with the Egan agenda for change Industry problems
(Egan, 1998) Related Dimensions Definition
Leadership Support for employees (Quinn, 1988; Low & Shi, 2001) Caring and empathetic orientation of leaders. Encompasses listening, supporting legitimate requests, conveying appreciation, helpfulness and approachability (Quinn, 1988); reinforcement of the orders of site engineers by project managers (Low & Shi, 2001).
Loose/tight or overt/suppressed control (Eldridge & Crombie, 1974; Hofstede, 1997)
The extent of formal internal structuring that regulates such aspects as dressing, language, punctuality and other acceptable behaviour (Hofstede, 1997)
Decision-making practices (Taylor & Bowers, 1972; Thompson, 1993; Serpell & Rodriguez, 2002)
The extent of consultation involved in making important decisions (Low & Shi, 2001)
Decisiveness, direction & goal clarification (Deal & Kennedy, 1982; Quinn, 1988)
The extent of planning and goal-setting. The extent to which problems are defined, objectives established, roles and tasks defined, and instructions are given by leaders (Quinn, 1988)
Process or results orientation (Hofstede, 1997) The extent of concern within the organisation for means as opposed to the concern for goals (Hofstede, 1997)
Employee or job/task orientation (Hofstede, 1997; Trompenaars & Hampden-Turner, 1997)
The extent to which the organisation takes responsibility for employee welfare and takes account their personal problems, as opposed to an interest only in the work that employees do (Hofstede, 1997)
Control or influence of lower levels (Taylor & Bowers, 1972; Coffey, 1996)
The amount of say or influence various levels in the organisation have on what goes on in the work group (Taylor & Bowers, 1972). The level of empowerment (Kashiwagi et al., 2004)
Dealing with uncertainty (and risk) (Handy, 1993; 1995; Hofstede, 1997; 2001; Deal & Kennedy, 1982; Erez & Gati, 2004)
Extent to which uncertainty (or ambiguity) is accepted or avoided (Hofstede, 2001)
Communication (Thompson, 1993; Low & Shi, 2001; Serpell & Rodriguez, 2002; Skitmore et al., 2004)
Willingness to talk to subordinates to let them know what is going on and to find out what is going on at their level (Low & Shi, 2001).
Client focus Research into end-user wants/needs (Egan, 1998; Dainty et al., 2005) The amount of research undertaken into identifying end-user wants/needs Education of clients (Egan, 1998) The level of importance associated with the education of clients on products and processes Auditing client satisfaction (Egan, 1998; Bryde and Robinson, 2005) The extent to which organisation monitors the satisfaction of clients with their products and
services Deal or relationship focus (Gesteland, 1999) The emphasis on building long-lasting relationships with clients as opposed to just focusing on
the current deal Normative or pragmatic orientation; Client/market focus (Thompson,
1993; Hofstede, 1997; Bryde and Robinson, 2005) The extent to which the client (or market) drives the process (Hofstede, 1997). The priority given to clients (Thompson, 1993)
Process & team integration
Individualism or groupism (Schein, 1985; Handy, 1993; 1995; Trompenaars, 1994; Hofstede, 2001)
The extent to which the interest of individuals prevails over the interest of the group and vice versa i.e. power of the group (Hofstede, 2001)
Relationship between management & staff (Thompson, 1993) The accessibility and approachability of management to staff Cooperative behaviour (Phua & Rowlinson, 2003) The extent to which members of one subgroup (in-group) cooperate with other employees who
do not belong to that group (out-group) (Phua & Rowlinson, 2003) Attitudes towards work & others (Svensson & Wood, 2003) Extent to which people enjoy working in organisation and working with other organisational
members (Taylor and Bowers, 1972) Task organisation (Harrison, in Graves, 1986; Handy, 1993; 1995) The extent to which tasks are arranged in such a way as to facilitate working together as
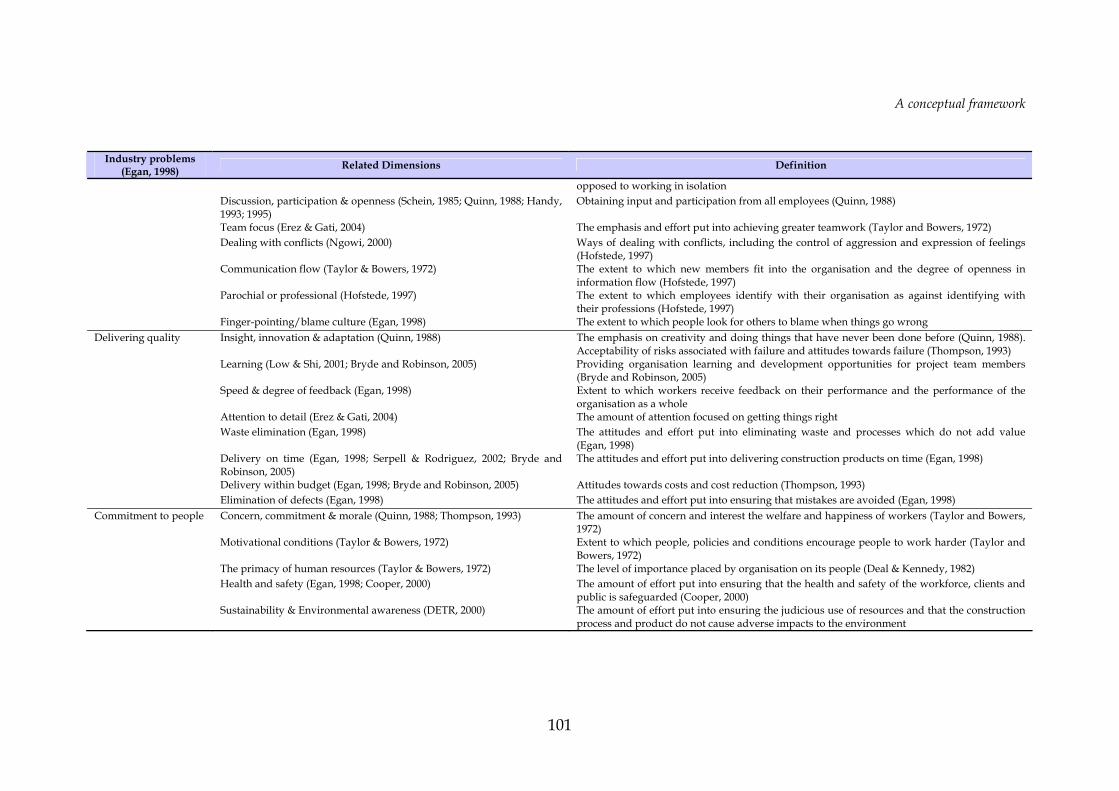
A conceptual framework
101
Industry problems (Egan, 1998) Related Dimensions Definition
opposed to working in isolation Discussion, participation & openness (Schein, 1985; Quinn, 1988; Handy,
1993; 1995) Obtaining input and participation from all employees (Quinn, 1988)
Team focus (Erez & Gati, 2004) The emphasis and effort put into achieving greater teamwork (Taylor and Bowers, 1972) Dealing with conflicts (Ngowi, 2000) Ways of dealing with conflicts, including the control of aggression and expression of feelings
(Hofstede, 1997) Communication flow (Taylor & Bowers, 1972) The extent to which new members fit into the organisation and the degree of openness in
information flow (Hofstede, 1997) Parochial or professional (Hofstede, 1997) The extent to which employees identify with their organisation as against identifying with
their professions (Hofstede, 1997) Finger-pointing/blame culture (Egan, 1998) The extent to which people look for others to blame when things go wrong Delivering quality Insight, innovation & adaptation (Quinn, 1988) The emphasis on creativity and doing things that have never been done before (Quinn, 1988).
Acceptability of risks associated with failure and attitudes towards failure (Thompson, 1993) Learning (Low & Shi, 2001; Bryde and Robinson, 2005) Providing organisation learning and development opportunities for project team members
(Bryde and Robinson, 2005) Speed & degree of feedback (Egan, 1998) Extent to which workers receive feedback on their performance and the performance of the
organisation as a whole Attention to detail (Erez & Gati, 2004) The amount of attention focused on getting things right Waste elimination (Egan, 1998) The attitudes and effort put into eliminating waste and processes which do not add value
(Egan, 1998) Delivery on time (Egan, 1998; Serpell & Rodriguez, 2002; Bryde and
Robinson, 2005) The attitudes and effort put into delivering construction products on time (Egan, 1998)
Delivery within budget (Egan, 1998; Bryde and Robinson, 2005) Attitudes towards costs and cost reduction (Thompson, 1993) Elimination of defects (Egan, 1998) The attitudes and effort put into ensuring that mistakes are avoided (Egan, 1998) Commitment to people Concern, commitment & morale (Quinn, 1988; Thompson, 1993) The amount of concern and interest the welfare and happiness of workers (Taylor and Bowers,
1972) Motivational conditions (Taylor & Bowers, 1972) Extent to which people, policies and conditions encourage people to work harder (Taylor and
Bowers, 1972) The primacy of human resources (Taylor & Bowers, 1972) The level of importance placed by organisation on its people (Deal & Kennedy, 1982) Health and safety (Egan, 1998; Cooper, 2000) The amount of effort put into ensuring that the health and safety of the workforce, clients and
public is safeguarded (Cooper, 2000) Sustainability & Environmental awareness (DETR, 2000) The amount of effort put into ensuring the judicious use of resources and that the construction
process and product do not cause adverse impacts to the environment
A conceptual framework
102
4.3.3 Process and team fragmentation
It is noted that success does not derive from fragmentation, a fundamental
problem/characteristic of the construction industry in which the project
process is often executed as “a series of sequential and largely separate
operations undertaken by individual designers, constructors and suppliers”
(Egan, 1998). This problem is well documented (cf. Latham, 1994; Harvey and
Ashworth, 1997; Fellows et al., 2002; Cain, 2004), with Baiden et al. (2006)
suggesting that consequently, many of the teams involved in project delivery
work towards individually defined objectives that are often in conflict with
one another.
Dimensions that typically arise from this problem include individualism or
groupism, relationship between management and staff, cooperative
behaviour, attitudes towards work and others, task organisation, discussion,
participation and openness, team focus, finger-pointing or blame culture,
dealing with conflicts, communication flow, communication, measurement,
documentation and information management (cf. Baiden et al., 2006).
4.3.4 Delivering quality
Delivering quality involves elements such as waste elimination, innovating
for the benefit of the client, and delivering on time and to budget with zero
defects (Egan, 1998). This ability to deliver quality is a fundamental challenge
in construction, especially with clients selecting designers and constructors
on the basis of lowest cost instead of overall value for money. The problems
associated with project delivery in this regard are also well known (cf.
Littlefield, 1998; Cain, 2004).
A number of dimensions arise out of the various elements associated with the
challenge of delivering quality. These include insight, innovation and
adaptation, learning, speed and degree of feedback, attention to detail,
A conceptual framework
103
attitudes towards delivery on time, attitudes towards delivery to budget,
attitudes towards elimination of defects.
4.3.5 Commitment to people
Fellows et al. (2002) have noted that it is commonplace to come across phrases
like “people are our greatest assets” in construction. However Egan (1998)
argues that there is still a problem in construction of recognising that its
people are its greatest assets and hence a need to invest in their training and
development, health and safety, decent site conditions, and fair wages. This
problem also encompasses the lack of concern for the environment and the
issue of sustainability, as these also relate to a concern for people within the
society at large. It is not surprising to find for instance that construction has
one of the worst records for health and safety and a poor record for
recruitment and retention (Fellows et al., 2002; Pearce, 2003). Problems of this
sort associated with the people resource are constantly being reported
especially in the trade magazines like Construction News (cf. Kernon, 2005;
Prior, 2005; Booth, 2005; Anon, 2005; Prior, 2006; Rimmer, 2006).
Some of the dimensions that emerge from this fundamental problem include
concern, commitment and morale, the primacy of human resources,
motivational conditions, health and safety, sustainability, and environmental
awareness (Table 4.2).
4.3.6 Relevance of dimensions identified
In a report prepared by the Construction Research and Innovation Strategy
Panel (CRISP) Culture and People Task Group (2002) on a research strategy
for culture and people in construction, a number of dimensions were
proposed by construction industry experts. These dimensions were training,
institutional structure, education, economic cycle, team skills, learning,
leadership, image of construction, image promotion, incentives, motivation
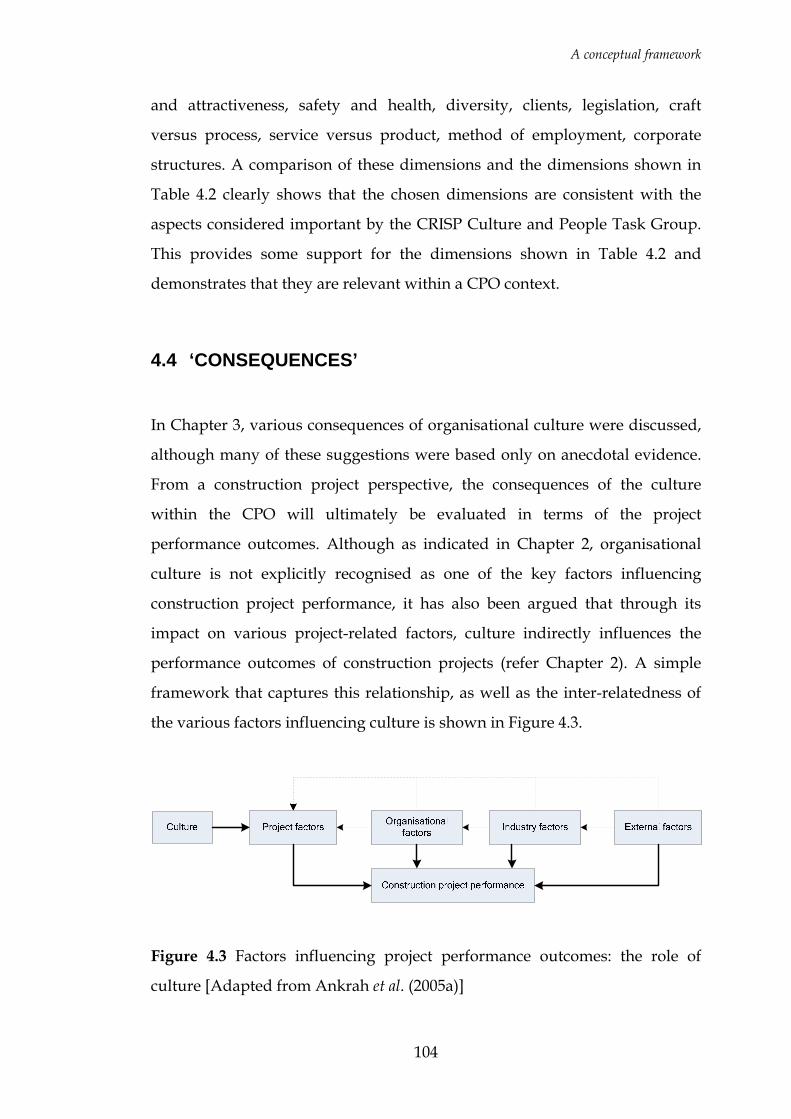
A conceptual framework
104
and attractiveness, safety and health, diversity, clients, legislation, craft
versus process, service versus product, method of employment, corporate
structures. A comparison of these dimensions and the dimensions shown in
Table 4.2 clearly shows that the chosen dimensions are consistent with the
aspects considered important by the CRISP Culture and People Task Group.
This provides some support for the dimensions shown in Table 4.2 and
demonstrates that they are relevant within a CPO context.
4.4 ‘CONSEQUENCES’
In Chapter 3, various consequences of organisational culture were discussed,
although many of these suggestions were based only on anecdotal evidence.
From a construction project perspective, the consequences of the culture
within the CPO will ultimately be evaluated in terms of the project
performance outcomes. Although as indicated in Chapter 2, organisational
culture is not explicitly recognised as one of the key factors influencing
construction project performance, it has also been argued that through its
impact on various project-related factors, culture indirectly influences the
performance outcomes of construction projects (refer Chapter 2). A simple
framework that captures this relationship, as well as the inter-relatedness of
the various factors influencing culture is shown in Figure 4.3.
Figure 4.3 Factors influencing project performance outcomes: the role of
culture [Adapted from Ankrah et al. (2005a)]

A conceptual framework
105
4.5 A CONCEPTUAL FRAMEWORK OF CULTURE AND PERFORMANCE
Fusing together the three strands of antecedents, behaviours and
consequences, it is possible to develop a basic conceptual framework for this
research that encapsulates the manner in which organisational culture within
a CPO develops, the dimensions along which the culture manifests, and its
subsequent influence on construction project performance. This conceptual
framework is shown in Figure 4.4. It captures the antecedents in the form of
project-dependent factors as well as the project-independent factors that
combine to determine the culture within the CPO. These factors include inter
alia composition of the CPO, project characteristics, project manager and
dominant groups, significant events, procurement approach, location, macro-
culture, industry characteristics, recruitment strategies, training initiatives,
and technology and primary function. The culture that develops is
manifested along a myriad of dimensions that can be classified in terms of the
problems with which they are associated. In this framework, they are
classified as commitment to client, teamwork, delivering improved quality,
commitment to workforce and leadership. Through its impact on various
project-related factors, culture then influences project performance.
This conceptual framework thus provides a useful basis for focusing attention
on specific contextual and substantive variables in this research. Collection of
data on these various variables will make it possible to assess the cultural
orientations of project organisations along relevant dimensions, and to test
for significant differences in cultural orientations for different construction
projects. It will also be possible to assess the extent to which particular
cultural orientations impact on project delivery and performance outcomes.
Hypotheses are very helpful in this regard. From the conceptual framework
and the preceding discussions, three fundamental hypotheses can be drawn
to facilitate the examination of the data for relationships.
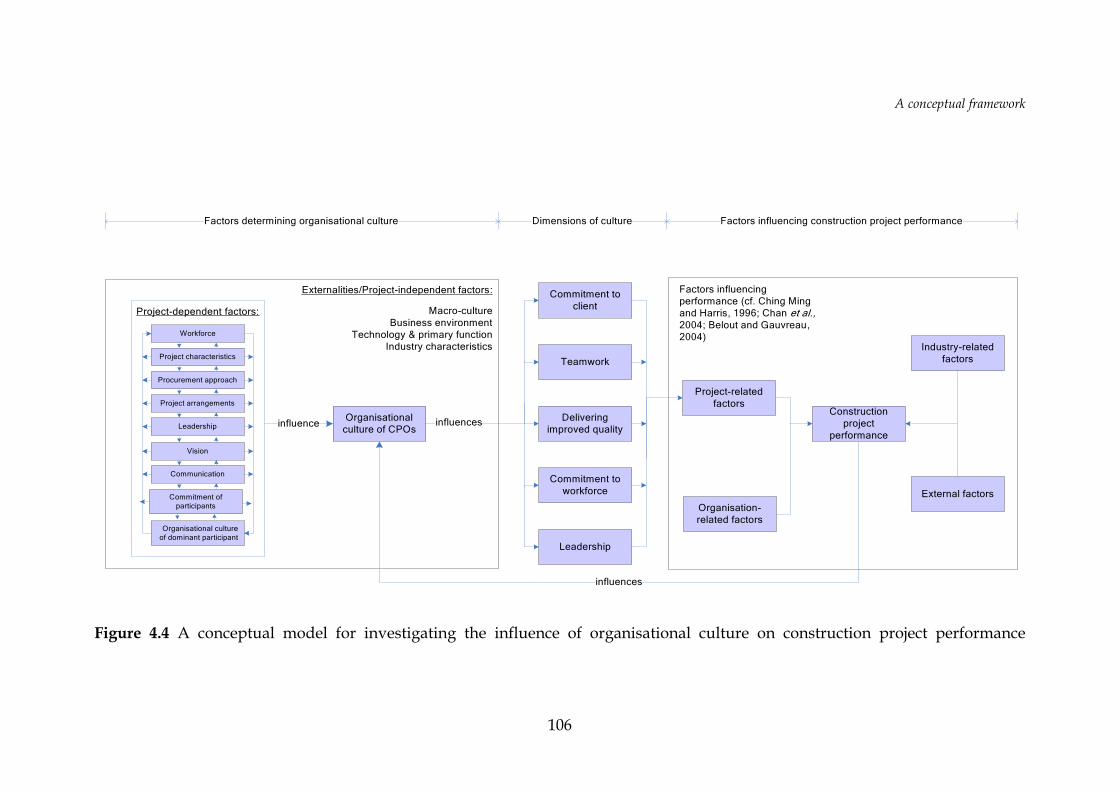
A conceptual framework
106
Externalities/Project-independent factors:
Macro-cultureBusiness environment
Technology & primary functionIndustry characteristics
Project-dependent factors:
Commitment to client
Teamwork
Delivering improved quality
Leadership
Organisation-related factors
Project-related factors
Construction project
performance
Commitment to workforce
Industry-related factors
External factors
Factors determining organisational culture Dimensions of culture Factors influencing construction project performance
Organisational culture of CPOs
influence influences
Project characteristics
Workforce
Procurement approach
Organisational culture of dominant participant
Project arrangements
influences
Communication
Vision
Leadership
Commitment of participants
Factors influencing performance (cf. Ching Ming and Harris, 1996; Chan et al., 2004; Belout and Gauvreau, 2004)
Figure 4.4 A conceptual model for investigating the influence of organisational culture on construction project performance

A conceptual framework
107
In the first instance, it has been shown from the literature that the culture
within a CPO is contextually determined, with factors such as project
composition and characteristics, dominant groups, occurrence or otherwise of
significant events, procurement approach, prioritisation of goals and
objectives, and project location potentially influencing the cultural orientation
of the CPO as summarised in the conceptual framework (Figure 4.4). In terms
of these factors, different projects are likely to have different configurations
implying also that different cultural orientations are likely to exist on these
projects. From this argument, it is reasonable to propose that:
H1: There are significant differences in the organisational cultures of
CPOs working on different construction projects in the UK.
As it is not clear from the empirical evidence provided in the literature what
the nature of the relationship between project features and cultural
orientations is, it is necessary to establish clearly by way of empirical research
whether or not CPOs have different cultural orientations and to what extent
these orientations are associated with key project features. Hypothesis H1
must therefore be tested in the analysis of data.
Secondly, it has been demonstrated through the examination of the literature
on performance of construction projects that several factors influence
performance outcomes (refer Chapter 2). These factors have been captured in
the conceptual framework under the categories project-related, organisation-
related, industry-related and external factors. The implications of having
these various factors impacting on performance outcomes are that different
construction projects will achieve different levels of performance. It is
therefore logical to propose that:
H2: There are significant differences in the performance levels of
different projects across the UK.
A conceptual framework
108
Here also, it is not clear from the evidence provided in the literature the
extent by which performance levels actually vary across construction projects
in the UK. It is therefore necessary to establish clearly from the data collected
whether or not CPOs actually have significantly different levels of
performance. Hypothesis H2 must therefore be tested in the analysis of data.
Finally, it has been demonstrated by the literature review (refer Chapter 3)
that there is sufficient theoretical basis and empirical evidence, albeit such
evidence is mainly anecdotal, to argue that construction project performance
outcomes are attributable in part to the culture within the CPO. It can thus be
proposed that:
H3: There is a significant relationship between organisational culture
and construction project performance.
Whilst such an association between culture and performance has been
alluded to in several quarters within the culture-in-construction literature, as
established through the literature review (refer Chapter 3), not much has been
provided beyond anecdotal evidence to back this assertion. Given that the
aim of this research as outlined in Chapter 1 was to look for empirical
evidence of a relationship between culture and performance, H3 provides an
appropriate hypothesis that must be examined in the light of the data
collected to achieve the aim of the research.
These three hypotheses presented above represent the main hypotheses of the
research, and the subsequent data collection, analyses and discussion will
focus on testing the validity of these hypotheses. For this to be done requires
the development of empirical referents for measuring organisational culture
and measuring the performance of construction projects. These are
considered in the following subsections.
A conceptual framework
109
4.5.1 Measuring organisational culture – A social cognitive approach
Similar to the definition of culture adopted for this research, it has been
argued by Cooper (2000) that the culture of an organisation in respect of any
particular dimension comprises the solutions chosen by the organisation and
its members in respect of that dimension, and the observable degree of effort
with which all organisation members direct their attention and actions
towards achieving the end goals for that particular dimension on a daily
basis. It is expected that a variety of tendencies will arise for each particular
dimension, corresponding to the preferences of individuals within the CPO
and the CPO as a whole. The various dimensions that have been identified
and collated in Table 4.2 refer to various attributes in respect of which certain
attitudes, behaviours and conditions are expected within the CPO in order
that the specific end goals will be achieved. It has been argued in Cooper
(ibid) that there is an interactive or reciprocal relationship between these
attitudes (psychological factors), behaviours (behavioural factors) and
conditions (situational factors). In the words of Cooper (ibid) the solutions in
respect of each dimension, and the effort put into pursuing them are reflected
in the “…dynamic reciprocal relationships between members’ perceptions
and attitudes towards the operationalisation of organisational goals;
members’ day-to-day goal-directed behaviour; and the presence and quality
of organisational systems and subsystems to support the goal-directed
behaviour”. This implies that assessing a particular dimension of culture
requires an assessment of each of these three aspects.
This approach is best captured or explained by reference to Bandura’s model
of reciprocal determinism (Cooper, 2000) derived from Social Cognitive
Theory (SCT) in which human functioning is viewed as the product of a
dynamic interplay of psychological, behavioural and situational influences
(Parajes, 2002). Social cognitive theory explains human functioning in terms
of the triadic reciprocal causal relationship between the cognitive and other
personal factors, behaviour, and environmental events which operate as
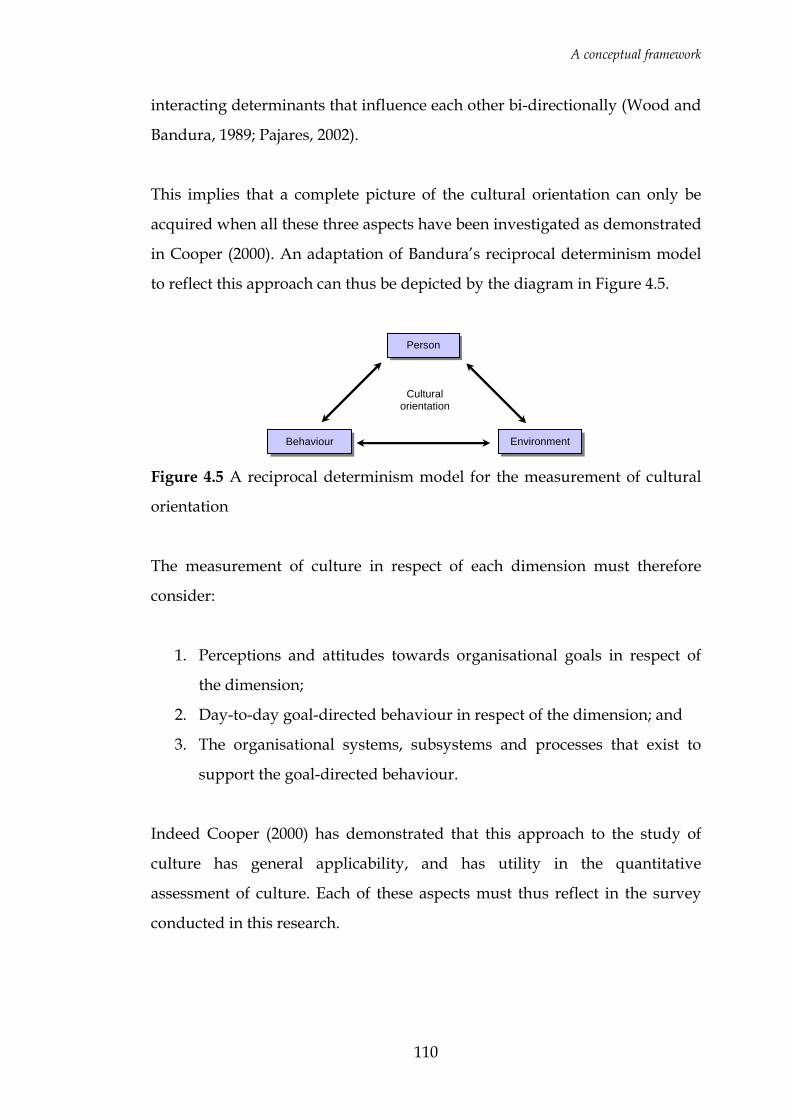
A conceptual framework
110
interacting determinants that influence each other bi-directionally (Wood and
Bandura, 1989; Pajares, 2002).
This implies that a complete picture of the cultural orientation can only be
acquired when all these three aspects have been investigated as demonstrated
in Cooper (2000). An adaptation of Bandura’s reciprocal determinism model
to reflect this approach can thus be depicted by the diagram in Figure 4.5.
Figure 4.5 A reciprocal determinism model for the measurement of cultural
orientation
The measurement of culture in respect of each dimension must therefore
consider:
1. Perceptions and attitudes towards organisational goals in respect of
the dimension;
2. Day-to-day goal-directed behaviour in respect of the dimension; and
3. The organisational systems, subsystems and processes that exist to
support the goal-directed behaviour.
Indeed Cooper (2000) has demonstrated that this approach to the study of
culture has general applicability, and has utility in the quantitative
assessment of culture. Each of these aspects must thus reflect in the survey
conducted in this research.
Person
Environment Behaviour
Cultural orientation
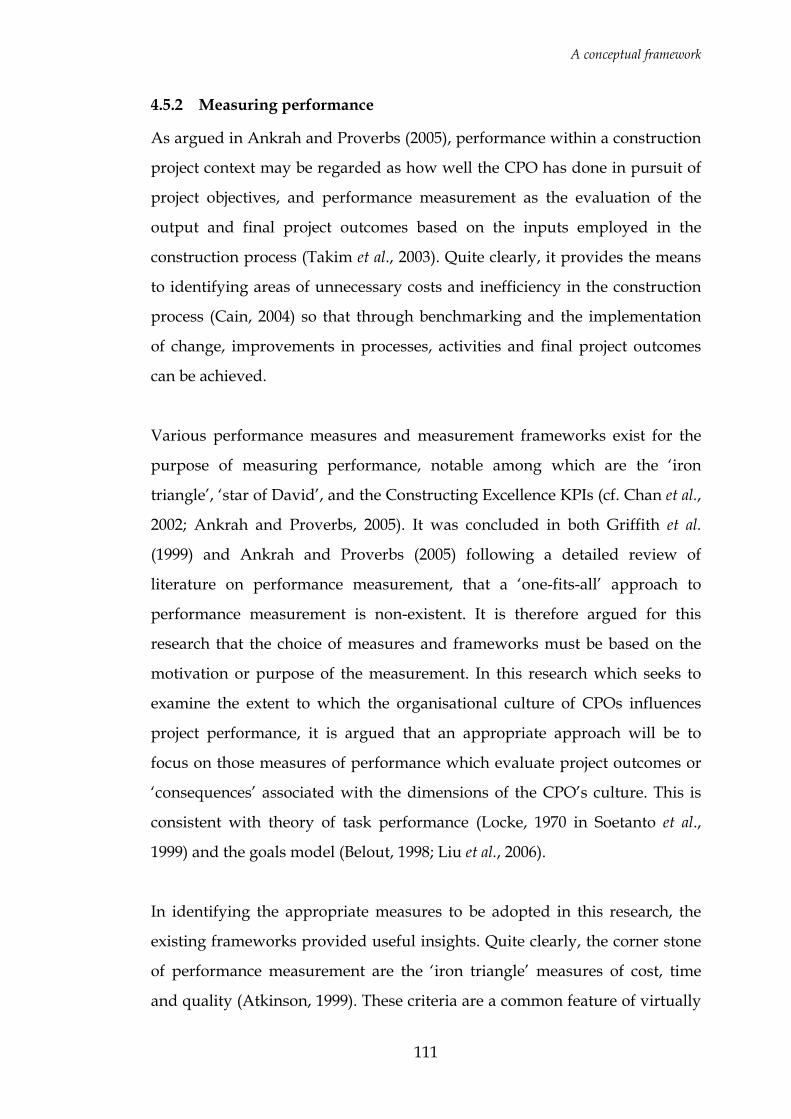
A conceptual framework
111
4.5.2 Measuring performance
As argued in Ankrah and Proverbs (2005), performance within a construction
project context may be regarded as how well the CPO has done in pursuit of
project objectives, and performance measurement as the evaluation of the
output and final project outcomes based on the inputs employed in the
construction process (Takim et al., 2003). Quite clearly, it provides the means
to identifying areas of unnecessary costs and inefficiency in the construction
process (Cain, 2004) so that through benchmarking and the implementation
of change, improvements in processes, activities and final project outcomes
can be achieved.
Various performance measures and measurement frameworks exist for the
purpose of measuring performance, notable among which are the ‘iron
triangle’, ‘star of David’, and the Constructing Excellence KPIs (cf. Chan et al.,
2002; Ankrah and Proverbs, 2005). It was concluded in both Griffith et al.
(1999) and Ankrah and Proverbs (2005) following a detailed review of
literature on performance measurement, that a ‘one-fits-all’ approach to
performance measurement is non-existent. It is therefore argued for this
research that the choice of measures and frameworks must be based on the
motivation or purpose of the measurement. In this research which seeks to
examine the extent to which the organisational culture of CPOs influences
project performance, it is argued that an appropriate approach will be to
focus on those measures of performance which evaluate project outcomes or
‘consequences’ associated with the dimensions of the CPO’s culture. This is
consistent with theory of task performance (Locke, 1970 in Soetanto et al.,
1999) and the goals model (Belout, 1998; Liu et al., 2006).
In identifying the appropriate measures to be adopted in this research, the
existing frameworks provided useful insights. Quite clearly, the corner stone
of performance measurement are the ‘iron triangle’ measures of cost, time
and quality (Atkinson, 1999). These criteria are a common feature of virtually
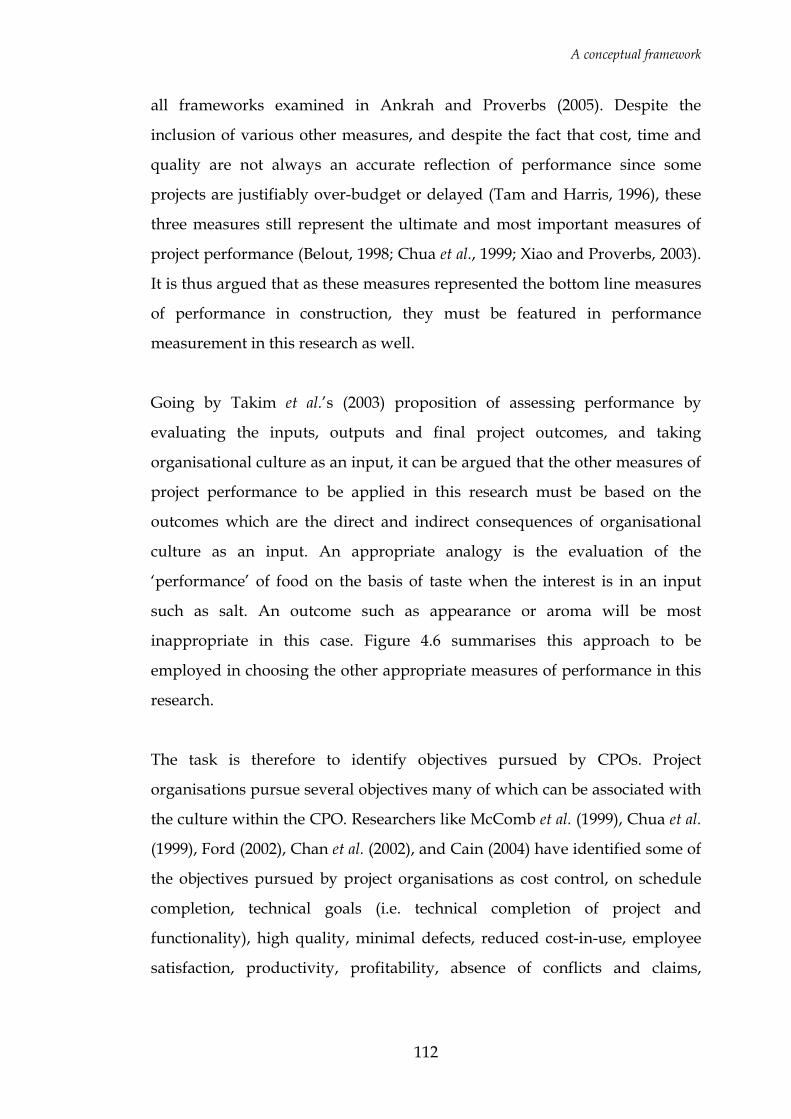
A conceptual framework
112
all frameworks examined in Ankrah and Proverbs (2005). Despite the
inclusion of various other measures, and despite the fact that cost, time and
quality are not always an accurate reflection of performance since some
projects are justifiably over-budget or delayed (Tam and Harris, 1996), these
three measures still represent the ultimate and most important measures of
project performance (Belout, 1998; Chua et al., 1999; Xiao and Proverbs, 2003).
It is thus argued that as these measures represented the bottom line measures
of performance in construction, they must be featured in performance
measurement in this research as well.
Going by Takim et al.’s (2003) proposition of assessing performance by
evaluating the inputs, outputs and final project outcomes, and taking
organisational culture as an input, it can be argued that the other measures of
project performance to be applied in this research must be based on the
outcomes which are the direct and indirect consequences of organisational
culture as an input. An appropriate analogy is the evaluation of the
‘performance’ of food on the basis of taste when the interest is in an input
such as salt. An outcome such as appearance or aroma will be most
inappropriate in this case. Figure 4.6 summarises this approach to be
employed in choosing the other appropriate measures of performance in this
research.
The task is therefore to identify objectives pursued by CPOs. Project
organisations pursue several objectives many of which can be associated with
the culture within the CPO. Researchers like McComb et al. (1999), Chua et al.
(1999), Ford (2002), Chan et al. (2002), and Cain (2004) have identified some of
the objectives pursued by project organisations as cost control, on schedule
completion, technical goals (i.e. technical completion of project and
functionality), high quality, minimal defects, reduced cost-in-use, employee
satisfaction, productivity, profitability, absence of conflicts and claims,
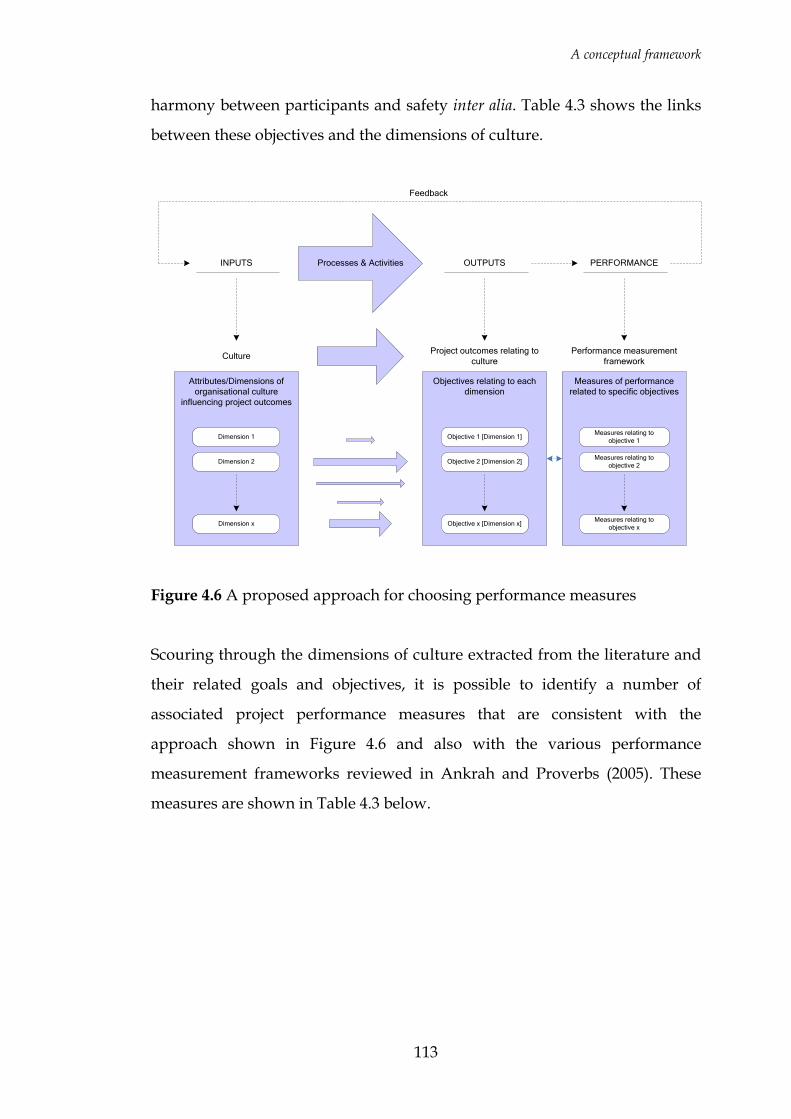
A conceptual framework
113
harmony between participants and safety inter alia. Table 4.3 shows the links
between these objectives and the dimensions of culture.
INPUTS OUTPUTS
Attributes/Dimensions of organisational culture
influencing project outcomes
Objectives relating to each dimension
CultureProject outcomes relating to
culture
Processes & Activities
Dimension 1
Dimension 2
Dimension x
Objective 1 [Dimension 1]
Objective 2 [Dimension 2]
Objective x [Dimension x]
Measures of performance related to specific objectives
Performance measurement framework
Measures relating to objective 1
Measures relating to objective 2
Measures relating to objective x
PERFORMANCE
Feedback
Figure 4.6 A proposed approach for choosing performance measures
Scouring through the dimensions of culture extracted from the literature and
their related goals and objectives, it is possible to identify a number of
associated project performance measures that are consistent with the
approach shown in Figure 4.6 and also with the various performance
measurement frameworks reviewed in Ankrah and Proverbs (2005). These
measures are shown in Table 4.3 below.
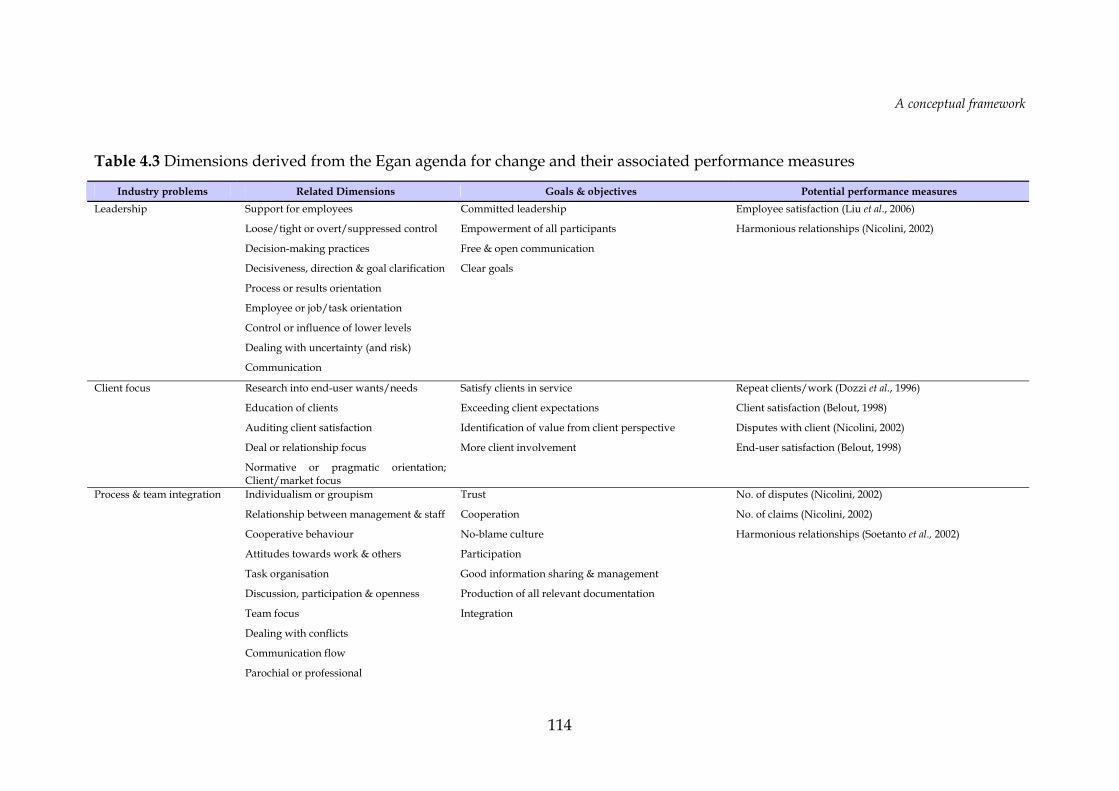
A conceptual framework
114
Table 4.3 Dimensions derived from the Egan agenda for change and their associated performance measures
Industry problems Related Dimensions Goals & objectives Potential performance measures Leadership Support for employees Committed leadership Employee satisfaction (Liu et al., 2006)
Loose/tight or overt/suppressed control Empowerment of all participants Harmonious relationships (Nicolini, 2002)
Decision-making practices Free & open communication
Decisiveness, direction & goal clarification Clear goals
Process or results orientation
Employee or job/task orientation
Control or influence of lower levels
Dealing with uncertainty (and risk)
Communication
Client focus Research into end-user wants/needs Satisfy clients in service Repeat clients/work (Dozzi et al., 1996)
Education of clients Exceeding client expectations Client satisfaction (Belout, 1998)
Auditing client satisfaction Identification of value from client perspective Disputes with client (Nicolini, 2002)
Deal or relationship focus More client involvement End-user satisfaction (Belout, 1998)
Normative or pragmatic orientation; Client/market focus
Process & team integration Individualism or groupism Trust No. of disputes (Nicolini, 2002)
Relationship between management & staff Cooperation No. of claims (Nicolini, 2002)
Cooperative behaviour No-blame culture Harmonious relationships (Soetanto et al., 2002)
Attitudes towards work & others Participation
Task organisation Good information sharing & management
Discussion, participation & openness Production of all relevant documentation
Team focus Integration
Dealing with conflicts
Communication flow
Parochial or professional
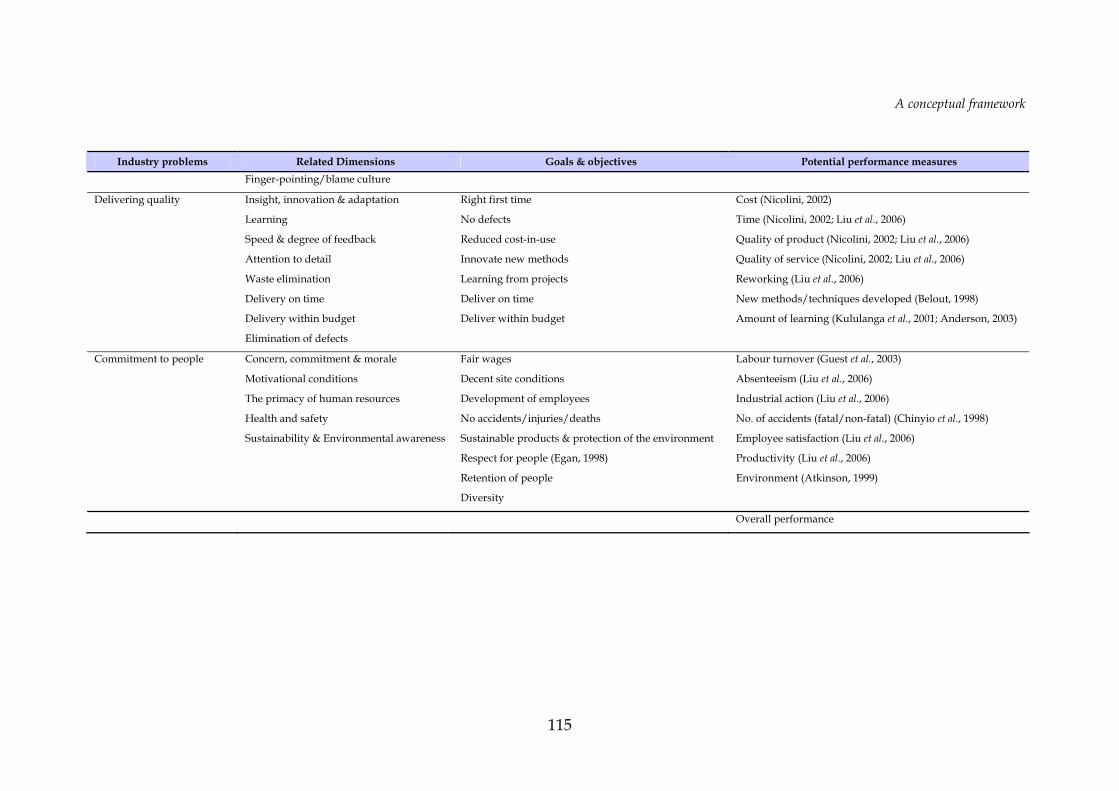
A conceptual framework
115
Industry problems Related Dimensions Goals & objectives Potential performance measures Finger-pointing/blame culture
Delivering quality Insight, innovation & adaptation Right first time Cost (Nicolini, 2002)
Learning No defects Time (Nicolini, 2002; Liu et al., 2006)
Speed & degree of feedback Reduced cost-in-use Quality of product (Nicolini, 2002; Liu et al., 2006)
Attention to detail Innovate new methods Quality of service (Nicolini, 2002; Liu et al., 2006)
Waste elimination Learning from projects Reworking (Liu et al., 2006)
Delivery on time Deliver on time New methods/techniques developed (Belout, 1998)
Delivery within budget Deliver within budget Amount of learning (Kululanga et al., 2001; Anderson, 2003)
Elimination of defects
Commitment to people Concern, commitment & morale Fair wages Labour turnover (Guest et al., 2003)
Motivational conditions Decent site conditions Absenteeism (Liu et al., 2006)
The primacy of human resources Development of employees Industrial action (Liu et al., 2006)
Health and safety No accidents/injuries/deaths No. of accidents (fatal/non-fatal) (Chinyio et al., 1998)
Sustainability & Environmental awareness Sustainable products & protection of the environment Employee satisfaction (Liu et al., 2006)
Respect for people (Egan, 1998) Productivity (Liu et al., 2006)
Retention of people Environment (Atkinson, 1999)
Diversity
Overall performance
A conceptual framework
116
4.6 SUMMARY
On the basis of the literature review a conceptual model has been developed
showing the contextual variables that are instrumental in determining the
organisational culture of construction project organisations that develops, the
relevant dimensions along which the culture of the CPO manifests, and how
these dimensions of culture subsequently influence project performance
outcomes. The model shows that the culture of a CPO is influenced by
composition of the CPO, project characteristics, project manager and
dominant groups, significant events, procurement approach, location, macro-
culture, industry characteristics, recruitment strategies, training initiatives,
and technology and primary function.
The culture that emerges manifests along a number of dimensions that can be
generically classified as leadership, commitment to client, process and team
integration, delivering improved quality, and commitment to people. The
orientations along these dimensions will have consequences for project
performance outcomes as measured inter alia by cost, time, quality, health and
safety, absenteeism, productivity, disputes and harmony.
On the basis of the conceptual model, three fundamental hypotheses have
been proposed for testing in the subsequent phases of this research. These
hypotheses relate to a difference (or lack of it) in cultural orientation among
CPOs, a difference (or lack of it) in performance levels of the different CPOs,
and a relationship (or lack of it) between the cultural orientation and
performance outcomes.
Testing of these hypotheses requires the measurement of organisational
culture and project performance. It is argued, in line with Bandura’s social
cognitive theory, that the measurement of culture should address attitudes
A conceptual framework
117
and perceptions, goal-directed behaviour, and situational conditions
associated with the various dimensions of culture (Cooper, 2000). It is also
argued, in line with Takim et al. (2003), that the measures of performance
assessed should be measures associated with the goals and objectives
associated with the dimensions of culture. These considerations must be
incorporated in the research design. The following chapter discusses the
research methodology that will make this possible. It outlines the research
design and data collection strategies to be employed in obtaining the data
required to measure culture and performance so that the hypotheses can be
tested.
118
CHAPTER 5: RESEARCH METHODOLOGY
5.0 INTRODUCTION
This chapter outlines the research methodology adopted for undertaking this
research study; in this case a quantitative methodology, which incorporates to
a small degree some aspects of the qualitative approach. Arguments are
presented justifying the choice of this approach and the specific research
methods applied to collect data. Coupled with the application of social
cognitive theory for the diagnosis of culture, the methodology represents a
unique contribution to the study of culture from the construction project
context.
5.1 INVESTIGATING THE RELATIONSHIP BETWEEN CULTURE AND PERFORMANCE – THE RESEARCH PARADIGM
Investigating the relationships highlighted in the conceptual model requires a
consideration of the overall research paradigm within which the research is to
be undertaken, and the research methods that are appropriate within this
paradigm. In research there are two major paradigms; the qualitative
paradigm (aka3 phenomenological or interpretive) and the quantitative
paradigm (aka positivist). It has been observed in Walker (1997) that part of
the process of undertaking ‘re-search’ which literally means “to search again”
is to review problems from different perspectives. The choice of research
methodology should enable this process to take place, and should allow the
3 aka – also known as
Research methodology
119
systematic and objective gathering, processing and analysing of data (Walker,
1997) to provide the new perspectives required.
In order to achieve the aim of this research which requires a comparison of
CPOs on a uniform basis so that empirical examination of the relationships
between cultural orientations and performance outcomes can be undertaken,
an overall positivist orientation was adopted. It was shown in the literature
review (refer Chapter 3) that research into culture in a construction context
have typically been either qualitative or quantitative. It was also shown that
the research specifically addressing culture at the project level have in the
main been qualitative. Therefore to provide new perspectives, which is the
essence of undertaking research, the quantitative approach was considered
appropriate. In Chapter 3, the weaknesses of both qualitative and quantitative
approaches of culture research were highlighted and it was argued in line
with Hofstede et al. (1990) and van den Berg and Wilderom (2004) that the
most appropriate approach for this kind of research would be a conciliatory
approach combining both qualitative and quantitative approaches. For this
reason it was considered justifiable to incorporate within this overall
positivist paradigm, an element of the qualitative approach to satisfy this
requirement for a conciliatory approach. This approach is consistent with
Denison and Mishra’s (1995) methodology for investigating the relationship
between organisational culture and effectiveness, and is also consistent with
the arguments of Raftery et al. (1997), Kumaraswamy et al. (1997) and Liu
(2002) in favour of some degree of methodological liberalism in synthesising
paradigms where appropriate in construction management research.
Creswell (2003) provides an example of a scenario in which this approach can
be situated viz; where for instance the researcher wants to both generalise the
findings to a population and develop a detailed view of the meaning of a
phenomenon or concept for individuals, the researcher may first explore
generally in a qualitative manner to learn about what variables to study, and
Research methodology
120
then study those variables with a large sample of individuals quantitatively.
This scenario mirrors this research and shows that the approach being
adopted for this research is appropriate.
In line with Creswell’s (2003) sequential exploratory strategy, the approach
proposed for this research comprises in-depth interviews to begin with
(qualitative), to capture as much as possible, the language and meanings of
the industry, and to capture a sense of what organisational culture is
perceived to be from a construction practitioner’s perspective. Information
obtained from this process is then to be fed into the development of a
questionnaire survey (quantitative) to incorporate several conceptually
related questions covering each of the various dimensions identified through
the qualitative investigation. An overall outline of this approach is shown in
Figure 5.1. As indicated already, an overall positivist paradigm is being
adopted in this research and therefore the greater priority in this research is
placed on the quantitative aspects. This is because as argued previously (refer
Chapter 3) this approach best facilitates the comparison of organisations on
the same basis and allows the research objectives of empirically examining
the relationships between cultural orientations and performance outcomes to
be pursued.
Key to this whole approach is the focus on the construction project context,
and on practices or preferred solutions for dealing with some of the
fundamental problems experienced by CPOs in line with the definition of
culture assumed for this research.
As far as research into organisational culture in the construction industry is
concerned, applying this approach represents a significant departure from the
approaches applied in construction culture research like Maloney and Federle
(1990), Root (2002), Serpell and Rodriguez (2002), Rameezdeen and
Gunarathna (2003), and Ankrah and Langford (2005).
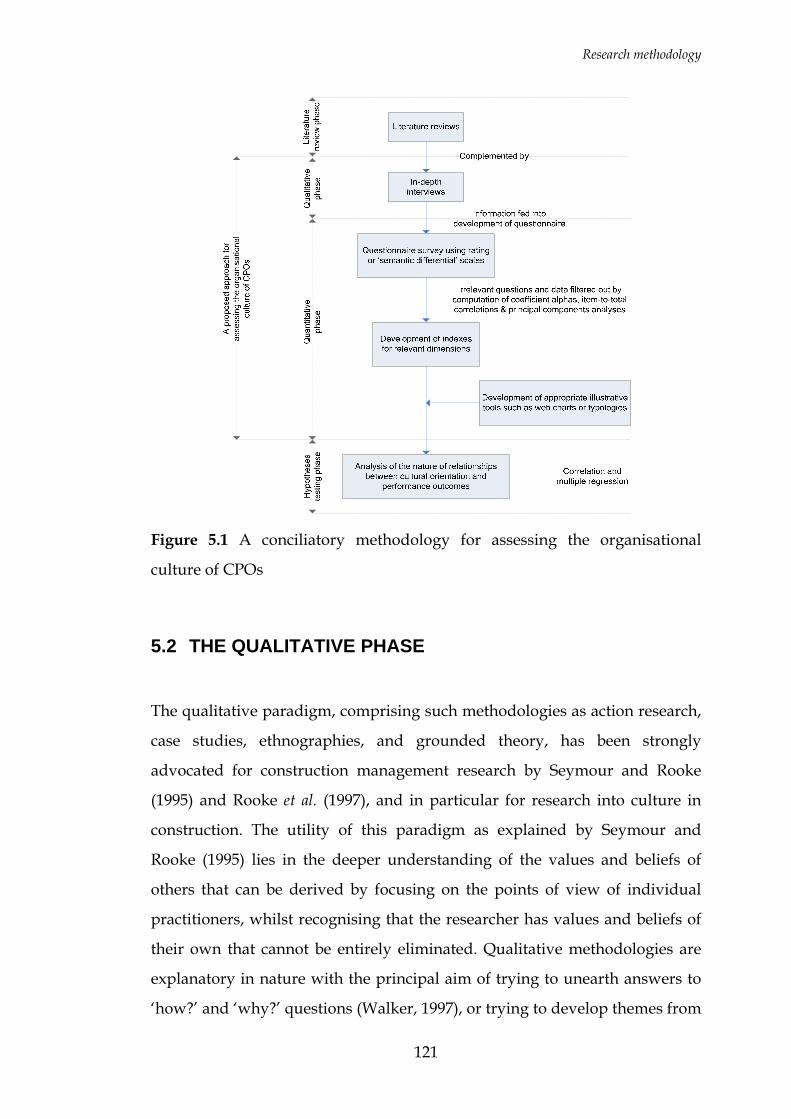
Research methodology
121
Figure 5.1 A conciliatory methodology for assessing the organisational
culture of CPOs
5.2 THE QUALITATIVE PHASE
The qualitative paradigm, comprising such methodologies as action research,
case studies, ethnographies, and grounded theory, has been strongly
advocated for construction management research by Seymour and Rooke
(1995) and Rooke et al. (1997), and in particular for research into culture in
construction. The utility of this paradigm as explained by Seymour and
Rooke (1995) lies in the deeper understanding of the values and beliefs of
others that can be derived by focusing on the points of view of individual
practitioners, whilst recognising that the researcher has values and beliefs of
their own that cannot be entirely eliminated. Qualitative methodologies are
explanatory in nature with the principal aim of trying to unearth answers to
‘how?’ and ‘why?’ questions (Walker, 1997), or trying to develop themes from
Research methodology
122
the data (Creswell, 2003). Recalling the discussions in Chapter 3, it can be
seen that this approach is ideally suited to an investigation of culture
conceptualised as an ideational phenomenon (anthropological perspective) or
as a root metaphor (organisational perspective).
As can be observed from the research objectives, the hypotheses and the
thrust of all the preceding chapters, the main focus of this research was not to
address ‘how?’ and ‘why?’ questions. However, it was considered logical to
incorporate elements of this methodology within this research, especially as
this would yield some insight into construction culture “from the inside and
through the definition” of practitioners (Hofstede, 2001; Rooke and Seymour,
2002), and help identify aspects or dimensions of culture that were
considered important from construction practitioners’ point of view without
imposing biases from the literature. This phase of the research was thus
exploratory in nature.
Following the precedent set by Hofstede et al. (1990), interviews were
adopted as an appropriate method for collecting the qualitative data required
for this phase to enable the exploration of the culture phenomenon. It is on
record that interviews are the most widely used qualitative method in
organisational research (King, 1994).
Fundamentally, the interviews were to capture a sense of what organisational
culture is from a practitioner point of view. The interviews were also to
identify the fundamental problems CPOs have to deal with and potential
aspects of organisational practices which mirror the culture of CPOs and may
be operationalised as dimensions. By conducting these interviews, it was
possible to consider the relevance of the dimensions identified from the
literature as captured in Table 4.2. As argued by Delobbe et al. (2002), a priori
dimensions such as those in Table 4.2 are only useful to the extent that they
are sufficiently relevant and generic. The interviews were therefore an
Research methodology
123
opportunity to test the relevance and comprehensiveness of these dimensions
and the conceptual framework as a whole (cf. Nicolini, 2002).
5.2.1 Interviews
The interviews were an opportunity to ignore a priori ideas and to draw on
the knowledge of practitioners without imposing biases or knowledge
obtained directly from literature or experience (cf. Nicolini, 2002). Like
Hofstede et al. (1990), the intention was to paint a qualitative, empathetic
description of the culture on construction projects.
A series of in-depth semi-structured interviews were carried out with
experienced practitioners working within the industry. The main thrust of the
interviews was to draw out those issues that were considered important on
construction projects and the main challenges faced by project organisations.
It was also to draw out ‘who’ and ‘what’ had a significant impact on the
culture of the project organisation. These interviews permitted the
development of a certain level of empathy with the circumstances of the
organisations being investigated – a requirement set out in Hofstede (2001)
and Serpell and Rodriguez (2002). The interview schedule used to guide the
interviews is shown in Appendix C. It is important to emphasise that this
schedule only served as a guide, and the interviewer was free to probe and
ask questions in any order as appropriate. In line with Trompenaars and
Hampden-Turner (1999), the investigations were always started with the
question “what does the concept of culture mean to you?”
Nine interviews were conducted in all with highly experienced construction
industry practitioners who represented major construction organisations
operating out of the West Midlands (UK). Seven of these participants were
approached directly to participate in this research and a further two indicated
their willingness to be interviewed when they responded to a random
Research methodology
124
questionnaire survey (Appendix B) of West Midlands based construction
organisations. Participants had an average of 22 years working experience.
Their positions included Managing Director, Operations Director, Regional
Manager and Health & Safety Manager.
Average duration of these interviews was circa 51 minutes. All interviews
were recorded and transcribed later to support the notes taken. The method
of analysis adopted was the template approach involving the examination of
the interview transcripts for common themes and sub-themes using an
analysis guide. The analysis guide, also referred to as a ‘codebook’ in King
(1994) was derived largely from the literature and consisted of themes related
to what culture means, how culture develops, and how culture manifests.
This guide book was modified as necessary with the on-going analysis of the
interview transcripts and provided a systematic basis for examining the data.
To facilitate the analysis of data, the NVivo NUDIST software was employed
for coding, organising, linking, and exploring the transcripts and notes. The
software enabled the coding of responses from interviewees and organising
these into appropriate themes and sub-themes in line with the analysis guide.
This qualitative phase was intended to help in refining the definition of
culture, and refining the framework for measuring the organisational culture
of CPOs in the main questionnaire survey. Some of the findings of this
qualitative phase have been reported in Ankrah et al. (2007d). Key findings
are summarised below.
5.2.1.1 What is culture?
In response to the question “what does the concept of culture mean to you?”,
a range of views were expressed by the interviewees. According to
interviewees;

Research methodology
125
“Organisational culture...is about the passion and the pace of the business,
and...the smell of the place. Does it smell right? Does it feel right?...does it
have the energy? Is there a positive energy there, as opposed to a negative
energy? Do people have that passion for their role?...do they really want to
succeed? And when they are talking to you are they convincing about the
process that they are involved in, about the work that they are involved in?
And can it be delivered at pace, is there an ability to change?”
“…it's all about people and their attitudes. That’s the way I can describe it.”
Although not quite as academically framed as the definitions of culture
reviewed in Chapter 3, it can be seen from the above quotations that the
interviewees, who are construction project participants, have the same
notions of culture as implied in the theories. Consistent with the theoretical
arguments made about emphasising practices in the assessment of
organisational culture, interviewees related the culture not only with
assumptions or meanings, but more with the attitudes of workers and with
their behaviours saying;
“…within the culture, there needs to be a set of recognisable behaviours. So
you have to be able to say yes, I understand that person works for
XYZ4…because they demonstrate these behaviours”
“…a kind of an all encompassing thing there that says there is a set of
behaviours…and you should be able to see those in people that you interface
with.”
In terms of the descriptors used by interviewees to illustrate some of the
cultures they had experienced, some of the insightful ones are captured in
Figure 5.2 below. 4 XYZ has been inserted in place of the real name of the organisation.
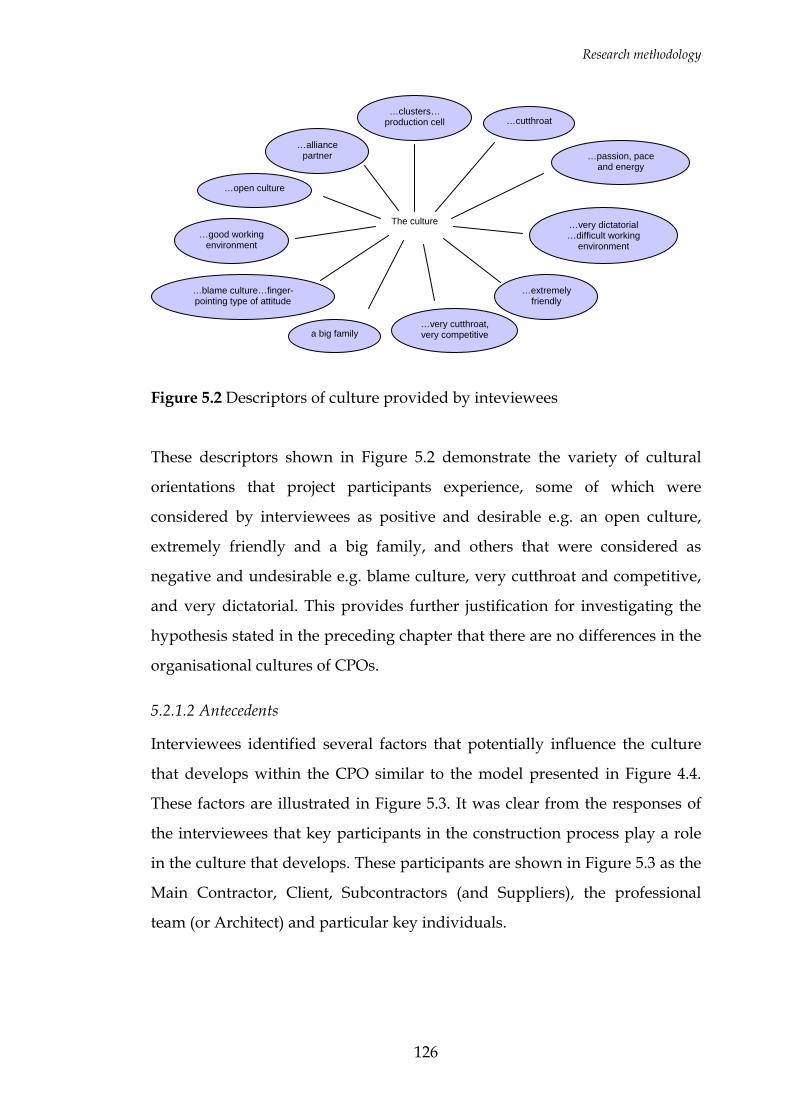
Research methodology
126
Figure 5.2 Descriptors of culture provided by inteviewees
These descriptors shown in Figure 5.2 demonstrate the variety of cultural
orientations that project participants experience, some of which were
considered by interviewees as positive and desirable e.g. an open culture,
extremely friendly and a big family, and others that were considered as
negative and undesirable e.g. blame culture, very cutthroat and competitive,
and very dictatorial. This provides further justification for investigating the
hypothesis stated in the preceding chapter that there are no differences in the
organisational cultures of CPOs.
5.2.1.2 Antecedents
Interviewees identified several factors that potentially influence the culture
that develops within the CPO similar to the model presented in Figure 4.4.
These factors are illustrated in Figure 5.3. It was clear from the responses of
the interviewees that key participants in the construction process play a role
in the culture that develops. These participants are shown in Figure 5.3 as the
Main Contractor, Client, Subcontractors (and Suppliers), the professional
team (or Architect) and particular key individuals.
…passion, pace and energy
…clusters… production cell
…alliance partner
…good working environment
…open culture
…very cutthroat, very competitive
…very dictatorial …difficult working
environment
…extremely friendly
The culture
…blame culture…finger-pointing type of attitude
…cutthroat
a big family
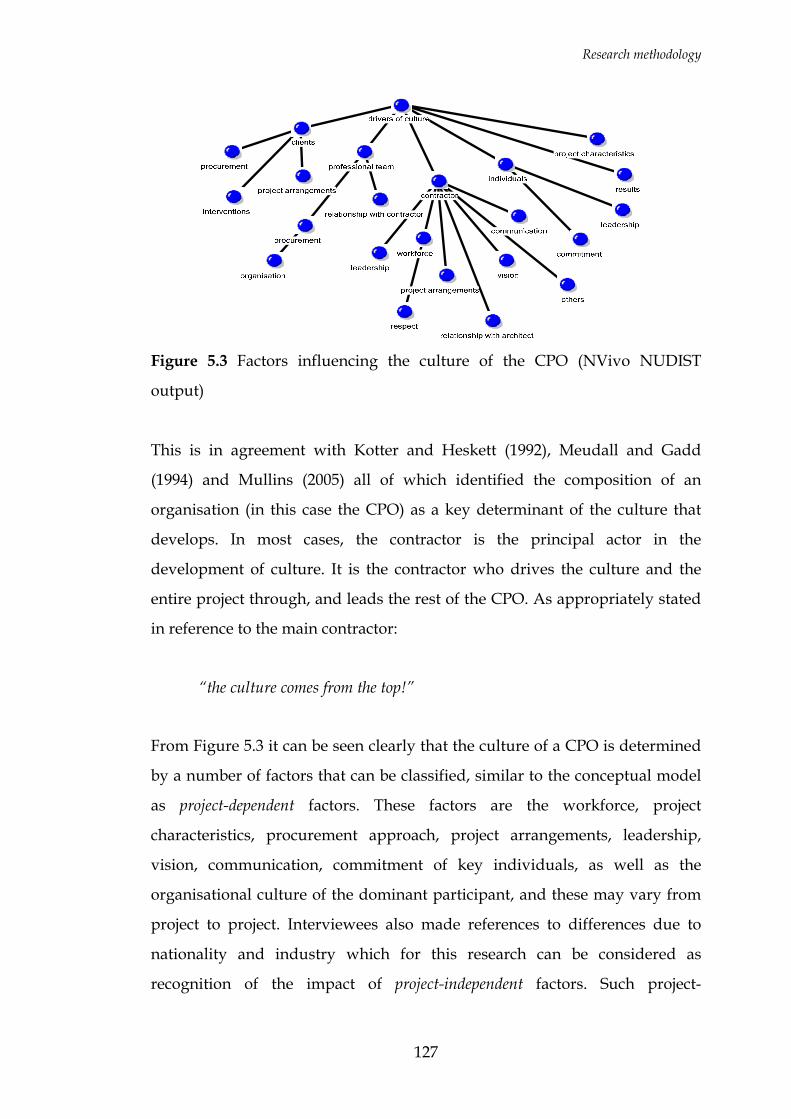
Research methodology
127
Figure 5.3 Factors influencing the culture of the CPO (NVivo NUDIST
output)
This is in agreement with Kotter and Heskett (1992), Meudall and Gadd
(1994) and Mullins (2005) all of which identified the composition of an
organisation (in this case the CPO) as a key determinant of the culture that
develops. In most cases, the contractor is the principal actor in the
development of culture. It is the contractor who drives the culture and the
entire project through, and leads the rest of the CPO. As appropriately stated
in reference to the main contractor:
“the culture comes from the top!”
From Figure 5.3 it can be seen clearly that the culture of a CPO is determined
by a number of factors that can be classified, similar to the conceptual model
as project-dependent factors. These factors are the workforce, project
characteristics, procurement approach, project arrangements, leadership,
vision, communication, commitment of key individuals, as well as the
organisational culture of the dominant participant, and these may vary from
project to project. Interviewees also made references to differences due to
nationality and industry which for this research can be considered as
recognition of the impact of project-independent factors. Such project-

Research methodology
128
independent factors are the same irrespective of the project under
consideration.
5.2.1.3 Behaviours
The responses of the interviewees showed that these manifestations of culture
can be viewed generally in terms of relationships between participants,
attitudes of people and their actual behaviours. These views are consistent
with the various theories of culture discussed in Chapter 3 (cf. Allaire and
Firsirotu, 1984; Schein, 1985; Denison and Mishra, 1995; and Hofstede, 2001).
The various dimensions raised by the interviewees are shown in the model
generated by the NVivo NUDIST software (Figure 5.4).
Many of these dimensions of culture are consistent with the dimensions of
culture already identified in the literature (cf. Taylor and Bowers, 1972;
Quinn, 1988; Thompson, 1993; Handy 1993; 1995; Erez and Gati, 2004; and
Mullins, 2005) and captured in Tables 3.2 and 4.2 (refer Chapters 3 and 4).
Examples are communication, innovation, decision-making, participation,
commitment to people and client/customer focus. This consistency
demonstrates the validity of the issues raised by the interviewees.
Significantly, there are other dimensions raised by interviewees which were
not represented in the dimensions identified in the general management and
organisational literature. These are issues which reflect the uniqueness of the
problems faced by CPOs and the issues they have to deal with. Examples of
these are planning, site tidiness, health and safety, partnering and
subcontracting.
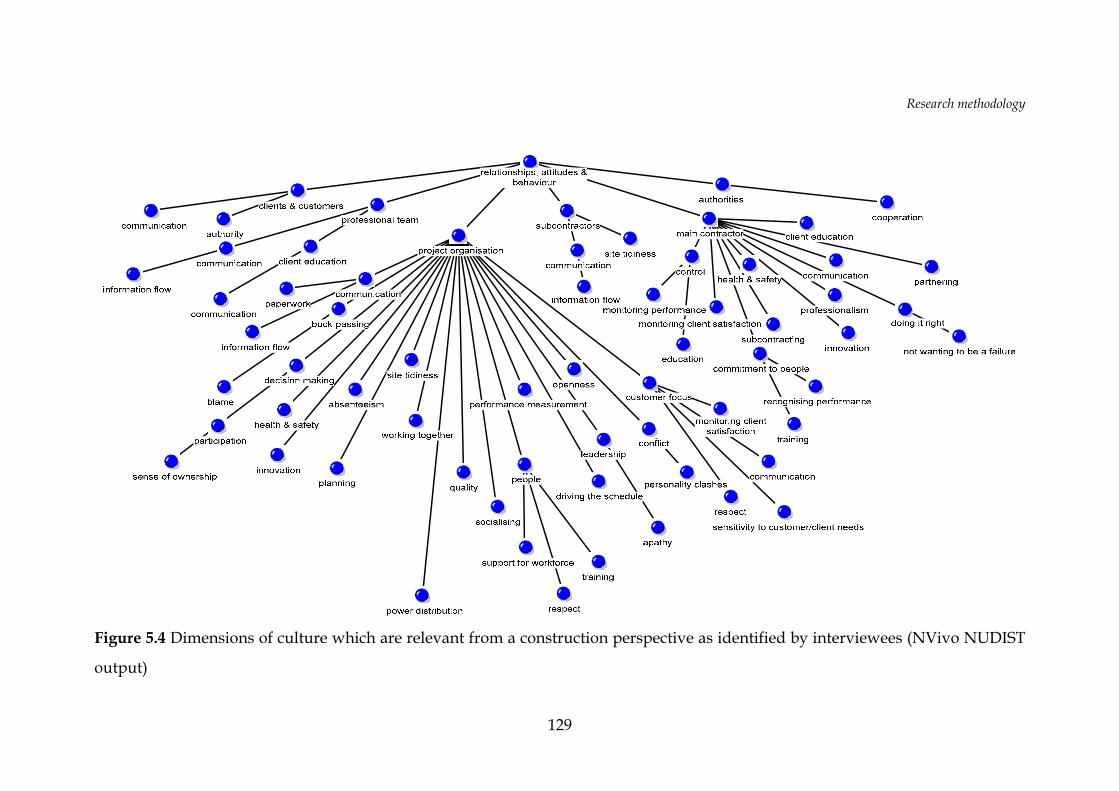
Research methodology
129
Figure 5.4 Dimensions of culture which are relevant from a construction perspective as identified by interviewees (NVivo NUDIST
output)
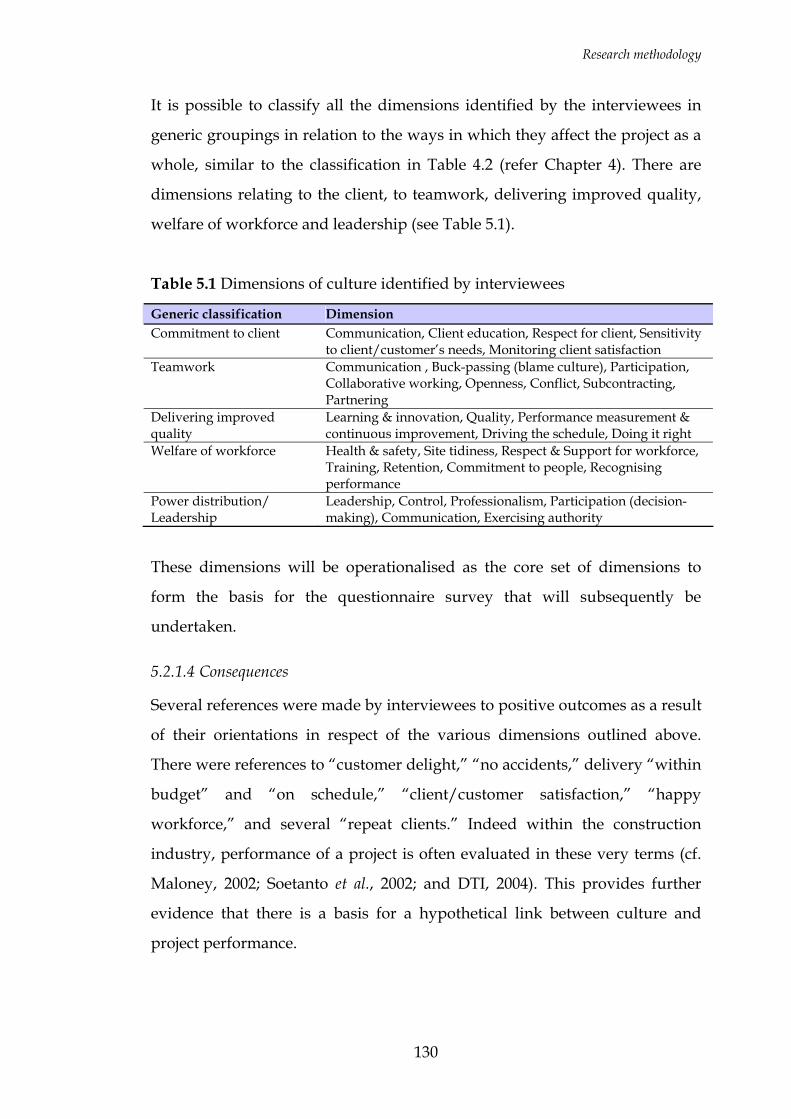
Research methodology
130
It is possible to classify all the dimensions identified by the interviewees in
generic groupings in relation to the ways in which they affect the project as a
whole, similar to the classification in Table 4.2 (refer Chapter 4). There are
dimensions relating to the client, to teamwork, delivering improved quality,
welfare of workforce and leadership (see Table 5.1).
Table 5.1 Dimensions of culture identified by interviewees
Generic classification Dimension Commitment to client Communication, Client education, Respect for client, Sensitivity
to client/customer’s needs, Monitoring client satisfaction Teamwork Communication , Buck-passing (blame culture), Participation,
Collaborative working, Openness, Conflict, Subcontracting, Partnering
Delivering improved quality
Learning & innovation, Quality, Performance measurement & continuous improvement, Driving the schedule, Doing it right
Welfare of workforce Health & safety, Site tidiness, Respect & Support for workforce, Training, Retention, Commitment to people, Recognising performance
Power distribution/ Leadership
Leadership, Control, Professionalism, Participation (decision-making), Communication, Exercising authority
These dimensions will be operationalised as the core set of dimensions to
form the basis for the questionnaire survey that will subsequently be
undertaken.
5.2.1.4 Consequences
Several references were made by interviewees to positive outcomes as a result
of their orientations in respect of the various dimensions outlined above.
There were references to “customer delight,” “no accidents,” delivery “within
budget” and “on schedule,” “client/customer satisfaction,” “happy
workforce,” and several “repeat clients.” Indeed within the construction
industry, performance of a project is often evaluated in these very terms (cf.
Maloney, 2002; Soetanto et al., 2002; and DTI, 2004). This provides further
evidence that there is a basis for a hypothetical link between culture and
project performance.
Research methodology
131
5.2.2 Implications for conceptual model
The findings from the interviews suggest that generally the relationships
highlighted by the conceptual model are well founded, consistent with what
obtains in the construction industry as per the views of practitioners, and can
thus be used as the basis of the questionnaire survey. The conceptual model
however requires a few minor modifications in respect of the determinants
and dimensions of culture to reflect the perspectives provided by the
interviewees. Having established this, the research was able to proceed to the
quantitative phase of the investigation.
5.3 THE QUANTITATIVE PHASE
A quantitative approach to this research was considered necessary because as
noted in Walker (1997), empirical research provides strong evidence for
explaining phenomenon, enabling researchers to address the questions ‘how
much’ or ‘how many?’. More appropriately in the context of this investigation
this kind of research enables the researcher to establish “which variables are
significant, and to what extent, in a scientific way” (Walker, 1997), thus
allowing the objective of explanatory assertions about the sample, and by
inference the population, to be achieved (Babbie, 1990; Czaja and Blair, 1996).
In conducting quantitative research, three main approaches are typically
employed. These approaches are identified by Fellows and Liu (1997) as ‘desk
research’, experimentation and surveys.
5.3.1 ‘Desk research’
Desk research involves using data collected by others, perhaps analysing it in
alternative ways to yield fresh insight. This approach according to Fellows
and Liu (1997), though cheap, time saving and suitable for studies in such
areas as macro-economics where data can not be obtained by any other viable
Research methodology
132
alternatives, is also often problematic. The problems stem from the fact that
the data, collected for other purposes, may not be well tailored for the
particular research being undertaken. Besides, sampling may also not be
appropriate to the requirements of the research, and the data may have
inherent limitations due to the manner in which it was collected (ibid). For
this research, the bespoke nature of the framework adopted precluded the
application of this strategy.
5.3.2 Experimentation
In experimentation, results are sought by effecting incremental changes in the
independent variable and measuring the effect, if any, on the dependent
variable (Fellows and Liu, 1997; Creswell, 2003). It is acknowledged in
Fellows and Liu (ibid) that this strategy poses significant problems for
research in the social sciences which are far in excess of those encountered in
a science research laboratory. The most significant of these problems relates
to the amount of control over the variables. It is argued (ibid) that society is
dynamic and the number of variables operating is vast, making it difficult to
hold constant all the extraneous factors influencing the outcomes of the
experiment. In this research, where there is very limited control over the
research environment (the construction project), these problems imply that
the experimentation research strategy is also inappropriate.
5.3.3 Survey research
According to Czaja and Blair (1996), survey research is one of the foremost
means of social investigation. It builds on previous work which has already
developed principles, laws and theories that help to decide the data
requirements of the particular research project (Fellows and Liu, 1997).
Survey research include cross-sectional and longitudinal studies using
questionnaires or structured interviews for data collection, with the aim of
generalizing from a sample to a population (Babbie, 1990; Creswell, 2003).
Research methodology
133
Although it also has limitations such as low response rates (for questionnaire
surveys) and the risk of bias, this strategy offers the opportunity to explore a
broad range of issues such as those envisaged in this research.
In this research therefore, the survey research design was adopted in the
quantitative phase to provide, as indicated by Creswell (2003), a quantitative
description of trends, attitudes, or opinions of the population by studying a
sample of that population. Specifically, a cross-sectional questionnaire survey
of construction project participants was adopted with the questionnaire
designed to elicit information about the construction project in respect of
project features, performance outcomes and cultural orientations. Table 5.2
shows the dimensions of culture and performance measures derived from the
literature and interviews which were addressed by the questionnaire.
5.3.3.1 Unit of analysis
The aim of this study is to establish the existence or otherwise of a
relationship between the cultural orientation of the CPO and the project
performance outcomes. From this it can be seen that the appropriate unit of
analysis for the research is the construction project, with the survey enquiring
into the culture of the CPO or temporary project multi-organisation
delivering the project and the performance outcomes of the projects on which
they were engaged. Because of the multi-organisational nature of
construction projects, within this unit of analysis, there exist embedded units
with their own subcultures. These subcultures as recognised in
Kumaraswamy et al.’s (2002) framework, relate not just to organisational
differences but also to operational, professional and individualistic
differences, making it similar to regular organisations where departmental
and divisional subcultures also exist within the overall organisational culture.
To ensure therefore that the survey captured the culture of the CPO rather
than the embedded units, the questionnaire was developed with specific
emphasis on the project.

Research methodology
134
Table 5.2 Dimensions of culture and their associated performance measures derived from literature and the interviews
Industry problems Related Dimensions Goals & objectives Potential performance measures Leadership Support for employees Committed leadership Employee satisfaction
Relationship between management & staff Empowerment of all participants Harmonious relationships
Loose/tight or overt/suppressed control Free & open communication
Participation (decision-making) Clear goals
Decisiveness, direction & goal clarification
Control or influence of lower levels
Communication
Client focus Communication Satisfy clients in service Repeat clients/work
Research into end-user wants/needs Exceeding client expectations Client satisfaction
Client education Identification of value from client perspective Disputes with client
Monitoring client satisfaction More client involvement End-user satisfaction
Respect for client
Sensitivity to client/customer’s needs
Process & team integration Communication Trust No. of disputes
Collaborative working Cooperation No. of claims
Attitudes towards work & others No-blame culture Harmonious relationships
Task organisation Participation
Participation Good information sharing & management
Team focus Production of all relevant documentation
Dealing with conflicts Integration
Openness
Buck-passing (blame culture)
Delivering quality Insight, innovation & adaptation Right first time Cost
Learning No defects Time
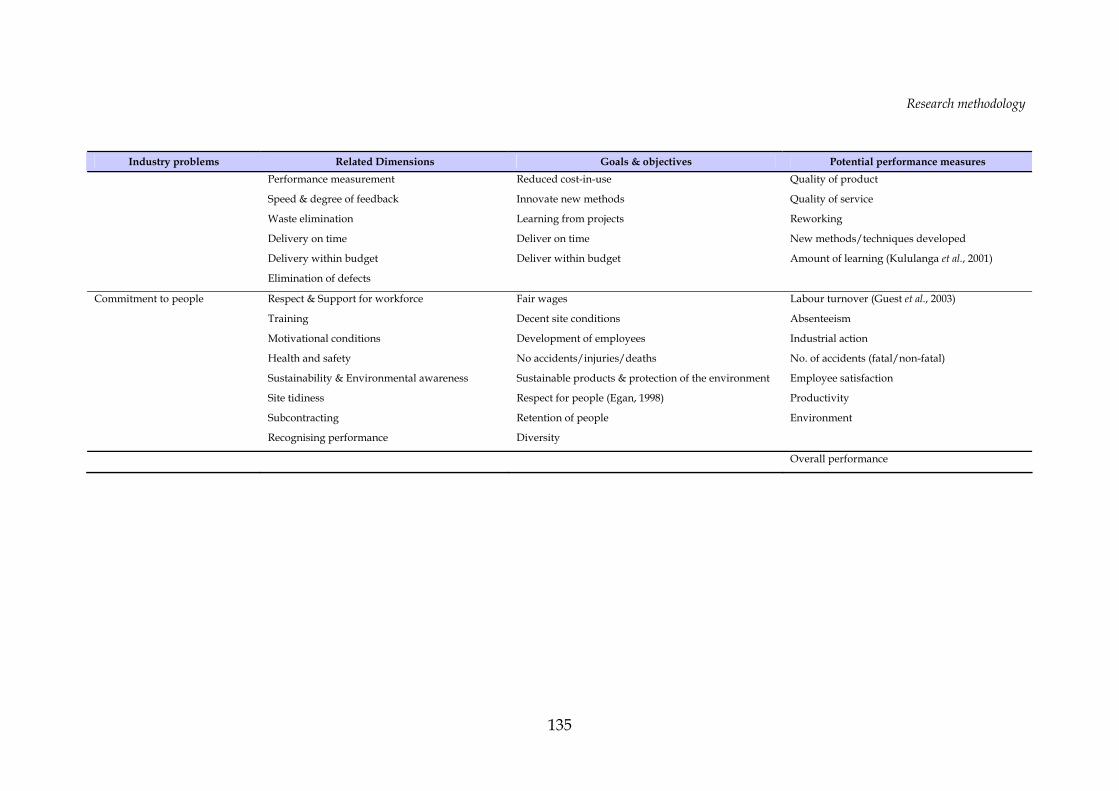
Research methodology
135
Industry problems Related Dimensions Goals & objectives Potential performance measures Performance measurement Reduced cost-in-use Quality of product
Speed & degree of feedback Innovate new methods Quality of service
Waste elimination Learning from projects Reworking
Delivery on time Deliver on time New methods/techniques developed
Delivery within budget Deliver within budget Amount of learning (Kululanga et al., 2001)
Elimination of defects
Commitment to people Respect & Support for workforce Fair wages Labour turnover (Guest et al., 2003)
Training Decent site conditions Absenteeism
Motivational conditions Development of employees Industrial action
Health and safety No accidents/injuries/deaths No. of accidents (fatal/non-fatal)
Sustainability & Environmental awareness Sustainable products & protection of the environment Employee satisfaction
Site tidiness Respect for people (Egan, 1998) Productivity
Subcontracting Retention of people Environment
Recognising performance Diversity
Overall performance
Research methodology
136
5.3.3.2 Questionnaire development
Being the main data collection tool, the questionnaire was designed to be
‘respondent-friendly’ in order to maximise the response rate, which is widely
recognised as being particularly low in construction management research
(Xiao, 2002). It is well known that proper questionnaire design is vital for
successful data collection (Babbie, 1992; Fellows and Lui, 1997; Creswell,
2003). Considerable effort was therefore devoted towards this endeavour.
As indicated earlier, the unit of analysis in this research was the construction
project. In order to obtain all the data required to address the research
hypotheses, information on already completed projects was required. The
questionnaire was therefore developed with an invitation to participants to
use their most recently completed construction project as the frame of
reference for responding to the survey. The rationale for targeting most
recently completed projects was that on such projects, complete data can be
collected to enable a reasonably accurate assessment of performance to be
made especially as some of the performance measures are output based and
retrospective (Dainty et al., 2003). Besides, such projects would also still be
relatively fresh in the minds of respondents, making it relatively easier for
them to recall their experiences thus minimising the potential distortions.
This is consistent with Borman (1978), Tsui and Ohlott (1988) and Weekley
and Gier (1989). Retrospective data collection designs according to Ogbonna
and Harris (2002) are a valid and reliable means of gaining insight into
organisational phenomena. Ogbonna and Harris (2002) and Anderson (2003)
are examples of research that have utilised such designs in investigating the
phenomenon of culture. Questionnaire items were therefore directed towards
unearthing facts and views of respondents about these projects. The
questionnaire survey was designed primarily to elicit information on the kind
of cultures that exist within construction project organisations and
Research methodology
137
information on performance outcomes so that relationships between them
can be explored using appropriate statistical techniques.
The questionnaire was in four parts. The first section requested general
personal information about the respondent. The second section asked
respondents to provide information about the most recently completed
construction project on which they had direct operational involvement. This
section was based on the literature review and interviews in regards to
factors influencing the culture of a CPO. In exploring the various cultures that
have developed within CPOs, this section was intended to provide data for
contextualising and categorising the various cultural orientations found.
The third section requested details about the performance of the project. The
specific indicators assessed were based on those identified in Table 5.2. These
performance indicators were chosen in accordance with the theory of task
performance which posits that measures of performance must reflect the
desired goals/objectives (Ankrah and Proverbs, 2005). By identifying the
project objectives in respect of the key dimensions of organisational culture, it
was possible to identify appropriate performance indicators (Table 5.2) which
then formed the basis of the questions in this section of the questionnaire
survey. In the analysis of the relationships between organisational culture
and construction project performance, the performance measures were to be
considered as the dependent variables to be correlated with the independent
cultural variables.
The last section requested the respondents’ opinion on the culture that existed
within the CPO on the project. The questions addressed the key dimensions
of culture identified in the interviews conducted with various construction
professionals. There were three parts to this section of the questionnaire, and
these parts assessed the three aspects of attitudes and perceptions, behaviours
and situational contexts respectively in compliance with the social cognitive

Research methodology
138
theory (Parajes, 2002; Cooper, 2000). From the data collected therefore,
indexes were to be constructed for each dimension of culture bringing
together the relevant questions from each of these three parts. These indexes
were then to be employed as measures of culture and used as the
independent variables in the statistical analysis of the relationships between
organisational culture and project performance. With this data, it will be
possible to explore and categorise the cultures of CPOs, and to develop
appropriate typologies for the cultures within CPOs.
The various sections and questions in the questionnaire reproduced in
Appendix D, were therefore all relevant for the statistical analyses. In total,
the questionnaire contained 165 items.
In developing this questionnaire, questions were deliberately constructed to
include both close ended and open ended questions, and measurements also
included the range of nominal, ordinal, and scale measurements. The variety
was to provide flexibility in questionnaire design, and to avoid monotony
and make the questionnaire more interesting for respondents as suggested by
Babbie (1990). In the main however, close ended questions with ordinal scales
were employed to make the questionnaire as easy to complete as possible.
The layout and format of the questionnaire was also given a lot of
consideration to maximise response and to ensure that respondents did not
inadvertently miss questions (ibid). Instructions were also provided generally
and at the beginning of each section for completing the questionnaire. Once
developed, the questionnaire was ready for testing.
5.4 PILOT SURVEY
In order to evaluate the clarity and comprehensiveness of the questionnaire,
as well as the feasibility of the survey as a whole, a pilot survey was
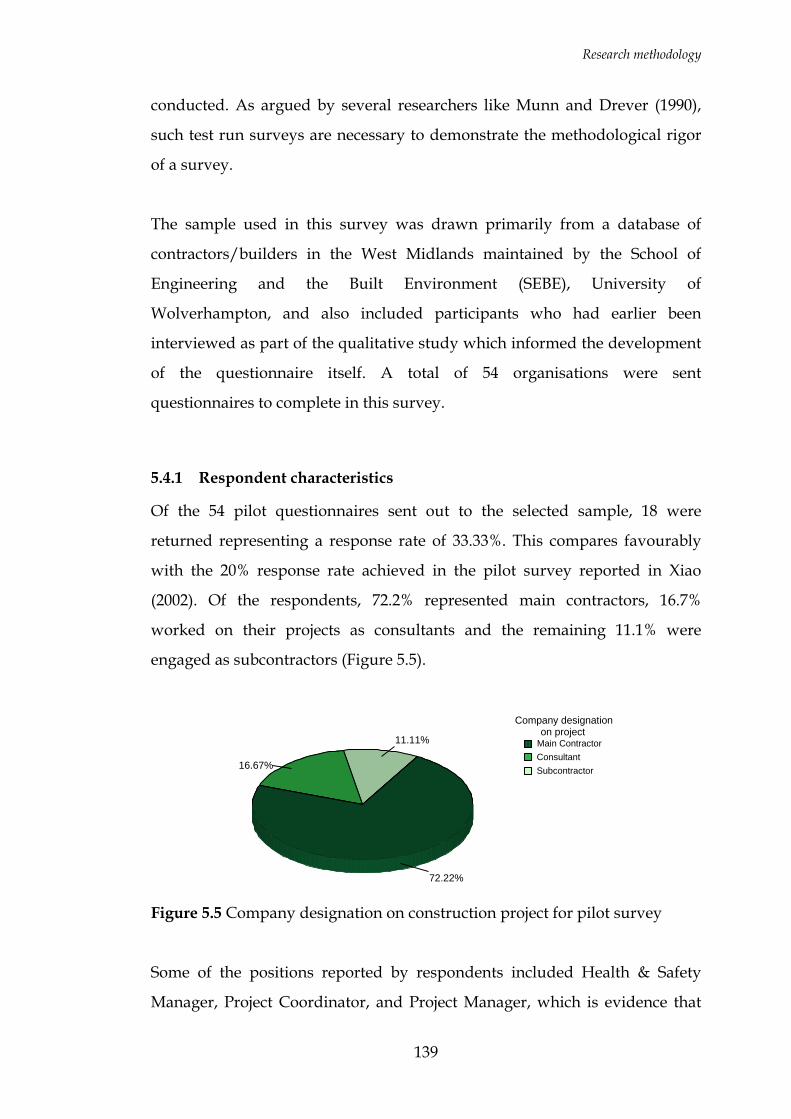
Research methodology
139
conducted. As argued by several researchers like Munn and Drever (1990),
such test run surveys are necessary to demonstrate the methodological rigor
of a survey.
The sample used in this survey was drawn primarily from a database of
contractors/builders in the West Midlands maintained by the School of
Engineering and the Built Environment (SEBE), University of
Wolverhampton, and also included participants who had earlier been
interviewed as part of the qualitative study which informed the development
of the questionnaire itself. A total of 54 organisations were sent
questionnaires to complete in this survey.
5.4.1 Respondent characteristics
Of the 54 pilot questionnaires sent out to the selected sample, 18 were
returned representing a response rate of 33.33%. This compares favourably
with the 20% response rate achieved in the pilot survey reported in Xiao
(2002). Of the respondents, 72.2% represented main contractors, 16.7%
worked on their projects as consultants and the remaining 11.1% were
engaged as subcontractors (Figure 5.5).
11.11%
16.67%
72.22%
SubcontractorConsultantMain Contractor
Company designationon project
Figure 5.5 Company designation on construction project for pilot survey
Some of the positions reported by respondents included Health & Safety
Manager, Project Coordinator, and Project Manager, which is evidence that
Research methodology
140
these respondents are capable of providing the information requested in the
questionnaire.
5.4.2 Impact of analysis on questionnaire development for main survey
As a result of the analysis of the pilot survey, the questionnaire was taken
through a process of revision to make it more suitable for the main
questionnaire survey. From the feedback provided by respondents, the
average time taken to complete a questionnaire was approximately 24
minutes. It was therefore considered unnecessary to reduce the overall
number of questions in the questionnaire to make it shorter.
Three questions were withdrawn completely because all respondents gave
exactly the same response, or did not provide an adequate response at all. An
example was a question on whether there were incidents/threats of industrial
action on the project. All respondents replied in the negative.
Three new questions were introduced to help with the assessment of project
performance. These were questions on:
Number of design variations;
Number of times called back during the defects liability period; and
Satisfaction with project profitability.
Some of the questions on the dimensions of culture were also re-worded as
the feedback from the respondents seemed to suggest that they found them
ambiguous. This was confirmed by the reliability analysis (using Cronbach’s
alpha) and the Friedman test which was applied to test for significant
differences in the ranking of related measures of cultural orientation (Kinnear
and Gray, 2004). Having satisfied the requirement to pretest the questionnaire
(cf. Babbie, 1990; Munn and Drever, 1990; Czaja and Blair, 1996) and having

Research methodology
141
completed the revision of the questionnaire, it was ready for deployment in
the main survey.
5.5 SAMPLING FOR MAIN SURVEY
As indicated in Babbie (1990), sampling is necessary because of the
constraints of time and cost. In this research, the target population is UK
contractors (as defined in Chapter 2) and it is well known that UK contractors
exceed 175K. In Chapter 2 it was reported that there were 176K private
contractors in the UK as at the year 2004 (DTI, 2005). Because it was
impractical to collect data from all 176K contractors in the population,
sampling was necessary to make the survey possible.
Following the examples of Soetanto et al. (2001) and Xiao (2002), the sampling
frame that was adopted for the selection of the sample was the list of
contractors registered in the UK Kompass (2006) register. In order to
determine a suitable size for the sample, the following formula from Czaja
and Blair (1996) and Creative Research Systems (2003) was applied:
( )2
2 1c
ppzss −×=
Where:
ss = sample size
z = standardised variable
p = percentage picking a choice, expressed as a decimal
c = confidence interval, expressed as a decimal
As with most other research, a confidence level of 95% was assumed (Munn
and Drever, 1990; Creative Research Systems, 2003). For 95% confidence level
(i.e. significance level of α = 0.05), z = 1.96. Based on the need to find a balance
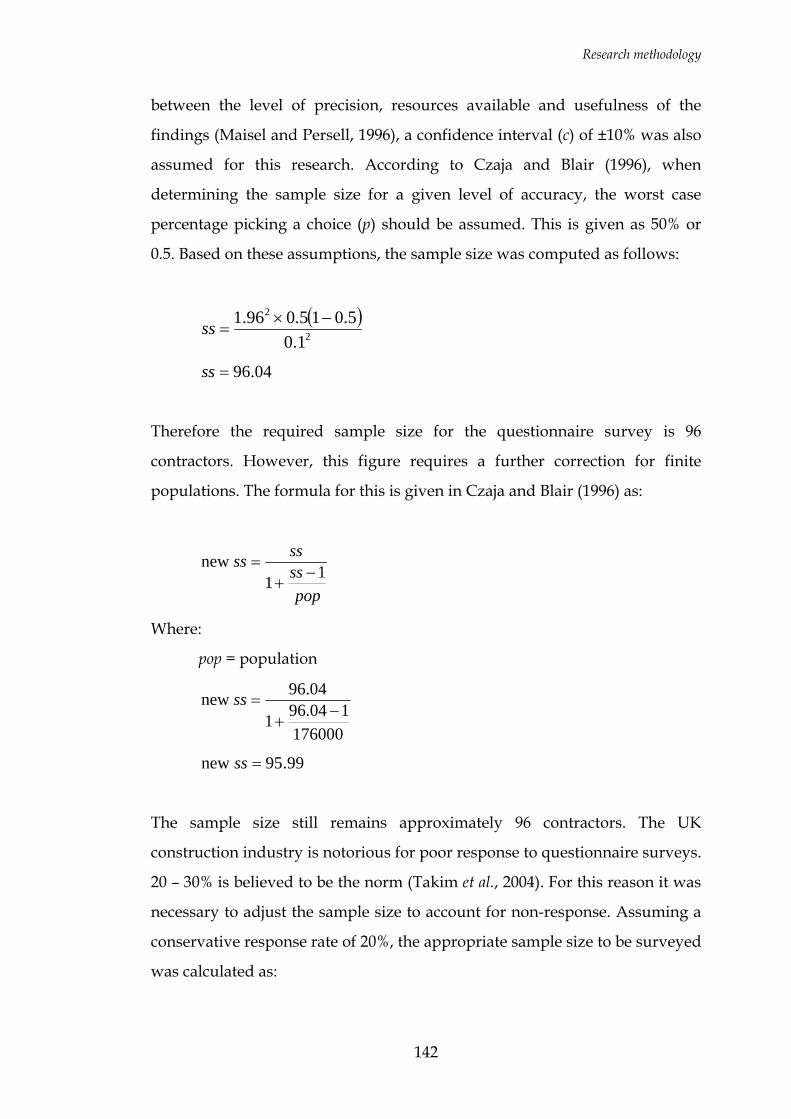
Research methodology
142
between the level of precision, resources available and usefulness of the
findings (Maisel and Persell, 1996), a confidence interval (c) of ±10% was also
assumed for this research. According to Czaja and Blair (1996), when
determining the sample size for a given level of accuracy, the worst case
percentage picking a choice (p) should be assumed. This is given as 50% or
0.5. Based on these assumptions, the sample size was computed as follows:
( )2
2
1.05.015.096.1 −×
=ss
04.96=ss
Therefore the required sample size for the questionnaire survey is 96
contractors. However, this figure requires a further correction for finite
populations. The formula for this is given in Czaja and Blair (1996) as:
popssssss 11
new−
+=
Where:
pop = population
176000104.961
04.96 new−
+=ss
99.95 new =ss
The sample size still remains approximately 96 contractors. The UK
construction industry is notorious for poor response to questionnaire surveys.
20 – 30% is believed to be the norm (Takim et al., 2004). For this reason it was
necessary to adjust the sample size to account for non-response. Assuming a
conservative response rate of 20%, the appropriate sample size to be surveyed
was calculated as:
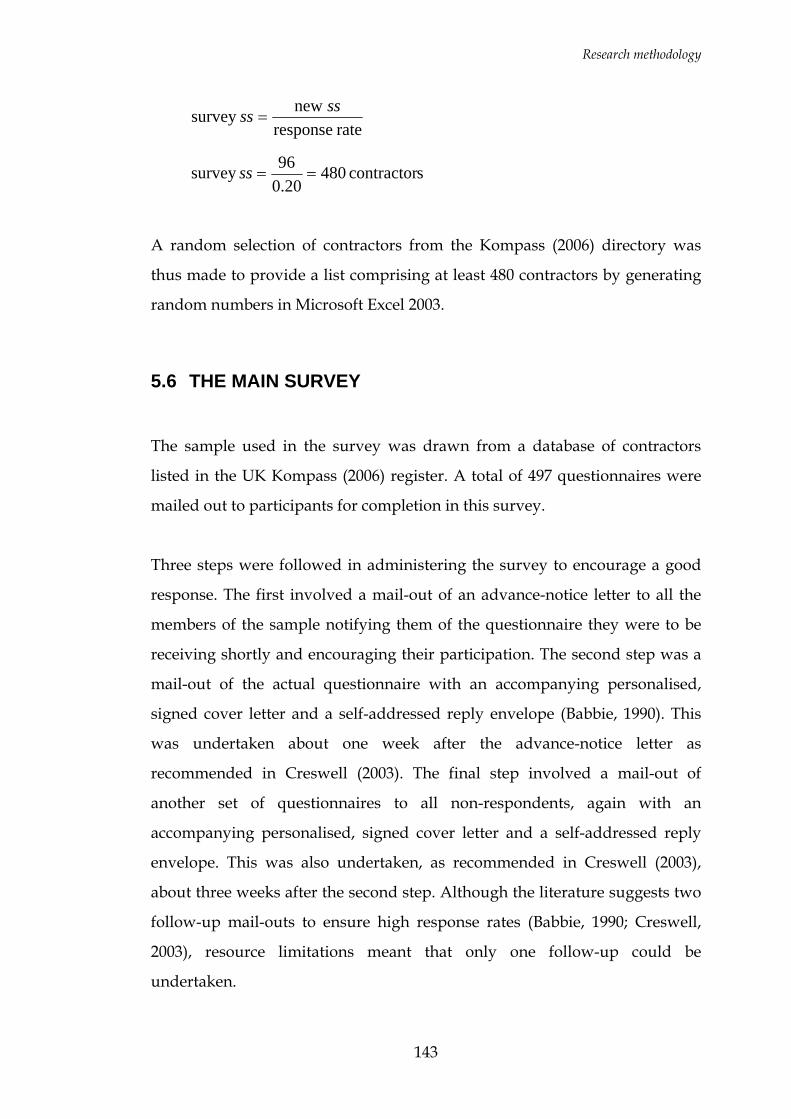
Research methodology
143
rate response newsurvey ssss =
scontractor 4800.2096survey ==ss
A random selection of contractors from the Kompass (2006) directory was
thus made to provide a list comprising at least 480 contractors by generating
random numbers in Microsoft Excel 2003.
5.6 THE MAIN SURVEY
The sample used in the survey was drawn from a database of contractors
listed in the UK Kompass (2006) register. A total of 497 questionnaires were
mailed out to participants for completion in this survey.
Three steps were followed in administering the survey to encourage a good
response. The first involved a mail-out of an advance-notice letter to all the
members of the sample notifying them of the questionnaire they were to be
receiving shortly and encouraging their participation. The second step was a
mail-out of the actual questionnaire with an accompanying personalised,
signed cover letter and a self-addressed reply envelope (Babbie, 1990). This
was undertaken about one week after the advance-notice letter as
recommended in Creswell (2003). The final step involved a mail-out of
another set of questionnaires to all non-respondents, again with an
accompanying personalised, signed cover letter and a self-addressed reply
envelope. This was also undertaken, as recommended in Creswell (2003),
about three weeks after the second step. Although the literature suggests two
follow-up mail-outs to ensure high response rates (Babbie, 1990; Creswell,
2003), resource limitations meant that only one follow-up could be
undertaken.
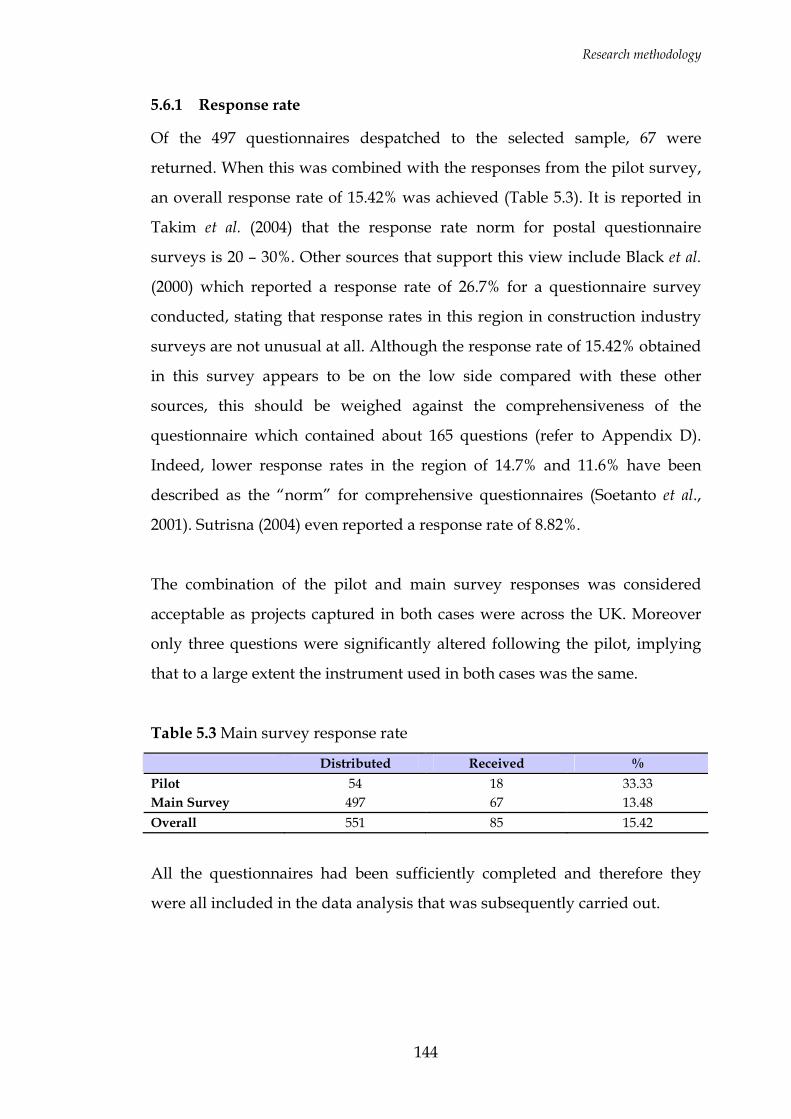
Research methodology
144
5.6.1 Response rate
Of the 497 questionnaires despatched to the selected sample, 67 were
returned. When this was combined with the responses from the pilot survey,
an overall response rate of 15.42% was achieved (Table 5.3). It is reported in
Takim et al. (2004) that the response rate norm for postal questionnaire
surveys is 20 – 30%. Other sources that support this view include Black et al.
(2000) which reported a response rate of 26.7% for a questionnaire survey
conducted, stating that response rates in this region in construction industry
surveys are not unusual at all. Although the response rate of 15.42% obtained
in this survey appears to be on the low side compared with these other
sources, this should be weighed against the comprehensiveness of the
questionnaire which contained about 165 questions (refer to Appendix D).
Indeed, lower response rates in the region of 14.7% and 11.6% have been
described as the “norm” for comprehensive questionnaires (Soetanto et al.,
2001). Sutrisna (2004) even reported a response rate of 8.82%.
The combination of the pilot and main survey responses was considered
acceptable as projects captured in both cases were across the UK. Moreover
only three questions were significantly altered following the pilot, implying
that to a large extent the instrument used in both cases was the same.
Table 5.3 Main survey response rate
Distributed Received % Pilot 54 18 33.33 Main Survey 497 67 13.48 Overall 551 85 15.42
All the questionnaires had been sufficiently completed and therefore they
were all included in the data analysis that was subsequently carried out.
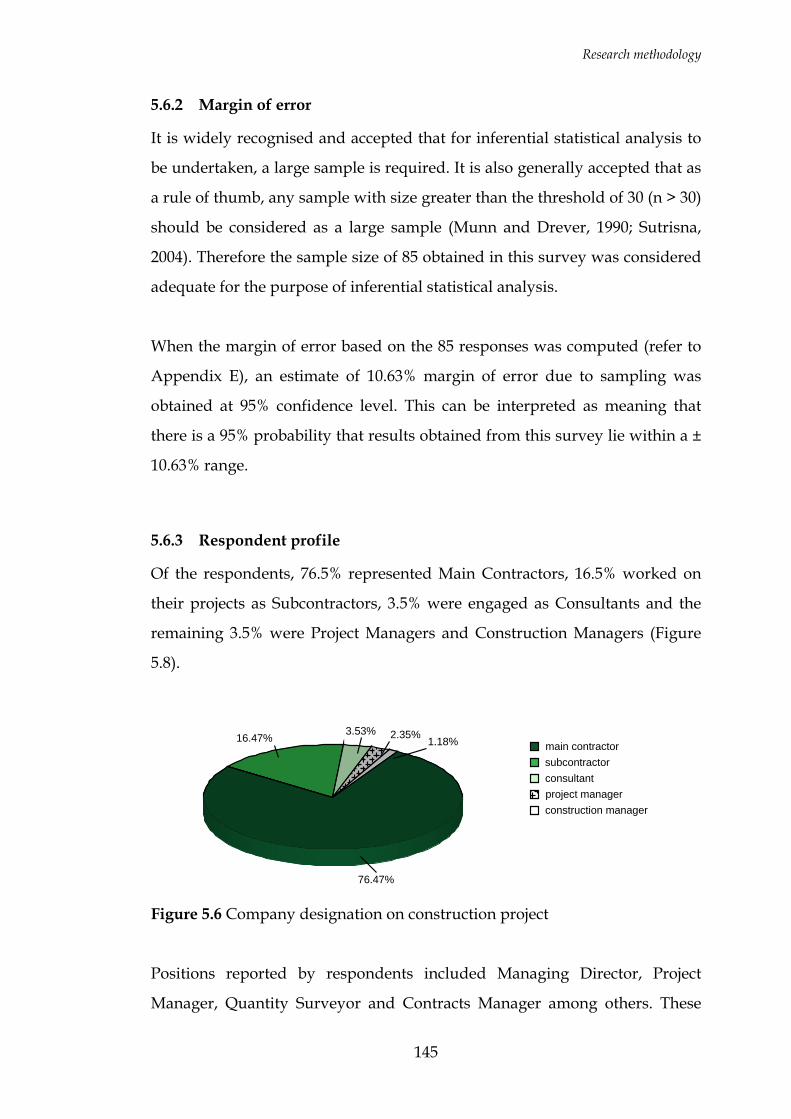
Research methodology
145
5.6.2 Margin of error
It is widely recognised and accepted that for inferential statistical analysis to
be undertaken, a large sample is required. It is also generally accepted that as
a rule of thumb, any sample with size greater than the threshold of 30 (n > 30)
should be considered as a large sample (Munn and Drever, 1990; Sutrisna,
2004). Therefore the sample size of 85 obtained in this survey was considered
adequate for the purpose of inferential statistical analysis.
When the margin of error based on the 85 responses was computed (refer to
Appendix E), an estimate of 10.63% margin of error due to sampling was
obtained at 95% confidence level. This can be interpreted as meaning that
there is a 95% probability that results obtained from this survey lie within a ±
10.63% range.
5.6.3 Respondent profile
Of the respondents, 76.5% represented Main Contractors, 16.5% worked on
their projects as Subcontractors, 3.5% were engaged as Consultants and the
remaining 3.5% were Project Managers and Construction Managers (Figure
5.8).
1.18%2.35%3.53%16.47%
76.47%
construction managerproject managerconsultantsubcontractormain contractor
Figure 5.6 Company designation on construction project
Positions reported by respondents included Managing Director, Project
Manager, Quantity Surveyor and Contracts Manager among others. These
Research methodology
146
positions are evidence of the fact that the respondents are in the position to
provide the information requested in the questionnaire.
Analysis of the data was undertaken using SPSS v13.
5.6.4 Data editing
The responses received from participants contained some missing data.
Indeed it is the exceptional study that has no missing data (LoPresti, 1998).
Missing data can be problematic in analysis and occurs for many reasons.
According to LoPresti (ibid), in reputable studies, analysis of missing data is
required to improve the validity of the study. Therefore to end up with a
good data set and to be able to use all the data collected in the analysis, some
time was spent investigating and resolving the missing data problem.
The SPSS v.13 Missing Values Analysis option was used to analyse the
patterns of missing data (Appendix F). It was decided after Hair et al. (1998),
that where missing data levels were not excessively high (in the order of 50%
or more) cases and variables would not be excluded from analysis. The only
variable with a high percentage of missing values was Delay (90.6%). This was
the case because this particular question was a follow up question to a
previous question and was not applicable to most of the respondents. Where
appropriate, the Replace Missing Values option was used to replace the
missing values with the mean of all valid responses. Whilst several different
options exist for replacing missing values, substitution with the mean is one
of the most widely used (Xiao, 2002). This is so because it is considered as the
best single replacement value (Hair et al., 1998). Besides, it is easy to calculate
and effect the replacement hence its use in this study. To check
appropriateness of this approach, the regression method and the estimation-
maximization (EM) method were also used to estimate alternative replacement
values (refer to Appendix F). The series means calculated were consistent
Research methodology
147
with these estimates, especially the regression estimates and were therefore
accepted.
Further editing of the data was also required to organise it in a format
suitable for analysis. For example the scale data representing Contract Price
and Project Duration were transformed into categorical data. New variables
for Cost Performance and Time Performance were also computed.
5.6.5 Sample splitting
Because of the model development anticipated towards the latter phases of
the data analysis, and the requirement for model validation prior to the
drawing of conclusions (Good and Hardin, 2003), a proportion of the data
collected was selected and held back for the purpose of the validation. This
approach is in line with the second of the three approaches of validation
described by Good and Hardin (2003) which specifies the splitting of the
sample and using one part for calibration, and the other part for verification.
This approach has been described as an effective method of validation when
it is not practical to collect new data to test the model (Snee, 1977). In terms of
how much is set aside for this purpose, the evidence from other research is
rather mixed. Whilst Xiao (2002) set aside 12.20%, Omoregie (2006) set aside
9.03%. This appears to suggest that there is no fixed number or percentage
required for validation. The recommendation however in Good and Hardin
(2003) and Picard and Berk (1990) is that between a quarter (1/4) and a third
(1/3) should be set aside for validation purposes.
25% of the sample was therefore randomly selected in SPSS and excluded
from the main analysis. The 25% was equivalent to 21 cases (Table 5.4).
The data was now ready for analysis.
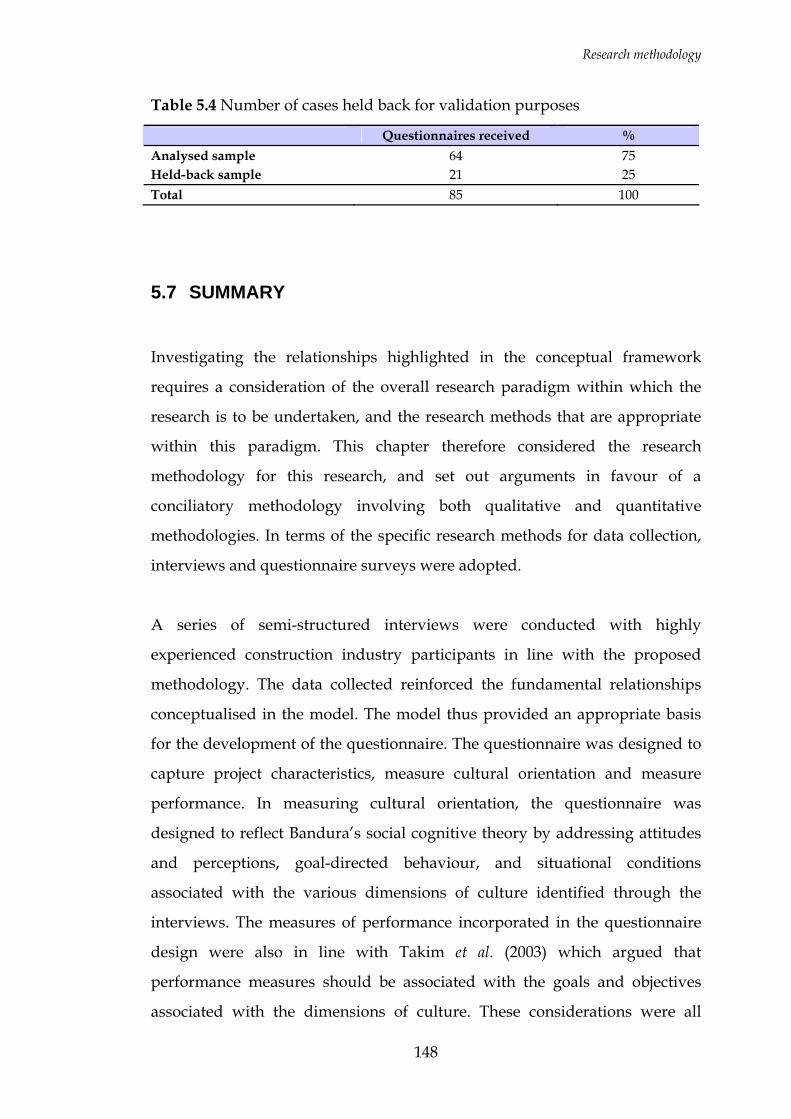
Research methodology
148
Table 5.4 Number of cases held back for validation purposes
Questionnaires received % Analysed sample 64 75 Held-back sample 21 25 Total 85 100
5.7 SUMMARY
Investigating the relationships highlighted in the conceptual framework
requires a consideration of the overall research paradigm within which the
research is to be undertaken, and the research methods that are appropriate
within this paradigm. This chapter therefore considered the research
methodology for this research, and set out arguments in favour of a
conciliatory methodology involving both qualitative and quantitative
methodologies. In terms of the specific research methods for data collection,
interviews and questionnaire surveys were adopted.
A series of semi-structured interviews were conducted with highly
experienced construction industry participants in line with the proposed
methodology. The data collected reinforced the fundamental relationships
conceptualised in the model. The model thus provided an appropriate basis
for the development of the questionnaire. The questionnaire was designed to
capture project characteristics, measure cultural orientation and measure
performance. In measuring cultural orientation, the questionnaire was
designed to reflect Bandura’s social cognitive theory by addressing attitudes
and perceptions, goal-directed behaviour, and situational conditions
associated with the various dimensions of culture identified through the
interviews. The measures of performance incorporated in the questionnaire
design were also in line with Takim et al. (2003) which argued that
performance measures should be associated with the goals and objectives
associated with the dimensions of culture. These considerations were all
Research methodology
149
reflected in the questionnaire. Within culture research in construction, this
approach is novel and represents a significant departure from the norm.
Following a successful pilot of the questionnaire (33.33% response rate),
minor modifications were made to the questionnaire based on the feedback,
and the major survey was conducted on a randomly selected sample of
contractors listed in the UK Kompass (2006) register. Altogether, 85 sets of
data were generated representing an overall response rate of 15.42%. A
majority of the respondents were main contractors on the projects they
described. Following editing of the data to make it suitable for analysis and
splitting of the sample, the data was ready for analysis using SPSS v13.
The following chapters present the results of statistical analyses undertaken
on the data to assess the characteristics of the projects covered by the survey,
and to diagnose the cultures of the CPOs and evaluate their performance. The
statistical analysis techniques applied are also discussed along with their
limitations and assumptions.
150
CHAPTER 6: PROJECT CHARACTERISTICS AND THE CULTURE OF THE CONSTRUCTION PROJECT ORGANISATION
6.0 INTRODUCTION
As indicated in the previous chapter, the questionnaire queried respondents
on the characteristics of the projects they were engaged on and the attitudes
and perceptions, behaviours and conditions that prevailed on the
construction project. The discussions following will thus outline the
characteristics of the projects making up the sample to set the context, and
also present an analysis of the data on cultural orientations of these CPOs. By
so doing, this chapter partially achieves the fifth objective of this research
which was to establish the cultural orientations of CPOs in the UK. Further
evaluation to draw out differences in the cultural orientations of the CPOs is
also presented, the intention being to address the first of the three hypotheses
that was developed from the conceptual framework which proposed that
there are significant differences in the cultural orientations of CPOs. An
evaluation of the relationships between the cultural orientations and the
project characteristics is also undertaken to assess the role of the antecedent
states as suggested by the conceptual framework.
6.1 STATISTICAL PROCEDURES AND ANALYSES
As can be seen from the questionnaire (Appendix D) there was a mixture of
nominal, ordinal and scale data. A variety of statistical procedures were
therefore employed in the analyses of the data starting with basic descriptive
statistics to more complex procedures like the Freidman test, factor analysis,

Project characteristics and culture
151
cluster analysis and analysis of correlations between the variables. The
descriptive statistics encompassed frequency distributions, measures of
central tendency such as means, medians and modes, and measures of
dispersion such as the standard deviation. These were employed to develop a
thorough understanding of the nature of the data and to provide summary
descriptions of the projects in the sample.
Where appropriate, tests were carried out on the significance of the findings.
Such tests included the chi-square (χ2) test and the Friedman test. The chi-
square test is a non-parametric procedure that tabulates a variable into
categories and computes a chi-square statistic to test the hypothesis that the
observed frequencies do not differ from their expected values. This goodness-
of-fit test compares the observed and expected frequencies in each category to
test either that all categories contain the same proportion or user-specified
proportions of values (SPSS, 2004). Where the intention was to detect
significant relationships between some of the nominal variables, the Pearson
χ2 test was applied in cross-tabulations of the variables (Kinnear and Gray,
2004). For the ordinal data, the Friedman test was applied to test for
significant differences in the ranking of related variables (ibid). This is a non-
parametric test for multiple related samples. Such nonparametric tests make
no assumptions about the data and are especially appropriate for small
samples and can be used with ordinal test variables (Field, 2000), hence their
appropriateness for this research.
Factor analysis is a multivariate statistical technique for examining the
underlying structure or the structure of interrelationships (or correlations)
among a large number of variables (Hair et al., 1998). This analysis yields a set
of factors or underlying dimensions which, when interpreted and
understood, describe the data in a parsimonious but more meaningful
number of concepts than the original individual variables (ibid). This
approach was utilised in the seminal work of Hofstede (2001) on culture.
Project characteristics and culture
152
Because of the data reduction intention, a suitable method for extraction of
factors is principal components analysis, with the extracted components used
to compute new variables for subsequent analyses.
Another useful technique that was adopted for the analysis of data was
cluster analysis. This technique allocates a set of subjects (in this case CPOs)
to a set of mutually exclusive, exhaustive groups in such a way that the
subjects within a group are similar to one another while subjects in different
groups are dissimilar (SPSS, 2004). This technique was particularly useful for
categorising the CPOs into mutually exclusive typologies of culture.
Where there was a need to compare groups of cases for differences in their
means along particular variables, analysis of variance (ANOVA) was carried
out. ANOVA is a technique for testing simultaneously whether two or more
population means are significantly different. Although one-way ANOVA is
the method of choice when testing for differences between multiple groups, it
assumes that the mean is a valid estimate of centre and that the distribution
of the test variable is reasonably normal and similar in all groups (Field,
2000). Where it was not possible to show clearly that these assumptions are
satisfied, nonparametric procedures such as the Kruskal-Wallis and Mann-
Whitney tests were used to test for the significance of the differences between
the mean ranks of the various groups (i.e. whether or not the values of a
particular variable differ between two or more groups). The Kruskal Wallis
test is a one-way ANOVA by ranks. It tests the null hypothesis that multiple
independent samples come from the same population, i.e. have the same
mean rank (SPSS, 2004). The Mann-Whitney test is a non-parametric ANOVA
similar to the Kruskal-Wallis, but is applied where there are only two groups
to compare (Field, 2000). Unlike standard ANOVA, these tests do not assume
normality, and can be used for ordinal variables (SPSS, 2004).
Project characteristics and culture
153
A final statistical procedure applied to assess the existence of relationships
between variables was the test of correlation. In this case as the data to be
tested included ordinal or dichotomous nominal data, the non-parametric
Spearman’s correlation coefficient was calculated. This test first ranks the
data and then applies the Pearson’s equation to compute the correlation
coefficient. The equation to compute correlation coefficient (r), is given by
Field (2000) as:
yx
n
iii
SSn
yyxxr
)1(
))((1
−
−−=
∑=
Where:
x and y are any pair of variables whose level of correlation is being
sought
x and y are the means of x and y respectively
Sx and Sy are the standard deviations of x and y respectively.
Correlations measure how variables or rank orders are related. It is useful for
determining the strength and direction of the association between two
variables which could be positively related, not related at all or negatively
related (Field, 2000). The correlation coefficient (r) lies between –1 and +1. If
the r is close to –1 or +1, the two variables are close to a perfect linear
relationship, and when the r is close to 0, there is little or no correlation (ibid).
6.2 PROJECT CHARACTERISTICS
Various issues relating to projects were assessed because of their potential
influence on the type of culture that develops within the construction project
organisation as argued in Ankrah et al. (2005b). Analyses of these project
characteristics are presented below.
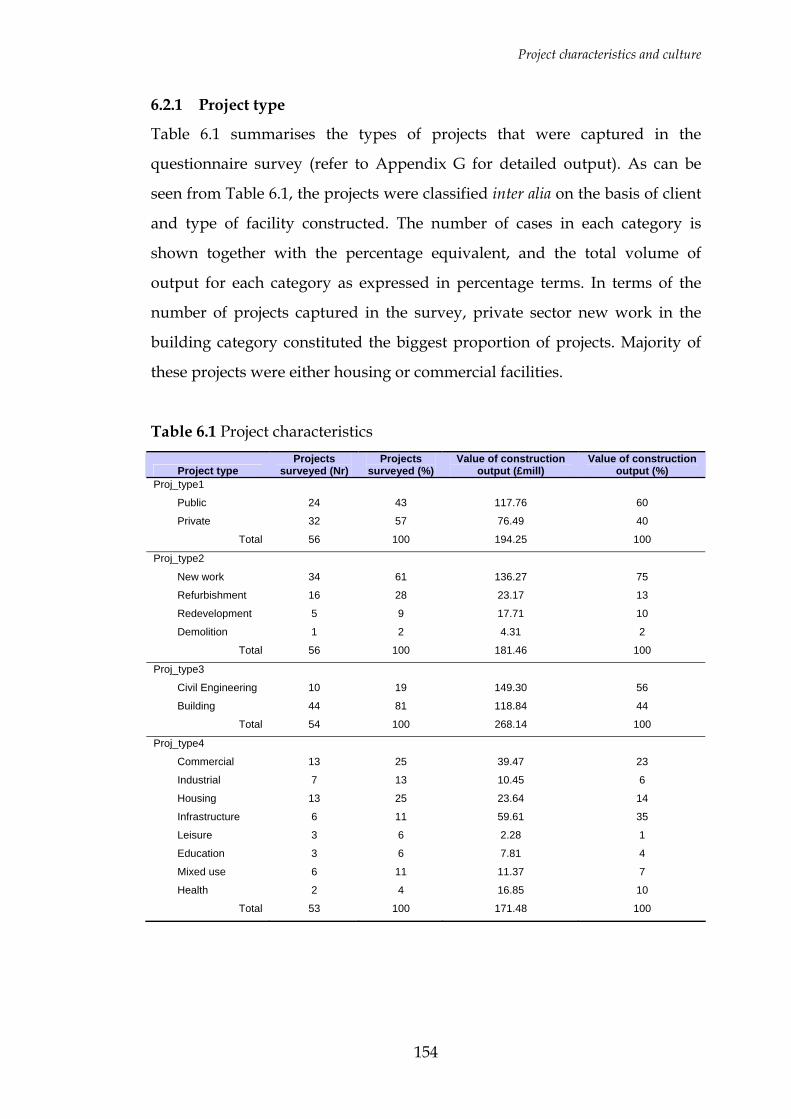
Project characteristics and culture
154
6.2.1 Project type
Table 6.1 summarises the types of projects that were captured in the
questionnaire survey (refer to Appendix G for detailed output). As can be
seen from Table 6.1, the projects were classified inter alia on the basis of client
and type of facility constructed. The number of cases in each category is
shown together with the percentage equivalent, and the total volume of
output for each category as expressed in percentage terms. In terms of the
number of projects captured in the survey, private sector new work in the
building category constituted the biggest proportion of projects. Majority of
these projects were either housing or commercial facilities.
Table 6.1 Project characteristics
Project type Projects
surveyed (Nr) Projects
surveyed (%) Value of construction
output (£mill) Value of construction
output (%) Proj_type1
Public 24 43 117.76 60
Private 32 57 76.49 40
Total 56 100 194.25 100
Proj_type2
New work 34 61 136.27 75
Refurbishment 16 28 23.17 13
Redevelopment 5 9 17.71 10
Demolition 1 2 4.31 2
Total 56 100 181.46 100
Proj_type3
Civil Engineering 10 19 149.30 56
Building 44 81 118.84 44
Total 54 100 268.14 100
Proj_type4
Commercial 13 25 39.47 23
Industrial 7 13 10.45 6
Housing 13 25 23.64 14
Infrastructure 6 11 59.61 35
Leisure 3 6 2.28 1
Education 3 6 7.81 4
Mixed use 6 11 11.37 7
Health 2 4 16.85 10
Total 53 100 171.48 100
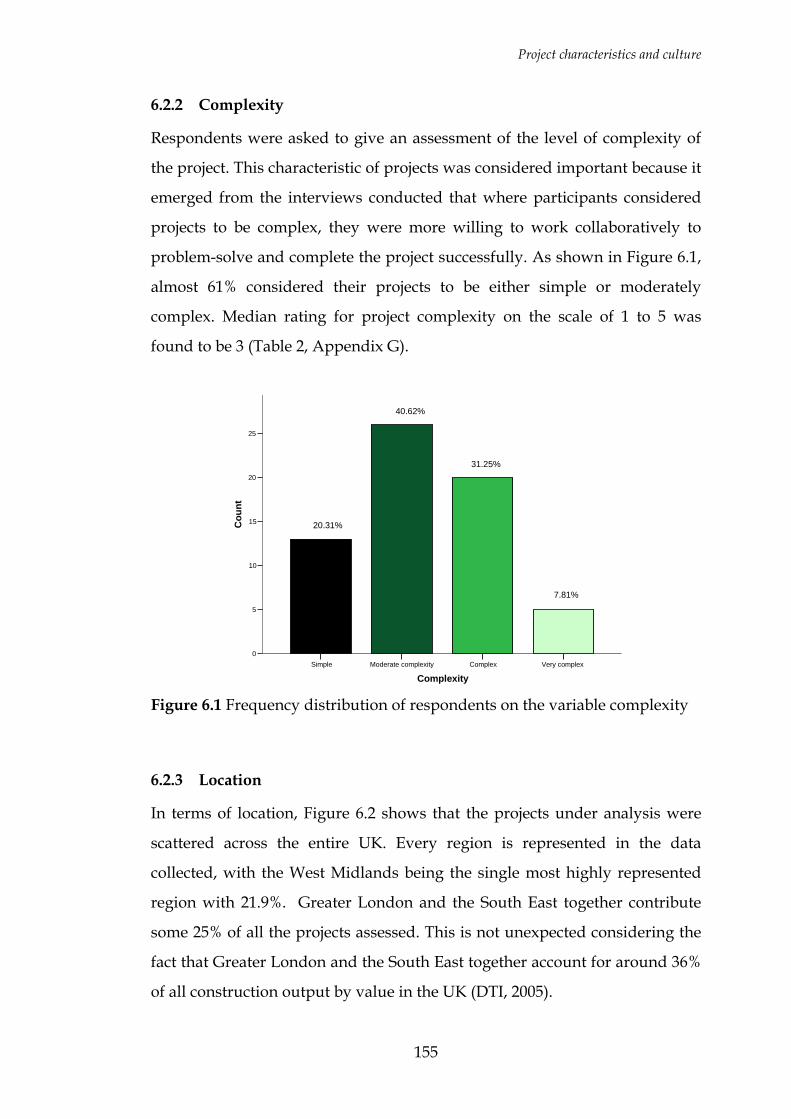
Project characteristics and culture
155
6.2.2 Complexity
Respondents were asked to give an assessment of the level of complexity of
the project. This characteristic of projects was considered important because it
emerged from the interviews conducted that where participants considered
projects to be complex, they were more willing to work collaboratively to
problem-solve and complete the project successfully. As shown in Figure 6.1,
almost 61% considered their projects to be either simple or moderately
complex. Median rating for project complexity on the scale of 1 to 5 was
found to be 3 (Table 2, Appendix G).
Very complexComplexModerate complexitySimple
Complexity
25
20
15
10
5
0
Cou
nt
7.81%
31.25%
40.62%
20.31%
Figure 6.1 Frequency distribution of respondents on the variable complexity
6.2.3 Location
In terms of location, Figure 6.2 shows that the projects under analysis were
scattered across the entire UK. Every region is represented in the data
collected, with the West Midlands being the single most highly represented
region with 21.9%. Greater London and the South East together contribute
some 25% of all the projects assessed. This is not unexpected considering the
fact that Greater London and the South East together account for around 36%
of all construction output by value in the UK (DTI, 2005).
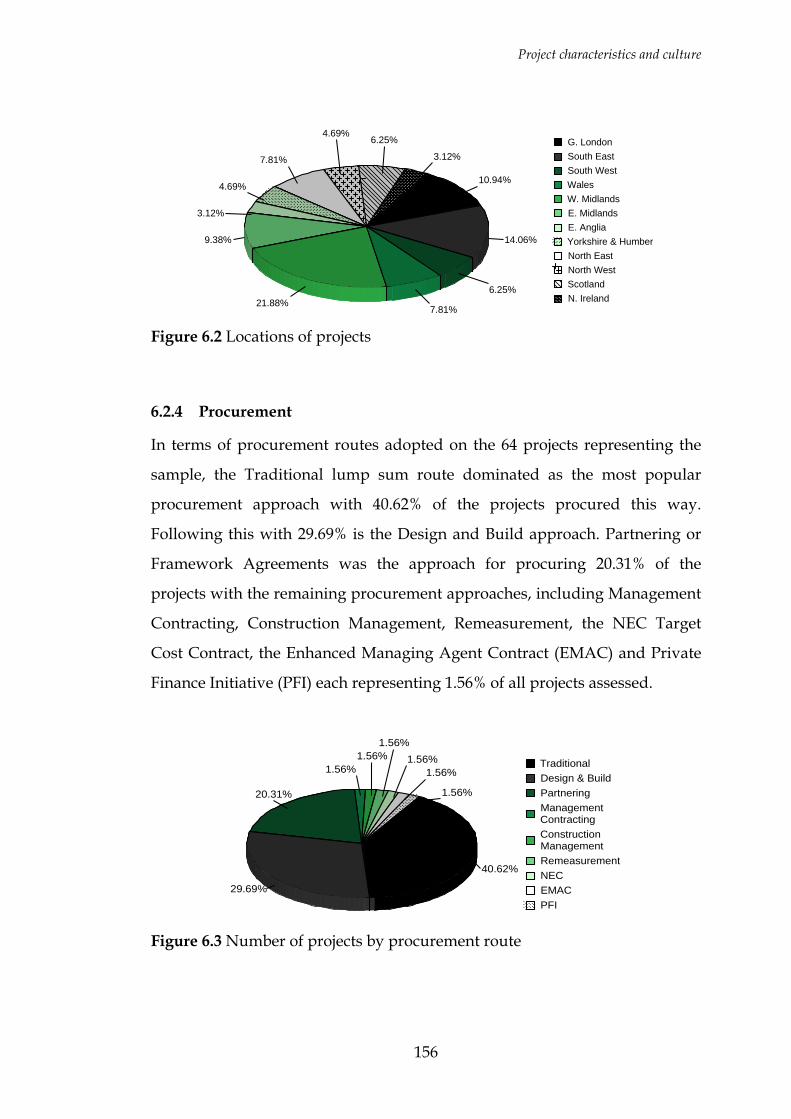
Project characteristics and culture
156
3.12%
6.25%4.69%
7.81%
4.69%
3.12%
9.38%
21.88%7.81%
6.25%
14.06%
10.94%
N. IrelandScotlandNorth WestNorth EastYorkshire & HumberE. AngliaE. MidlandsW. MidlandsWalesSouth WestSouth EastG. London
Figure 6.2 Locations of projects
6.2.4 Procurement
In terms of procurement routes adopted on the 64 projects representing the
sample, the Traditional lump sum route dominated as the most popular
procurement approach with 40.62% of the projects procured this way.
Following this with 29.69% is the Design and Build approach. Partnering or
Framework Agreements was the approach for procuring 20.31% of the
projects with the remaining procurement approaches, including Management
Contracting, Construction Management, Remeasurement, the NEC Target
Cost Contract, the Enhanced Managing Agent Contract (EMAC) and Private
Finance Initiative (PFI) each representing 1.56% of all projects assessed.
1.56%
1.56%1.56%
1.56%1.56%
1.56%
20.31%
29.69%
40.62%
PFIEMACNECRemeasurement
ConstructionManagement
ManagementContracting
PartneringDesign & BuildTraditional
Figure 6.3 Number of projects by procurement route
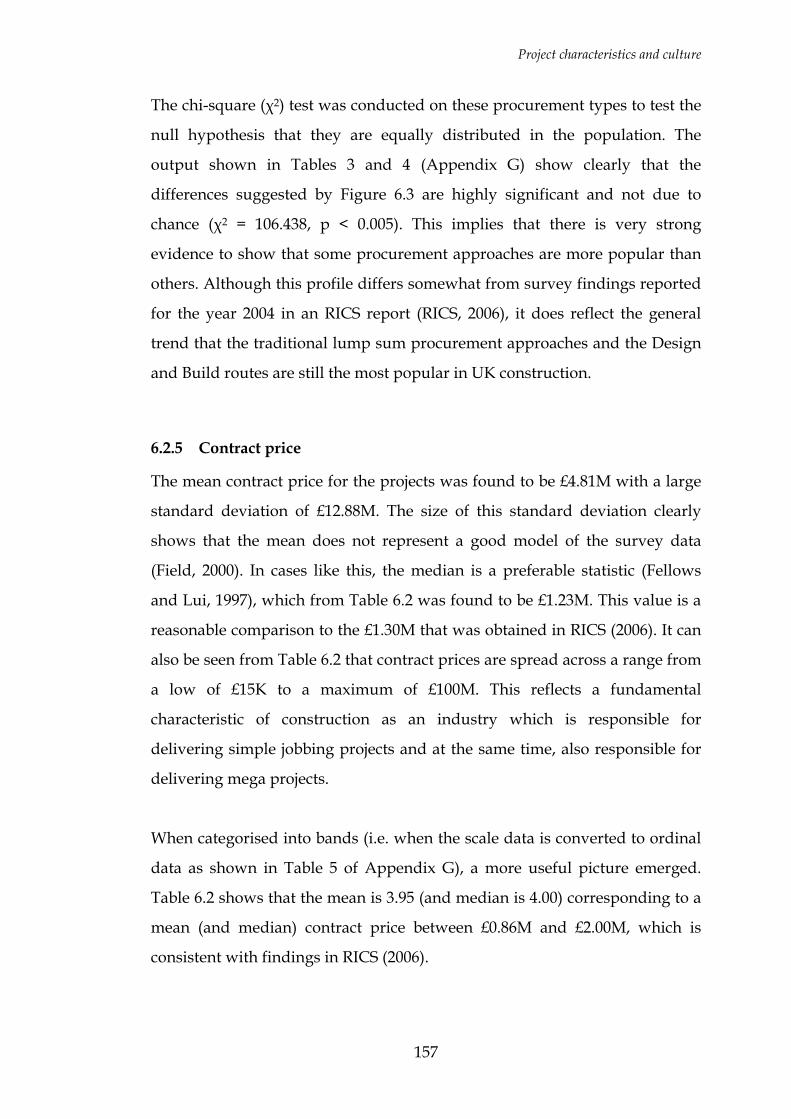
Project characteristics and culture
157
The chi-square (χ2) test was conducted on these procurement types to test the
null hypothesis that they are equally distributed in the population. The
output shown in Tables 3 and 4 (Appendix G) show clearly that the
differences suggested by Figure 6.3 are highly significant and not due to
chance (χ2 = 106.438, p < 0.005). This implies that there is very strong
evidence to show that some procurement approaches are more popular than
others. Although this profile differs somewhat from survey findings reported
for the year 2004 in an RICS report (RICS, 2006), it does reflect the general
trend that the traditional lump sum procurement approaches and the Design
and Build routes are still the most popular in UK construction.
6.2.5 Contract price
The mean contract price for the projects was found to be £4.81M with a large
standard deviation of £12.88M. The size of this standard deviation clearly
shows that the mean does not represent a good model of the survey data
(Field, 2000). In cases like this, the median is a preferable statistic (Fellows
and Lui, 1997), which from Table 6.2 was found to be £1.23M. This value is a
reasonable comparison to the £1.30M that was obtained in RICS (2006). It can
also be seen from Table 6.2 that contract prices are spread across a range from
a low of £15K to a maximum of £100M. This reflects a fundamental
characteristic of construction as an industry which is responsible for
delivering simple jobbing projects and at the same time, also responsible for
delivering mega projects.
When categorised into bands (i.e. when the scale data is converted to ordinal
data as shown in Table 5 of Appendix G), a more useful picture emerged.
Table 6.2 shows that the mean is 3.95 (and median is 4.00) corresponding to a
mean (and median) contract price between £0.86M and £2.00M, which is
consistent with findings in RICS (2006).
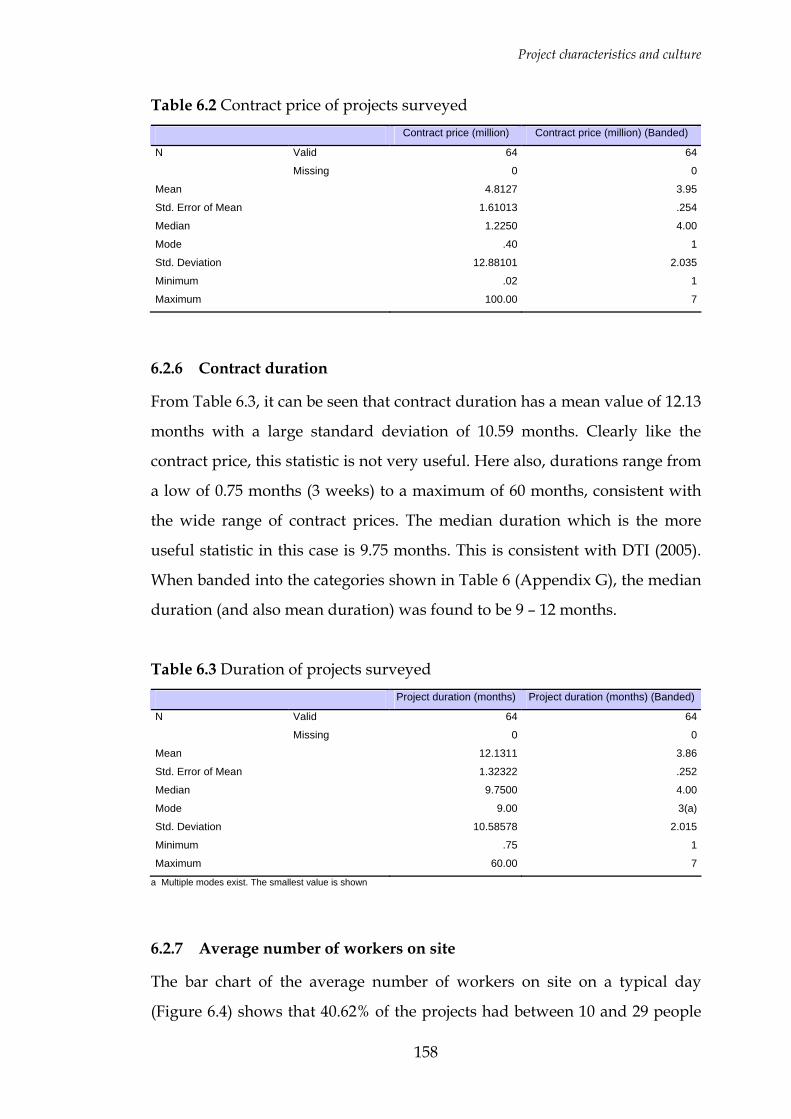
Project characteristics and culture
158
Table 6.2 Contract price of projects surveyed Contract price (million) Contract price (million) (Banded)
N Valid 64 64
Missing 0 0
Mean 4.8127 3.95
Std. Error of Mean 1.61013 .254
Median 1.2250 4.00
Mode .40 1
Std. Deviation 12.88101 2.035
Minimum .02 1
Maximum 100.00 7
6.2.6 Contract duration
From Table 6.3, it can be seen that contract duration has a mean value of 12.13
months with a large standard deviation of 10.59 months. Clearly like the
contract price, this statistic is not very useful. Here also, durations range from
a low of 0.75 months (3 weeks) to a maximum of 60 months, consistent with
the wide range of contract prices. The median duration which is the more
useful statistic in this case is 9.75 months. This is consistent with DTI (2005).
When banded into the categories shown in Table 6 (Appendix G), the median
duration (and also mean duration) was found to be 9 – 12 months.
Table 6.3 Duration of projects surveyed Project duration (months) Project duration (months) (Banded)
N Valid 64 64
Missing 0 0
Mean 12.1311 3.86
Std. Error of Mean 1.32322 .252
Median 9.7500 4.00
Mode 9.00 3(a)
Std. Deviation 10.58578 2.015
Minimum .75 1
Maximum 60.00 7
a Multiple modes exist. The smallest value is shown
6.2.7 Average number of workers on site
The bar chart of the average number of workers on site on a typical day
(Figure 6.4) shows that 40.62% of the projects had between 10 and 29 people
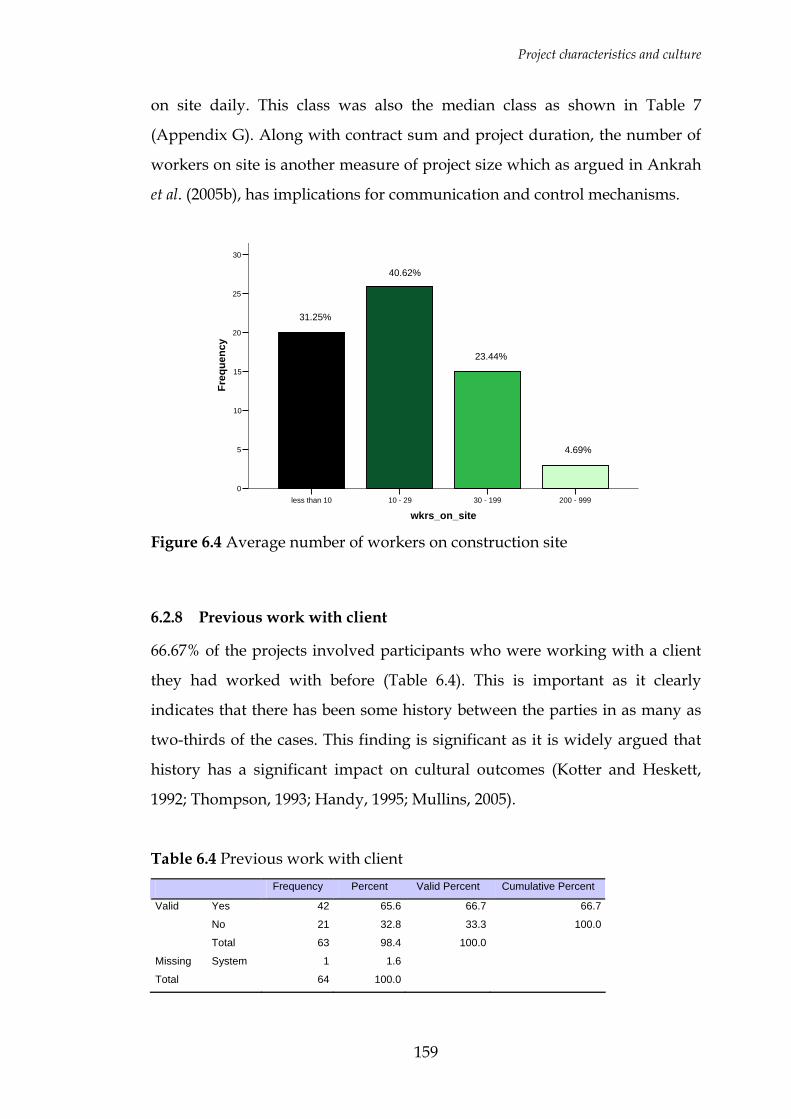
Project characteristics and culture
159
on site daily. This class was also the median class as shown in Table 7
(Appendix G). Along with contract sum and project duration, the number of
workers on site is another measure of project size which as argued in Ankrah
et al. (2005b), has implications for communication and control mechanisms.
200 - 99930 - 19910 - 29less than 10
wkrs_on_site
30
25
20
15
10
5
0
Freq
uenc
y
4.69%
23.44%
40.62%
31.25%
Figure 6.4 Average number of workers on construction site
6.2.8 Previous work with client
66.67% of the projects involved participants who were working with a client
they had worked with before (Table 6.4). This is important as it clearly
indicates that there has been some history between the parties in as many as
two-thirds of the cases. This finding is significant as it is widely argued that
history has a significant impact on cultural outcomes (Kotter and Heskett,
1992; Thompson, 1993; Handy, 1995; Mullins, 2005).
Table 6.4 Previous work with client Frequency Percent Valid Percent Cumulative Percent
Valid Yes 42 65.6 66.7 66.7
No 21 32.8 33.3 100.0
Total 63 98.4 100.0
Missing System 1 1.6
Total 64 100.0
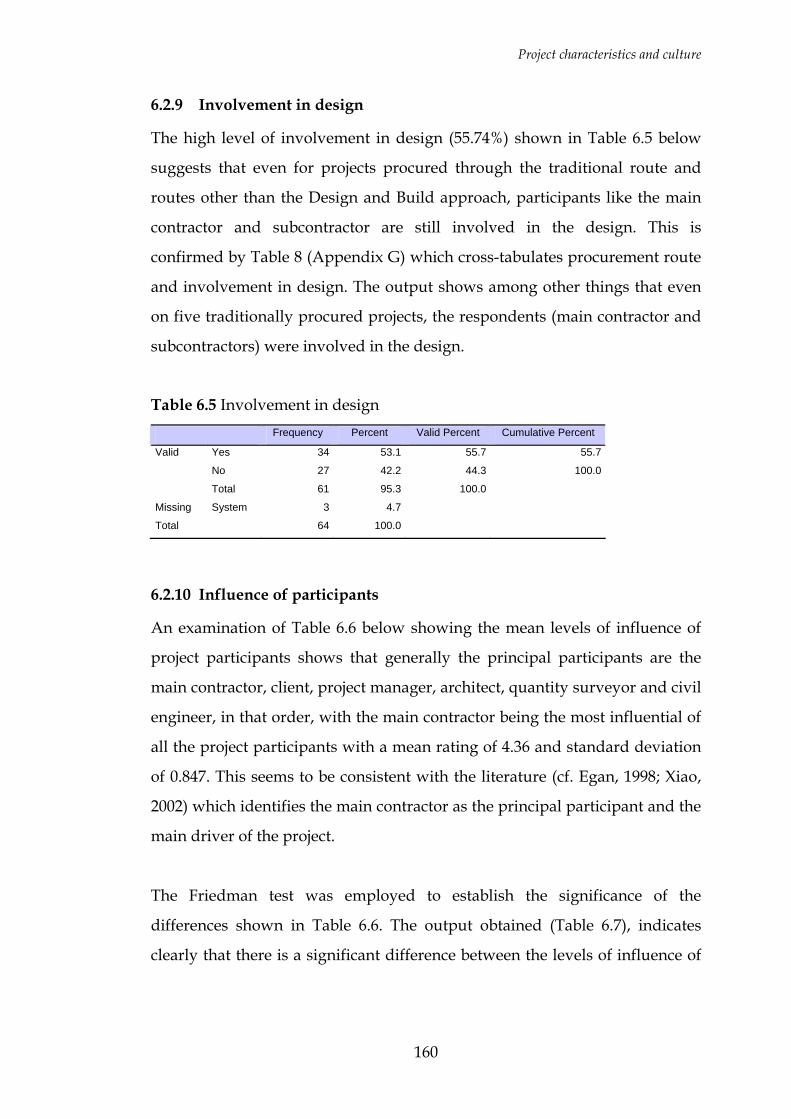
Project characteristics and culture
160
6.2.9 Involvement in design
The high level of involvement in design (55.74%) shown in Table 6.5 below
suggests that even for projects procured through the traditional route and
routes other than the Design and Build approach, participants like the main
contractor and subcontractor are still involved in the design. This is
confirmed by Table 8 (Appendix G) which cross-tabulates procurement route
and involvement in design. The output shows among other things that even
on five traditionally procured projects, the respondents (main contractor and
subcontractors) were involved in the design.
Table 6.5 Involvement in design Frequency Percent Valid Percent Cumulative Percent
Valid Yes 34 53.1 55.7 55.7
No 27 42.2 44.3 100.0
Total 61 95.3 100.0
Missing System 3 4.7
Total 64 100.0
6.2.10 Influence of participants
An examination of Table 6.6 below showing the mean levels of influence of
project participants shows that generally the principal participants are the
main contractor, client, project manager, architect, quantity surveyor and civil
engineer, in that order, with the main contractor being the most influential of
all the project participants with a mean rating of 4.36 and standard deviation
of 0.847. This seems to be consistent with the literature (cf. Egan, 1998; Xiao,
2002) which identifies the main contractor as the principal participant and the
main driver of the project.
The Friedman test was employed to establish the significance of the
differences shown in Table 6.6. The output obtained (Table 6.7), indicates
clearly that there is a significant difference between the levels of influence of
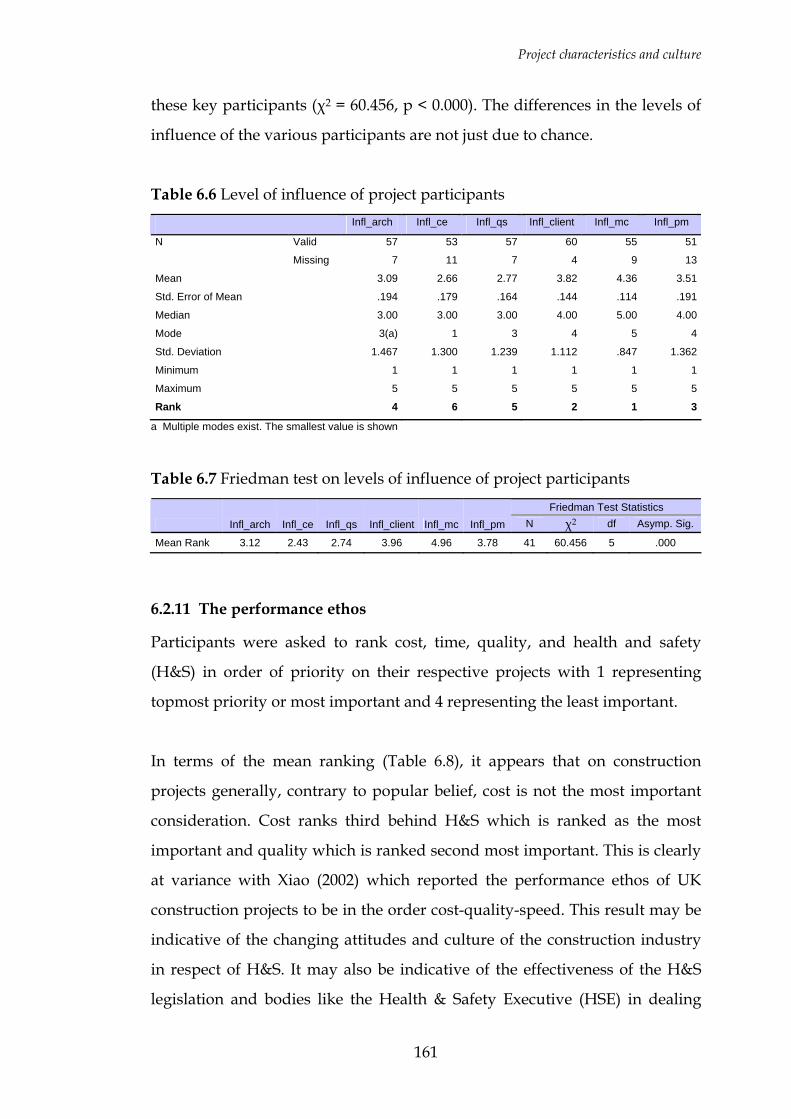
Project characteristics and culture
161
these key participants (χ2 = 60.456, p < 0.000). The differences in the levels of
influence of the various participants are not just due to chance.
Table 6.6 Level of influence of project participants Infl_arch Infl_ce Infl_qs Infl_client Infl_mc Infl_pm
N Valid 57 53 57 60 55 51
Missing 7 11 7 4 9 13
Mean 3.09 2.66 2.77 3.82 4.36 3.51
Std. Error of Mean .194 .179 .164 .144 .114 .191
Median 3.00 3.00 3.00 4.00 5.00 4.00
Mode 3(a) 1 3 4 5 4
Std. Deviation 1.467 1.300 1.239 1.112 .847 1.362
Minimum 1 1 1 1 1 1
Maximum 5 5 5 5 5 5
Rank 4 6 5 2 1 3
a Multiple modes exist. The smallest value is shown
Table 6.7 Friedman test on levels of influence of project participants Friedman Test Statistics
Infl_arch Infl_ce Infl_qs Infl_client Infl_mc Infl_pm N χ2 df Asymp. Sig.
Mean Rank 3.12 2.43 2.74 3.96 4.96 3.78 41 60.456 5 .000
6.2.11 The performance ethos
Participants were asked to rank cost, time, quality, and health and safety
(H&S) in order of priority on their respective projects with 1 representing
topmost priority or most important and 4 representing the least important.
In terms of the mean ranking (Table 6.8), it appears that on construction
projects generally, contrary to popular belief, cost is not the most important
consideration. Cost ranks third behind H&S which is ranked as the most
important and quality which is ranked second most important. This is clearly
at variance with Xiao (2002) which reported the performance ethos of UK
construction projects to be in the order cost-quality-speed. This result may be
indicative of the changing attitudes and culture of the construction industry
in respect of H&S. It may also be indicative of the effectiveness of the H&S
legislation and bodies like the Health & Safety Executive (HSE) in dealing

Project characteristics and culture
162
with organisations that fail to meet their H&S commitments. Indeed,
accidents and injuries and fatalities in the construction industry are declining
and this may be attributable in part to this changing ethos.
Table 6.8 Priority levels for various project objectives Prior_cost Prior_time Prior_qual Prior_hands
N Valid 64 64 64 64
Missing 0 0 0 0
Mean 2.29 2.84 2.05 1.90
Std. Error of Mean .136 .145 .127 .146
Median 2.00 3.00 2.00 1.00
Mode 1 4 1 1
Std. Deviation 1.090 1.158 1.015 1.164
Minimum 1 1 1 1
Maximum 4 5 4 4
Rank 3 4 2 1
There is however agreement between the results and the literature (cf. Xiao,
2002) that time is the least important consideration. The performance ethos is
thus H&S–quality–cost–time.
Here also, the Friedman test was applied to these rankings in order to test the
significance of these findings. The Friedman procedure tests the null
hypothesis that multiple ordinal responses come from the same population.
The data may come from repeated measures of a single sample or from the
same measure from multiple matched samples. For a constant sample size,
the higher the value of this chi-square statistic, the larger the difference
between each variable's rank sum and its expected value. The output from
SPSS is shown in Table 6.9.
Table 6.9 Friedman test on project priorities Friedman Test Statistics
Prior_cost Prior_time Prior_qual Prior_hands N χ2 df Asymp. Sig.
Mean Rank 2.52 3.05 2.26 2.16 64 21.359 3 .000

Project characteristics and culture
163
From this output it can be seen that there is a large chi-square value (χ2 =
21.359, p < 0.000) implying that there is strong evidence to reject the null
hypothesis that there is no difference in the priority placed on the different
objectives project organisations pursue. Clearly, the levels of priority placed
on the various objectives are significantly different from each other, and H&S
is the most important objective that most project organisations pursue.
6.3 SUMMARY OF PROJECT CHARACTERISTICS
Most of the projects captured in this survey were private sector new work in
the building category, specifically housing and commercial building projects.
This outcome is not surprising for a nationwide survey of this nature
considering the fact that according to the Construction Statistics Annual (DTI,
2005), the private sector accounts for some 67% of all construction output,
new work accounts for about 53%, building projects make up about 77%, and
housing constitutes about 40% of construction output in the UK. Most of
these projects were considered by respondents to be either moderately
complex or simple, where complexity is a measure of the difficulty of
executing the individual parts of the construction project and/or bringing
these parts together in a unified whole (Gidado, 1996). This makes sense
considering the range of projects that contractors undertake from simple
jobbing projects to very complex mega projects.
In terms of the locations of these projects, all the UK regions were well
represented, and a majority of these projects (41%) had been procured by
traditional procurement arrangements. This finding is consistent with RICS
(2006) which also found that in the UK, as at 2004 the traditional procurement
approach was the most popular procurement route followed by the Design
and Build approach. Contract prices ranged from £15K to £18M with contract
durations from three weeks to five years. This is also a reflection of the range

Project characteristics and culture
164
of projects undertaken in the construction industry. Median (and mean) value
of the projects was found to be between £0.86M and £2.00M, consistent with
RICS (2006), with the median (and mean) duration found to be within the
range of 9 – 12 months, which is not too dissimilar from figures provided in
DTI (2005). In terms of the average number of workers on site, 10 – 29
workers each day was found to be the median class. Not surprisingly, the
Main Contractor was reported as the most influential participant overall. The
performance ethos of UK construction project organisations was found to be
in the order H&S–quality–cost–time with H&S as the most important and
time as the least important. As argued earlier, this seems to suggest a shift in
priorities from what obtains traditionally as reported in Xiao (2002) where
cost is considered as the most important objective.
It can be concluded from the above findings that generally the sample is
representative, or at least broadly reflective, of construction projects in the
UK. Projects of all kinds, procured under different arrangements, and across
the entire UK are represented in the sample.
6.4 AN ANALYSIS OF THE RELATIONSHIPS BETWEEN PROJECT CHARACTERISTICS
To assess the nature of inter-relationships between the project characteristics,
Spearman’s correlation was applied to the project characteristics. The
Spearman’s correlation coefficient was considered appropriate as the
variables involved were a combination of scale, ordinal or dichotomous
nominal data. The correlation matrix produced is shown in Table 8
(Appendix G). From Table 8 (Appendix G), it can be seen that many of the
project characteristics are inter-related. Altogether, these relationships paint
an interesting portrait of construction projects in the UK. Summarising the
key findings from this matrix, it can the seen that there is a strong positive
Project characteristics and culture
165
association between contract price, project duration, average number of
workers on site, actual out-turn cost and the actual duration. These
associations are logical as these parameters are all fundamentally measures of
the size and scale of the project. The association between these measures and
project complexity and number of variations implies that the bigger the
project, the more complex it is likely to be and the greater the number of
design variations that are likely to occur. This is also consistent with
conventional wisdom. The bigger projects are the public sector new work
projects within the civil engineering category. Such projects are associated
with greater influence of the civil engineer and the quantity surveyor.
Significantly the bigger a project gets (non-housing projects), the greater the
priority on cost relative to the other objectives, and the lower the emphasis
placed on quality. One other significant relationship is the negative
association between the priority of cost and the priority of H&S which
suggests that as more emphasis is placed on cost, there is less emphasis on
H&S. Bearing in mind the finding that there is greater emphasis on cost for
the bigger non-housing projects, it would appear to suggest that both quality
and H&S concerns are replaced by cost concerns as the project becomes
bigger in size.
These projects which manifest the relationships highlighted above represent
the context within which the cultural orientations to be examined have
developed. They also represent the sort of projects for which the inferences to
be drawn from the subsequent analyses can be considered valid.
6.5 DIAGNOSING THE CULTURE OF CPOs
In trying to diagnose the culture of CPOs in the UK based on the
questionnaire responses, composite indexes were constructed for the various
dimensions of culture. This was primarily because of the adoption of the
Project characteristics and culture
166
social cognitive theory (SCT) approach of reciprocal determinism (Wood and
Bandura, 1989; Pajares, 2002) which implied that each dimension of culture
was addressed by three questions covering the cognitive, behavioural and
situational aspects (refer Chapter 4). Such indexes ensure that more
comprehensive and more accurate assessments of orientations on variables
are obtained (Griffith et al., 1999). Babbie (1990) argues that where single
questionnaire items give only a crude assessment on a given variable, such
composite measures are preferable. Moreover, it is argued that such additive
indexes reduce the random error by averaging the individual random
variations to zero when summed across all items (Griffith et al., 1999).
6.5.1 Index construction
A number of requirements, as spelt out in Babbie (1990) had to be satisfied in
the construction of the indexes. Firstly, items presented in the negative on the
questionnaire had to be converted to the positive so that all items would read
in the same direction or context. Secondly, to ensure valid measurements,
face validity was required. Each item included in the index had to appear (at
least superficially) to be related to the variable it was purporting to measure.
Only items satisfying this requirement were selected for the construction of
the indexes. Lastly there was a need for unidimensionality, in that a
composite measure should only represent one dimension. Therefore no
questionnaire item was included in more than one of the indexes.
6.5.2 Index scoring
Babbie (1990) argued that equal weighting should be applied unless there
were compelling reasons for the application of differential weighting.
Therefore, in the analysis undertaken, equal weighting was applied to the
items in the composite index. Each respondent was thus assigned an overall
score representing the mean of the scores received on individual items as per
Project characteristics and culture
167
Babbie (ibid). In this study where each index was made up of three
questionnaire items, the three items were each allocated a 33.33% weighting.
Scoring the indexes in this manner gave a theoretical range of scores from a
minimum of 1 to a maximum of 5, with 1 representing a very low orientation
on the dimension and 5 representing a very high orientation. 37 indexes
(dimensions of culture) were generated in this manner. Appendix H shows
the individual questionnaire items making up the indexes.
6.5.3 A profile of the general cultural orientation of CPOs
Descriptive statistics for the 37 dimensions of culture were produced (Table
6.10). The measure of central tendency employed was the mean, although the
median would theoretically have been the more accurate measure because the
data was ordinal. However as explained in Hofstede (2001) the mean was
used as the nature of the data was such that the mean is a close estimate of
the median. This is borne out by the results in Table 6.10. The mean is also
easier to determine and interpret, and can be employed in various other
calculations. Besides, as in the case of Hofstede (2001) the data scales used in
this study i.e. very important to not important, and strongly agree to strongly
disagree, can be considered quasi-interval scales, implying that the mean is a
reasonable and valid measure.
A web chart of the means, representing the mean cultural orientations of
CPOs along the various dimensions, is shown in Figure 6.5.
These findings are also summarised in simpler terms in Table 6.11. The
lowest rated dimension was blame culture (T8) which was rated low. The fact
that it was not rated very low implies that a certain level of finger-pointing
still exists. This is in keeping with the reputation of the construction industry
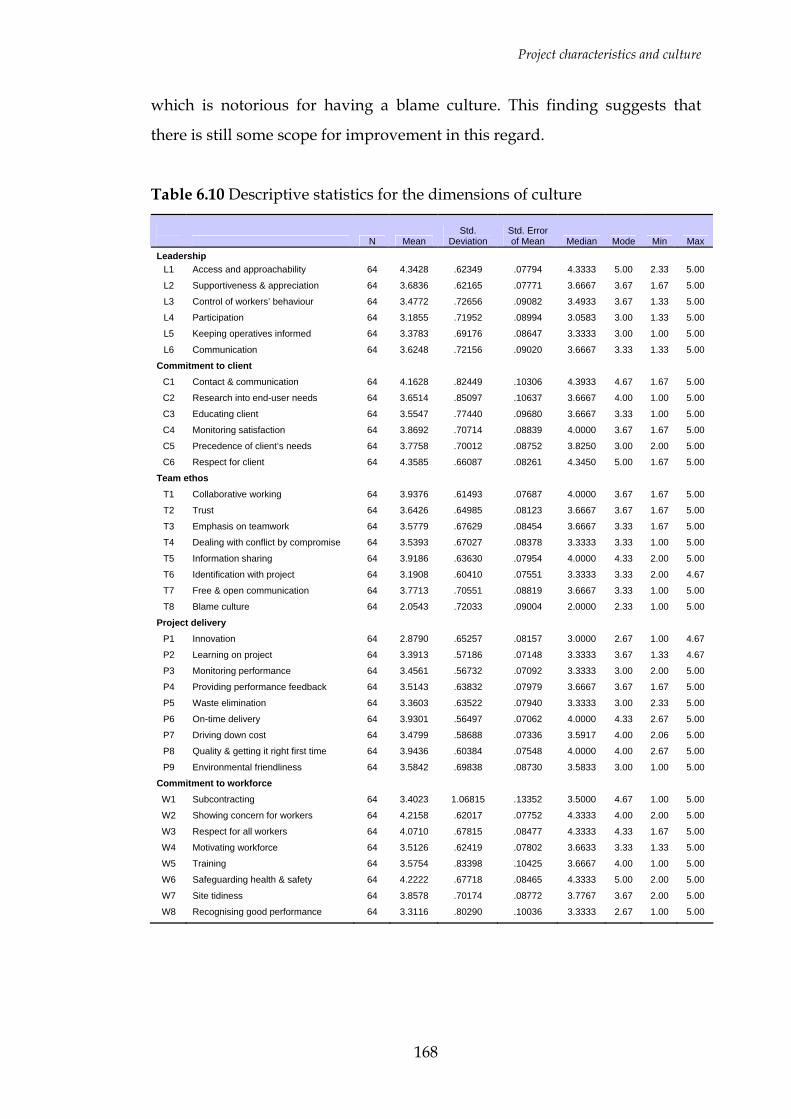
Project characteristics and culture
168
which is notorious for having a blame culture. This finding suggests that
there is still some scope for improvement in this regard.
Table 6.10 Descriptive statistics for the dimensions of culture
N Mean
Std. Deviation
Std. Error of Mean Median Mode Min Max
Leadership
L1 Access and approachability 64 4.3428 .62349 .07794 4.3333 5.00 2.33 5.00
L2 Supportiveness & appreciation 64 3.6836 .62165 .07771 3.6667 3.67 1.67 5.00
L3 Control of workers’ behaviour 64 3.4772 .72656 .09082 3.4933 3.67 1.33 5.00
L4 Participation 64 3.1855 .71952 .08994 3.0583 3.00 1.33 5.00
L5 Keeping operatives informed 64 3.3783 .69176 .08647 3.3333 3.00 1.00 5.00
L6 Communication 64 3.6248 .72156 .09020 3.6667 3.33 1.33 5.00
Commitment to client
C1 Contact & communication 64 4.1628 .82449 .10306 4.3933 4.67 1.67 5.00
C2 Research into end-user needs 64 3.6514 .85097 .10637 3.6667 4.00 1.00 5.00
C3 Educating client 64 3.5547 .77440 .09680 3.6667 3.33 1.00 5.00
C4 Monitoring satisfaction 64 3.8692 .70714 .08839 4.0000 3.67 1.67 5.00
C5 Precedence of client’s needs 64 3.7758 .70012 .08752 3.8250 3.00 2.00 5.00
C6 Respect for client 64 4.3585 .66087 .08261 4.3450 5.00 1.67 5.00
Team ethos
T1 Collaborative working 64 3.9376 .61493 .07687 4.0000 3.67 1.67 5.00
T2 Trust 64 3.6426 .64985 .08123 3.6667 3.67 1.67 5.00
T3 Emphasis on teamwork 64 3.5779 .67629 .08454 3.6667 3.33 1.67 5.00
T4 Dealing with conflict by compromise 64 3.5393 .67027 .08378 3.3333 3.33 1.00 5.00
T5 Information sharing 64 3.9186 .63630 .07954 4.0000 4.33 2.00 5.00
T6 Identification with project 64 3.1908 .60410 .07551 3.3333 3.33 2.00 4.67
T7 Free & open communication 64 3.7713 .70551 .08819 3.6667 3.33 1.00 5.00
T8 Blame culture 64 2.0543 .72033 .09004 2.0000 2.33 1.00 5.00
Project delivery
P1 Innovation 64 2.8790 .65257 .08157 3.0000 2.67 1.00 4.67
P2 Learning on project 64 3.3913 .57186 .07148 3.3333 3.67 1.33 4.67
P3 Monitoring performance 64 3.4561 .56732 .07092 3.3333 3.00 2.00 5.00
P4 Providing performance feedback 64 3.5143 .63832 .07979 3.6667 3.67 1.67 5.00
P5 Waste elimination 64 3.3603 .63522 .07940 3.3333 3.00 2.33 5.00
P6 On-time delivery 64 3.9301 .56497 .07062 4.0000 4.33 2.67 5.00
P7 Driving down cost 64 3.4799 .58688 .07336 3.5917 4.00 2.06 5.00
P8 Quality & getting it right first time 64 3.9436 .60384 .07548 4.0000 4.00 2.67 5.00
P9 Environmental friendliness 64 3.5842 .69838 .08730 3.5833 3.00 1.00 5.00
Commitment to workforce
W1 Subcontracting 64 3.4023 1.06815 .13352 3.5000 4.67 1.00 5.00
W2 Showing concern for workers 64 4.2158 .62017 .07752 4.3333 4.00 2.00 5.00
W3 Respect for all workers 64 4.0710 .67815 .08477 4.3333 4.33 1.67 5.00
W4 Motivating workforce 64 3.5126 .62419 .07802 3.6633 3.33 1.33 5.00
W5 Training 64 3.5754 .83398 .10425 3.6667 4.00 1.00 5.00
W6 Safeguarding health & safety 64 4.2222 .67718 .08465 4.3333 5.00 2.00 5.00
W7 Site tidiness 64 3.8578 .70174 .08772 3.7767 3.67 2.00 5.00
W8 Recognising good performance 64 3.3116 .80290 .10036 3.3333 2.67 1.00 5.00
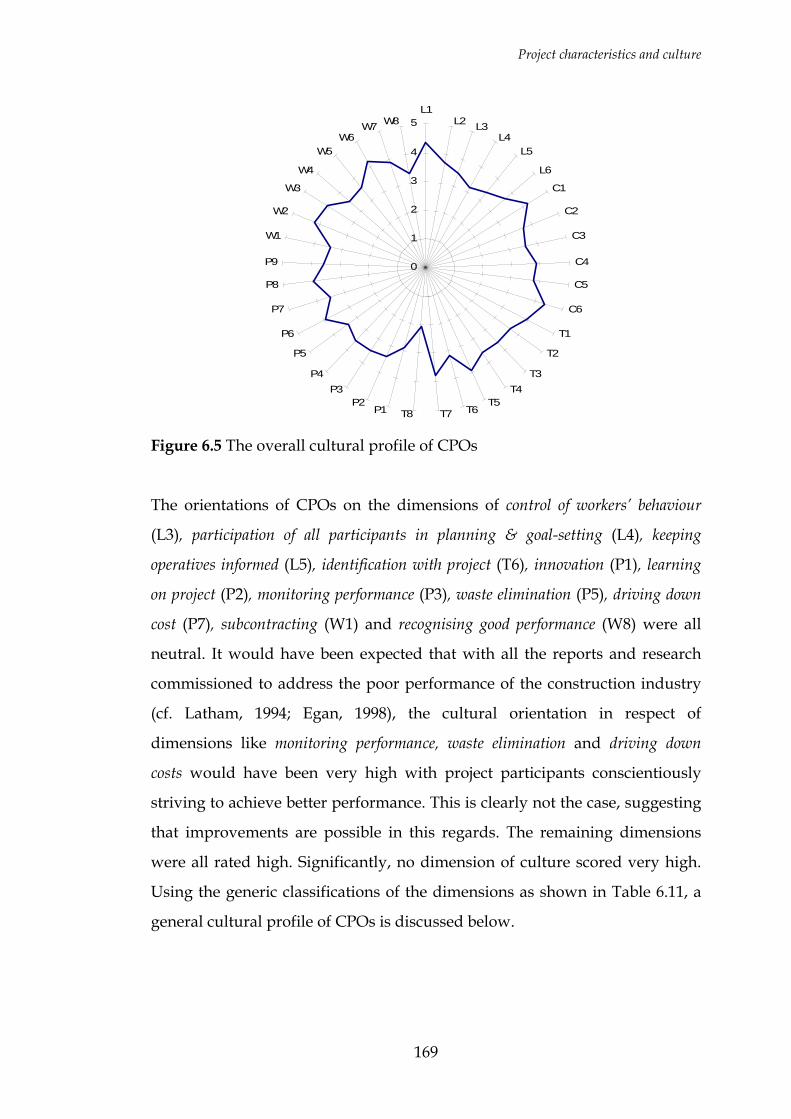
Project characteristics and culture
169
0
1
2
3
4
5L1
L2 L3L4
L5
L6
C1
C2
C3
C4
C5
C6
T1
T2
T3T4
T5T6T7T8P1
P2P3
P4
P5
P6
P7
P8
P9
W1
W2
W3
W4
W5W6
W7 W8
Figure 6.5 The overall cultural profile of CPOs
The orientations of CPOs on the dimensions of control of workers’ behaviour
(L3), participation of all participants in planning & goal-setting (L4), keeping
operatives informed (L5), identification with project (T6), innovation (P1), learning
on project (P2), monitoring performance (P3), waste elimination (P5), driving down
cost (P7), subcontracting (W1) and recognising good performance (W8) were all
neutral. It would have been expected that with all the reports and research
commissioned to address the poor performance of the construction industry
(cf. Latham, 1994; Egan, 1998), the cultural orientation in respect of
dimensions like monitoring performance, waste elimination and driving down
costs would have been very high with project participants conscientiously
striving to achieve better performance. This is clearly not the case, suggesting
that improvements are possible in this regards. The remaining dimensions
were all rated high. Significantly, no dimension of culture scored very high.
Using the generic classifications of the dimensions as shown in Table 6.11, a
general cultural profile of CPOs is discussed below.
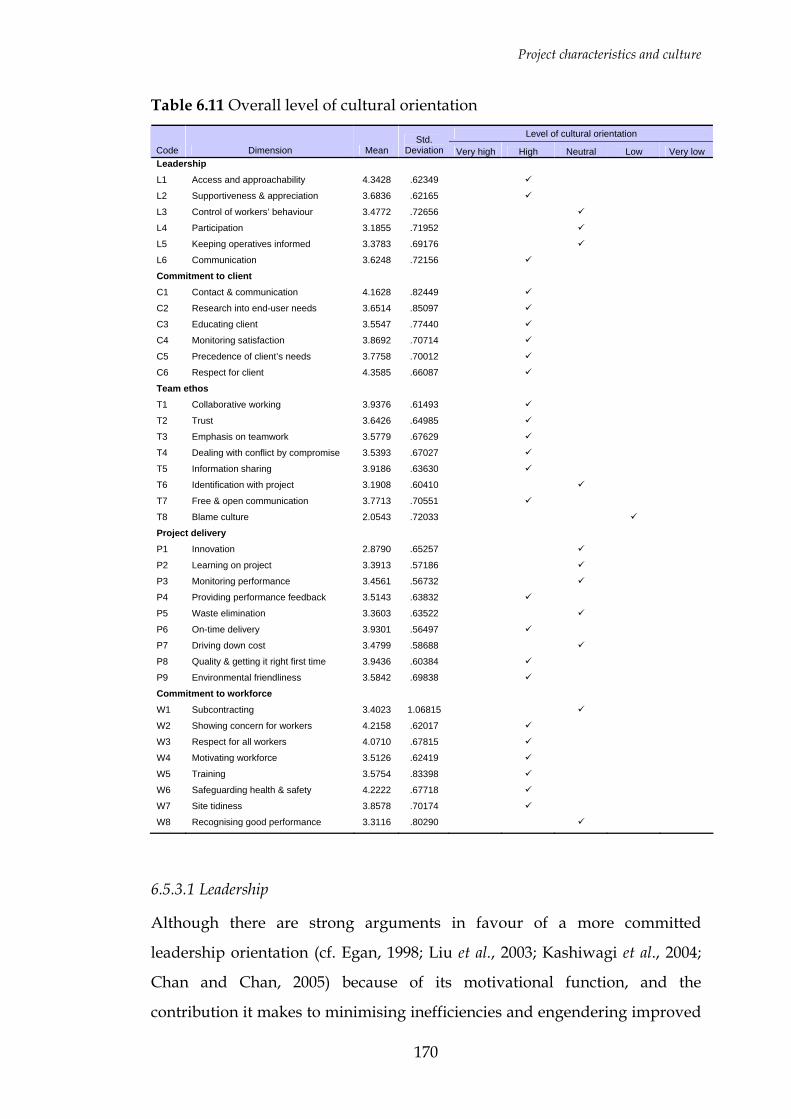
Project characteristics and culture
170
Table 6.11 Overall level of cultural orientation Level of cultural orientation
Code Dimension Mean Std.
Deviation Very high High Neutral Low Very low Leadership
L1 Access and approachability 4.3428 .62349
L2 Supportiveness & appreciation 3.6836 .62165
L3 Control of workers’ behaviour 3.4772 .72656
L4 Participation 3.1855 .71952
L5 Keeping operatives informed 3.3783 .69176
L6 Communication 3.6248 .72156
Commitment to client
C1 Contact & communication 4.1628 .82449
C2 Research into end-user needs 3.6514 .85097
C3 Educating client 3.5547 .77440
C4 Monitoring satisfaction 3.8692 .70714
C5 Precedence of client’s needs 3.7758 .70012
C6 Respect for client 4.3585 .66087
Team ethos
T1 Collaborative working 3.9376 .61493
T2 Trust 3.6426 .64985
T3 Emphasis on teamwork 3.5779 .67629
T4 Dealing with conflict by compromise 3.5393 .67027
T5 Information sharing 3.9186 .63630
T6 Identification with project 3.1908 .60410
T7 Free & open communication 3.7713 .70551
T8 Blame culture 2.0543 .72033
Project delivery
P1 Innovation 2.8790 .65257
P2 Learning on project 3.3913 .57186
P3 Monitoring performance 3.4561 .56732
P4 Providing performance feedback 3.5143 .63832
P5 Waste elimination 3.3603 .63522
P6 On-time delivery 3.9301 .56497
P7 Driving down cost 3.4799 .58688
P8 Quality & getting it right first time 3.9436 .60384
P9 Environmental friendliness 3.5842 .69838
Commitment to workforce
W1 Subcontracting 3.4023 1.06815
W2 Showing concern for workers 4.2158 .62017
W3 Respect for all workers 4.0710 .67815
W4 Motivating workforce 3.5126 .62419
W5 Training 3.5754 .83398
W6 Safeguarding health & safety 4.2222 .67718
W7 Site tidiness 3.8578 .70174
W8 Recognising good performance 3.3116 .80290
6.5.3.1 Leadership
Although there are strong arguments in favour of a more committed
leadership orientation (cf. Egan, 1998; Liu et al., 2003; Kashiwagi et al., 2004;
Chan and Chan, 2005) because of its motivational function, and the
contribution it makes to minimising inefficiencies and engendering improved
Project characteristics and culture
171
performance, the results of this survey seem to suggest an indifference in
leadership orientation corroborating Egan’s (1998) assertions that there is a
lack of widespread evidence of the commitment of leadership. Although
there is generally a high orientation in respect of access and approachability
of management staff, supportiveness and appreciation, and communication,
there is also a neutral orientation in respect of control of workers’ behaviour,
participation of all participants in planning and goal-setting, and keeping
operatives informed. All these dimensions can be improved.
6.5.3.2 Commitment to client
Although it is widely believed that in construction, there is a tendency to
focus on the next job and the next employer which detracts from a focus on
the current client (Egan, 1998), this research suggests that there is still a
relatively high orientation in respect of all the dimensions relating to
commitment to client. CPOs exhibited a generally high orientation on the
dimensions contact and communication, research into end-user needs,
educating client, precedence of client’s needs, respect for the client, and
monitoring client satisfaction. Given that client focus is important for
performance improvement (Egan, 1998; Dainty et al., 2005), it is reasonable to
suggest that CPOs need to further improve orientations to a very high level.
6.5.3.3 Team ethos
A fundamental characteristic of the construction industry is the extensive
fragmentation within the CPO (cf. Latham, 1994; Harvey and Ashworth, 1997;
Egan, 1998; Fellows et al., 2002; Cain, 2004). It is widely believed that this
fragmentation has negative impacts on project delivery (cf. Latham, 1994;
Egan, 1998). With the high orientations found among CPOs in this survey in
respect of the dimensions of collaborative working, trust, emphasis on
teamwork, dealing with conflict by compromise, information sharing, and
free and open communication, and the low orientation in respect of blame
culture, it would appear to suggest that project participants are taking on
board the messages advocating greater integration. The level of identification
Project characteristics and culture
172
with the project was however rated neutral overall. In all these aspects, there
is room for further improvement.
6.5.3.4 Project delivery
The orientation of CPOs on the dimensions in this area was mixed. Whilst
orientations were high in respect of providing performance feedback, striving
for on-time delivery, quality and getting it right first time, and environmental
friendliness, orientations in respect of the dimensions innovation, learning on
project, monitoring performance, emphasising waste elimination, and
striving to drive down cost, were all neutral. This finding is consistent with
the suggestion that the selection of designers and constructors on the basis of
lowest cost instead of overall value for money undermines the interest of
some project participants in improving their orientations in respect of these
dimensions of culture (cf. Littlefield, 1998; Cain, 2004).
6.5.3.5 Commitment to workforce
As argued earlier there is still a problem in construction of recognising that its
people are its greatest assets and hence a need to invest in their training and
development, health and safety, decent site conditions, and fair wages (Egan,
1998; Fellows et al., 2002; Pearce, 2003). This is borne out by the findings
which show a high (rather than very high) cultural orientation in respect of
the dimensions of showing concern for workers, respect for all workers,
motivating workforce, safeguarding health and safety, and site tidiness, and a
neutral cultural orientation in respect of the dimensions subcontracting, and
recognising good performance. With the exception of the dimension
subcontracting which fundamentally assessed the degree of utilisation of
direct labour or subcontractors, it would have been expected that if people
are indeed the “greatest assets” (Fellows et al., 2002), then there should be a
very high orientation in respect of all these dimensions. Here also, there is
scope for improvement in the cultural profile of CPOs.
Project characteristics and culture
173
These findings in respect of the cultural orientations of CPOs are particularly
useful for those seeking change in the culture of the construction industry as
it identifies those areas where improvements are possible. Relating this
perspective to social cognitive theory, it can be suggested that measures to
drive such improvements must address the cognitive aspects, the behavioural
aspects and/or the situational contexts within which project participants
function. Whether or not such improvements in culture will also improve
performance however requires further investigation.
6.6 IDENTIFYING THE UNDERLYING FACTORS
In order to test the factor structure of the 37 dimensions of culture being
investigated and to establish the extent to which any underlying factors tally
with the a priori item classification based on Egan (1998), factor analysis was
undertaken. The factor analysis was also to demonstrate convergent and
discriminant validity and also to reduce the number of variables to be
considered in subsequent analysis.
It has been specified in Hair et al. (1998) that the preferable size for factor
analysis is 100 cases or more. A common rule of thumb for sample size is a
ratio of five to ten cases per variable (Hair et al., 1998; Field, 2000). Some even
specify higher ratios (Osborne and Costello, 2004). The sample size of 64 in
this analysis which is less than the suggested minimum therefore raises the
question of sample size adequacy and whether the application of factor
analysis will lead to the extraction of stable factors. However it has also been
argued in Field (2000) that under certain circumstances the sample size may
not be critical. For instance it has been argued ibid that if a factor has four or
more loadings greater than 0.6 then it is reliable regardless of sample size.
Again, where all communalities are greater than 0.6, samples less than 100
may be perfectly adequate (ibid). Communalities obtained in this research are
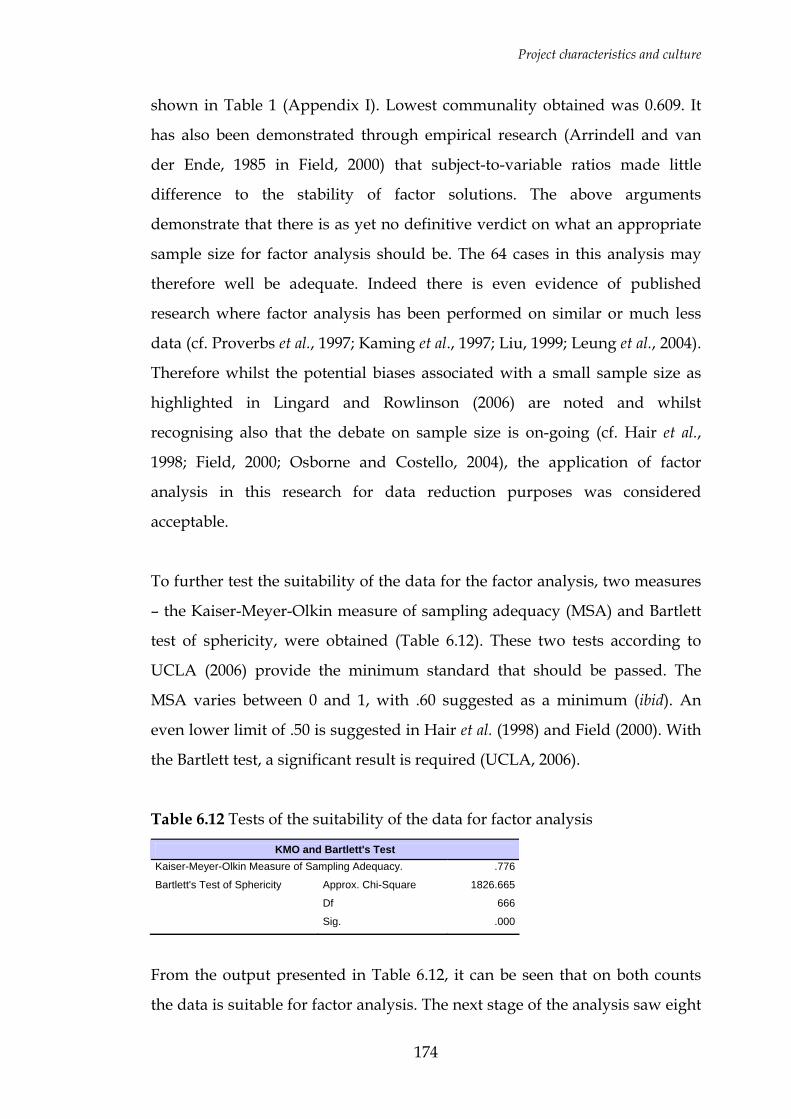
Project characteristics and culture
174
shown in Table 1 (Appendix I). Lowest communality obtained was 0.609. It
has also been demonstrated through empirical research (Arrindell and van
der Ende, 1985 in Field, 2000) that subject-to-variable ratios made little
difference to the stability of factor solutions. The above arguments
demonstrate that there is as yet no definitive verdict on what an appropriate
sample size for factor analysis should be. The 64 cases in this analysis may
therefore well be adequate. Indeed there is even evidence of published
research where factor analysis has been performed on similar or much less
data (cf. Proverbs et al., 1997; Kaming et al., 1997; Liu, 1999; Leung et al., 2004).
Therefore whilst the potential biases associated with a small sample size as
highlighted in Lingard and Rowlinson (2006) are noted and whilst
recognising also that the debate on sample size is on-going (cf. Hair et al.,
1998; Field, 2000; Osborne and Costello, 2004), the application of factor
analysis in this research for data reduction purposes was considered
acceptable.
To further test the suitability of the data for the factor analysis, two measures
– the Kaiser-Meyer-Olkin measure of sampling adequacy (MSA) and Bartlett
test of sphericity, were obtained (Table 6.12). These two tests according to
UCLA (2006) provide the minimum standard that should be passed. The
MSA varies between 0 and 1, with .60 suggested as a minimum (ibid). An
even lower limit of .50 is suggested in Hair et al. (1998) and Field (2000). With
the Bartlett test, a significant result is required (UCLA, 2006).
Table 6.12 Tests of the suitability of the data for factor analysis
KMO and Bartlett's Test Kaiser-Meyer-Olkin Measure of Sampling Adequacy. .776
Bartlett's Test of Sphericity Approx. Chi-Square 1826.665
Df 666
Sig. .000
From the output presented in Table 6.12, it can be seen that on both counts
the data is suitable for factor analysis. The next stage of the analysis saw eight
Project characteristics and culture
175
components initially extracted accounting for 73.88% of the total variance in
the 37 dimensions of culture (Table 2, Appendix I). The extraction of the eight
components was based on the Kaiser criterion which specifies the extraction
of all factors with eigen values ≥1 (Field, 2000). It is important to recognise
that an exact quantitative basis for the number of factors to extract does not
exist (Hair et al., 1998). What exists are a number of criteria outlined in Hair et
al. (1998) and Field (2000) that are in current use and that are applied
subjectively in research. One of these is the Kaiser criterion. According to
Field (2000), the Kaiser criterion should not be the only criterion used for
factor extraction as its reliability is dependent on the number of variables and
the sample size. Indeed the Kaiser criterion is most reliable when variables
are between 20 and 50 (Hair et al., 1998), and also where sample size is greater
than 250 with average communality greater than or equal to 0.6 (Field, 2000).
An alternative to the Kaiser criterion provided by Hair et al. (1998) is the a
priori criterion where the researcher already knows the desired number of
components based for instance on theory. In this research, the literature
review and the interview results seemed to indicate five key categories of the
cultural dimensions, implying the extraction of five components if this
criterion is adopted. Another alternative criterion is the percentage of
variance criterion which specifies that for social science research selecting a
solution that accounts for 60% of the total variance is satisfactory (ibid). In this
research, 60% of the total variance coincides with five components as shown
in Table 6.13. Indeed the scree plot produced (Figure 6.6) also provides
support for a five component solution. The cut-off point for selecting
components on a scree plot is the point of inflexion or change of direction
(Field, 2000), which on Figure 6.6 is marked by the thunderbolt. This point of
inflexion corresponds with five components.
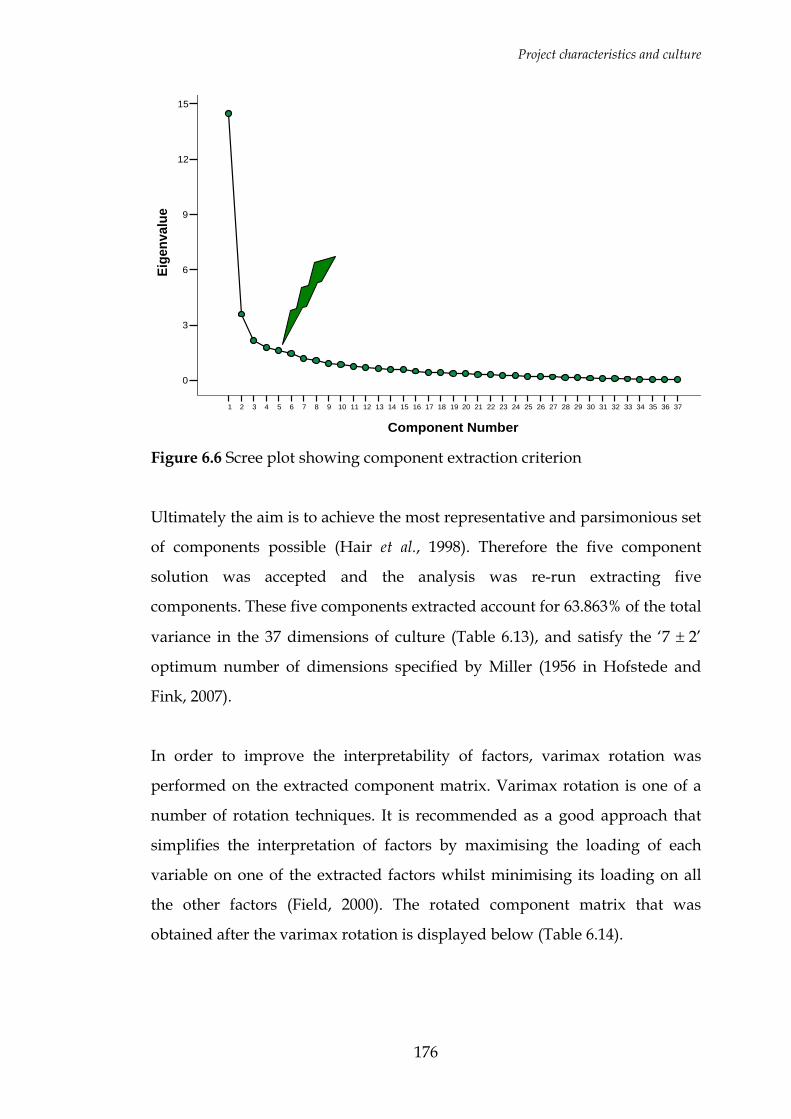
Project characteristics and culture
176
37363534333231302928272625242322212019181716151413121110987654321
Component Number
15
12
9
6
3
0
Eige
nval
ue
Figure 6.6 Scree plot showing component extraction criterion
Ultimately the aim is to achieve the most representative and parsimonious set
of components possible (Hair et al., 1998). Therefore the five component
solution was accepted and the analysis was re-run extracting five
components. These five components extracted account for 63.863% of the total
variance in the 37 dimensions of culture (Table 6.13), and satisfy the ‘7 ± 2’
optimum number of dimensions specified by Miller (1956 in Hofstede and
Fink, 2007).
In order to improve the interpretability of factors, varimax rotation was
performed on the extracted component matrix. Varimax rotation is one of a
number of rotation techniques. It is recommended as a good approach that
simplifies the interpretation of factors by maximising the loading of each
variable on one of the extracted factors whilst minimising its loading on all
the other factors (Field, 2000). The rotated component matrix that was
obtained after the varimax rotation is displayed below (Table 6.14).
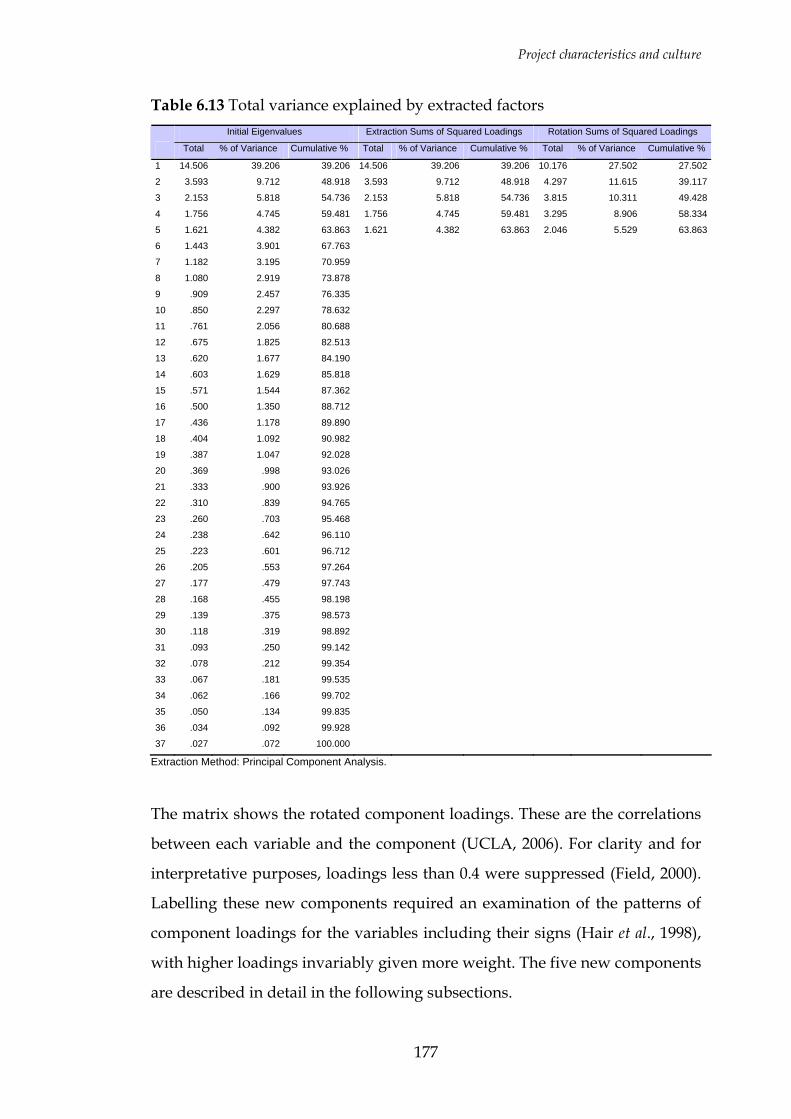
Project characteristics and culture
177
Table 6.13 Total variance explained by extracted factors Initial Eigenvalues Extraction Sums of Squared Loadings Rotation Sums of Squared Loadings
Total % of Variance Cumulative % Total % of Variance Cumulative % Total % of Variance Cumulative %
1 14.506 39.206 39.206 14.506 39.206 39.206 10.176 27.502 27.502
2 3.593 9.712 48.918 3.593 9.712 48.918 4.297 11.615 39.117
3 2.153 5.818 54.736 2.153 5.818 54.736 3.815 10.311 49.428
4 1.756 4.745 59.481 1.756 4.745 59.481 3.295 8.906 58.334
5 1.621 4.382 63.863 1.621 4.382 63.863 2.046 5.529 63.863
6 1.443 3.901 67.763
7 1.182 3.195 70.959
8 1.080 2.919 73.878
9 .909 2.457 76.335
10 .850 2.297 78.632
11 .761 2.056 80.688
12 .675 1.825 82.513
13 .620 1.677 84.190
14 .603 1.629 85.818
15 .571 1.544 87.362
16 .500 1.350 88.712
17 .436 1.178 89.890
18 .404 1.092 90.982
19 .387 1.047 92.028
20 .369 .998 93.026
21 .333 .900 93.926
22 .310 .839 94.765
23 .260 .703 95.468
24 .238 .642 96.110
25 .223 .601 96.712
26 .205 .553 97.264
27 .177 .479 97.743
28 .168 .455 98.198
29 .139 .375 98.573
30 .118 .319 98.892
31 .093 .250 99.142
32 .078 .212 99.354
33 .067 .181 99.535
34 .062 .166 99.702
35 .050 .134 99.835
36 .034 .092 99.928
37 .027 .072 100.000
Extraction Method: Principal Component Analysis.
The matrix shows the rotated component loadings. These are the correlations
between each variable and the component (UCLA, 2006). For clarity and for
interpretative purposes, loadings less than 0.4 were suppressed (Field, 2000).
Labelling these new components required an examination of the patterns of
component loadings for the variables including their signs (Hair et al., 1998),
with higher loadings invariably given more weight. The five new components
are described in detail in the following subsections.
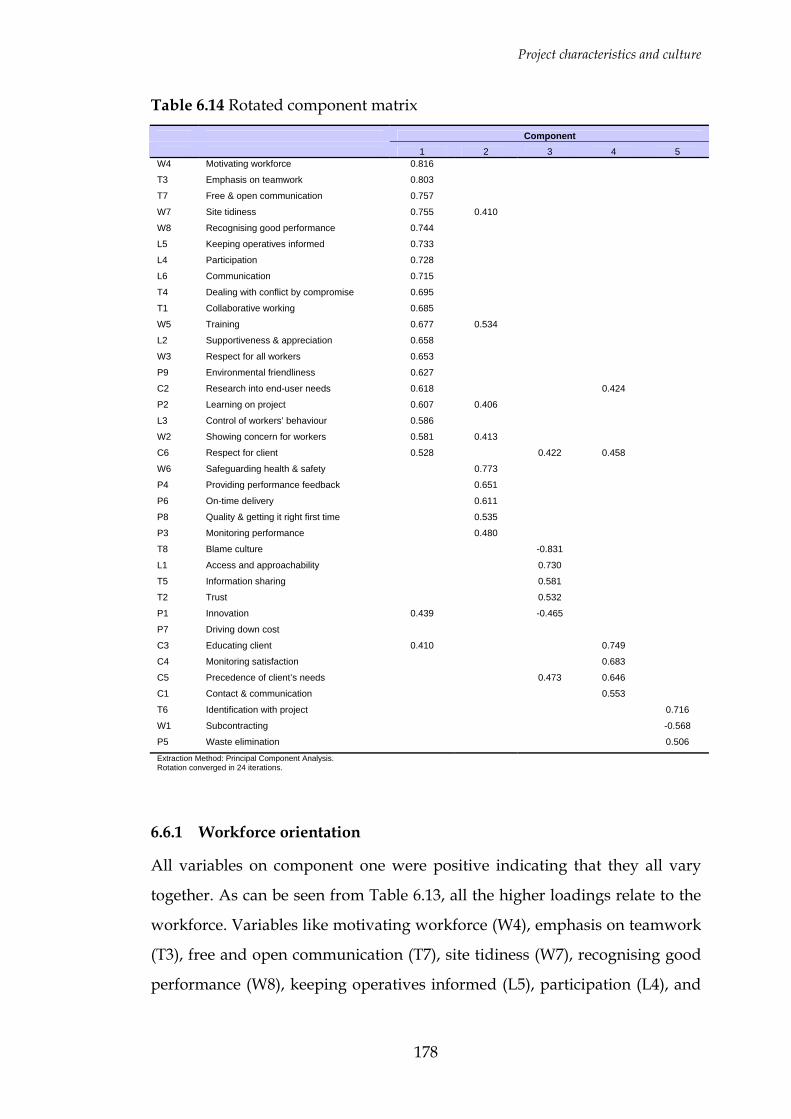
Project characteristics and culture
178
Table 6.14 Rotated component matrix
Component 1 2 3 4 5 W4 Motivating workforce 0.816
T3 Emphasis on teamwork 0.803
T7 Free & open communication 0.757
W7 Site tidiness 0.755 0.410
W8 Recognising good performance 0.744
L5 Keeping operatives informed 0.733
L4 Participation 0.728
L6 Communication 0.715
T4 Dealing with conflict by compromise 0.695
T1 Collaborative working 0.685
W5 Training 0.677 0.534
L2 Supportiveness & appreciation 0.658
W3 Respect for all workers 0.653
P9 Environmental friendliness 0.627
C2 Research into end-user needs 0.618 0.424
P2 Learning on project 0.607 0.406
L3 Control of workers’ behaviour 0.586
W2 Showing concern for workers 0.581 0.413
C6 Respect for client 0.528 0.422 0.458
W6 Safeguarding health & safety 0.773
P4 Providing performance feedback 0.651
P6 On-time delivery 0.611
P8 Quality & getting it right first time 0.535
P3 Monitoring performance 0.480
T8 Blame culture -0.831
L1 Access and approachability 0.730
T5 Information sharing 0.581
T2 Trust 0.532
P1 Innovation 0.439 -0.465
P7 Driving down cost
C3 Educating client 0.410 0.749
C4 Monitoring satisfaction 0.683
C5 Precedence of client’s needs 0.473 0.646
C1 Contact & communication 0.553
T6 Identification with project 0.716
W1 Subcontracting -0.568
P5 Waste elimination 0.506
Extraction Method: Principal Component Analysis. Rotation converged in 24 iterations.
6.6.1 Workforce orientation
All variables on component one were positive indicating that they all vary
together. As can be seen from Table 6.13, all the higher loadings relate to the
workforce. Variables like motivating workforce (W4), emphasis on teamwork
(T3), free and open communication (T7), site tidiness (W7), recognising good
performance (W8), keeping operatives informed (L5), participation (L4), and

Project characteristics and culture
179
communication (L6) were loaded highly on component one. This component
was therefore labelled workforce orientation. It is very common to find this
dimension (or similar) in empirical studies of organisational culture, as in the
very recent study of Zuo and Zillante (2006) on project culture, which found
people orientation to be significantly associated with team satisfaction.
Workforce orientation encompasses the amount of effort put into motivating
the workforce, emphasis on teamwork, the extent of free and open
communication on site, the emphasis on site tidiness, recognition of good
performance, keeping operatives informed of project developments, the
extent of participation in planning and decision-making by the workforce,
communication between managers and operatives, and so on. These elements
generally speaking, are not areas for which the construction industry is
renowned for exemplifying good practice as found for instance in Riley and
Clare-Brown (2001). This is supported by the results shown in Figure 6.5 and
Table 6.11, which indicate that the UK construction industry is generally
moderate in orientation in respect of aspects like recognising good
performance, keeping operatives informed and participation in planning and
decision-making, and just above moderate in respect of the other dimensions.
Going by the evidence presented so far, it appears reasonable to suggest that
the workforce orientation of construction project organisations can and must
be improved, especially as it is universally recognised that these are traits
necessary for employee satisfaction and organisational effectiveness (Robbins,
1998; Mullins, 2005).
6.6.2 Performance orientation
Variables on component two were also all positive indicating that they all
vary together. Variables highly loaded on this component were safeguarding
health and safety (W6), providing performance feedback (P4), on-time

Project characteristics and culture
180
delivery (P6), and quality and getting it right first time (P8). All these
dimensions assess orientation of CPOs in relation to aspects of delivering
projects to specified standards. This component was therefore labelled
performance orientation. A similar dimension – results orientation, has also
been investigated in other studies (cf. Zuo and Zillante, 2006) demonstrating
the validity of these results.
Performance orientation encompasses safeguarding H&S, providing
performance feedback for continuous improvement, emphasising on-time
delivery, and striving for quality delivery and getting it right first time. The
profile summarised in Table 6.11 shows that the orientation on all these
aspects is high. A high performance orientation is understandable
considering the fact that there are direct penalties associated with falling foul
of any requirements associated with these dimensions unlike the workforce
orientation.
Here also, there is room for further improvement. Dainty et al. (2005) report a
similar dimension in respect of project management competencies described
as achievement orientation, a concern for working well towards a standard of
excellence. High-performing project managers’ achievement orientations
were inevitably directed towards successful project outcomes.
6.6.3 Team orientation
Component three had negative loading on the variables blame culture (T8)
and innovation (P1) indicating that they vary together. That is, trying out new
ways of executing tasks is associated with a blame culture. The variables
access and approachability (L1), information sharing (T5), and trust (T2) were
all positively loaded indicating that they also vary together but are oppositely
related to the blame culture (T8). All together, the significant loadings give an
indication of the team orientation.

Project characteristics and culture
181
Team orientation thus encompasses blame culture (or absence of it), the
extent to which management is accessible and approachable, amount of
information sharing, degree of trust, and to lesser extent the avoidance of
innovation. Team orientation is generally high as can be seen from Table 6.11,
with a low blame culture across the projects surveyed. This appears to herald
an improvement from the time of Shammas-Toma et al. (1998) which found a
culture dominated by short-term financial considerations and reflected in
uncooperative, antagonistic and suspicious relationships with accusations,
recriminations and blame, to be common on UK construction sites. Because of
the fragmented nature of construction, a high team orientation with better
integration, cooperation and coordination of construction project teams is
often a prerequisite for project success (Dozzi et al., 1996; Cicmil and
Marshall, 2005). This is consistent with Baiden et al. (2006) who posit that
team orientation promotes a working environment where information is
freely exchanged between the different participants.
The importance of this orientation has also been emphasized by Dainty et al.
(2005) which also reported a requirement for teamwork and cooperation
competency within project management.
6.6.4 Client orientation
All the variables on component four were positive, indicating that they all
vary together. These variables were educating client (C3), monitoring client
satisfaction (C4), precedence of client’s needs (C5), and contact and
communication with client (C1), all clearly making reference to relations with
the client. Component four was therefore labelled client orientation.
Client orientation thus encompasses the effort put into educating the client,
the extent to which client satisfaction is monitored, precedence of client’s
needs, and the amount of contact and communication between the project
organisation and client. It is widely recognised that customer-focus is a
Project characteristics and culture
182
precursor to success, and as a result, it has been argued that contractor
organisations must be customer-focused, in terms of understanding and
fulfilling the expectations of the client (Bryde and Robinson, 2005). In Dainty
et al.’s (2005) study on the competencies of project managers, high performing
managers were found among other tendencies to show a marked propensity
for seeking information about the real, underlying needs of clients, beyond
those overtly expressed within contractual documents and terms of
appointment. They also exhibited a responsible attitude towards dealing with
customer service problems rapidly and efficiently (ibid). These findings
underscore the importance of client orientation. From the data analysed in
Table 6.11, client orientation is generally high across the sampled construction
projects, reflecting an appreciation of the importance of this dimension. This
is in line with the Egan (1998) agenda for change which challenged the
industry to show greater commitment to its clients. But there is still some
scope for further improvement in this regard as none of the individual
dimensions making up client orientation was rated as being very high.
6.6.5 Project orientation
The final component – component five, had one negative loading due to the
variable subcontracting (W1) indicating that it varies negatively with the
other variables – identification with project (T6) and waste elimination (W5)
which both have positive loadings. This could be interpreted as meaning, the
greater the level of subcontracting, the lower the level of identification with
the project (probably due to the compounded effect of out-group
discrimination – drawn from Phua and Rowlinson’s (2004) social identity
perspective), and the lower the waste elimination orientation. It has been
noted in Hsieh (1998) that there is a tendency for subcontracting to divide the
CPO into “islands” or self-centred decision-making units with conflicting
interests. It has also been noted (ibid) that current subcontracting practices are
inimical to waste elimination and improved productivity. It is therefore not
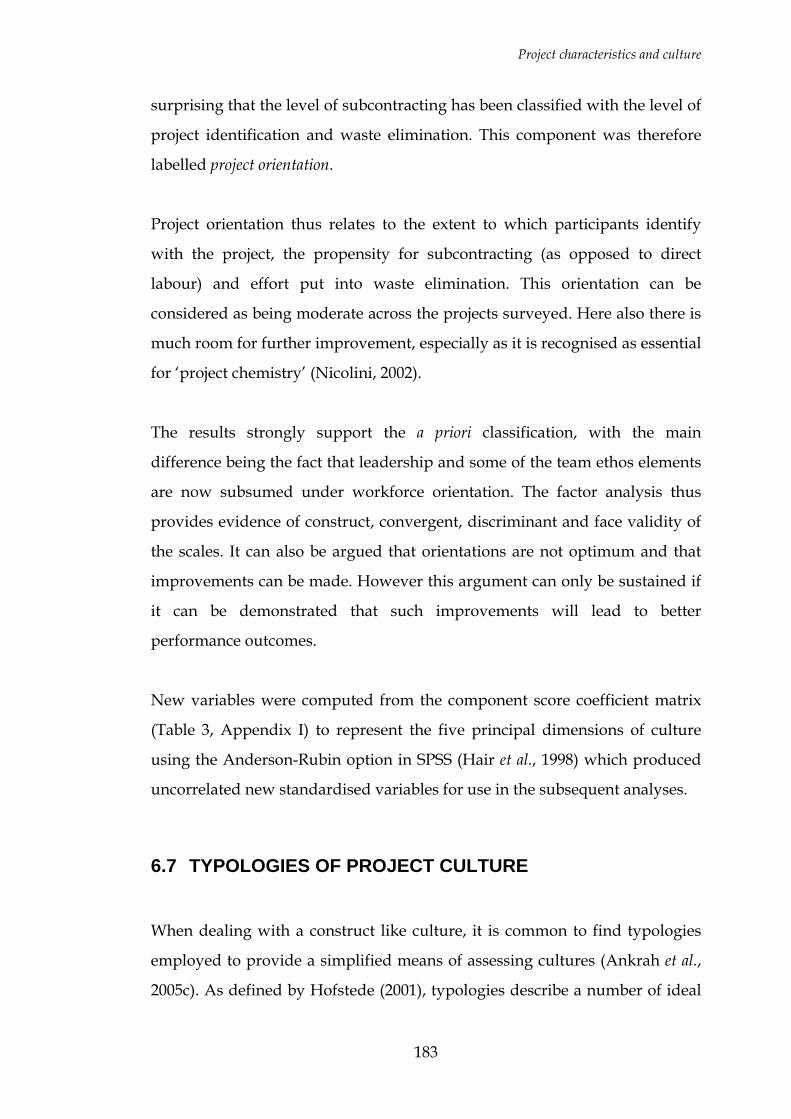
Project characteristics and culture
183
surprising that the level of subcontracting has been classified with the level of
project identification and waste elimination. This component was therefore
labelled project orientation.
Project orientation thus relates to the extent to which participants identify
with the project, the propensity for subcontracting (as opposed to direct
labour) and effort put into waste elimination. This orientation can be
considered as being moderate across the projects surveyed. Here also there is
much room for further improvement, especially as it is recognised as essential
for ‘project chemistry’ (Nicolini, 2002).
The results strongly support the a priori classification, with the main
difference being the fact that leadership and some of the team ethos elements
are now subsumed under workforce orientation. The factor analysis thus
provides evidence of construct, convergent, discriminant and face validity of
the scales. It can also be argued that orientations are not optimum and that
improvements can be made. However this argument can only be sustained if
it can be demonstrated that such improvements will lead to better
performance outcomes.
New variables were computed from the component score coefficient matrix
(Table 3, Appendix I) to represent the five principal dimensions of culture
using the Anderson-Rubin option in SPSS (Hair et al., 1998) which produced
uncorrelated new standardised variables for use in the subsequent analyses.
6.7 TYPOLOGIES OF PROJECT CULTURE
When dealing with a construct like culture, it is common to find typologies
employed to provide a simplified means of assessing cultures (Ankrah et al.,
2005c). As defined by Hofstede (2001), typologies describe a number of ideal
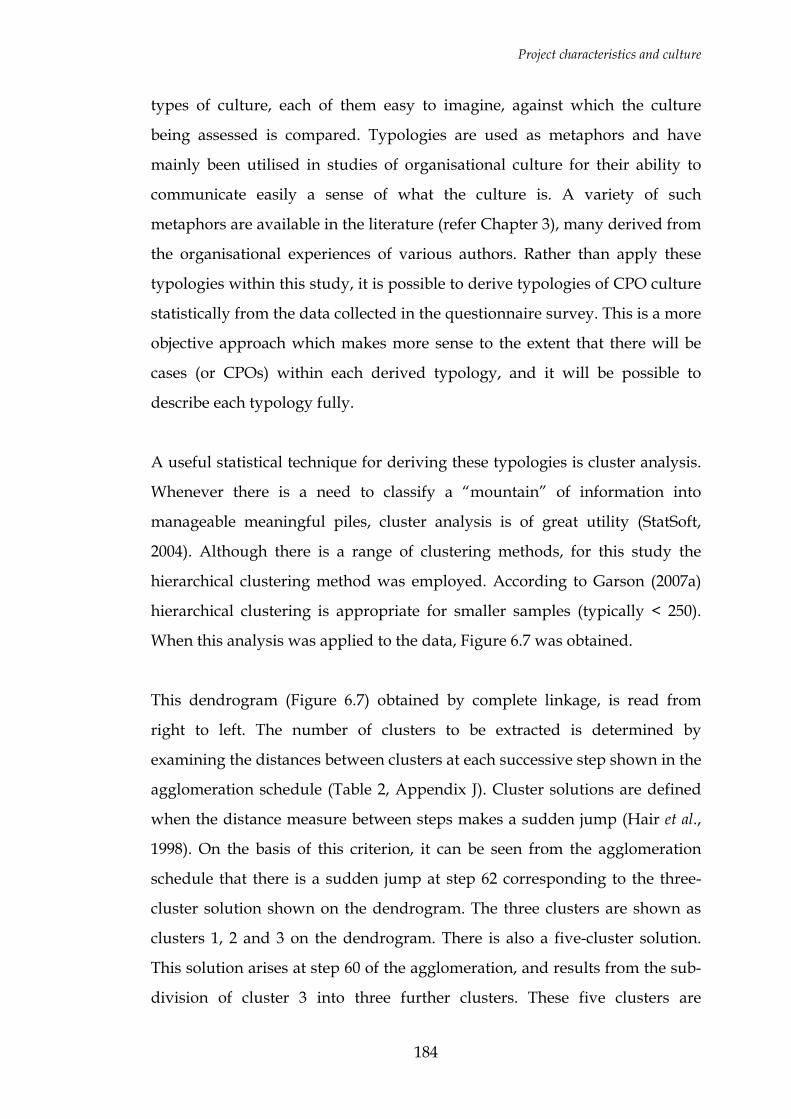
Project characteristics and culture
184
types of culture, each of them easy to imagine, against which the culture
being assessed is compared. Typologies are used as metaphors and have
mainly been utilised in studies of organisational culture for their ability to
communicate easily a sense of what the culture is. A variety of such
metaphors are available in the literature (refer Chapter 3), many derived from
the organisational experiences of various authors. Rather than apply these
typologies within this study, it is possible to derive typologies of CPO culture
statistically from the data collected in the questionnaire survey. This is a more
objective approach which makes more sense to the extent that there will be
cases (or CPOs) within each derived typology, and it will be possible to
describe each typology fully.
A useful statistical technique for deriving these typologies is cluster analysis.
Whenever there is a need to classify a “mountain” of information into
manageable meaningful piles, cluster analysis is of great utility (StatSoft,
2004). Although there is a range of clustering methods, for this study the
hierarchical clustering method was employed. According to Garson (2007a)
hierarchical clustering is appropriate for smaller samples (typically < 250).
When this analysis was applied to the data, Figure 6.7 was obtained.
This dendrogram (Figure 6.7) obtained by complete linkage, is read from
right to left. The number of clusters to be extracted is determined by
examining the distances between clusters at each successive step shown in the
agglomeration schedule (Table 2, Appendix J). Cluster solutions are defined
when the distance measure between steps makes a sudden jump (Hair et al.,
1998). On the basis of this criterion, it can be seen from the agglomeration
schedule that there is a sudden jump at step 62 corresponding to the three-
cluster solution shown on the dendrogram. The three clusters are shown as
clusters 1, 2 and 3 on the dendrogram. There is also a five-cluster solution.
This solution arises at step 60 of the agglomeration, and results from the sub-
division of cluster 3 into three further clusters. These five clusters are

Project characteristics and culture
185
indicated on Figure 6.7 as clusters A, B, C, D and E. Indeed clusters A, D and
E can each be further sub-divided into two, giving rise to an eight-cluster
solution shown on Figure 6.7 as clusters π, ρ, θ, λ, ξ, µ, σ and ω. However, for
the purposes of this research, the five-cluster solution was accepted.
Figure 6.7 Dendrogram of cultural typologies using complete linkage
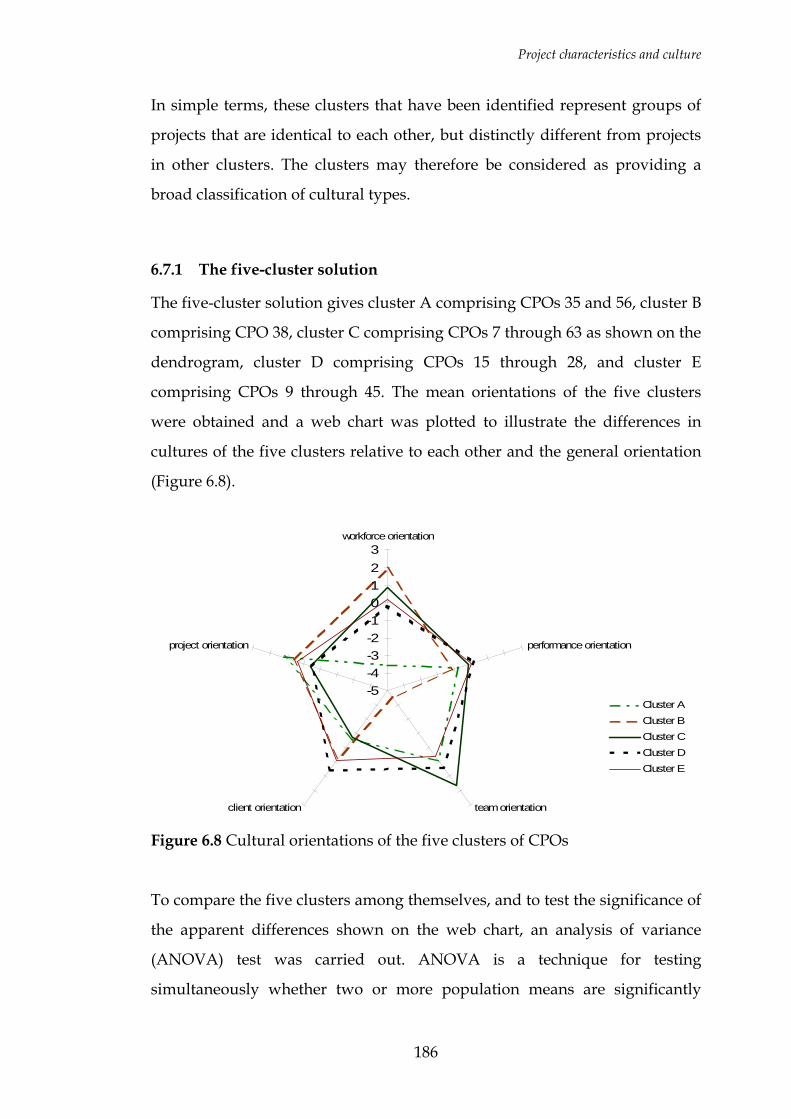
Project characteristics and culture
186
In simple terms, these clusters that have been identified represent groups of
projects that are identical to each other, but distinctly different from projects
in other clusters. The clusters may therefore be considered as providing a
broad classification of cultural types.
6.7.1 The five-cluster solution
The five-cluster solution gives cluster A comprising CPOs 35 and 56, cluster B
comprising CPO 38, cluster C comprising CPOs 7 through 63 as shown on the
dendrogram, cluster D comprising CPOs 15 through 28, and cluster E
comprising CPOs 9 through 45. The mean orientations of the five clusters
were obtained and a web chart was plotted to illustrate the differences in
cultures of the five clusters relative to each other and the general orientation
(Figure 6.8).
-5-4-3-2-10123
workforce orientation
performance orientation
team orientationclient orientation
project orientation
Cluster ACluster BCluster CCluster DCluster E
Figure 6.8 Cultural orientations of the five clusters of CPOs
To compare the five clusters among themselves, and to test the significance of
the apparent differences shown on the web chart, an analysis of variance
(ANOVA) test was carried out. ANOVA is a technique for testing
simultaneously whether two or more population means are significantly
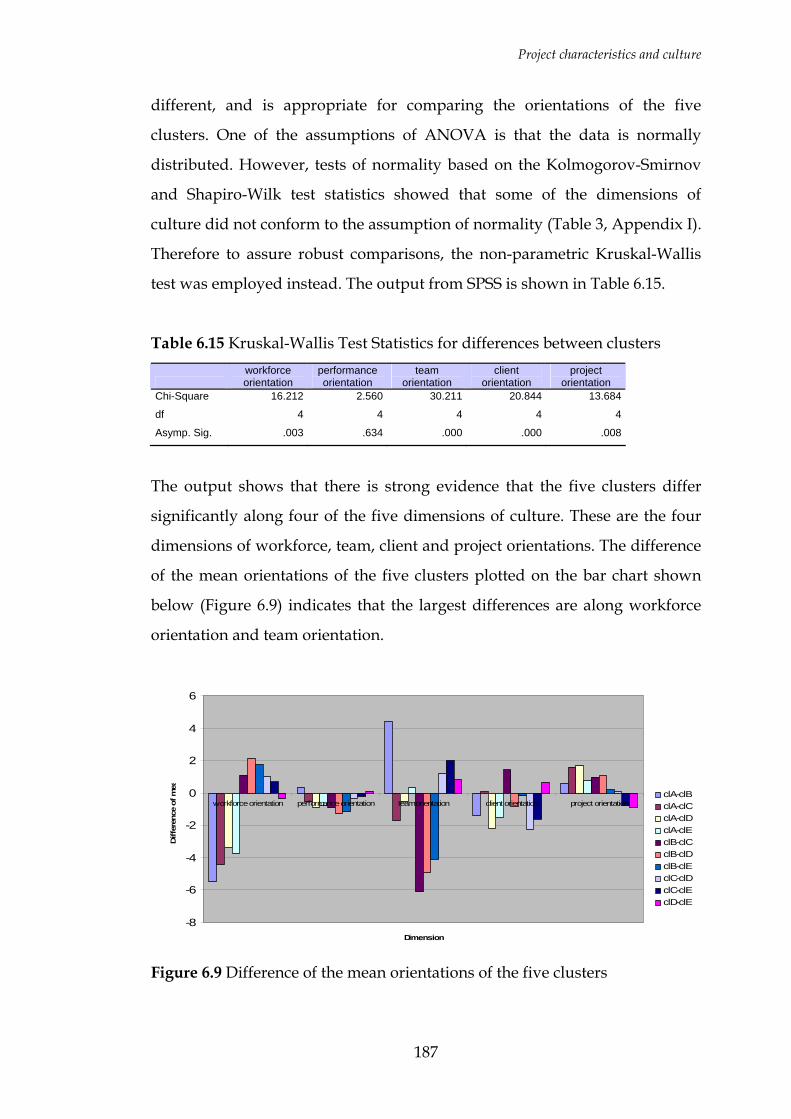
Project characteristics and culture
187
different, and is appropriate for comparing the orientations of the five
clusters. One of the assumptions of ANOVA is that the data is normally
distributed. However, tests of normality based on the Kolmogorov-Smirnov
and Shapiro-Wilk test statistics showed that some of the dimensions of
culture did not conform to the assumption of normality (Table 3, Appendix I).
Therefore to assure robust comparisons, the non-parametric Kruskal-Wallis
test was employed instead. The output from SPSS is shown in Table 6.15.
Table 6.15 Kruskal-Wallis Test Statistics for differences between clusters
workforce orientation
performance orientation
team orientation
client orientation
project orientation
Chi-Square 16.212 2.560 30.211 20.844 13.684
df 4 4 4 4 4
Asymp. Sig. .003 .634 .000 .000 .008
The output shows that there is strong evidence that the five clusters differ
significantly along four of the five dimensions of culture. These are the four
dimensions of workforce, team, client and project orientations. The difference
of the mean orientations of the five clusters plotted on the bar chart shown
below (Figure 6.9) indicates that the largest differences are along workforce
orientation and team orientation.
-8
-6
-4
-2
0
2
4
6
workforce orientation performance orientation team orientation client orientation project orientation
Dimension
Diff
eren
ce o
f mea
clA-clBclA-clCclA-clDclA-clEclB-clCclB-clDclB-clEclC-clDclC-clEclD-clE
Figure 6.9 Difference of the mean orientations of the five clusters
Project characteristics and culture
188
6.7.2 Profiles of the clusters
Cultural profiles of the five clusters identified through the cluster analysis are
discussed below.
6.7.2.1 Profile of cluster A
Relative to the other clusters, cluster A has the lowest workforce orientation,
but it has the highest project orientation. This suggests that relatively, CPOs
within this cluster do not put as much emphasis and effort into motivating
the workforce, teamwork, maintaining free and open communication on site,
site tidiness, recognising good performance, keeping operatives informed of
project developments, and workforce involvement in planning and decision-
making. These CPOs however demonstrate the greatest sense of identification
with the project, use of direct labour and emphasis on waste elimination. This
cluster also has a relatively low client orientation.
6.7.2.2 Profile of cluster B
Relative to the others, cluster B has the highest workforce orientation but
lowest team orientation. This implies that CPOs in this cluster put the
greatest emphasis and effort into motivating the workforce, maintaining free
and open communication on site, site tidiness, recognising good performance,
keeping operatives informed of project developments, and workforce
involvement in planning and decision-making. These CPOs however also
exhibit much more finger-pointing, less accessible and approachable
management, less information sharing, and a lower degree of trust.
6.7.2.3 Profile of cluster C
Cluster C has the highest team orientation, but also has the lowest client
orientation. This implies that relatively, CPOs in this cluster put the greatest
emphasis and effort into avoiding finger-pointing, more accessible and
approachable management, more information sharing, and promoting a
higher degree of trust among participants. These CPOs however also put the
least effort into educating the client, monitoring client satisfaction, giving
Project characteristics and culture
189
precedence to the client’s needs, maintaining contact and communication
with the client. These CPOs also have a high workforce orientation.
6.7.2.4 Profile of cluster D
Cluster D has the highest client orientation. Together with cluster C this
cluster has the lowest project orientation. This suggests that CPOs within this
cluster put the most emphasis and effort into educating the client, monitoring
client satisfaction, giving precedence to the client’s needs, maintaining contact
and communication with the client. These CPOs however also have the
lowest sense of identification with the project, use of direct labour and
emphasis on waste elimination.
6.7.2.5 Profile of cluster E
Relative to the other clusters, Cluster E has a cultural profile that practically
coincides with the average orientation along the dimensions of culture
assessed. CPOs in cluster E therefore have a culture that is neither higher than
average or lower. These CPOs constitute the largest proportion of projects.
These five clusters provide a broad classification of cultural types, and
provide evidence that there are indeed significant differences in the cultures
of CPOs. This implies that the hypothesis H1 which proposed that there are
significant differences in the cultures of CPOs working on different
construction projects in the UK is supported by the empirical evidence.
6.7.3 Implications for project management and performance
It is widely recognised that workforce orientation is necessary for goal
commitment, organisational effectiveness and participant satisfaction (Leung
et al., 2004; Mullins, 2005), and that key aspects of workforce orientation
including a climate of openness and encouragement of employees are factors
that support learning (Kululanga et al., 2001). This suggests that CPOs with a
high workforce orientation such as those in cluster B are more likely to
Project characteristics and culture
190
achieve positive outcomes in terms of learning, goal commitment,
effectiveness and participant satisfaction, whilst those in cluster A are more
likely to find these outcomes harder to achieve.
Because of the fragmented nature of construction, a high team orientation
with better integration, cooperation and coordination has been identified as a
prerequisite for project success (Cicmil and Marshall, 2005). It leads to an
environment where there is trust, open communication and free exchange of
information (Baiden et al., 2006). It reduces the propensity for litigation (Fenn
et al., 1997) with obvious implications for satisfaction. This implies that CPOs
with a high team orientation such as those in cluster C are more likely to
experience positive outcomes in terms of ‘project chemistry’, litigation and
participant satisfaction. It is also widely recognised that customer-focus is a
precursor to success, and as a result, it has been argued that contractor
organisations must be customer-focused (Bryde and Robinson, 2005). In
Dainty et al.’s (2005) study on competencies of project managers (PMs), high
performing managers were found to show a marked propensity for seeking
information about the real underlying needs of clients, and for dealing with
customer service problems rapidly and efficiently. This implies that unlike
cluster C, CPOs with a high client orientation such as those in cluster D are
more likely to achieve positive outcomes in terms of client satisfaction and
PMs performance.
Higher project orientation implies that project participants identify more with
the project, there is less subcontracting, and more effort is put into waste
elimination. It has been noted in Hsieh (1998) for instance that there is a
tendency for subcontracting to divide the CPO into “islands” with conflicting
interests. It has also been noted ibid that subcontracting practices are inimical
to waste elimination and improved productivity, and that subcontractors are
notorious for poor housekeeping. These aspects if not properly attended to,
can increase ‘opportunities’ for accidents and therefore have negative

Project characteristics and culture
191
consequences on H&S on site (Sawacha et al., 1999), leading to de-motivation
and consequently absenteeism. This implies that unlike clusters C and D,
CPOs with a high project orientation (cluster A) are more likely to achieve
positive outcomes in respect of waste reduction, productivity and H&S.
These inferences drawn from the literature though speculative, demonstrate
the potential positive and negative impacts of having one or other cultural
profile, and provide interesting hypotheses that can be examined in the
subsequent analyses. Clearly, each typology has cultural orientations that
potentially have both positive and negative consequences associated with
them. Whilst there is no right or wrong cultural typology, it is important to be
aware of the potentially negative orientations so that steps can be taken to
mitigate their impacts on project delivery and performance.
6.8 PROJECT-DEPENDENT FACTORS AND THE CULTURE OF CPOs
It was argued in Chapters 4 and 5 that various factors such as leadership,
people, project characteristics, procurement and other project arrangements,
prioritisation of goals and objectives, and location potentially have a bearing
on the culture that develops within a construction project organisation (CPO).
Some of these factors thus formed the basis of the contextual information that
was collected in the questionnaire survey. It was argued in Ankrah et al.
(2005b) that such information will be useful in testing for significant
differences in the various cultural orientations found. Some of the hypotheses
that were put forward ibid to help with the testing were that:
P1: There are no differences in the cultures of CPOs regardless of
their composition.
P2: There are no differences in the cultures of CPOs irrespective of
the characteristics of the projects on which they are engaged.
Project characteristics and culture
192
P3: There are no differences in the cultures of CPOs irrespective of
who dominates and drives the project.
P4: There are no differences in the cultures of CPOs regardless of the
method of procurement employed.
P5: There are no differences in the cultures of CPOs irrespective of
the prioritisation of goals and objectives.
P6: There are no differences in the cultures of CPOs irrespective of
where the project is located.
Whilst the data collected did not permit the testing of all these propositions,
some of them were put to the test using the Kruskal-Wallis and Mann-
Whitney tests where the variables involved were nominal, and Spearman’s
correlation where the variables involved were ordinal or scale. Each of the
five dimensions of culture was tested and the results are presented in
Appendix K. Some of the inferences drawn from these results are discussed.
6.8.1 The effect of project characteristics
There was no evidence from the data collected to suggest that the type of
client or nature of the project has an effect on the cultural orientation of the
CPO. Regardless of whether the project was public or private, new work or
repair and maintenance, building or civil engineering, or housing or non-
housing, there was no evidence that any of the cultural orientations is
different, and therefore no evidence of an effect of project type on culture
(refer to Tables 1, 2 and 3, Appendix K).
Project scale as measured by the contract sum showed significant correlation
with the performance orientation of the CPO (ρ = 0.288, p = 0.021). The
correlation itself was positive indicating that the higher the contract sum the
higher the performance orientation. This finding is reinforced by the
correlation between another measure of project scale, in this case the average
number of workers on site, and performance orientation (ρ = 0.255, p = 0.042).
Project characteristics and culture
193
Another project characteristic, complexity, was also found to be significantly
correlated with team orientation (ρ = -0.281, p = 0.025), as well as client
orientation (ρ = 0.299, p = 0.017). This implies that the more complex a project
is, the higher the client orientation but the lower the team orientation.
6.8.2 The effect of dominant participants
For each project, the most dominant participant was identified from the data
on levels of influence. A test for differences in cultural orientation for the
different dominant groups was then conducted. No significant differences
were found as shown in Table 1 (Appendix K). However, the correlation
matrix (Table 3, Appendix K) revealed significant association between the
level of influence of the quantity surveyor (QS) and performance orientation
(ρ = 0.336, p = 0.011), between the level of influence of the client and
workforce orientation (ρ = 0.381, p = 0.003), and between the level of main
contractor influence and project orientation (ρ = -0.293, p = 0.030). These
results suggest that as the quantity surveyor becomes more influential, the
performance orientation within the CPO increases; as the client becomes
more influential, workforce orientation increases; and as the main contractor
becomes more influential, the project orientation of participants suffers.
6.8.3 The effect of procurement
As can be seen from Table 2 (Appendix K), there was no evidence in the data
collected to suggest that the type of procurement employed had a significant
effect on the type of culture within the CPO. In other words it appears to
suggest that the culture within the project organisation (at least in respect of
the workforce, performance, team, client and project orientations) is not
significantly changed by the procurement route employed. This finding is
somewhat surprising as it is widely believed that some procurement routes
like partnering lead to greater orientation on such aspects as performance,

Project characteristics and culture
194
team and client focus. Indeed this belief was recounted by one of the
interviewees in the qualitative phase who even intimated that they;
“move people around to meet that client or contractual arrangement”
because “if you use that contract, you get these behaviours. If you use this
contract, you get these behaviours,” and “…we can't have people that are
used to partnering...and are looking at success and how to make the job
successful, in an environment where you've got a client who actually wants
us to go out of business”
It can be inferred from the results that it should not be taken for granted that
adopting partnering for instance as a procurement framework would
automatically result in a different cultural orientation. Participants need to
work at changing the culture through training and development in aspects
such as teamwork (Nicolini, 2002).
6.8.4 The effect of project objectives
For each project, the topmost priority was identified from the data on the
priority of cost, time, quality and H&S. The Kruskal-Wallis test revealed no
evidence of significant differences in cultural orientation regardless of what
the topmost priority was. However, the correlation matrix revealed
significant association between the level of importance of cost and the level of
workforce orientation (ρ = 0.266, p = 0.034). Recalling the fact that on the
ordinal scale of project priorities, higher values reflect lower importance, this
finding indicates that as cost becomes more important the workforce
orientation suffers. The correlation matrix also revealed significant
association between the level of importance of H&S and the performance
orientation (ρ = -0.295, p = 0.018) and the team orientation (ρ = -0.299, p =
0.016). In other words, as H&S becomes more important performance
orientation and team orientation both improve.

Project characteristics and culture
195
6.8.5 The effect of location
The results from the analysis showed significant evidence of differences in
project orientation with location of the project regionally (χ2 = 20.000, p =
0.045). None of the other cultural orientations showed evidence of differences
with the project location. To help interpret these results, Figure 6.10 was
produced showing mean project orientations for the various regions. Very
crudely, it appears there is a north-south divide with projects to the north of
the UK generally having a lower project orientation than projects in the south,
the exceptions being the North-East and the South-West.
N.Ireland
ScotlandNorthWest
NorthEast
Yorks &Humber
E. AngliaE.Midlands
W.Midlands
WalesSouthWest
SouthEast
G.London
Proj_loc
1.00000
0.50000
0.00000
-0.50000
Mea
n pr
ojec
t orie
ntat
ion
Figure 6.10 Mean project orientation for the different UK regions
6.8.6 The effect of other factors
Beyond the contextual factors discussed above, the analysis also examined
the effects of having previously worked with the client, the involvement in
design, and the number of design variations. From the Mann-Whitney
statistics shown in Table 1 (Appendix K), there was inadequate evidence to
suggest that previous work with the client or involvement in design had any
effect on the cultural orientations.
Project characteristics and culture
196
The correlation matrix (Table 3, Appendix K) however revealed a significant
correlation between the number of design variations and the team orientation
(ρ = -0.259, p = 0.039). The negative correlation indicates that an increase in
number of design variations is associated with a decline in team orientation.
6.8.7 Discussion of the effects of project-dependent factors
It is clear from the results that some of the contextual factors do have a
significant association with the cultural outcomes, in particular, project size,
complexity, the influence of participants like the quantity surveyor, client and
the main contractor, the level of importance of cost and H&S, location, and
the number of design variations.
Project size, as reflected in the contract sum and the number of workers on
site was found to be positively associated with performance orientation. As
projects grow in size, the project organisation becomes more performance
oriented. This is logical as performance orientation deals with the effort to
protect people on site, providing all participants with performance feedback
so that continuous improvement can be achieved, the emphasis placed on
schedule delivery, and the effort put into achieving quality delivery and
getting it right first time. The bigger the project, the bigger the likely cost of
getting any of these aspects wrong and hence the greater the attention
required to ensure that things do not go wrong. This is consistent with the
finding that there is greater emphasis on cost on the bigger projects.
Moreover, as can be seen from Figure 6.11 the larger projects also coincide
with the publicly funded projects where public accountability is required.
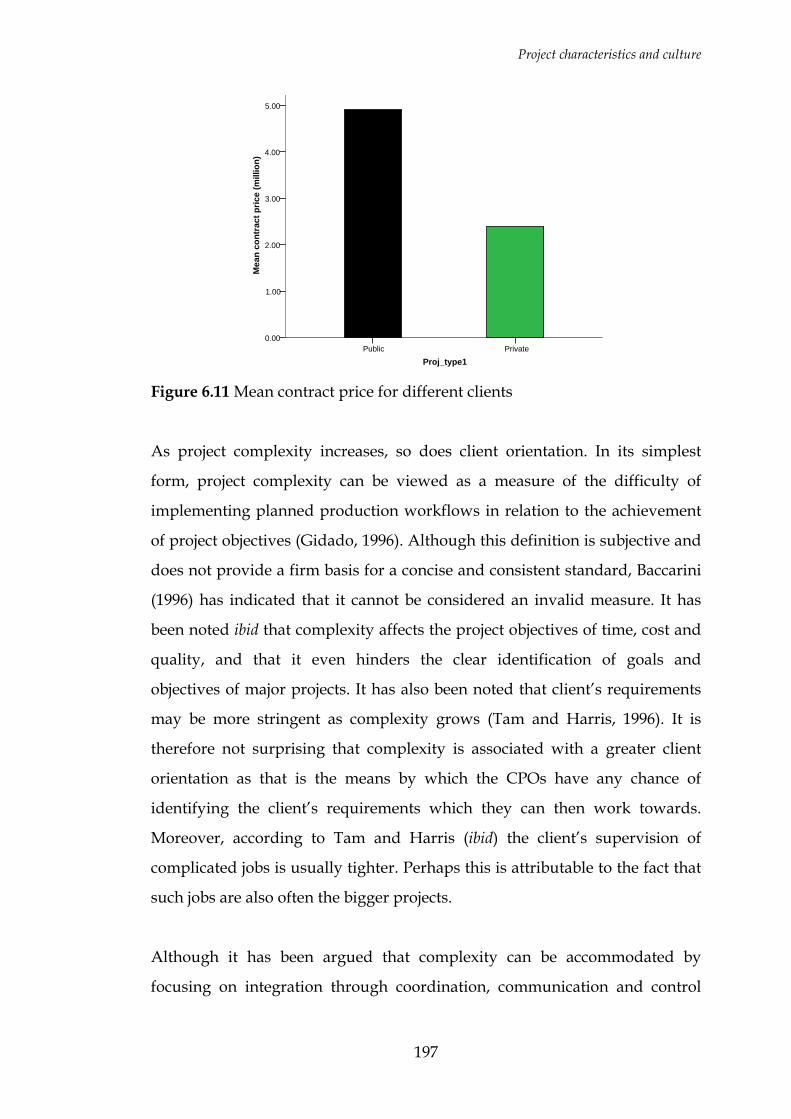
Project characteristics and culture
197
PrivatePublic
Proj_type1
5.00
4.00
3.00
2.00
1.00
0.00
Mea
n co
ntra
ct p
rice
(mill
ion)
Figure 6.11 Mean contract price for different clients
As project complexity increases, so does client orientation. In its simplest
form, project complexity can be viewed as a measure of the difficulty of
implementing planned production workflows in relation to the achievement
of project objectives (Gidado, 1996). Although this definition is subjective and
does not provide a firm basis for a concise and consistent standard, Baccarini
(1996) has indicated that it cannot be considered an invalid measure. It has
been noted ibid that complexity affects the project objectives of time, cost and
quality, and that it even hinders the clear identification of goals and
objectives of major projects. It has also been noted that client’s requirements
may be more stringent as complexity grows (Tam and Harris, 1996). It is
therefore not surprising that complexity is associated with a greater client
orientation as that is the means by which the CPOs have any chance of
identifying the client’s requirements which they can then work towards.
Moreover, according to Tam and Harris (ibid) the client’s supervision of
complicated jobs is usually tighter. Perhaps this is attributable to the fact that
such jobs are also often the bigger projects.
Although it has been argued that complexity can be accommodated by
focusing on integration through coordination, communication and control
Project characteristics and culture
198
(Baccarini, 1996), a view supported by findings from the interviews in which
an interviewee remarked that “the more complex they are the more people have to
get their heads together to solve the complexity”, it was also found in this study
that increasing complexity is associated with lower team orientation. This
implies that the issues of integrating the project organisation and the tasks are
not being addressed adequately for such projects. Perhaps it is also a
reflection of the challenges associated with complex projects where mistakes
and their attendant conflicts and disputes are more likely to be common.
The data also revealed that as QS’s become more influential on projects, the
CPO becomes more performance oriented. The role of the QS is to provide
inter alia a cost management service (Seeley, 1997; Burnside and Westcott,
1999). This role becomes more important as the contract sum increases. It is
therefore not surprising that an increase in the importance of the QS’s role
coincides with greater performance orientation.
Similarly as the client becomes more influential, workforce orientation
increases. Workforce orientation is fundamentally about getting the best out
of people by developing a culture that makes it easy for everyone to
contribute to successfully delivering projects to the benefit of all involved
(Constructing Excellence, 2004). As the ultimate beneficiary of any workforce
orientation that prevails on a construction project, it is logical to see
workforce orientation grow with an increase in the influence of the client. As
the main contractor becomes more influential, project orientation suffers. This
finding though somewhat surprising, can be related to Hsieh’s (1998) point
about the development of “islands” or self-centred decision-making units
within the CPO each looking out for their own interests. This is a hypothesis
that requires further investigation.
Another significant finding from the data is that as cost becomes more
important as a project objective, the workforce orientation suffers. This
Project characteristics and culture
199
finding reflects the traditional nature of the construction industry where cost
is the prime objective (Xiao, 2002) and workforce orientation is
characteristically poor as noted by Egan (1998). Alternatively, as the H&S
objective becomes more important to the CPO, performance orientation and
team orientation both improve.
The number of design variations was found to be significantly and negatively
associated with team orientation. As highlighted in Chapter 2, variations may
often result in delays and reworking with their attendant costs and
programme disruption, as well as reduced labour productivity (Sutrisna and
Potts, 2002; Hanna et al., 2002; Moselhi et al., 2005). Moreover, their valuation
leads to conflicts and disputes between project participants (Hanna et al.,
2002). The finding from the data thus provides empirical evidence of the
deterioration in team orientation that can be associated with variations.
With regard to location, there appears to be a crude north-south divide with
projects to the north of the UK generally having a lower project orientation
than projects in the south, the exceptions being the North-East and the South-
West. From the definition of project orientation, this implies that there is less
identification with the project, more subcontracting, and less emphasis on
waste elimination on projects to the north than projects to the south.
Perhaps one of the most significant findings is the lack of evidence to support
the fact that different procurement routes result in different cultural
orientations. It has been argued that procurement routes like partnering are
associated with a spirit of collaboration, open interaction, trust, commitment,
mutual advantage, learning, innovation and productivity (Cook and
Hancher, 1990; Crowley and Karim, 1995; Drexler and Larson 2000; Naoum,
2003), in contrast to the traditional culture of antagonism, conflict and
disputes. The expectation therefore was that the results would provide some
evidence of differences in cultural orientation for different procurement

Project characteristics and culture
200
routes. The lack of evidence in this respect gives credence to the suggestion
that although partnering contracts are being adopted, the real cultural change
it heralds is not embraced (Sullivan, 2006).
6.9 SUMMARY
In this chapter, descriptive statistics, chi-square tests and Freidman’s test
were utilised to provide a picture of the projects captured in the
questionnaire survey. Factor analysis and cluster analysis were also utilised
alongside the descriptive statistics to analyse the cultural orientations of the
CPOs. Then the Mann-Whitney test, Kruskal-Wallis test, and non-parametric
correlation analysis were employed to explore and draw inferences about the
relationships between project features and the cultural orientations of CPOs.
The results indicate that the sample is generally reflective of construction
projects in the UK. Projects of all kinds, reflecting the range of projects that
contractors undertake from simple jobbing projects to very complex mega
projects, and procured under different arrangements in all the different
regions of the UK are represented in the sample. The Main Contractor was
reported as the most influential participant overall. Of great significance was
the fact that overall, the performance ethos of CPOs was found to be in the
order H&S–quality–cost–time with H&S as the most important and time as
the least important. It is argued that this suggests a shift in priorities from
what obtains traditionally where cost is considered as the most important
objective. Analysis of relationships between these project features revealed
strong positive associations between contract price, project duration, average
number of workers on site, actual out-turn cost and the actual duration,
which are all measures of project size. The ‘bigger’ the project, the more
complex it is likely to be and the greater the number of design variations that
are likely to occur. It was also found that the bigger projects are the public
Project characteristics and culture
201
sector new work projects within the civil engineering category. Such projects
are associated with greater influence of the civil engineer and the QS.
Significantly the bigger a project gets, the greater the priority on cost but the
lower the emphasis on quality and on H&S.
The application of factor analysis to the dimensions of culture led to the
extraction of five principal dimensions of workforce, performance, team,
client and project orientation. Based on these five dimensions, it was found
that the CPOs can be grouped into five clusters which are significantly
different along workforce, team, client and project orientations. This provides
confirmation that CPOs do indeed have different cultures. Analyses carried
out to assess the differences in cultural orientations associated with the
differences in project features revealed evidence that some of the project
features are significantly associated with the cultural outcomes. In particular,
project size, complexity, the influence of participants like the quantity
surveyor, client and the main contractor, the level of importance of cost and
H&S, location, and the number of design variations showed evidence of
association with some of the dimensions of culture.
It is argued in this chapter that there is still some scope for strengthening the
orientations of the CPOs along all the five dimensions of culture. However
whether or not it is necessary to devote resources to any effort to improve
cultural orientations depends on research demonstrating that such
improvements will lead to better performance outcomes. As part of the
process of trying to demonstrate this, the following chapter presents the
analysis of performance outcomes of the projects surveyed.

202
CHAPTER 7: PROJECT PERFORMANCE OUTCOMES
7.0 INTRODUCTION
In order to evaluate the impact of cultural orientations on project
performance outcomes, it is necessary to assess the performance of
construction projects in the UK, where performance is the degree to which the
project objectives are achieved. The performance of the construction project
was assessed on the basis of the various outcomes pursued by stakeholders
including inter alia cost, time, quality, health and safety, disputes, and
productivity outcomes. Discussions on these various outcomes are presented
in this chapter. The chapter thus addresses the second part of the fifth
objective of this research which was to assess project organisations, through a
UK-wide questionnaire survey, and to establish their levels of performance. It
also attempts to address the second of the three research hypotheses which
posits that there are significant differences in the performance levels of
different projects across the UK.
7.1 STATISTICAL PROCEDURES AND ANALYSES
Here also a variety of statistical procedures were employed in the analyses of
the data starting with basic descriptive statistics to the more complex
procedures like factor analysis. The descriptive statistics encompassed
frequency distributions, measures of central tendency such as means,
medians and modes, and measures of dispersion such as the standard
deviation. These were employed to provide summary descriptions of the
performance levels of the projects.
Project performance
203
In some cases where there were two sets of scores to compare from the same
subjects (e.g. project contract sum and actual cost), the Wilcoxon signed-rank
test was applied as specified in Field (2000). The Wilcoxon signed-rank test is
a nonparametric test for two related samples that allows testing for
differences between paired scores when the assumptions required by the
paired-samples t test are not met (SPSS, 2004). The Wilcoxon signed-ranks
method tests the null hypothesis that two related medians are the same. This
test thus allows the comparison of a single median against a known value or
paired medians from the same (or matched) sample (SPSS, 2004).
As in the preceding chapter, tests of correlation were carried out to assess the
existence of relationships between the performance measures. In this case also
as some of the data to be tested was ordinal, the non-parametric Spearman’s
correlation coefficient was calculated.
Factor analysis was then carried out to examine the underlying structure or
the structure of interrelationships (or correlations) among the performance
variables. This analysis yields a set of factors or underlying variables which,
when interpreted and understood, describe the data in a parsimonious but
more meaningful number of concepts than the original individual variables
(Hair et al., 1998). Here also because of the data reduction intention, principal
components analysis was used for the extraction of factors. The extracted
components were used to compute new variables for subsequent analysis.
Finally, the nonparametric statistical tests of Kruskal-Wallis and Mann-
Whitney were used to test for the significance of the differences between the
mean ranks of the performance variables for different projects (i.e. whether or
not the values of a particular performance variable differ between two or
more groups).

Project performance
204
7.2 AN EVALUATION OF PERFORMANCE OUTCOMES
In order to obtain an overall picture of the levels of performance of the
construction projects captured in the survey, various performance measures
were assessed in line with Table 5.2 (refer Chapter 5). Principal among these
measures were cost, time, quality, H&S, service, productivity, operative
satisfaction, collaborative working, learning, innovation, profitability, and the
level of repeat business. These measures were evaluated individually, and the
findings are outlined below.
7.2.1 Cost performance (CP)
Cost performance was assessed using a number of measures. Respondents
were asked to provide the contract sum as well as the final out-turn cost
(ascertained final account). As a first step, it was considered necessary to
check for a significant difference between the two variables. The Wilcoxon
Signed-Rank test was used. This test was appropriate as there were two sets
of data from the same respondents to compare. Tables 7.1 and 7.2 are the
outputs obtained from SPSS.
Table 7.1 A comparison of actual cost and contract sum N Mean Rank Sum of Ranks
Act_cost - Contract price (million) Negative Ranks 9a 30.78 277.00
Positive Ranks 37b 21.73 804.00
Ties 18c
Total 64
a Act_cost < Contract price (million) b Act_cost > Contract price (million) c Act_cost = Contract price (million)
Table 7.2 Wilcoxon Signed Ranks Test Act_cost - Contract price (million)
Z -2.879a
Asymp. Sig. (2-tailed) .004
a Based on negative ranks.
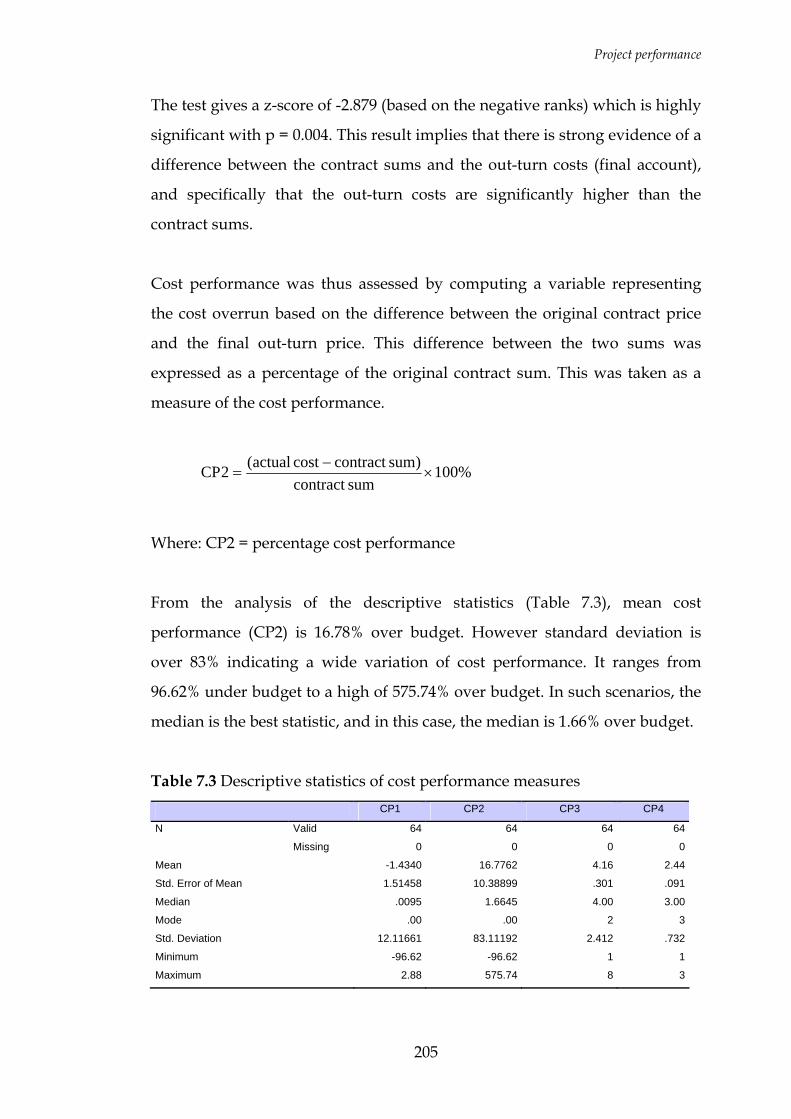
Project performance
205
The test gives a z-score of -2.879 (based on the negative ranks) which is highly
significant with p = 0.004. This result implies that there is strong evidence of a
difference between the contract sums and the out-turn costs (final account),
and specifically that the out-turn costs are significantly higher than the
contract sums.
Cost performance was thus assessed by computing a variable representing
the cost overrun based on the difference between the original contract price
and the final out-turn price. This difference between the two sums was
expressed as a percentage of the original contract sum. This was taken as a
measure of the cost performance.
%100sumcontract
)sumcontract cost actual(2CP ×−
=
Where: CP2 = percentage cost performance
From the analysis of the descriptive statistics (Table 7.3), mean cost
performance (CP2) is 16.78% over budget. However standard deviation is
over 83% indicating a wide variation of cost performance. It ranges from
96.62% under budget to a high of 575.74% over budget. In such scenarios, the
median is the best statistic, and in this case, the median is 1.66% over budget.
Table 7.3 Descriptive statistics of cost performance measures CP1 CP2 CP3 CP4
N Valid 64 64 64 64
Missing 0 0 0 0
Mean -1.4340 16.7762 4.16 2.44
Std. Error of Mean 1.51458 10.38899 .301 .091
Median .0095 1.6645 4.00 3.00
Mode .00 .00 2 3
Std. Deviation 12.11661 83.11192 2.412 .732
Minimum -96.62 -96.62 1 1
Maximum 2.88 575.74 8 3
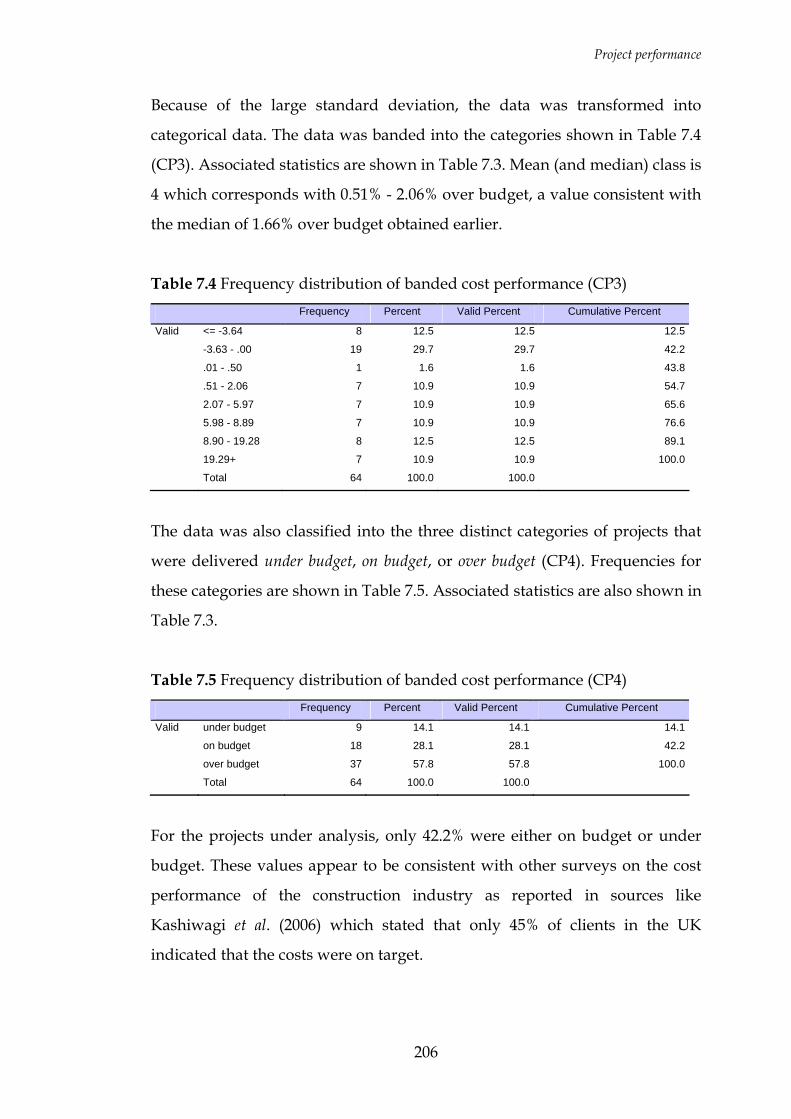
Project performance
206
Because of the large standard deviation, the data was transformed into
categorical data. The data was banded into the categories shown in Table 7.4
(CP3). Associated statistics are shown in Table 7.3. Mean (and median) class is
4 which corresponds with 0.51% - 2.06% over budget, a value consistent with
the median of 1.66% over budget obtained earlier.
Table 7.4 Frequency distribution of banded cost performance (CP3) Frequency Percent Valid Percent Cumulative Percent
Valid <= -3.64 8 12.5 12.5 12.5
-3.63 - .00 19 29.7 29.7 42.2
.01 - .50 1 1.6 1.6 43.8
.51 - 2.06 7 10.9 10.9 54.7
2.07 - 5.97 7 10.9 10.9 65.6
5.98 - 8.89 7 10.9 10.9 76.6
8.90 - 19.28 8 12.5 12.5 89.1
19.29+ 7 10.9 10.9 100.0
Total 64 100.0 100.0
The data was also classified into the three distinct categories of projects that
were delivered under budget, on budget, or over budget (CP4). Frequencies for
these categories are shown in Table 7.5. Associated statistics are also shown in
Table 7.3.
Table 7.5 Frequency distribution of banded cost performance (CP4) Frequency Percent Valid Percent Cumulative Percent
Valid under budget 9 14.1 14.1 14.1
on budget 18 28.1 28.1 42.2
over budget 37 57.8 57.8 100.0
Total 64 100.0 100.0
For the projects under analysis, only 42.2% were either on budget or under
budget. These values appear to be consistent with other surveys on the cost
performance of the construction industry as reported in sources like
Kashiwagi et al. (2006) which stated that only 45% of clients in the UK
indicated that the costs were on target.
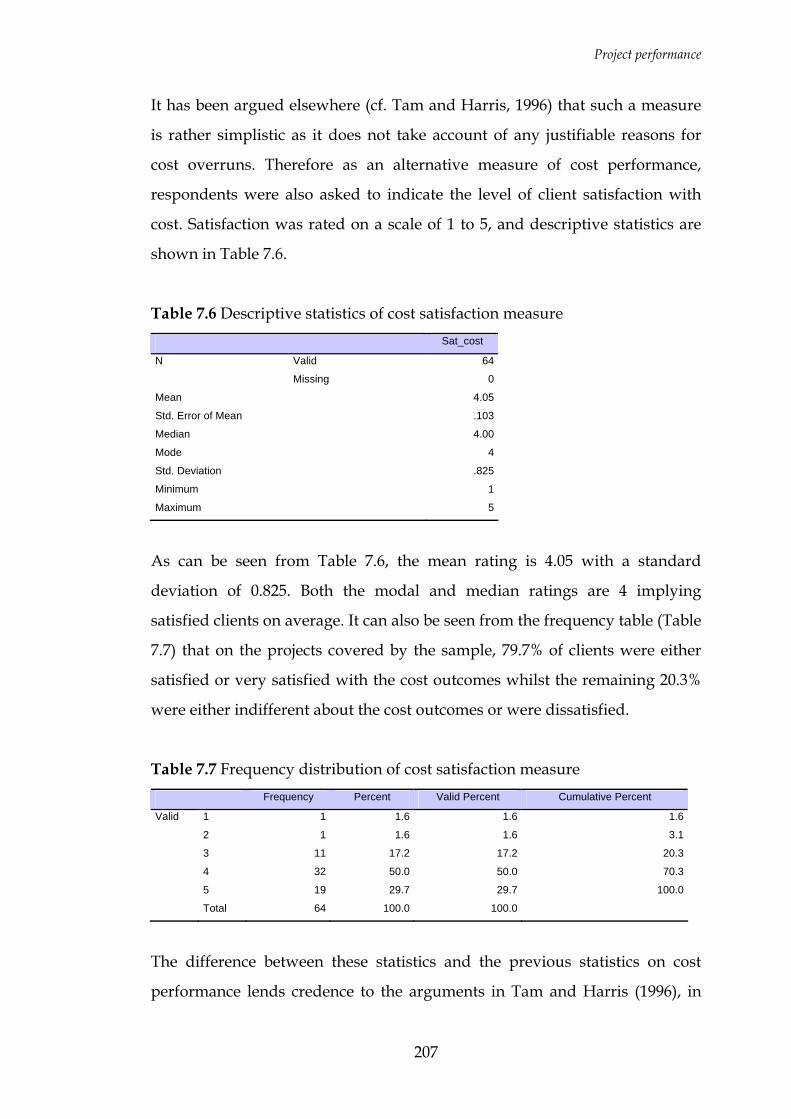
Project performance
207
It has been argued elsewhere (cf. Tam and Harris, 1996) that such a measure
is rather simplistic as it does not take account of any justifiable reasons for
cost overruns. Therefore as an alternative measure of cost performance,
respondents were also asked to indicate the level of client satisfaction with
cost. Satisfaction was rated on a scale of 1 to 5, and descriptive statistics are
shown in Table 7.6.
Table 7.6 Descriptive statistics of cost satisfaction measure Sat_cost
N Valid 64
Missing 0
Mean 4.05
Std. Error of Mean .103
Median 4.00
Mode 4
Std. Deviation .825
Minimum 1
Maximum 5
As can be seen from Table 7.6, the mean rating is 4.05 with a standard
deviation of 0.825. Both the modal and median ratings are 4 implying
satisfied clients on average. It can also be seen from the frequency table (Table
7.7) that on the projects covered by the sample, 79.7% of clients were either
satisfied or very satisfied with the cost outcomes whilst the remaining 20.3%
were either indifferent about the cost outcomes or were dissatisfied.
Table 7.7 Frequency distribution of cost satisfaction measure Frequency Percent Valid Percent Cumulative Percent
Valid 1 1 1.6 1.6 1.6
2 1 1.6 1.6 3.1
3 11 17.2 17.2 20.3
4 32 50.0 50.0 70.3
5 19 29.7 29.7 100.0
Total 64 100.0 100.0
The difference between these statistics and the previous statistics on cost
performance lends credence to the arguments in Tam and Harris (1996), in
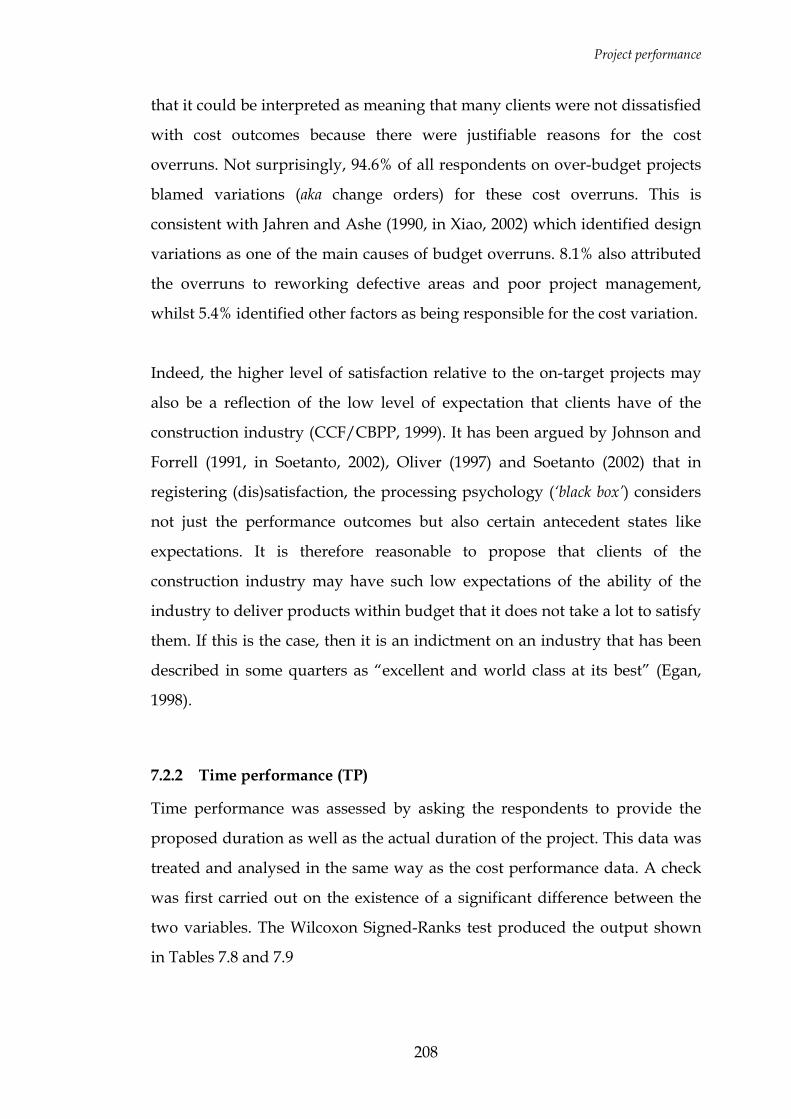
Project performance
208
that it could be interpreted as meaning that many clients were not dissatisfied
with cost outcomes because there were justifiable reasons for the cost
overruns. Not surprisingly, 94.6% of all respondents on over-budget projects
blamed variations (aka change orders) for these cost overruns. This is
consistent with Jahren and Ashe (1990, in Xiao, 2002) which identified design
variations as one of the main causes of budget overruns. 8.1% also attributed
the overruns to reworking defective areas and poor project management,
whilst 5.4% identified other factors as being responsible for the cost variation.
Indeed, the higher level of satisfaction relative to the on-target projects may
also be a reflection of the low level of expectation that clients have of the
construction industry (CCF/CBPP, 1999). It has been argued by Johnson and
Forrell (1991, in Soetanto, 2002), Oliver (1997) and Soetanto (2002) that in
registering (dis)satisfaction, the processing psychology (‘black box’) considers
not just the performance outcomes but also certain antecedent states like
expectations. It is therefore reasonable to propose that clients of the
construction industry may have such low expectations of the ability of the
industry to deliver products within budget that it does not take a lot to satisfy
them. If this is the case, then it is an indictment on an industry that has been
described in some quarters as “excellent and world class at its best” (Egan,
1998).
7.2.2 Time performance (TP)
Time performance was assessed by asking the respondents to provide the
proposed duration as well as the actual duration of the project. This data was
treated and analysed in the same way as the cost performance data. A check
was first carried out on the existence of a significant difference between the
two variables. The Wilcoxon Signed-Ranks test produced the output shown
in Tables 7.8 and 7.9
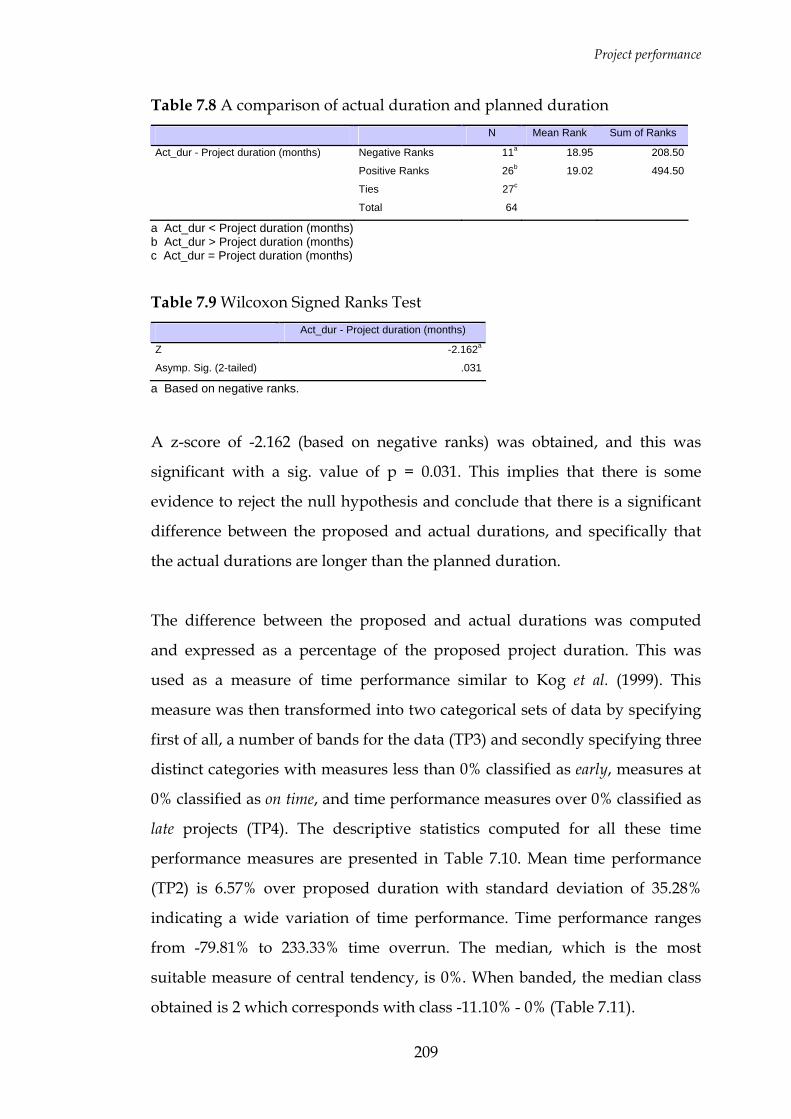
Project performance
209
Table 7.8 A comparison of actual duration and planned duration N Mean Rank Sum of Ranks
Act_dur - Project duration (months) Negative Ranks 11a 18.95 208.50
Positive Ranks 26b 19.02 494.50
Ties 27c
Total 64
a Act_dur < Project duration (months) b Act_dur > Project duration (months) c Act_dur = Project duration (months)
Table 7.9 Wilcoxon Signed Ranks Test Act_dur - Project duration (months)
Z -2.162a
Asymp. Sig. (2-tailed) .031
a Based on negative ranks.
A z-score of -2.162 (based on negative ranks) was obtained, and this was
significant with a sig. value of p = 0.031. This implies that there is some
evidence to reject the null hypothesis and conclude that there is a significant
difference between the proposed and actual durations, and specifically that
the actual durations are longer than the planned duration.
The difference between the proposed and actual durations was computed
and expressed as a percentage of the proposed project duration. This was
used as a measure of time performance similar to Kog et al. (1999). This
measure was then transformed into two categorical sets of data by specifying
first of all, a number of bands for the data (TP3) and secondly specifying three
distinct categories with measures less than 0% classified as early, measures at
0% classified as on time, and time performance measures over 0% classified as
late projects (TP4). The descriptive statistics computed for all these time
performance measures are presented in Table 7.10. Mean time performance
(TP2) is 6.57% over proposed duration with standard deviation of 35.28%
indicating a wide variation of time performance. Time performance ranges
from -79.81% to 233.33% time overrun. The median, which is the most
suitable measure of central tendency, is 0%. When banded, the median class
obtained is 2 which corresponds with class -11.10% - 0% (Table 7.11).
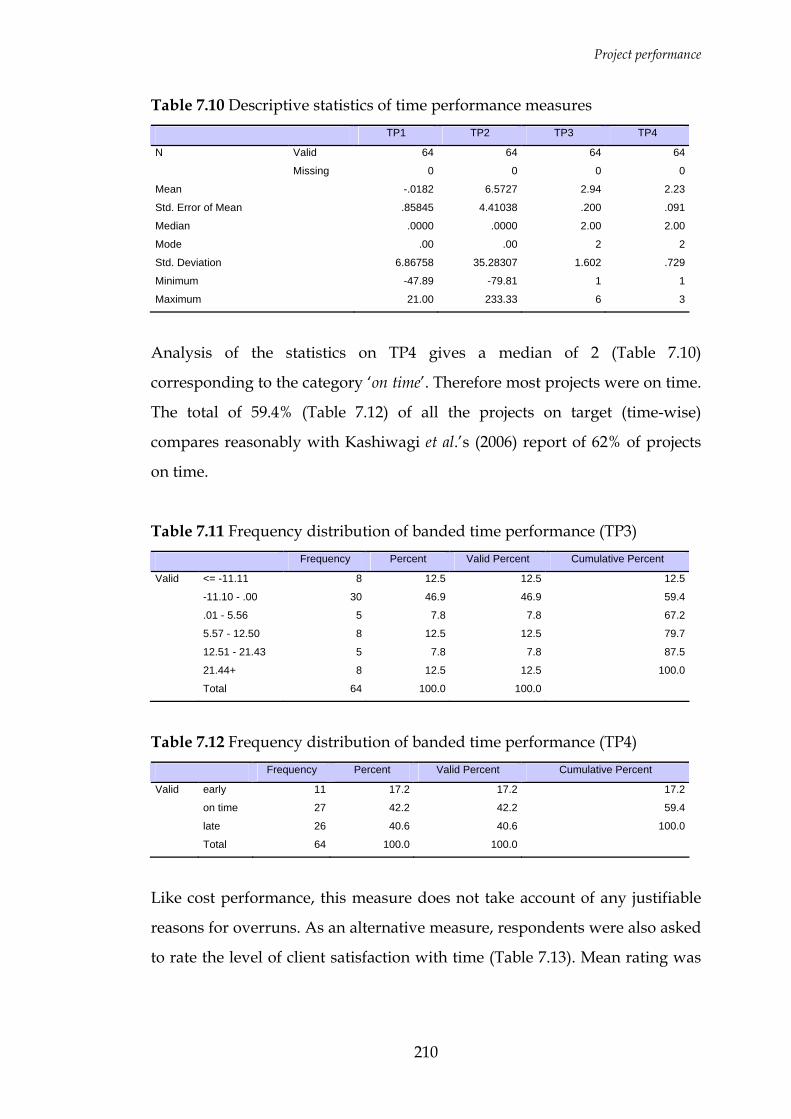
Project performance
210
Table 7.10 Descriptive statistics of time performance measures TP1 TP2 TP3 TP4
N Valid 64 64 64 64
Missing 0 0 0 0
Mean -.0182 6.5727 2.94 2.23
Std. Error of Mean .85845 4.41038 .200 .091
Median .0000 .0000 2.00 2.00
Mode .00 .00 2 2
Std. Deviation 6.86758 35.28307 1.602 .729
Minimum -47.89 -79.81 1 1
Maximum 21.00 233.33 6 3
Analysis of the statistics on TP4 gives a median of 2 (Table 7.10)
corresponding to the category ‘on time’. Therefore most projects were on time.
The total of 59.4% (Table 7.12) of all the projects on target (time-wise)
compares reasonably with Kashiwagi et al.’s (2006) report of 62% of projects
on time.
Table 7.11 Frequency distribution of banded time performance (TP3) Frequency Percent Valid Percent Cumulative Percent
Valid <= -11.11 8 12.5 12.5 12.5
-11.10 - .00 30 46.9 46.9 59.4
.01 - 5.56 5 7.8 7.8 67.2
5.57 - 12.50 8 12.5 12.5 79.7
12.51 - 21.43 5 7.8 7.8 87.5
21.44+ 8 12.5 12.5 100.0
Total 64 100.0 100.0
Table 7.12 Frequency distribution of banded time performance (TP4) Frequency Percent Valid Percent Cumulative Percent
Valid early 11 17.2 17.2 17.2
on time 27 42.2 42.2 59.4
late 26 40.6 40.6 100.0
Total 64 100.0 100.0
Like cost performance, this measure does not take account of any justifiable
reasons for overruns. As an alternative measure, respondents were also asked
to rate the level of client satisfaction with time (Table 7.13). Mean rating was

Project performance
211
found to be 4.09 with standard deviation of 0.904. Both modal and median
ratings are 4.
Table 7.13 Descriptive statistics of time satisfaction measure Sat_time
N Valid 64
Missing 0
Mean 4.09
Std. Error of Mean .113
Median 4.00
Mode 4
Std. Deviation .904
Minimum 1
Maximum 5
It can be seen from Table 7.14 that 81.2% of clients were either satisfied or
very satisfied with the time performance. The same arguments made for the
cost performance are also applicable here. Indeed, all respondents (100%) on
late projects blamed variations, 34.6% also blamed inclement weather, 11.5%
blamed poor project management, and 3.8% blamed problems with labour.
Another 15.4% identified other factors as being responsible for the lost time.
Here also the higher level of satisfaction relative to the on-target projects may
also be a reflection of the low level of expectation that clients have of the
construction industry as argued previously.
Table 7.14 Frequency distribution of time satisfaction measure Frequency Percent Valid Percent Cumulative Percent
Valid 1 1 1.6 1.6 1.6
2 3 4.7 4.7 6.3
3 8 12.5 12.5 18.8
4 29 45.3 45.3 64.1
5 23 35.9 35.9 100.0
Total 64 100.0 100.0
Respondents were also asked to state the amount of liquidated and
ascertained damages (LADs) paid on the projects that were late. Surprisingly
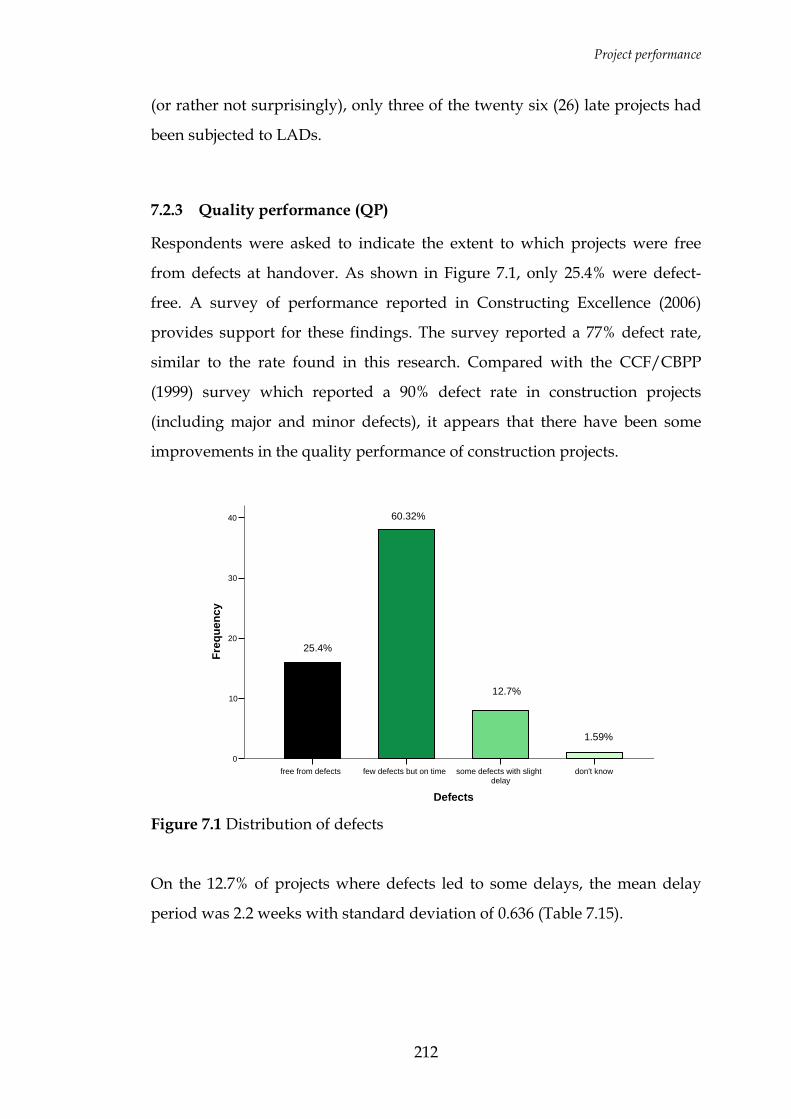
Project performance
212
(or rather not surprisingly), only three of the twenty six (26) late projects had
been subjected to LADs.
7.2.3 Quality performance (QP)
Respondents were asked to indicate the extent to which projects were free
from defects at handover. As shown in Figure 7.1, only 25.4% were defect-
free. A survey of performance reported in Constructing Excellence (2006)
provides support for these findings. The survey reported a 77% defect rate,
similar to the rate found in this research. Compared with the CCF/CBPP
(1999) survey which reported a 90% defect rate in construction projects
(including major and minor defects), it appears that there have been some
improvements in the quality performance of construction projects.
don't knowsome defects with slightdelay
few defects but on timefree from defects
Defects
40
30
20
10
0
Freq
uenc
y
1.59%
12.7%
60.32%
25.4%
Figure 7.1 Distribution of defects
On the 12.7% of projects where defects led to some delays, the mean delay
period was 2.2 weeks with standard deviation of 0.636 (Table 7.15).
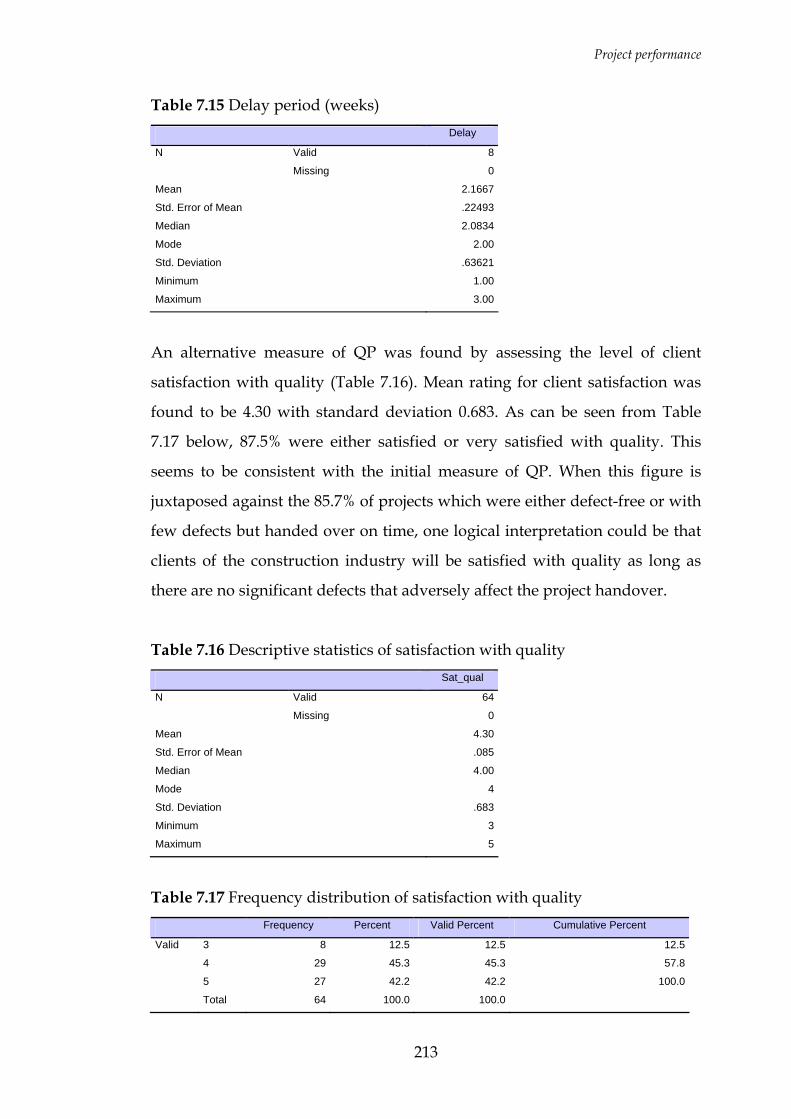
Project performance
213
Table 7.15 Delay period (weeks) Delay
Valid 8N
Missing 0
Mean 2.1667
Std. Error of Mean .22493
Median 2.0834
Mode 2.00
Std. Deviation .63621
Minimum 1.00
Maximum 3.00
An alternative measure of QP was found by assessing the level of client
satisfaction with quality (Table 7.16). Mean rating for client satisfaction was
found to be 4.30 with standard deviation 0.683. As can be seen from Table
7.17 below, 87.5% were either satisfied or very satisfied with quality. This
seems to be consistent with the initial measure of QP. When this figure is
juxtaposed against the 85.7% of projects which were either defect-free or with
few defects but handed over on time, one logical interpretation could be that
clients of the construction industry will be satisfied with quality as long as
there are no significant defects that adversely affect the project handover.
Table 7.16 Descriptive statistics of satisfaction with quality Sat_qual
N Valid 64
Missing 0
Mean 4.30
Std. Error of Mean .085
Median 4.00
Mode 4
Std. Deviation .683
Minimum 3
Maximum 5
Table 7.17 Frequency distribution of satisfaction with quality Frequency Percent Valid Percent Cumulative Percent
Valid 3 8 12.5 12.5 12.5
4 29 45.3 45.3 57.8
5 27 42.2 42.2 100.0
Total 64 100.0 100.0
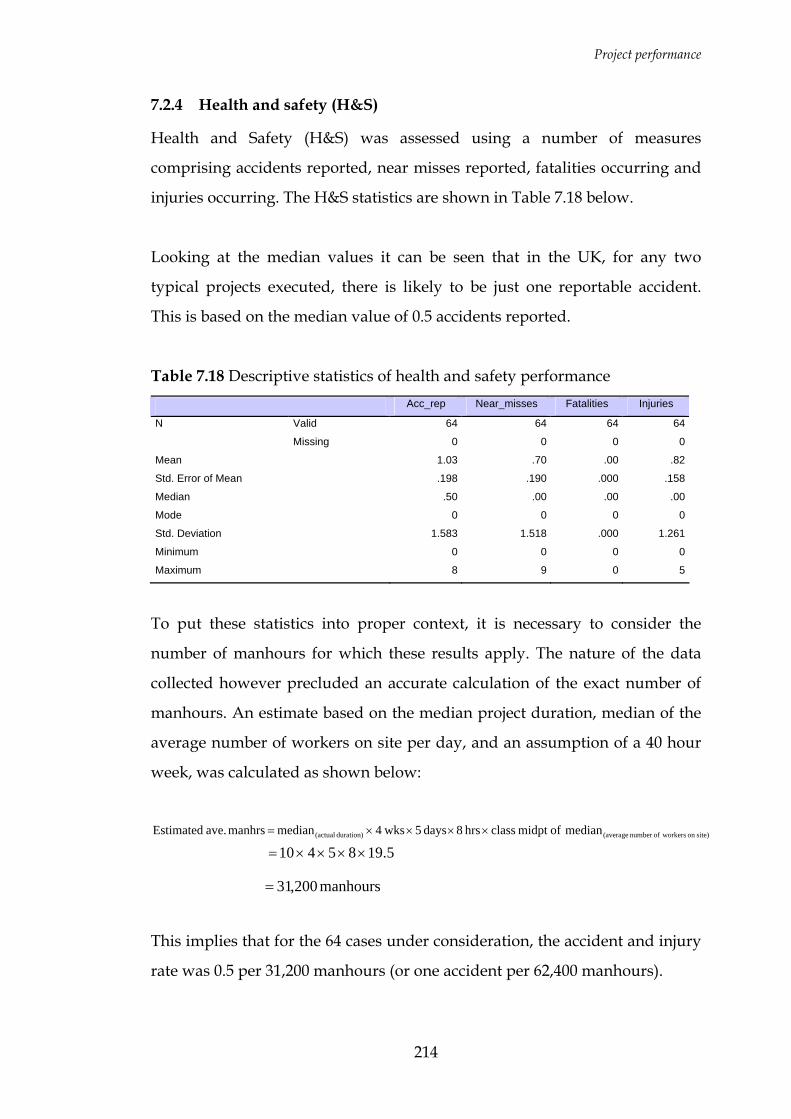
Project performance
214
7.2.4 Health and safety (H&S)
Health and Safety (H&S) was assessed using a number of measures
comprising accidents reported, near misses reported, fatalities occurring and
injuries occurring. The H&S statistics are shown in Table 7.18 below.
Looking at the median values it can be seen that in the UK, for any two
typical projects executed, there is likely to be just one reportable accident.
This is based on the median value of 0.5 accidents reported.
Table 7.18 Descriptive statistics of health and safety performance Acc_rep Near_misses Fatalities Injuries
N Valid 64 64 64 64
Missing 0 0 0 0
Mean 1.03 .70 .00 .82
Std. Error of Mean .198 .190 .000 .158
Median .50 .00 .00 .00
Mode 0 0 0 0
Std. Deviation 1.583 1.518 .000 1.261
Minimum 0 0 0 0
Maximum 8 9 0 5
To put these statistics into proper context, it is necessary to consider the
number of manhours for which these results apply. The nature of the data
collected however precluded an accurate calculation of the exact number of
manhours. An estimate based on the median project duration, median of the
average number of workers on site per day, and an assumption of a 40 hour
week, was calculated as shown below:
site)on workersofnumber (averageduration) (actual median ofmidpt class hrs 8days 5 wks4 median manhrs ave. Estimated ××××=
5.1985410 ××××=
This implies that for the 64 cases under consideration, the accident and injury
rate was 0.5 per 31,200 manhours (or one accident per 62,400 manhours).
manhours 200,31=
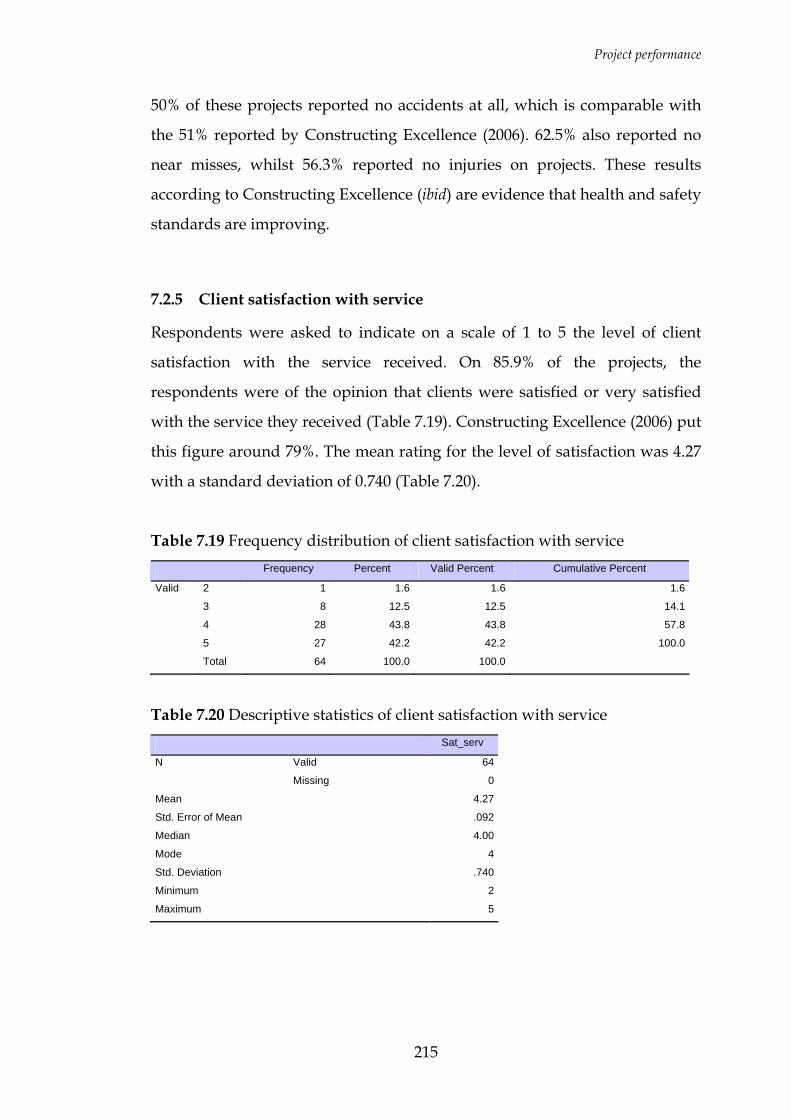
Project performance
215
50% of these projects reported no accidents at all, which is comparable with
the 51% reported by Constructing Excellence (2006). 62.5% also reported no
near misses, whilst 56.3% reported no injuries on projects. These results
according to Constructing Excellence (ibid) are evidence that health and safety
standards are improving.
7.2.5 Client satisfaction with service
Respondents were asked to indicate on a scale of 1 to 5 the level of client
satisfaction with the service received. On 85.9% of the projects, the
respondents were of the opinion that clients were satisfied or very satisfied
with the service they received (Table 7.19). Constructing Excellence (2006) put
this figure around 79%. The mean rating for the level of satisfaction was 4.27
with a standard deviation of 0.740 (Table 7.20).
Table 7.19 Frequency distribution of client satisfaction with service Frequency Percent Valid Percent Cumulative Percent
Valid 2 1 1.6 1.6 1.6
3 8 12.5 12.5 14.1
4 28 43.8 43.8 57.8
5 27 42.2 42.2 100.0
Total 64 100.0 100.0
Table 7.20 Descriptive statistics of client satisfaction with service Sat_serv
N Valid 64
Missing 0
Mean 4.27
Std. Error of Mean .092
Median 4.00
Mode 4
Std. Deviation .740
Minimum 2
Maximum 5
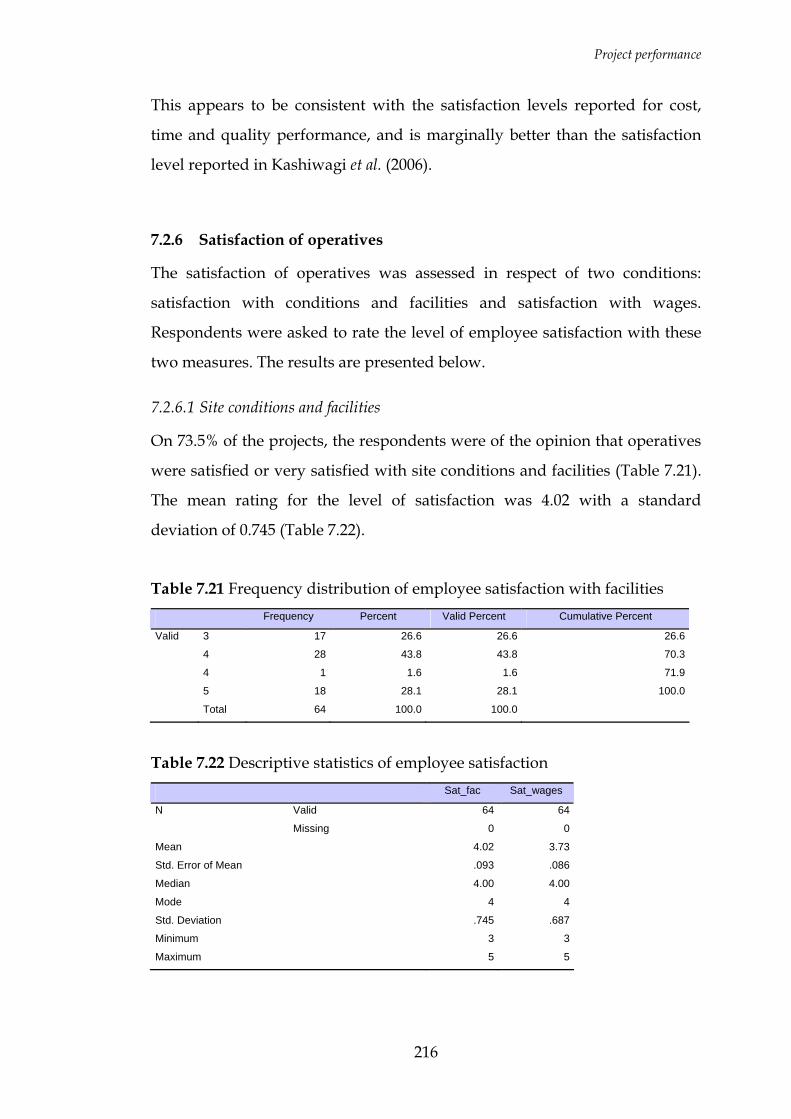
Project performance
216
This appears to be consistent with the satisfaction levels reported for cost,
time and quality performance, and is marginally better than the satisfaction
level reported in Kashiwagi et al. (2006).
7.2.6 Satisfaction of operatives
The satisfaction of operatives was assessed in respect of two conditions:
satisfaction with conditions and facilities and satisfaction with wages.
Respondents were asked to rate the level of employee satisfaction with these
two measures. The results are presented below.
7.2.6.1 Site conditions and facilities
On 73.5% of the projects, the respondents were of the opinion that operatives
were satisfied or very satisfied with site conditions and facilities (Table 7.21).
The mean rating for the level of satisfaction was 4.02 with a standard
deviation of 0.745 (Table 7.22).
Table 7.21 Frequency distribution of employee satisfaction with facilities Frequency Percent Valid Percent Cumulative Percent
Valid 3 17 26.6 26.6 26.6
4 28 43.8 43.8 70.3
4 1 1.6 1.6 71.9
5 18 28.1 28.1 100.0
Total 64 100.0 100.0
Table 7.22 Descriptive statistics of employee satisfaction Sat_fac Sat_wages
N Valid 64 64
Missing 0 0
Mean 4.02 3.73
Std. Error of Mean .093 .086
Median 4.00 4.00
Mode 4 4
Std. Deviation .745 .687
Minimum 3 3
Maximum 5 5
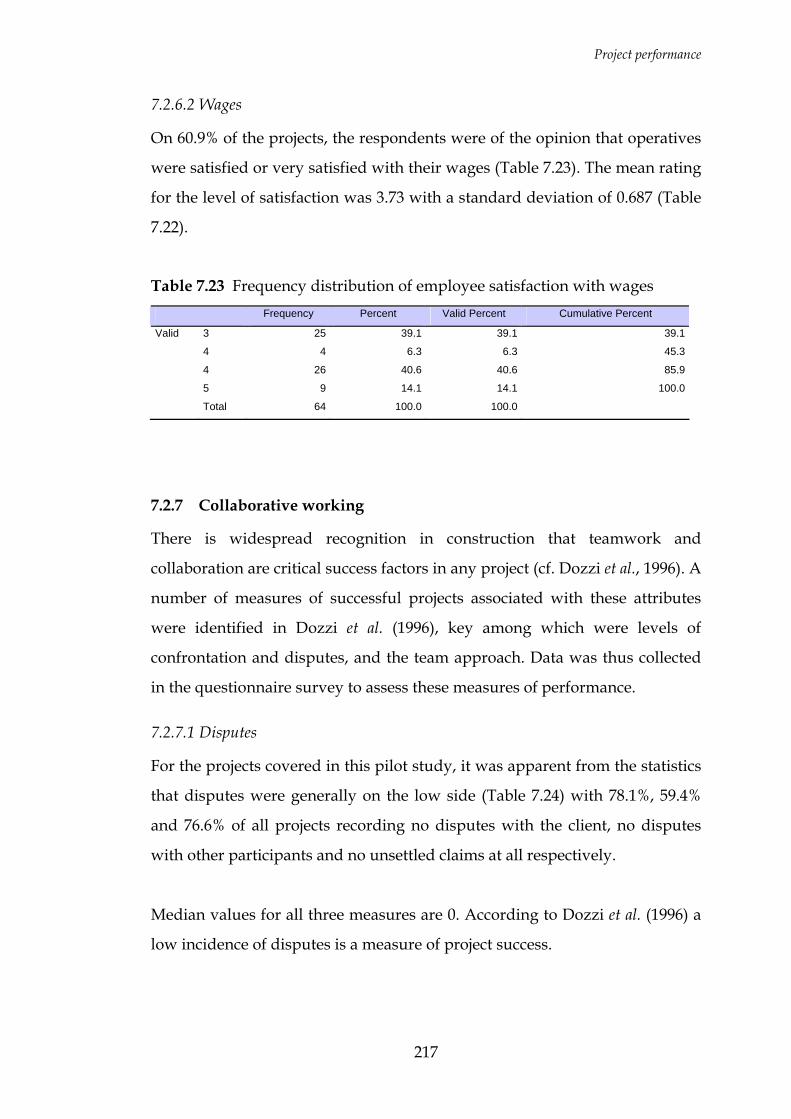
Project performance
217
7.2.6.2 Wages
On 60.9% of the projects, the respondents were of the opinion that operatives
were satisfied or very satisfied with their wages (Table 7.23). The mean rating
for the level of satisfaction was 3.73 with a standard deviation of 0.687 (Table
7.22).
Table 7.23 Frequency distribution of employee satisfaction with wages Frequency Percent Valid Percent Cumulative Percent
Valid 3 25 39.1 39.1 39.1
4 4 6.3 6.3 45.3
4 26 40.6 40.6 85.9
5 9 14.1 14.1 100.0
Total 64 100.0 100.0
7.2.7 Collaborative working
There is widespread recognition in construction that teamwork and
collaboration are critical success factors in any project (cf. Dozzi et al., 1996). A
number of measures of successful projects associated with these attributes
were identified in Dozzi et al. (1996), key among which were levels of
confrontation and disputes, and the team approach. Data was thus collected
in the questionnaire survey to assess these measures of performance.
7.2.7.1 Disputes
For the projects covered in this pilot study, it was apparent from the statistics
that disputes were generally on the low side (Table 7.24) with 78.1%, 59.4%
and 76.6% of all projects recording no disputes with the client, no disputes
with other participants and no unsettled claims at all respectively.
Median values for all three measures are 0. According to Dozzi et al. (1996) a
low incidence of disputes is a measure of project success.
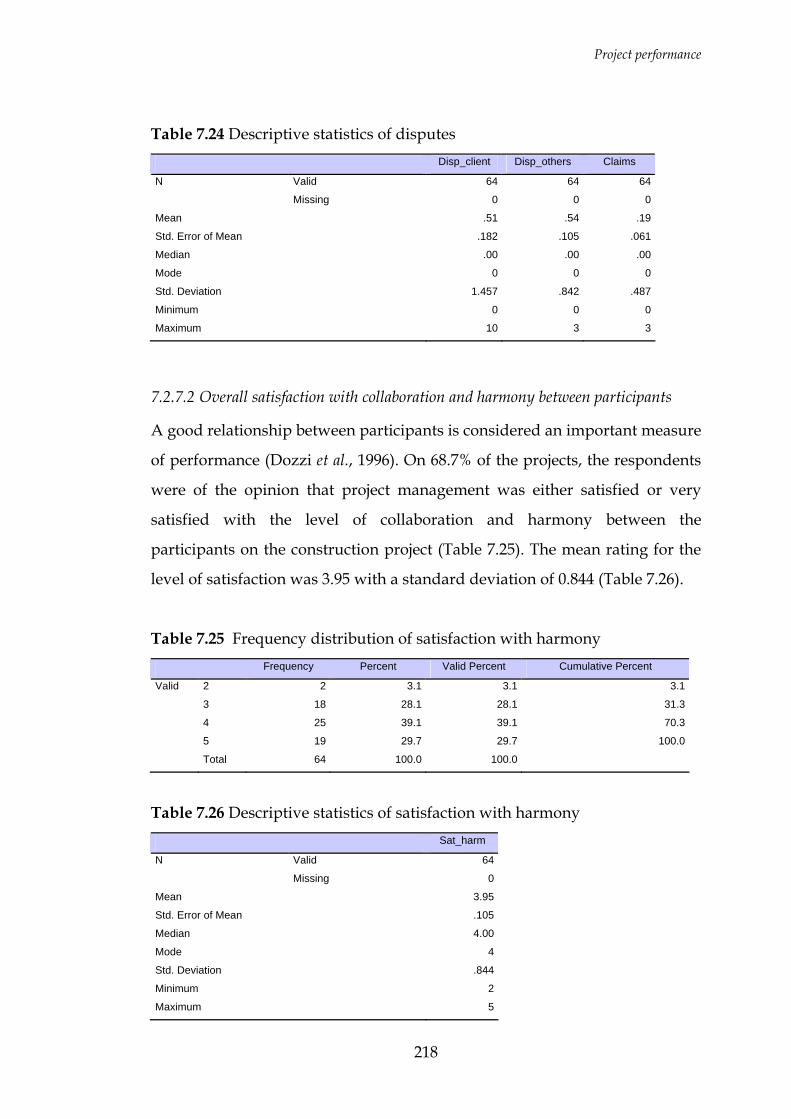
Project performance
218
Table 7.24 Descriptive statistics of disputes Disp_client Disp_others Claims
Valid 64 64 64 N
Missing 0 0 0
Mean .51 .54 .19
Std. Error of Mean .182 .105 .061
Median .00 .00 .00
Mode 0 0 0
Std. Deviation 1.457 .842 .487
Minimum 0 0 0
Maximum 10 3 3
7.2.7.2 Overall satisfaction with collaboration and harmony between participants
A good relationship between participants is considered an important measure
of performance (Dozzi et al., 1996). On 68.7% of the projects, the respondents
were of the opinion that project management was either satisfied or very
satisfied with the level of collaboration and harmony between the
participants on the construction project (Table 7.25). The mean rating for the
level of satisfaction was 3.95 with a standard deviation of 0.844 (Table 7.26).
Table 7.25 Frequency distribution of satisfaction with harmony Frequency Percent Valid Percent Cumulative Percent
Valid 2 2 3.1 3.1 3.1
3 18 28.1 28.1 31.3
4 25 39.1 39.1 70.3
5 19 29.7 29.7 100.0
Total 64 100.0 100.0
Table 7.26 Descriptive statistics of satisfaction with harmony Sat_harm
N Valid 64
Missing 0
Mean 3.95
Std. Error of Mean .105
Median 4.00
Mode 4
Std. Deviation .844
Minimum 2
Maximum 5
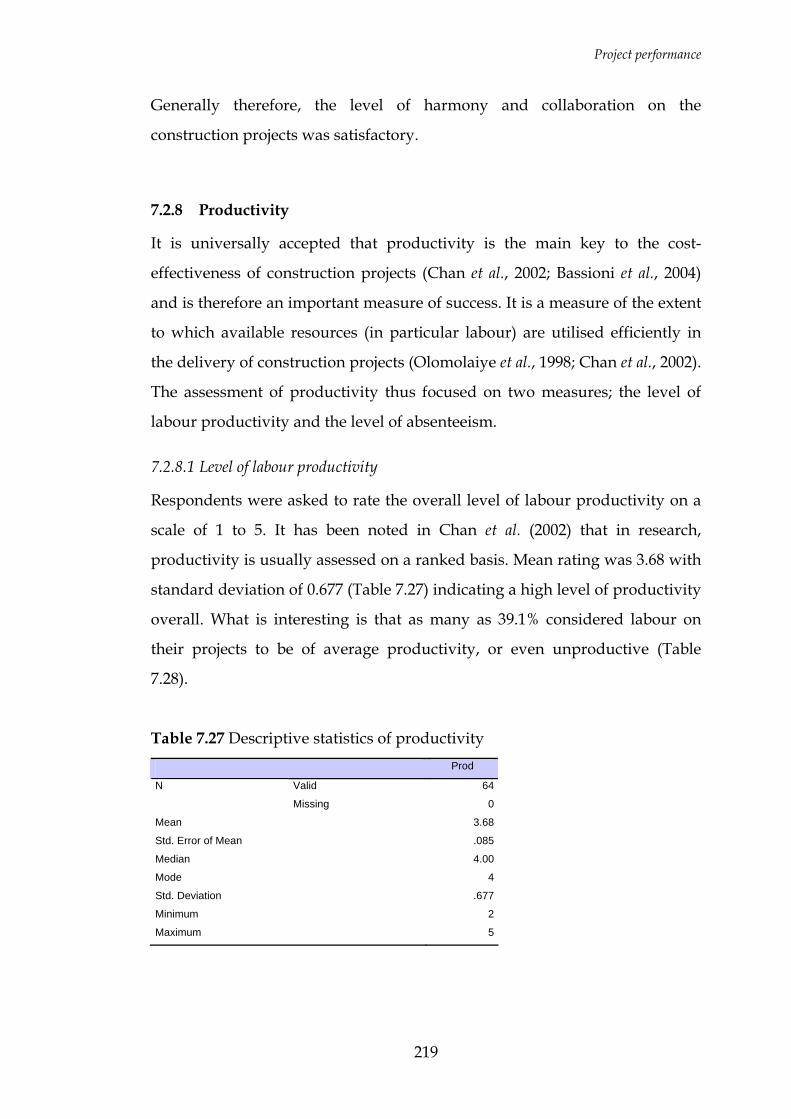
Project performance
219
Generally therefore, the level of harmony and collaboration on the
construction projects was satisfactory.
7.2.8 Productivity
It is universally accepted that productivity is the main key to the cost-
effectiveness of construction projects (Chan et al., 2002; Bassioni et al., 2004)
and is therefore an important measure of success. It is a measure of the extent
to which available resources (in particular labour) are utilised efficiently in
the delivery of construction projects (Olomolaiye et al., 1998; Chan et al., 2002).
The assessment of productivity thus focused on two measures; the level of
labour productivity and the level of absenteeism.
7.2.8.1 Level of labour productivity
Respondents were asked to rate the overall level of labour productivity on a
scale of 1 to 5. It has been noted in Chan et al. (2002) that in research,
productivity is usually assessed on a ranked basis. Mean rating was 3.68 with
standard deviation of 0.677 (Table 7.27) indicating a high level of productivity
overall. What is interesting is that as many as 39.1% considered labour on
their projects to be of average productivity, or even unproductive (Table
7.28).
Table 7.27 Descriptive statistics of productivity Prod
Valid 64N
Missing 0
Mean 3.68
Std. Error of Mean .085
Median 4.00
Mode 4
Std. Deviation .677
Minimum 2
Maximum 5
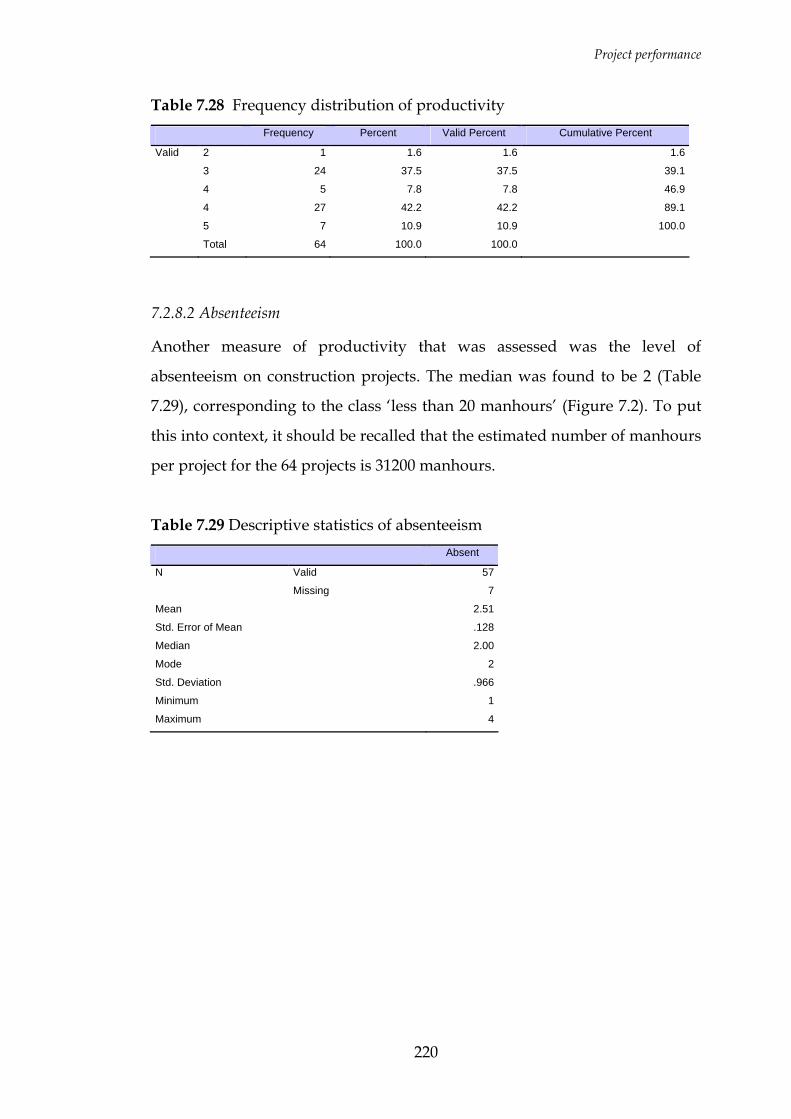
Project performance
220
Table 7.28 Frequency distribution of productivity Frequency Percent Valid Percent Cumulative Percent
Valid 2 1 1.6 1.6 1.6
3 24 37.5 37.5 39.1
4 5 7.8 7.8 46.9
4 27 42.2 42.2 89.1
5 7 10.9 10.9 100.0
Total 64 100.0 100.0
7.2.8.2 Absenteeism
Another measure of productivity that was assessed was the level of
absenteeism on construction projects. The median was found to be 2 (Table
7.29), corresponding to the class ‘less than 20 manhours’ (Figure 7.2). To put
this into context, it should be recalled that the estimated number of manhours
per project for the 64 projects is 31200 manhours.
Table 7.29 Descriptive statistics of absenteeism Absent
Valid 57N
Missing 7
Mean 2.51
Std. Error of Mean .128
Median 2.00
Mode 2
Std. Deviation .966
Minimum 1
Maximum 4
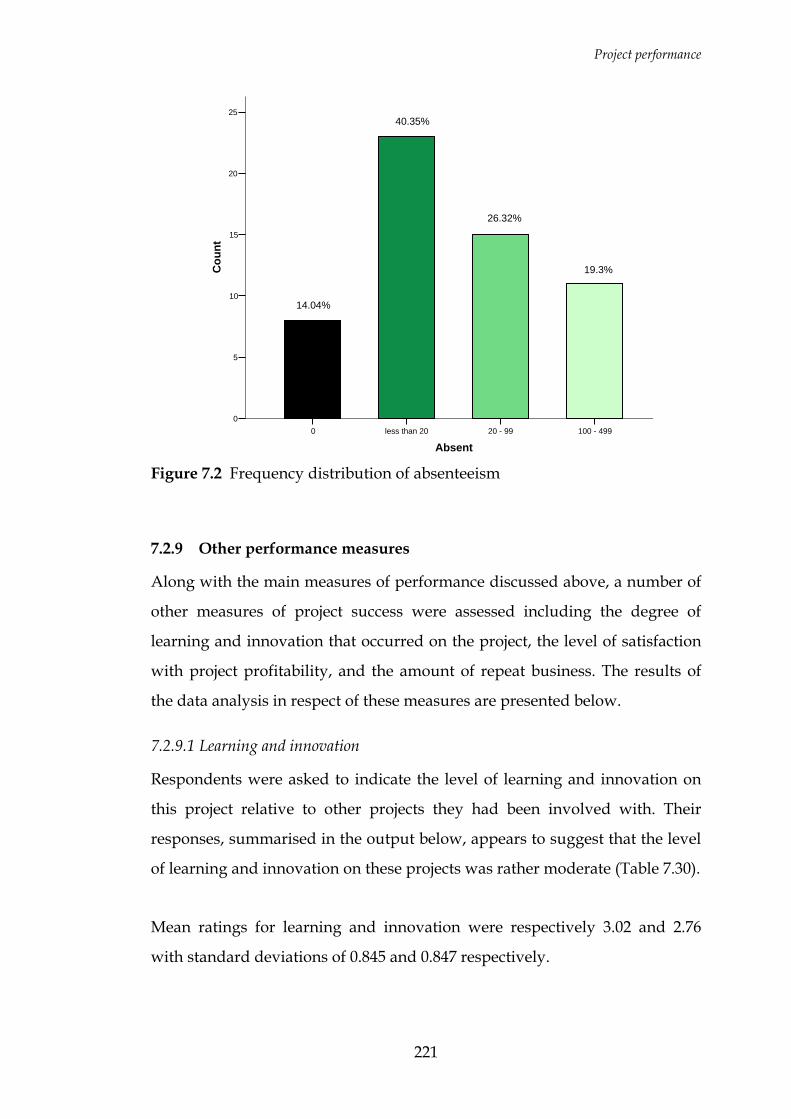
Project performance
221
100 - 49920 - 99less than 200
Absent
25
20
15
10
5
0
Cou
nt
19.3%
26.32%
40.35%
14.04%
Figure 7.2 Frequency distribution of absenteeism
7.2.9 Other performance measures
Along with the main measures of performance discussed above, a number of
other measures of project success were assessed including the degree of
learning and innovation that occurred on the project, the level of satisfaction
with project profitability, and the amount of repeat business. The results of
the data analysis in respect of these measures are presented below.
7.2.9.1 Learning and innovation
Respondents were asked to indicate the level of learning and innovation on
this project relative to other projects they had been involved with. Their
responses, summarised in the output below, appears to suggest that the level
of learning and innovation on these projects was rather moderate (Table 7.30).
Mean ratings for learning and innovation were respectively 3.02 and 2.76
with standard deviations of 0.845 and 0.847 respectively.
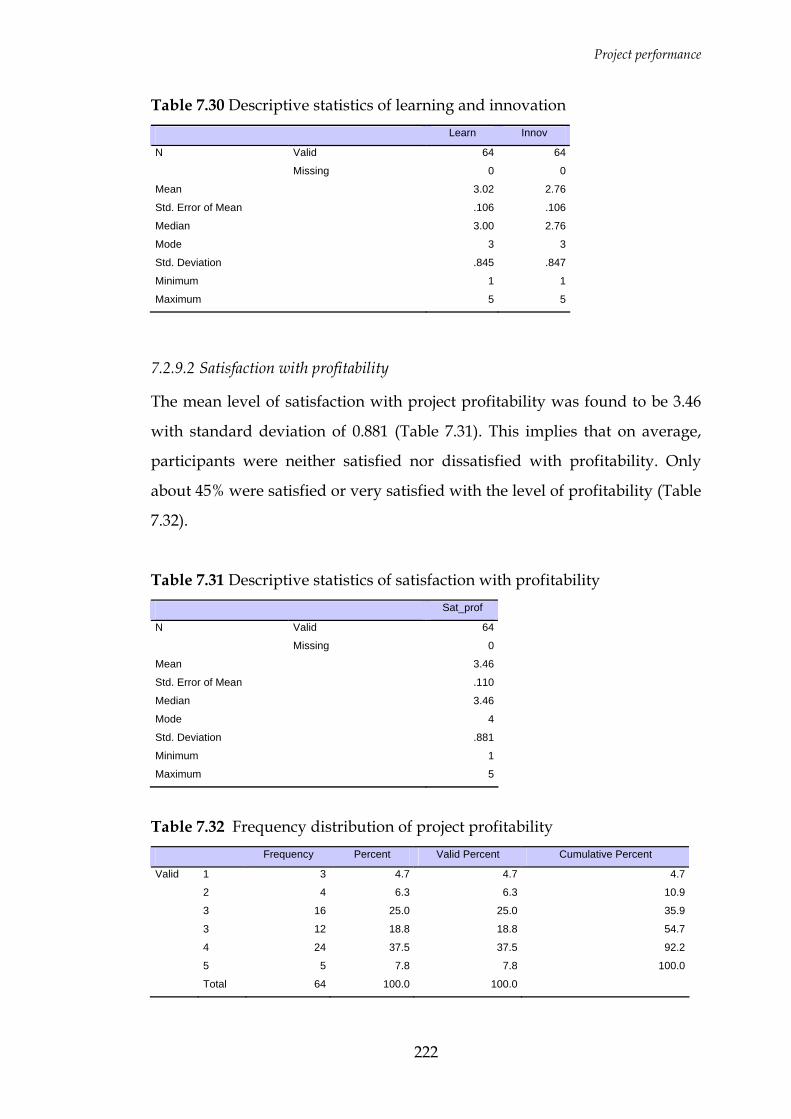
Project performance
222
Table 7.30 Descriptive statistics of learning and innovation Learn Innov
Valid 64 64 N
Missing 0 0
Mean 3.02 2.76
Std. Error of Mean .106 .106
Median 3.00 2.76
Mode 3 3
Std. Deviation .845 .847
Minimum 1 1
Maximum 5 5
7.2.9.2 Satisfaction with profitability
The mean level of satisfaction with project profitability was found to be 3.46
with standard deviation of 0.881 (Table 7.31). This implies that on average,
participants were neither satisfied nor dissatisfied with profitability. Only
about 45% were satisfied or very satisfied with the level of profitability (Table
7.32).
Table 7.31 Descriptive statistics of satisfaction with profitability Sat_prof
N Valid 64
Missing 0
Mean 3.46
Std. Error of Mean .110
Median 3.46
Mode 4
Std. Deviation .881
Minimum 1
Maximum 5
Table 7.32 Frequency distribution of project profitability Frequency Percent Valid Percent Cumulative Percent
Valid 1 3 4.7 4.7 4.7
2 4 6.3 6.3 10.9
3 16 25.0 25.0 35.9
3 12 18.8 18.8 54.7
4 24 37.5 37.5 92.2
5 5 7.8 7.8 100.0
Total 64 100.0 100.0

Project performance
223
7.2.9.3 Repeat business
A key measure of performance and project success according to Dozzi et al.
(1996) is repeat business. It is an indication of the level of trust between the
client and the contractor. Respondents where thus asked to indicate whether
or not they had undertaken any new work for the client since the completion
of the project.
54% had subsequent to the completion of this project undertaken other
projects for the same client. Given that clients’ willingness to select the same
contractor for future work is directly influenced by their satisfaction with
products and services provided (Maloney, 2003), then arguably this implies
that at least 54% of clients in this study were satisfied with their previous
performance, and this provides additional support for the validity of the
findings in respect of the performance measures like H&S, quality, cost and
time performance.
7.3 IDENTIFYING THE PRINCIPAL PERFORMANCE MEASURES
In total, 21 measures of performance were assessed in this research. In order
to reduce the number of variables to facilitate subsequent analyses, and also
to test the factor structure of the 21 performance measures factor analysis was
undertaken. It was also an opportunity to assess the convergent and
discriminant validity of the measures of performance. Principal components
was adopted as the method of extraction.
To test the suitability of the data for the factor analysis, the Kaiser-Meyer-
Olkin measure of sampling adequacy (MSA) and Bartlett test of sphericity
were obtained (Table 7.33). The MSA obtained was 0.626 greater than the
suggested minimum of 0.60 (UCLA, 2006). The Bartlett test also produced a
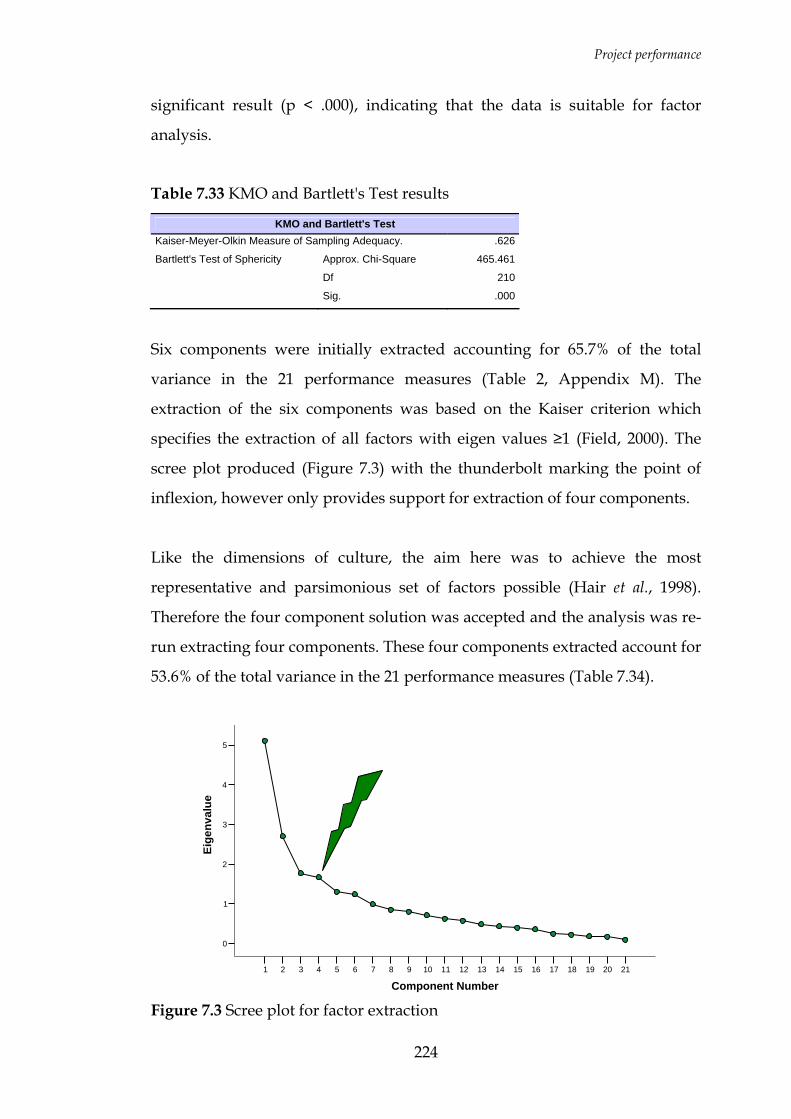
Project performance
224
significant result (p < .000), indicating that the data is suitable for factor
analysis.
Table 7.33 KMO and Bartlett's Test results
KMO and Bartlett's Test Kaiser-Meyer-Olkin Measure of Sampling Adequacy. .626
Bartlett's Test of Sphericity Approx. Chi-Square 465.461
Df 210
Sig. .000
Six components were initially extracted accounting for 65.7% of the total
variance in the 21 performance measures (Table 2, Appendix M). The
extraction of the six components was based on the Kaiser criterion which
specifies the extraction of all factors with eigen values ≥1 (Field, 2000). The
scree plot produced (Figure 7.3) with the thunderbolt marking the point of
inflexion, however only provides support for extraction of four components.
Like the dimensions of culture, the aim here was to achieve the most
representative and parsimonious set of factors possible (Hair et al., 1998).
Therefore the four component solution was accepted and the analysis was re-
run extracting four components. These four components extracted account for
53.6% of the total variance in the 21 performance measures (Table 7.34).
212019181716151413121110987654321
Component Number
5
4
3
2
1
0
Eige
nval
ue
Figure 7.3 Scree plot for factor extraction

Project performance
225
Table 7.34 Total variance explained by factors extracted
5.110 24.332 24.332 5.110 24.332 24.332 4.163 19.824 19.824
2.705 12.879 37.211 2.705 12.879 37.211 3.246 15.457 35.281
1.778 8.466 45.677 1.778 8.466 45.677 1.996 9.505 44.787
1.669 7.946 53.623 1.669 7.946 53.623 1.856 8.836 53.623
1.303 6.204 59.827
1.239 5.898 65.726
.994 4.735 70.461
.849 4.044 74.505
.809 3.850 78.355
.720 3.427 81.782
.627 2.988 84.770
.578 2.753 87.523
.490 2.335 89.858
.439 2.090 91.948
.396 1.886 93.834
.364 1.734 95.568
.250 1.191 96.759
.228 1.088 97.847
.188 .893 98.740
.168 .802 99.542
.096 .458 100.000
Component1
2
3
4
5
6
7
8
9
10
11
12
13
14
15
16
17
18
19
20
21
Total % of Variance Cumulative % Total % of Variance Cumulative % Total % of Variance Cumulative %
Initial Eigenvalues Extraction Sums of Squared Loadings Rotation Sums of Squared Loadings
Extraction Method: Principal Component Analysis.
In order to improve the interpretability of factors, varimax rotation was
performed on the extracted component matrix to maximise the loading of
each variable on one of the extracted factors whilst minimising its loading on
all the other factors (Field, 2000). The rotated component matrix that was
obtained after the varimax rotation is displayed below (Table 7.35). The
matrix shows the rotated component loadings with loadings less than 0.4
suppressed for clarity.
New variables for these four extracted components were computed using the
Anderson-Rubin method (SPSS, 2004) for subsequent analyses.
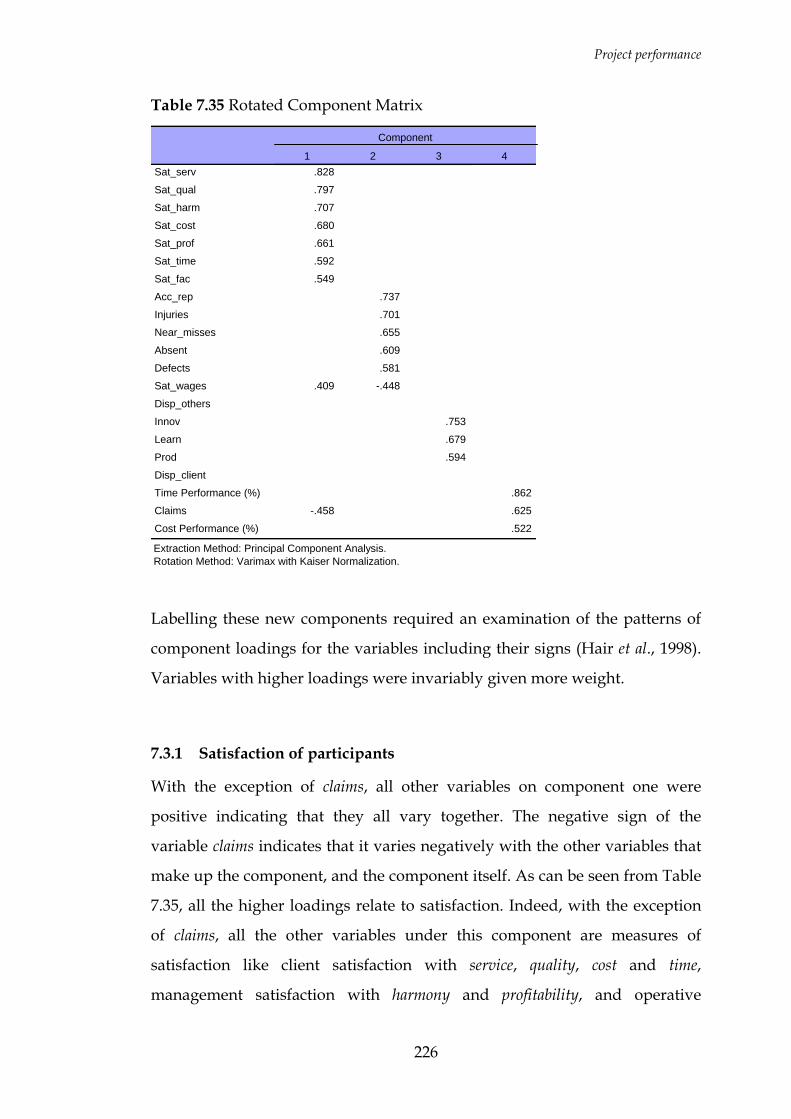
Project performance
226
Table 7.35 Rotated Component Matrix
.828
.797
.707
.680
.661
.592
.549
.737
.701
.655
.609
.581
.409 -.448
.753
.679
.594
.862
-.458 .625
.522
Sat_serv
Sat_qual
Sat_harm
Sat_cost
Sat_prof
Sat_time
Sat_fac
Acc_rep
Injuries
Near_misses
Absent
Defects
Sat_wages
Disp_others
Innov
Learn
Prod
Disp_client
Time Performance (%)
Claims
Cost Performance (%)
1 2 3 4
Component
Extraction Method: Principal Component Analysis. Rotation Method: Varimax with Kaiser Normalization.
Labelling these new components required an examination of the patterns of
component loadings for the variables including their signs (Hair et al., 1998).
Variables with higher loadings were invariably given more weight.
7.3.1 Satisfaction of participants
With the exception of claims, all other variables on component one were
positive indicating that they all vary together. The negative sign of the
variable claims indicates that it varies negatively with the other variables that
make up the component, and the component itself. As can be seen from Table
7.35, all the higher loadings relate to satisfaction. Indeed, with the exception
of claims, all the other variables under this component are measures of
satisfaction like client satisfaction with service, quality, cost and time,
management satisfaction with harmony and profitability, and operative
Project performance
227
satisfaction with conditions and wages. This component was therefore labelled
participant satisfaction. The positive associations between the satisfaction
variables is a sign of the inter-relatedness of the satisfaction levels of project
participants. There is support in the construction management literature for
this assertion. Dozzi et al. (1996) for instance argued that if a project is
profitable for the contractor, there is a greater chance of the client being
satisfied.
It is very common to find this measure of participant satisfaction (or similar)
in the literature on performance measures (cf. Chan et al., 2002; Leung et al.,
2004) and in some studies of culture (cf. Zuo and Zillante, 2006). Satisfaction
is defined in Chan et al. (2002) as the level of ‘happiness’ of people affected by
the project including key project participants. It is an attribute of success,
which is both dependent on performance and personal standards or
expectations (Liu and Walker, 1998; Cox et al., 2002). Satisfaction, described in
Lui and Walker (1998) as an aptitude (an effect or emotion), is thus a
subjective assessment of performance. In this research it encompasses client
satisfaction with service, quality, cost and time, management satisfaction with
harmony and profitability, and operative satisfaction with conditions and wages,
as well as the absence of claims.
Going by the evidence presented so far, it appears reasonable to suggest that
participant satisfaction across the construction industry is generally high.
7.3.2 H&S and quality outcomes
With the exception of satisfaction with wages, all other variables on component
two were positive indicating that they all vary together. As can be seen from
Table 7.35, all the higher loadings relate to accidents reported, injuries occuring,
near misses reported, extent of defects, and the level of absenteeism. This
component was therefore labelled H&S and quality outcomes. Increases in this
Project performance
228
measure imply worsening performance. The negative relationship between
this measure and satisfaction with wages indicates that as H&S standards
decline, satisfaction with wages also declines, absenteeism grows, and quality
levels decline.
It has been reported in the literature (cf. Warrack and Sinha, 1999; Griffith,
2000; Cooper and Phillips, 1995) that H&S and quality are closely associated.
Warrack and Sinha (1999) for instance argue that integration of H&S and
quality is essential in the development of improvement strategies and
describing them as “two sides of the same coin”. This is confirmation of the
validity of the factor extraction.
H&S and quality outcomes represent important measures of project
performance. Indeed in this research, H&S and quality were identified by
respondents as the first and second most important project objectives
respectively.
7.3.3 Innovation and learning
All the variables on component three were positive indicating that they all
vary together. As can be seen from Table 7.35, the variables loading on this
component were the measures of innovation, learning, and productivity. As all
these variables are positively correlated with component three, it implies that
higher levels of innovation are associated with higher levels of learning and
higher levels of productivity. Component three was therefore labelled
innovation and learning. Performance measures associated with the degree of
innovation and learning are emerging within the construction project context
as some of the ‘soft’ but very relevant measures of performance as
acknowledged for instance by Bassioni et al. (2004). An example of the
assessment of learning in construction, albeit in an organisational context, is
provided by Kululanga et al. (2001).
Project performance
229
Innovation and learning as a measure of performance, is commonly found in
the main performance measurement frameworks like the Balanced Scorecard
(Kaplan and Norton, 1996) and the EFQM Excellence Model reviewed in
Mbugua (2000) and Bassioni et al. (2004). This provides some validation for
the factor extraction.
From the descriptive statistics, it can be suggested that the level of innovation
and learning in construction is generally not high. This confirms research
findings such as those of Riley and Clare-Brown (2001) which showed that
there were significantly more innovative values in production and process
manufacturing companies than in construction. It also supports the view that
collective learning is lost once a project is completed and the project
organisation disbands (Ibert, 2004).
7.3.4 Time and cost outcomes
All the variables on component four were positive indicating that they all
vary together. As can be seen from Table 7.35, the variables loading on this
component were the measures of time performance, claims, and cost performance.
As all these variables are positively correlated with component four, it
implies that as time performance declines, claims increase and cost
performance declines as well. Component four was therefore labelled time and
cost performance. Increases in this measure imply worsening performance. The
packaging of time, claims and cost together in one performance measure is a
logical outcome bearing in mind the finding that most cost and time overruns
were due to variations, the valuation of which is often associated with
disputes and claims.
From the descriptive statistics, it can be suggested that the time and cost
performance levels of construction projects in the UK is generally inadequate
or even poor.

Project performance
230
7.4 EXAMINING PERFORMANCE DIFFERENCES ACROSS PROJECTS
In order to assess whether or not significant differences in performance levels
exist across construction projects in the UK, the Kruskal-Wallis test, Mann-
Whitney test and Spearman’s correlation test were applied to the
performance measures and contextual variables. The Kruskal-Wallis and
Mann-Whitney tests were applied where the variables involved were
nominal, and Spearman’s correlation where the variables involved were
ordinal or scale. Each of the four principal performance measures was tested
and the results are presented in Appendix N. Apart from these four principal
measures of performance, an overall project performance index was also
developed and assessed, similar to Ogbonna and Harris (2000) and Xiao
(2002). This overall project performance index brought together all four
aspects of project performance in an attempt to give a holistic view of project
performance based on a single aggregated performance indicator.
In this process of aggregation to form an overall performance index, equal
weighting was applied to all the four performance measures (25% each). This
was because as argued in Xiao (2002), all aspects of performance need to be
considered, and the achievement of one aspect of performance should not be
at the expense of another. Moreover, Babbie (1990) has also indicated that
unless there is a sound basis for differential weighting, equal weighting
should be applied. Overall performance was thus taken as the summated
mean and calculated as follows:
( )TCILHQPS41OP −+−×=
Where:
OP is Overall performance
PS is Participant satisfaction
Project performance
231
HQ is Health and safety and quality
IL is Innovation and learning
TC is Time and cost
All these measures of performance were assessed and the results are shown
in Tables 1, 2 and 3 (Appendix N). From these tables it can be seen that with
the exception of the overall performance index, all the other performance
outcomes vary with the characteristics of the project.
Satisfaction of participants is significantly correlated with the level of
importance of H&S on the project (ρ = .268, p = .043). Recalling that the
manner in which priorities were ranked with 1 representing most important
(refer Chapter 6), this result can be interpreted as meaning that as the level of
priority of H&S increases, the satisfaction levels of project participants
declines. Relating this with the negative association between priority of H&S
and priority of cost established in Chapter 6, it can be inferred that an
increase in the importance of H&S which corresponds with a decline in the
priority of cost, is associated with a decline in participant satisfaction. This
outcome is somewhat surprising as it appears to suggest simply that project
participants are more satisfied on projects where there is less emphasis on
H&S, but more emphasis on cost.
H&S and quality outcomes vary significantly with whether a project is new
work, refurbishment, redevelopment or demolition (χ2 = 8.351, p = .039). As
can be seen from Figure 7.4, demolition projects are by far the worst
performers in relation to H&S and quality. When classified only in terms of
whether the project is new work or repair and maintenance (R&M), there is
also a significant difference in H&S and quality outcomes (z = -2.016, p = .044)
with performance significantly better for the R&M than for the new work as
shown in Table 3 of Appendix N (ρ = -.291, p = .042). The H&S and quality
outcome also varies significantly with complexity (ρ = .310, p = .019), contract
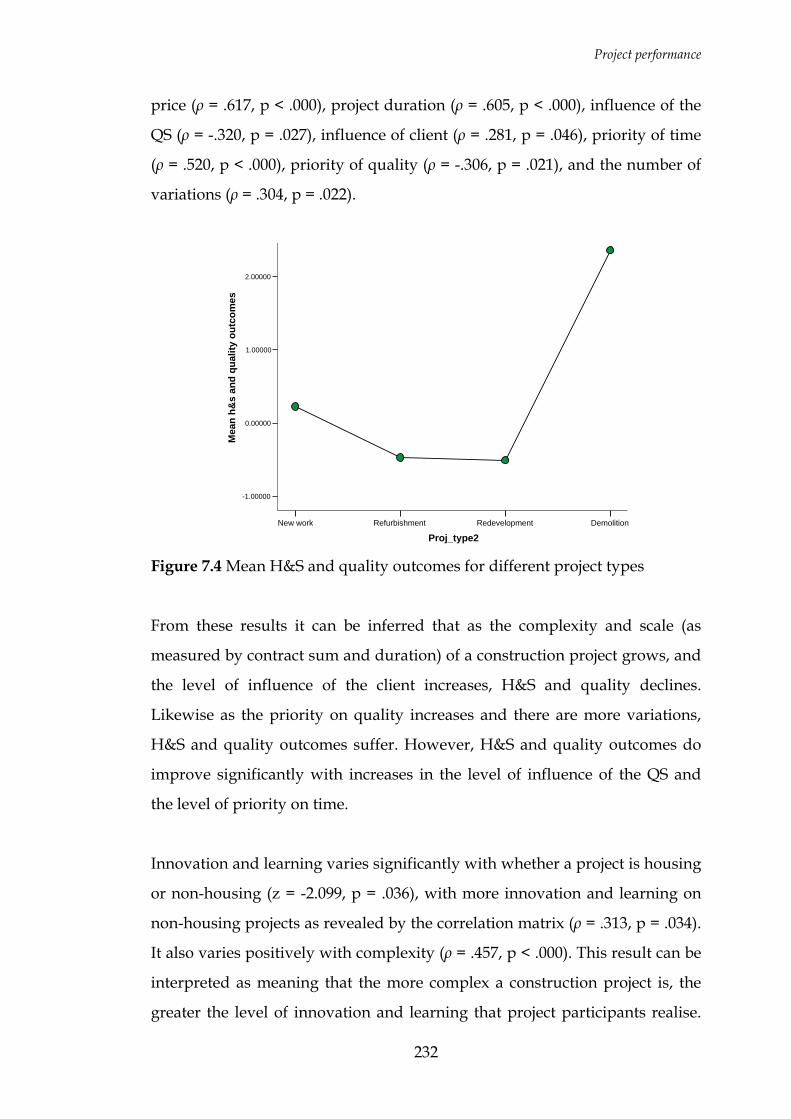
Project performance
232
price (ρ = .617, p < .000), project duration (ρ = .605, p < .000), influence of the
QS (ρ = -.320, p = .027), influence of client (ρ = .281, p = .046), priority of time
(ρ = .520, p < .000), priority of quality (ρ = -.306, p = .021), and the number of
variations (ρ = .304, p = .022).
DemolitionRedevelopmentRefurbishmentNew work
Proj_type2
2.00000
1.00000
0.00000
-1.00000
Mea
n h&
s an
d qu
ality
out
com
es
Figure 7.4 Mean H&S and quality outcomes for different project types
From these results it can be inferred that as the complexity and scale (as
measured by contract sum and duration) of a construction project grows, and
the level of influence of the client increases, H&S and quality declines.
Likewise as the priority on quality increases and there are more variations,
H&S and quality outcomes suffer. However, H&S and quality outcomes do
improve significantly with increases in the level of influence of the QS and
the level of priority on time.
Innovation and learning varies significantly with whether a project is housing
or non-housing (z = -2.099, p = .036), with more innovation and learning on
non-housing projects as revealed by the correlation matrix (ρ = .313, p = .034).
It also varies positively with complexity (ρ = .457, p < .000). This result can be
interpreted as meaning that the more complex a construction project is, the
greater the level of innovation and learning that project participants realise.
Project performance
233
Given that the more complex projects and non-housing projects tend to be the
bigger projects (refer Chapter 6), it can be inferred that greater levels of
innovation and learning are likely to occur on such projects.
The analysis also revealed evidence of a significant difference in time and cost
outcomes between projects that are new work and R&M projects (z = -1.974, p
= .048), and as shown in Table 3 (Appendix N) specifically that new work has
better time and cost outcomes than R&M projects (ρ = .285, p = .047).
The evidence from the above analyses clearly indicates that performance
levels across projects in the sample, in relation to the various measures
assessed in this research, vary from project to project. What remains to be
seen is whether such differences are associated with the cultural differences
established in Chapter 6.
7.5 SUMMARY
In order to provide a basis for the evaluation of the impact of cultural
orientations on project performance outcomes, there was a need to assess the
performance of construction projects in the UK. A variety of performance
measures including inter alia cost, time, quality, health and safety, disputes,
and productivity outcomes were thus assessed in this chapter.
Generally, the performance levels found in this research were consistent with
other reports and surveys carried out (cf. CCF/CBPP, 1999; Constructing
Excellence, 2006; Kashiwagi et al., 2006) with the evidence from the projects
captured by the survey suggesting that there have been some improvements
in the overall performance levels. Several measures of performance were
assessed in this research. However, the application of principal component
factor analysis led to the extraction of four principal measures of performance
Project performance
234
viz; satisfaction of participants, H&S and quality, innovation and learning, and time
and cost outcomes. When analysed across the project characteristics, it was
found that whilst overall performance (the aggregation of the four
performance measures) did not vary significantly for different project types,
satisfaction of participants, H&S and quality, innovation and learning, and
time and cost outcomes did vary significantly from project to project. In
particular, it was found that H&S and quality outcomes vary the most with
project characteristics (Table 3, Appendix N).
The chapter has thus addressed the second part of the fifth objective of this
research which was to establish the levels of performance of construction
projects in the sample. It has also been demonstrated in response to the
second research hypothesis, that there are statistically significant differences
in performance levels across construction projects within the sample.
Having established clear differences in cultural orientation and performance
levels of construction projects, the next phase of this research focuses on the
examination of the data for evidence of relationships between cultural
orientations and performance outcomes. The next chapter addresses this
aspect of the research.
235
CHAPTER 8: THE CULTURE OF THE CONSTRUCTION PROJECT ORGANISATION AND PROJECT PERFORMANCE
8.0 INTRODUCTION
The final two objectives of this research are to explore the possible
relationships between each specific cultural attribute and the performance of
the project organisations, and to develop models that relate organisational
culture with performance. It has been established in the last two chapters that
different cultures exist within different project organisations. It has also been
established that performance levels vary from project to project. Therefore to
address the last two objectives of this research it is necessary to explore the
extent to which the differences in cultural orientation are associated with the
differences in performance outcomes. This chapter therefore explores the
potential relationships between the operating cultures within the CPOs and
the project performance outcomes to determine whether or not any
significant association exists. Models of the relationships are developed and
presented in this chapter to help identify best practice cultural orientations.
8.1 THE RESEARCH HYPOTHESIS AND STATISTICAL ANALYSIS
The main aim of this research is to establish empirically whether or not the
culture within a CPO has an impact on its performance, and to investigate the
nature of any relationship(s) that exist. To help achieve this, a hypothesis was
advanced in Chapter 4 as follows:
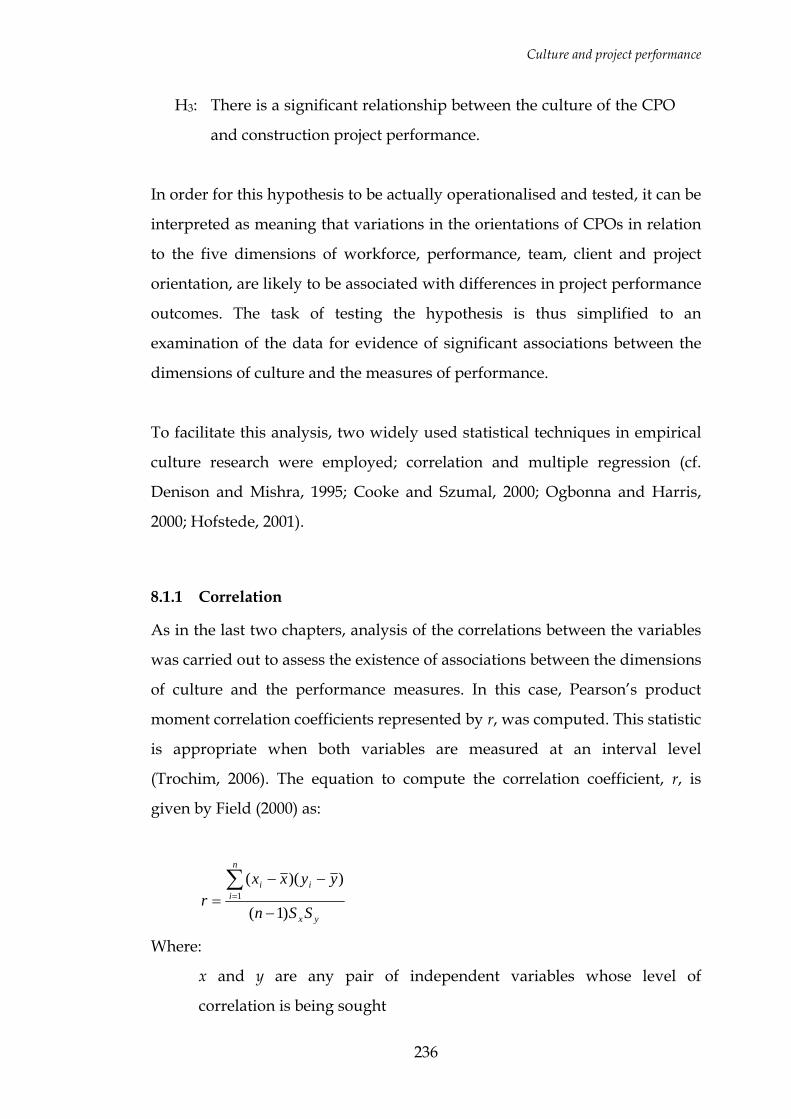
Culture and project performance
236
H3: There is a significant relationship between the culture of the CPO
and construction project performance.
In order for this hypothesis to be actually operationalised and tested, it can be
interpreted as meaning that variations in the orientations of CPOs in relation
to the five dimensions of workforce, performance, team, client and project
orientation, are likely to be associated with differences in project performance
outcomes. The task of testing the hypothesis is thus simplified to an
examination of the data for evidence of significant associations between the
dimensions of culture and the measures of performance.
To facilitate this analysis, two widely used statistical techniques in empirical
culture research were employed; correlation and multiple regression (cf.
Denison and Mishra, 1995; Cooke and Szumal, 2000; Ogbonna and Harris,
2000; Hofstede, 2001).
8.1.1 Correlation
As in the last two chapters, analysis of the correlations between the variables
was carried out to assess the existence of associations between the dimensions
of culture and the performance measures. In this case, Pearson’s product
moment correlation coefficients represented by r, was computed. This statistic
is appropriate when both variables are measured at an interval level
(Trochim, 2006). The equation to compute the correlation coefficient, r, is
given by Field (2000) as:
yx
n
iii
SSn
yyxxr
)1(
))((1
−
−−=
∑=
Where:
x and y are any pair of independent variables whose level of
correlation is being sought
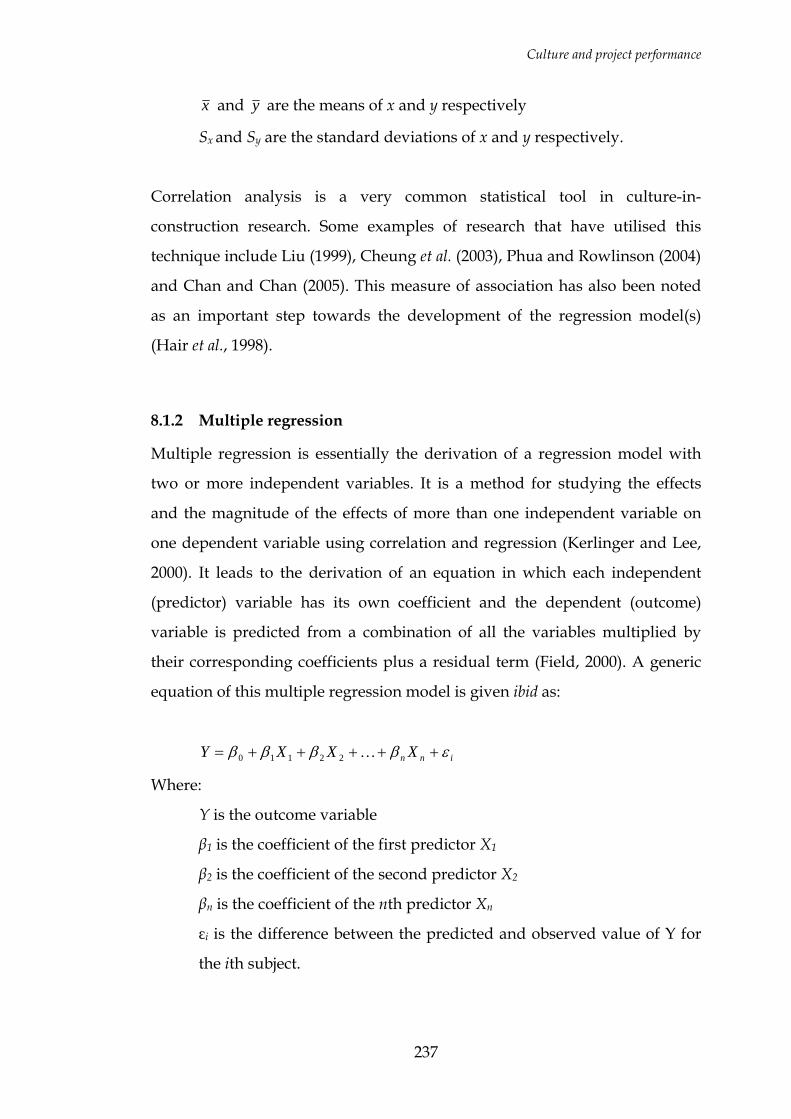
Culture and project performance
237
x and y are the means of x and y respectively
Sx and Sy are the standard deviations of x and y respectively.
Correlation analysis is a very common statistical tool in culture-in-
construction research. Some examples of research that have utilised this
technique include Liu (1999), Cheung et al. (2003), Phua and Rowlinson (2004)
and Chan and Chan (2005). This measure of association has also been noted
as an important step towards the development of the regression model(s)
(Hair et al., 1998).
8.1.2 Multiple regression
Multiple regression is essentially the derivation of a regression model with
two or more independent variables. It is a method for studying the effects
and the magnitude of the effects of more than one independent variable on
one dependent variable using correlation and regression (Kerlinger and Lee,
2000). It leads to the derivation of an equation in which each independent
(predictor) variable has its own coefficient and the dependent (outcome)
variable is predicted from a combination of all the variables multiplied by
their corresponding coefficients plus a residual term (Field, 2000). A generic
equation of this multiple regression model is given ibid as:
inn XXXY εββββ +++++= K22110
Where:
Y is the outcome variable
β1 is the coefficient of the first predictor X1
β2 is the coefficient of the second predictor X2
βn is the coefficient of the nth predictor Xn
εi is the difference between the predicted and observed value of Y for
the ith subject.
Culture and project performance
238
According to Hair et al. (1998), the coefficients are weights which effectively
denote the relative contribution of the predictor variables to the overall
prediction, and facilitate interpretation as to the influence of each variable in
making the prediction. As aptly stated in Kerlinger and Lee (2000), the results
of the calculations indicate how ‘good’ the prediction is and approximately
how much of the variance of the outcome is accounted for by the ‘best’ linear
combination of the predictors. This is what makes the multiple regression
model particularly appropriate in this research which seeks to examine the
influence of various dimensions of culture (independent variables) on each
project performance outcome (dependent variable).
8.1.2.1 Methods of variable selection in multiple regression
There are several methods for deciding which independent variables to use in
the regression model and how to enter these variables into the model. Field
(2000) identified three principal methods as hierarchical, forced entry, and
stepwise methods.
Hierarchical regression relies on the identification of predictors based on past
research. These known predictors are then entered into the regression model
in order of their importance, after which the previously unidentified
predictors are entered (Field, 2000). In this research, the absence of strong
empirical evidence of important predictors from the literature on cultural
orientations and performance precluded the use of this method of regression.
With forced entry, all the predictors are forced into the model
simultaneously. As noted in Field (2000), this method also relies on the
existence of sound theoretical bases for inclusion of all the chosen variables, a
requirement which cannot be satisfied in this research.
The most viable option for this research is thus the stepwise method. In the
stepwise method, the decisions about what variables to enter into the model
Culture and project performance
239
and the order in which they are entered are based entirely on a mathematical
criterion (Field, 2000). This approach according to Xiao (2002) yields a final
equation that is simple yet powerful enough to reveal any significant
relationships. Predictors not in the model are evaluated for entry one at a
time, with the best predictor being entered into the model, and those already
in the equation are evaluated for removal one at a time with the removal of
the most insignificant predictor, until no more predictors are eligible for entry
or removal (Field, 2000; Xiao, 2002). The criterion for entry of a predictor is
that the significance of the F test must be ≤ 0.05, and the criterion for removal
is that the significance of the F test must be ≥ 0.10.
8.1.2.2 Assumptions of regression
There are a number of key assumptions associated with the multiple
regression procedure. These assumptions must be met for the regression
analysis to guarantee a model in which the actual errors in prediction are as a
result of the real absence of a relationship among the variables and not
caused by some characteristic of the data not accommodated by the
regression procedure (Hair et al., 1998). These assumptions are given ibid as
follows:
Linearity of the phenomenon measured
Constant variance of the error terms
Independence of the error terms
Normality of the error term distribution
Hair et al. (1998) have indicated that the principal measure of prediction
errors is the residual, which is the difference between the observed and
predicted values for the outcome variable. Analysis of the residuals is thus
the principal means of identifying violations of the assumptions. According
to Hair et al. (ibid), plots of the standardised residuals versus predictor and
outcome variables is the basic method of identifying assumption violations.
Culture and project performance
240
Specific patterns of these residuals indicate violations of particular
assumptions. These assumptions are discussed in more detail below.
Linearity
Multiple regression assumes a linear relationship between the outcome
variable and the predictor variables. One approach for testing this
assumption is to plot the outcome against the predictor variables, and the
data points should cluster around a straight line if the assumptions are met
(Xiao, 2002). Linearity can also be assessed from an examination of residual
plots which must show a random distribution of data points. Hair et al. (1998)
and Field (2000) provide a number of residual plots which show non-linear
patterns of residuals. Where such non-linear relationships exist, alternative
regression methods such as the introduction of polynomial terms must be
considered.
Constant variance
Heteroscedasticity, or the presence of unequal variance has been described as
one of the commonest assumption violations. It is diagnosed also by plots of
studentised residuals against the predicted outcome values. A consistent
pattern (triangle or diamond-shaped) in such a plot is evidence that the
variance is not constant (Hair et al., 1998). Alternatively, the Levene test for
homogeneity of variance can be produced by SPSS (SPSS, 2004). Significant
values indicate a departure from constant variance.
Independence
It is expected that the residual terms for any two cases should be uncorrelated
(i.e. independent). Autocorrelation is said to exist where residual terms are
not independent (Field, 2000). The Durbin-Watson test for serial correlation of
the residuals (SPSS, 2004), can be used to evaluate this assumption. The test
statistic can vary between 0 and 4 with the value of 2 meaning that the
Culture and project performance
241
residuals are uncorrelated or independent (Field, 2000). As a general rule of
thumb, the closer the value is to 2, the better.
Normality
A fundamental assumption of multiple regression, and what Hair et al. (1998)
described as the most frequently violated assumption, is the assumption of
normality of the predictor and outcome variables. The simplest diagnostic
tool for the set of predictors in the equation is the histogram of residuals
which by visual inspection should be bell-shaped, approximating the normal
distribution. A better method is the use of the normal probability plot (P-P
plot) which compares the standardised residuals with a normal distribution
which is represented by a straight diagonal line. If the distribution is normal,
then the residual line must closely follow this diagonal line (Hair et al., 1998).
As indicated in Field (2000), it is only when all these assumptions are met that
the model can be accurately applied to the population. All the assumptions
were thus tested as each multiple regression model was generated.
Multiple regression is a widely used multivariate technique in construction
management research. For example, Cheung et al. (2003) used this technique
to relate contract elements to partnering attributes; Phua and Rowlinson
(2004) used this approach to determine the extent to which intra- and inter-
organisational cooperation was affected by a number of cultural attributes;
and leader behaviours were regressed on employee work outcomes in Chan
and Chan (2005) revealing inter alia that all factors of transformational
leadership (except idealised behaviours) and contingent reward and
management by exception were positively related to all facets of employee
work outcomes. All these researches have sought to examine and model the
relationships between predictor and outcome variables, an aim which clearly
resonates with the aim of this research.

Culture and project performance
242
8.2 THE CULTURE – PERFORMANCE CORRELATION
Correlations measure how variables or rank orders are related. The bivariate
correlations procedure in SPSS was used to compute Pearson's correlation
coefficients with their significance levels. Pearson's correlation coefficient is a
measure of linear association (Field, 2000). It is useful for determining the
strength and direction of the association between two variables which could
be positively related, not related at all or negatively related (ibid).
Before calculating the correlation coefficients, the data was screened for
outliers (which can cause misleading results) and evidence of linear
relationships by plotting scatterplots of the various variables. A sample of
these scatterplots are shown in Appendix O. Although in some instances
outliers were evident (e.g. Figure 2, Appendix O), no logical reason could be
adduced to warrant exclusion, and therefore all the cases were included in
the analysis. Beyond the outliers, there was no evidence in the distribution of
the data points to suggest relationships other than linear between the
variables. This implies that tests of linear association between the variables
are appropriate. Table 8.1 shows the correlation matrix produced in this
analysis. It can be seen that with the exception of time and cost outcomes,
there is evidence to show that all the other performance outcomes, including
overall performance are related to one or other dimension of culture.
Satisfaction of participants is significantly and positively associated with the
workforce orientation (r = .299, p = .024) and the team orientation (r = .351, p
= .007). This implies that as workforce orientation on a project rises, the
satisfaction of project participants also rises. Likewise as the team orientation
on the project rises, so does the satisfaction of participants. These same
relationships were found in Zuo and Zillante (2006) which reported
significant correlations between the dimensions integration, cooperation and
people orientation and project team satisfaction.
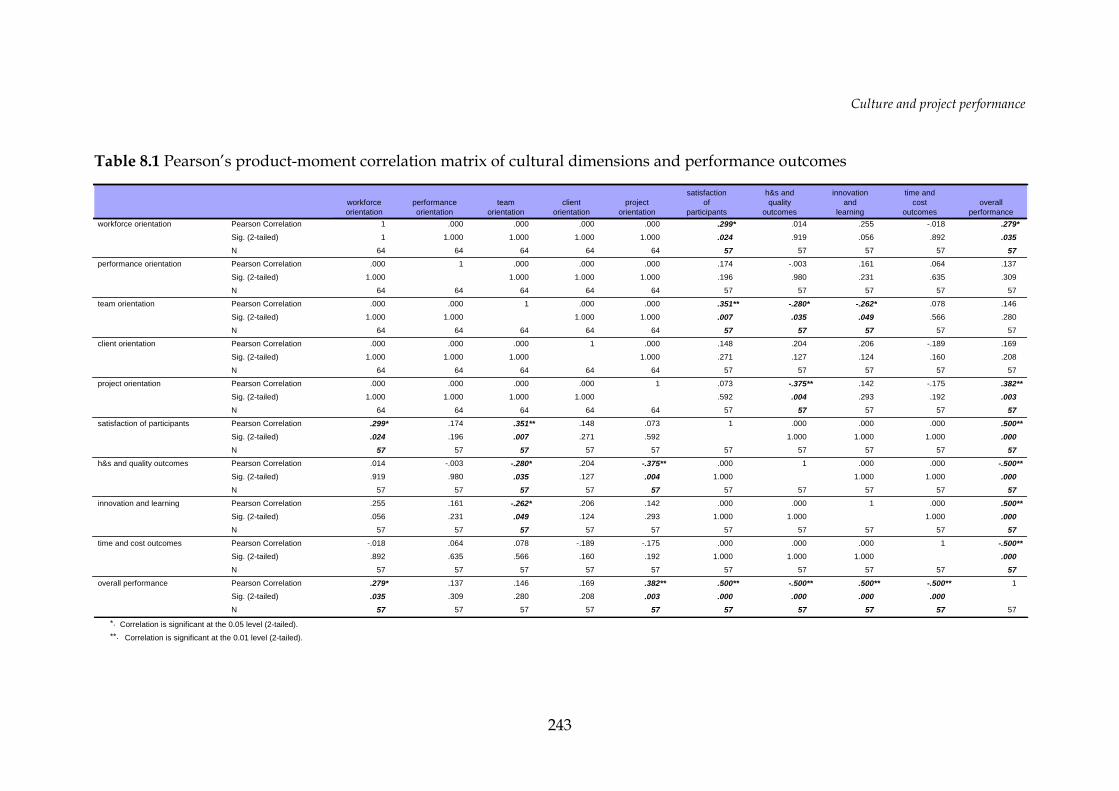
Culture and project performance
243
Table 8.1 Pearson’s product-moment correlation matrix of cultural dimensions and performance outcomes
1 .000 .000 .000 .000 .299* .014 .255 -.018 .279*1 1.000 1.000 1.000 1.000 .024 .919 .056 .892 .035
64 64 64 64 64 57 57 57 57 57.000 1 .000 .000 .000 .174 -.003 .161 .064 .137
1.000 1.000 1.000 1.000 .196 .980 .231 .635 .309
64 64 64 64 64 57 57 57 57 57
.000 .000 1 .000 .000 .351** -.280* -.262* .078 .146
1.000 1.000 1.000 1.000 .007 .035 .049 .566 .280
64 64 64 64 64 57 57 57 57 57
.000 .000 .000 1 .000 .148 .204 .206 -.189 .169
1.000 1.000 1.000 1.000 .271 .127 .124 .160 .208
64 64 64 64 64 57 57 57 57 57
.000 .000 .000 .000 1 .073 -.375** .142 -.175 .382**1.000 1.000 1.000 1.000 .592 .004 .293 .192 .003
64 64 64 64 64 57 57 57 57 57.299* .174 .351** .148 .073 1 .000 .000 .000 .500**.024 .196 .007 .271 .592 1.000 1.000 1.000 .000
57 57 57 57 57 57 57 57 57 57.014 -.003 -.280* .204 -.375** .000 1 .000 .000 -.500**.919 .980 .035 .127 .004 1.000 1.000 1.000 .000
57 57 57 57 57 57 57 57 57 57.255 .161 -.262* .206 .142 .000 .000 1 .000 .500**.056 .231 .049 .124 .293 1.000 1.000 1.000 .000
57 57 57 57 57 57 57 57 57 57-.018 .064 .078 -.189 -.175 .000 .000 .000 1 -.500**.892 .635 .566 .160 .192 1.000 1.000 1.000 .000
57 57 57 57 57 57 57 57 57 57.279* .137 .146 .169 .382** .500** -.500** .500** -.500** 1
.035 .309 .280 .208 .003 .000 .000 .000 .00057 57 57 57 57 57 57 57 57 57
Pearson Correlation
Sig. (2-tailed)
N
Pearson Correlation
Sig. (2-tailed)
N
Pearson Correlation
Sig. (2-tailed)
N
Pearson Correlation
Sig. (2-tailed)
N
Pearson Correlation
Sig. (2-tailed)
N
Pearson Correlation
Sig. (2-tailed)
N
Pearson Correlation
Sig. (2-tailed)
N
Pearson Correlation
Sig. (2-tailed)
N
Pearson Correlation
Sig. (2-tailed)
N
Pearson Correlation
Sig. (2-tailed)
N
workforce orientation
performance orientation
team orientation
client orientation
project orientation
satisfaction of participants
h&s and quality outcomes
innovation and learning
time and cost outcomes
overall performance
workforceorientation
performanceorientation
teamorientation
clientorientation
projectorientation
satisfactionof
participants
h&s andquality
outcomes
innovationand
learning
time andcost
outcomesoverall
performance
Correlation is significant at the 0.05 level (2-tailed).*.
Correlation is significant at the 0.01 level (2-tailed).**.
Culture and project performance
244
H&S and quality outcomes are significantly and negatively related to team
orientation (r = -.280, p = .035) and the project orientation (r = -.375, p = .004).
This means that as both the team and project orientations improve, H&S and
quality also improves. Innovation and learning outcomes are significantly
and negatively related to team orientation (r = -.262, p = .049), which means
that higher team orientations were associated with lower levels of innovation
and learning. Overall performance is significantly and positively related to
workforce orientation (r = .279, p = .035) and project orientation (r = .382, p =
.003). This means that as workforce orientation and project orientation
improves on construction projects, so does the overall performance.
Interestingly, there was no evidence found in the data to suggest that there is
an association between the dimensions of performance orientation and client
orientation and any of the measures of performance.
Whilst none of the relationships exposed in the correlation matrix confirm
causality per se for reasons discussed in Field (2000) such as the third variable
problem, they may be indicative of underlying causal relationships and as
such require further exploration. What they do confirm however is that there
are significant linear relationships. Where the relationship is positive, an
increase in one variable will correspond with an increase in the other
variable, and where the relationship is negative, an increase in one variable
will correspond with a decrease in the other variable. It can therefore be
inferred from the results that there is sufficient evidence of linear
relationships to proceed with the regression modelling.
8.3 MODELLING THE RELATIONSHIP BETWEEN CULTURE AND PERFORMANCE
It has been noted in Field (2000) that whilst correlations are a useful research
tool for examining the relationships between variables, they provide little
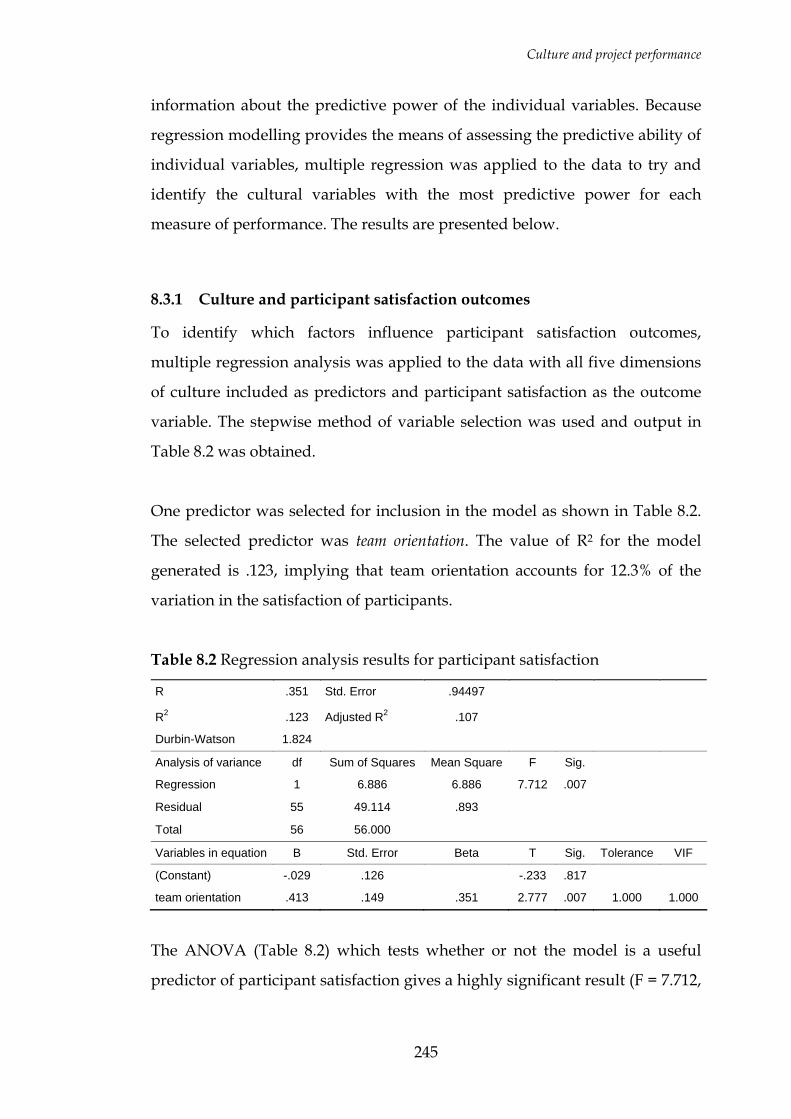
Culture and project performance
245
information about the predictive power of the individual variables. Because
regression modelling provides the means of assessing the predictive ability of
individual variables, multiple regression was applied to the data to try and
identify the cultural variables with the most predictive power for each
measure of performance. The results are presented below.
8.3.1 Culture and participant satisfaction outcomes
To identify which factors influence participant satisfaction outcomes,
multiple regression analysis was applied to the data with all five dimensions
of culture included as predictors and participant satisfaction as the outcome
variable. The stepwise method of variable selection was used and output in
Table 8.2 was obtained.
One predictor was selected for inclusion in the model as shown in Table 8.2.
The selected predictor was team orientation. The value of R2 for the model
generated is .123, implying that team orientation accounts for 12.3% of the
variation in the satisfaction of participants.
Table 8.2 Regression analysis results for participant satisfaction
R .351 Std. Error .94497
R2 .123 Adjusted R2 .107
Durbin-Watson 1.824
Analysis of variance df Sum of Squares Mean Square F Sig.
Regression 1 6.886 6.886 7.712 .007
Residual 55 49.114 .893
Total 56 56.000
Variables in equation B Std. Error Beta T Sig. Tolerance VIF
(Constant) -.029 .126 -.233 .817
team orientation .413 .149 .351 2.777 .007 1.000 1.000
The ANOVA (Table 8.2) which tests whether or not the model is a useful
predictor of participant satisfaction gives a highly significant result (F = 7.712,
Culture and project performance
246
p = .007), indicating that this model significantly improves the prediction of
satisfaction of participants.
Table 8.2 also provides the actual parameters of the regression model. From
this table, the final regression equation for participant satisfaction can be
presented as:
PARTICIPANT SATISFACTION = -.029 + .413 (TEAM ORIENTATION)
The predictor team orientation, clearly makes a significant contribution to this
model (t = 2.777, p = .007), and the VIF (variance inflation factor) of 1.000
obtained indicates that there is no collinearity within the data (Field, 2000).
The four other variables eliminated through the regression were (i) workforce
orientation, (ii) client orientation, (iii) performance orientation, and (iv)
project orientation.
8.3.1.1 Testing the assumptions of regression
To test the assumptions of the regression, an analysis of residuals was
undertaken. Plots of the residuals are shown in Figures 8.1, 8.2 and 8.3. The
histogram shows a bell-shaped distribution indicating that the assumption of
normality has not been violated. The normal probability plot of expected
cumulative probability against observed cumulative probability also shows
points generally lying close to the straight line indicating that the residuals
are approximately normally distributed thus confirming the conclusions
drawn from histogram.
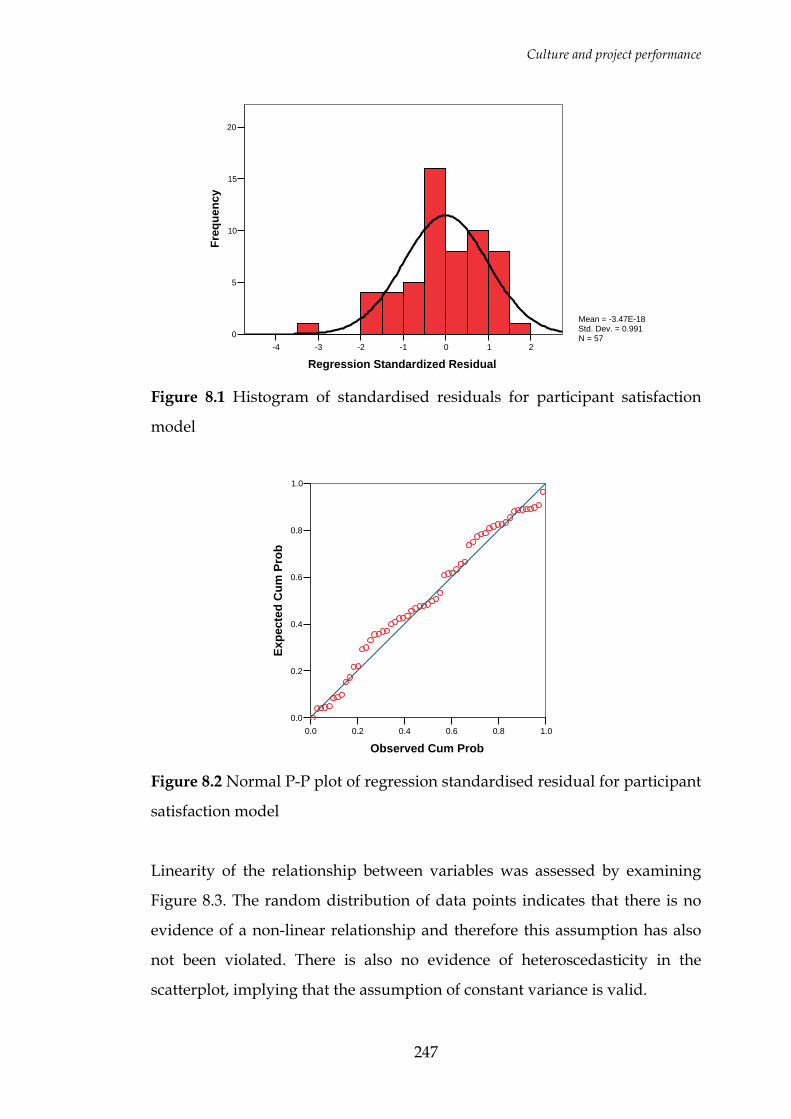
Culture and project performance
247
210-1-2-3-4
Regression Standardized Residual
20
15
10
5
0
Freq
uenc
y
Mean = -3.47E-18Std. Dev. = 0.991N = 57
Figure 8.1 Histogram of standardised residuals for participant satisfaction
model
1.00.80.60.40.20.0
Observed Cum Prob
1.0
0.8
0.6
0.4
0.2
0.0
Expe
cted
Cum
Pro
b
Figure 8.2 Normal P-P plot of regression standardised residual for participant
satisfaction model
Linearity of the relationship between variables was assessed by examining
Figure 8.3. The random distribution of data points indicates that there is no
evidence of a non-linear relationship and therefore this assumption has also
not been violated. There is also no evidence of heteroscedasticity in the
scatterplot, implying that the assumption of constant variance is valid.

Culture and project performance
248
3210-1-2
Regression Standardized Predicted Value
2
1
0
-1
-2
-3
-4
Reg
ress
ion
Stan
dard
ized
Res
idua
l
Figure 8.3 Scatterplot of standardised residual against predicted value for
participant satisfaction model
To test for the independence of the error terms, the Durbin-Watson statistic
was obtained (Table 8.2). Its value of 1.824 is very close to 2 indicating that
this assumption has also not been violated.
Taken together, these findings indicate that the regression model produced is
an accurate and valid representation of the data and can be applied to the
population.
8.3.1.2 Discussion
The multiple regression analysis revealed that higher levels of team
orientation are associated with higher levels of participant satisfaction. Whilst
this does not prove causality, it is significant that the projects with higher
levels of team orientation are also the ones with the higher levels of
participant satisfaction. These results may indeed be indicative of an
underlying causal relationship and therefore require deeper examination.
Indeed team orientation is not the only important cultural factor but also
workforce orientation as revealed by the correlation matrix.
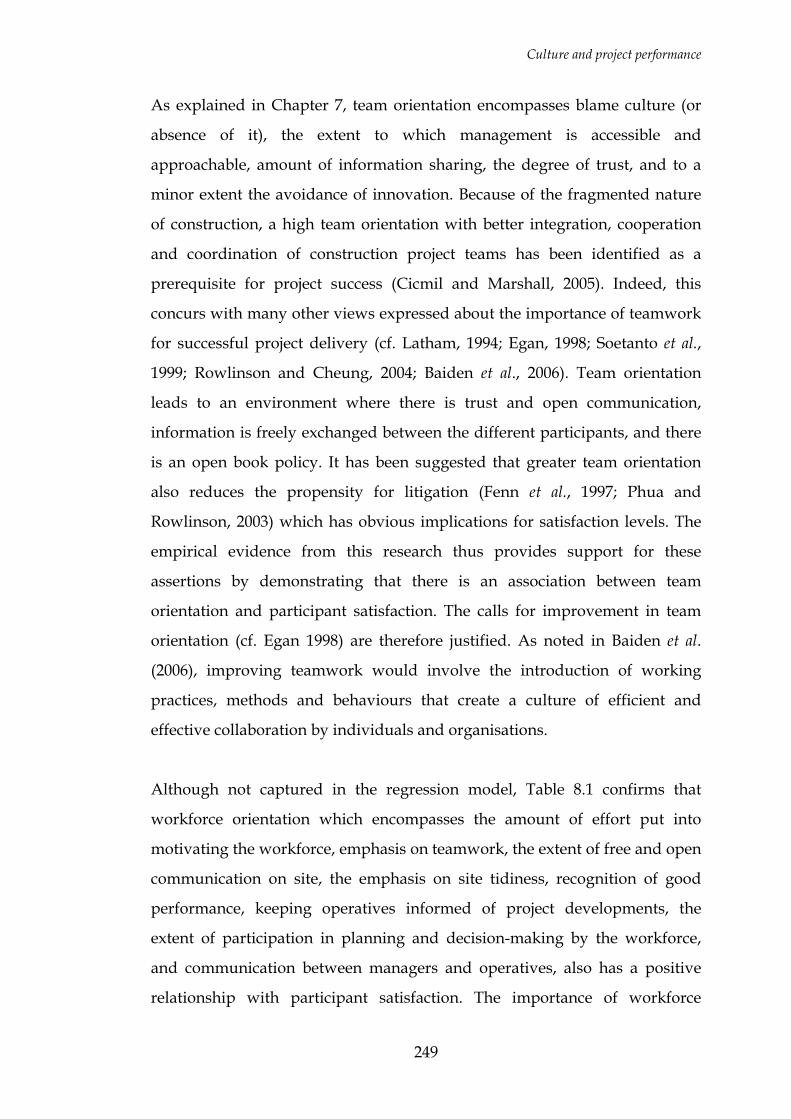
Culture and project performance
249
As explained in Chapter 7, team orientation encompasses blame culture (or
absence of it), the extent to which management is accessible and
approachable, amount of information sharing, the degree of trust, and to a
minor extent the avoidance of innovation. Because of the fragmented nature
of construction, a high team orientation with better integration, cooperation
and coordination of construction project teams has been identified as a
prerequisite for project success (Cicmil and Marshall, 2005). Indeed, this
concurs with many other views expressed about the importance of teamwork
for successful project delivery (cf. Latham, 1994; Egan, 1998; Soetanto et al.,
1999; Rowlinson and Cheung, 2004; Baiden et al., 2006). Team orientation
leads to an environment where there is trust and open communication,
information is freely exchanged between the different participants, and there
is an open book policy. It has been suggested that greater team orientation
also reduces the propensity for litigation (Fenn et al., 1997; Phua and
Rowlinson, 2003) which has obvious implications for satisfaction levels. The
empirical evidence from this research thus provides support for these
assertions by demonstrating that there is an association between team
orientation and participant satisfaction. The calls for improvement in team
orientation (cf. Egan 1998) are therefore justified. As noted in Baiden et al.
(2006), improving teamwork would involve the introduction of working
practices, methods and behaviours that create a culture of efficient and
effective collaboration by individuals and organisations.
Although not captured in the regression model, Table 8.1 confirms that
workforce orientation which encompasses the amount of effort put into
motivating the workforce, emphasis on teamwork, the extent of free and open
communication on site, the emphasis on site tidiness, recognition of good
performance, keeping operatives informed of project developments, the
extent of participation in planning and decision-making by the workforce,
and communication between managers and operatives, also has a positive
relationship with participant satisfaction. The importance of workforce
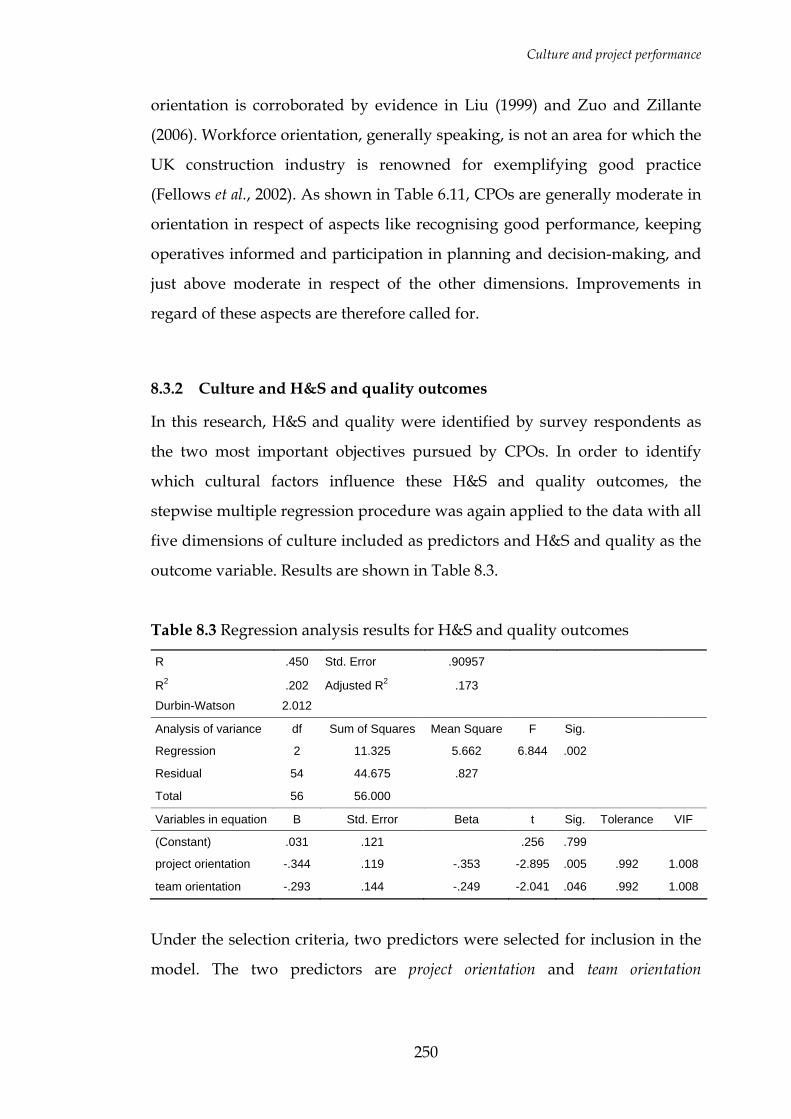
Culture and project performance
250
orientation is corroborated by evidence in Liu (1999) and Zuo and Zillante
(2006). Workforce orientation, generally speaking, is not an area for which the
UK construction industry is renowned for exemplifying good practice
(Fellows et al., 2002). As shown in Table 6.11, CPOs are generally moderate in
orientation in respect of aspects like recognising good performance, keeping
operatives informed and participation in planning and decision-making, and
just above moderate in respect of the other dimensions. Improvements in
regard of these aspects are therefore called for.
8.3.2 Culture and H&S and quality outcomes
In this research, H&S and quality were identified by survey respondents as
the two most important objectives pursued by CPOs. In order to identify
which cultural factors influence these H&S and quality outcomes, the
stepwise multiple regression procedure was again applied to the data with all
five dimensions of culture included as predictors and H&S and quality as the
outcome variable. Results are shown in Table 8.3.
Table 8.3 Regression analysis results for H&S and quality outcomes
R .450 Std. Error .90957
R2 .202 Adjusted R2 .173
Durbin-Watson 2.012
Analysis of variance df Sum of Squares Mean Square F Sig.
Regression 2 11.325 5.662 6.844 .002
Residual 54 44.675 .827
Total 56 56.000
Variables in equation B Std. Error Beta t Sig. Tolerance VIF
(Constant) .031 .121 .256 .799
project orientation -.344 .119 -.353 -2.895 .005 .992 1.008
team orientation -.293 .144 -.249 -2.041 .046 .992 1.008
Under the selection criteria, two predictors were selected for inclusion in the
model. The two predictors are project orientation and team orientation
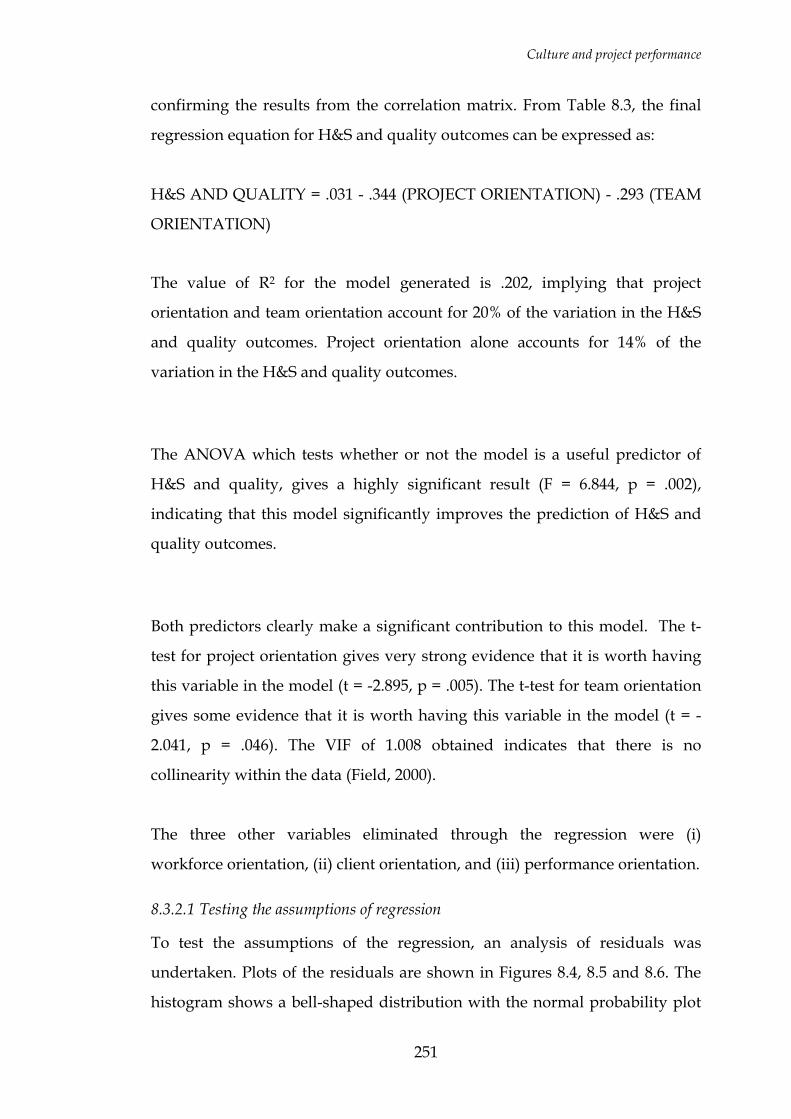
Culture and project performance
251
confirming the results from the correlation matrix. From Table 8.3, the final
regression equation for H&S and quality outcomes can be expressed as:
H&S AND QUALITY = .031 - .344 (PROJECT ORIENTATION) - .293 (TEAM
ORIENTATION)
The value of R2 for the model generated is .202, implying that project
orientation and team orientation account for 20% of the variation in the H&S
and quality outcomes. Project orientation alone accounts for 14% of the
variation in the H&S and quality outcomes.
The ANOVA which tests whether or not the model is a useful predictor of
H&S and quality, gives a highly significant result (F = 6.844, p = .002),
indicating that this model significantly improves the prediction of H&S and
quality outcomes.
Both predictors clearly make a significant contribution to this model. The t-
test for project orientation gives very strong evidence that it is worth having
this variable in the model (t = -2.895, p = .005). The t-test for team orientation
gives some evidence that it is worth having this variable in the model (t = -
2.041, p = .046). The VIF of 1.008 obtained indicates that there is no
collinearity within the data (Field, 2000).
The three other variables eliminated through the regression were (i)
workforce orientation, (ii) client orientation, and (iii) performance orientation.
8.3.2.1 Testing the assumptions of regression
To test the assumptions of the regression, an analysis of residuals was
undertaken. Plots of the residuals are shown in Figures 8.4, 8.5 and 8.6. The
histogram shows a bell-shaped distribution with the normal probability plot
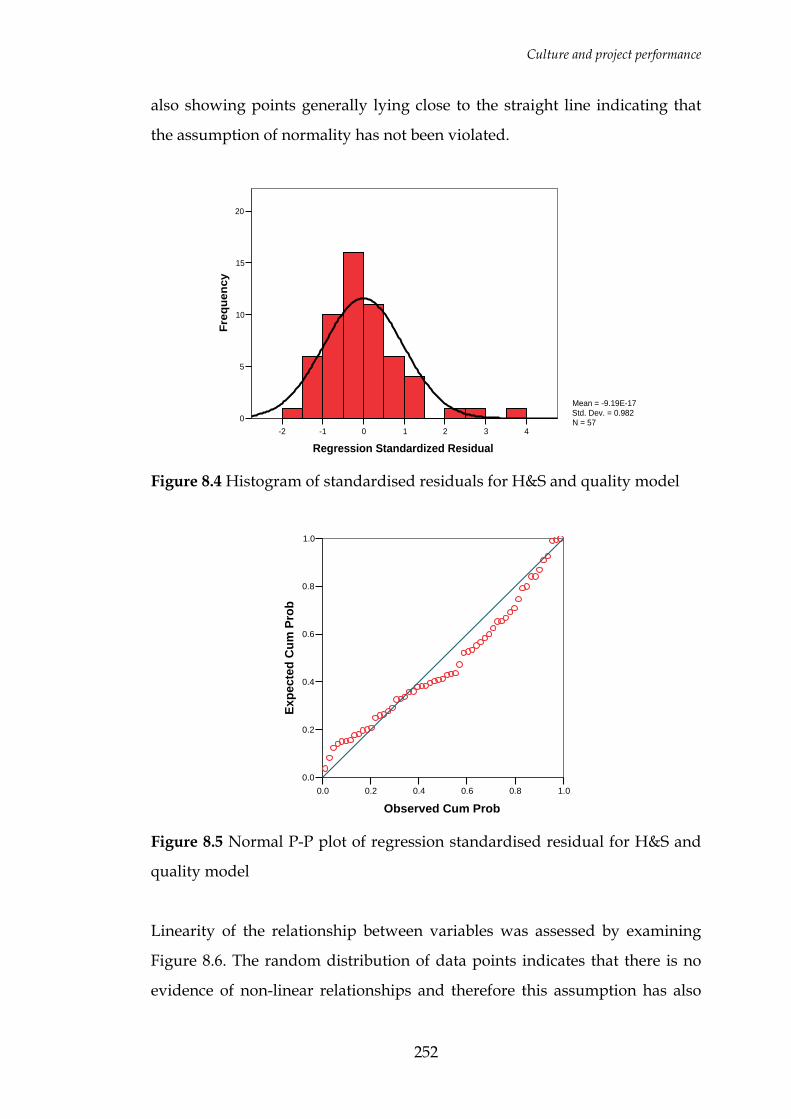
Culture and project performance
252
also showing points generally lying close to the straight line indicating that
the assumption of normality has not been violated.
43210-1-2
Regression Standardized Residual
20
15
10
5
0
Freq
uenc
y
Mean = -9.19E-17Std. Dev. = 0.982N = 57
Figure 8.4 Histogram of standardised residuals for H&S and quality model
1.00.80.60.40.20.0
Observed Cum Prob
1.0
0.8
0.6
0.4
0.2
0.0
Expe
cted
Cum
Pro
b
Figure 8.5 Normal P-P plot of regression standardised residual for H&S and
quality model
Linearity of the relationship between variables was assessed by examining
Figure 8.6. The random distribution of data points indicates that there is no
evidence of non-linear relationships and therefore this assumption has also
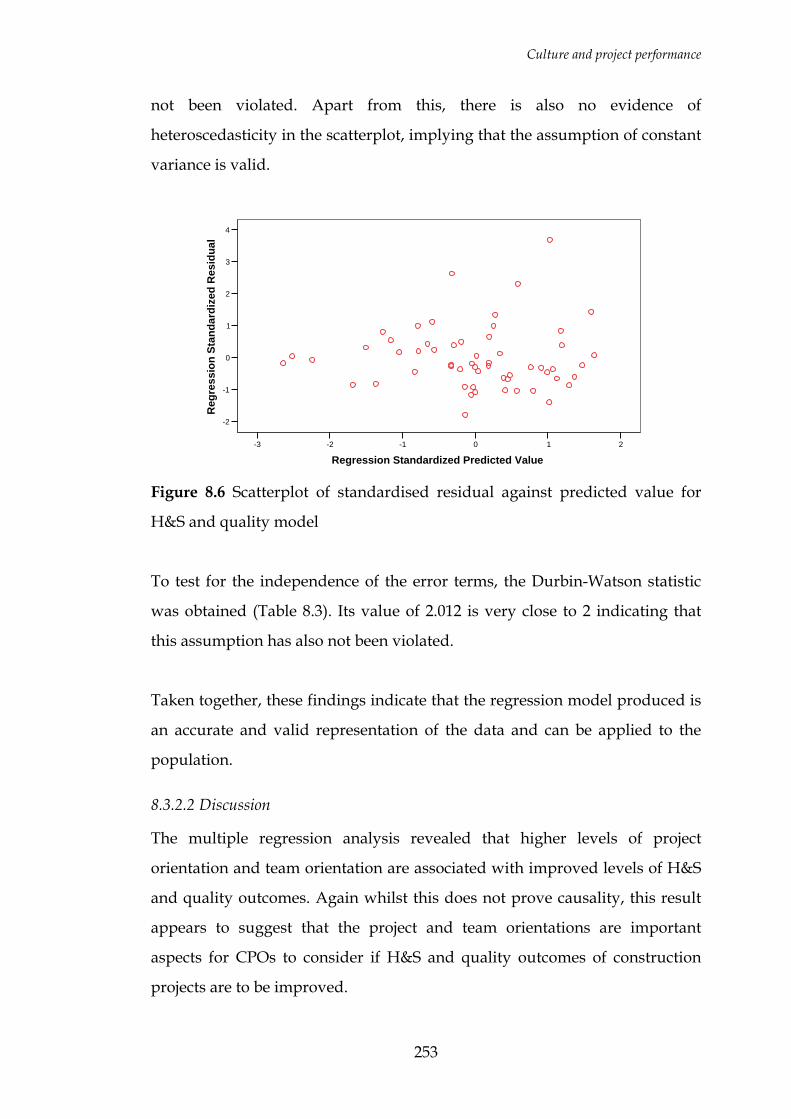
Culture and project performance
253
not been violated. Apart from this, there is also no evidence of
heteroscedasticity in the scatterplot, implying that the assumption of constant
variance is valid.
210-1-2-3
Regression Standardized Predicted Value
4
3
2
1
0
-1
-2
Reg
ress
ion
Stan
dard
ized
Res
idua
l
Figure 8.6 Scatterplot of standardised residual against predicted value for
H&S and quality model
To test for the independence of the error terms, the Durbin-Watson statistic
was obtained (Table 8.3). Its value of 2.012 is very close to 2 indicating that
this assumption has also not been violated.
Taken together, these findings indicate that the regression model produced is
an accurate and valid representation of the data and can be applied to the
population.
8.3.2.2 Discussion
The multiple regression analysis revealed that higher levels of project
orientation and team orientation are associated with improved levels of H&S
and quality outcomes. Again whilst this does not prove causality, this result
appears to suggest that the project and team orientations are important
aspects for CPOs to consider if H&S and quality outcomes of construction
projects are to be improved.

Culture and project performance
254
The H&S and quality outcomes of a construction project relates to accidents
reported, injuries occurring, near misses reported, extent of defects, and the
level of absenteeism. Higher project and team orientations are therefore
associated with a reduction in the numbers associated with these occurrences.
Higher project orientation implies that project participants identify more with
the project, there is less subcontracting (greater use of direct labour), and
more effort is put into waste elimination. One plausible reason for this
association with better H&S and quality outcomes, borrowing from findings
in Hsieh (1998), is that project orientation which encompasses housekeeping
on-site worsens with an increase in subcontracting. Subcontractors are
notorious for poor housekeeping, a fact even noted by interviewees (during
the qualitative phase of this research) when one of them stated in reference to
subcontractors that “they’ll always make a mess”. Housekeeping includes waste
cleanup, organisation of tools and materials, inspection of stairs, passageways
and openings, and maintenance of site utilities such as electrical power,
water, gas, toilet, drainage, and lighting (Hsieh, 1998). These aspects if not
properly attended to, can increase ‘opportunities’ for accidents and therefore
have negative consequences on H&S on site as found in Sawacha et al. (1999),
and also lead to loss of motivation and consequently absenteeism.
Typically, the relationship between contractors and subcontractors is
“traditional, cost-driven, and potentially adversarial” (Greenwood, 2001). It
has also been found that subcontractors often have different objectives and
aspirations (Riley and Clare-Brown, 2001). From this it can be inferred that
lower project orientation often associated with greater levels of
subcontracting will lead to greater segregation or “islands” (Hsieh, 1998) and
more pronounced out-group discrimination (Phua and Rowlinson, 2004). The
effect of this is that participants take less responsibility for the H&S of
workers who belong to the out-group and are less likely to take any action if
for instance they find them working unsafely. Besides these issues, because of
the financial burdens often imposed on subcontractors as a result of risk
Culture and project performance
255
shedding by the main contractor (Hsieh, 1998; Costantino et al., 2001),
subcontractors tend not to value work ethics, invest in human resources,
upgrade managerial ability, and skills and technology advancement (Hsieh,
1998). It is therefore not surprising that quality also suffers when project
orientation declines. This finding is supported by Love and Heng (2000)
which also found that damage by subcontractors and poor workmanship
were the primary causes of defects.
As explained earlier, team orientation has to do with better integration, active
cooperation and coordination of construction project teams. Its association
with H&S and quality outcomes is also supported by previous research in
this domain. Thomas et al. (2002) for instance posit that teamwork within the
supply chain is essential for the achievement of planned quality outcomes,
with greater levels of teamwork leading to improved quality outcomes. It has
also been argued in Xiao and Proverbs (2002c) that a culture dominated by
short-term financial considerations and reflected in uncooperative,
antagonistic and suspicious relationships with accusations, recriminations
and blame common, as found by Shammas-Toma et al. (1998), undoubtedly
has a negative influence on the quality performance of UK contractors. The
evidence from this research provides support for this thesis as shown by the
regression model above. With greater levels of team orientation, participants
are also more likely to take responsibility for each others welfare and as such
are unlikely to walk by unconcerned if they find other participants working
unsafely, hence the positive and significant association between team
orientation and performance outcomes.
8.3.3 Culture and innovation and learning outcomes
In this research, innovation and learning were generally rated as moderate, a
reflection of the slow rate of change within construction. In order to identify
which cultural factors were most significantly related to these innovation and
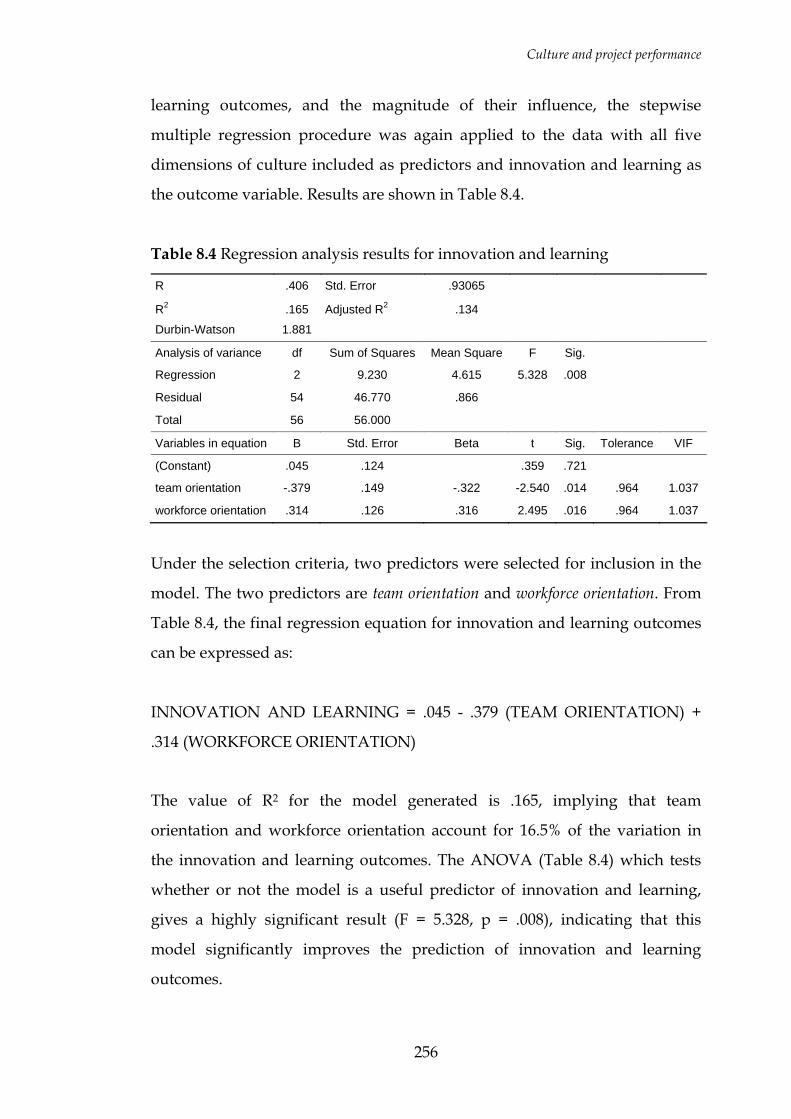
Culture and project performance
256
learning outcomes, and the magnitude of their influence, the stepwise
multiple regression procedure was again applied to the data with all five
dimensions of culture included as predictors and innovation and learning as
the outcome variable. Results are shown in Table 8.4.
Table 8.4 Regression analysis results for innovation and learning
R .406 Std. Error .93065
R2 .165 Adjusted R2 .134
Durbin-Watson 1.881
Analysis of variance df Sum of Squares Mean Square F Sig.
Regression 2 9.230 4.615 5.328 .008
Residual 54 46.770 .866
Total 56 56.000
Variables in equation B Std. Error Beta t Sig. Tolerance VIF
(Constant) .045 .124 .359 .721
team orientation -.379 .149 -.322 -2.540 .014 .964 1.037
workforce orientation .314 .126 .316 2.495 .016 .964 1.037
Under the selection criteria, two predictors were selected for inclusion in the
model. The two predictors are team orientation and workforce orientation. From
Table 8.4, the final regression equation for innovation and learning outcomes
can be expressed as:
INNOVATION AND LEARNING = .045 - .379 (TEAM ORIENTATION) +
.314 (WORKFORCE ORIENTATION)
The value of R2 for the model generated is .165, implying that team
orientation and workforce orientation account for 16.5% of the variation in
the innovation and learning outcomes. The ANOVA (Table 8.4) which tests
whether or not the model is a useful predictor of innovation and learning,
gives a highly significant result (F = 5.328, p = .008), indicating that this
model significantly improves the prediction of innovation and learning
outcomes.
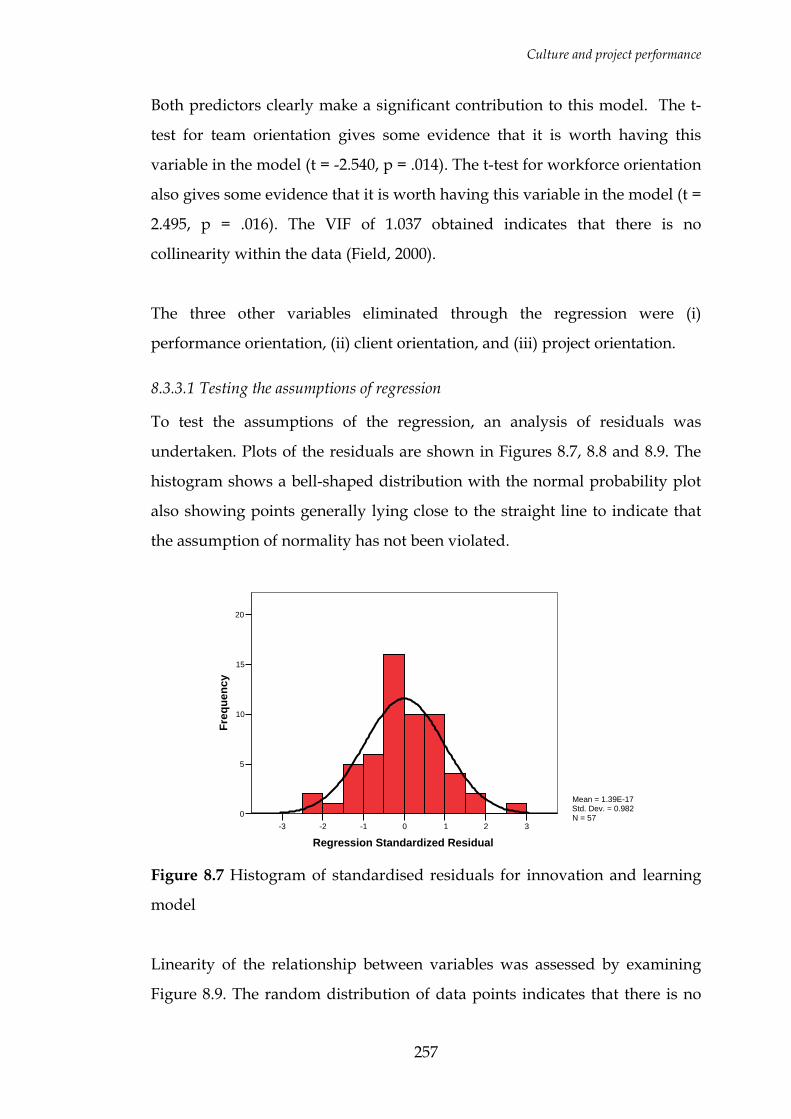
Culture and project performance
257
Both predictors clearly make a significant contribution to this model. The t-
test for team orientation gives some evidence that it is worth having this
variable in the model (t = -2.540, p = .014). The t-test for workforce orientation
also gives some evidence that it is worth having this variable in the model (t =
2.495, p = .016). The VIF of 1.037 obtained indicates that there is no
collinearity within the data (Field, 2000).
The three other variables eliminated through the regression were (i)
performance orientation, (ii) client orientation, and (iii) project orientation.
8.3.3.1 Testing the assumptions of regression
To test the assumptions of the regression, an analysis of residuals was
undertaken. Plots of the residuals are shown in Figures 8.7, 8.8 and 8.9. The
histogram shows a bell-shaped distribution with the normal probability plot
also showing points generally lying close to the straight line to indicate that
the assumption of normality has not been violated.
3210-1-2-3
Regression Standardized Residual
20
15
10
5
0
Freq
uenc
y
Mean = 1.39E-17Std. Dev. = 0.982N = 57
Figure 8.7 Histogram of standardised residuals for innovation and learning
model
Linearity of the relationship between variables was assessed by examining
Figure 8.9. The random distribution of data points indicates that there is no

Culture and project performance
258
evidence of non-linear relationships and therefore this assumption has also
not been violated. Apart from this, there is also no evidence of
heteroscedasticity in the scatterplot, implying that the assumption of constant
variance is valid.
1.00.80.60.40.20.0
Observed Cum Prob
1.0
0.8
0.6
0.4
0.2
0.0
Expe
cted
Cum
Pro
b
Figure 8.8 Normal P-P plot of regression standardised residual for innovation
and learning model
210-1-2-3
Regression Standardized Predicted Value
3
2
1
0
-1
-2
-3
Reg
ress
ion
Stan
dard
ized
Res
idua
l
Figure 8.9 Scatterplot of standardised residual against predicted value for
innovation and learning model
To test for the independence of the error terms, the Durbin-Watson statistic
was obtained (Table 8.4). Its value of 1.881 is very close to 2 indicating that
this assumption has also not been violated.
Culture and project performance
259
Taken together, these findings indicate that the regression model produced is
an accurate and valid representation of the data which can be applied to the
population.
8.3.3.2 Discussion
The multiple regression analysis revealed that higher levels of team
orientation are associated with lower levels of innovation and learning. This
represents perhaps one of the most surprising findings of this survey, as it
seems to suggest that high levels of innovation and learning cannot be
achieved without compromising team orientation. Although this outcome
appears to contradict logical thinking (cf. Kululanga et al., 2001), there are
logical reasons why such an outcome is evident in the projects sampled. To
some extent this finding can be attributed to the fact that learning normally
takes place in the face of the mistakes and failures that often accompany
attempts to be creative or innovative. Unfortunately, with a high risk low
margin industry like construction, mistakes are not acceptable. Consequently,
as CPOs strive to maintain or improve team orientation, conscious efforts are
made to avoid errors and mistakes and this inevitably stifles creativity,
innovation and learning. This finding is also possibly a reflection of the
unconstructive manner in which conflicts are handled (Hartmann, 2006). It
should also be recalled that by definition (refer Chapter 6) team orientation
also encapsulates the avoidance of innovation.
Workforce orientation on the other hand was found to be positively
associated with innovation and learning. As workforce orientation improves
CPOs exhibit greater levels of innovation and learning. As noted in
Kululanga et al. (2001), some of the factors that support learning and in
particular reflective or generative learning include a climate of openness,
rewarding innovations, leadership commitment to learning, a common sense
of direction, encouragement of employees to update their values. Hartman
Culture and project performance
260
(2006) also identifies similar factors as advantageous for innovation. These
factors are all key aspects of workforce orientation (Chapter 7 refer),
explaining why workforce orientation is directly associated with the amount
of innovation and learning that takes place. Indeed, the cultural dimension of
learning on the project is also one of the dimensions subsumed under
workforce orientation (Table 6.14). The greater the emphasis on these
dimensions, the greater the innovation and learning outcomes on the project.
8.3.4 Culture and time and cost outcomes
To identify which factors influence time and cost outcomes, the multiple
regression analysis was repeated with all five dimensions of culture included
as predictors and time and cost outcomes included as the outcome variable.
Here also, stepwise regression was applied as the method of variable
selection.
The stepwise regression failed to identify and include any of the variables in a
model to predict the time and cost outcomes, confirming the correlation
matrix results (Table 8.1). It can be suggested from this result that cultural
orientations are not very useful predictors of time and cost outcomes. This
finding also reflects the fact that perhaps other factors not considered in this
research are more critical in determining time and cost outcomes of a
construction project. Examples of some of the factors catalogued in existing
research include design changes, labour productivity, planning, resources,
inflation, errors in taking-off, project complexity, time devoted by project
manager, frequency of meetings, monetary incentives to designer,
implementation of constructability programme, and project manager’s
experience on similar projects (Kaming et al., 1997; Kog et al., 1999). In this
research as highlighted in Chapter 8, respondents identified variations,
making good defects, poor project management, inclement weather and
labour problems as some of the factors determining time and cost outcomes.
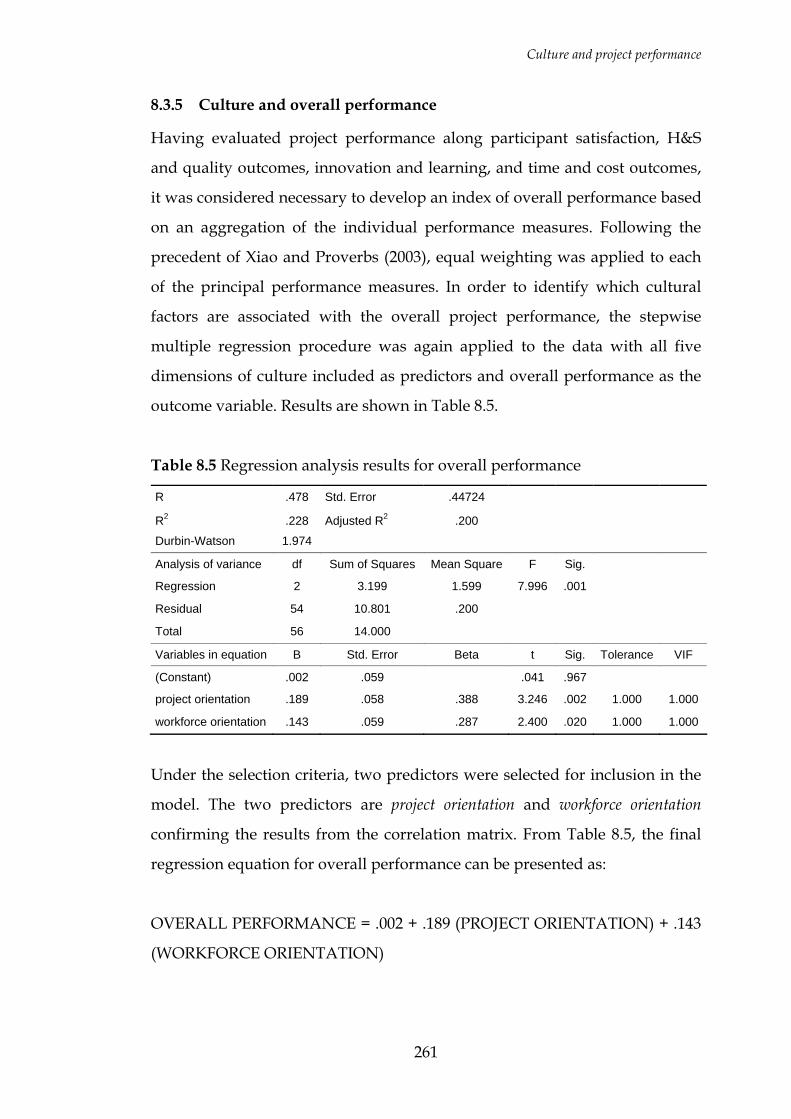
Culture and project performance
261
8.3.5 Culture and overall performance
Having evaluated project performance along participant satisfaction, H&S
and quality outcomes, innovation and learning, and time and cost outcomes,
it was considered necessary to develop an index of overall performance based
on an aggregation of the individual performance measures. Following the
precedent of Xiao and Proverbs (2003), equal weighting was applied to each
of the principal performance measures. In order to identify which cultural
factors are associated with the overall project performance, the stepwise
multiple regression procedure was again applied to the data with all five
dimensions of culture included as predictors and overall performance as the
outcome variable. Results are shown in Table 8.5.
Table 8.5 Regression analysis results for overall performance
R .478 Std. Error .44724
R2 .228 Adjusted R2 .200
Durbin-Watson 1.974
Analysis of variance df Sum of Squares Mean Square F Sig.
Regression 2 3.199 1.599 7.996 .001
Residual 54 10.801 .200
Total 56 14.000
Variables in equation B Std. Error Beta t Sig. Tolerance VIF
(Constant) .002 .059 .041 .967
project orientation .189 .058 .388 3.246 .002 1.000 1.000
workforce orientation .143 .059 .287 2.400 .020 1.000 1.000
Under the selection criteria, two predictors were selected for inclusion in the
model. The two predictors are project orientation and workforce orientation
confirming the results from the correlation matrix. From Table 8.5, the final
regression equation for overall performance can be presented as:
OVERALL PERFORMANCE = .002 + .189 (PROJECT ORIENTATION) + .143
(WORKFORCE ORIENTATION)
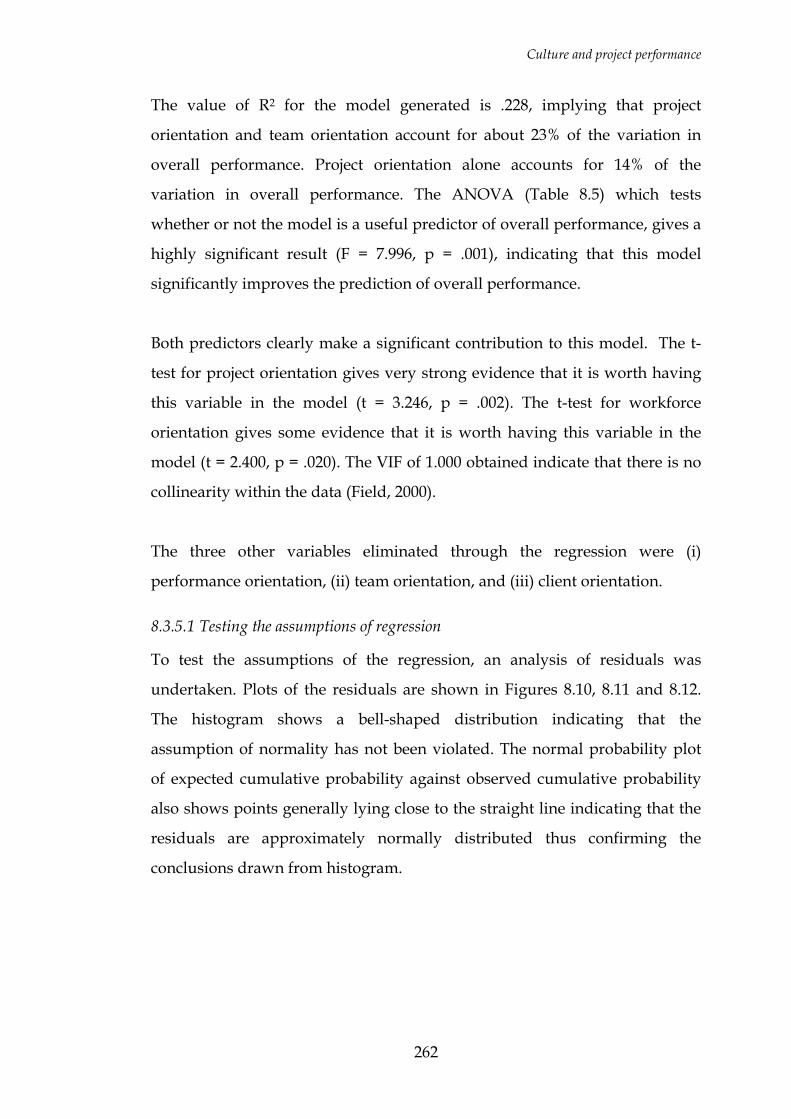
Culture and project performance
262
The value of R2 for the model generated is .228, implying that project
orientation and team orientation account for about 23% of the variation in
overall performance. Project orientation alone accounts for 14% of the
variation in overall performance. The ANOVA (Table 8.5) which tests
whether or not the model is a useful predictor of overall performance, gives a
highly significant result (F = 7.996, p = .001), indicating that this model
significantly improves the prediction of overall performance.
Both predictors clearly make a significant contribution to this model. The t-
test for project orientation gives very strong evidence that it is worth having
this variable in the model (t = 3.246, p = .002). The t-test for workforce
orientation gives some evidence that it is worth having this variable in the
model (t = 2.400, p = .020). The VIF of 1.000 obtained indicate that there is no
collinearity within the data (Field, 2000).
The three other variables eliminated through the regression were (i)
performance orientation, (ii) team orientation, and (iii) client orientation.
8.3.5.1 Testing the assumptions of regression
To test the assumptions of the regression, an analysis of residuals was
undertaken. Plots of the residuals are shown in Figures 8.10, 8.11 and 8.12.
The histogram shows a bell-shaped distribution indicating that the
assumption of normality has not been violated. The normal probability plot
of expected cumulative probability against observed cumulative probability
also shows points generally lying close to the straight line indicating that the
residuals are approximately normally distributed thus confirming the
conclusions drawn from histogram.
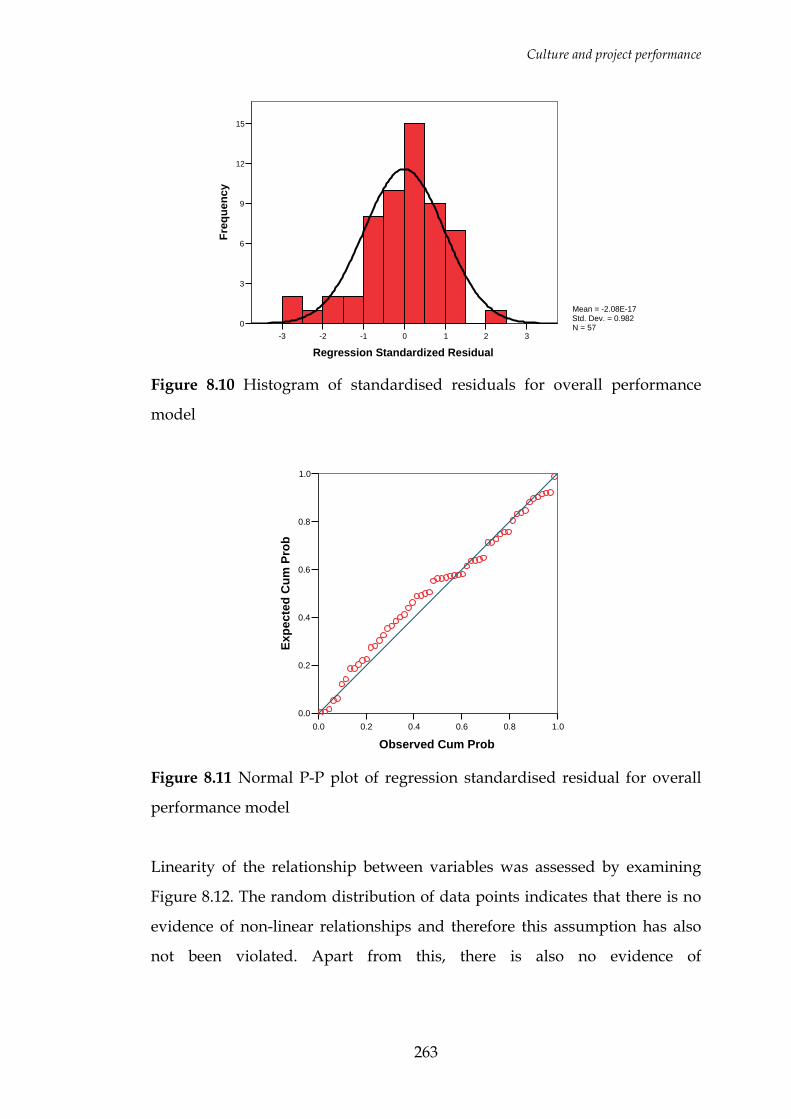
Culture and project performance
263
3210-1-2-3
Regression Standardized Residual
15
12
9
6
3
0
Freq
uenc
y
Mean = -2.08E-17Std. Dev. = 0.982N = 57
Figure 8.10 Histogram of standardised residuals for overall performance
model
1.00.80.60.40.20.0
Observed Cum Prob
1.0
0.8
0.6
0.4
0.2
0.0
Expe
cted
Cum
Pro
b
Figure 8.11 Normal P-P plot of regression standardised residual for overall
performance model
Linearity of the relationship between variables was assessed by examining
Figure 8.12. The random distribution of data points indicates that there is no
evidence of non-linear relationships and therefore this assumption has also
not been violated. Apart from this, there is also no evidence of
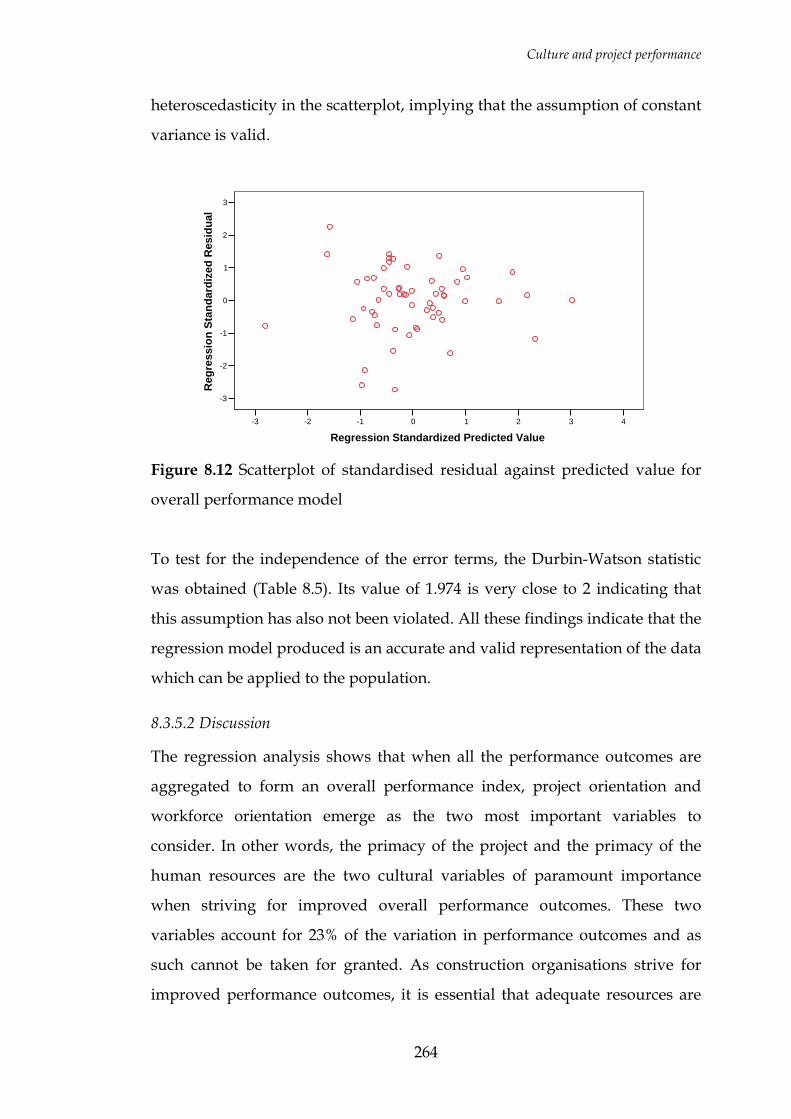
Culture and project performance
264
heteroscedasticity in the scatterplot, implying that the assumption of constant
variance is valid.
43210-1-2-3
Regression Standardized Predicted Value
3
2
1
0
-1
-2
-3
Reg
ress
ion
Stan
dard
ized
Res
idua
l
Figure 8.12 Scatterplot of standardised residual against predicted value for
overall performance model
To test for the independence of the error terms, the Durbin-Watson statistic
was obtained (Table 8.5). Its value of 1.974 is very close to 2 indicating that
this assumption has also not been violated. All these findings indicate that the
regression model produced is an accurate and valid representation of the data
which can be applied to the population.
8.3.5.2 Discussion
The regression analysis shows that when all the performance outcomes are
aggregated to form an overall performance index, project orientation and
workforce orientation emerge as the two most important variables to
consider. In other words, the primacy of the project and the primacy of the
human resources are the two cultural variables of paramount importance
when striving for improved overall performance outcomes. These two
variables account for 23% of the variation in performance outcomes and as
such cannot be taken for granted. As construction organisations strive for
improved performance outcomes, it is essential that adequate resources are
Culture and project performance
265
devoted towards the improvement of project orientation and workforce
orientation. Researchers looking into project or contractor performance must
also address these aspects in order to evolve comprehensive frameworks for
performance improvement.
This is not however to suggest that the other dimensions of culture i.e.
performance orientation, team orientation and client orientation are not
important. What it does indicate though is that there was insufficient
evidence to establish their degree of importance.
8.4 VALIDATION OF MODELS
Having developed the models showing the impact of culture on project
performance outcomes, there is a further requirement to test the
generalisability and transferability of the results to the wider population of
construction projects. This is model validation. For this validation, the 21
questionnaires that had been held back from the main analysis were used as
an independent sample of cases. It is recognised that mathematical models
usually fit the sample from which they are derived better than they will fit
another sample from the same population (Tam and Harris, 1996). As argued
ibid, the observed error rate in this test sample will better reflect the models’
effectiveness. Where appropriate, the missing values were replaced with the
mean of all valid responses, as in the case of the original analysis.
Given that the outcome of the multiple regression analysis gave R2 values the
largest of which was 23% (implying that several other factors not accounted
for in this study account for the variation in the performance outcomes), it
can be seen that the predictive use of these developed models is limited. It
can therefore be argued that trying to validate these models by attempting to
directly predict the exact project performance of the new cases will be
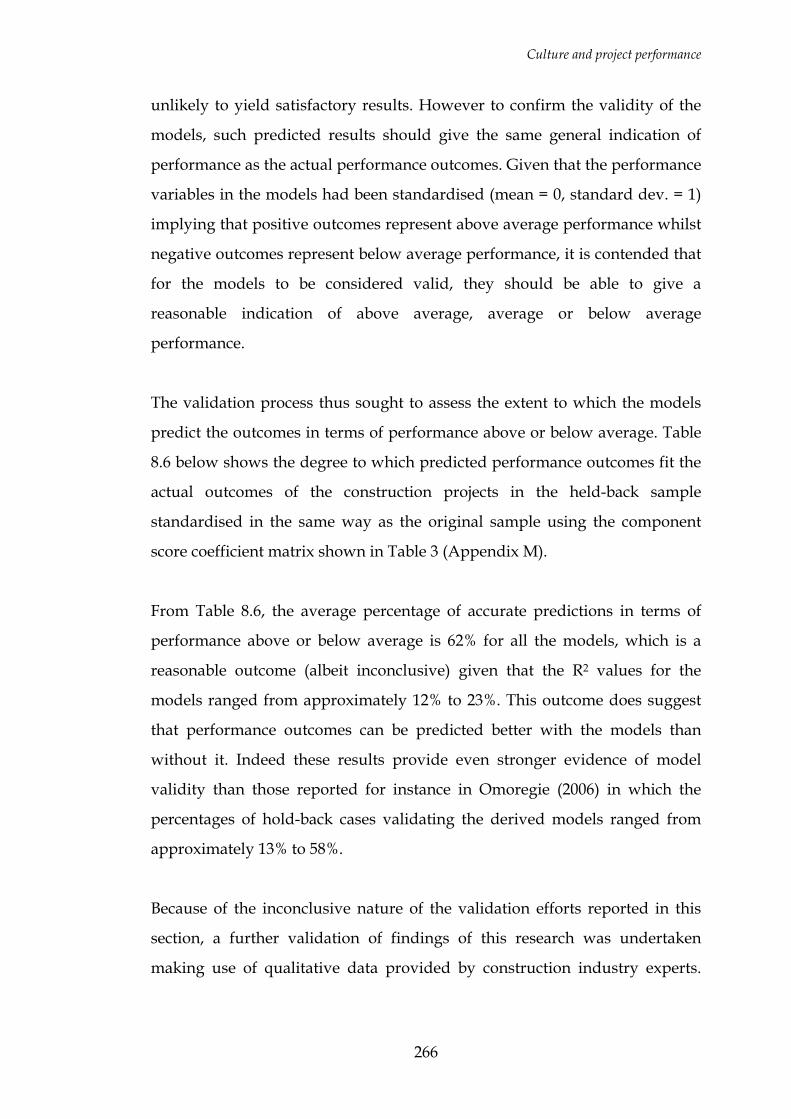
Culture and project performance
266
unlikely to yield satisfactory results. However to confirm the validity of the
models, such predicted results should give the same general indication of
performance as the actual performance outcomes. Given that the performance
variables in the models had been standardised (mean = 0, standard dev. = 1)
implying that positive outcomes represent above average performance whilst
negative outcomes represent below average performance, it is contended that
for the models to be considered valid, they should be able to give a
reasonable indication of above average, average or below average
performance.
The validation process thus sought to assess the extent to which the models
predict the outcomes in terms of performance above or below average. Table
8.6 below shows the degree to which predicted performance outcomes fit the
actual outcomes of the construction projects in the held-back sample
standardised in the same way as the original sample using the component
score coefficient matrix shown in Table 3 (Appendix M).
From Table 8.6, the average percentage of accurate predictions in terms of
performance above or below average is 62% for all the models, which is a
reasonable outcome (albeit inconclusive) given that the R2 values for the
models ranged from approximately 12% to 23%. This outcome does suggest
that performance outcomes can be predicted better with the models than
without it. Indeed these results provide even stronger evidence of model
validity than those reported for instance in Omoregie (2006) in which the
percentages of hold-back cases validating the derived models ranged from
approximately 13% to 58%.
Because of the inconclusive nature of the validation efforts reported in this
section, a further validation of findings of this research was undertaken
making use of qualitative data provided by construction industry experts.
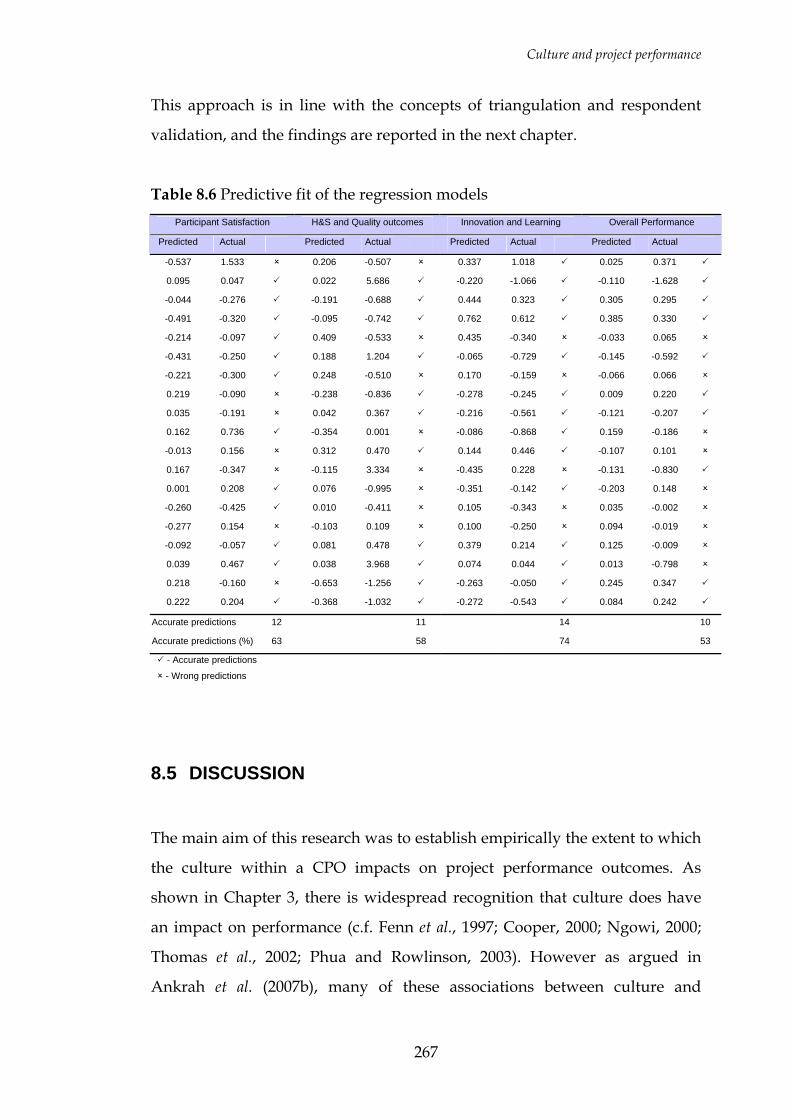
Culture and project performance
267
This approach is in line with the concepts of triangulation and respondent
validation, and the findings are reported in the next chapter.
Table 8.6 Predictive fit of the regression models Participant Satisfaction H&S and Quality outcomes Innovation and Learning Overall Performance
Predicted Actual Predicted Actual Predicted Actual Predicted Actual
-0.537 1.533 0.206 -0.507 0.337 1.018 0.025 0.371
0.095 0.047 0.022 5.686 -0.220 -1.066 -0.110 -1.628
-0.044 -0.276 -0.191 -0.688 0.444 0.323 0.305 0.295
-0.491 -0.320 -0.095 -0.742 0.762 0.612 0.385 0.330
-0.214 -0.097 0.409 -0.533 0.435 -0.340 -0.033 0.065
-0.431 -0.250 0.188 1.204 -0.065 -0.729 -0.145 -0.592
-0.221 -0.300 0.248 -0.510 0.170 -0.159 -0.066 0.066
0.219 -0.090 -0.238 -0.836 -0.278 -0.245 0.009 0.220
0.035 -0.191 0.042 0.367 -0.216 -0.561 -0.121 -0.207
0.162 0.736 -0.354 0.001 -0.086 -0.868 0.159 -0.186
-0.013 0.156 0.312 0.470 0.144 0.446 -0.107 0.101
0.167 -0.347 -0.115 3.334 -0.435 0.228 -0.131 -0.830
0.001 0.208 0.076 -0.995 -0.351 -0.142 -0.203 0.148
-0.260 -0.425 0.010 -0.411 0.105 -0.343 0.035 -0.002
-0.277 0.154 -0.103 0.109 0.100 -0.250 0.094 -0.019
-0.092 -0.057 0.081 0.478 0.379 0.214 0.125 -0.009
0.039 0.467 0.038 3.968 0.074 0.044 0.013 -0.798
0.218 -0.160 -0.653 -1.256 -0.263 -0.050 0.245 0.347
0.222 0.204 -0.368 -1.032 -0.272 -0.543 0.084 0.242
Accurate predictions 12 11 14 10
Accurate predictions (%) 63 58 74 53
- Accurate predictions
- Wrong predictions
8.5 DISCUSSION
The main aim of this research was to establish empirically the extent to which
the culture within a CPO impacts on project performance outcomes. As
shown in Chapter 3, there is widespread recognition that culture does have
an impact on performance (c.f. Fenn et al., 1997; Cooper, 2000; Ngowi, 2000;
Thomas et al., 2002; Phua and Rowlinson, 2003). However as argued in
Ankrah et al. (2007b), many of these associations between culture and
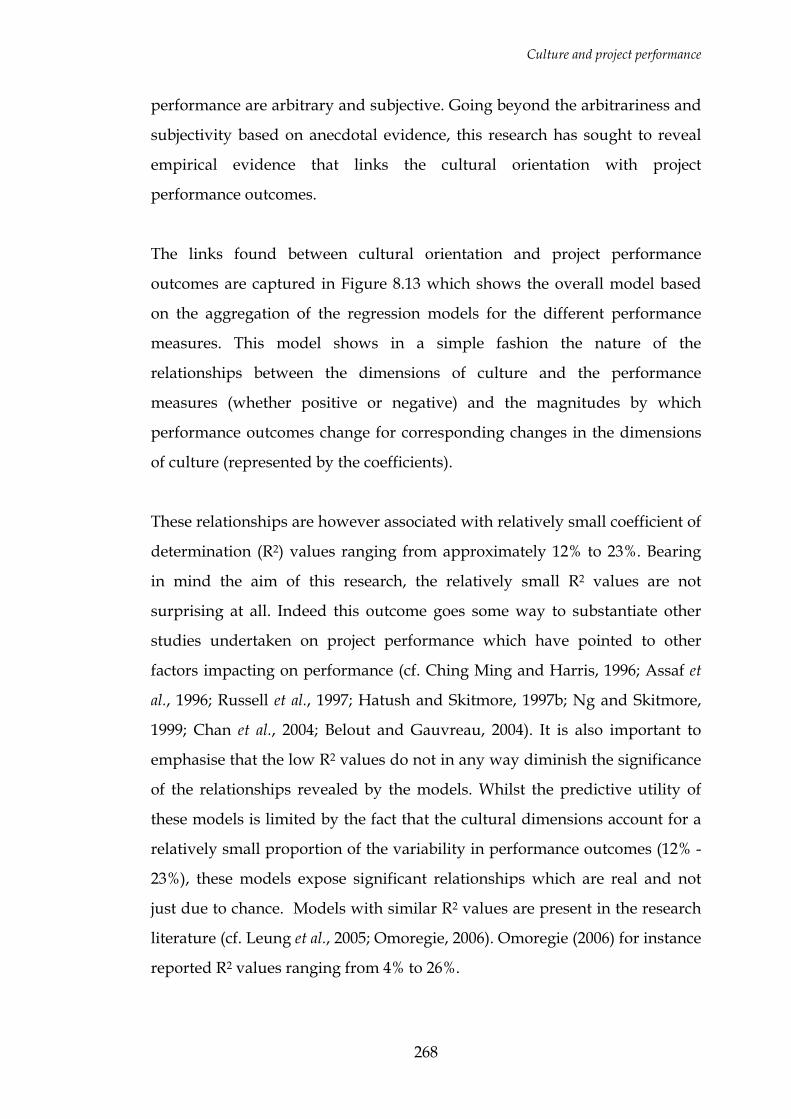
Culture and project performance
268
performance are arbitrary and subjective. Going beyond the arbitrariness and
subjectivity based on anecdotal evidence, this research has sought to reveal
empirical evidence that links the cultural orientation with project
performance outcomes.
The links found between cultural orientation and project performance
outcomes are captured in Figure 8.13 which shows the overall model based
on the aggregation of the regression models for the different performance
measures. This model shows in a simple fashion the nature of the
relationships between the dimensions of culture and the performance
measures (whether positive or negative) and the magnitudes by which
performance outcomes change for corresponding changes in the dimensions
of culture (represented by the coefficients).
These relationships are however associated with relatively small coefficient of
determination (R2) values ranging from approximately 12% to 23%. Bearing
in mind the aim of this research, the relatively small R2 values are not
surprising at all. Indeed this outcome goes some way to substantiate other
studies undertaken on project performance which have pointed to other
factors impacting on performance (cf. Ching Ming and Harris, 1996; Assaf et
al., 1996; Russell et al., 1997; Hatush and Skitmore, 1997b; Ng and Skitmore,
1999; Chan et al., 2004; Belout and Gauvreau, 2004). It is also important to
emphasise that the low R2 values do not in any way diminish the significance
of the relationships revealed by the models. Whilst the predictive utility of
these models is limited by the fact that the cultural dimensions account for a
relatively small proportion of the variability in performance outcomes (12% -
23%), these models expose significant relationships which are real and not
just due to chance. Models with similar R2 values are present in the research
literature (cf. Leung et al., 2005; Omoregie, 2006). Omoregie (2006) for instance
reported R2 values ranging from 4% to 26%.
Culture and project performance
269
Innovation and Learning
0.314
-0.379
Participant Satisfaction
Workforce orientation
H&S and Quality outcomes
Time and Cost outcomes
Performance orientation
Project orientation
Team orientation
Client orientation
Overall performance
0.143
-0.3
44
0.189
0.413
-0.293
Negative relationships
Positive relationships
Figure 8.13 A pictorial representation of the regression results
It can be surmised from these results that workforce orientation is
significantly associated with project performance outcomes. Construction
projects with higher levels of workforce orientation achieved higher levels of
innovation and learning, and overall performance. It is also positively
associated with participant satisfaction although this is not shown in Figure
8.13. Improving workforce orientation implies increasing the effort put into
motivating the workforce, emphasis on teamwork, free and open
communication on site, emphasis on site tidiness, recognition of good
performance, information flow to workforce, participation in planning and
decision-making, communication between managers and operatives, and
emphasis on learning, among other things. These are all attributes that
according to the organisational behaviour and human resource scholars (cf.
Robbins, 1998; Mullins, 2005), are important ingredients of organisational
effectiveness. These aspects of workforce orientation have been linked to
greater goal commitment and motivation (cf. McFillen and Maloney, 1988;
Smithers and Walker, 2000), and as found in Leung et al. (2004) the greater the
goal commitment, the greater the satisfaction of participants. The link to
innovation and learning is also supported by the literature (cf. Kululanga et
Culture and project performance
270
al., 2001) which has argued for instance that learning is fostered by a greater
workforce orientation.
Ultimately, construction projects will exhibit an overall performance
improvement when workforce orientation within the CPO is improved.
The results also indicate that as CPOs improve in project orientation, they
exhibit better H&S and quality outcomes, and an improved overall
performance outcome. Project orientation refers to the sense of identification
with the construction project which worsens as the level of subcontracting
increases (Riley and Clare-Brown, 2001), a fact confirmed by the factor
analysis. This finding is significant as it raises the fundamental question of
what to do about subcontracting. Subcontracting is inevitable given the
specialised, fragmented and uncertain nature of demand in construction
(Hsieh, 1998; Gonzalez-Diaz et al., 2000; Xiao, 2002). If project orientation is to
be improved in spite of subcontracting, there is a need for measures to
mitigate any negative consequences of subcontracting on project orientation
and by extension H&S and quality outcomes. Measures could include
induction, training and partnering (building long-term relationships with
subcontractors). Other useful measures have also been identified in Sawacha
et al. (1999). Indeed, some of these positive measures are actually being
practiced by main contractors as indicated by interviewees viz:
“we will go out and will give them (Subcontractors) a free H&S briefing.
We’ll train their operatives for them in H&S…, to try and help them along.
We will discuss with them where the shortfalls are. We’ll identify what things
we feel need to be put into place to put things right which will be discussed
with them at the time. We'll set an action plan, we'll agree dates and then
we'll go back at regular intervals see how they are doing, have they met the
dates? If not, why not? What we need to do to bring the thing back on track?
Culture and project performance
271
So there are reviews which go on all the way through the process from many
different angles.”
Such measures, also referred to as positive management action by Sawacha et
al. (1999), if embraced and applied fully can improve project orientation and
by extension can also potentially lead to better H&S and quality outcomes.
With H&S outcomes and quality outcomes being the first and second most
important objectives that project organisations pursue (Chapter 6 refer), it is
reasonable to recommend that project organisations give more attention to
this cultural dimension of project orientation. Ultimately, construction
projects that exhibit higher levels of project orientation will also potentially
exhibit an overall performance improvement.
The other important dimension of culture is the team orientation. Projects
that exhibited the higher participant satisfaction levels and better H&S and
quality outcomes were those with the higher team orientations. The
importance of this dimension of culture is underscored by the extensive
literature and toolkits on team integration (cf. Latham, 1994; Egan, 2002; The
Strategic Forum for Construction, 2003; Kadefors, 2004; Cicmil and Marshall,
2005; Baiden et al., 2006). One of the ways by which the industry has sought to
respond to the need for higher levels of team orientation has been the
encouragement of partnering as an alternative procurement approach
(Rowlinson and Cheung, 2004; Sullivan, 2006; OGC, 2007).
Improving team orientation is the very ethos of the partnering approach to
project procurement. This was acknowledged by interviewees (in the
qualitative phase) who appeared to favour the use of partnering as a
procurement approach for generating the required team orientation stating
inter alia that:
Culture and project performance
272
“The typical two stage or single stage lump sum price, is all about how do we
fight each other,…whereas in a framework, a partnering agreement like
BAA's framework, or the NHS Procure 21 as a framework,…it’s about a
project. Everybody’s looking forward at how we get the job built and how we
get the job completed on time. And it's a collaborative way of working to
deliver that.”
It is often taken for granted that particular procurement routes like
‘partnering’ are the panacea for the poor team orientation of CPOs.
Surprisingly, as shown in Chapter 6, there was no evidence on the projects
surveyed where partnering was employed, that this procurement route led to
greater levels of team orientation. This seems to corroborate views expressed
in Sullivan (2006) that very often partnering is approached as a ‘tick in the
box’ exercise, with participants not embracing the real cultural change it
heralds. Perhaps it is time to rethink partnering.
Indeed, as demonstrated in the literature, several other factors contribute
towards facilitating the process of integration with the aim of engendering a
team culture. Baiden et al. (2006) for instance provide insights into practices
that promote team integration, highlighting inter alia flat organisation
structures, co-location, availability and accessibility of information, and
flexibility within the project team. Such measures help to improve the
situational context. However relating this to the social cognitive theory, it is
also necessary to take measures that address the cognitive as well as the
behavioural aspects. Training in teamwork through on-going workshops is
key in this regards (Rowlinson and Cheung, 2004).
Curiously, it was also found that the projects with better innovation and
learning outcomes were those with lower team orientations. This finding is
consistent with research reported in Michela and Burke (2000). It has been
noted that learning (and by extension innovation) does not happen by chance
Culture and project performance
273
(Kululanga et al., 2001), but is a consequence of deliberate action (cf. Bresnen
et al., 2003). Taking such deliberate action has been a challenge for
construction, especially at the project level where issues of who provides
leadership, who owns the benefits, and who bears the risk for things going
wrong are always at the fore (Chan et al., 2005). Such issues are also at the
core of a culture of teamwork. If issues like these can be resolved, there is a
greater likelihood that greater innovation and learning can be fostered
without compromising team orientation. Perhaps it is also time the
construction industry reconsidered its efforts in propagating the notion that
mistakes are not acceptable. Mantras like “right first time” which are
regularly bandied about by practitioners and researchers alike, serve this
purpose of signalling that mistakes are unacceptable. By these arguments, the
position being taken is that there is no need for team orientation to be
compromised in the pursuit of innovation and learning on the construction
project. Rather, steps can be taken as indicated above to ensure that team
orientation is maintained whilst pursuing innovation and learning as project
objectives.
A curious finding in this research was the lack of empirical evidence to link
either client or performance orientations with any of the performance
outcomes. In trying to identify ‘best practice’ cultural orientations, it is
tempting to propose on the basis of these findings that these dimensions are
unimportant and can be ignored. However it should be noted that a lack of
evidence to prove an association does not necessarily mean that such an
association does not exist. Moreover, it is possible that there may be
associations with performance outcomes not assessed in this research. Indeed
it may well be that these dimensions are just enablers or enhancers of project
success which by themselves cannot guarantee project success, but without
which project success cannot be obtained (Nicolini, 2002). It is therefore not
prudent without further external validation of this research involving a larger
sample size to suggest that these dimensions of culture are unimportant.
Culture and project performance
274
What can be proposed however on the basis of the findings reported, is that
workforce, project and team orientations have important roles to play in
determining project performance outcomes. As such there is justification for
undertaking further, perhaps more critical and in-depth research into these
dimensions of culture. There is also justification for applying more effort and
resources towards improving these orientations. Best practice cultural
orientations in respect of these dimensions of culture can therefore be
suggested as:
A greater workforce orientation – encompassing a greater amount of
effort put into motivating the workforce, emphasis on teamwork, free
and open communication on site, emphasis on site tidiness,
recognition of good performance. It also encompasses keeping
operatives informed of project developments, a greater level of
participation in planning and decision-making by the workforce,
communication between managers and operatives, and so on.
A greater project orientation – encompassing a greater level of
identification with the project among participants, a greater emphasis
on waste elimination, and a greater effort put into implementing
measures that help align subcontractors’ goals with project goals.
A greater team orientation – encompassing the absence of a blame
culture, a greater level of management accessibility and
approachability, information sharing, and trust.
As construction organisations strive for improved performance outcomes, it
is essential that adequate resources and attention are devoted towards
improvements in these regards. These issues go to the heart of participants’
commitment to the project and their motivation towards achieving the project
objectives. Belout (1997) and Nicolini (2002) provide some useful practical
pointers on how to foster these orientations including Project Manager
training (in team building), co-location, early involvement of contractors and
Culture and project performance
275
other suppliers project, appropriate contractual relations, appropriate team
selection and composition (personal profile analysis), activities (including
social activities) and workshops. Although addressing the retail sector,
Ogbonna and Harris (2002) also provide some strategies that are worth
exploring. Beyond just working to achieve these orientations, it has also been
shown that for innovation and learning to flourish without compromising the
team orientation, perhaps the industry must begin to recognise and educate
participants that mistakes are acceptable, and encourage participants to
resolve from the outset of the project the issues concerning leadership, who
owns the benefits, and who bears the risk for things going wrong.
Considered together, these findings provide sound empirical evidence for
accepting the main research hypothesis which posited that there is a
significant relationship between the cultural orientations of CPOs and project
performance outcomes. Clearly, there are significant relationships between
cultural orientation as assessed through the dimensions of workforce
orientation, project orientation and team orientation, and construction project
performance outcomes. The statistics confirm that these associations are not
just due to chance but are real. Although the amount of variation in
performance outcomes culture accounts for is relatively small judging from
the R2 values, it is nevertheless significant enough to warrant greater
attention from both the research fraternity and construction industry
practitioners. In other words, culture within the project organisation matters.
It has been noted that one of the most important tasks of the Project Manager
is to ensure that the optimum project culture is developed (Riley and Clare-
Brown, 2001; Anderson, 2003). Through the development of these models
which have helped to identify best practice, this research has provided some
direction on what an optimum project culture ought to be. This is not
however to suggest that there is a one best culture. As noted in Chapter 3
there is a need for congruence between the culture and its context
Culture and project performance
276
(Thompson, 1993; Kotter and Heskett, 1992) implying that certain contexts
may give rise to particular orientations different from other contexts as found
in Chapter 6. What is important is to be aware of the potential adverse
impacts on outcomes so that steps can be taken to mitigate these effects.
8.6 SUMMARY
This chapter sought to explore the potential relationships between the
operating cultures within the CPOs and the project performance outcomes to
determine whether or not any significant association exists. Pearson’s
correlation coefficients and stepwise multiple regression were employed for
this purpose.
It was found that significant associations exist between participant
satisfaction and workforce and team orientation. Projects with higher
participant satisfaction were generally those with the higher workforce and
team orientations. Significant associations also exist between H&S and quality
outcomes and project and team orientation. Projects with better H&S and
quality outcomes were generally those with higher project and team
orientations. Significant associations were also found between innovation and
learning and workforce and team orientations. Projects with higher
innovation and learning were generally those with higher workforce
orientation, but lower team orientation. Finally for the overall performance
index developed, significant associations were found with workforce and
project orientations. Projects with better overall performance were those with
higher workforce and project orientations. Although these relationships were
found to be associated with relatively small R2 values ranging from 12% to
23%, it is argued that these are significant enough to warrant attention from
practitioners and performance researchers alike.
Culture and project performance
277
It is abundantly clear from the above results that the hypothesis that there is a
relationship between organisational culture and construction project
performance is supported by the empirical evidence. Whilst not all the
dimensions of culture assessed are significant, and not all the measures of
performance show an association with those significant dimensions of
culture, there is significant evidence and support for the hypothesis that
cultural orientation (along certain specific dimensions of culture) has an
impact on some project performance outcomes. These findings have thus
demonstrated that the culture within the CPO is a significant aspect that
research into project performance must address in order to evolve
comprehensive frameworks for performance improvement. These findings
also provide justification for the calls for cultural change within the CPO.
This chapter has thus addressed the final two objectives of this research
which sought to explore the possible relationships between each specific
cultural attribute and the performance of the project organisations, and to
develop models that relate organisational culture with performance – these
objectives being linked to the main research hypothesis which posited that
there is a significant relationship between the culture of the CPO and
construction project performance.
Having established clear relationships between cultural orientations and
performance outcomes of construction projects, the next phase of this
research addresses the need to validate these findings, and the next chapter
focuses on this aspect of the research.
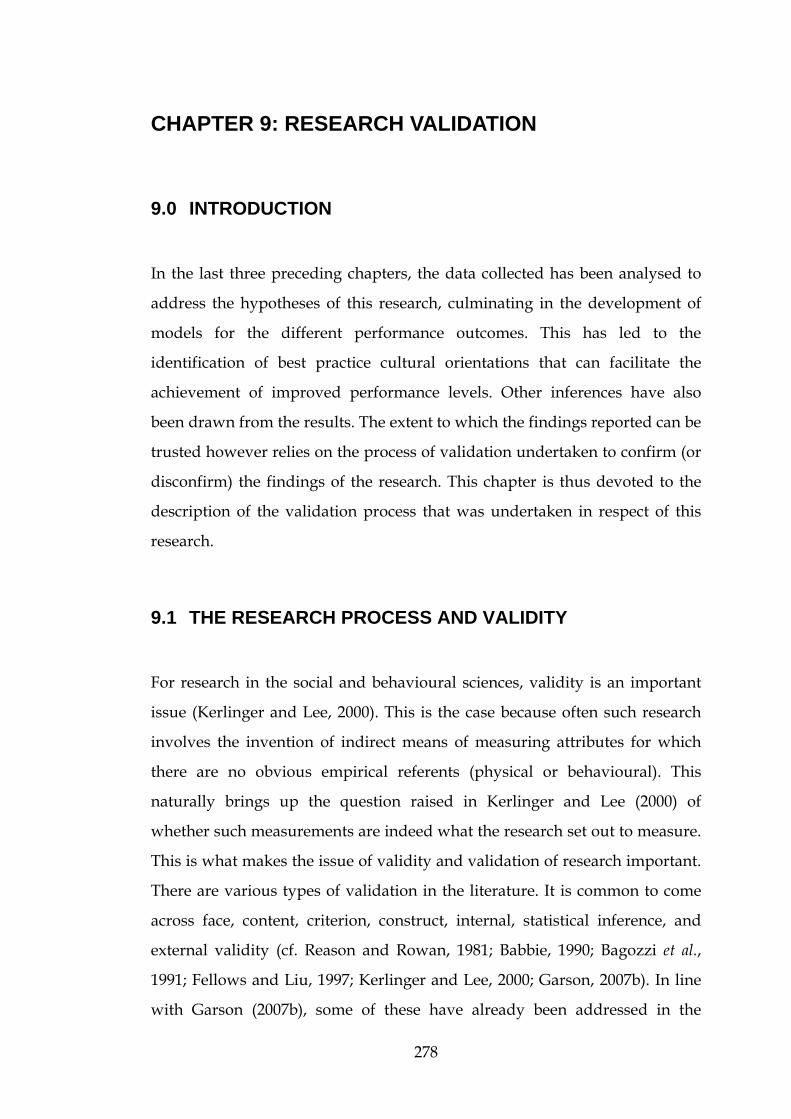
278
CHAPTER 9: RESEARCH VALIDATION
9.0 INTRODUCTION
In the last three preceding chapters, the data collected has been analysed to
address the hypotheses of this research, culminating in the development of
models for the different performance outcomes. This has led to the
identification of best practice cultural orientations that can facilitate the
achievement of improved performance levels. Other inferences have also
been drawn from the results. The extent to which the findings reported can be
trusted however relies on the process of validation undertaken to confirm (or
disconfirm) the findings of the research. This chapter is thus devoted to the
description of the validation process that was undertaken in respect of this
research.
9.1 THE RESEARCH PROCESS AND VALIDITY
For research in the social and behavioural sciences, validity is an important
issue (Kerlinger and Lee, 2000). This is the case because often such research
involves the invention of indirect means of measuring attributes for which
there are no obvious empirical referents (physical or behavioural). This
naturally brings up the question raised in Kerlinger and Lee (2000) of
whether such measurements are indeed what the research set out to measure.
This is what makes the issue of validity and validation of research important.
There are various types of validation in the literature. It is common to come
across face, content, criterion, construct, internal, statistical inference, and
external validity (cf. Reason and Rowan, 1981; Babbie, 1990; Bagozzi et al.,
1991; Fellows and Liu, 1997; Kerlinger and Lee, 2000; Garson, 2007b). In line
with Garson (2007b), some of these have already been addressed in the
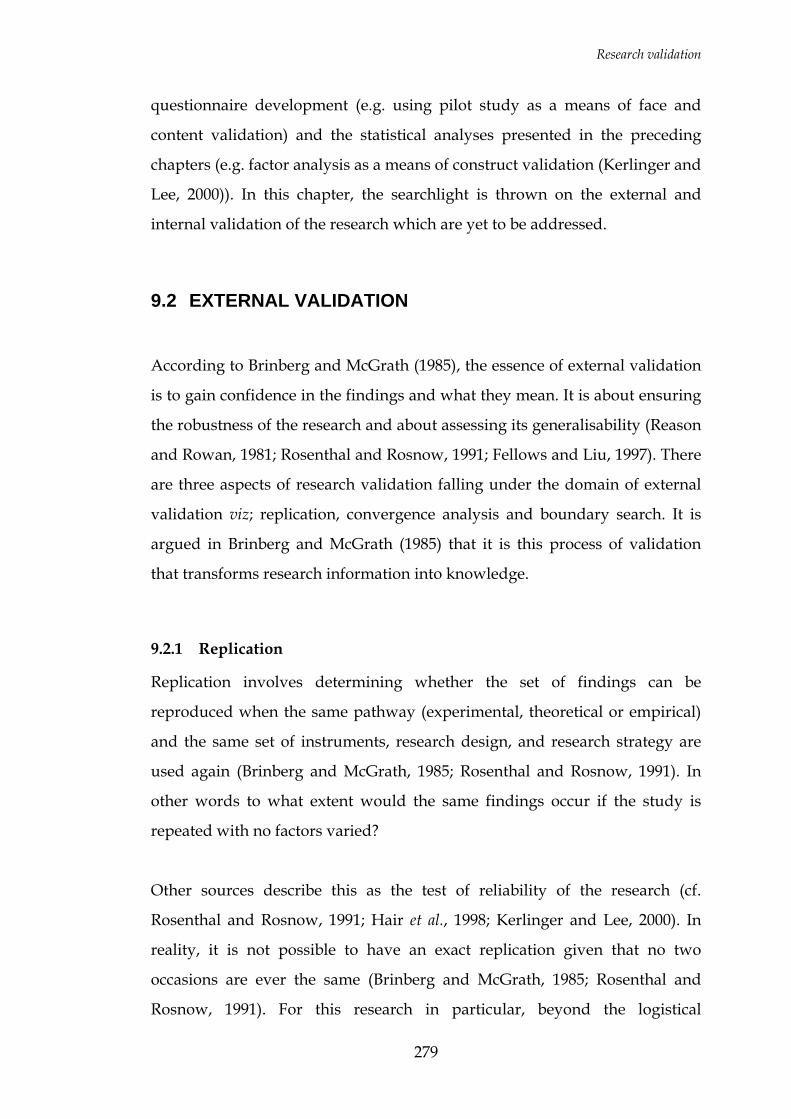
Research validation
279
questionnaire development (e.g. using pilot study as a means of face and
content validation) and the statistical analyses presented in the preceding
chapters (e.g. factor analysis as a means of construct validation (Kerlinger and
Lee, 2000)). In this chapter, the searchlight is thrown on the external and
internal validation of the research which are yet to be addressed.
9.2 EXTERNAL VALIDATION
According to Brinberg and McGrath (1985), the essence of external validation
is to gain confidence in the findings and what they mean. It is about ensuring
the robustness of the research and about assessing its generalisability (Reason
and Rowan, 1981; Rosenthal and Rosnow, 1991; Fellows and Liu, 1997). There
are three aspects of research validation falling under the domain of external
validation viz; replication, convergence analysis and boundary search. It is
argued in Brinberg and McGrath (1985) that it is this process of validation
that transforms research information into knowledge.
9.2.1 Replication
Replication involves determining whether the set of findings can be
reproduced when the same pathway (experimental, theoretical or empirical)
and the same set of instruments, research design, and research strategy are
used again (Brinberg and McGrath, 1985; Rosenthal and Rosnow, 1991). In
other words to what extent would the same findings occur if the study is
repeated with no factors varied?
Other sources describe this as the test of reliability of the research (cf.
Rosenthal and Rosnow, 1991; Hair et al., 1998; Kerlinger and Lee, 2000). In
reality, it is not possible to have an exact replication given that no two
occasions are ever the same (Brinberg and McGrath, 1985; Rosenthal and
Rosnow, 1991). For this research in particular, beyond the logistical
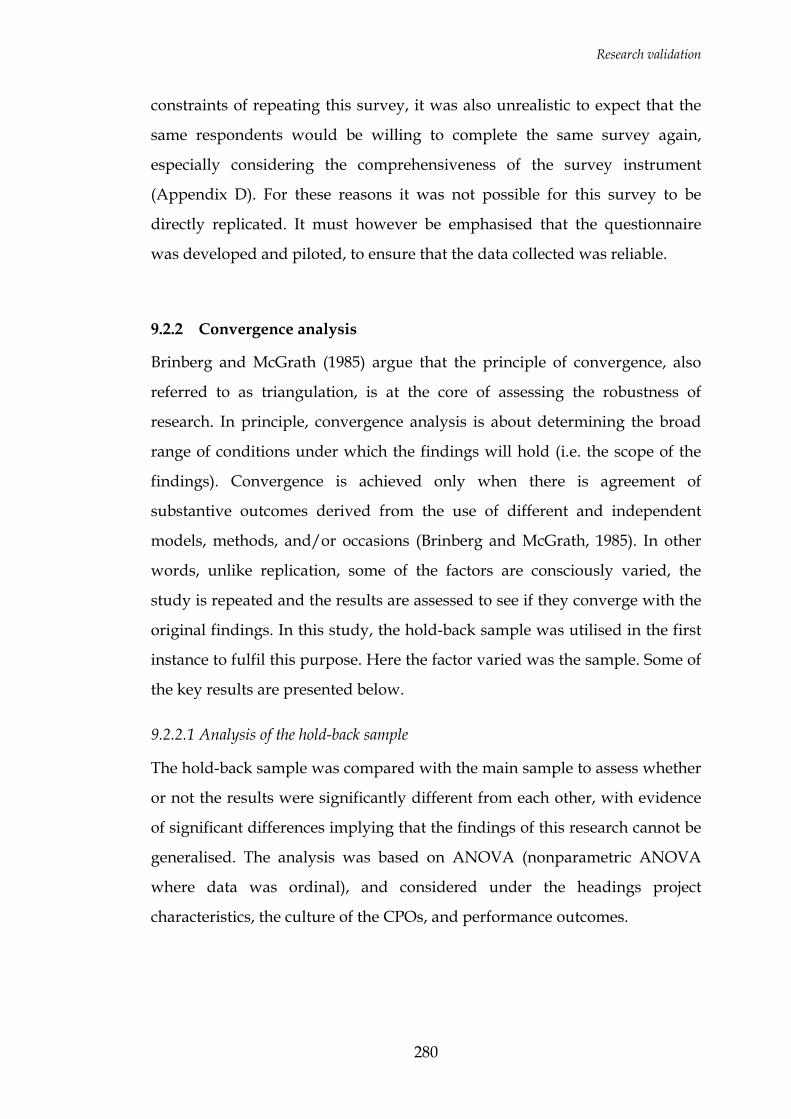
Research validation
280
constraints of repeating this survey, it was also unrealistic to expect that the
same respondents would be willing to complete the same survey again,
especially considering the comprehensiveness of the survey instrument
(Appendix D). For these reasons it was not possible for this survey to be
directly replicated. It must however be emphasised that the questionnaire
was developed and piloted, to ensure that the data collected was reliable.
9.2.2 Convergence analysis
Brinberg and McGrath (1985) argue that the principle of convergence, also
referred to as triangulation, is at the core of assessing the robustness of
research. In principle, convergence analysis is about determining the broad
range of conditions under which the findings will hold (i.e. the scope of the
findings). Convergence is achieved only when there is agreement of
substantive outcomes derived from the use of different and independent
models, methods, and/or occasions (Brinberg and McGrath, 1985). In other
words, unlike replication, some of the factors are consciously varied, the
study is repeated and the results are assessed to see if they converge with the
original findings. In this study, the hold-back sample was utilised in the first
instance to fulfil this purpose. Here the factor varied was the sample. Some of
the key results are presented below.
9.2.2.1 Analysis of the hold-back sample
The hold-back sample was compared with the main sample to assess whether
or not the results were significantly different from each other, with evidence
of significant differences implying that the findings of this research cannot be
generalised. The analysis was based on ANOVA (nonparametric ANOVA
where data was ordinal), and considered under the headings project
characteristics, the culture of the CPOs, and performance outcomes.
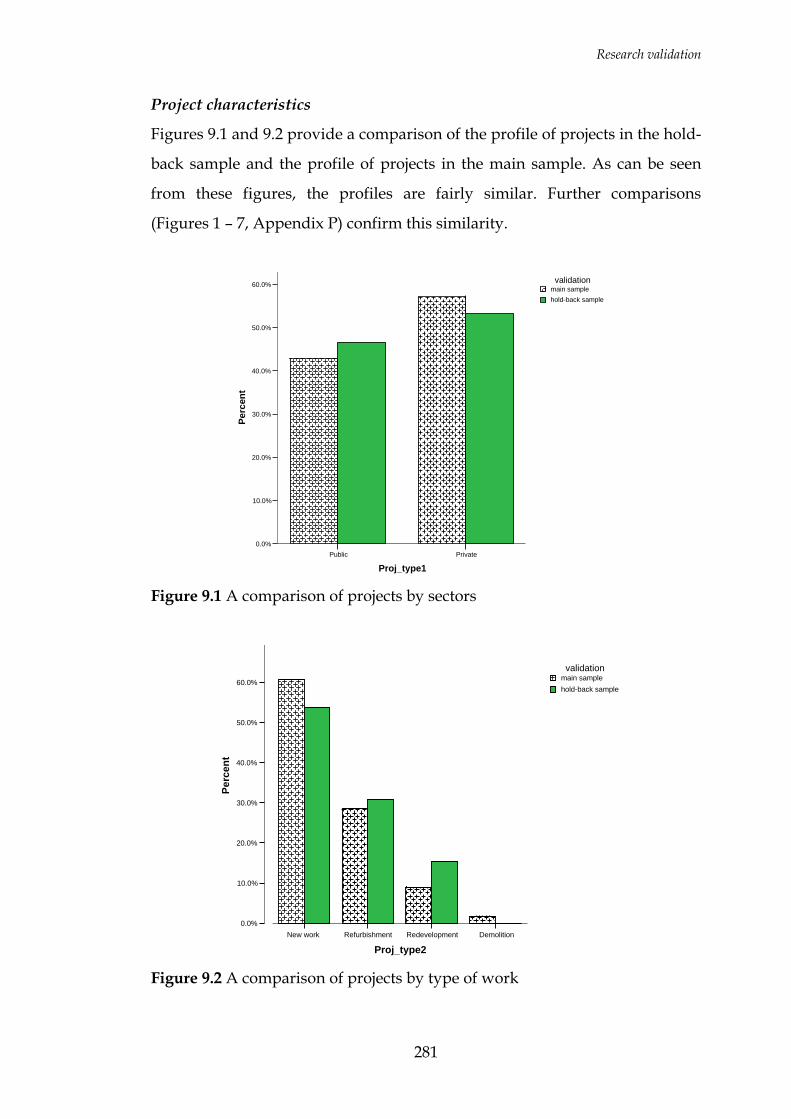
Research validation
281
Project characteristics
Figures 9.1 and 9.2 provide a comparison of the profile of projects in the hold-
back sample and the profile of projects in the main sample. As can be seen
from these figures, the profiles are fairly similar. Further comparisons
(Figures 1 – 7, Appendix P) confirm this similarity.
PrivatePublic
Proj_type1
60.0%
50.0%
40.0%
30.0%
20.0%
10.0%
0.0%
Perc
ent
hold-back samplemain samplevalidation
Figure 9.1 A comparison of projects by sectors
DemolitionRedevelopmentRefurbishmentNew work
Proj_type2
60.0%
50.0%
40.0%
30.0%
20.0%
10.0%
0.0%
Perc
ent
hold-back samplemain samplevalidation
Figure 9.2 A comparison of projects by type of work
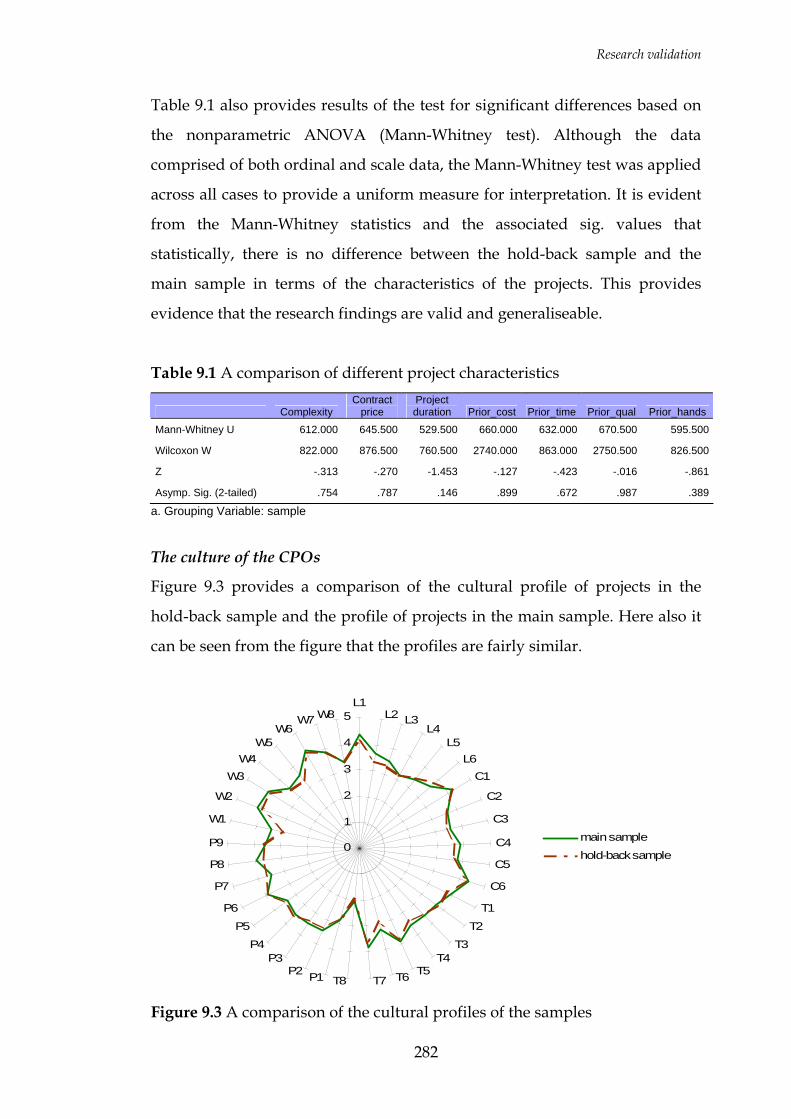
Research validation
282
Table 9.1 also provides results of the test for significant differences based on
the nonparametric ANOVA (Mann-Whitney test). Although the data
comprised of both ordinal and scale data, the Mann-Whitney test was applied
across all cases to provide a uniform measure for interpretation. It is evident
from the Mann-Whitney statistics and the associated sig. values that
statistically, there is no difference between the hold-back sample and the
main sample in terms of the characteristics of the projects. This provides
evidence that the research findings are valid and generaliseable.
Table 9.1 A comparison of different project characteristics
Complexity Contract
price Project duration Prior_cost Prior_time Prior_qual Prior_hands
Mann-Whitney U 612.000 645.500 529.500 660.000 632.000 670.500 595.500
Wilcoxon W 822.000 876.500 760.500 2740.000 863.000 2750.500 826.500
Z -.313 -.270 -1.453 -.127 -.423 -.016 -.861
Asymp. Sig. (2-tailed) .754 .787 .146 .899 .672 .987 .389
a. Grouping Variable: sample
The culture of the CPOs
Figure 9.3 provides a comparison of the cultural profile of projects in the
hold-back sample and the profile of projects in the main sample. Here also it
can be seen from the figure that the profiles are fairly similar.
0
1
2
3
4
5L1
L2 L3L4
L5L6
C1
C2
C3
C4
C5
C6
T1
T2
T3T4
T5T6T7T8P1P2P3
P4
P5
P6
P7
P8
P9
W1
W2
W3W4
W5W6
W7 W8
main sample
hold-back sample
Figure 9.3 A comparison of the cultural profiles of the samples
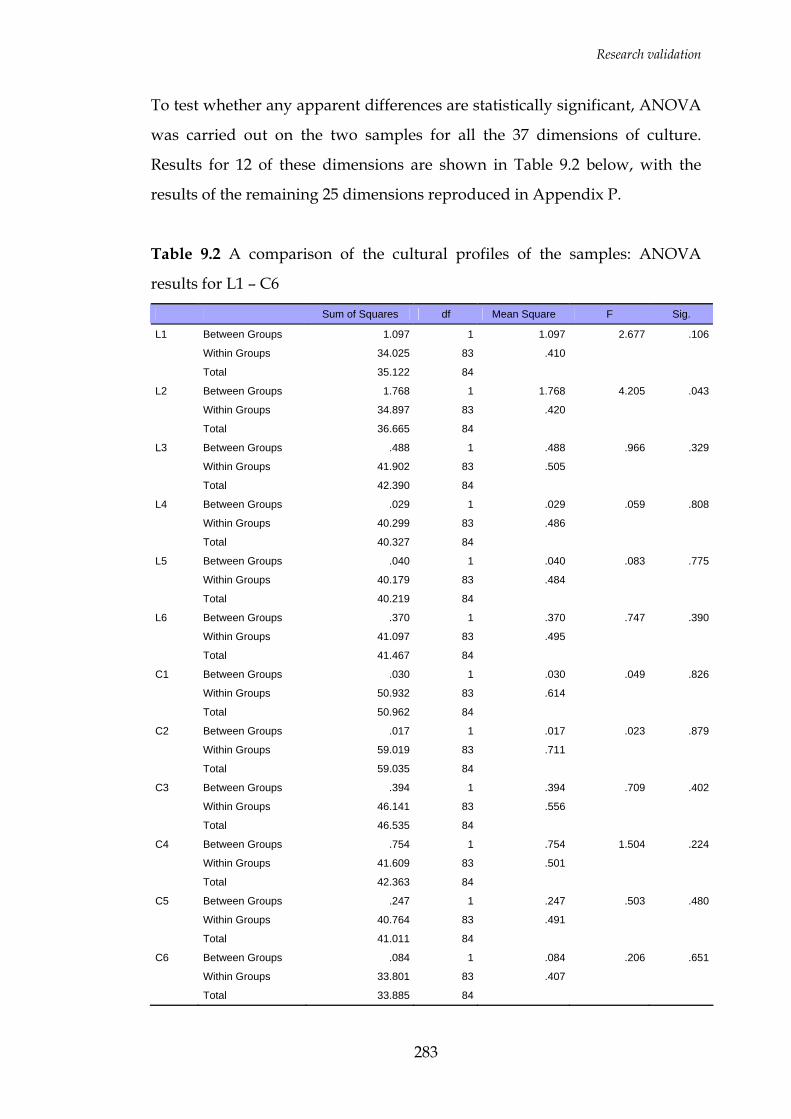
Research validation
283
To test whether any apparent differences are statistically significant, ANOVA
was carried out on the two samples for all the 37 dimensions of culture.
Results for 12 of these dimensions are shown in Table 9.2 below, with the
results of the remaining 25 dimensions reproduced in Appendix P.
Table 9.2 A comparison of the cultural profiles of the samples: ANOVA
results for L1 – C6
Sum of Squares df Mean Square F Sig.
L1 Between Groups 1.097 1 1.097 2.677 .106
Within Groups 34.025 83 .410
Total 35.122 84
L2 Between Groups 1.768 1 1.768 4.205 .043
Within Groups 34.897 83 .420
Total 36.665 84
L3 Between Groups .488 1 .488 .966 .329
Within Groups 41.902 83 .505
Total 42.390 84
L4 Between Groups .029 1 .029 .059 .808
Within Groups 40.299 83 .486
Total 40.327 84
L5 Between Groups .040 1 .040 .083 .775
Within Groups 40.179 83 .484
Total 40.219 84
L6 Between Groups .370 1 .370 .747 .390
Within Groups 41.097 83 .495
Total 41.467 84
C1 Between Groups .030 1 .030 .049 .826
Within Groups 50.932 83 .614
Total 50.962 84
C2 Between Groups .017 1 .017 .023 .879
Within Groups 59.019 83 .711
Total 59.035 84
C3 Between Groups .394 1 .394 .709 .402
Within Groups 46.141 83 .556
Total 46.535 84
C4 Between Groups .754 1 .754 1.504 .224
Within Groups 41.609 83 .501
Total 42.363 84
C5 Between Groups .247 1 .247 .503 .480
Within Groups 40.764 83 .491
Total 41.011 84
C6 Between Groups .084 1 .084 .206 .651
Within Groups 33.801 83 .407
Total 33.885 84

Research validation
284
As can be seen from Table 9.2 and Appendix P, only one dimension of culture
i.e. supportiveness & appreciation (L2) with F = 4.205 and p = 0.043, showed
some evidence of a difference between the hold-back sample and the main
sample. Even here, the evidence was not strong. It can thus be inferred from
these results that the findings are generally consistent across samples from
the same population and are therefore generaliseable.
Performance outcomes
The performance outcomes of the two samples were also compared for
evidence of significant differences. Because the performance measures were a
combination of both ordinal and scale data, nonparametric ANOVA (Mann-
Whitney test) was employed to provide a uniform test for all the performance
measures. Results are shown in Table 9.3.
With the exception of learning outcomes (Learn) which showed some
evidence (albeit not strong evidence) of a difference between the two samples
(z = 2.168 and p = 0.030), none of the other variables were significantly
different across the sample. Here also, it can be argued that this provides
support for the validity and generaliseability of the research findings.
As can be observed from these results and further results reproduced in
Appendix P, there is little evidence that the results from the hold-back data
are different from the main sample. In other words, the hold-back data
largely mirrors the results of the main sample. It can be concluded therefore
that the findings reported in this thesis are to a large extent generaliseable
across construction projects in the UK.
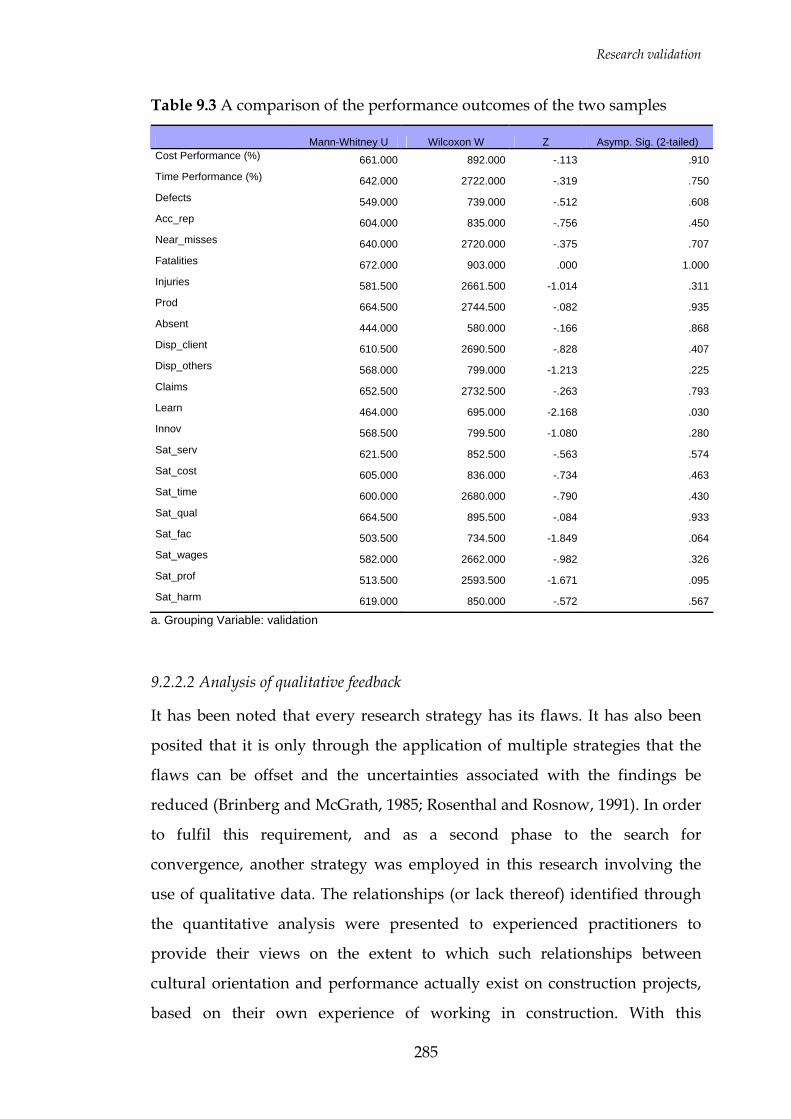
Research validation
285
Table 9.3 A comparison of the performance outcomes of the two samples
Mann-Whitney U Wilcoxon W Z Asymp. Sig. (2-tailed) Cost Performance (%) 661.000 892.000 -.113 .910Time Performance (%) 642.000 2722.000 -.319 .750Defects 549.000 739.000 -.512 .608Acc_rep 604.000 835.000 -.756 .450Near_misses 640.000 2720.000 -.375 .707Fatalities 672.000 903.000 .000 1.000Injuries 581.500 2661.500 -1.014 .311Prod 664.500 2744.500 -.082 .935Absent 444.000 580.000 -.166 .868Disp_client 610.500 2690.500 -.828 .407Disp_others 568.000 799.000 -1.213 .225Claims 652.500 2732.500 -.263 .793Learn 464.000 695.000 -2.168 .030Innov 568.500 799.500 -1.080 .280Sat_serv 621.500 852.500 -.563 .574Sat_cost 605.000 836.000 -.734 .463Sat_time 600.000 2680.000 -.790 .430Sat_qual 664.500 895.500 -.084 .933Sat_fac 503.500 734.500 -1.849 .064Sat_wages 582.000 2662.000 -.982 .326Sat_prof 513.500 2593.500 -1.671 .095Sat_harm 619.000 850.000 -.572 .567
a. Grouping Variable: validation
9.2.2.2 Analysis of qualitative feedback
It has been noted that every research strategy has its flaws. It has also been
posited that it is only through the application of multiple strategies that the
flaws can be offset and the uncertainties associated with the findings be
reduced (Brinberg and McGrath, 1985; Rosenthal and Rosnow, 1991). In order
to fulfil this requirement, and as a second phase to the search for
convergence, another strategy was employed in this research involving the
use of qualitative data. The relationships (or lack thereof) identified through
the quantitative analysis were presented to experienced practitioners to
provide their views on the extent to which such relationships between
cultural orientation and performance actually exist on construction projects,
based on their own experience of working in construction. With this
Research validation
286
approach, described in Silverman (1993) as respondent validation, it is argued
that where participants verify the tentative results of the research, this
generates more confidence in the validity of the findings. The procedure
adopted from Bloor (1978, in Silverman, 1993) involved providing
participants with a research report (Appendix Q) and recording their
response to it. It has been argued that this process of going back to
participants with tentative results and refining them in the light of
participants’ reactions is a characteristic of good research (Reason and
Rowan, 1981). This approach has been used extensively in construction
management research with Hari et al. (2005) for instance interviewing five
experts to validate their research findings.
Five experienced construction industry practitioners accepted the invitation
to share their views on the relationships found between the dimensions of
culture and the measures of project performance. The mean number of years
of experience of working in construction was 20½ years. This was an
opportunity for them to challenge the relationships suggested and to propose
alternative associations that they considered to be more accurate reflections of
the construction project context. Their responses to the various questions are
tabulated in Appendix R, and summarized below.
In response to whether from their own experiences of working on
construction projects they found projects with higher participant satisfaction
to be those with higher team and workforce orientations, all the respondents
answered in the affirmative. To quote a respondent, this finding was:
“Absolutely true – people need to be engaged with the project.”
Another respondent expressed the view that whilst team and workforce
orientations are both likely to influence satisfaction levels, team orientation is
Research validation
287
likely to be the more important factor. This is consistent with findings
reported in Ankrah et al. (2007b).
In response to whether from their own experiences of working on
construction projects they found projects with better H&S and quality
outcomes to be those with higher project and team orientations, the majority
of the respondents again answered in the affirmative.
In response also to the question of whether from their experiences of working
on construction projects they found projects with higher levels of innovation
and learning to be those with higher workforce orientation, the respondents
were unanimous in affirming the validity of this finding. Clearly the data
analysis has revealed a relationship with which practitioners identify.
In response to whether from their own experiences of working on
construction projects they found projects with higher innovation and learning
outcomes to be those with lower team orientation, two of the respondents
agreed that this was indeed the case. A third respondent however found this
outcome surprising stating that:
“One would have expected that innovation and learning would flourish on
projects where there is a positive team environment.”
In trying to rationalise this finding, another respondent who felt that the
findings were possibly valid suggested that:
“Sometimes rewards associated with innovation breeds competition among
participants which detracts from teamwork.”
This view is consistent with Hartmann (2006). When asked whether the
finding that none of the dimensions of culture were associated with time and
Research validation
288
cost outcomes was a valid reflection of what happens on a construction
project, respondents were split. Whilst for some this outcome was not
surprising, one particular respondent disagreed outright with this finding
arguing that:
“I find that culture on a project changes and enthusiasm slips with delays.”
In relation to the lack of evidence to link client and performance orientations
with any of the performance outcomes, the results were also mixed. Some
scepticism was displayed by the respondents, with the general feeling
summed up in the sentiment:
“(The finding is valid) to some extent. For instance, some clients don’t
want to be involved and on such projects the level of client focus doesn’t make
any difference. On projects where clients are more hands-on, client focus is
likely to have an influence on performance.”
One respondent however challenged the validity of this particular finding
stating that it was “hard to believe”.
It can be concluded from the above responses that although generally the
respondents are affirming the findings of the questionnaire survey, the
limitations of questionnaire surveys have also been made evident in the
scepticism of some of the respondents in respect of some of the findings. A
key limitation of questionnaire surveys is their inability to completely
eliminate or expose the ‘noise’ or influence of extraneous factors, and also
their inability to delve into issues beyond the superficial. It is possible that the
scepticism was as a result of some of these limitations. This not withstanding,
it is contended that overall, there is agreement between the views of the
respondents and the questionnaire survey results.
Research validation
289
The convergence or triangulation achieved by adopting this approach is
evidence, as indicated in Brinberg and McGrath (1985), that some of the
sources of potential invalidity in measurement and manipulation of variables
were successfully reduced during the course of the research. It can be
concluded from these results that generally the findings of the main survey
are an accurate reflection of the situation within the construction industry,
and to that extent, generalisations can be made for construction projects
across the UK.
9.2.3 Boundary search
Boundary search is the third aspect of external validation. Also referred to as
differentiation or discriminant validity, it is the attempt to identify the
boundaries associated with the findings of a research (Brinberg and McGrath,
1985; Rosenthal and Rosnow, 1991). It has been noted that it is not typical to
find researchers going beyond replication and convergence analysis to
deliberately search for the boundaries of findings (Brinberg and McGrath,
1985). Whilst it was not a deliberate intention in this research to follow this
trend, it was not possible to progress to the boundary search stage purely due
to the constraints (such as the time and cost constraints associated with
completing a PhD) associated with undertaking this research. It is however
recognised that there are some potential boundaries to the findings reported
in this research, an example of which is the country of study. Indeed, these
potential boundaries represent potential areas for further study.
9.3 INTERNAL VALIDATION
In Rosenthal and Rosnow (1991), internal validity has been defined as the
degree of validity of statements made about whether X causes Y – the
primary concern being to rule out plausible rival hypotheses. Similar
definitions are provided in Fellows and Liu (1997), and Garson (2007b). All
Research validation
290
these sources emphasise the importance of good research design for
achieving good internal validity. However they fall short of identifying
appropriate procedures for checking whether indeed good internal validity
has been achieved. In seeking to evaluate the internal validity of this research
therefore, the strategy implemented in Xiao (2002) and Proverbs (1998) was
adopted. This strategy involves the search for convergence between the three
aspects of:
Research findings;
Published research; and
Academic validation.
The principle here is that if convergence is demonstrated, then arguments
(about X and Y) made on the basis of the findings of this research are valid,
indicating that good internal validity was achieved through the research
design. This strategy is particularly useful as it provides an opportunity to
weigh the findings of this study against other published studies examining
the same issues, and to subject it to expert scrutiny. It should be emphasised
at this point that the absence of convergence does not necessarily imply a lack
of internal validity. Rather, it may well be a sign of new insight.
9.3.1 Convergence of research findings and published research
It is believed that the outcome of a single study by itself contributes little to
the body of knowledge. Only when the results of a single study have been
compared with other studies that examine the same focal problem is the
knowledge about the problem increased (Brinberg and McGrath, 1985). It has
been shown in the preceding chapter that in the main, the findings are
supported by the literature. These are summarised here again to emphasise
the convergence between the research findings and the research literature.
Research validation
291
9.3.1.1 The participant satisfaction model
The participant satisfaction model indicated that higher levels of team
orientation would lead to higher levels of participant satisfaction. This
finding is supported by independent research in the literature.
A quantitative study undertaken by Leung et al. (2004) on project participants
found team-related variables in the form of team conflict, cooperation and
participation, and goal commitment to be critical factors influencing the final
satisfaction outcomes of construction projects. This finding is reinforced in
Leung et al. (2005). Zuo and Zillante (2006) also found integration,
cooperation and people orientation as the main contributors to project team
satisfaction. Although focusing on customer satisfaction, studies like Maloney
(2003) have also identified labour-management cooperation as a requirement
for satisfaction. These publications corroborate the findings of this research.
9.3.1.2 The H&S and quality outcomes model
The H&S and quality model indicated that higher levels of project orientation
and team orientation would lead to improved levels of H&S and quality
outcomes. For this finding also, there is support in the literature.
Thomas et al. (2002) for instance found teamwork to be an essential
determinant of quality outcomes. It was also found in this research that
projects that under-performed were the “adversarial, conflict-ridden projects
concerned with individual, or organisational self-preservation” (Thomas et
al., 2002) – in other words projects with an absence of team and project
orientation. In an analysis of 120 questionnaires, Sawacha et al. (1999)
identified inter alia worker-management relationship and management-
worker cooperation on safety (aspects of team orientation) as important
factors influencing safety performance. Control on sub-contract’s safety
behaviour and site tidiness were also identified in Sawacha et al. (ibid), and as
argued in Chapter 8, these issues can be located within project orientation.
Research validation
292
9.3.1.3 The innovation and learning model
The innovation and learning model indicated that as workforce orientation
improves CPOs exhibit greater levels of innovation and learning, and as team
orientation improves, CPOs exhibit lower levels of innovation and learning.
It has been suggested in Kululanga et al. (2001) that a climate of openness,
rewarding innovations, leadership commitment to learning, a common sense
of direction, and encouragement of employees to update their values (all
fundamental aspects of workforce orientation) are essential for learning to
take place. This corroborates the research findings. Conversely, the
suggestion that higher levels of team orientation are associated with lower
levels of innovation and learning is not supported by the literature (cf.
Kululanga et al., 2001). It also appears to be contrary to logical thinking. This
does not necessarily invalidate the research and its findings. Indeed it may be
that this research is shedding new insight on innovation and learning not
previously captured. Whilst this is debatable, what cannot be doubted is the
need for further research in this domain. As noted by an interviewee in the
convergence analysis subsection above, there could be logical reasons for this
finding such as the recognition and reward structure.
9.3.1.4 The time and cost model
The inability to develop a time and cost model indicated that cultural
orientations are not very useful predictors of time and cost outcomes. This
finding is also corroborated indirectly by the research literature on factors
influencing time and cost outcomes (cf. Kaming et al., 1997; Kog et al., 1999)
which are in the main silent on such ‘soft’ factors as those examined in this
research, instead identifying such ‘hard’ factors as design changes, labour
productivity, inadequate planning, resource shortages, inflation, errors in
taking-off, project complexity, time devoted by project manager, frequency of
meetings, monetary incentives to designer, implementation of
constructability programme, and project manager’s experience on similar
Research validation
293
projects, as the more critical determinants of time and cost outcomes of a
construction project.
9.3.2 Convergence of research findings and academic validation
The process of disseminating the findings of this research to practitioners and
the wider academic community through the publication of articles in
international academic journals and conference proceedings involved a
review and assessment of the validity of the research and its findings by
independent referees. As noted in Xiao (2002) peer review in this manner
provides an opportunity for the methodologies, meanings and interpretation
of the research to be questioned. It is a process of critical inquiry which is
meant in theory to provide an informed, fair, reasonable and professional
opinion about the merits of research work (Runeson and Loosemore, 1999).
Fenn (1997) has observed that peer review is used as the gold-standard
throughout academia in the UK. Feedback from such a process serves to
enrich research work and potentially improves its findings (Alkass et al.,
1998). During this review process, the article is sent anonymously to two –
four independent experts in areas related to the particular subject of the paper
(Xiao, 2002). The essence of anonymity (ibid) is to ensure that possible biases
or prejudice in the review are eliminated, although in reality this is not
always achieved (Runeson and Loosemore, 1999). There are four possible
outcomes of this review. These are (i) acceptance without change; (ii)
acceptance subject to minor changes; (iii) acceptance with major amendments;
or (iv) rejection (Runeson and Loosemore, 1999). In all cases the referees
provide feedback outlining the basis of their decision, often raising issues
which range from trivial to fundamental which can be incorporated in the
research to improve its validity.
During the course of this research, seven (7) conference papers have been
developed and published (or are about to be). These papers have been
Research validation
294
presented at the annual international conferences of the Association of
Researchers in Construction Management (ARCOM) (2004, 2005 & 2007), the
Construction Industry Board (CIB) W92/T23/W107 International Symposium
on Procurement Systems (2005), the biennial Postgraduate Researchers of the
Built Environment (PRoBE) Conference (2005), and the Construction
Management and Economics 25th Anniversary Conference (2007). A further
three (3) journal papers have also been published or are in the review process.
The journals targeted with these papers include Construction Management
and Economics, Engineering Construction and Architectural Management,
and the International Journal of Construction Management. These outlets
were specifically targeted for their rigorous peer review procedures.
With the continual challenge and feedback from the academic community
which have been incorporated in the research and into this thesis, the
research has been improved significantly making the findings more robust
and reliable as argued by Xiao (2002). Acceptance of the articles for
publication indicates that this research is scholarly and academically valid.
Thus it can be argued that there is convergence between the research findings
and academic validation.
9.3.3 Convergence of published research and academic validation
An important characteristic of the publications described in the preceding
sub-section is that most of the key arguments and findings of the research
reported were supported by comprehensive literature. Even where divergent
findings were reported, these were considered in the light of the extensive
literature supporting the alternative views. As shown in Table 9.4, a total of
474 references have been cited giving an average of approximately 47
references per paper. Although some of these references are duplicated due
to the similarity of the research context, there were also many distinct and
paper-specific references used to support the specific findings reported in
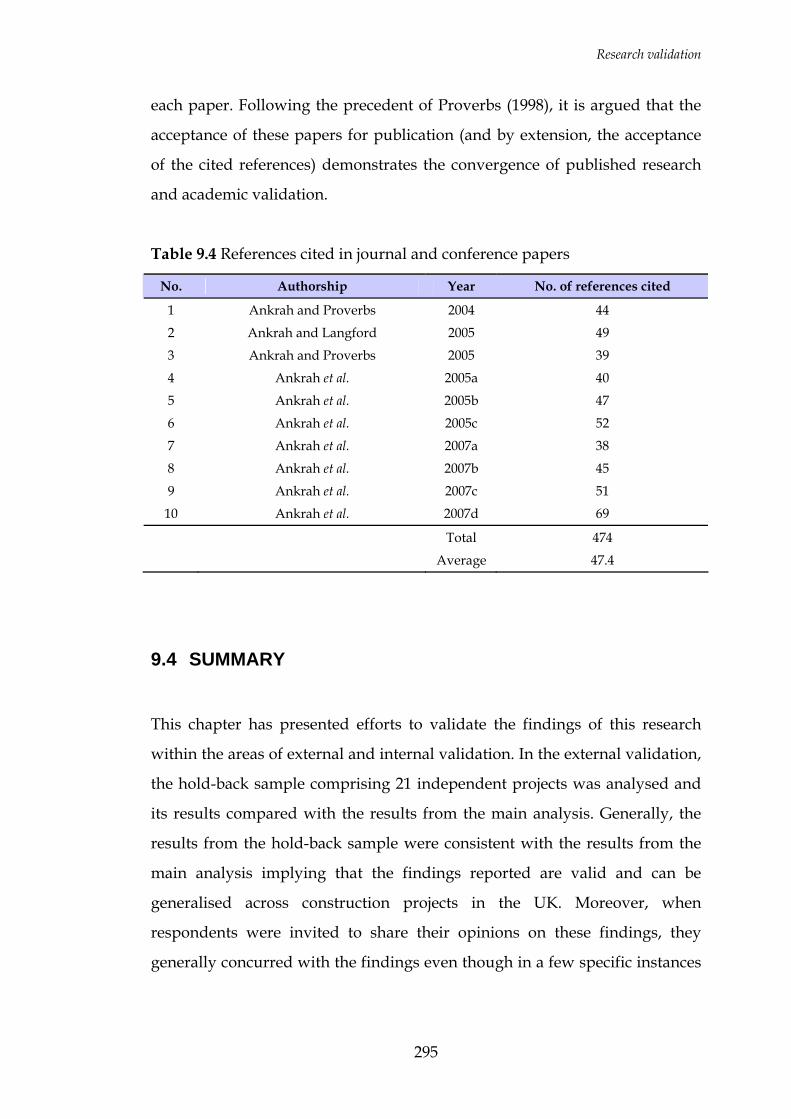
Research validation
295
each paper. Following the precedent of Proverbs (1998), it is argued that the
acceptance of these papers for publication (and by extension, the acceptance
of the cited references) demonstrates the convergence of published research
and academic validation.
Table 9.4 References cited in journal and conference papers
No. Authorship Year No. of references cited
1 Ankrah and Proverbs 2004 44
2 Ankrah and Langford 2005 49
3 Ankrah and Proverbs 2005 39
4 Ankrah et al. 2005a 40
5 Ankrah et al. 2005b 47
6 Ankrah et al. 2005c 52
7 Ankrah et al. 2007a 38
8 Ankrah et al. 2007b 45
9 Ankrah et al. 2007c 51
10 Ankrah et al. 2007d 69
Total 474
Average 47.4
9.4 SUMMARY
This chapter has presented efforts to validate the findings of this research
within the areas of external and internal validation. In the external validation,
the hold-back sample comprising 21 independent projects was analysed and
its results compared with the results from the main analysis. Generally, the
results from the hold-back sample were consistent with the results from the
main analysis implying that the findings reported are valid and can be
generalised across construction projects in the UK. Moreover, when
respondents were invited to share their opinions on these findings, they
generally concurred with the findings even though in a few specific instances
Research validation
296
they expressed scepticism. Even where there was scepticism, this was not
unanimous and therefore does not invalidate the findings.
The internal validation sought convergence of the research findings,
published research and academic validation. It is argued that the
relationships between culture and performance uncovered in the analysis are
largely supported by the literature. Ten (10) papers have been developed and
published (or are under review) in various peer reviewed academic journals
and conference proceedings. In all these papers, a significant number of
references have been cited to support the arguments advanced in these
papers. It is thus argued that this research is convergent with the established
knowledge.
In the next chapter, the conclusions of this research based on the analyses and
validation efforts will be set out. The limitations of the research and
recommendations will also be put forward.
297
CHAPTER 10: CONCLUSIONS AND RECOMMENDATIONS
10.0 INTRODUCTION
Improvement in project performance has been a recurring theme in all the
major construction industry reports. For this improvement in project
performance to be realised, it is essential to investigate systematically, factors
such as the culture within the project organisation that are widely believed to
have an impact on project performance outcomes. To this end, this research
has undertaken a study of construction projects in the UK with the aim being
to diagnose the culture within the CPO and assess its impact on project
performance outcomes. This has led to the development of a number of ‘best
practice’ culture-performance models. After summarising the entire research,
this final chapter outlines the main findings and the limitations of the
research. It also offers some recommendations for construction industry
practitioners, and some recommendations for future research.
10.1 SUMMARY OF THE RESEARCH
In the first chapter of this thesis, the aim of this research was set out as being
to determine empirically the extent to which organisational culture influences
construction project performance and the nature of this influence, and to
develop a model that will assist CPOs to assess, in terms of performance, the
possible outcomes of their cultural orientation. To help achieve this end, a
number of objectives were put forward. The summary presented here
outlines how these objectives were achieved.
Conclusions and recommendations
298
10.1.1 The UK construction industry and the performance deficit
The first objective, addressed in Chapter 2, required an examination of the
UK construction industry and its performance. The construction industry is
responsible for the delivery of the UK’s built environment, in all its various
forms. It delivers this built environment through projects, with a number of
organisations coming together to form a temporary project organisation that
undertakes the construction. Unfortunately, the industry has consistently
failed to deliver these projects to the specified requirements. This state of
affairs has inspired a significant amount of research into project performance
and factors influencing performance outcomes. Whilst several of the factors
identified in the literature are ‘soft’ factors which stem from the culture that
exists within the CPO, few direct references to organisational culture are
made in the performance literature. Even where references to organisational
culture are made in the performance literature, the extent of its impact are not
set out. This situation inevitably implies a difficulty in assessing the effects of
the cultural orientation of the CPO on performance, and the likely
performance outcomes of cultural change. This shows that there is a gap in
the knowledge on cultural orientation and performance that needs to be
explored.
10.1.2 The importance of culture
The second objective addressed in Chapter 3, required an exploration of the
phenomenon of culture and the relevant theories. The consensus of views,
established through the review of culture, suggested that culture comprises
the values and system of meanings peculiar to a group of people, that are
learned and shared by all the individuals in the group through dealing with
the basic problems of life and through their interaction with the contextual
factors relating to the environment in which they live. Culture therefore has
the ability to shape the behaviour of, not just individuals, but groups of
people as in organisations, industries and countries. This innate ability of

Conclusions and recommendations
299
culture to shape behaviour has particular relevance for the construction
industry because of the industry’s peculiar nature of contracting and product
delivery, requiring the cooperation of a myriad of participants who
sometimes have different and conflicting objectives. Unfortunately, for a long
time, the importance of culture has been understated and references to its
influence have been mainly anecdotal, with little by way of systematic
research to show the extent of its impact.
This trend has been changing over the past decade. Growing awareness of the
importance of culture in construction has seen increasing research interest
and publications on culture and related issues, though much of this still
remains anecdotal. The review demonstrated that fundamental questions of
what the cultures of CPOs are and what impacts these cultures have on
performance outcomes are yet to be investigated. It is argued that
construction industry participants need to become more aware of the
importance of this phenomenon and its manifestation and impact on the
process and product of construction business. This can only be achieved
through systematic research.
10.1.3 A conceptual model of culture and performance
For research to be undertaken, it is necessary to have appropriate frameworks
based on improvement and adaptation of existing frameworks (Tijhuis, 2001).
The third objective was therefore to develop such a framework and this was
addressed in Chapter 4. On the basis of the literature review, a conceptual
model was developed showing the contextual variables that are instrumental
in determining the organisational culture of CPOs that develops, the relevant
dimensions along which the culture of the CPO manifests, and how these
dimensions of culture subsequently influence project performance outcomes.
Conclusions and recommendations
300
On the basis of the conceptual model, three fundamental hypotheses were
proposed for testing. These hypotheses related to a difference (or lack of it) in
cultural orientation among different CPOs, a difference (or lack of it) in
performance levels of the different construction projects, and a relationship
(or lack of it) between the cultural orientations of CPOs and the project
performance outcomes. The next phase of the research involved the testing of
this conceptual framework.
10.1.4 A methodology for investigating culture and performance
Chapter 5 considered the overall research paradigm within which the
relationships highlighted in the conceptual model were to be investigated,
and the research methods appropriate within this paradigm. This chapter set
out arguments in favour of a conciliatory methodology involving both a
qualitative and a quantitative methodology. In terms of the specific research
methods for data collection, interviews and questionnaire surveys were
adopted following the precedent of Hofstede et al. (1990).
A series of semi-structured interviews were conducted with highly
experienced construction industry participants in line with the proposed
methodology. The data collected reinforced the fundamental relationships
conceptualised in the model. The model thus provided an appropriate basis
for the development of the questionnaire. The questionnaire was designed to
capture project characteristics, measure cultural orientation and measure
performance. It was argued, in line with Bandura’s social cognitive theory,
that the measurement of culture should address attitudes and perceptions,
goal-directed behaviour, and situational conditions associated with the
various dimensions of culture (Cooper, 2000). It was also argued, in line with
Takim et al. (2003), that the measures of performance assessed should be
measures associated with the goals and objectives related to the dimensions
of culture. These considerations were incorporated in the questionnaire
Conclusions and recommendations
301
design. Within culture research in construction, this approach represents a
significant departure from the norm and is novel in its application of both
qualitative and quantitative methodologies, and in its application of social
cognitive theory.
Following a successful pilot of the questionnaire, minor modifications were
made to the questionnaire based on the feedback, and the major survey was
conducted on a randomly selected sample of contractors listed in the UK
Kompass (2006) register. Altogether, 85 sets of data were generated
representing an overall response rate of 15.42%.
10.1.5 An analysis of project characteristics and the cultural orientations of
the CPOs
In Chapter 6, analysis of the data collected was undertaken to address the
first part of the fifth objective. In this chapter, descriptive statistics, chi-square
tests and Freidman’s test were utilised to provide a picture of the projects
captured in the questionnaire survey. Principal component factor analysis
and cluster analysis were then utilised alongside descriptive statistics to
analyse the cultural orientations of the CPOs. Then the Mann-Whitney test,
Kruskal-Wallis test, and non-parametric correlation analysis were employed
to explore and draw inferences about the relationships between the project
parameters and the cultural orientations of the CPOs within the sample. The
results indicated that the sample was generally representative of construction
projects in the UK. Projects of all kinds reflecting the range of projects that
contractors undertake from simple jobbing projects to very complex multi-
million pound projects, procured under different arrangements, and across
all regions of the UK were represented. Not surprisingly, the Main Contractor
was reported as the most influential participant overall. Of significance was
the fact that overall, the performance ethos of CPOs was in the order H&S–
Conclusions and recommendations
302
quality–cost–time, with H&S as the most important and time as the least
important.
Application of principal component factor analysis to the attributes of culture
assessed in the survey led to the extraction of five principal dimensions of
workforce orientation, performance orientation, team orientation, client orientation
and project orientation. Based on these five dimensions, it was found that the
CPOs can be grouped into five clusters which are significantly different along
workforce, team, client and project orientations. This provides confirmation
that CPOs do indeed have different cultures. This finding provides support
for the hypothesis H1 (refer Chapter 4) which posits that there are significant
differences in the organisational cultures of CPOs working on different
construction projects in the UK.
Analyses carried out to assess differences in cultural orientations attributable
to project parameters revealed that not all the contextual factors have an
effect on the culture of the CPO. However, there is evidence that some of the
factors do have an effect on the cultural outcomes. In particular, project size,
complexity, the influence of participants like the quantity surveyor, client and
the main contractor, the level of importance of cost and H&S, location, and
the number of design variations showed some evidence of association with
some of the dimensions of culture.
It is argued in this chapter that there is still some scope for strengthening the
orientations of the CPOs along all the five dimensions of culture. However
whether or not it is necessary to devote resources to any effort to improve
cultural orientations depends on research demonstrating that such
improvements will lead to better performance outcomes.
Conclusions and recommendations
303
10.1.6 An appraisal of project performance
In order to provide a basis for the evaluation of the impact of cultural
orientations on project performance outcomes, there was a need to assess the
performance of construction projects in the UK. This was the second part of
the fifth objective, and was addressed in Chapter 7. A variety of performance
measures including inter alia cost, time, quality, health and safety, disputes,
and productivity outcomes were assessed.
Generally, the performance levels found in this research were consistent with
other reports and surveys carried out (cf. CCF/CBPP, 1999; Constructing
Excellence, 2006; Kashiwagi et al., 2006), with the evidence suggesting that
there have been some improvements in the overall performance levels across
the construction industry. Several measures of performance were assessed in
this research. However, the application of principal component factor
analysis led to the extraction of four principal measures of performance viz;
satisfaction of participants, H&S and quality, innovation and learning, and time and
cost outcomes. When analysed across the project parameters, it was found that
whilst overall performance (the aggregation of the four performance
measures) did not vary significantly for different project types, satisfaction of
participants, H&S and quality, innovation and learning, and time and cost
outcomes did vary significantly from project to project. This finding thus
provides support for the hypothesis H2 (refer Chapter 4) which posits that
there are significant differences in the performance levels of different projects
across the UK.
10.1.7 The relationship between culture and project performance
Having established clear differences in cultural orientation and performance
levels of construction projects, the next phase of this research focused on the
examination of the data for evidence of relationships between cultural
orientations and performance outcomes. This was presented in Chapter 8 and
Conclusions and recommendations
304
addressed the final two objectives of this research. Pearson’s correlation
coefficients and stepwise multiple regression were employed in the analysis.
It was found that significant associations exist between participant
satisfaction and workforce and team orientation. Projects with higher
participant satisfaction were generally those with the higher workforce and
team orientations. Significant associations were also found to exist between
H&S and quality outcomes and project and team orientation. Projects with
better H&S and quality outcomes were generally those with higher project
and team orientations. Significant associations were also found between
innovation and learning and workforce and team orientations. Projects with
higher innovation and learning were generally those with higher workforce
orientation, but lower team orientation. Finally for the overall performance
index developed, significant associations were found with workforce and
project orientations. Projects with better overall performance were those with
higher workforce and project orientations. Although these relationships were
found to be associated with relatively small R2 values ranging from 12% to
23%, it is argued that these are significant enough to warrant attention from
practitioners and performance researchers alike.
The significant associations established through this analysis thus provides
empirical support for the main research hypothesis H3 (refer Chapter 4)
which posits that there is a significant relationship between organisational
culture and construction project performance.
10.1.8 Validation of the research
Chapter 9 presented the validation of the findings of this research within the
domains of external and internal validation. In the external validation, the
hold-back sample comprising 21 independent projects was analysed and
results were compared with those from the main analysis. Generally, the
Conclusions and recommendations
305
results from the hold-back sample were consistent with the results from the
main analysis implying that the findings reported are valid and can be
generalised across construction projects in the UK. Moreover, when
experienced practitioners were invited to share their opinions on these
findings, they generally concurred with the findings even though in a few
specific instances they expressed scepticism. Even where there was
scepticism, this was not unanimous and therefore not considered enough to
invalidate the findings. What this does suggest however is that there is still
some scope for deeper insight within this domain.
The internal validation sought convergence of the research findings,
published research and academic validation. It was shown that the
relationships between culture and performance uncovered in the analysis are
generally supported by the literature. Ten (10) papers have been developed
and published (or are under review) in various peer reviewed academic
journals and conference proceedings. In all these papers, a significant number
of references have been cited to support the arguments advanced in these
papers. It was thus argued that this research is convergent with the
established knowledge and can therefore be considered as valid.
10.2 CONCLUSIONS OF THE RESEARCH
The main conclusions drawn from the research are that:
There are five principal dimensions of culture, namely workforce
orientation, performance orientation, team orientation, client
orientation and project orientation along which the culture of a CPO
can be diagnosed.
CPOs in the UK do indeed have different cultures which are
significantly different particularly along workforce, team, client and
Conclusions and recommendations
306
project orientations. Different CPOs can therefore be distinguished
from each other along these dimensions. This finding provides support
for the hypothesis H1 which posits that there are significant differences
in the cultures of CPOs working on different construction projects in
the UK.
The culture of the CPO along the five principal dimensions varies with
key project features, in particular project size, complexity, the
influence of participants like the quantity surveyor, client and the main
contractor, the level of importance of cost and H&S, location, and the
number of design variations. In terms of these features, all construction
projects have different configurations implying that different cultural
orientations are likely to exist. At the very least, project participants
need to be aware of such possibilities. Whilst the project organisation
has little control over some of these project features, the insight into
the cultural consequences of undertaking projects with particular
features provides an opportunity for project participants to take these
into account when planning towards projects and take steps to
mitigate any undesirable cultural outcomes. Significantly, it was found
that the procurement route did not make any difference in the culture.
Clearly, it should not be taken for granted that adopting partnering for
instance as a procurement framework would automatically result in a
different cultural orientation. Participants need to work at developing
the desired culture.
Project performance levels are consistent with other reports and
surveys carried out, with the evidence suggesting that although there
have been some marginal improvements in the overall performance
levels across the construction industry, there is still some scope for
further improvement. There are also significant differences in
performance levels across different construction projects in the UK
providing support for the hypothesis H2. All measures of project
performance (at least those assessed in this research) can be subsumed
Conclusions and recommendations
307
under the four principal measures of participant satisfaction, H&S and
quality outcomes, innovation and learning, and time and cost
outcomes.
Whilst not all the dimensions of culture assessed are significant in
terms of their association with the performance measures, and not all
the measures of performance show an association with those
significant dimensions of culture, there is significant evidence and
support for the position that cultural orientation (along certain specific
dimensions of culture) has an impact on some project performance
outcomes. The significant associations found provide empirical
support for the main research hypothesis H3 which posits that there is
a significant relationship between organisational culture and
construction project performance.
In summary, culture matters. The calls for cultural change in the project
organisation are therefore justified. Research into project performance must
therefore also consider this aspect in order to evolve comprehensive
frameworks for performance improvement.
10.3 CONTRIBUTION TO KNOWLEDGE
Building on the existing knowledge on organisational culture, this research
has provided greater insight into organisational culture within a construction
project context, in particular providing empirical evidence that different
CPOs have different cultural orientations and that these different cultural
orientations are associated with different levels of performance. It has also
demonstrated that workforce, team and project orientations are the specific
dimensions of culture which have the most significant association with
project performance outcomes and as such are the dimensions that require
the attention and resources of the organisations involved in the project. This
Conclusions and recommendations
308
is not to suggest that the other dimensions i.e. performance and client
orientation are unimportant, but rather that the research did not uncover
evidence to establish their degree of importance. Four (4) statistical models
have been developed to represent the relationships between the cultural
orientations and performance outcomes, and though their predictive utility is
limited, these models do provide some guidance on the likely project
performance outcomes given specific cultural orientations. This implies that
early on during the construction process, CPOs can undertake an assessment
of their cultural orientation and based on that, forecast the probable project
performance. Where necessary, action can be taken to manage or even change
the cultural orientation in terms of the attitudes and behaviours of
participants, as well as the situational context.
By empirically associating various cultural orientations with project
performance outcomes, this research has provided some evidence that culture
does matter in the quest for performance improvement on construction
projects. The findings can thus be used as a basis for recommending or
encouraging cultural change within project organisations. It can also be used
as a basis for encouraging researchers of project performance to devote more
attention to the ‘softer’ aspects such as culture in order to evolve more
comprehensive frameworks for performance improvement.
Beyond the direct output of the research discussed above, the research has
also made significant contribution by moving the discussion of organisational
culture within the construction research context from the traditional ‘black
box’ approach towards more empirically grounded discourse. It has also
demonstrated that beyond the existing generic organisational behaviour
frameworks, it is possible to develop reliable construction-specific
frameworks that can be employed successfully in research and yield
meaningful outcomes. Indeed the framework developed in this research is
itself unique to this research, and coupled with the application of social
Conclusions and recommendations
309
cognitive theory for the measurement of culture, also represents a
contribution that can be adopted by other researchers for application in
further research.
As a result of the research undertaken, ten (10) technical papers have been
published (or will soon be) in refereed international construction journals and
conference proceedings. Full bibliographic details are provided in Appendix
A. Several more are under development.
10.4 A REFLECTION ON THE RESEARCH
This research has achieved its aim of providing a general overview of the
culture of CPOs and exposing some of the significant associations between
the culture of the CPO and construction project performance outcomes which
may be indicative of a causal effect of culture, even though an actual effect
has not been established in this research. In undertaking this study, a number
of choices have been made which have ultimately influenced the
methodology adopted, data collected, analysis undertaken and consequently,
the findings. Whilst these choices have facilitated the achievement of the
objectives of this research, they have also imposed some constraints on the
research. For instance as shown from the literature review section (refer
Chapter 3), studies of culture attempt to answer a number of key questions
about a group of people typically in relation to what, why and how a way of
doing things or responding to problems has developed. To address the
objectives of this research, the choice was made to focus on the question
relating to what way of doing things has developed on construction projects.
This choice is amenable to a quantitative approach which was thus adopted
for this study. By making this choice, the study was as a result limited to a
superficial examination of the culture within the CPO. Although this was
adequate for the purpose of achieving the research objectives, it failed to
Conclusions and recommendations
310
allow the deeper insight into the underlying assumptions and beliefs which
for some researchers (cf. Schein, 1985) is the very essence of culture.
Compounding this limitation was the number of dimensions of culture
addressed in this study which further precluded an in-depth examination of
any particular dimension of culture. To derive the maximum benefit from a
study into a phenomenon like culture, perhaps a more appropriate approach
for future research may be to focus on only one dimension of culture, asking
all the what, why and how questions to unearth the underlying assumptions
and beliefs of the project participants. This approach is more suited to a
qualitative methodology and will address a different set of objectives.
Within the main quantitative phase of the study, data on construction projects
was collected by means of a questionnaire survey of knowledgeable
informants. The use of a single informant in each case is supported by the
literature (cf. Ogbonna and Harris, 2000; Anderson, 2003). However it raises
questions of whether their perceptions are consistent with the perceptions of
other participants of the project, especially considering the multi-
organisational nature of the CPO. Research of this nature on culture will
benefit from the perceptions of a cross-section of project participants and
therefore if possible, researchers should endeavour to collect such data. Again
as indicated in Chapter 5, 85 sets of data were generated corresponding with
a 10.63% margin of error. Whilst this was adequate for the purposes of
inferential statistics, a bigger sample size would be necessary in future
research to draw firmer conclusions about the results in terms of the existence
of a cause and effect relationship between the dimensions of culture and
performance outcomes, especially with the application of factor analysis as
one of the techniques for statistical analysis.
From the above discussions, it can be seen that whilst the research
undertaken has addressed the objectives set out, and has explored a range of
techniques suitable for analysing cultural orientations and drawing inferences
Conclusions and recommendations
311
about the relationships between these orientations and performance which
can be applied in other similar studies, there is still some potential for
improving such studies to provide deeper insight into culture within CPOs.
10.5 LIMITATIONS
Beyond those highlighted in the preceding section, there are some other
potential limitations that should be borne in mind when interpreting the
findings of this research. It has been noted in Babbie (1992) that theoretical
concepts almost never have perfect indicators. Any given concept has several
possible indicators and whilst theory and empirical evidence facilitate the
identification of the most useful indicators, they do not give any guarantees
that these indicators are indeed the best. In this research, a number of
indicators have been utilised as proxies for the measurement of both culture
and performance, and as noted above they may not be perfect indicators.
Moreover, every empirical indicator has some defects (Babbie, 1992).
Although this is a potential limitation it is also important to emphasise that
significant theoretical and empirical evidence were adduced to support the
choice of these indicators. Again it was impossible to ascertain whether or not
all the respondents answered the questions with candour. Thus as recognised
in Hammond (2006), if the respondents failed to answer the questions
honestly and to the best of their recollection as envisaged, then the results
may not be a true reflection of the population. However, the application of
multiple research methods helped to obviate the potential biases.
Given that the focus of the empirical aspects of this research was entirely on
the UK, and given the macro-cultural influences implied in the thesis, it is
entirely plausible that there may be significant differences in the findings if
this study is replicated in another jurisdiction. Indeed this aspect is
recommended as a potential area for further research.
Conclusions and recommendations
312
The limitations noted here do not however undermine the validity of the
research undertaken and its main findings. It should be remembered that
scientific research is a never-ending quest aimed at the understanding of
some phenomenon which requires continuous measurement and examination
of associations (Babbie, 1992), and this research is just one step on this quest.
10.6 RECOMMENDATIONS FOR INDUSTRY
As observed earlier, one of the most important tasks of the Project Manager
(and indeed all key stakeholders) is to ensure that the optimum project
culture is developed (Riley and Clare-Brown, 2001). Within the limitations
outlined above, this research has provided some direction on what an
optimum project culture ought to be, and some indication of aspects where
there is potential for improvement in industry. A number of
recommendations can thus be put forward to provide some direction for
improvement in this regard as follows:
To improve the likelihood of achieving greater participant satisfaction,
greater innovation and learning, and better overall performance, it is
recommended that practitioners devote more effort and resources
towards making their CPOs more workforce oriented. In practical
terms this means putting more effort into motivating the workforce,
emphasising teamwork, promoting free and open communication on
site, emphasising site tidiness, recognising good performance, keeping
operatives informed of project developments, encouraging greater
workforce participation in planning and decision-making, and
encouraging communication between managers and operatives.
To improve the likelihood of achieving better H&S and quality
outcomes, and better overall performance, it is recommended that
practitioners devote more effort and resources towards making their
Conclusions and recommendations
313
CPOs more project oriented. In practical terms this means trying to
foster a greater sense of identification with the project among
participants, initiating measures to help align subcontractors’ goals
with project goals, and putting more emphasis on waste elimination.
To improve the likelihood of achieving greater participant satisfaction,
and better H&S and quality outcomes, it is recommended that
practitioners devote more effort and resources towards making their
CPOs more team oriented. In practical terms a greater team orientation
means avoiding finger-pointing, promoting a greater level of
management accessibility and approachability, free sharing of
information, and trust. It is also recommended that for innovation and
learning to flourish without compromising the team orientation,
perhaps the industry must begin to recognise and educate participants
that mistakes are acceptable, and encourage participants to resolve
from the outset of the project the issues concerning leadership, who
owns the benefits, and who bears the risk for things going wrong in
the attempts to foster innovation and learning.
In summary, culture matters. As construction organisations strive for
improved performance outcomes, it is recommended that construction
industry practitioners who are the beneficiaries of improvements in
performance devote more attention and resources towards cultivating the
right culture within their project organisations. These issues go to the heart of
participant’s commitment to the project and their motivation towards
achieving the project objectives. Some of the practical mechanisms that can be
employed in this regards are induction of new participants, providing on-
going training, offering a vision that all participants identify with, continuous
monitoring, providing performance feedback, establishing appropriate
reward structures that target team achievements, and ensuring stability by for
example retaining a competent but limited pool of subcontractors.
Conclusions and recommendations
314
10.7 RECOMMENDATIONS FOR FUTURE RESEARCH
Based on the findings of the research and the limitations that have been
noted, a number of recommendations are put forward to provide some
direction for future research endeavour in this domain as follows:
This research has revealed a number of significant associations
between the dimensions of culture and the project performance
outcomes that might be indicative of a causal effect of culture,
although causality has not actually been established. To confirm and
further validate these associations, future research in this genre must
endeavour to collect data from a bigger sample to increase the
precision of the analysis and to enable firmer conclusions to be drawn
from the models.
By addressing several dimensions of culture, this research was unable
to delve into the details of any particular dimension of culture to
unearth issues relating to the how and why particular orientations arise.
For some researchers (cf. Schein 1985) this is the very essence of
culture. A key recommendation therefore is that for future research in
this domain, rather that addressing several dimensions of culture
superficially, researchers must identify a specific dimension of culture
and investigate this to great depth to unearth the underlying
assumptions and beliefs that inform a particular orientation. Indeed,
the exploratory research presented in this thesis provides some
indication of the dimensions of culture that matter (i.e. workforce,
team and project orientations) and could in the first instance be the
focus of such in-depth research. Inductive ethnographic approaches
are preferable for this sort of research, and will enable cause and effect
relationships to be established more clearly.
Conclusions and recommendations
315
It has been found in this research that an increase in the level of
subcontracting is associated with a decline in H&S performance,
corroborating a finding in Sawacha et al. (1999) that subcontractor’s
safety behaviour is one of the factors influencing safety performance
on construction sites. Unfortunately beyond pointing out the
association between subcontracting and poor H&S, these studies do
not go further to inquire into the underlying causes of this relationship
and how it can be mitigated. With H&S becoming the most important
objective on construction projects, it is recommended that further
research be undertaken to delve deeper into the role of subcontracting
practice in undermining efforts to improve H&S performance. Given
that subcontracting is an inevitable part of construction, such research
will represent a significant contribution to knowledge.
Another significant but somewhat curious finding in this research was
the evidence pointing to the negative association between the level of
team orientation and the level of innovation and learning on the
construction project. The scepticism expressed by experienced
practitioners in relation to this finding suggests that there is a need
also for further research to delve into issues of team orientation and
the level of innovation and learning on a construction project to
ascertain the validity and generalisability of this finding. If found to be
valid, such a study will provide insight into those factors that account
for this relationship, and steps that can be taken to ensure that
innovation and learning is not at the expense of team orientation.
As indicated in section 10.5, the research context was limited to
construction projects in the UK. It is entirely plausible that there may
be significant differences in the findings if this study is replicated in
other countries. It will be interesting and useful for benchmarking
purposes to find out if differences do exist and the effects (if any) on
project outcomes. It is therefore recommended that this study is
Conclusions and recommendations
316
replicated in other countries to allow for comparative analysis to be
undertaken.
Potentially, the models presented in this research can be further
developed to provide an early warning project management toolkit,
possibly web-based, that will rely on a diagnosis of the culture within
the CPO to forecast performance outcomes. However this will require
further data collection to test and improve the rigour of the models.
10.8 SUMMARY
In summary, this research has explored empirically, the cultural orientations
of CPOs and has found specific dimensions of culture that are associated with
project performance. The conclusion that can be drawn from this is that
culture matters, and cannot be taken for granted. Research into project
performance must therefore also consider this aspect in order to evolve
comprehensive frameworks for performance improvement. Again, beyond
providing justification for the calls for cultural change in the project
organisation, this research has also identified the direction of such change,
and some of the drivers that need to be considered in trying to bring about
such change.
317
REFERENCES
ABEYSEKERA, V. (2002) Understanding “Culture” in an International
Construction Context, IN FELLOWS, R. & SEYMOUR, D. E. (eds.),
Perspectives on culture in construction, CIB report, Vol. 275, 39-51.
ABU BAKAR, R. (1998) The management practices and organisational culture
of large Malaysian construction contractors, Unpublished PhD thesis,
University of Reading, Reading.
AHADZIE, D. K., PROVERBS, D. G. & OLOMOLAIYE, P. (2005)
Construction Performance Measurement Systems: Emerging Research
Needs, IN RUDDOCK, L., AMARATUNGA, D., AOUAD, G., HAIGH,
R., KAGIOGLOU, M. & SEXTON, M. (Eds.) Fifth International
Postgraduate Research Conference. University of Salford, BUHU, 736-746.
AHADZIE, D. K., PROVERBS, D. G., OLOMOLAIYE, P. & GAMESON, R.
(2006) A conceptual predictive model for evaluating the performance
of project managers in mass house building projects, IN BALDWIN,
A., HUI, E. & WONG, F. (Eds.) Proceedings of the BEAR 2006
Construction Sustainability and Innovation/CIB W89 International
Conference on Building Education and Research, Hong Kong.
AKINSOLA, A. O. (1997) An intelligent model of variations' contingency on
construction projects, PhD. thesis, University of Wolverhampton,
Wolverhampton.
ALKASS, S., MAZEROLLE, M. & HARRIS, F. (1998) Rigour in research and
peer-review: a reply, Construction Management & Economics, 16 (2), 139.
ALLAIRE, Y. & FIRSIROTU, M. E. (1984) Theories of Organizational Culture,
Organization Studies, 5 (3), 193-226.
ALVESSON, M. (2002) Understanding organizational culture, London;
Thousand Oaks, California, SAGE.
AMARATUNGA, D. & BALDRY, D. (2002) Performance measurement in
facilities management and its relationships with management theory
and motivation, Facilities, 20 (10), 327-336.

References
318
AMERICAN HERITAGE DICTIONARY OF THE ENGLISH LANGUAGE
(2000) Fourth Edition, Houghton Mifflin Company,
http://dictionary.reference.com/search?q=culture [15/01/04].
ANDERSON, E. S. (2003) Understanding your project organization's
character, Project Management Journal, 34 (4), 4.
ANKRAH, N. A. & LANGFORD D. A. (2005) Architects and Contractors: A
comparative study of organizational cultures, Construction Management
and Economics, 23 (6), 595-607.
ANKRAH, N. A. & PROVERBS, D. (2004) Treading the softer areas of
construction management: A critical review of culture, IN
KHOSROWSHAHI, F. (ed.), Proceedings of the 20th Annual ARCOM
Conference, Edinburgh, 1, 551-558.
ANKRAH, N. A. & PROVERBS, D. (2005) A framework for measuring
construction project performance: overcoming key challenges of
performance measurement, IN KHOSROWSHAHI, F. (Ed.) Proceedings
of the 21st Annual ARCOM Conference. London, ARCOM.
ANKRAH, N. A., PROVERBS, D. & DEBRAH, Y. (2007b) Improving
satisfaction with construction project outcomes: the role of culture,
Construction Management and Economics 25th Anniversary Conference.
Reading, UK, Construction Management and Economics.
ANKRAH, N. A., PROVERBS, D. & DEBRAH, Y. (2007d) Towards a model
for diagnosing the culture of a construction project organisation,
International Journal of Construction Management, (Under review).
ANKRAH, N. A., PROVERBS, D., ANTWI, A. & DEBRAH, Y. (2005a) The
influence of organisational culture on contractor performance, IN
SULLIVAN, K. & KASHIWAGI, D. T. (Eds.) Proceedings of the CIB
W92/T23/W107 International Symposium on Procurement Systems: The
Impact of Cultural Differences and Systems on Construction Performance,
Las Vegas, 2, 373-381.
References
319
ANKRAH, N. A., PROVERBS, D., ANTWI, A. & DEBRAH, Y. (2005b) Factors
influencing organisational culture: A construction project perspective,
IN EGBU, C. O. & TONG, M. K. L. (eds.), Proceedings of the PRoBE 2005
Conference, Glasgow.
ANKRAH, N. A., PROVERBS, D., ANTWI, A. & DEBRAH, Y. (2005c)
Towards a new approach for measuring the organisational culture of
construction project organisations: Overcoming the methodological
challenges, IN EGBU, C. O. & TONG, M. K. L. (Eds.) Proceedings of the
PRoBE 2005 Conference. Glasgow.
ANON (2005) Why the skills card scheme broke down, Construction News,
(6943), 14.
ARDITI, D. & LEE, D. E. (2003) Assessing the corporate service quality
performance of design-build contractors using quality function
deployment, Construction Management and Economics, 21 (2), 175-185.
ARTAMA WIGUNA, I. P. & SCOTT, S. (2006) Relating risk to project
performance in Indonesian building contracts, Construction
Management & Economics, 24 (11), 1125.
ASHKANASY, N. M., BROADFOOT, L. E. & FALKUS, S. (2000)
Questionnaire measures of organisational culture, IN ASHKANASY,
N. M., WILDEROM, C. P. M. & PETERSON, M. F. (Eds.) Handbook of
organizational culture and climate. California, Sage.
ASSAF, S. A., AL-HAMMAD, A. M. & UBAID, A. (1996) Factors effecting
construction contractors' performance, Building Research and
Information, 24 (3), 159-163.
ATKINSON, R. (1999) Project management: cost, time and quality, two best
guesses and a phenomenon, its time to accept other success criteria,
International Journal of Project Management, 17 (6), 337.
BABBIE, E. R. (1990) Survey research methods, Belmont, California, Wadsworth
Pub. Co.
BACCARINI, D. (1996) The concept of project complexity – A review,
International Journal of Project Management, 14 (4), 201.
References
320
BAGOZZI, R. P., YOUJAE, Y. & PHILLIPS, L. W. (1991) Assessing Construct
Validity in Organizational Research, Administrative Science Quarterly,
36 (3), 421.
BAIDEN, B. K., PRICE, A. D. F. & DAINTY, A. R. J. (2006) The extent of team
integration within construction projects, International Journal of Project
Management, 24 (1), 13.
BAKER, K. A. (2002) Organizational Culture, http://www.sc.doe.gov/sc-
5/benchmark/Ch%2011%20Organizational%20Culture%2006.08.02.pd
f, [02/09/05].
BALDRY, D. (1996) Client benchmarking of contractor performance, IN
LANGFORD, D. A. & RETIK, A. (Eds.) Vol 2; Managing the construction
project and managing risk, London, 72-81.
BARTHORPE, S., DUNCAN, R. & MILLER, C. (2000) The pluralistic facets of
culture and its impact on construction, Property Management, 18 (5),
335-351.
BASS, B. M. (1990) Bass & Stogdill's Handbook of Leadership: Theory, research &
management applications, New York, Free Press.
BASSIONI, H. A., PRICE, A. D. & HASSAN, T. M. (2004) Performance
Measurement in Construction, Journal of Management in Engineering, 20
(2), 42.
BATE, S. P. (1984) The impact of organizational culture on approaches to
organizational problemsolving, Organization Studies, 5 (1), 43-66.
BBC (2002) Wembley stadium chaos 'self-inflicted',
http://news.bbc.co.uk/1/hi/uk_politics/2119413.stm, [10/10/06].
BBC (2006) Wembley Stadium faces more delays,
http://news.bbc.co.uk/1/hi/england/london/5139864.stm,
[10/10/06].
BELASSI, W. & TUKEL, O. I. (1996) A new framework for determining critical
success/failure factors in projects, International Journal of Project
Management, 14 (3), 141-151.
References
321
BELOUT, A. (1998) Effects of human resource management on project
effectiveness and success: Toward a new conceptual framework,
International Journal of Project Management, 16 (1), 21-26.
BELOUT, A. & GAUVREAU, C. (2004) Factors influencing project success: the
impact of human resource management, International Journal of Project
Management, 22, 1-11.
BLACK, C., AKINTOYE, A. & FITZGERALD, E. (2000) An analysis of success
factors and benefits of partnering in construction, International Journal
of Project Management, 18, 423-434.
BODLEY, J. H. (1994) An Anthropological Perspective, Cultural Anthropology:
Tribes, States, and the Global System.
BOOTH, J. (2005) Slow killer haunts industry, Construction News, (6943), 22-
25.
BORMAN, W. C. (1978) Exploring upper limits of reliability and validity in
performance ratings, Joumal of Applied Psychology, 63 135-144.
BRESNEN, M., EDELMAN, L., NEWELL, S., SCARBROUGH, H. & SWAN, J.
(2003) Social practices and the management of knowledge in project
environments, International Journal of Project Management, 21 (3), 157.
BRINBERG, D. & MCGRATH, J. E. (1985) Validity and the research process,
Beverly Hills; London, Sage.
BROWN, A. (1998) Organisational culture, Harlow, Pearson Education
Limited.
BRYDE, D. J. & ROBINSON, L. (2005) Client versus contractor perspectives
on project success criteria, International Journal of Project Management,
23 (8), 622.
BURNSIDE K & WESTCOTT (1999) AJ Market trends and developments in
QS services, RICS COBRA Research Seminar
CAIN, C. T. (2004) Performance measurement for construction profitability,
Victoria, Australia, Blackwell Pub.
References
322
CALIBRE (2000) CALIBRE Project Management Service,
http://buildnet.csir.co.za/calibre & http://www.calibre2000.com/#,
[28/04/05].
CCF/CBPP (1999) Survey of construction clients' satisfaction: Headline results, A
joint Construction Clients' Forum, Construction Best Practice
Programme and Carmague report.
CHAN, A. P. C., SCOTT, D. & CHAN, A. P. L. (2004) Factors Affecting the
Success of a Construction Project, Journal of Construction Engineering
and Management, 130 (1), 153-155.
CHAN, A. P. C., SCOTT, D. & LAM, E. W. M. (2002) Framework of Success
Criteria for Design/Build Projects, Journal of Management in
Engineering, 18 (3), 120.
CHAN, A. T. S. & CHAN, E. H. W. (2005) Impact of Perceived Leadership
Styles on Work Outcomes: Case of Building Professionals, Journal of
Construction Engineering & Management, 131 (4), 413.
CHAN, P., COOPER, R. & TZORTZOPOULOS, P. (2005) Organizational
learning: conceptual challenges from a project perspective,
Construction Management & Economics, 23 (7), 747.
CHERNS, A. B. & BRYANT, D. T. (1984) Studying the client's role in
construction management, Construction Management & Economics, 2 (2),
177.
CHEUNG, S.-O., NG, T. S. T., WONG, S.-P. & SUEN, H. C. H. (2003)
Behavioral aspects in construction partnering, International Journal of
Project Management, 21 (5), 333.
CHING MING, T. & HARRIS, F. (1996) Model for assessing building
contractors' project performance, Engineering Construction and
Architectural Management, 3, 187-204.
CHINYIO, E. A., OLOMOLAIYE, P. O., KOMETA, S. T. & HARRIS, F. C.
(1998) A need based methodology for classifying construction clients
and selecting contractors, Construction Management and Economics, 16,
91-98.
References
323
CHRISTENSEN, E. W. & GORDON, G. G. (1999) An Exploration of Industry,
Culture and Revenue Growth, Organization Studies, Summer, 1999.
CHUA, D. K. H., KOG, Y. C. & LOH, P. K. (1999) Critical Success Factors for
Different Project Objectives, Journal of construction engineering and
management, 125 (3), 142-150.
CIB (1999) The improving performance of the UK construction industry, A joint
Construction Industry Board/Building Report, April, 1999.
CICMIL, S. & MARSHALL, D. (2005) Insights into collaboration at the project
level: complexity, social interaction and procurement mechanisms,
Building Research & Information, 33 (6), 523.
CIDB (2001) QLASSIC: CIDB’s Long-term initiative to measure construction
quality, http://www.cidb.gov.my/main.php?cid=742, [28/01/05].
CIIBM (2004) Construction Industry Institute Benchmarking and Metrics,
http://cii-benchmarking.org/main_index.cfm, [28/04/05].
CITB (2002) Equal opportunities: Stats & Facts,
http://www.citb.co.uk/equal_ops/, [04/03/05].
CLARK, P. & BARRICK, A. (2003) Holyrood: 300 design changes in July point
to even more delays to come, Building.
COFFEY, M. W. (1996) The potential for employee involvement in
construction, IN LANGFORD, D. & RETIK, A. (Eds.) The organization
and management of construction: Shaping theory and practice. London, E &
FN Spon.
COLUMBIA ENCYCLOPEDIA (2005) The nature of culture,
http://www.encyclopedia.com/html/section/culture_TheNatureofC
ulture.asp, [02/09/05].
CONLEY, M. A. & GREGORY, R. A. (1999) Partnering on Small Construction
Projects, Journal of Construction Engineering and Management, 125 (5),
320-324.
CONSTRUCTING EXCELLENCE (2004) Culture and People,
www.constructingexcellence.org.uk, [30/11/06].
References
324
CONSTRUCTING EXCELLENCE (2006) UK construction industry registers
improved performance in 2006 Key Performance Indicators Survey,
http://www.constructingexcellence.org.uk/news/article.jsp?id=7846,
[29/01/07].
COOK, E. L. & HANCHER, D. E. (1990) Partnering. Contracting for the
future, Journal of management in engineering, 6 (4), 431-446.
COOKE, R. A. & SZUMAL, J. L. (2000) Using the Organizational Culture
Inventory to understand the operating cultures of organisations, IN
ASHKANASY, N. M., WILDEROM, C. P. M. & PETERSON, M. F.
(Eds.) Handbook of organizational culture and climate. California, Sage.
COOPER, A. (1998) Business Process Reengineering and organisational
culture, Unpublished thesis,
www.managingchange.com/bpr/bprcult/3culture.htm, [02/09/05].
COOPER, M. D. & PHILLIPS, R. A. (1995) Killing two birds with one stone:
achieving quality via total safety management, 16 (8), p3(7).
COOPER, M. D. (2000) Towards a model of safety culture, Safety Science, 36,
111-136
COSTA, D. B. & FORMOSO, C. T. (2004) Evaluating performance
measurement systems for construction companies, IN: AOUAD, G.,
AMARATUNGA, D., KAGIOGLOU, M., RUDDOCK, L. & SEXTON,
M. (Eds.), The International Salford Centre for Research and Innovation
(SCRI) Research Symposium.
COSTANTINO, N., PIETROFORTE, R. & HAMILL, P. (2001) Subcontracting
in commercial and residential construction: an empirical investigation,
Construction Management & Economics, 19 (4), 439.
CREATIVE RESEARCH SYSTEMS (2003) The survey system,
http://www.surveysystem.com/sscalc.htm, [14/07/05].
CRESWELL, J. W. (2003) Research design: qualitative, quantitative, and mixed
method approaches, Thousand Oaks, Calif., Sage Publications.
CRISP Culture and People Task Group (2002) Culture and people in
construction – a research strategy, CRISP Report, UK.
References
325
CROWLEY, L. & KARIM, A. (1995) Conceptual model of partnering, Journal
of management in engineering, 11 (5), 33-39.
CZAJA, R. & BLAIR, J. (1996) Designing surveys: a guide to decisions and
procedures, Thousand Oaks, California; London, Pine Forge Press.
DAINTY, A. R. J., BAGILHOLE, B. M. & NEALE, R. H. (2002) Coping with
construction culture: A longitudinal case study of a woman's
experiences of working on a British construction site IN: FELLOWS, R.
& SEYMOUR, D. E., Perspectives on culture in construction, CIB Report,
Vol. 275, 221-237.
DAINTY, A., BAGILHOLE, B. & GREEN, S. (Eds.) (2007) People and Culture in
Construction: A Reader, Routledge.
DAINTY, A., CHENG, M.-I. & MOORE, D. (2003) Redefining performance
measures for construction project managers: an empirical evaluation,
Construction Management & Economics, 21 (2), 209-218.
DAINTY, A. R. J., CHENG, M.-I. & MOORE, D. R. (2004) A competency-
based performance model for construction project managers,
Construction Management and Economics, 22 (8), 877-886.
DAINTY, A., CHENG, M.-I. & MOORE, D. (2005) A comparison of the
behavioral competencies of client-focused and production-focused
project managers in the construction sector, Project Management Journal,
36 (2), 39.
DEAL, T. E. & KENNEDY, A. A. (1982) Corporate cultures: the rites and rituals of
corporate life, Reading, Mass., Addison-Wesley Pub. Co.
DELOBBE, N., HACCOUN, R. R. & VANDENBERGHE, C. (2002) Measuring
Core Dimensions of Organizational Culture: A Review of Research and
Development of a New Instrument, Unpublished manuscript. Universite
catholique de Louvain, Belgium,
www.iag.ucl.ac.be/recherche/Papers/wp53.pdf, [16/05/05].
DENISON, D. R. & MISHRA, A. K. (1995) Toward a theory of organizational
effectiveness, Organization Science, 6 (2), 204-223.
References
326
DETR (2000) Building a better quality of life: A strategy for more sustainable
construction,
http://www.dti.gov.uk/construction/sustain/bql/pdf/sus_cons.pdf,
[13/06/05].
DICKSON, M. W., ADITYA, R. N. & CHHOKAR, J. S. (2000) Definition and
interpretation in cross-cultural organizational culture research: Some
pointers from the GLOBE research program, IN ASHKANASY, N. M.,
WILDEROM, C. P. M. & PETERSON, M. F. (Eds.) Handbook of
organizational culture and climate, California, Sage.
DOZZI, P., HARTMAN, F., TIDSBURY, N. & ASHRAFI, R. (1996) More-
Stable Owner-Contractor Relationships, Journal of Construction
Engineering and Management, 122, (1), 30-35.
DREXLER, J. A. & LARSON, E. W. (2000) Partnering: Why project owner-
contractor relationships change, Journal of construction engineering and
management, 126 (4), 293-297.
DTI (2004) Key Performance Indicators,
http://www.dti.gov.uk/construction/kpi/, [11/08/04].
DTI (2005) Construction Statistics Annuals 2005, Department of Trade and
Industry (HMSO), London.
DTI (2006) Construction Statistics - Output and Employment Quarter 1 2006,
Department of Trade and Industry
[http://www.dti.gov.uk/sectors/construction/ConstructionStatistics
/OutputandEmployment/quarter106/page29702.html], [15/06/06].
DUNCAN, R., NEALE, R. & BAGILHOLE, B. (2002) Equality of opportunity,
family friendliness and UK construction industry culture, IN
FELLOWS, R. & SEYMOUR, D. E. (Eds.) Perspectives on culture in
construction, CIB Report, 275.
EATON CONSULTING GROUP INC. (2002) Rebuilding the Motorway in
Croatia: Bechtel/ENKA Project, Available at:
http://www.eatonconsultinggroup.com/highlights.html [20/04/04]
References
327
EGAN, J. (1998) Rethinking construction, Construction Task Force, London,
HMSO.
EGAN, J. (2002) Accelerating change, Strategic Forum for Construction,
London.
ELDRIDGE, J. E. T. & CROMBIE, A. D. (1975) A sociology of organisations,
International Publications Service, New York.
EREZ, M. & GATI, E. (2004) A dynamic, multi-level model of culture: From
the micro level of the individual to the macro level of a global culture,
Applied psychology: An international review, 53 (4), 583-598.
FELLOWS, R. & LIU, A. (1997) Research methods for construction, Blackwell
Science, Oxford; Malden, MA, USA.
FELLOWS, R. & LIU, A. (2002) Impact of behavioural compatibility on project
procurement, IN FELLOWS, R. F. & SEYMOUR, D. E. (Eds.)
Perspectives on culture in construction, CIB report, 275.
FELLOWS, R. & SEYMOUR, D. E. (Eds.) (2002) Perspectives on culture in
construction, CIB Report.
FELLOWS, R., LANGFORD, D., NEWCOMBE, R. & URRY, S. (2002)
Construction management in practice, Oxford, Blackwell Science.
FENN, P. (1997) Rigour in research and peer review, Construction Management
& Economics, 15 (4), 383.
FENN, P., LOWE, D. & SPECK, C. (1997) Conflict and dispute in construction,
Construction Management and Economics, 15, 513-518.
FIELD, A. P. (2000) Discovering statistics using SPSS for Windows: advanced
techniques for the beginner, London; Thousand Oaks, Sage Publications.
FORD, D. N. (2002) Achieving Multiple Project Objectives through
Contingency management, Journal of Construction Engineering &
Management, 128 (1), 30.
FORTUNE, J. & WHITE, D. (2006) Framing of project critical success factors
by a systems model, International Journal of Project Management, 24 (1),
53.
References
328
GARSON, D. (2007a) Cluster Analysis,
http://www2.chass.ncsu.edu/garson/PA765/cluster.htm,
[01/01/07].
GARSON, D. (2007b) Validity,
http://www2.chass.ncsu.edu/garson/PA765/cluster.htm,
[20/03/07].
GARSON, D. G. (2006a) Reliability analysis: Key concepts and terms,
http://www2.chass.ncsu.edu/garson/pa765/reliab.htm [08/08/06]
GARSON, D. G. (2006b) Scales and standard measures: Key concepts and terms,
http://www2.chass.ncsu.edu/garson/pa765/standard.htm
[08/08/06]
GEERTZ, C. (2001) The interpretation of cultures: selected essays, New York,
N.Y., BasicBooks.
GESTELAND, R. R. (1999) Cross-cultural business behavior: marketing,
negotiating, and managing across cultures, 2nd edition, Copenhagen
Business School Press, Copenhagen.
GIDADO, K. I. (1996) Project complexity: The focal point of construction
production planning, Construction Management & Economics, 14 (3), 213.
GLOBERSON, S. & ZWIKAEL, O. (2002) The Impact of the Project Manager
on Project Management Planning Processes, Project Management
Journal, 33 (3), 58-64.
GODFREY, P. S. (1996) Control of Risk – A Guide to the Systematic
Management of Risk from Construction, CIRIA Special Publication,
London, CIRIA, 125.
GONZALEZ-DIAZ, M., ARRUNADA, B. & FERNANDEZ, A. (2000) Causes
of subcontracting: evidence from panel data on construction firms,
Journal of Economic Behavior & Organization, 42 (2), 167.
GOOD, P. I. & HARDIN, J. W. (2003) Common errors in statistics (and how to
avoid them), Hoboken, NJ, Wiley-Interscience.
GOODENOUGH, W. H. (2003) In pursuit of culture, Annual Review of
Anthropology, 32, 1-12.
References
329
GRAVES, D. (1986) Corporate culture – diagnosis and change: auditing and
changing the culture of organizations, St. Martin's Press, New York.
GREENWOOD, D. (2001) Subcontract procurement: are relationships
changing? Construction Management & Economics, 19 (1), 5.
GRIFFITH, A. (2000) Integrated management systems: a single management
system solution for project control? Engineering Construction &
Architectural Management, 7 (3), 232.
GRIFFITH, A. F., GIBSON, G. E., HAMILTON, M. R., TORTORA, A. L. &
WILSON, C. T. (1999) Project success index for capital facility
construction projects, Journal of performance of constructed facilities, 13
(1), 39-45.
GUEST, D. E., MICHIE, J., CONWAY, N. & SHEEHAN, M. (2003) Human
resource management and corporate performance in the UK, British
Journal of Industrial Relations, 41 (2), 291-314.
HAGBERG, R. & HEIFETZ, J. (2000) Corporate Culture/Organizational Culture:
Understanding and Assessment - Telling the CEO his/her baby is ugly,
http://www.hcgnet.com/html/articles/understanding-Culture.html
[2/7/03]
HAIR, J. F., ANDERSON, R. E., TATHAM, R. L. & BLACK, W. C. (1998)
Multivariate data analysis, Upper Saddle River, N.J., Prentice Hall.
HALE, A. R. (2000) Culture’s confusions, Safety science, 34, 1-14.
HALL, E. T. & HALL, M. R. (1990) Understanding cultural differences,
Intercultural Press, Yarmouth, Me.
HALL, J. R. & NEITZ, M. J. (1993) Culture: sociological perspectives, Englewood
Cliffs, N.J., Prentice Hall.
HALL, M. A. (1999) International construction management: the cultural
dimension, PhD. Thesis, Liverpool John Moores University, Liverpool.
HAMMOND, F. N. (2006) The economic impacts of Sub-Saharan Africa urban
real estate policies, PhD thesis, School of Engineering and the Built
Environment, University of Wolverhampton, Wolverhampton.
References
330
HAMMOND, P. B. (1978) An introduction to cultural and social anthropology,
New York, Macmillan Publishing Co.
HAMPDEN-TURNER, C. (1994) Corporate culture, Piatkus.
HANDLEY, P. (1997) BOT Privatisation in Asia: Distorted goals and processes,
http://wwwarc.murdoch.edu.au/wp/wp82.rtf, [23/03/04].
HANDY, C. B. (1993) Understanding organizations, Oxford University Press,
New York.
HANDY, C. B. (1995) Gods of management: the changing work of organizations,
Oxford University Press, New York.
HANNA, A. S., CAMLIC, R., PETERSON, P. A. & NORDHEIM, E. V. (2002)
Quantitative Definition of Projects Impacted by Change Orders, Journal
of Construction Engineering & Management, 128 (1), 57.
HARI, S., EGBU, C. & KUMAR, B. (2005) A knowledge capture awareness
tool: An empirical study on small and medium enterprises in the
construction industry, Engineering, Construction and Architectural
Management, 12 (6), 533-567.
HARRIS, F. & MCCAFFER, R. (2001) Modern construction management, Oxford,
UK; Malden, MA, Blackwell Science.
HARTMANN, A. (2006) The context of innovation management in
construction firms, Construction Management & Economics, 24 (6), 567.
HARVEY, R. C. & ASHWORTH, A. (1997) The Construction Industry of Great
Britain, Oxford, Laxton's.
HATCH, M. J. (1993) The dynamics of organizational culture, Academy of
Management Review, 18 (4), 657-693.
HATUSH, Z. & SKITMORE, M. (1997a) Criteria for contractor selection,
Construction Management and Economics, 15, 19-38.
HATUSH, Z. & SKITMORE, M. (1997b) Evaluating contractor pre-
qualification data: selection criteria and project success factors,
Construction Management and Economics, 15, 129-147.
HOBDAY, M. (2000) The project-based organisation: an ideal form for
managing complex products and systems? Research policy, 29, 871-893.
References
331
HOFSTEDE, G. (1984) Culture's consequences: international differences in work-
related values, Abridged ed, Sage, London; Beverly Hills.
HOFSTEDE, G. (2001) Culture's consequences: comparing values, behaviors,
institutions, and organizations across nations, London; Thousand Oaks,
California, Sage Publications.
HOFSTEDE, G. H. (1997) Cultures and organizations: software of the mind, [Rev.,
McGraw-Hill, New York.
HOFSTEDE, G. & FINK, G. (2007) Culture: organisations, personalities and
nations, European Journal of International Management, 1 (1/2), 14-22.
HOFSTEDE, G., BOND, M. H. & LUK, C. L. (1993) Individual Perceptions of
Organizational Cultures: A Methodological Treatise on Levels of
Analysis, Organization Studies, 14 (4), 483.
HOFSTEDE, G., NEUIJEN, B., OHAYV, D. D. & SANDERS, G. (1990)
Measuring organizational cultures: A qualitative and quantitative
study across twenty cases, Administrative Science Quarterly, 35 (2), 286-
316.
HOLT, G. D., OLOMOLAIYE, P. O. & HARRIS, F. C. (1994) Evaluating
prequalification criteria in contractor selection, Building and
Environment, 29, 437.
HSE (2006) Construction, Health & Safety Executive, http://www.hse-
databases.co.uk/construction/index.htm, [19/06/06].
HSIEH, T.-Y. (1998) Impact of subcontracting on site productivity: Lessons
learned in Taiwan, Journal of Construction Engineering & Management,
124 (2), 91-100.
IBERT, O. (2004) Projects and firms as discordant complements:
organisational learning in the Munich software ecology, Research policy,
33 (10), 1529-1546.
INFOPLEASE (2005) Theories of culture, The Columbia Electronic
Encyclopedia,
http://www.infoplease.com/ce6/society/A0857661.html, [10/10/05].
References
332
IVE, G., GRUNEBERG, S., MEIKLE, J. & CROSTHWAITE, D. (2004)
Measuring the competitiveness of the UK construction industry, DTI.
KADEFORS, A. (2004) Trust in project relationships - inside the black box,
International journal of project management, 22, 175-182.
KAMING, P. F., OLOMOLAIYE, P. O., HOLT, G. D. & HARRIS, F. C. (1997)
Factors influencing construction time and cost overruns on high-rise
projects in Indonesia, Construction Management and Economics, 15 (1),
83-94.
KAPLAN, R. S. & NORTON, D. P. (1992) The balanced scorecard - measures
that drive performance, Havard Business Review, 70, 71-79.
KAPLAN, R. S. & NORTON, D. P. (1996) The balanced scorecard; Translating
strategy into action, Havard Business School Press, Boston, MA.
KASHIWAGI, D. & BYFIELD, R. E. (2002) Selecting the best contractor to get
performance: On time, on budget, meeting quality expectations, Journal
of Facilities Management, 1 (2), 103-116.
KASHIWAGI, D., SAVICKY, J. & SULLIVAN, K. (2006) Is performance-based
procurement a solution to construction performance? Keynote address,
International Conference in the Built Environment in the 21st Century
(ICiBE2006). Kuala Lumpur, Malaysia.
KEESING, R. M. (1974) Theories of culture, Annual Review of Anthropology.
KERLINGER, F. N. & LEE, H. B. (2000) Foundations of behavioral research, Fort
Worth; London, Harcourt College Publishers.
KERNON, S. (2005) Cancer is 'epidemic', Construction News, (6945), 4.
KING, N. (1994) The Qualitative Research Inteview, IN CASSELL, C. &
SYMON, G. (Eds.) Qualitative methods in organizational research: a
practical guide, London; Thousand Oaks, Calif., Sage Publications.
KINNEAR, P. R. & GRAY, C. D. (2004) SPSS 12 made simple, Hove, East
Sussex; New York, Psychology Press.
KOG, Y. C., CHUA, D. K. H., LOH, P. K. & JASELSKIS, E. J. (1999) Key
determinants for construction schedule performance, International
Journal of Project Management, 17 (6), 351.
References
333
KOMPASS (2006) Kompass: the authority on British industry. [Vol.1]. Products
and services, East Grinstead: Reed Information Services.
KOTTER, J. P. & HESKETT, J. L. (1992) Corporate culture and performance, New
York, Toronto, Free Press; Maxwell Macmillan Canada; Maxwell
Macmillan International.
KULULANGA, G. K., EDUM-FOTWE, F. T. & MCCAFFER, R. (2001)
Measuring construction contractors' organizational learning, Building
Research & Information, 29 (1), 21.
KUMARASWAMY, M. M., CHAN, D. W. M., DISSANAYAKA, S. M. &
YOGESWARAN, K. (1997) Mapping Methodologies and Mixing
Methods in Construction Management Research, Proceedings of the 13th
Annual ARCOM Conference, Cambridge, UK, ARCOM, 471-480.
KUMARASWAMY, M., ROWLINSON, S., RAHMAN, M. & PHUA, F. (2002)
Strategies for triggering the required 'cultural revolution' in the
construction industry, IN: FELLOWS, R. F. & SEYMOUR, D. E. (Eds.)
Perspectives on culture in construction, CIB Report, Vol. 275.
KWAKYE, A. A. (1994) Understanding tendering and estimating, Aldershot,
Hampshire, England; Brookfield, Vt., USA, Gower Pub.
LATHAM, M. (1994) Constructing the team, Final report of the
government/industry review of procurement and contractual arrangements in
the United Kingdom construction industry, London, HMSO, Department
of Environment.
LARSON, E. (1997) Partnering on construction projects: A study of the
relationship between partnering activities and project success, IEEE
Transactions on Engineering Management, 44, 188-195.
LEUNG, M.-Y., LIU, A. M. M. & NG, S. T. (2005) Is there a relationship
between construction conflicts and participants' satisfaction?
Engineering, Construction and Architectural Management, 12 (2), 149-167.
LEUNG, M.-Y., NG, S. T. & CHEUNG, S.-O. (2004) Measuring construction
project participant satisfaction, Construction Management & Economics,
22 (3), 319.
References
334
LIM, C. S. & MOHAMED, M. Z. (1999) Criteria of project success: an
exploratory re-examination, International Journal of Project Management,
17 (4), 243-248.
LINGARD, H. & ROWLINSON, S. (2006) Letter to the Editor, Construction
Management & Economics, 24 (11), 1107-1109.
LITTLEFIELD, D. (1998) Hard hats, soft skills, People Management, 4 (24), 34.
LIU A. M. (2002) Keys to harmony and harmonic keys, In: Fellows, R. and
Seymour, D. E. (Eds.) Perspectives on culture in construction, CIB Report,
275.
LIU, A. M. M. (1999) Culture in the Hong Kong real-estate profession: a trait
approach, Habitat International, 23 (3), 413-425.
LIU, A. M. M. & WALKER, A. (1998) Evaluation of project outcomes,
Construction Management & Economics, 16 (2), 209.
LIU, A., FELLOWS, R. & FANG, Z. (2003) The power paradigm of project
leadership, Construction Management and Economics, 21 (8), 819-829.
LIU, A. M. M., ZHANG, S. & LEUNG, M. (2006) A framework for assessing
organisational culture of Chinese construction enterprises, Engineering
Construction & Architectural Management, 13 (4), 327-342.
LOOSEMORE, M. (1998) The three ironies of crisis management in
construction projects, International Journal of Project Management, 16 (3),
139.
LOOSEMORE, M. (2002) Prejudice and racism in the construction industry,
IN FELLOWS, R. & SEYMOUR, D. E. (Eds.) Perspectives on culture in
construction. CIB Report, 275.
LOPRESTI, F. (1998) New SPSS Missing Values Analysis Option,
http://www.nyu.edu/its/pubs/connect/archives/98fall/loprestimiss
ing.html, [14/11/06].
LORENZ, K. & MAROSSZEKY, M. (2004) Intercultural management for
international construction projects - A comparison of Austria and
Germany with Australia, IN: KHOSROWSHAHI, F. (Ed.) Proceedings of
the 20th Annual ARCOM Conference, Edinburgh, Vol. 1, 427-436.
References
335
LOVE, P. E. D., EDWARDS, D. J. & SOHAL, A. (2004) Total quality
management in Australian contracting organisations: pre-conditions
for successful implementation, Engineering Construction & Architectural
Management, 11 (3), 189.
LOVE, P. E. D. & HENG, L. (2000) Quantifying the causes and costs of rework
in construction, Construction Management & Economics, 18 (4), 479.
LOW, S. P. & SHI, Y. (2001) Cultural influences on organizational processes in
international projects: two case studies, Work Study, 50 (7), 276-285.
MAISEL, R. & PERSELL, C. H. (1996) How sampling works, Thousand Oaks,
California, Pine Forge Press.
MAJID, M. Z. A. & MCCAFFER, R. (1998) Factors of Non-Excusable Delays
That Influence Contractors' Performance, Journal of Management in
Engineering, 14 (3), 42-49.
MALONEY, W. F. & FEDERLE, M. O. (1990) Organizational culture in
engineering and construction organizations, University of Michigan, Ann
Arbor.
MALONEY, W. F. (2002) Construction product or service and customer
satisfaction, Journal of Construction Engineering and Management, 128 (6),
522-529.
MALONEY, W. F. (2003) Labor-Management Cooperation and Customer
Satisfaction, Journal of Construction Engineering & Management, 129 (2),
165.
MARTIN, J. (1992) Cultures in organizations: three perspectives, Oxford
University Press, New York.
MASAOKA, Y. (2003) Key elements of private infrastructure financing in the Asia-
Pacific region, Nagasaki University, http://www.econ.nagasaki-
u.ac.jp/info/ra/dp_arc/02_03/dp_0203.pdf [15/03/04].
MBUGUA, L. M. (2000) A methodology for evaluating the business
performance of UK construction companies, Unpublished PhD thesis,
School of Engineering and the Built Environment, University of
Wolverhampton, Wolverhampton.
References
336
MCCOMB, S. A., GREEN, S. G. & COMPTON, W. D. (1999) Project Goals,
Team Performance, and Shared Understanding, Engineering
Management Journal, 11 (3), 7pp.
MCFILLEN, J. M. & MALONEY, W. F. (1988) New answers and new
questions in construction worker motivation, Construction Management
& Economics, 6 (1), 35.
MCNAMARA, C. (1999) Organisational culture,
http://www.mapnp.org/library/org_thry/culture/culture.htm,
[27/02/04].
MEUDELL, K. & GADD, K. (1994) Culture and climate in short life
organizations: sunny spells or thunderstorms, International Journal of
Contemporary Hospitality Management, 6, (5), 27-32.
MICHELA, J. L. & BURKE, W. W. (2000) Organizational culture and climate
in transformations for quality and innovation, IN ASHKANASY, N.
M., WILDEROM, C. P. M. & PETERSON, M. F. (Eds.) Handbook of
organizational culture and climate, California, Sage.
MIRAGLIA, E., LAW, R. & COLLINS, P. (1999) What Is Culture?, [15/01/04].
MOSELHI, O., ASSEM, I. & EL-RAYES, K. (2005) Change Orders Impact on
Labor Productivity, Journal of Construction Engineering & Management,
131 (3), 354.
MULLINS, L. J. (1993) Management and Organisational Behaviour, Pitman
Publishing, London.
MULLINS, L. J. (2005) Management and organisational behaviour, Harlow,
England; New York, Prentice Hall/Financial Times.
MUNN, P. & DREVER, E. (1990) Using questionnaires in small-scale research: A
teachers' guide, SCRE, Edinburgh.
NAOUM, S. (2003) An overview into the concept of partnering, International
journal of project management, 21 (1), 71-76.
NEUIJEN, B. (2002) National and organisational cultures: Implicit images,
CIB Report, 275.
References
337
NEWCOMBE, R. (2003) From client to project stakeholders: a stakeholder
mapping approach, Construction Management and Economics, 21 841-
848.
NG, S. T. & SKITMORE, R. M. (1999) Client and consultant perspectives of
prequalification criteria, Building and Environment, 34, 607-622.
NGOWI, A. B. (2000) Impact of culture on the application of TQM in the
construction industry in Botswana, International Journal of Quality &
Reliability Management, 17, 442-452(11).
NICOLINI, D. (2002) In search of 'project chemistry', Construction Management
& Economics, 20 (2), 167.
OFORI, G. (2000) Challenges of construction industries in developing
countries: Lessons from various countries, 2nd International Conference
on Construction in Developing Countries: Challenges facing the construction
industry in developing countries. Gabarone, Botswana,
http://buildnet.csir.co.za/cdcproc/2nd_proceedings.html.
OGBONNA, E. & HARRIS, L. C. (2000) Leadership style, organizational
culture and performance: empirical evidence from UK companies,
International Journal of Human Resource Management, 11 (4), 766-788.
OGBONNA, E. & HARRIS, L. C. (2002) Organizational Culture: A Ten Year,
Two-Phase Study of Change in the UK Food Retailing Sector, Journal of
Management Studies, 39, 673-706.
OGC (2007) Effective Partnering: An overview for customers and providers,
http://www.ogc.gov.uk/delivery_lifecycle_effective_partnering_an_o
verview_for_customers_and_providers.asp, [16/02/07].
OLIVER, R. L. (1997) Satisfaction: a behavioral perspective on the consumer,
McGraw Hill, New York.
OLOMOLAIYE, P. O., JAYAWARDANE, A. K. W. & HARRIS, F. (1998)
Construction productivity management, Longman, Essex, England.
OMOREGIE, A. (2006) Blueprints for infrastructure and service delivery in
SubSaharan Africa, PhD thesis, The Leicester School of Architecture, De
Montfort University, Leicester.
References
338
ONS (2002) UK Standard Industrial Classification of Economic Activities 2003,
Office for National Statistics, HMSO, London.
ONS (2006) GDP: Measuring the UK's economic activity,
http://www.statistics.gov.uk/cci/nugget.asp?id=56, [24/12/06].
OSBORNE, J. W. & COSTELLO, A. B. (2004) Sample size and subject to item
ratio in principal components analysis, Practical Assessment, Research &
Evaluation, 9 (11).
OUCHI, W. G. (1981) Theory Z: how American business can meet the Japanese
challenge, Reading, Mass., Addison-Wesley.
PACKHAM, G., THOMAS, B. & MILLER, C. (2003) Partnering in the house
building sector: A subcontractor's view, International journal of project
management, 21 (5), 327-332.
PAJARES, F. (2002) Overview of social cognitive theory and of self-efficacy,
http://www.emory.edu/EDUCATION/mfp/eff.html, [01/07/05].
PANT, D. P., ALLINSON, C. W. & HAYES, J. (1996) Transferring the western
model of project organisation to a bureaucratic culture: The case of
Nepal, International journal of project management, 14 (1), 53-57.
PAYNE, M. (1996) A dictionary of cultural and critical theory, Oxford, OX, UK;
Cambridge, Mass., USA, Blackwell Reference.
PAYNE, R. L. (2000) Climate and culture: How close can they get? IN:
ASHKANASY, N. M., WILDEROM, C. P. M. & PETERSON, M. F
(Eds.) Handbook of organizational culture, Sage Publications.
PEARCE, D. (2003) The social and economic value of construction: The
construction industry's contribution to sustainable development,
London, nCRISP.
PETERS, T. J. & WATERMAN, R. H. (1982) In search of excellence: lessons from
America's best-run companies, New York, Harper & Row.
PHUA, F. T. T. & ROWLINSON, S. (2003) Cultural differences as an
explanatory variable for adversarial attitudes in the construction
industry: the case of Hong Kong, Construction Management and
Economics, 21, 777-785.
References
339
PHUA, F. T. T. & ROWLINSON, S. (2004) Operationalising culture in
construction management research: a social identity perspective in the
Hong Kong context, Construction Management and Economics, 22, 913-
925.
PICARD, R. R. & BERK, K. N. (1990) Data Splitting. American Statistician, 44
(2), 140-147.
PRIOR, G. (2005) Unions aim high for Blue Book pay review, Construction
News, (6945), 5.
PRIOR, G. (2006) Building bosses at breaking point, Construction News, (6965),
6.
PROVERBS, D. (1998) A best practice model for high-rise in situ concrete
construction based on French, German and UK contractor performance
measures, PhD thesis, School of Engineering and the Built
Environment, University of Wolverhampton, Wolverhampton.
PROVERBS, D. G. & FANIRAN, O. O. (2001) International construction
performance comparisons: a study of `European' and Australian
contractors, Engineering Construction and Architectural Management, 8
(4), 284-291.
PROVERBS, D. G., HOLT, G. D. & OLOMOLAIYE, P. O. (1997) Factors
influencing the choice of concrete supply methods, Building Research &
Information, 25 (3), 176.
PROVERBS, D. G., HOLT, G. D. & OLOMOLAIYE, P. O. (1999) Productivity
rates and construction methods for high rise concrete construction: a
comparative evaluation of UK, German and French contractors,
Construction Management and Economics, 17 (1), 45-52.
QUINN, R. E. (1988) Beyond rational management: mastering the paradoxes
and competing demands of high performance, Jossey-Bass, San
Francisco.
References
340
RAFTERY, J., MCGEORGE, D. & WALTERS, M. (1997) Breaking up
methodological monopolies: a multi-paradigm approach to
construction management research, Construction Management &
Economics, 15 (3), 291.
RAMEEZDEEN, R. & GUNARATHNA, N. (2003) Organizational culture in
construction: an employee perspective, The Australian Journal of
Construction Economics and Building, 3, (1).
REASON, P. & ROWAN, J. (1981) Issues of validity in new paradigm
research, IN REASON, P. & ROWAN, J. (Eds.) Human inquiry: a
sourcebook of new paradigm research. Chichester, Wiley.
REISNER, A. (2005) A wealth of contenders worthy of the top prize,
Construction News, (6945), 22-25.
RICS (2006) Contracts in use: A survey of building contracts in use during
2004, London, The Royal Institution of Chartered Surveyors.
RILEY, M. J. & CLARE-BROWN, D. (2001) Comparison of cultures in
construction and manufacturing industries, Journal of Management in
Engineering, 17, (3), 149-158.
RIMMER, M. (2006) Bias is shameful waste, Construction News, (6965), 14.
RITTER, M. (2003) The use of balanced scorecards in the strategic
management of corporate communication, Corporate communications:
An international journal, 8 (1), 44-59.
ROBBINS, S. P. (1998) Organizational behavior: concepts, controversies,
applications, Upper Saddle River, N.J., Prentice Hall.
ROBERTS, K. H. & BOYACIGILLER, N. A. (1993) Cross-National
Organizational Research: The Grasp of the Blind Men, De Gruyter
Studies in Organization, 51.
ROOKE, J. (2001) Developing a culture of quality in the British construction
industry: a report on research in progress, In Tijhuis, W. (Ed.) Culture
in construction - Part of the deal? CIB Proceedings, University of Twente,
The Netherlands, 255.
References
341
ROOKE, J. & SEYMOUR, D. (2002) Ethnography in the construction industry:
Competing bodies of knowledge in civil engineering, CIB Report, 275
ROOKE, J., SEYMOUR, D. & CROOK, D. (1997) Preserving methodological
consistency: a reply to Raftery, McGeorge and Walters, Construction
Management & Economics, 15 (5), 491.
ROOKE, J., SEYMOUR, D. & FELLOWS, R. (2004) Planning for claims: an
ethnography of industry culture, Construction Management and
Economics, 22, 655-662.
ROOT, D. (2002) Validating occupational imagery in construction; Applying
Hofstede's VSM to occupations and roles in the UK construction
industry, IN: FELLOWS, R. F. & SEYMOUR, D. E. (Eds.) Perspectives on
culture in construction, CIB Report, 275, 151-171.
ROSENTHAL, R. & ROSNOW, R. L. (1991) Essentials of behavioral research:
methods and data analysis, New York; London, McGraw-Hill.
ROWLINSON, S. & CHEUNG, F. Y. K. (2004) A review of the concepts and
definitions of the various forms of relational contracting, International
Symposium of the CIB W92 on Procurement Systems "Project Procurement
for Infrastructure Construction", 7 – 10 January, 2004, Chennai, India.
RUNESON, G. R. & LOOSEMORE, M. (1999) Gate-keepers or judges: peer
reviews in construction management, Construction Management &
Economics, 17 (4), 529.
RUSSELL, J. S., JASELSKIS, E. J. & LAWRENCE, S. P. (1997) Continuous
Assessment of Project Performance, Journal of Construction Engineering
and Management, 123, 64-71.
SAWACHA, E., NAOUM, S. & FONG, D. (1999) Factors affecting safety
performance on construction sites, International Journal of Project
Management, 17 (5), 309.
SAXE, J. G. (1963) "The Blind Men and the Elephant; John Godfrey Saxe's version
of the famous Indian legend."
http://www.noogenesis.com/pineapple/blind_men_elephant.html,
[19/02/04].
References
342
SCHEIN, E. (1985) Organizatonal Culture and leadership, San Francisco,
Washington, London, Jossey-Bass Publishers.
SCHEIN, E. (2000) Sense and nonsense about culture and climate IN:
ASHKANASY, N. M., WILDEROM, C. P. M. & PETERSON, M. F.
(Eds.), Handbook of organizational culture and climate, Sage, California.
SCHNEIDER, B. (2000) The psychological life of organizations IN:
ASHKANASY, N. M., WILDEROM, C. P. M. & PETERSON, M. F.
(Eds.), Handbook of organizational culture and climate, Sage, California.
SEELEY I. H. (1997) Quantity Surveying Practice, Second Edition, London,
Macmillan.
SERPELL, A. F. & RODRIGUEZ, D. (2002) Studying construction
organisational culture: Preliminary findings, IN: FELLOWS, R. F. &
SEYMOUR, D. E. (Eds.) Perspectives on culture in construction, CIB
Report, 275, 76-91.
SEYMOUR, D. & ROOKE, J. (1995) The culture of the industry and the culture
of research, Construction Management & Economics, 13 (6), 511.
SHAMMAS-TOMA, M., SEYMOUR, D. & CLARK, L. (1998) Obstacles to
implementing total quality management in the UK construction
industry, Construction Management & Economics, 16 (2), 177.
SILVERMAN, D. (1993) Interpreting qualitative data: methods for analysing talk,
text and interaction, London, Sage.
SIMON (1944) The placing and management of building contracts: report of
the central council for works and building, London, HMSO.
SKITMORE, R. M., TONE, K. & TRAN, D. (2004) The impact of culture on
project communications: Two case studies from S.E. Asia, IN
OGUNLANA (Ed.) Proceedings of the International Symposium on
Globalisation and Construction, 17-19 November. Bangkok, Thailand.
SMIRCICH, L. (1983) Concepts of culture and organisational analysis,
Administrative Science Quarterly, 28, 339-358.
SMITH, C. (2000) Organizational culture in practice, Human Resource
Development International, 3 (2), 153-158.
References
343
SMITH, L. F. (2001) Development of a multidimensional labour satisfaction
questionnaire: dimensions, validity and internal reliability, Quality in
Health Care, 10 (1), 17-22.
SMITH, M. E. (2003) Changing an organization's culture: correlates of success
and failure, Leadership & Organization Development Journal, 24, 249-261.
SMITHERS, G. L. & WALKER, D. H. T. (2000) The effect of the workplace on
motivation and demotivation of construction professionals,
Construction Management & Economics, 18 (7), 833.
SNEE, R. D. (1977) Validation of regression models: Methods and examples,
Technometrics, 19 (4), 415-428.
SOETANTO, R. (2002) Modelling satisfaction for main participants of the
construction project coalition: a study of mutual performance assessment,
Ph.D. thesis, University of Wolverhampton, Wolverhampton.
SOETANTO, R., PROVERBS, D. & COOPER, P. (1999) A conceptual model of
performance and satisfaction for main participants of construction
project coalitions, Proceedings of ARCOM 15th Annual Conference. John
Moores University, Liverpool, ARCOM.
SOETANTO, R., PROVERBS, D. G. & COOPER, P. (2002) A tool for Assessing
Contractor Performance, Journal of Construction Procurement, 8 (1), 48-
63.
SOETANTO, R., PROVERBS, D. G. & HOLT, G. D. (2001) Achieving quality
construction projects based on harmonious working relationships:
clients' and architects' perceptions of contractor performance,
International Journal of Quality and Reliability Management, 18 (4/5), 528-
548.
SPSS (2004) Base System: SPSS v13.0 for Windows, SPSS Inc.
STATSOFT (2004) Cluster Analysis,
http://www.statsoft.com/textbook/stcluan.html, [28/12/06].
STRAIGHT, R. L. (1999) Measuring Contractors' Performance, Journal of
Supply Chain Management, 35 (2), 18-28.
References
344
SULLIVAN, M. (2006) An open relationship, Construction Journal, June, 06, 9-
10.
SUTRISNA, M. (2004) Developing a knowledge based system for the valuation of
variations in civil engineering works, PhD thesis, University of
Wolverhampton, Wolverhampton.
SUTRISNA, M. & POTTS, K. (2002) Analysing typical factors for the early
prediction of variations, IN GREENWOOD, D. (Ed.) 18th annual
ARCOM conference, Newcastle, 1, 391-401.
SVENSSON, G. & WOOD, G. (2003) The dynamics of business ethics: a
function of time and culture - cases and models, Management Decision,
41, 350-361.
TAKIM, R., AKINTOYE, A. & KELLY, J. (2003) Performance measurement
systems in construction, IN GREENWOOD, D. (Ed.) 19th annual
ARCOM conference, University of Brighton, ARCOM, 423-431.
TAKIM, R., AKINTOYE, A. & KELLY, J. (2004) Analysis of Performance
Measurement in the Malaysian Construction Industry, IN
OGUNLANA, S. O., CHAREONNGAM, C., HERABET, P. &
HADIKUSUMO, B. H. W. (Eds.) Globalization and Construction, AIT
Conference Centre, Bangkok, Thailand, 533–546.
TAM, C. M. & HARRIS, F. (1996) Model for assessing building contractors'
project performance, Engineering Construction and Architectural
Management, 3 (3), 187-204.
TAYLOR, J. C. & BOWERS, D. G. (1972) Survey of organizations; a machine-
scored standardized questionnaire instrument, Center for Research on
Utilization of Scientific Knowledge, Ann Arbor, Michigan.
THARP, B. M. (2005) Diagnosing Organizational Culture,
http://www.haworth.com/haworth/assets/Diagnosing%20Org%20C
ulture.pdf, [12/12/06].
THE STRATEGIC FORUM FOR CONSTRUCTION (2003) Integration toolkit,
http://www.strategicforum.org.uk/sfctoolkit2/home/home.html,
[13/03/07].

References
345
THOMAS, R., MAROSSZEKY, M., KARIM, K., DAVIS, S. & MCGEORGE, D.
(2002) The importance of project culture in achieving quality outcomes
in construction, Proceedings IGLC-10, Gramado, Brazil.
THOMPSON, J. L. (1993) Strategic management: awareness and change, London;
New York, Chapman & Hall, University and Professional Division.
TIJHUIS, W. (Ed.) (2001) Culture in construction - Part of the deal? CIB
Publications.
TROCHIM, W. M. K. (2006) Correlation,
http://www.socialresearchmethods.net/kb/statcorr.php, [02/02/07].
TROMPENAARS, F. & HAMPDEN-TURNER, C. (1997) Riding the waves of
culture: understanding cultural diversity in business, London, Nicholas
Brealey.
TROMPENAARS, F. & HAMPDEN-TURNER, C. (1999) Riding the waves of
culture: understanding cultural diversity in business, 2nd edition, Nicholas
Brealey, London.
TROMPENAARS, F. (1994) Riding the waves of culture: understanding diversity
in global business, Irwin Professional Pub., Burr Ridge, Illinois.
TSUI, A. S. & OHLOTT, P. (1988) Multiple assessment of managerial
effectiveness: Interrater agreement and consensus in effectiveness
models, Journal of Personnel Psychology, 41, 779-803.
TURNER, R. J. (2006) Towards a theory of project management: The nature of
the project, International Journal of Project Management, 24 (1), 1.
UCLA Academic Technology Services (2006) Annotated SPSS Output - Factor
Analysis, http://www.ats.ucla.edu/stat/spss/output/factor1.htm,
[10/08/06].
VAN DEN BERG, P. T. & WILDEROM, C. P. (2004) Defining, Measuring, and
Comparing Organisational Cultures, Applied Psychology, 53 (4), 570-582.
WALKER, D. H. T. (1997) Choosing an appropriate research methodology,
Construction Management & Economics, 15 (2), 149.

References
346
WARRACK, B. J. & SINHA, M. N. (1999) Integrating safety and quality:
building to achieve excellence in the workplace, Total Quality
Management, 10 (4/5), 779.
WEEKLEY, J. A. & GIER, J. A. (1989) Ceiling in the reliability and validity of
performance ratings: The case of expert raters, Academy of Management
Journal, 32 (1), 213.
WHITE, D. & FORTUNE, J. (2002) Current practice in project management -
an empirical study, International Journal of Project Management, 20 (1), 1.
WILDEROM, C. P. M., GLUNK, U. & MASLOWSKI, R. (2000) Organizational
culture as a predictor of organisational performance, IN
ASHKANASY, N. M., WILDEROM, C. P. M. & PETERSON, M. F.
(Eds.) Handbook of organizational culture and climate. California, Sage.
WILSON, F. (1999) Organizational culture and control, Organization Behaviour,
101-118.
WOOD, R. & BANDURA, A. (1989) Social cognitive theory of organizational
management, Academy of Management Review, 14 (3), 361-384.
WORLDBANK (1997) Expanding the Measure of Wealth: Indicators of
Environmentally Sustainable Development, Environment Department,
The World Bank, Washington DC.
XIAO, H. (2002) A comparative study of contractor performance based on
Japanese, UK and US construction practice, PhD thesis, SEBE,
University of Wolverhampton, Wolverhampton.
XIAO, H. & PROVERBS, D. (2002a) Construction time performance: an
evaluation of contractors from Japan, the UK and the US, Engineering
Construction and Architectural Management, 9 (2), 81-89.
XIAO, H. & PROVERBS, D. (2002b) The performance of contractors in Japan,
the UK and the USA: a comparative evaluation of construction cost,
Construction Management and Economics, 20 (5), 425-435.
References
347
XIAO, H. & PROVERBS, D. (2002c) The performance of contractors in Japan,
the UK and the USA: an evaluation of construction quality,
International Journal of Quality and Reliability Management, 19 (6/7), 672-
687.
XIAO, H. & PROVERBS, D. (2003) Factors influencing contractor
performance: an international investigation, Engineering Construction
and Architectural Management, 10 (5), 322-332.
ZHANG, S. B. & LIU, A. M. M. (2006) Organisational culture profiles of
construction enterprises in China, Construction Management and
Economics, 24 (8), 817-828.
ZUO, J. & ZILLANTE, G. (2006) Project culture within construction projects -
A pilot case study, The international journal of construction management, 6
(2), 15-29.
348
BIBLIOGRAPHY
ABUKHDER, J. (2003) Centre for the Built Environment (CBE) Seminar,
Glasgow.
AKINSOLA, A. O., POTTS, K. F., NDEKUGRI, I. & HARRIS, F. (1997)
Identification and evaluation of factors influencing variations on
building projects, International Journal of Project Management, 15, 263-
267.
ALARCON, L. F. & MOURGUES, C. (2002) Performance Modelling for
Contractor Selection, Journal of Management in Engineering, 18 (2), 52-60.
ALVESSON, M. (2002) Understanding organizational culture, SAGE, London;
Thousand Oaks, Calif.
AMARATUNGA, D. & BALDRY, D. (2002) Performance measurement in
facilities management and its relationships with management theory
and motivation, Facilities, 20, 327-336.
ANKRAH, N. A. (2003) A Comparative Study of The Organizational Cultures of
Architectural Practices and Construction Firms, M.Sc. thesis, University of
Strathclyde, Glasgow.
ARDITI, D. & LEE, D. E. (2003) Assessing the corporate service quality
performance of design-build contractors using quality function
deployment, Construction Management and Economics, 21, 175-185.
ASHKANASY, N. M., WILDEROM, C. P. M. & PETERSON M. F. (2000)
Handbook of organizational culture, Sage Publications.
BABA, K. (1996) Development of construction management based on regional
culture, IN LANGFORD, D. A. & RETIK, A. (Eds.) Vol 1; Managing the
construction enterprise, 119-128.
BALDRY, D. (1996) Client benchmarking of contractor performance, IN
LANGFORD, D. A. & RETIK, A. (Eds.) Vol 2; Managing the construction
project and managing risk, 72-81.
BARTHORPE, S. (2002) The Origins and Organisational Perspectives of
Culture, CIB Report, 7-24.
Bibliography
349
BREMEN, M. & MARSHALL, N. (1998) Partnering strategies and
organisational cultures in the construction industry, IN HUGHES, W.
(Ed.) ARCOM, Reading, 465-476.
CHINYIO, E. A., OLOMOLAIYE, P. O., KOMETA, S. T. & HARRIS, F. C.
(1998) A need based methodology for classifying construction clients
and selecting contractors, Construction Management and Economics, 16,
91-98.
COSTA, D. B., LIMA, H. R. & FORMOSO, C. T. (2004) Performance
measurement systems for benchmarking in the Brazilian construction
industry, IN: OGUNLANA, S. O., CHAREONNGAM, C., HERABET,
P. & HADIKUSUMO, B. H. W. (Eds.), Globalization and Construction,
AIT Conference Centre, Bangkok, Thailand, 1030-1039.
DESTER, W. S. & BLOCKLEY, D. I. (1995) Safety – behaviour and culture in
construction, Engineering Construction and Architectural Management, 2,
17.
FRANKS, A. (2001) Organisational culture - make of it what you will,
Clinician in Management, 10, 14-22.
HALL, M. A. & JAGGAR, D. M. (1997) Should Construction Enterprises,
Working Internationally, Take Account of Cultural Differences in
Culture?, ARCOM, Cambridge, 1-10.
HAMADA, T. (1994) Anthropology and organizational culture, IN
HAMADA, T. & SIBLEY, W. E. (eds.) Anthropological perspectives on
organizational culture, 9-62.
HANCOCK, M., VACHIRA-ANGSANA, K. & ROOT, D. (1997) The effects of
culture on communication in multi national construction
organizations: an Australian-Thai case study, CIB report, 251-260.
HANDY, C. B. (2001) The elephant and the flea: looking backwards to the future,
Hutchinson, London.
HARLOW, E. & HEARN, J. (1995) Cultural Constructions: Contrasting
Theories of Organizational Culture and Gender Construction, Gender
Work and Organization, 2, 180.
Bibliography
350
HEARN, J. (1993) Men and Organisational Culture, Organisations, gender and
power, Coventry, 26-31.
HOFSTEDE, G. J. (2000) Organisational Culture: Siren or Sea Cow? A Reply
to Dianne Lewis, Strategic Change, 9, 135-138.
HOOD, J. N. & LOGSDON, J. M. (2002) Business ethics in the NAFTA
countries, Journal of Business Research, 55, 883-890.
INKELES, A. & SASAKI, M. S. (1996) Comparing nations and cultures: readings
in a cross-disciplinary perspective, Prentice Hall, Englewood Cliffs, N.J.
JACKSON, S. & HINCHLIFFE, S. (1999) Improving organisational culture
through innovative development programmes, International Journal of
Health Care Quality Assurance, 12, 143-148.
JARVIS, R., CURRAN, J., KITCHING, J. & LIGHTFOOT, G. (2000) The use of
quantitative and qualitative criteria in the measurement of
performance in small firms, Journal of Small Business and Enterprise
Development, 7, 123-134.
KANJI, G. K. & WONG, A. (1998a) Quality culture in the construction
industry, Total Quality Management, 9, S133-S140.
KANJI, G. K. & WONG, A. (1998b) Quality culture in the construction
industry, IN KANJI, G. K. (Ed.) Total quality management: business
excellence through quality culture, Sheffield, S133-S140.
KAPLAN, R. S. & NORTON, D. P. (1996) The balanced scorecard; Translating
strategy into action, Havard Business School Press, Boston, MA.
KIRK WALKER, S. (1996) Organisational culture: gender and the
management of project teams in construction industry, Vol 1; Team,
Paris, 219-226.
KNODE, T. & COOK, P. (2003) Evaluation of Contractor HSE Performance-
The Industry at a Crossroad, Journal of Petroleum Technology, 55, 26-27.
KUMAR, H. (2000) Learning organisational culture, Management Accountant,
35, 774-776.
Bibliography
351
KWAN, A. Y. & OFORI, G. (2001) Chinese culture and successful
implementation of partnering in Singapore's construction industry,
Construction Management and Economics, 19, 619-632.
LANGFORD, D. A. & MALE, S. (2001) Strategic management in construction,
2nd, Blackwell Science, Malden, MA.
LEWIS, D. (2000) The Usefulness of the Organisational Culture Concept: A
Response to Gert Jan Hofstede's comments, Strategic Change, 9, 139.
LINE, M. B. (1999) Types of organisational culture, Library Management, 20,
73-75.
LIU, A. M. M. & LAI YIN, N. (1995) Performance of Chinese Contractors in
Hong Kong, IN RICE, D. (Ed.) Habitat and the high-rise: tradition and
innovation. Amsterdam, Lehigh University, 179-196.
LYNCH, R. L. & CROSS, K. F. (1995) Measure up: yardsticks for continuous
improvement, Blackwell business, Cambridge.
MACCOBY, M. (1994) The Corporation as a Part-Culture, IN HAMADA, T. &
SIBLEY, W. E. (Eds.) Anthropological perspectives on organizational
culture, 267-278.
MAHMOUD, S. Y. & SCOTT, S. (2002) The development and use of key
performance indicators by the UK construction industry, IN
GREENWOOD, D. J. (Ed.) 18th Annual ARCOM Conference, Newcastle-
upon-Tyne, 2 587-594.
MARTINS, E. C. & TERBLANCHE, F. (2003) Building organisational culture
that stimulates creativity and innovation, European Journal of Innovation
Management, 6, 64-74.
MCCAFFER, R. (1997) Assessment of Work Performance of Maintenance
Contractors in Saudi Arabia, Journal of Management in Engineering, 13,
91.
MCCARTHY, E. (1998) The Dynamics of Culture, Organisational Culture and
Change, Ai and Society, 12, 155-184.
Bibliography
352
MCLEOD, J. R. & WILSON, J. A. (1994) Corporate Culture Studies and
Anthropology: An Uneasy Synthesis, IN HAMADA, T. & SIBLEY, W.
E. (Eds.) Anthropological perspectives on organizational culture, 279-292.
MEIJER, S. D. & SCHAEFER, W. F. (1997) Conditions for An Optimal Safety
Culture in Construction, CIB Report, 122-132.
MOLENAAR, K., BROWN, H., CAILE, S. & SMITH, R. (2002) Corporate
Culture: A Study of Firms with Outstanding Construction Safety,
Professional Safety, 47, 18-27.
MORTIMER, S. (2000) how the university's construction courses are
contributing to the industry's change of culture, Construction Manager,
6, 11-12.
NASH, M. (1994) Is Culture "Good" in the Microcosm of the Firm", IN
HAMADA, T. & SIBLEY, W. E. (Eds.) Anthropological perspectives on
organizational culture, 293-300.
NEELY, A. (1999) The performance measurement revolution: why now and
what next?, International Journal of Operations & Production Management,
19 (2), 205-228.
NEELY, A., RICHARDS, H., MILLS, J., PLATTS, K. & BOURNE, M. (1997)
Designing performance measures: A structured approach, International
Journal of Operations & Production Management, 17 (11), 1131-1152.
NG, S. T. & SKITMORE, R. M. (1999) Client and consultant perspectives of
prequalification criteria, Building and Environment, 34, 607-622.
NGOWI, A. B. (1997) Impact of Culture on Construction Procurement, Journal
of Construction Procurement, 3, 3-15.
NOLAN, R. W. (1994) Organizational Culture and the Development Crisis, IN
HAMADA, T. & SIBLEY, W. E. (Eds.) Anthropological perspectives on
organizational culture, 373-396.
OFORI, G. (2000) Globalization and construction industry development:
research opportunities, Construction Management and Economics, 18,
257-262.
Bibliography
353
OGBONNA, E. (1992) Managing Organisational Culture: Fantasy or Reality?,
Human Resource Management Journal, 3, 42.
OLUWOYE, J. O. & CAROLAN, C. G. (1996) Modelling Building Sub-
Contractor Performance: A Case Study of the NSW Construction
Industry, CIB Report, 205-218.
PARKER, R. & BRADLEY, L. (2000) Organisational culture in the public
sector: evidence from six organisations, International Journal of Public
Sector Management, 13, 125-141.
RASHID, M. Z. A., SAMBASIVAN, M. & JOHARI, J. (2003) The influence of
corporate culture and organisational commitment on performance,
Journal of Management Development, 22, 708-728.
RAWSTRON, A. (1998) The Construction Act: changing the culture, Structural
Engineer, 76, 305.
REIMAN, T. & OEDEWALD, P. (2002) The assessment of organisational
culture A methodological study, Vtt Tiedotteita, ALL.
REYNOLDS, P. C. (1994) Corporate Culture on the Rocks, IN HAMADA, T. &
SIBLEY, W. E. (Eds.) Anthropological perspectives on organizational
culture, 301-310.
ROBSON, G. (1999) The Hong Kong construction worker - what safety
culture?, Safety and Health Practitioner, 17, 24-29.
ROOKE, J. (1997) Developing a more empirical approach to culture, attitude
and motivation in construction management research: A critique and a
proposal, Journal of Construction Procurement, 3, 45-55.
RUSSELL, J. S. & JASELSKIS, E. J. (1992) Predicting Construction Contractor
Failure prior to Contract Award, Journal of Construction Engineering and
Management, 118, 791.
SEYMOUR, D. E. & FELLOWS, R. F. (1999) Towards a culture of quality in
the UK construction industry, IN OGUNLANA, S. O. (Ed.) Profitable
partnering in construction procurement, Chiang Mai; Thailand, 511-522.
Bibliography
354
SOMMERVILLE, J. & SULAIMAN, N. F. (1997) The culture for quality within
the UK construction industry: Temporal relatedness and dominance,
Total Quality Management, 8, S279-S285.
SPIEGEL, M. R. (1972), Schaum’s outline of theory and problems of statistics.
First edition, McGraw-Hill.
SUN, H. C. (2002) The relationship between organisational culture and its
national culture: a case study, International Journal of Human Resources
Development and Management, 2, 78-96.
TAKIM, R. & AKINTOYE, A. (2002) Performance indicators for successful
construction project performance, IN GREENWOOD, D. J. (Ed.) 18th
Annual Association of Researchers in Construction Management (ARCOM)
Conference, Newcastle-upon-Tyne, 2 545-556.
TAYEB, M. (1994) Japanese managers and British culture: a comparative case
study, International Journal of Human Resource Management, 5, 145.
TIERNEY, C. J. (1999) An organisational culture change, Organisations and
People, 6, 2-9.
WILSON, E. (2000) Inclusion, exclusion and ambiguity: the role of
organisational culture, Personnel Review, 29, 274-303.
WONG, C. H., HOLT, G. & HARRIS, P. (2001) Multi-criteria selection or
lowest price? Investigation of UK construction clients' tender
evaluation preferences, Engineering, Construction and Architectural
Management, 8, 257-271.
XIAO, H., PROVERBS, D., SHAW, T. & HOLT, G. (2000) A new approach to
comparing the performance of contractors internationally, Association
of Researchers in Construction Management, Glasgow, 117-126.
YASAMIS, F., ARDITI, D. & MOHAMMADI, J. (2002) Asessing contractor
quality performance, Construction Management and Economics, 20, 211-
223.
ZAIRI, M. (1992) TQM-based performance measurement: practical guidelines,
Letchworth: Technical Communications.
Appendices
355
Appendix A Details of publications
ANKRAH, N. A. & PROVERBS, D. (2004) Treading the softer areas of construction management: A
critical review of culture, In: Khosrowshahi, F. (ed.), Proceedings of the 20th Annual ARCOM
Conference, Edinburgh.
ANKRAH, N. A. & LANGFORD, D. A. (2005) Architects and Contractors: A comparative study of
organizational cultures, Construction Management and Economics, 23 (6), 595-607.
ANKRAH, N. A. & PROVERBS, D. (2005) A framework for measuring construction project
performance: overcoming key challenges of performance measurement, In: Khosrowshahi, F.
(ed.), Proceedings of the 21st Annual ARCOM Conference, London.
ANKRAH, N. A., PROVERBS, D., ANTWI, A. & DEBRAH, Y. (2005a) The influence of organisational
culture on contractor performance, In: Sullivan, K. and Kashiwagi, D.T. (eds.) Proceedings of the
2005 CIB W92/T23/W107 International Symposium on Procurement Systems: The Impact of Cultural
Differences and Systems on Construction Performance, Las Vegas.
ANKRAH, N. A., PROVERBS, D., ANTWI, A. & DEBRAH, Y. (2005b) Factors influencing
organisational culture: A construction project perspective, In: Egbu, C. O. and Tong, M. K. L.
(eds.), Proceedings of the PRoBE 2005 Conference, Glasgow. [Best Paper – Runner up]
ANKRAH, N. A., PROVERBS, D., ANTWI, A. & DEBRAH, Y. (2005c) Towards a new approach for
measuring the organisational culture of construction project organisations: Overcoming the
methodological challenges, In: Egbu, C.O. and Tong, M.K.L. (eds.), Proceedings of the PRoBE
2005 Conference, Glasgow.
ANKRAH, N. A., PROVERBS, D. & DEBRAH, Y. (2007a) A cultural profile of construction project
organisations in the UK, 23rd Annual ARCOM Conference. Belfast, ARCOM, (In press).
ANKRAH, N. A., PROVERBS, D. & DEBRAH, Y. (2007b) Improving satisfaction with construction
project outcomes: the role of culture, Construction Management and Economics 25th Anniversary
Conference. Reading, UK, Construction Management and Economics.
ANKRAH, N. A., PROVERBS, D. & DEBRAH, Y. (2007c) Factors influencing the culture of a
construction project organisation: an empirical investigation, Engineering Construction and
Architectural Management, (Under review).
ANKRAH, N. A., PROVERBS, D. & DEBRAH, Y. (2007d) Towards a model for diagnosing the culture
of a construction project organisation, International Journal of Construction Management, (Under
review).
Appendices
356
Appendix B Preliminary questionnaire survey
To Whom It May Concern:
Dear Sir or Madam,
REQUEST FOR ASSISTANCE WITH RESEARCH INTO ORGANISATIONAL CULTURE
In seeking to further extend its well-established expertise in productivity and performance related
issues, the Research Institute in Advanced Technologies (RIATec), University of Wolverhampton is
sponsoring this PhD. research study into the influence of organisational culture on construction
project performance. The research aims to deepen understanding of UK construction project
performance, and the role organisational culture plays in determining project performance outcomes.
The findings of this research will be utilised in the development of a tool to help contractors and other
project participants assess their culture, identify orientations incompatible with good performance, so
that steps can be taken to initiate and manage cultural change.
Such a study requires input from industry experts whose contribution will not only help make this
research successful, but will also ensure that construction industry perspectives are central to the
research and that the outcomes are relevant and responsive to the needs of construction organisations.
It is in the light of this that I am seeking your contribution, as a construction industry expert, to this
research by way of completing the attached form which will take no more than five minutes of your
time. In return for your assistance, the findings of this survey will be fed back to you for your
consideration and further input.
This research is being undertaken under the supervision of Professor David G. Proverbs, who is
renowned as an authority in construction and project management, and is the head of Construction
and Infrastructure Department, School of Engineering and the Built Environment, RIATec, University
of Wolverhampton.
Please return the completed form in the enclosed self-addressed freepost envelope (No stamp
required).
Counting on your consideration and support, I remain.
Yours faithfully,
Nii A. Ankrah
Doctoral Research Student RIATec, University of Wolverhampton. Tel: 01902323581 Email: [email protected]

357
THE INFLUENCE OF ORGANISATIONAL CULTURE ON CONSTRUCTION PROJECT
PERFORMANCE
From a construction project organisation perspective, organisational culture can be defined as the
characteristics of project organisations including approaches to construction, human resource policies,
and the behaviour of people in project organisations. Assuming this definition;
1. Would you say that the culture of construction project organisations is reflected in the way work is
undertaken on construction projects?
Yes [ ] No [ ]
2. Would you say that the culture of construction project organisations influences project outcomes?
Yes [ ] No [ ]
3. Would you say that different construction project organisations have significantly different
organisational cultures?
Yes [ ] No [ ]
4. Is it your perception that generally, the organisational culture of construction project organisations
is one of the causes of the poor performance of the construction industry?
Yes [ ] No [ ]
General information
Please indicate your Position (Optional)
How many years of experience do you have in construction?
Are you involved in day-to-day management of construction projects?
Yes [ ] No [ ]
Thank you for taking time to complete this brief survey. Your further contribution as an industry expert to
this research by way of an interview will be extremely invaluable. Please indicate your willingness to be
interviewed briefly (either face-to-face or by phone).
Yes [ ] No [ ]
358
Please provide appropriate contact details below:
Name
Address
Postcode
Tel
Thank you for completing this survey. Please return completed form to:
Nii Amponsah Ankrah
Research Institute in Advanced Technologies
University of Wolverhampton
Room MA115, Wulfruna Street
Wolverhampton
WV1 1SB
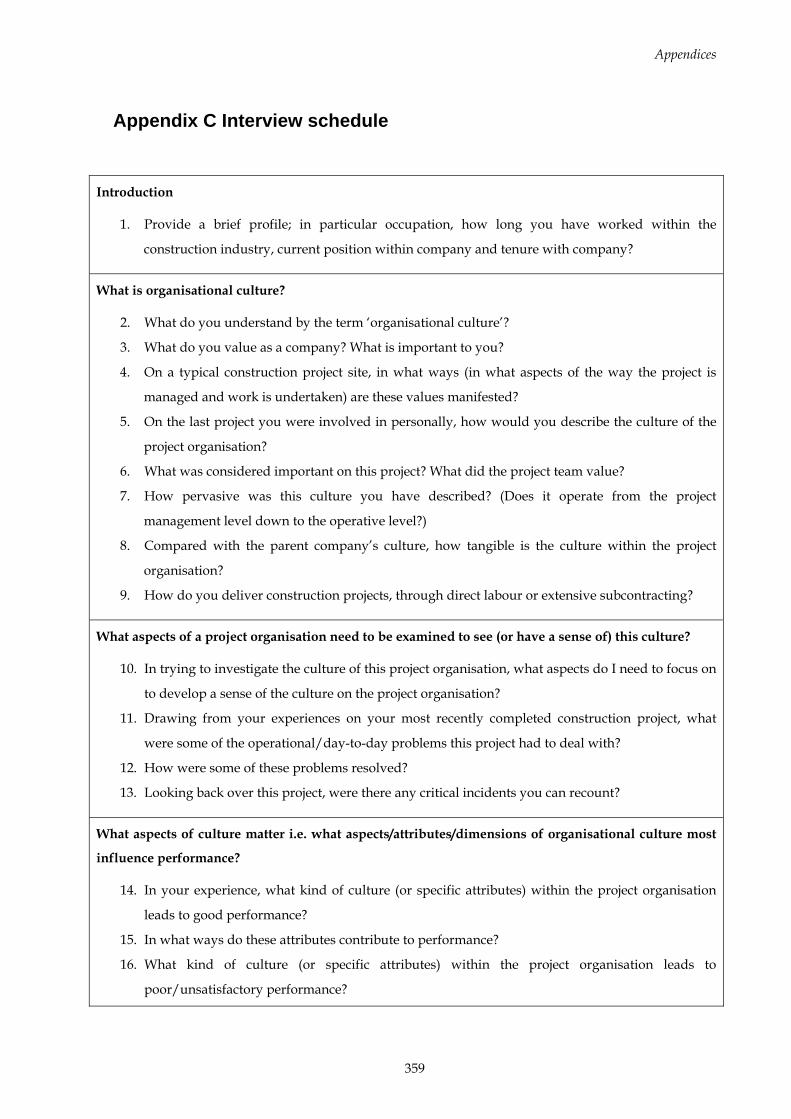
Appendices
359
Appendix C Interview schedule
Introduction
1. Provide a brief profile; in particular occupation, how long you have worked within the
construction industry, current position within company and tenure with company?
What is organisational culture?
2. What do you understand by the term ‘organisational culture’?
3. What do you value as a company? What is important to you?
4. On a typical construction project site, in what ways (in what aspects of the way the project is
managed and work is undertaken) are these values manifested?
5. On the last project you were involved in personally, how would you describe the culture of the
project organisation?
6. What was considered important on this project? What did the project team value?
7. How pervasive was this culture you have described? (Does it operate from the project
management level down to the operative level?)
8. Compared with the parent company’s culture, how tangible is the culture within the project
organisation?
9. How do you deliver construction projects, through direct labour or extensive subcontracting?
What aspects of a project organisation need to be examined to see (or have a sense of) this culture?
10. In trying to investigate the culture of this project organisation, what aspects do I need to focus on
to develop a sense of the culture on the project organisation?
11. Drawing from your experiences on your most recently completed construction project, what
were some of the operational/day-to-day problems this project had to deal with?
12. How were some of these problems resolved?
13. Looking back over this project, were there any critical incidents you can recount?
What aspects of culture matter i.e. what aspects/attributes/dimensions of organisational culture most
influence performance?
14. In your experience, what kind of culture (or specific attributes) within the project organisation
leads to good performance?
15. In what ways do these attributes contribute to performance?
16. What kind of culture (or specific attributes) within the project organisation leads to
poor/unsatisfactory performance?
Appendices
360
17. In what ways do these attributes contribute to unsatisfactory performance?
Factors influencing organisational culture
18. In your opinion, what are the factors that influence the kind of culture that develops within the
project organisation?
Specific dimensions
19. Leadership; client focus; process & team integration; delivering quality; and commitment to
people – what was the culture like in respect of these, and how did it affect performance?
Other
20. If you were to be undertaking a similar investigation into organisational culture on construction
projects, what aspects of organisational life would you focus on?
Appendices
361
Appendix D Main questionnaire survey
Initial letter to give prior notice of questionnaire survey
Dear Sir or Madam,
An Investigation of Construction Project Culture and Performance
We would like to invite your participation in a research that seeks to deepen understanding of UK
construction project performance, and the role that the culture on the project site plays in determining
project performance outcomes.
Your participation will be by way of completing a questionnaire, and this letter is to give you prior
notice of the questionnaire, which we will be mailing out shortly. The questionnaire will be based on
one of your most recently completed construction projects, and may be completed by any member of
the project management team. It will require that respondents recall their experiences on this project
and use that as a basis for responding to the questions.
You are assured that the information obtained from this survey will be kept strictly CONFIDENTIAL
and used for research purposes only.
If you require any further information or clarification, we will be happy to answer your questions. If
you would also prefer to receive the questionnaire in another format (e.g. electronically), or would like
us to send it to a specific individual in your company (e.g. a Project Manager), please do not hesitate
in contacting us. Contact details are provided below.
We do appreciate that the questionnaire will take some of your valuable time. However, without your
kind and expert input the ambitions of this research project will not be realised. It is our hope
therefore that you will be able to assist us in this research.
Thanking you in anticipation.
Yours Sincerely,
Nii A. Ankrah
SEBE, University of Wolverhampton
Tel: 01902 32 3581
Fax: 01902 32 2743
Email: [email protected]
Appendices
362
Cover letter of questionnaire survey
To Whom It May Concern:
Dear Sir or Madam,
An Investigation of Construction Project Culture and Performance
We would like to invite your participation in this research study which seeks to deepen
understanding of UK construction project performance, and the role that the culture on the project site
plays in determining project performance outcomes.
We will be very grateful if you (or one of your Project Managers) can complete the enclosed
questionnaire and return it in the SAE enclosed. The questionnaire will require that you recall your
experiences on one of your most recently completed construction project and use that as a basis for
responding to the questions. Your contribution will be most invaluable. You are assured that the
information obtained from this survey will be kept strictly CONFIDENTIAL and used for research
purposes only. Upon request, you will receive a copy of a report detailing the results of this research.
If you require any further information or clarification, we will be pleased to answer your questions.
Contact details are provided below. Alternatively you may wish to make assumptions on any matters
that are unclear to you.
We do appreciate that the questionnaire will take some of your valuable time. However, without your
kind and expert input the ambitions of this research project will not be realised. It is our hope
therefore that you will be able to assist us in this research by completing and returning the enclosed
questionnaire.
Thanking you in anticipation.
Yours Sincerely,
Nii A. Ankrah
Research Student
University of Wolverhampton.
Tel: 01902 32 3581
Fax: 01902 32 2743
Email: [email protected]
Enclosures (2)
Appendices
363
School of Engineering and the Built Environment (SEBE)
University of Wolverhampton
A QUESTIONNAIRE ON CONSTRUCTION PROJECT CULTURE AND PERFORMANCE
The questionnaire is in four (4) parts. Section A requests personal information about you and is
optional. Section B asks you to provide some information about your most recently completed
construction project. Section C requests details about the performance of this project, and the last
section (Section D) requests your opinion on the attitudes, behaviours and conditions that existed on
this project.
Please answer questions to the best of your recollection.
We do appreciate that the questionnaire will take some of your valuable time. However, without your
kind and expert input the ambitions of this research project can not be realised. To this end, we would
like to thank you very much for your valued and kind consideration.
Please return completed questionnaire in the enclosed SAE or fax to:
Nii A. Ankrah
School of Engineering and the Built Environment (SEBE)
University of Wolverhampton
Wulfruna Street
WV1 1SB
Tel: 01902 32 3581
Fax: 01902 32 2743
Email: [email protected]
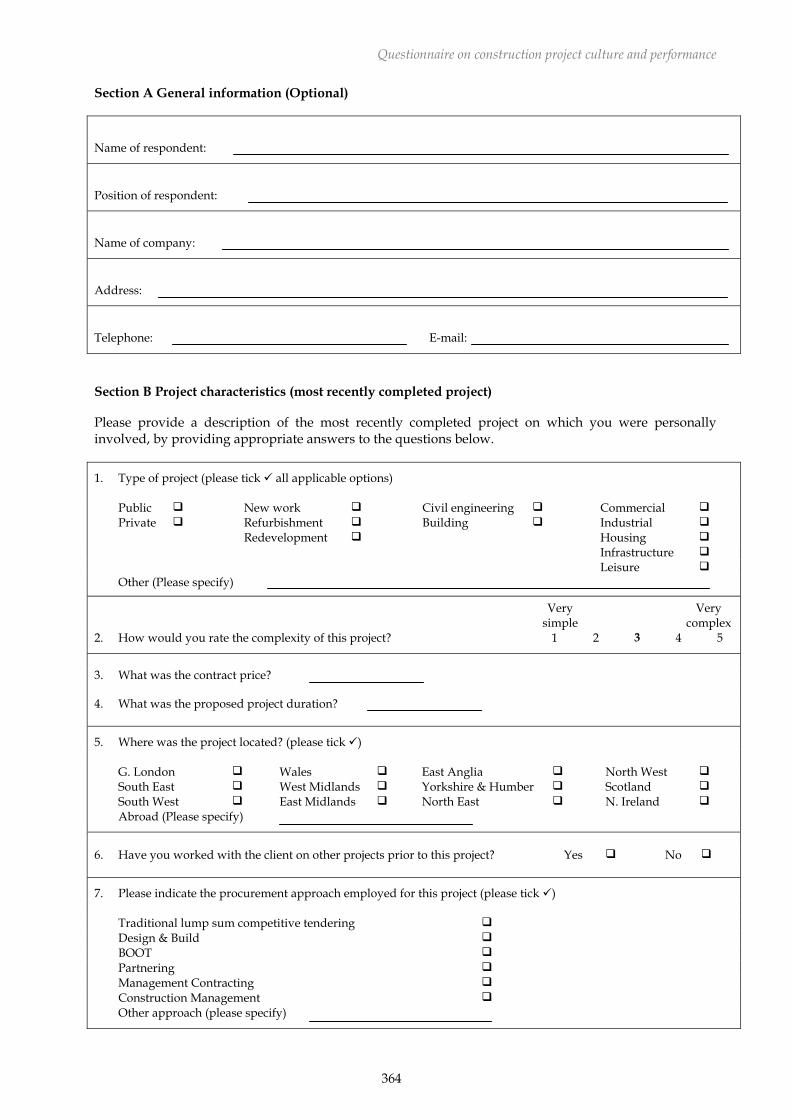
Questionnaire on construction project culture and performance
364
Section A General information (Optional)
Name of respondent:
Position of respondent:
Name of company:
Address:
Telephone: E-mail:
Section B Project characteristics (most recently completed project) Please provide a description of the most recently completed project on which you were personally involved, by providing appropriate answers to the questions below.
1. Type of project (please tick all applicable options)
Public New work Civil engineering Commercial Private Refurbishment Building Industrial Redevelopment Housing Infrastructure Leisure Other (Please specify)
Very simple
Very complex
2. How would you rate the complexity of this project? 1 2 3 4 5
3. What was the contract price? 4. What was the proposed project duration?
5. Where was the project located? (please tick )
G. London Wales East Anglia North West South East West Midlands Yorkshire & Humber Scotland South West East Midlands North East N. Ireland Abroad (Please specify)
6. Have you worked with the client on other projects prior to this project? Yes No
7. Please indicate the procurement approach employed for this project (please tick )
Traditional lump sum competitive tendering Design & Build BOOT Partnering Management Contracting Construction Management Other approach (please specify)
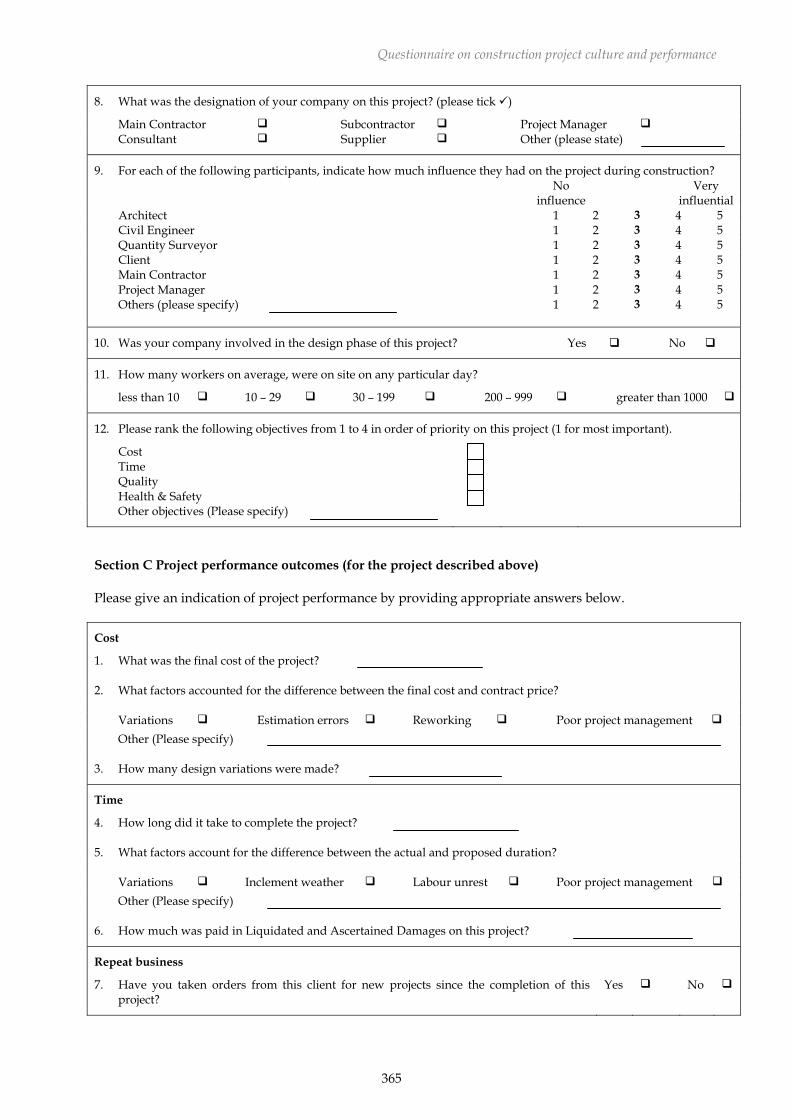
Questionnaire on construction project culture and performance
365
8. What was the designation of your company on this project? (please tick )
Main Contractor Subcontractor Project Manager Consultant Supplier Other (please state)
9. For each of the following participants, indicate how much influence they had on the project during construction?
No influence
Very influential
Architect 1 2 3 4 5 Civil Engineer 1 2 3 4 5 Quantity Surveyor 1 2 3 4 5 Client 1 2 3 4 5 Main Contractor 1 2 3 4 5 Project Manager 1 2 3 4 5 Others (please specify) 1 2 3 4 5
10. Was your company involved in the design phase of this project? Yes No
11. How many workers on average, were on site on any particular day?
less than 10 10 – 29 30 – 199 200 – 999 greater than 1000
12. Please rank the following objectives from 1 to 4 in order of priority on this project (1 for most important).
Cost Time Quality Health & Safety Other objectives (Please specify)
Section C Project performance outcomes (for the project described above) Please give an indication of project performance by providing appropriate answers below.
Cost
1. What was the final cost of the project? 2. What factors accounted for the difference between the final cost and contract price?
Variations Estimation errors Reworking Poor project management Other (Please specify)
3. How many design variations were made?
Time
4. How long did it take to complete the project? 5. What factors account for the difference between the actual and proposed duration?
Variations Inclement weather Labour unrest Poor project management Other (Please specify)
6. How much was paid in Liquidated and Ascertained Damages on this project?
Repeat business
7. Have you taken orders from this client for new projects since the completion of this project?
Yes No
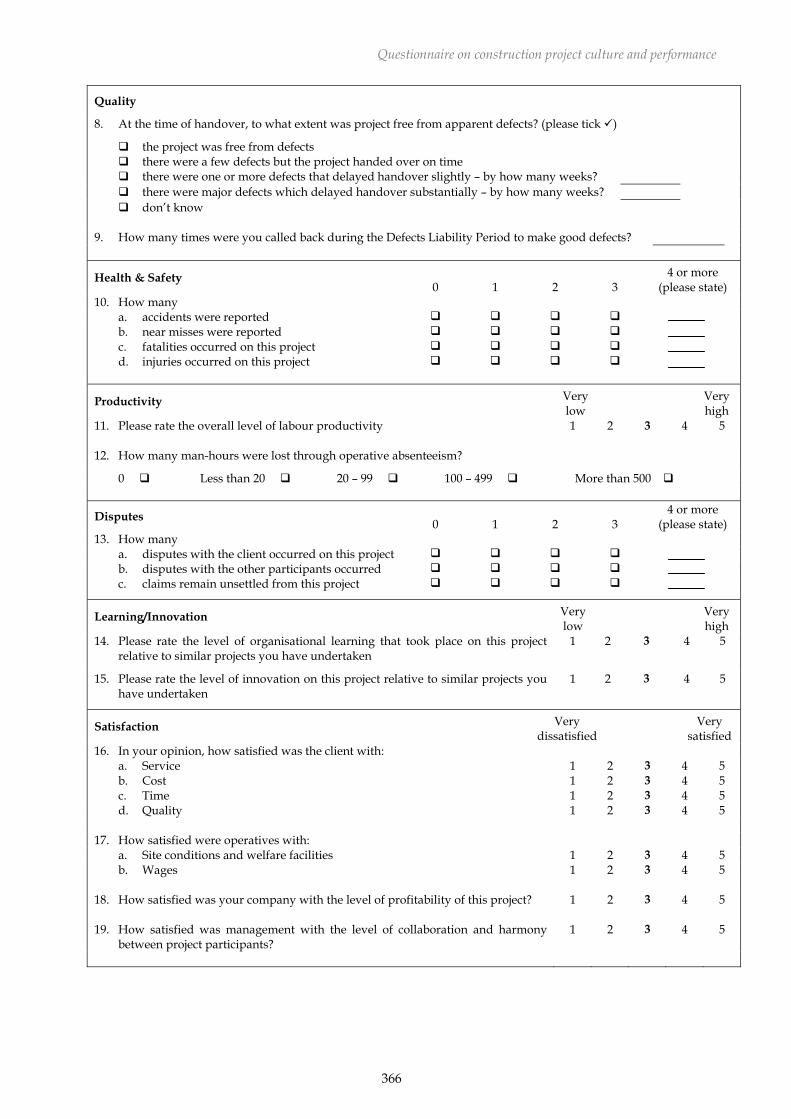
Questionnaire on construction project culture and performance
366
Quality
8. At the time of handover, to what extent was project free from apparent defects? (please tick )
the project was free from defects there were a few defects but the project handed over on time there were one or more defects that delayed handover slightly – by how many weeks? there were major defects which delayed handover substantially – by how many weeks? don’t know
9. How many times were you called back during the Defects Liability Period to make good defects?
Health & Safety 0 1 2 3
4 or more (please state)
10. How many a. accidents were reported b. near misses were reported c. fatalities occurred on this project d. injuries occurred on this project
Productivity Very low
Very high
11. Please rate the overall level of labour productivity 1 2 3 4 5 12. How many man-hours were lost through operative absenteeism?
0 Less than 20 20 – 99 100 – 499 More than 500
Disputes 0 1 2 3 4 or more
(please state) 13. How many
a. disputes with the client occurred on this project b. disputes with the other participants occurred c. claims remain unsettled from this project
Learning/Innovation Very low
Very high
14. Please rate the level of organisational learning that took place on this project relative to similar projects you have undertaken
1 2 3 4 5
15. Please rate the level of innovation on this project relative to similar projects you have undertaken
1 2 3 4 5
Satisfaction Very dissatisfied
Very satisfied
16. In your opinion, how satisfied was the client with: a. Service 1 2 3 4 5 b. Cost 1 2 3 4 5 c. Time 1 2 3 4 5 d. Quality 1 2 3 4 5
17. How satisfied were operatives with:
a. Site conditions and welfare facilities 1 2 3 4 5 b. Wages 1 2 3 4 5
18. How satisfied was your company with the level of profitability of this project? 1 2 3 4 5 19. How satisfied was management with the level of collaboration and harmony
between project participants? 1 2 3 4 5
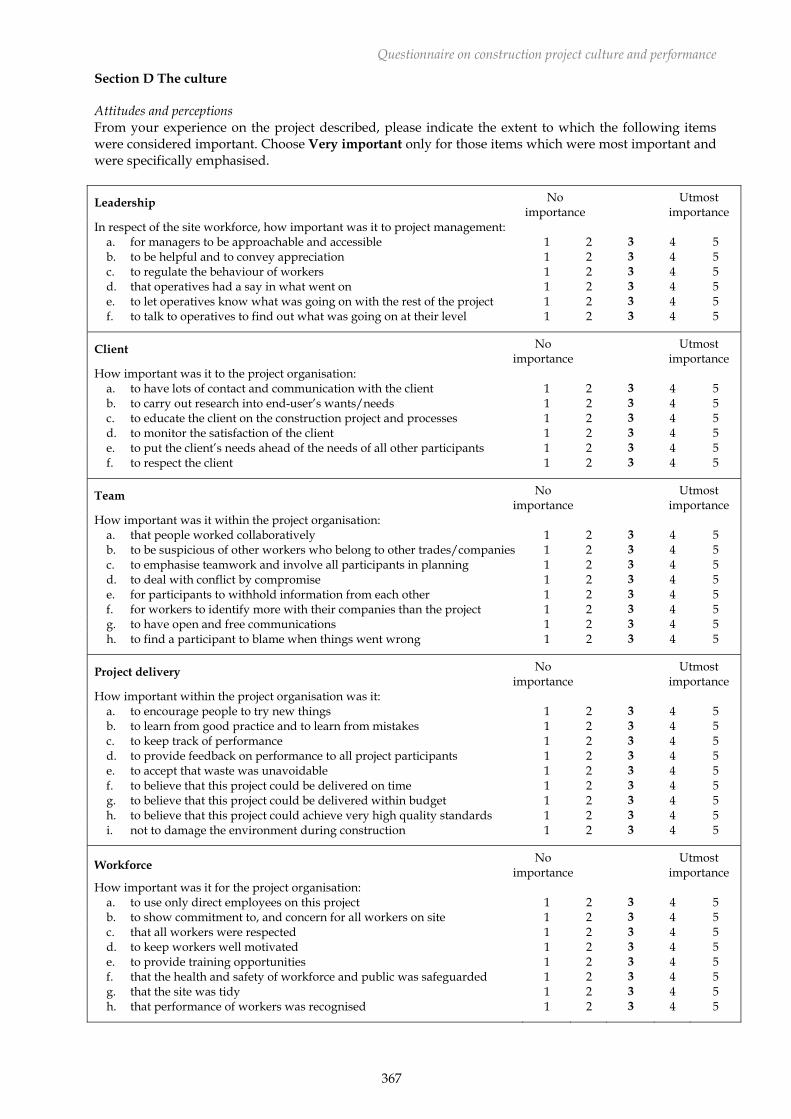
Questionnaire on construction project culture and performance
367
Section D The culture Attitudes and perceptions From your experience on the project described, please indicate the extent to which the following items were considered important. Choose Very important only for those items which were most important and were specifically emphasised.
Leadership No importance
Utmost importance
In respect of the site workforce, how important was it to project management: a. for managers to be approachable and accessible 1 2 3 4 5 b. to be helpful and to convey appreciation 1 2 3 4 5 c. to regulate the behaviour of workers 1 2 3 4 5 d. that operatives had a say in what went on 1 2 3 4 5 e. to let operatives know what was going on with the rest of the project 1 2 3 4 5 f. to talk to operatives to find out what was going on at their level 1 2 3 4 5
Client No importance
Utmost importance
How important was it to the project organisation: a. to have lots of contact and communication with the client 1 2 3 4 5 b. to carry out research into end-user’s wants/needs 1 2 3 4 5 c. to educate the client on the construction project and processes 1 2 3 4 5 d. to monitor the satisfaction of the client 1 2 3 4 5 e. to put the client’s needs ahead of the needs of all other participants 1 2 3 4 5 f. to respect the client 1 2 3 4 5
Team No importance
Utmost importance
How important was it within the project organisation: a. that people worked collaboratively 1 2 3 4 5 b. to be suspicious of other workers who belong to other trades/companies 1 2 3 4 5 c. to emphasise teamwork and involve all participants in planning 1 2 3 4 5 d. to deal with conflict by compromise 1 2 3 4 5 e. for participants to withhold information from each other 1 2 3 4 5 f. for workers to identify more with their companies than the project 1 2 3 4 5 g. to have open and free communications 1 2 3 4 5 h. to find a participant to blame when things went wrong 1 2 3 4 5
Project delivery No importance
Utmost importance
How important within the project organisation was it: a. to encourage people to try new things 1 2 3 4 5 b. to learn from good practice and to learn from mistakes 1 2 3 4 5 c. to keep track of performance 1 2 3 4 5 d. to provide feedback on performance to all project participants 1 2 3 4 5 e. to accept that waste was unavoidable 1 2 3 4 5 f. to believe that this project could be delivered on time 1 2 3 4 5 g. to believe that this project could be delivered within budget 1 2 3 4 5 h. to believe that this project could achieve very high quality standards 1 2 3 4 5 i. not to damage the environment during construction 1 2 3 4 5
Workforce No importance
Utmost importance
How important was it for the project organisation: a. to use only direct employees on this project 1 2 3 4 5 b. to show commitment to, and concern for all workers on site 1 2 3 4 5 c. that all workers were respected 1 2 3 4 5 d. to keep workers well motivated 1 2 3 4 5 e. to provide training opportunities 1 2 3 4 5 f. that the health and safety of workforce and public was safeguarded 1 2 3 4 5 g. that the site was tidy 1 2 3 4 5 h. that performance of workers was recognised 1 2 3 4 5

Questionnaire on construction project culture and performance
368
Behaviours On the project described in Section B, please indicate the extent to which you agree that the following behaviours were present. Choose Strongly agree only for those behaviours towards which conscious effort was made on this project.
Leadership Strongly disagree
Strongly agree
On this project: a. managers were distant and not approachable 1 2 3 4 5 b. managers always conveyed appreciation for the efforts of operatives 1 2 3 4 5 c. managers strictly regulated the behaviour of operatives 1 2 3 4 5 d. operatives had little say in how the project was run 1 2 3 4 5 e. operatives were kept continuously informed of what was going on 1 2 3 4 5 f. managers rarely talked to operatives to find out progress at their level 1 2 3 4 5
Client Strongly disagree
Strongly agree
During this project: a. there was very little contact or communication with the client 1 2 3 4 5 b. participants carried out extensive research into end-user needs 1 2 3 4 5 c. the client was kept educated on the project and its processes 1 2 3 4 5 d. the satisfaction of the client was monitored at all times 1 2 3 4 5 e. other considerations were put first before the client’s needs 1 2 3 4 5 f. the client was shown little respect 1 2 3 4 5
Team Strongly disagree
Strongly agree
During this project: a. different workgroups, gangs and companies worked collaboratively 1 2 3 4 5 b. project participants had complete trust in each other 1 2 3 4 5 c. there was participation and input from all participants 1 2 3 4 5 d. disagreements were resolved by discussion and compromise 1 2 3 4 5 e. some participants withheld information required by other participants 1 2 3 4 5 f. people identified more with their own companies than with the project 1 2 3 4 5 g. people could speak freely and openly 1 2 3 4 5 h. participants were quick to blame others when a problem occurred 1 2 3 4 5
Project delivery Strongly disagree
Strongly agree
On this project, participants: a. were very creative and tried new ways of carrying out their jobs 1 2 3 4 5 b. availed themselves of any opportunities to learn something new 1 2 3 4 5 c. were continuously assessed on their performance 1 2 3 4 5 d. received little or no feedback on the quality of their work 1 2 3 4 5 e. worked hard to eliminate waste and processes which did not add value 1 2 3 4 5 f. put in little effort to deliver the project on schedule 1 2 3 4 5 g. were mindful of cost and worked to drive down costs 1 2 3 4 5 h. were apathetic towards ensuring that high quality levels were achieved 1 2 3 4 5 i. executed their work in environmentally friendly ways 1 2 3 4 5
Workforce Strongly disagree
Strongly agree
On this project: a. a lot of the work was subcontracted 1 2 3 4 5 b. managers showed little concern for the welfare of workers 1 2 3 4 5 c. managers treated operatives with little respect 1 2 3 4 5 d. workers at all levels were given adequate responsibility and incentives 1 2 3 4 5 e. people actively took part in any training sessions organised on site 1 2 3 4 5 f. operatives did not use the provided PPE gear 1 2 3 4 5 g. workers always cleaned up their work area and kept the site tidy 1 2 3 4 5 h. operatives who worked hard were recognised and rewarded accordingly 1 2 3 4 5
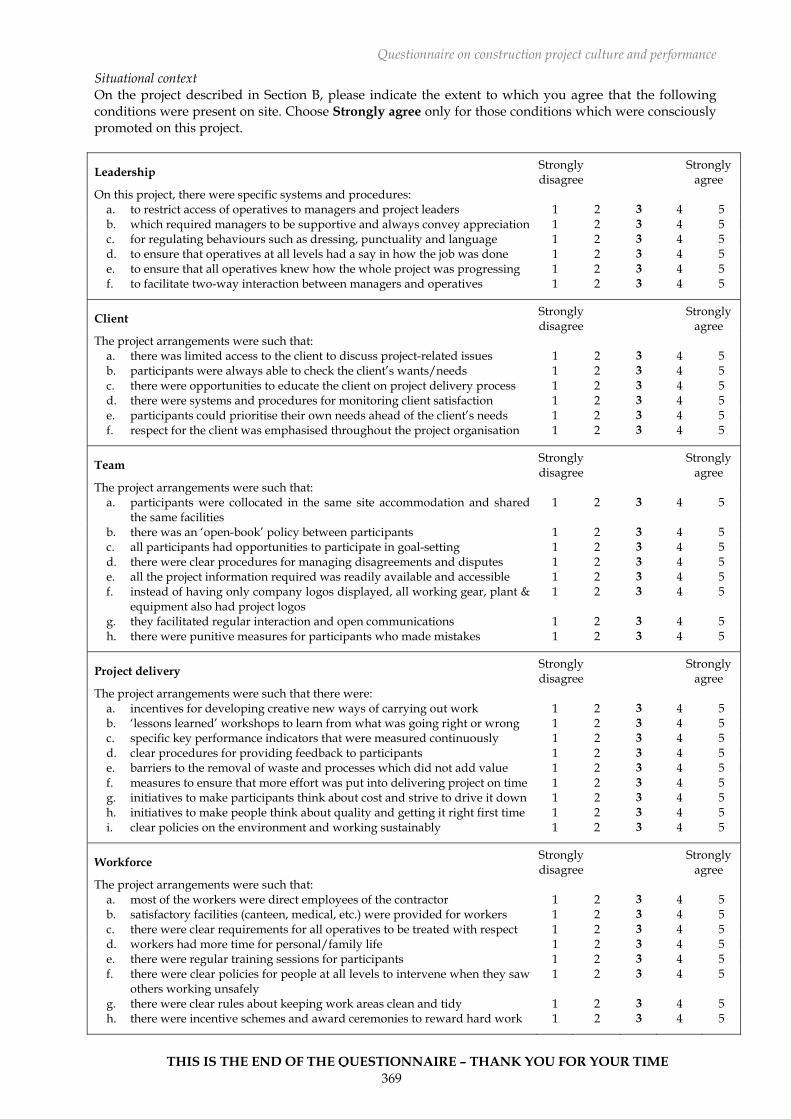
Questionnaire on construction project culture and performance
369
Situational context On the project described in Section B, please indicate the extent to which you agree that the following conditions were present on site. Choose Strongly agree only for those conditions which were consciously promoted on this project.
Leadership Strongly disagree
Strongly agree
On this project, there were specific systems and procedures: a. to restrict access of operatives to managers and project leaders 1 2 3 4 5 b. which required managers to be supportive and always convey appreciation 1 2 3 4 5 c. for regulating behaviours such as dressing, punctuality and language 1 2 3 4 5 d. to ensure that operatives at all levels had a say in how the job was done 1 2 3 4 5 e. to ensure that all operatives knew how the whole project was progressing 1 2 3 4 5 f. to facilitate two-way interaction between managers and operatives 1 2 3 4 5
Client Strongly disagree
Strongly agree
The project arrangements were such that: a. there was limited access to the client to discuss project-related issues 1 2 3 4 5 b. participants were always able to check the client’s wants/needs 1 2 3 4 5 c. there were opportunities to educate the client on project delivery process 1 2 3 4 5 d. there were systems and procedures for monitoring client satisfaction 1 2 3 4 5 e. participants could prioritise their own needs ahead of the client’s needs 1 2 3 4 5 f. respect for the client was emphasised throughout the project organisation 1 2 3 4 5
Team Strongly disagree
Strongly agree
The project arrangements were such that: a. participants were collocated in the same site accommodation and shared
the same facilities 1 2 3 4 5
b. there was an ‘open-book’ policy between participants 1 2 3 4 5 c. all participants had opportunities to participate in goal-setting 1 2 3 4 5 d. there were clear procedures for managing disagreements and disputes 1 2 3 4 5 e. all the project information required was readily available and accessible 1 2 3 4 5 f. instead of having only company logos displayed, all working gear, plant &
equipment also had project logos 1 2 3 4 5
g. they facilitated regular interaction and open communications 1 2 3 4 5 h. there were punitive measures for participants who made mistakes 1 2 3 4 5
Project delivery Strongly disagree
Strongly agree
The project arrangements were such that there were: a. incentives for developing creative new ways of carrying out work 1 2 3 4 5 b. ‘lessons learned’ workshops to learn from what was going right or wrong 1 2 3 4 5 c. specific key performance indicators that were measured continuously 1 2 3 4 5 d. clear procedures for providing feedback to participants 1 2 3 4 5 e. barriers to the removal of waste and processes which did not add value 1 2 3 4 5 f. measures to ensure that more effort was put into delivering project on time 1 2 3 4 5 g. initiatives to make participants think about cost and strive to drive it down 1 2 3 4 5 h. initiatives to make people think about quality and getting it right first time 1 2 3 4 5 i. clear policies on the environment and working sustainably 1 2 3 4 5
Workforce Strongly disagree
Strongly agree
The project arrangements were such that: a. most of the workers were direct employees of the contractor 1 2 3 4 5 b. satisfactory facilities (canteen, medical, etc.) were provided for workers 1 2 3 4 5 c. there were clear requirements for all operatives to be treated with respect 1 2 3 4 5 d. workers had more time for personal/family life 1 2 3 4 5 e. there were regular training sessions for participants 1 2 3 4 5 f. there were clear policies for people at all levels to intervene when they saw
others working unsafely 1 2 3 4 5
g. there were clear rules about keeping work areas clean and tidy 1 2 3 4 5 h. there were incentive schemes and award ceremonies to reward hard work 1 2 3 4 5
THIS IS THE END OF THE QUESTIONNAIRE – THANK YOU FOR YOUR TIME

Appendices
370
Appendix E Calculation of the margin of error
The margin of error is given by the expression:
( )n
ppzmˆ1ˆ* −
=
Where:
m = margin of error
z* = standard random variable
p̂ = estimated variance
n = sample size
For a significance level of α = 0.05, z* = 1.96.
When estimating the margin of error, it was assumed that maximum variance
occurs when p = 0.5 which provides the worst case scenario (Sutrisna, 2004).
Based on this assumption, the margin of error was computed as follows:
( ) %10085
5.015.096.1 ×−
=m
%1000.0542396.1 ××=m
%63.10=m
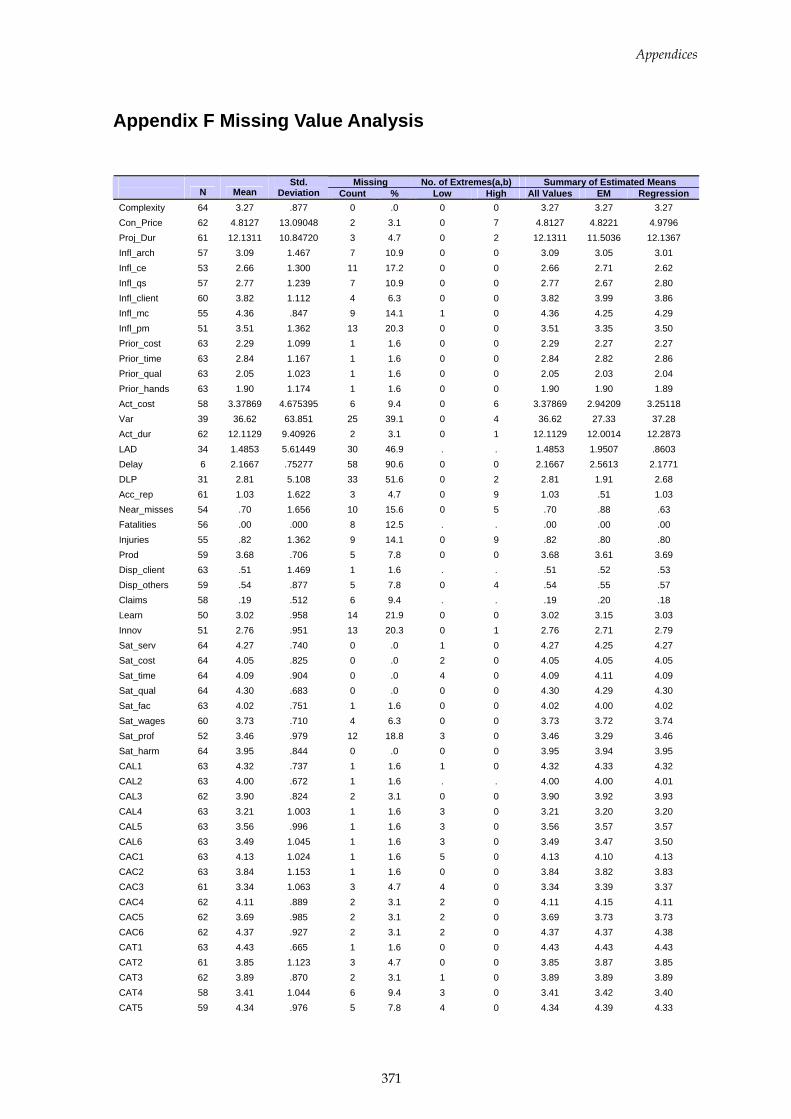
Appendices
371
Appendix F Missing Value Analysis
Missing No. of Extremes(a,b) Summary of Estimated Means
N Mean Std.
Deviation Count % Low High All Values EM Regression Complexity 64 3.27 .877 0 .0 0 0 3.27 3.27 3.27 Con_Price 62 4.8127 13.09048 2 3.1 0 7 4.8127 4.8221 4.9796 Proj_Dur 61 12.1311 10.84720 3 4.7 0 2 12.1311 11.5036 12.1367 Infl_arch 57 3.09 1.467 7 10.9 0 0 3.09 3.05 3.01 Infl_ce 53 2.66 1.300 11 17.2 0 0 2.66 2.71 2.62 Infl_qs 57 2.77 1.239 7 10.9 0 0 2.77 2.67 2.80 Infl_client 60 3.82 1.112 4 6.3 0 0 3.82 3.99 3.86 Infl_mc 55 4.36 .847 9 14.1 1 0 4.36 4.25 4.29 Infl_pm 51 3.51 1.362 13 20.3 0 0 3.51 3.35 3.50 Prior_cost 63 2.29 1.099 1 1.6 0 0 2.29 2.27 2.27 Prior_time 63 2.84 1.167 1 1.6 0 0 2.84 2.82 2.86 Prior_qual 63 2.05 1.023 1 1.6 0 0 2.05 2.03 2.04 Prior_hands 63 1.90 1.174 1 1.6 0 0 1.90 1.90 1.89 Act_cost 58 3.37869 4.675395 6 9.4 0 6 3.37869 2.94209 3.25118 Var 39 36.62 63.851 25 39.1 0 4 36.62 27.33 37.28 Act_dur 62 12.1129 9.40926 2 3.1 0 1 12.1129 12.0014 12.2873 LAD 34 1.4853 5.61449 30 46.9 . . 1.4853 1.9507 .8603 Delay 6 2.1667 .75277 58 90.6 0 0 2.1667 2.5613 2.1771 DLP 31 2.81 5.108 33 51.6 0 2 2.81 1.91 2.68 Acc_rep 61 1.03 1.622 3 4.7 0 9 1.03 .51 1.03 Near_misses 54 .70 1.656 10 15.6 0 5 .70 .88 .63 Fatalities 56 .00 .000 8 12.5 . . .00 .00 .00 Injuries 55 .82 1.362 9 14.1 0 9 .82 .80 .80 Prod 59 3.68 .706 5 7.8 0 0 3.68 3.61 3.69 Disp_client 63 .51 1.469 1 1.6 . . .51 .52 .53 Disp_others 59 .54 .877 5 7.8 0 4 .54 .55 .57 Claims 58 .19 .512 6 9.4 . . .19 .20 .18 Learn 50 3.02 .958 14 21.9 0 0 3.02 3.15 3.03 Innov 51 2.76 .951 13 20.3 0 1 2.76 2.71 2.79 Sat_serv 64 4.27 .740 0 .0 1 0 4.27 4.25 4.27 Sat_cost 64 4.05 .825 0 .0 2 0 4.05 4.05 4.05 Sat_time 64 4.09 .904 0 .0 4 0 4.09 4.11 4.09 Sat_qual 64 4.30 .683 0 .0 0 0 4.30 4.29 4.30 Sat_fac 63 4.02 .751 1 1.6 0 0 4.02 4.00 4.02 Sat_wages 60 3.73 .710 4 6.3 0 0 3.73 3.72 3.74 Sat_prof 52 3.46 .979 12 18.8 3 0 3.46 3.29 3.46 Sat_harm 64 3.95 .844 0 .0 0 0 3.95 3.94 3.95 CAL1 63 4.32 .737 1 1.6 1 0 4.32 4.33 4.32 CAL2 63 4.00 .672 1 1.6 . . 4.00 4.00 4.01 CAL3 62 3.90 .824 2 3.1 0 0 3.90 3.92 3.93 CAL4 63 3.21 1.003 1 1.6 3 0 3.21 3.20 3.20 CAL5 63 3.56 .996 1 1.6 3 0 3.56 3.57 3.57 CAL6 63 3.49 1.045 1 1.6 3 0 3.49 3.47 3.50 CAC1 63 4.13 1.024 1 1.6 5 0 4.13 4.10 4.13 CAC2 63 3.84 1.153 1 1.6 0 0 3.84 3.82 3.83 CAC3 61 3.34 1.063 3 4.7 4 0 3.34 3.39 3.37 CAC4 62 4.11 .889 2 3.1 2 0 4.11 4.15 4.11 CAC5 62 3.69 .985 2 3.1 2 0 3.69 3.73 3.73 CAC6 62 4.37 .927 2 3.1 2 0 4.37 4.37 4.38 CAT1 63 4.43 .665 1 1.6 0 0 4.43 4.43 4.43 CAT2 61 3.85 1.123 3 4.7 0 0 3.85 3.87 3.85 CAT3 62 3.89 .870 2 3.1 1 0 3.89 3.89 3.89 CAT4 58 3.41 1.044 6 9.4 3 0 3.41 3.42 3.40 CAT5 59 4.34 .976 5 7.8 4 0 4.34 4.39 4.33
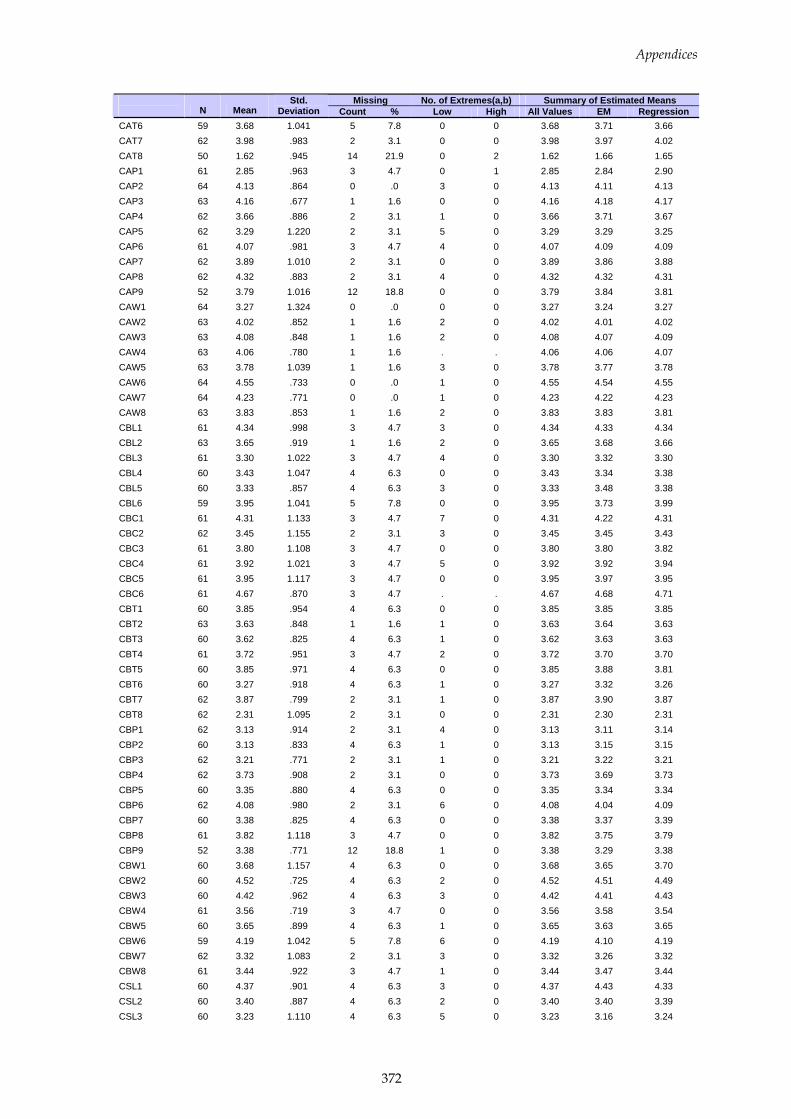
Appendices
372
Missing No. of Extremes(a,b) Summary of Estimated Means N Mean
Std. Deviation Count % Low High All Values EM Regression
CAT6 59 3.68 1.041 5 7.8 0 0 3.68 3.71 3.66 CAT7 62 3.98 .983 2 3.1 0 0 3.98 3.97 4.02 CAT8 50 1.62 .945 14 21.9 0 2 1.62 1.66 1.65 CAP1 61 2.85 .963 3 4.7 0 1 2.85 2.84 2.90 CAP2 64 4.13 .864 0 .0 3 0 4.13 4.11 4.13 CAP3 63 4.16 .677 1 1.6 0 0 4.16 4.18 4.17 CAP4 62 3.66 .886 2 3.1 1 0 3.66 3.71 3.67 CAP5 62 3.29 1.220 2 3.1 5 0 3.29 3.29 3.25 CAP6 61 4.07 .981 3 4.7 4 0 4.07 4.09 4.09 CAP7 62 3.89 1.010 2 3.1 0 0 3.89 3.86 3.88 CAP8 62 4.32 .883 2 3.1 4 0 4.32 4.32 4.31 CAP9 52 3.79 1.016 12 18.8 0 0 3.79 3.84 3.81 CAW1 64 3.27 1.324 0 .0 0 0 3.27 3.24 3.27 CAW2 63 4.02 .852 1 1.6 2 0 4.02 4.01 4.02 CAW3 63 4.08 .848 1 1.6 2 0 4.08 4.07 4.09 CAW4 63 4.06 .780 1 1.6 . . 4.06 4.06 4.07 CAW5 63 3.78 1.039 1 1.6 3 0 3.78 3.77 3.78 CAW6 64 4.55 .733 0 .0 1 0 4.55 4.54 4.55 CAW7 64 4.23 .771 0 .0 1 0 4.23 4.22 4.23 CAW8 63 3.83 .853 1 1.6 2 0 3.83 3.83 3.81 CBL1 61 4.34 .998 3 4.7 3 0 4.34 4.33 4.34 CBL2 63 3.65 .919 1 1.6 2 0 3.65 3.68 3.66 CBL3 61 3.30 1.022 3 4.7 4 0 3.30 3.32 3.30 CBL4 60 3.43 1.047 4 6.3 0 0 3.43 3.34 3.38 CBL5 60 3.33 .857 4 6.3 3 0 3.33 3.48 3.38 CBL6 59 3.95 1.041 5 7.8 0 0 3.95 3.73 3.99 CBC1 61 4.31 1.133 3 4.7 7 0 4.31 4.22 4.31 CBC2 62 3.45 1.155 2 3.1 3 0 3.45 3.45 3.43 CBC3 61 3.80 1.108 3 4.7 0 0 3.80 3.80 3.82 CBC4 61 3.92 1.021 3 4.7 5 0 3.92 3.92 3.94 CBC5 61 3.95 1.117 3 4.7 0 0 3.95 3.97 3.95 CBC6 61 4.67 .870 3 4.7 . . 4.67 4.68 4.71 CBT1 60 3.85 .954 4 6.3 0 0 3.85 3.85 3.85 CBT2 63 3.63 .848 1 1.6 1 0 3.63 3.64 3.63 CBT3 60 3.62 .825 4 6.3 1 0 3.62 3.63 3.63 CBT4 61 3.72 .951 3 4.7 2 0 3.72 3.70 3.70 CBT5 60 3.85 .971 4 6.3 0 0 3.85 3.88 3.81 CBT6 60 3.27 .918 4 6.3 1 0 3.27 3.32 3.26 CBT7 62 3.87 .799 2 3.1 1 0 3.87 3.90 3.87 CBT8 62 2.31 1.095 2 3.1 0 0 2.31 2.30 2.31 CBP1 62 3.13 .914 2 3.1 4 0 3.13 3.11 3.14 CBP2 60 3.13 .833 4 6.3 1 0 3.13 3.15 3.15 CBP3 62 3.21 .771 2 3.1 1 0 3.21 3.22 3.21 CBP4 62 3.73 .908 2 3.1 0 0 3.73 3.69 3.73 CBP5 60 3.35 .880 4 6.3 0 0 3.35 3.34 3.34 CBP6 62 4.08 .980 2 3.1 6 0 4.08 4.04 4.09 CBP7 60 3.38 .825 4 6.3 0 0 3.38 3.37 3.39 CBP8 61 3.82 1.118 3 4.7 0 0 3.82 3.75 3.79 CBP9 52 3.38 .771 12 18.8 1 0 3.38 3.29 3.38 CBW1 60 3.68 1.157 4 6.3 0 0 3.68 3.65 3.70 CBW2 60 4.52 .725 4 6.3 2 0 4.52 4.51 4.49 CBW3 60 4.42 .962 4 6.3 3 0 4.42 4.41 4.43 CBW4 61 3.56 .719 3 4.7 0 0 3.56 3.58 3.54 CBW5 60 3.65 .899 4 6.3 1 0 3.65 3.63 3.65 CBW6 59 4.19 1.042 5 7.8 6 0 4.19 4.10 4.19 CBW7 62 3.32 1.083 2 3.1 3 0 3.32 3.26 3.32 CBW8 61 3.44 .922 3 4.7 1 0 3.44 3.47 3.44 CSL1 60 4.37 .901 4 6.3 3 0 4.37 4.43 4.33 CSL2 60 3.40 .887 4 6.3 2 0 3.40 3.40 3.39 CSL3 60 3.23 1.110 4 6.3 5 0 3.23 3.16 3.24
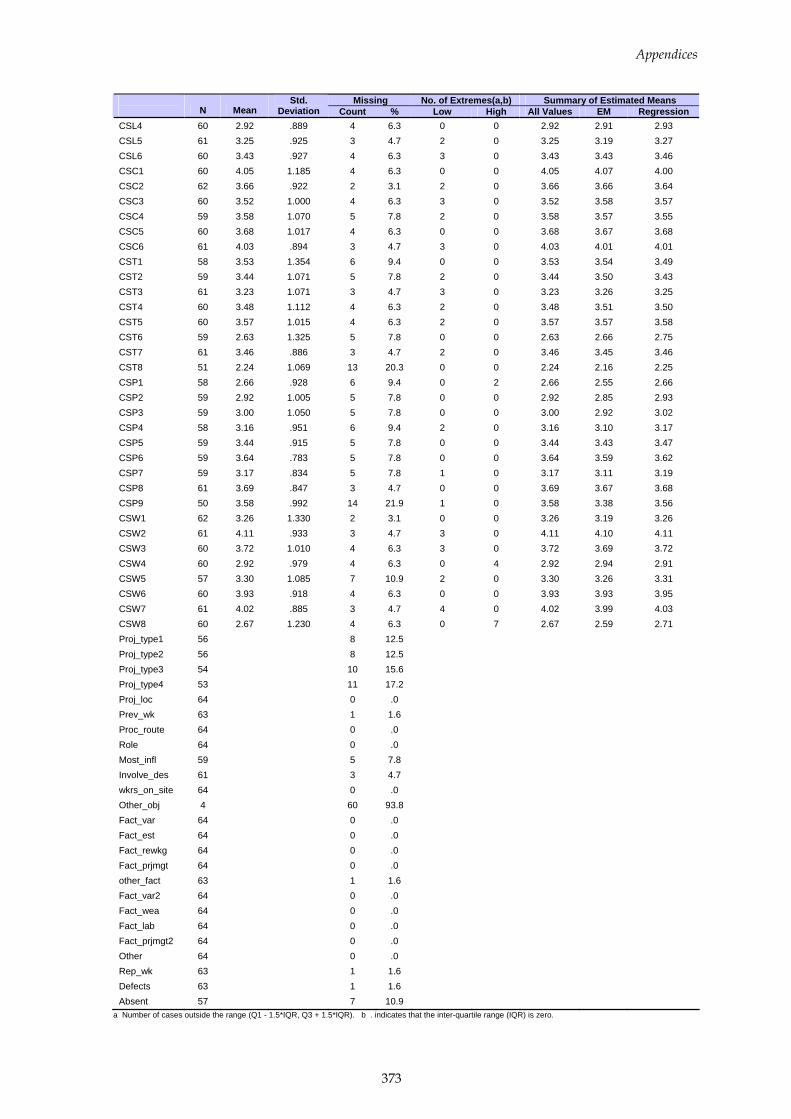
Appendices
373
Missing No. of Extremes(a,b) Summary of Estimated Means N Mean
Std. Deviation Count % Low High All Values EM Regression
CSL4 60 2.92 .889 4 6.3 0 0 2.92 2.91 2.93 CSL5 61 3.25 .925 3 4.7 2 0 3.25 3.19 3.27 CSL6 60 3.43 .927 4 6.3 3 0 3.43 3.43 3.46 CSC1 60 4.05 1.185 4 6.3 0 0 4.05 4.07 4.00 CSC2 62 3.66 .922 2 3.1 2 0 3.66 3.66 3.64 CSC3 60 3.52 1.000 4 6.3 3 0 3.52 3.58 3.57 CSC4 59 3.58 1.070 5 7.8 2 0 3.58 3.57 3.55 CSC5 60 3.68 1.017 4 6.3 0 0 3.68 3.67 3.68 CSC6 61 4.03 .894 3 4.7 3 0 4.03 4.01 4.01 CST1 58 3.53 1.354 6 9.4 0 0 3.53 3.54 3.49 CST2 59 3.44 1.071 5 7.8 2 0 3.44 3.50 3.43 CST3 61 3.23 1.071 3 4.7 3 0 3.23 3.26 3.25 CST4 60 3.48 1.112 4 6.3 2 0 3.48 3.51 3.50 CST5 60 3.57 1.015 4 6.3 2 0 3.57 3.57 3.58 CST6 59 2.63 1.325 5 7.8 0 0 2.63 2.66 2.75 CST7 61 3.46 .886 3 4.7 2 0 3.46 3.45 3.46 CST8 51 2.24 1.069 13 20.3 0 0 2.24 2.16 2.25 CSP1 58 2.66 .928 6 9.4 0 2 2.66 2.55 2.66 CSP2 59 2.92 1.005 5 7.8 0 0 2.92 2.85 2.93 CSP3 59 3.00 1.050 5 7.8 0 0 3.00 2.92 3.02 CSP4 58 3.16 .951 6 9.4 2 0 3.16 3.10 3.17 CSP5 59 3.44 .915 5 7.8 0 0 3.44 3.43 3.47 CSP6 59 3.64 .783 5 7.8 0 0 3.64 3.59 3.62 CSP7 59 3.17 .834 5 7.8 1 0 3.17 3.11 3.19 CSP8 61 3.69 .847 3 4.7 0 0 3.69 3.67 3.68 CSP9 50 3.58 .992 14 21.9 1 0 3.58 3.38 3.56 CSW1 62 3.26 1.330 2 3.1 0 0 3.26 3.19 3.26 CSW2 61 4.11 .933 3 4.7 3 0 4.11 4.10 4.11 CSW3 60 3.72 1.010 4 6.3 3 0 3.72 3.69 3.72 CSW4 60 2.92 .979 4 6.3 0 4 2.92 2.94 2.91 CSW5 57 3.30 1.085 7 10.9 2 0 3.30 3.26 3.31 CSW6 60 3.93 .918 4 6.3 0 0 3.93 3.93 3.95 CSW7 61 4.02 .885 3 4.7 4 0 4.02 3.99 4.03 CSW8 60 2.67 1.230 4 6.3 0 7 2.67 2.59 2.71 Proj_type1 56 8 12.5 Proj_type2 56 8 12.5 Proj_type3 54 10 15.6 Proj_type4 53 11 17.2 Proj_loc 64 0 .0 Prev_wk 63 1 1.6 Proc_route 64 0 .0 Role 64 0 .0 Most_infl 59 5 7.8 Involve_des 61 3 4.7 wkrs_on_site 64 0 .0 Other_obj 4 60 93.8 Fact_var 64 0 .0 Fact_est 64 0 .0 Fact_rewkg 64 0 .0 Fact_prjmgt 64 0 .0 other_fact 63 1 1.6 Fact_var2 64 0 .0 Fact_wea 64 0 .0 Fact_lab 64 0 .0 Fact_prjmgt2 64 0 .0 Other 64 0 .0 Rep_wk 63 1 1.6 Defects 63 1 1.6 Absent 57 7 10.9
a Number of cases outside the range (Q1 - 1.5*IQR, Q3 + 1.5*IQR). b . indicates that the inter-quartile range (IQR) is zero.
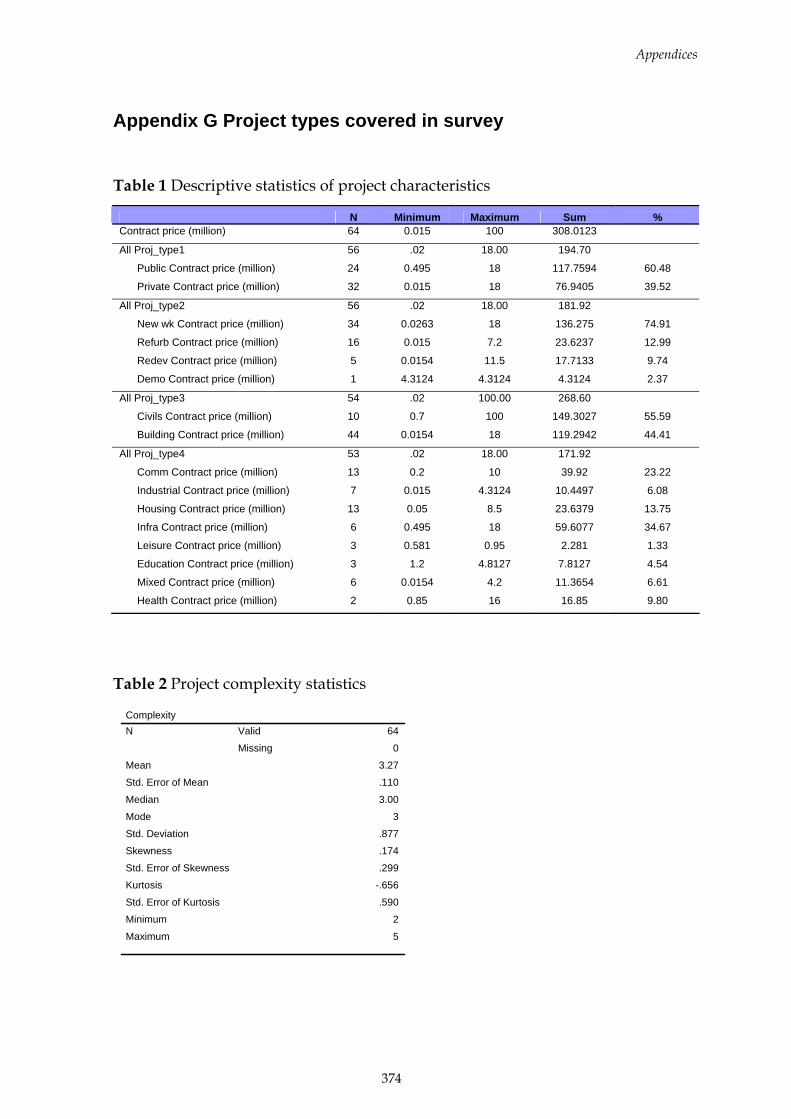
Appendices
374
Appendix G Project types covered in survey
Table 1 Descriptive statistics of project characteristics
N Minimum Maximum Sum % Contract price (million) 64 0.015 100 308.0123
All Proj_type1 56 .02 18.00 194.70
Public Contract price (million) 24 0.495 18 117.7594 60.48
Private Contract price (million) 32 0.015 18 76.9405 39.52
All Proj_type2 56 .02 18.00 181.92
New wk Contract price (million) 34 0.0263 18 136.275 74.91
Refurb Contract price (million) 16 0.015 7.2 23.6237 12.99
Redev Contract price (million) 5 0.0154 11.5 17.7133 9.74
Demo Contract price (million) 1 4.3124 4.3124 4.3124 2.37
All Proj_type3 54 .02 100.00 268.60
Civils Contract price (million) 10 0.7 100 149.3027 55.59
Building Contract price (million) 44 0.0154 18 119.2942 44.41
All Proj_type4 53 .02 18.00 171.92
Comm Contract price (million) 13 0.2 10 39.92 23.22
Industrial Contract price (million) 7 0.015 4.3124 10.4497 6.08
Housing Contract price (million) 13 0.05 8.5 23.6379 13.75
Infra Contract price (million) 6 0.495 18 59.6077 34.67
Leisure Contract price (million) 3 0.581 0.95 2.281 1.33
Education Contract price (million) 3 1.2 4.8127 7.8127 4.54
Mixed Contract price (million) 6 0.0154 4.2 11.3654 6.61
Health Contract price (million) 2 0.85 16 16.85 9.80
Table 2 Project complexity statistics
Complexity64
0
3.27
.110
3.00
3
.877
.174
.299
-.656
.590
2
5
Valid
Missing
N
Mean
Std. Error of Mean
Median
Mode
Std. Deviation
Skewness
Std. Error of Skewness
Kurtosis
Std. Error of Kurtosis
Minimum
Maximum
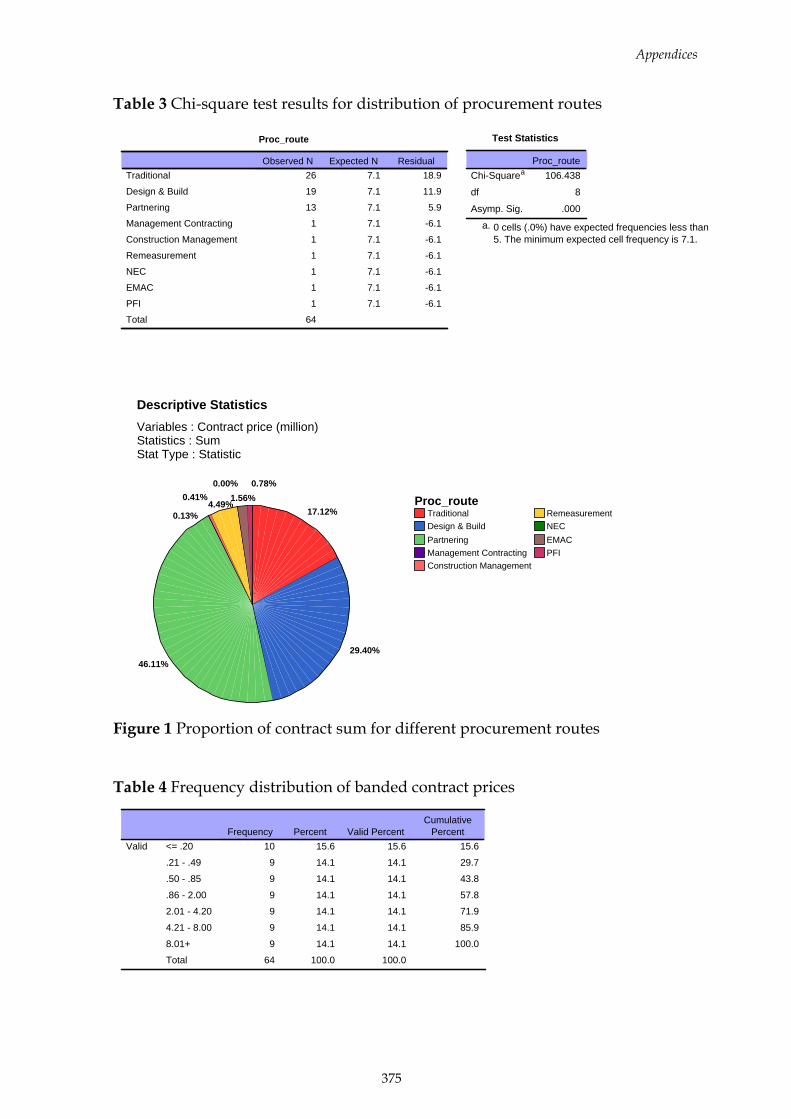
Appendices
375
Table 3 Chi-square test results for distribution of procurement routes
TraditionalDesign & BuildPartneringManagement ContractingConstruction Management
RemeasurementNECEMACPFI
Proc_route
Variables : Contract price (million)Statistics : SumStat Type : Statistic
Descriptive Statistics
17.12%
29.40%46.11%
0.13%
0.41%4.49%
0.00%1.56%
0.78%
Figure 1 Proportion of contract sum for different procurement routes
Table 4 Frequency distribution of banded contract prices
10 15.6 15.6 15.6
9 14.1 14.1 29.7
9 14.1 14.1 43.8
9 14.1 14.1 57.8
9 14.1 14.1 71.9
9 14.1 14.1 85.9
9 14.1 14.1 100.0
64 100.0 100.0
<= .20
.21 - .49
.50 - .85
.86 - 2.00
2.01 - 4.20
4.21 - 8.00
8.01+
Total
ValidFrequency Percent Valid Percent
CumulativePercent
Test Statistics
106.438
8
.000
Chi-Squarea
df
Asymp. Sig.
Proc_route
0 cells (.0%) have expected frequencies less than5. The minimum expected cell frequency is 7.1.
a.
Proc_route
26 7.1 18.9
19 7.1 11.9
13 7.1 5.9
1 7.1 -6.1
1 7.1 -6.1
1 7.1 -6.1
1 7.1 -6.1
1 7.1 -6.1
1 7.1 -6.1
64
Traditional
Design & Build
Partnering
Management Contracting
Construction Management
Remeasurement
NEC
EMAC
PFI
Total
Observed N Expected N Residual

Appendices
376
Table 5 Frequency distribution of banded project durations
10 15.6 15.6 15.6
10 15.6 15.6 31.3
11 17.2 17.2 48.4
6 9.4 9.4 57.8
9 14.1 14.1 71.9
11 17.2 17.2 89.1
7 10.9 10.9 100.0
64 100.0 100.0
<= 4.50
4.51 - 7.00
7.01 - 9.00
9.01 - 12.00
12.01 - 14.00
14.01 - 18.00
18.01+
Total
ValidFrequency Percent Valid Percent
CumulativePercent
Table 6 Descriptive statistics of number of workers on site
64
0
2.02
.108
2.00
2
.864
.427
.299
-.578
.590
1
4
Valid
Missing
N
Mean
Std. Error of Mean
Median
Mode
Std. Deviation
Skewness
Std. Error of Skewness
Kurtosis
Std. Error of Kurtosis
Minimum
Maximum
Table 7 Cross-tabulation of procurement approach and involvement in design
Proc_route
Traditional Design & Build Partnering
Management Contracting
Construction Management
Remeasurement NEC EMAC PFI
Involve_des Yes 5 17 11 0 0 0 0 1 0
No 19 2 1 1 1 1 1 0 1
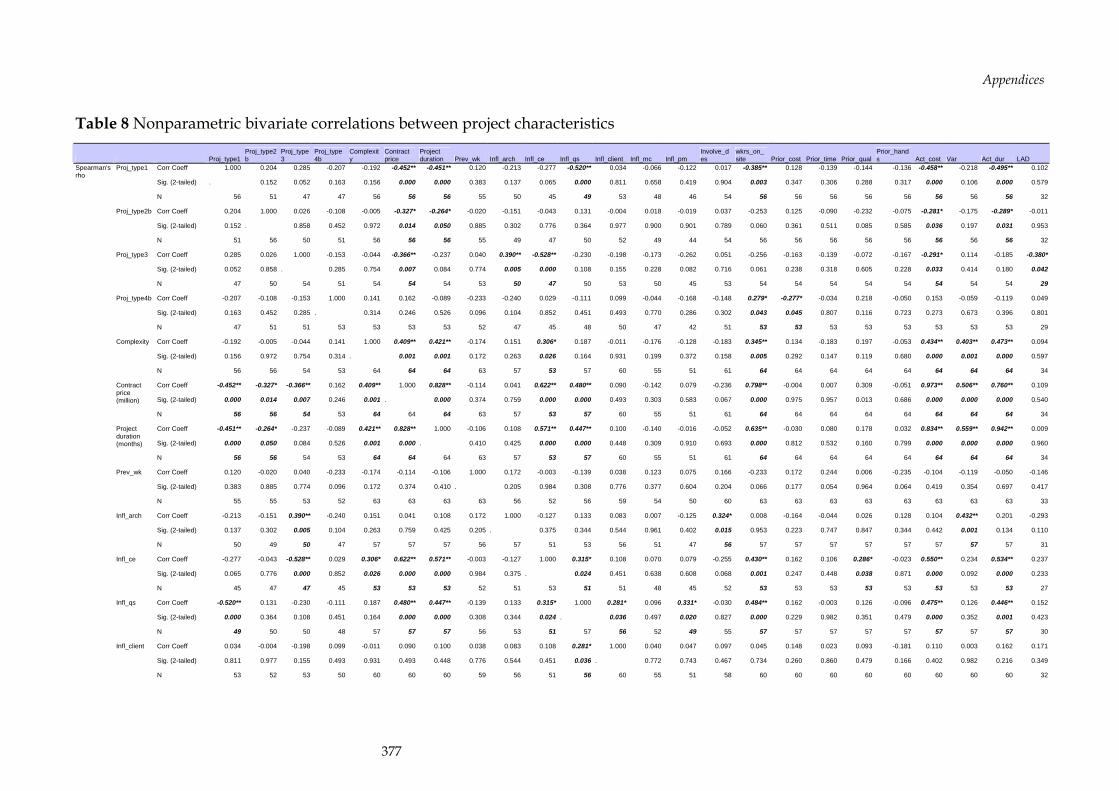
Appendices
377
Table 8 Nonparametric bivariate correlations between project characteristics
Proj_type1 Proj_type2b
Proj_type3
Proj_type4b
Complexity
Contract price
Project duration Prev_wk Infl_arch Infl_ce Infl_qs Infl_client Infl_mc Infl_pm
Involve_des
wkrs_on_site Prior_cost Prior_time Prior_qual
Prior_hands Act_cost Var Act_dur LAD
Corr Coeff 1.000 0.204 0.285 -0.207 -0.192 -0.452** -0.451** 0.120 -0.213 -0.277 -0.520** 0.034 -0.066 -0.122 0.017 -0.385** 0.128 -0.139 -0.144 -0.136 -0.458** -0.218 -0.495** 0.102
Sig. (2-tailed) . 0.152 0.052 0.163 0.156 0.000 0.000 0.383 0.137 0.065 0.000 0.811 0.658 0.419 0.904 0.003 0.347 0.306 0.288 0.317 0.000 0.106 0.000 0.579
Proj_type1
N 56 51 47 47 56 56 56 55 50 45 49 53 48 46 54 56 56 56 56 56 56 56 56 32
Corr Coeff 0.204 1.000 0.026 -0.108 -0.005 -0.327* -0.264* -0.020 -0.151 -0.043 0.131 -0.004 0.018 -0.019 0.037 -0.253 0.125 -0.090 -0.232 -0.075 -0.281* -0.175 -0.289* -0.011
Sig. (2-tailed) 0.152 . 0.858 0.452 0.972 0.014 0.050 0.885 0.302 0.776 0.364 0.977 0.900 0.901 0.789 0.060 0.361 0.511 0.085 0.585 0.036 0.197 0.031 0.953
Proj_type2b
N 51 56 50 51 56 56 56 55 49 47 50 52 49 44 54 56 56 56 56 56 56 56 56 32
Corr Coeff 0.285 0.026 1.000 -0.153 -0.044 -0.366** -0.237 0.040 0.390** -0.528** -0.230 -0.198 -0.173 -0.262 0.051 -0.256 -0.163 -0.139 -0.072 -0.167 -0.291* 0.114 -0.185 -0.380*
Sig. (2-tailed) 0.052 0.858 . 0.285 0.754 0.007 0.084 0.774 0.005 0.000 0.108 0.155 0.228 0.082 0.716 0.061 0.238 0.318 0.605 0.228 0.033 0.414 0.180 0.042
Proj_type3
N 47 50 54 51 54 54 54 53 50 47 50 53 50 45 53 54 54 54 54 54 54 54 54 29
Corr Coeff -0.207 -0.108 -0.153 1.000 0.141 0.162 -0.089 -0.233 -0.240 0.029 -0.111 0.099 -0.044 -0.168 -0.148 0.279* -0.277* -0.034 0.218 -0.050 0.153 -0.059 -0.119 0.049
Sig. (2-tailed) 0.163 0.452 0.285 . 0.314 0.246 0.526 0.096 0.104 0.852 0.451 0.493 0.770 0.286 0.302 0.043 0.045 0.807 0.116 0.723 0.273 0.673 0.396 0.801
Proj_type4b
N 47 51 51 53 53 53 53 52 47 45 48 50 47 42 51 53 53 53 53 53 53 53 53 29
Corr Coeff -0.192 -0.005 -0.044 0.141 1.000 0.409** 0.421** -0.174 0.151 0.306* 0.187 -0.011 -0.176 -0.128 -0.183 0.345** 0.134 -0.183 0.197 -0.053 0.434** 0.403** 0.473** 0.094
Sig. (2-tailed) 0.156 0.972 0.754 0.314 . 0.001 0.001 0.172 0.263 0.026 0.164 0.931 0.199 0.372 0.158 0.005 0.292 0.147 0.119 0.680 0.000 0.001 0.000 0.597
Complexity
N 56 56 54 53 64 64 64 63 57 53 57 60 55 51 61 64 64 64 64 64 64 64 64 34
Corr Coeff -0.452** -0.327* -0.366** 0.162 0.409** 1.000 0.828** -0.114 0.041 0.622** 0.480** 0.090 -0.142 0.079 -0.236 0.798** -0.004 0.007 0.309 -0.051 0.973** 0.506** 0.760** 0.109
Sig. (2-tailed) 0.000 0.014 0.007 0.246 0.001 . 0.000 0.374 0.759 0.000 0.000 0.493 0.303 0.583 0.067 0.000 0.975 0.957 0.013 0.686 0.000 0.000 0.000 0.540
Contract price (million)
N 56 56 54 53 64 64 64 63 57 53 57 60 55 51 61 64 64 64 64 64 64 64 64 34
Corr Coeff -0.451** -0.264* -0.237 -0.089 0.421** 0.828** 1.000 -0.106 0.108 0.571** 0.447** 0.100 -0.140 -0.016 -0.052 0.635** -0.030 0.080 0.178 0.032 0.834** 0.559** 0.942** 0.009
Sig. (2-tailed) 0.000 0.050 0.084 0.526 0.001 0.000 . 0.410 0.425 0.000 0.000 0.448 0.309 0.910 0.693 0.000 0.812 0.532 0.160 0.799 0.000 0.000 0.000 0.960
Project duration (months)
N 56 56 54 53 64 64 64 63 57 53 57 60 55 51 61 64 64 64 64 64 64 64 64 34
Corr Coeff 0.120 -0.020 0.040 -0.233 -0.174 -0.114 -0.106 1.000 0.172 -0.003 -0.139 0.038 0.123 0.075 0.166 -0.233 0.172 0.244 0.006 -0.235 -0.104 -0.119 -0.050 -0.146
Sig. (2-tailed) 0.383 0.885 0.774 0.096 0.172 0.374 0.410 . 0.205 0.984 0.308 0.776 0.377 0.604 0.204 0.066 0.177 0.054 0.964 0.064 0.419 0.354 0.697 0.417
Prev_wk
N 55 55 53 52 63 63 63 63 56 52 56 59 54 50 60 63 63 63 63 63 63 63 63 33
Corr Coeff -0.213 -0.151 0.390** -0.240 0.151 0.041 0.108 0.172 1.000 -0.127 0.133 0.083 0.007 -0.125 0.324* 0.008 -0.164 -0.044 0.026 0.128 0.104 0.432** 0.201 -0.293
Sig. (2-tailed) 0.137 0.302 0.005 0.104 0.263 0.759 0.425 0.205 . 0.375 0.344 0.544 0.961 0.402 0.015 0.953 0.223 0.747 0.847 0.344 0.442 0.001 0.134 0.110
Infl_arch
N 50 49 50 47 57 57 57 56 57 51 53 56 51 47 56 57 57 57 57 57 57 57 57 31
Corr Coeff -0.277 -0.043 -0.528** 0.029 0.306* 0.622** 0.571** -0.003 -0.127 1.000 0.315* 0.108 0.070 0.079 -0.255 0.430** 0.162 0.106 0.286* -0.023 0.550** 0.234 0.534** 0.237
Sig. (2-tailed) 0.065 0.776 0.000 0.852 0.026 0.000 0.000 0.984 0.375 . 0.024 0.451 0.638 0.608 0.068 0.001 0.247 0.448 0.038 0.871 0.000 0.092 0.000 0.233
Infl_ce
N 45 47 47 45 53 53 53 52 51 53 51 51 48 45 52 53 53 53 53 53 53 53 53 27
Corr Coeff -0.520** 0.131 -0.230 -0.111 0.187 0.480** 0.447** -0.139 0.133 0.315* 1.000 0.281* 0.096 0.331* -0.030 0.484** 0.162 -0.003 0.126 -0.096 0.475** 0.126 0.446** 0.152
Sig. (2-tailed) 0.000 0.364 0.108 0.451 0.164 0.000 0.000 0.308 0.344 0.024 . 0.036 0.497 0.020 0.827 0.000 0.229 0.982 0.351 0.479 0.000 0.352 0.001 0.423
Infl_qs
N 49 50 50 48 57 57 57 56 53 51 57 56 52 49 55 57 57 57 57 57 57 57 57 30
Corr Coeff 0.034 -0.004 -0.198 0.099 -0.011 0.090 0.100 0.038 0.083 0.108 0.281* 1.000 0.040 0.047 0.097 0.045 0.148 0.023 0.093 -0.181 0.110 0.003 0.162 0.171
Sig. (2-tailed) 0.811 0.977 0.155 0.493 0.931 0.493 0.448 0.776 0.544 0.451 0.036 . 0.772 0.743 0.467 0.734 0.260 0.860 0.479 0.166 0.402 0.982 0.216 0.349
Spearman's rho
Infl_client
N 53 52 53 50 60 60 60 59 56 51 56 60 55 51 58 60 60 60 60 60 60 60 60 32
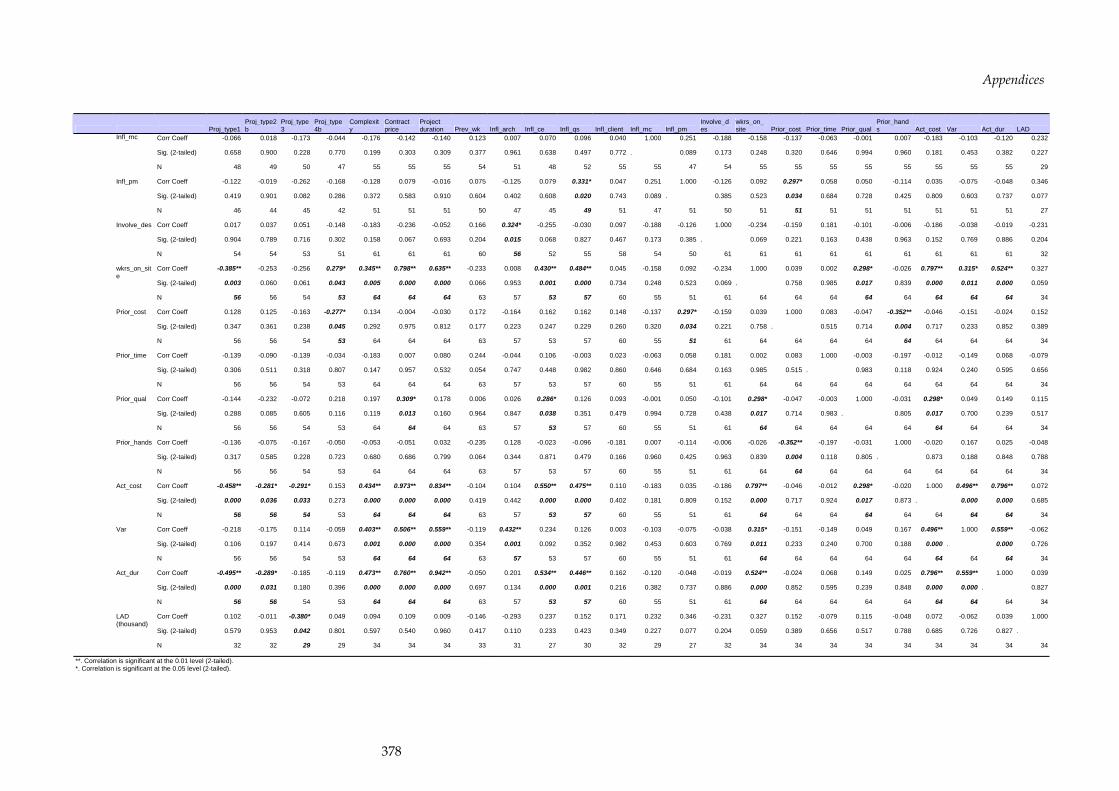
Appendices
378
Proj_type1 Proj_type2b
Proj_type3
Proj_type4b
Complexity
Contract price
Project duration Prev_wk Infl_arch Infl_ce Infl_qs Infl_client Infl_mc Infl_pm
Involve_des
wkrs_on_site Prior_cost Prior_time Prior_qual
Prior_hands Act_cost Var Act_dur LAD
Corr Coeff -0.066 0.018 -0.173 -0.044 -0.176 -0.142 -0.140 0.123 0.007 0.070 0.096 0.040 1.000 0.251 -0.188 -0.158 -0.137 -0.063 -0.001 0.007 -0.183 -0.103 -0.120 0.232
Sig. (2-tailed) 0.658 0.900 0.228 0.770 0.199 0.303 0.309 0.377 0.961 0.638 0.497 0.772 . 0.089 0.173 0.248 0.320 0.646 0.994 0.960 0.181 0.453 0.382 0.227
Infl_mc
N 48 49 50 47 55 55 55 54 51 48 52 55 55 47 54 55 55 55 55 55 55 55 55 29
Corr Coeff -0.122 -0.019 -0.262 -0.168 -0.128 0.079 -0.016 0.075 -0.125 0.079 0.331* 0.047 0.251 1.000 -0.126 0.092 0.297* 0.058 0.050 -0.114 0.035 -0.075 -0.048 0.346
Sig. (2-tailed) 0.419 0.901 0.082 0.286 0.372 0.583 0.910 0.604 0.402 0.608 0.020 0.743 0.089 . 0.385 0.523 0.034 0.684 0.728 0.425 0.809 0.603 0.737 0.077
Infl_pm
N 46 44 45 42 51 51 51 50 47 45 49 51 47 51 50 51 51 51 51 51 51 51 51 27
Corr Coeff 0.017 0.037 0.051 -0.148 -0.183 -0.236 -0.052 0.166 0.324* -0.255 -0.030 0.097 -0.188 -0.126 1.000 -0.234 -0.159 0.181 -0.101 -0.006 -0.186 -0.038 -0.019 -0.231
Sig. (2-tailed) 0.904 0.789 0.716 0.302 0.158 0.067 0.693 0.204 0.015 0.068 0.827 0.467 0.173 0.385 . 0.069 0.221 0.163 0.438 0.963 0.152 0.769 0.886 0.204
Involve_des
N 54 54 53 51 61 61 61 60 56 52 55 58 54 50 61 61 61 61 61 61 61 61 61 32
Corr Coeff -0.385** -0.253 -0.256 0.279* 0.345** 0.798** 0.635** -0.233 0.008 0.430** 0.484** 0.045 -0.158 0.092 -0.234 1.000 0.039 0.002 0.298* -0.026 0.797** 0.315* 0.524** 0.327
Sig. (2-tailed) 0.003 0.060 0.061 0.043 0.005 0.000 0.000 0.066 0.953 0.001 0.000 0.734 0.248 0.523 0.069 . 0.758 0.985 0.017 0.839 0.000 0.011 0.000 0.059
wkrs_on_site
N 56 56 54 53 64 64 64 63 57 53 57 60 55 51 61 64 64 64 64 64 64 64 64 34
Corr Coeff 0.128 0.125 -0.163 -0.277* 0.134 -0.004 -0.030 0.172 -0.164 0.162 0.162 0.148 -0.137 0.297* -0.159 0.039 1.000 0.083 -0.047 -0.352** -0.046 -0.151 -0.024 0.152
Sig. (2-tailed) 0.347 0.361 0.238 0.045 0.292 0.975 0.812 0.177 0.223 0.247 0.229 0.260 0.320 0.034 0.221 0.758 . 0.515 0.714 0.004 0.717 0.233 0.852 0.389
Prior_cost
N 56 56 54 53 64 64 64 63 57 53 57 60 55 51 61 64 64 64 64 64 64 64 64 34
Corr Coeff -0.139 -0.090 -0.139 -0.034 -0.183 0.007 0.080 0.244 -0.044 0.106 -0.003 0.023 -0.063 0.058 0.181 0.002 0.083 1.000 -0.003 -0.197 -0.012 -0.149 0.068 -0.079
Sig. (2-tailed) 0.306 0.511 0.318 0.807 0.147 0.957 0.532 0.054 0.747 0.448 0.982 0.860 0.646 0.684 0.163 0.985 0.515 . 0.983 0.118 0.924 0.240 0.595 0.656
Prior_time
N 56 56 54 53 64 64 64 63 57 53 57 60 55 51 61 64 64 64 64 64 64 64 64 34
Corr Coeff -0.144 -0.232 -0.072 0.218 0.197 0.309* 0.178 0.006 0.026 0.286* 0.126 0.093 -0.001 0.050 -0.101 0.298* -0.047 -0.003 1.000 -0.031 0.298* 0.049 0.149 0.115
Sig. (2-tailed) 0.288 0.085 0.605 0.116 0.119 0.013 0.160 0.964 0.847 0.038 0.351 0.479 0.994 0.728 0.438 0.017 0.714 0.983 . 0.805 0.017 0.700 0.239 0.517
Prior_qual
N 56 56 54 53 64 64 64 63 57 53 57 60 55 51 61 64 64 64 64 64 64 64 64 34
Corr Coeff -0.136 -0.075 -0.167 -0.050 -0.053 -0.051 0.032 -0.235 0.128 -0.023 -0.096 -0.181 0.007 -0.114 -0.006 -0.026 -0.352** -0.197 -0.031 1.000 -0.020 0.167 0.025 -0.048
Sig. (2-tailed) 0.317 0.585 0.228 0.723 0.680 0.686 0.799 0.064 0.344 0.871 0.479 0.166 0.960 0.425 0.963 0.839 0.004 0.118 0.805 . 0.873 0.188 0.848 0.788
Prior_hands
N 56 56 54 53 64 64 64 63 57 53 57 60 55 51 61 64 64 64 64 64 64 64 64 34
Corr Coeff -0.458** -0.281* -0.291* 0.153 0.434** 0.973** 0.834** -0.104 0.104 0.550** 0.475** 0.110 -0.183 0.035 -0.186 0.797** -0.046 -0.012 0.298* -0.020 1.000 0.496** 0.796** 0.072
Sig. (2-tailed) 0.000 0.036 0.033 0.273 0.000 0.000 0.000 0.419 0.442 0.000 0.000 0.402 0.181 0.809 0.152 0.000 0.717 0.924 0.017 0.873 . 0.000 0.000 0.685
Act_cost
N 56 56 54 53 64 64 64 63 57 53 57 60 55 51 61 64 64 64 64 64 64 64 64 34
Corr Coeff -0.218 -0.175 0.114 -0.059 0.403** 0.506** 0.559** -0.119 0.432** 0.234 0.126 0.003 -0.103 -0.075 -0.038 0.315* -0.151 -0.149 0.049 0.167 0.496** 1.000 0.559** -0.062
Sig. (2-tailed) 0.106 0.197 0.414 0.673 0.001 0.000 0.000 0.354 0.001 0.092 0.352 0.982 0.453 0.603 0.769 0.011 0.233 0.240 0.700 0.188 0.000 . 0.000 0.726
Var
N 56 56 54 53 64 64 64 63 57 53 57 60 55 51 61 64 64 64 64 64 64 64 64 34
Corr Coeff -0.495** -0.289* -0.185 -0.119 0.473** 0.760** 0.942** -0.050 0.201 0.534** 0.446** 0.162 -0.120 -0.048 -0.019 0.524** -0.024 0.068 0.149 0.025 0.796** 0.559** 1.000 0.039
Sig. (2-tailed) 0.000 0.031 0.180 0.396 0.000 0.000 0.000 0.697 0.134 0.000 0.001 0.216 0.382 0.737 0.886 0.000 0.852 0.595 0.239 0.848 0.000 0.000 . 0.827
Act_dur
N 56 56 54 53 64 64 64 63 57 53 57 60 55 51 61 64 64 64 64 64 64 64 64 34
Corr Coeff 0.102 -0.011 -0.380* 0.049 0.094 0.109 0.009 -0.146 -0.293 0.237 0.152 0.171 0.232 0.346 -0.231 0.327 0.152 -0.079 0.115 -0.048 0.072 -0.062 0.039 1.000
Sig. (2-tailed) 0.579 0.953 0.042 0.801 0.597 0.540 0.960 0.417 0.110 0.233 0.423 0.349 0.227 0.077 0.204 0.059 0.389 0.656 0.517 0.788 0.685 0.726 0.827 .
LAD (thousand)
N 32 32 29 29 34 34 34 33 31 27 30 32 29 27 32 34 34 34 34 34 34 34 34 34
**. Correlation is significant at the 0.01 level (2-tailed). *. Correlation is significant at the 0.05 level (2-tailed).
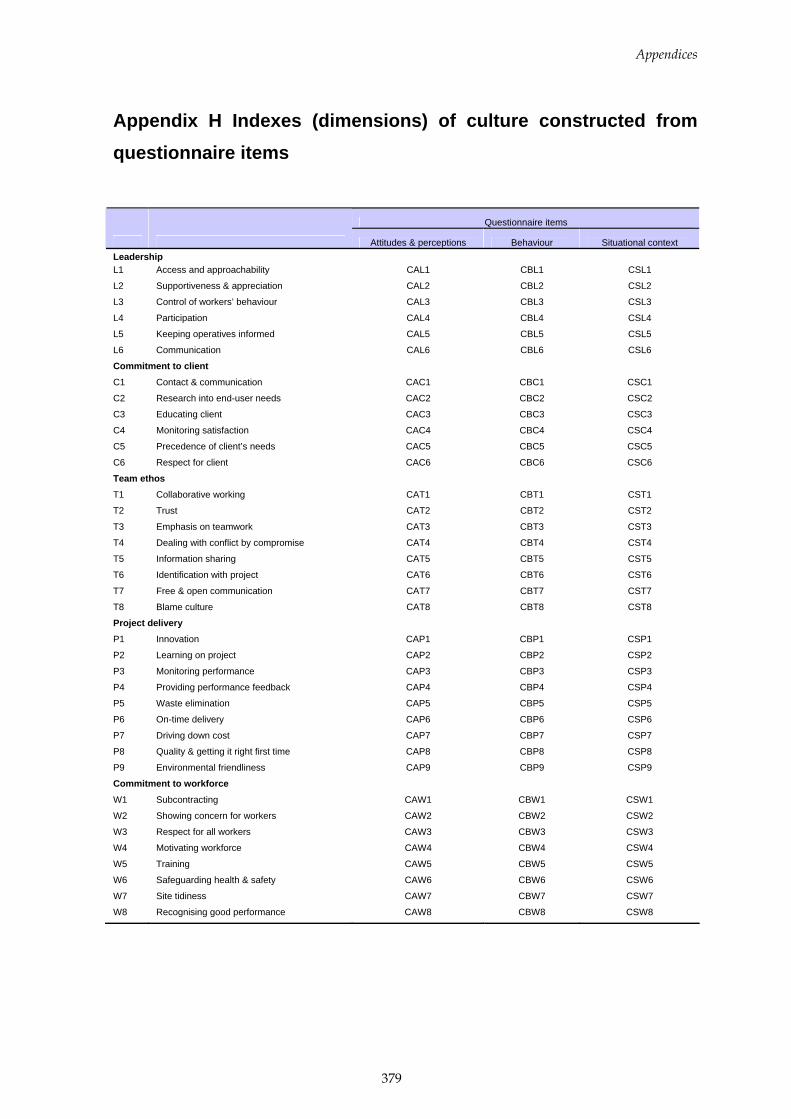
Appendices
379
Appendix H Indexes (dimensions) of culture constructed from questionnaire items
Questionnaire items
Attitudes & perceptions Behaviour Situational context Leadership L1 Access and approachability CAL1 CBL1 CSL1
L2 Supportiveness & appreciation CAL2 CBL2 CSL2
L3 Control of workers’ behaviour CAL3 CBL3 CSL3
L4 Participation CAL4 CBL4 CSL4
L5 Keeping operatives informed CAL5 CBL5 CSL5
L6 Communication CAL6 CBL6 CSL6
Commitment to client
C1 Contact & communication CAC1 CBC1 CSC1
C2 Research into end-user needs CAC2 CBC2 CSC2
C3 Educating client CAC3 CBC3 CSC3
C4 Monitoring satisfaction CAC4 CBC4 CSC4
C5 Precedence of client’s needs CAC5 CBC5 CSC5
C6 Respect for client CAC6 CBC6 CSC6
Team ethos T1 Collaborative working CAT1 CBT1 CST1
T2 Trust CAT2 CBT2 CST2
T3 Emphasis on teamwork CAT3 CBT3 CST3
T4 Dealing with conflict by compromise CAT4 CBT4 CST4
T5 Information sharing CAT5 CBT5 CST5
T6 Identification with project CAT6 CBT6 CST6
T7 Free & open communication CAT7 CBT7 CST7
T8 Blame culture CAT8 CBT8 CST8
Project delivery P1 Innovation CAP1 CBP1 CSP1
P2 Learning on project CAP2 CBP2 CSP2
P3 Monitoring performance CAP3 CBP3 CSP3
P4 Providing performance feedback CAP4 CBP4 CSP4
P5 Waste elimination CAP5 CBP5 CSP5
P6 On-time delivery CAP6 CBP6 CSP6
P7 Driving down cost CAP7 CBP7 CSP7
P8 Quality & getting it right first time CAP8 CBP8 CSP8
P9 Environmental friendliness CAP9 CBP9 CSP9
Commitment to workforce W1 Subcontracting CAW1 CBW1 CSW1
W2 Showing concern for workers CAW2 CBW2 CSW2
W3 Respect for all workers CAW3 CBW3 CSW3
W4 Motivating workforce CAW4 CBW4 CSW4
W5 Training CAW5 CBW5 CSW5
W6 Safeguarding health & safety CAW6 CBW6 CSW6
W7 Site tidiness CAW7 CBW7 CSW7
W8 Recognising good performance CAW8 CBW8 CSW8
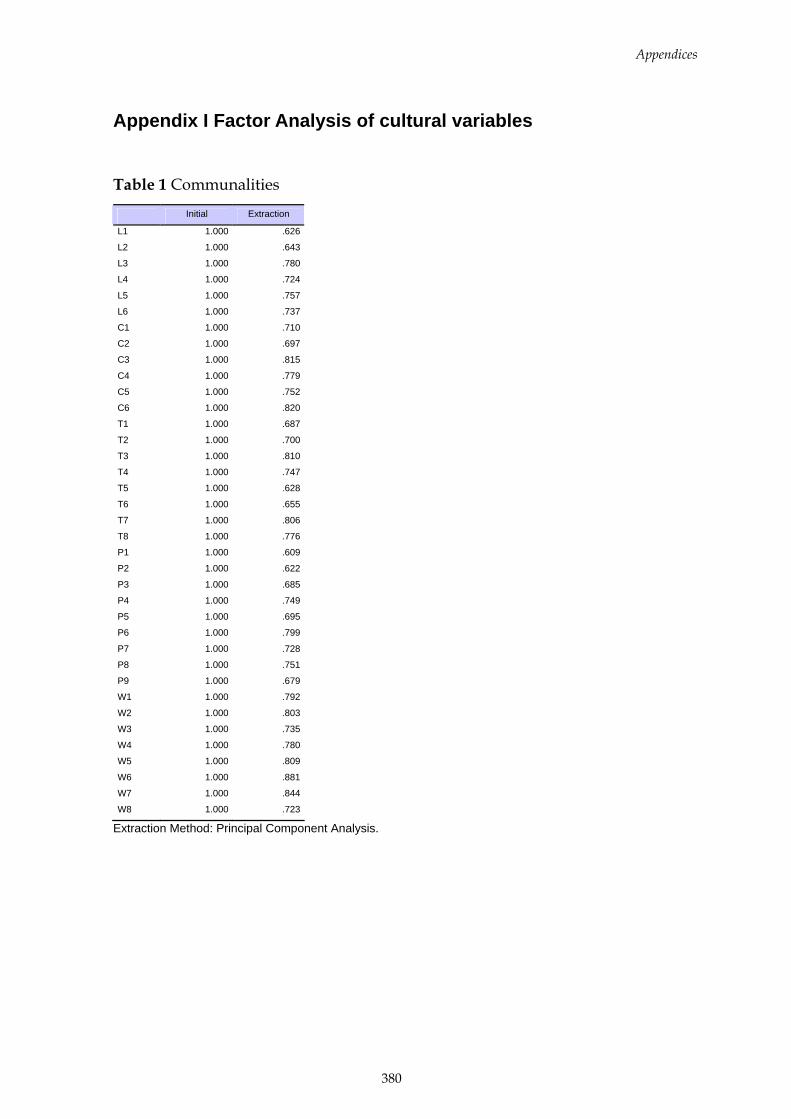
Appendices
380
Appendix I Factor Analysis of cultural variables
Table 1 Communalities
Initial Extraction
L1 1.000 .626
L2 1.000 .643
L3 1.000 .780
L4 1.000 .724
L5 1.000 .757
L6 1.000 .737
C1 1.000 .710
C2 1.000 .697
C3 1.000 .815
C4 1.000 .779
C5 1.000 .752
C6 1.000 .820
T1 1.000 .687
T2 1.000 .700
T3 1.000 .810
T4 1.000 .747
T5 1.000 .628
T6 1.000 .655
T7 1.000 .806
T8 1.000 .776
P1 1.000 .609
P2 1.000 .622
P3 1.000 .685
P4 1.000 .749
P5 1.000 .695
P6 1.000 .799
P7 1.000 .728
P8 1.000 .751
P9 1.000 .679
W1 1.000 .792
W2 1.000 .803
W3 1.000 .735
W4 1.000 .780
W5 1.000 .809
W6 1.000 .881
W7 1.000 .844
W8 1.000 .723
Extraction Method: Principal Component Analysis.
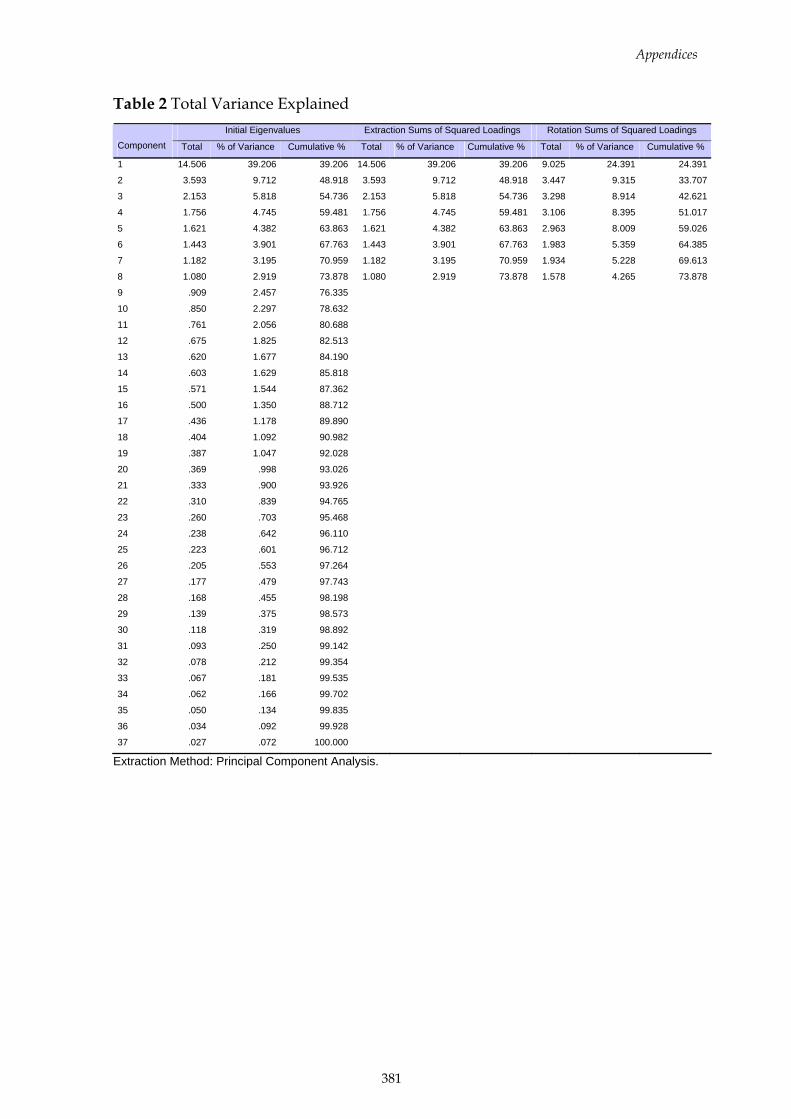
Appendices
381
Table 2 Total Variance Explained Initial Eigenvalues Extraction Sums of Squared Loadings Rotation Sums of Squared Loadings
Component Total % of Variance Cumulative % Total % of Variance Cumulative % Total % of Variance Cumulative %
1 14.506 39.206 39.206 14.506 39.206 39.206 9.025 24.391 24.391
2 3.593 9.712 48.918 3.593 9.712 48.918 3.447 9.315 33.707
3 2.153 5.818 54.736 2.153 5.818 54.736 3.298 8.914 42.621
4 1.756 4.745 59.481 1.756 4.745 59.481 3.106 8.395 51.017
5 1.621 4.382 63.863 1.621 4.382 63.863 2.963 8.009 59.026
6 1.443 3.901 67.763 1.443 3.901 67.763 1.983 5.359 64.385
7 1.182 3.195 70.959 1.182 3.195 70.959 1.934 5.228 69.613
8 1.080 2.919 73.878 1.080 2.919 73.878 1.578 4.265 73.878
9 .909 2.457 76.335
10 .850 2.297 78.632
11 .761 2.056 80.688
12 .675 1.825 82.513
13 .620 1.677 84.190
14 .603 1.629 85.818
15 .571 1.544 87.362
16 .500 1.350 88.712
17 .436 1.178 89.890
18 .404 1.092 90.982
19 .387 1.047 92.028
20 .369 .998 93.026
21 .333 .900 93.926
22 .310 .839 94.765
23 .260 .703 95.468
24 .238 .642 96.110
25 .223 .601 96.712
26 .205 .553 97.264
27 .177 .479 97.743
28 .168 .455 98.198
29 .139 .375 98.573
30 .118 .319 98.892
31 .093 .250 99.142
32 .078 .212 99.354
33 .067 .181 99.535
34 .062 .166 99.702
35 .050 .134 99.835
36 .034 .092 99.928
37 .027 .072 100.000
Extraction Method: Principal Component Analysis.
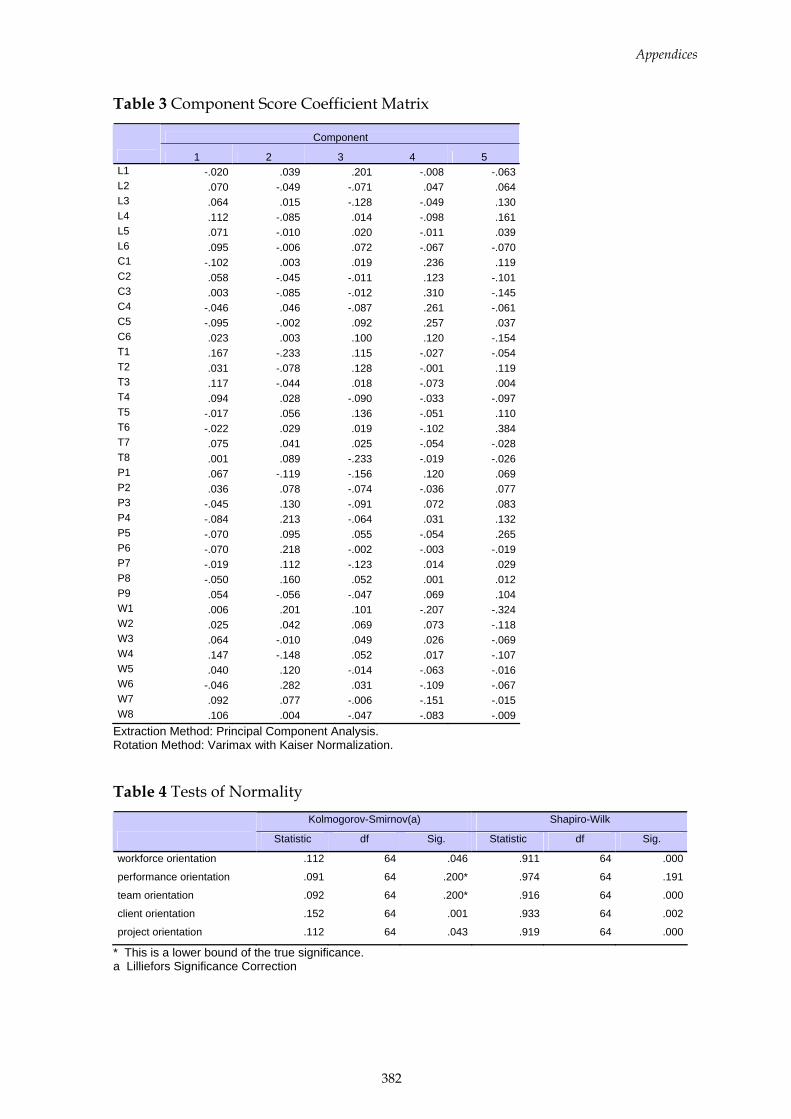
Appendices
382
Table 3 Component Score Coefficient Matrix
Component
1 2 3 4 5 L1 -.020 .039 .201 -.008 -.063L2 .070 -.049 -.071 .047 .064L3 .064 .015 -.128 -.049 .130L4 .112 -.085 .014 -.098 .161L5 .071 -.010 .020 -.011 .039L6 .095 -.006 .072 -.067 -.070C1 -.102 .003 .019 .236 .119C2 .058 -.045 -.011 .123 -.101C3 .003 -.085 -.012 .310 -.145C4 -.046 .046 -.087 .261 -.061C5 -.095 -.002 .092 .257 .037C6 .023 .003 .100 .120 -.154T1 .167 -.233 .115 -.027 -.054T2 .031 -.078 .128 -.001 .119T3 .117 -.044 .018 -.073 .004T4 .094 .028 -.090 -.033 -.097T5 -.017 .056 .136 -.051 .110T6 -.022 .029 .019 -.102 .384T7 .075 .041 .025 -.054 -.028T8 .001 .089 -.233 -.019 -.026P1 .067 -.119 -.156 .120 .069P2 .036 .078 -.074 -.036 .077P3 -.045 .130 -.091 .072 .083P4 -.084 .213 -.064 .031 .132P5 -.070 .095 .055 -.054 .265P6 -.070 .218 -.002 -.003 -.019P7 -.019 .112 -.123 .014 .029P8 -.050 .160 .052 .001 .012P9 .054 -.056 -.047 .069 .104W1 .006 .201 .101 -.207 -.324W2 .025 .042 .069 .073 -.118W3 .064 -.010 .049 .026 -.069W4 .147 -.148 .052 .017 -.107W5 .040 .120 -.014 -.063 -.016W6 -.046 .282 .031 -.109 -.067W7 .092 .077 -.006 -.151 -.015W8 .106 .004 -.047 -.083 -.009
Extraction Method: Principal Component Analysis. Rotation Method: Varimax with Kaiser Normalization.
Table 4 Tests of Normality Kolmogorov-Smirnov(a) Shapiro-Wilk
Statistic df Sig. Statistic df Sig.
workforce orientation .112 64 .046 .911 64 .000
performance orientation .091 64 .200* .974 64 .191
team orientation .092 64 .200* .916 64 .000
client orientation .152 64 .001 .933 64 .002
project orientation .112 64 .043 .919 64 .000
* This is a lower bound of the true significance. a Lilliefors Significance Correction

Appendices
383
Appendix J Cluster analysis output for dimensions of culture
Table 1 Case Processing Summary(a,b)
Cases Valid Missing Total
N Percent N Percent N Percent 64 100.0 0 .0 64 100.0
a Squared Euclidean Distance used b Complete Linkage
Table 2 Agglomeration Schedule
Cluster Combined Stage Cluster First Appears Stage Cluster 1 Cluster 2 Coefficients Cluster 1 Cluster 2 Next Stage 1 9 49 .284 0 0 21 2 18 19 .293 0 0 22 3 31 54 .339 0 0 10 4 21 51 .499 0 0 25 5 8 55 .634 0 0 21 6 14 36 .659 0 0 41 7 3 4 .700 0 0 10 8 2 24 .723 0 0 38 9 37 60 .770 0 0 30 10 3 31 .838 7 3 36 11 22 46 .845 0 0 30 12 23 41 .859 0 0 46 13 11 52 .961 0 0 35 14 48 62 .983 0 0 29 15 32 58 .990 0 0 33 16 16 33 1.000 0 0 39 17 39 64 1.041 0 0 44 18 1 13 1.055 0 0 39 19 27 50 1.076 0 0 22 20 7 17 1.164 0 0 32 21 8 9 1.213 5 1 34 22 18 27 1.392 2 19 38 23 15 40 1.550 0 0 42 24 47 57 1.585 0 0 47 25 12 21 1.615 0 4 36 26 20 28 1.631 0 0 46 27 42 59 1.831 0 0 34 28 26 29 1.834 0 0 42 29 6 48 1.927 0 14 41 30 22 37 2.248 11 9 44 31 25 61 2.263 0 0 56 32 7 34 2.338 20 0 52 33 30 32 2.357 0 15 45 34 8 42 2.445 21 27 49 35 5 11 2.465 0 13 50 36 3 12 2.504 10 25 48 37 10 53 2.551 0 0 43 38 2 18 2.565 8 22 49 39 1 16 2.795 18 16 55 40 43 63 2.930 0 0 52 41 6 14 3.920 29 6 47 42 15 26 3.935 23 28 54
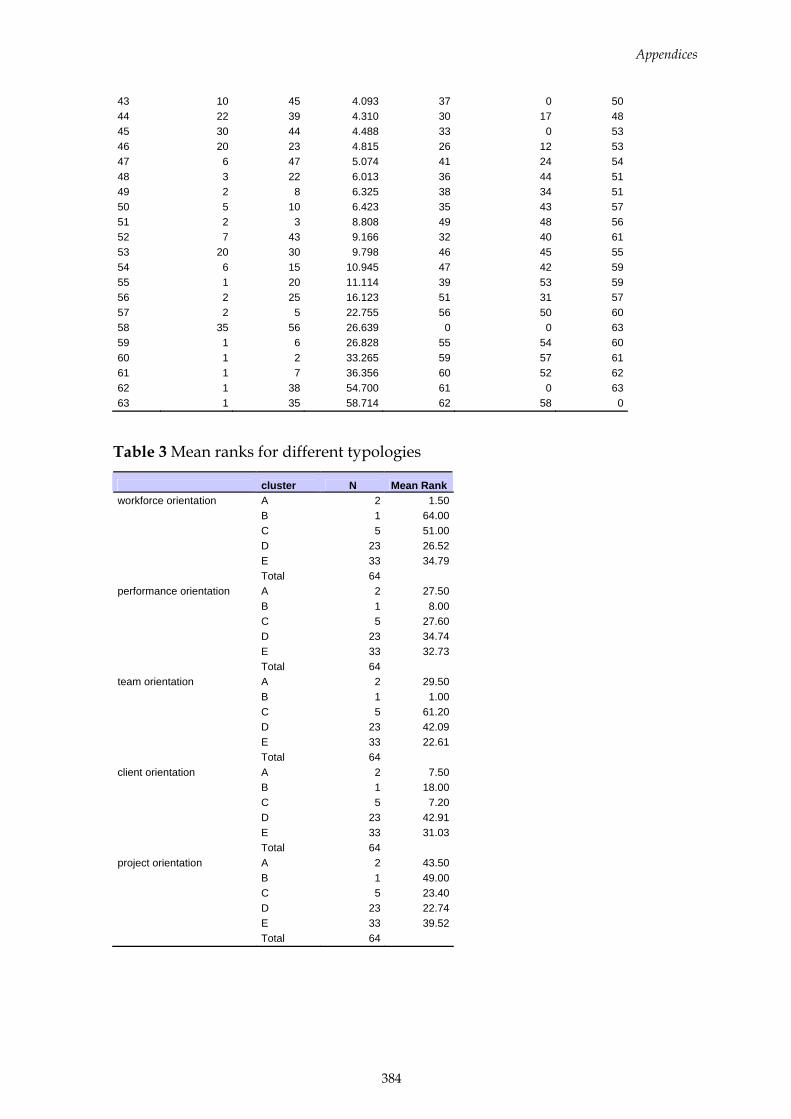
Appendices
384
43 10 45 4.093 37 0 50 44 22 39 4.310 30 17 48 45 30 44 4.488 33 0 53 46 20 23 4.815 26 12 53 47 6 47 5.074 41 24 54 48 3 22 6.013 36 44 51 49 2 8 6.325 38 34 51 50 5 10 6.423 35 43 57 51 2 3 8.808 49 48 56 52 7 43 9.166 32 40 61 53 20 30 9.798 46 45 55 54 6 15 10.945 47 42 59 55 1 20 11.114 39 53 59 56 2 25 16.123 51 31 57 57 2 5 22.755 56 50 60 58 35 56 26.639 0 0 63 59 1 6 26.828 55 54 60 60 1 2 33.265 59 57 61 61 1 7 36.356 60 52 62 62 1 38 54.700 61 0 63 63 1 35 58.714 62 58 0
Table 3 Mean ranks for different typologies
cluster N Mean Rankworkforce orientation A 2 1.50 B 1 64.00 C 5 51.00 D 23 26.52 E 33 34.79 Total 64 performance orientation A 2 27.50 B 1 8.00 C 5 27.60 D 23 34.74 E 33 32.73 Total 64 team orientation A 2 29.50 B 1 1.00 C 5 61.20 D 23 42.09 E 33 22.61 Total 64 client orientation A 2 7.50 B 1 18.00 C 5 7.20 D 23 42.91 E 33 31.03 Total 64 project orientation A 2 43.50 B 1 49.00 C 5 23.40 D 23 22.74 E 33 39.52 Total 64
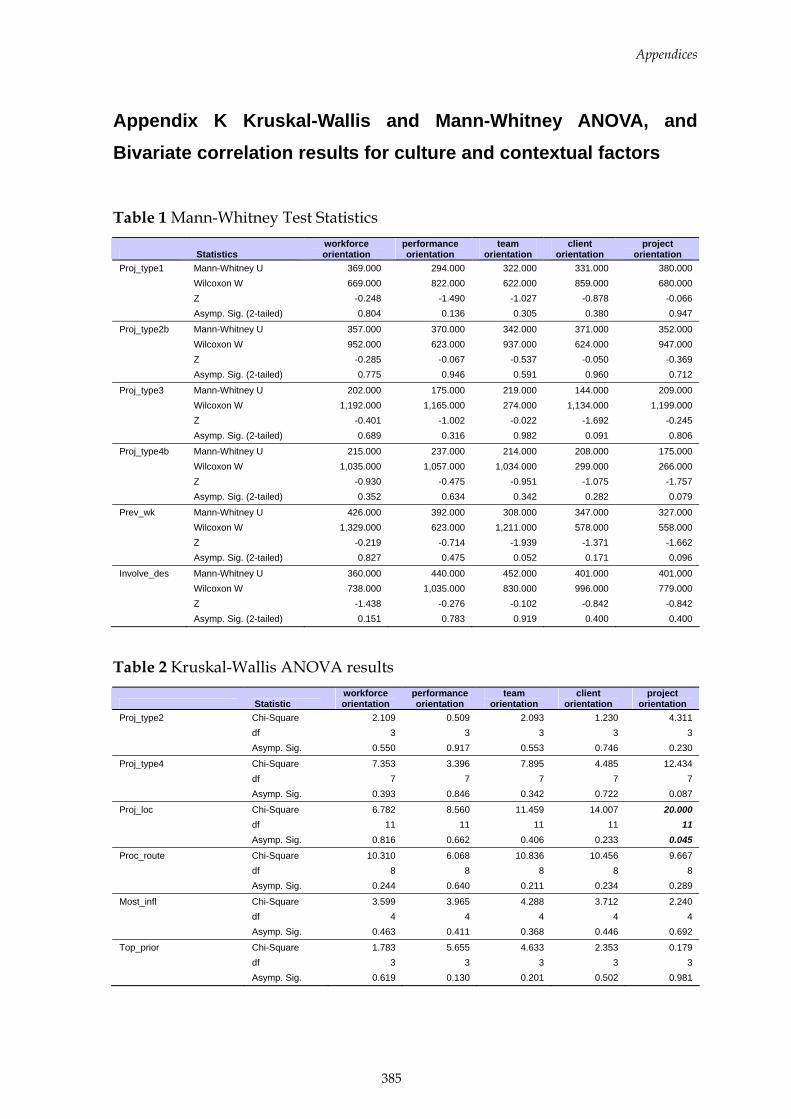
Appendices
385
Appendix K Kruskal-Wallis and Mann-Whitney ANOVA, and Bivariate correlation results for culture and contextual factors
Table 1 Mann-Whitney Test Statistics
Statistics workforce orientation
performance orientation
team orientation
client orientation
project orientation
Proj_type1 Mann-Whitney U 369.000 294.000 322.000 331.000 380.000 Wilcoxon W 669.000 822.000 622.000 859.000 680.000 Z -0.248 -1.490 -1.027 -0.878 -0.066 Asymp. Sig. (2-tailed) 0.804 0.136 0.305 0.380 0.947
Proj_type2b Mann-Whitney U 357.000 370.000 342.000 371.000 352.000 Wilcoxon W 952.000 623.000 937.000 624.000 947.000 Z -0.285 -0.067 -0.537 -0.050 -0.369 Asymp. Sig. (2-tailed) 0.775 0.946 0.591 0.960 0.712
Proj_type3 Mann-Whitney U 202.000 175.000 219.000 144.000 209.000 Wilcoxon W 1,192.000 1,165.000 274.000 1,134.000 1,199.000 Z -0.401 -1.002 -0.022 -1.692 -0.245 Asymp. Sig. (2-tailed) 0.689 0.316 0.982 0.091 0.806
Proj_type4b Mann-Whitney U 215.000 237.000 214.000 208.000 175.000 Wilcoxon W 1,035.000 1,057.000 1,034.000 299.000 266.000 Z -0.930 -0.475 -0.951 -1.075 -1.757 Asymp. Sig. (2-tailed) 0.352 0.634 0.342 0.282 0.079
Prev_wk Mann-Whitney U 426.000 392.000 308.000 347.000 327.000 Wilcoxon W 1,329.000 623.000 1,211.000 578.000 558.000 Z -0.219 -0.714 -1.939 -1.371 -1.662 Asymp. Sig. (2-tailed) 0.827 0.475 0.052 0.171 0.096
Involve_des Mann-Whitney U 360.000 440.000 452.000 401.000 401.000 Wilcoxon W 738.000 1,035.000 830.000 996.000 779.000 Z -1.438 -0.276 -0.102 -0.842 -0.842 Asymp. Sig. (2-tailed) 0.151 0.783 0.919 0.400 0.400
Table 2 Kruskal-Wallis ANOVA results
Statistic workforce orientation
performance orientation
team orientation
client orientation
project orientation
Proj_type2 Chi-Square 2.109 0.509 2.093 1.230 4.311 df 3 3 3 3 3 Asymp. Sig. 0.550 0.917 0.553 0.746 0.230
Proj_type4 Chi-Square 7.353 3.396 7.895 4.485 12.434 df 7 7 7 7 7 Asymp. Sig. 0.393 0.846 0.342 0.722 0.087
Proj_loc Chi-Square 6.782 8.560 11.459 14.007 20.000 df 11 11 11 11 11 Asymp. Sig. 0.816 0.662 0.406 0.233 0.045 Proc_route Chi-Square 10.310 6.068 10.836 10.456 9.667 df 8 8 8 8 8 Asymp. Sig. 0.244 0.640 0.211 0.234 0.289
Most_infl Chi-Square 3.599 3.965 4.288 3.712 2.240 df 4 4 4 4 4 Asymp. Sig. 0.463 0.411 0.368 0.446 0.692
Top_prior Chi-Square 1.783 5.655 4.633 2.353 0.179 df 3 3 3 3 3 Asymp. Sig. 0.619 0.130 0.201 0.502 0.981
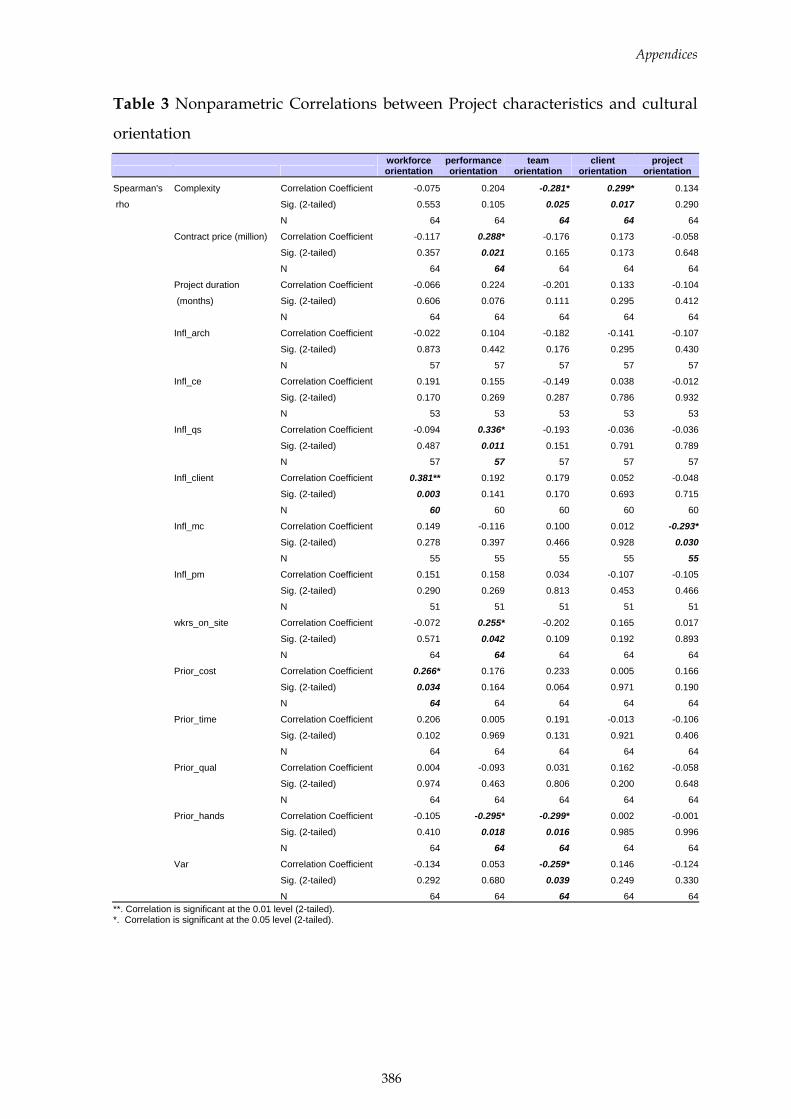
Appendices
386
Table 3 Nonparametric Correlations between Project characteristics and cultural
orientation
workforce orientation
performance orientation
team orientation
client orientation
project orientation
Spearman's Complexity Correlation Coefficient -0.075 0.204 -0.281* 0.299* 0.134
rho Sig. (2-tailed) 0.553 0.105 0.025 0.017 0.290
N 64 64 64 64 64
Contract price (million) Correlation Coefficient -0.117 0.288* -0.176 0.173 -0.058
Sig. (2-tailed) 0.357 0.021 0.165 0.173 0.648
N 64 64 64 64 64
Project duration Correlation Coefficient -0.066 0.224 -0.201 0.133 -0.104
(months) Sig. (2-tailed) 0.606 0.076 0.111 0.295 0.412
N 64 64 64 64 64
Infl_arch Correlation Coefficient -0.022 0.104 -0.182 -0.141 -0.107
Sig. (2-tailed) 0.873 0.442 0.176 0.295 0.430
N 57 57 57 57 57
Infl_ce Correlation Coefficient 0.191 0.155 -0.149 0.038 -0.012
Sig. (2-tailed) 0.170 0.269 0.287 0.786 0.932
N 53 53 53 53 53
Infl_qs Correlation Coefficient -0.094 0.336* -0.193 -0.036 -0.036
Sig. (2-tailed) 0.487 0.011 0.151 0.791 0.789
N 57 57 57 57 57
Infl_client Correlation Coefficient 0.381** 0.192 0.179 0.052 -0.048
Sig. (2-tailed) 0.003 0.141 0.170 0.693 0.715
N 60 60 60 60 60
Infl_mc Correlation Coefficient 0.149 -0.116 0.100 0.012 -0.293*
Sig. (2-tailed) 0.278 0.397 0.466 0.928 0.030 N 55 55 55 55 55
Infl_pm Correlation Coefficient 0.151 0.158 0.034 -0.107 -0.105
Sig. (2-tailed) 0.290 0.269 0.813 0.453 0.466
N 51 51 51 51 51
wkrs_on_site Correlation Coefficient -0.072 0.255* -0.202 0.165 0.017
Sig. (2-tailed) 0.571 0.042 0.109 0.192 0.893
N 64 64 64 64 64
Prior_cost Correlation Coefficient 0.266* 0.176 0.233 0.005 0.166
Sig. (2-tailed) 0.034 0.164 0.064 0.971 0.190
N 64 64 64 64 64
Prior_time Correlation Coefficient 0.206 0.005 0.191 -0.013 -0.106
Sig. (2-tailed) 0.102 0.969 0.131 0.921 0.406
N 64 64 64 64 64
Prior_qual Correlation Coefficient 0.004 -0.093 0.031 0.162 -0.058
Sig. (2-tailed) 0.974 0.463 0.806 0.200 0.648
N 64 64 64 64 64
Prior_hands Correlation Coefficient -0.105 -0.295* -0.299* 0.002 -0.001
Sig. (2-tailed) 0.410 0.018 0.016 0.985 0.996
N 64 64 64 64 64
Var Correlation Coefficient -0.134 0.053 -0.259* 0.146 -0.124
Sig. (2-tailed) 0.292 0.680 0.039 0.249 0.330
N 64 64 64 64 64**. Correlation is significant at the 0.01 level (2-tailed). *. Correlation is significant at the 0.05 level (2-tailed).
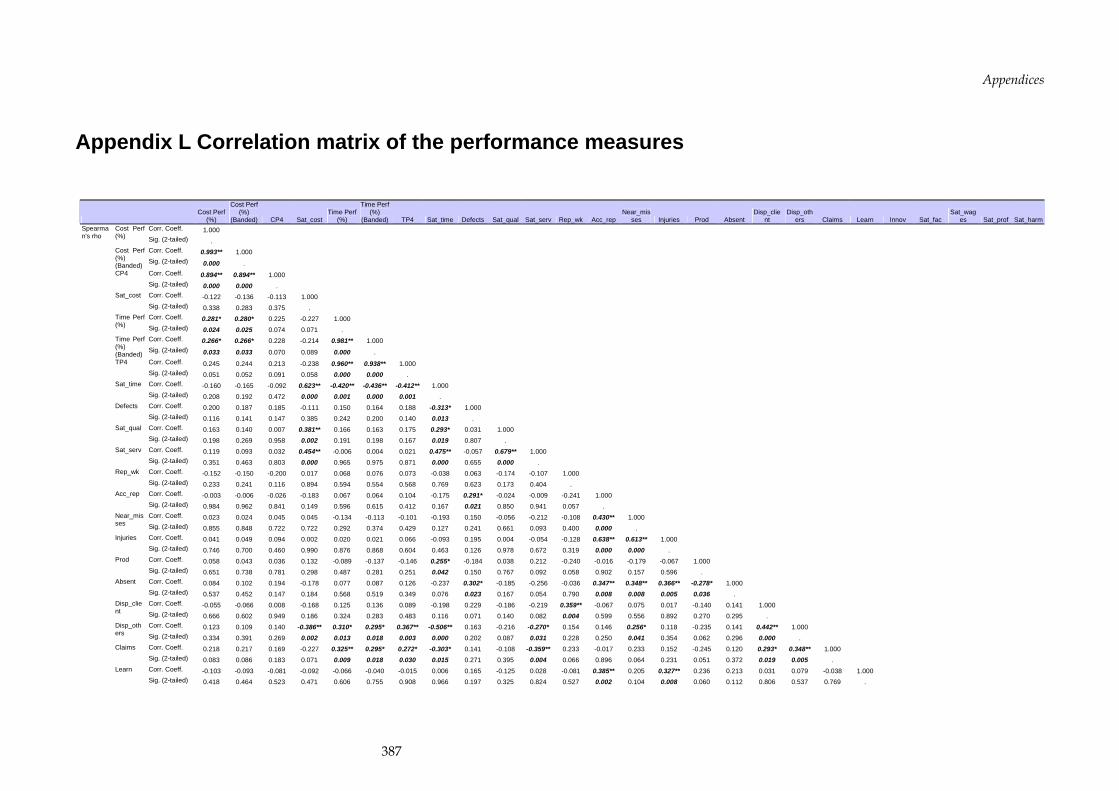
Appendices
387
Appendix L Correlation matrix of the performance measures
Cost Perf
(%)
Cost Perf (%)
(Banded) CP4 Sat_cost Time Perf
(%)
Time Perf (%)
(Banded) TP4 Sat_time Defects Sat_qual Sat_serv Rep_wk Acc_rep Near_mis
ses Injuries Prod Absent Disp_clie
nt Disp_oth
ers Claims Learn Innov Sat_fac Sat_wag
es Sat_prof Sat_harm Corr. Coeff. 1.000 Cost Perf
(%) Sig. (2-tailed) . Corr. Coeff. 0.993** 1.000 Cost Perf
(%) (Banded) Sig. (2-tailed) 0.000 .
Corr. Coeff. 0.894** 0.894** 1.000 CP4 Sig. (2-tailed) 0.000 0.000 . Corr. Coeff. -0.122 -0.136 -0.113 1.000 Sat_cost Sig. (2-tailed) 0.338 0.283 0.375 . Corr. Coeff. 0.281* 0.280* 0.225 -0.227 1.000 Time Perf
(%) Sig. (2-tailed) 0.024 0.025 0.074 0.071 . Corr. Coeff. 0.266* 0.266* 0.228 -0.214 0.981** 1.000 Time Perf
(%) (Banded) Sig. (2-tailed) 0.033 0.033 0.070 0.089 0.000 .
Corr. Coeff. 0.245 0.244 0.213 -0.238 0.960** 0.938** 1.000 TP4 Sig. (2-tailed) 0.051 0.052 0.091 0.058 0.000 0.000 . Corr. Coeff. -0.160 -0.165 -0.092 0.623** -0.420** -0.436** -0.412** 1.000 Sat_time Sig. (2-tailed) 0.208 0.192 0.472 0.000 0.001 0.000 0.001 . Corr. Coeff. 0.200 0.187 0.185 -0.111 0.150 0.164 0.188 -0.313* 1.000 Defects Sig. (2-tailed) 0.116 0.141 0.147 0.385 0.242 0.200 0.140 0.013 . Corr. Coeff. 0.163 0.140 0.007 0.381** 0.166 0.163 0.175 0.293* 0.031 1.000 Sat_qual Sig. (2-tailed) 0.198 0.269 0.958 0.002 0.191 0.198 0.167 0.019 0.807 . Corr. Coeff. 0.119 0.093 0.032 0.454** -0.006 0.004 0.021 0.475** -0.057 0.679** 1.000 Sat_serv Sig. (2-tailed) 0.351 0.463 0.803 0.000 0.965 0.975 0.871 0.000 0.655 0.000 . Corr. Coeff. -0.152 -0.150 -0.200 0.017 0.068 0.076 0.073 -0.038 0.063 -0.174 -0.107 1.000 Rep_wk Sig. (2-tailed) 0.233 0.241 0.116 0.894 0.594 0.554 0.568 0.769 0.623 0.173 0.404 . Corr. Coeff. -0.003 -0.006 -0.026 -0.183 0.067 0.064 0.104 -0.175 0.291* -0.024 -0.009 -0.241 1.000 Acc_rep Sig. (2-tailed) 0.984 0.962 0.841 0.149 0.596 0.615 0.412 0.167 0.021 0.850 0.941 0.057 . Corr. Coeff. 0.023 0.024 0.045 0.045 -0.134 -0.113 -0.101 -0.193 0.150 -0.056 -0.212 -0.108 0.430** 1.000 Near_mis
ses Sig. (2-tailed) 0.855 0.848 0.722 0.722 0.292 0.374 0.429 0.127 0.241 0.661 0.093 0.400 0.000 . Corr. Coeff. 0.041 0.049 0.094 0.002 0.020 0.021 0.066 -0.093 0.195 0.004 -0.054 -0.128 0.638** 0.613** 1.000 Injuries Sig. (2-tailed) 0.746 0.700 0.460 0.990 0.876 0.868 0.604 0.463 0.126 0.978 0.672 0.319 0.000 0.000 . Corr. Coeff. 0.058 0.043 0.036 0.132 -0.089 -0.137 -0.146 0.255* -0.184 0.038 0.212 -0.240 -0.016 -0.179 -0.067 1.000 Prod Sig. (2-tailed) 0.651 0.738 0.781 0.298 0.487 0.281 0.251 0.042 0.150 0.767 0.092 0.058 0.902 0.157 0.596 . Corr. Coeff. 0.084 0.102 0.194 -0.178 0.077 0.087 0.126 -0.237 0.302* -0.185 -0.256 -0.036 0.347** 0.348** 0.366** -0.278* 1.000 Absent Sig. (2-tailed) 0.537 0.452 0.147 0.184 0.568 0.519 0.349 0.076 0.023 0.167 0.054 0.790 0.008 0.008 0.005 0.036 . Corr. Coeff. -0.055 -0.066 0.008 -0.168 0.125 0.136 0.089 -0.198 0.229 -0.186 -0.219 0.359** -0.067 0.075 0.017 -0.140 0.141 1.000 Disp_clie
nt Sig. (2-tailed) 0.666 0.602 0.949 0.186 0.324 0.283 0.483 0.116 0.071 0.140 0.082 0.004 0.599 0.556 0.892 0.270 0.295 . Corr. Coeff. 0.123 0.109 0.140 -0.386** 0.310* 0.295* 0.367** -0.506** 0.163 -0.216 -0.270* 0.154 0.146 0.256* 0.118 -0.235 0.141 0.442** 1.000 Disp_oth
ers Sig. (2-tailed) 0.334 0.391 0.269 0.002 0.013 0.018 0.003 0.000 0.202 0.087 0.031 0.228 0.250 0.041 0.354 0.062 0.296 0.000 . Corr. Coeff. 0.218 0.217 0.169 -0.227 0.325** 0.295* 0.272* -0.303* 0.141 -0.108 -0.359** 0.233 -0.017 0.233 0.152 -0.245 0.120 0.293* 0.348** 1.000 Claims Sig. (2-tailed) 0.083 0.086 0.183 0.071 0.009 0.018 0.030 0.015 0.271 0.395 0.004 0.066 0.896 0.064 0.231 0.051 0.372 0.019 0.005 . Corr. Coeff. -0.103 -0.093 -0.081 -0.092 -0.066 -0.040 -0.015 0.006 0.165 -0.125 0.028 -0.081 0.385** 0.205 0.327** 0.236 0.213 0.031 0.079 -0.038 1.000
Spearman's rho
Learn Sig. (2-tailed) 0.418 0.464 0.523 0.471 0.606 0.755 0.908 0.966 0.197 0.325 0.824 0.527 0.002 0.104 0.008 0.060 0.112 0.806 0.537 0.769 .
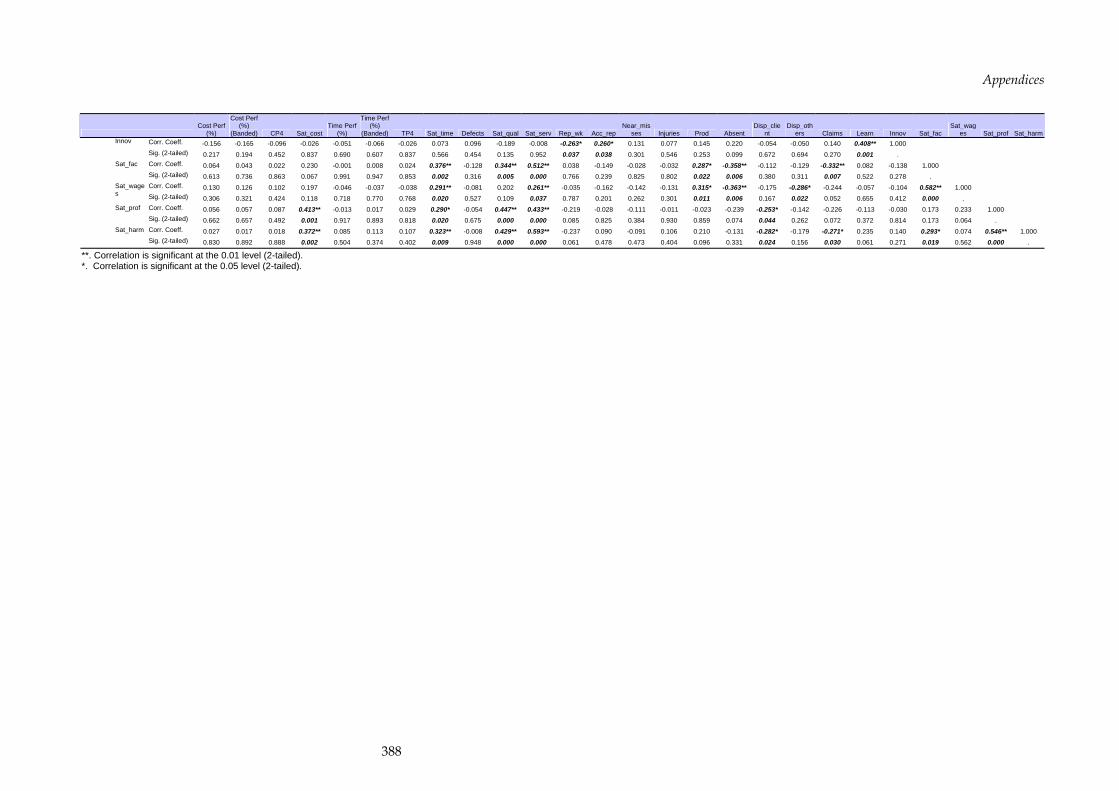
Appendices
388
Cost Perf
(%)
Cost Perf (%)
(Banded) CP4 Sat_cost Time Perf
(%)
Time Perf (%)
(Banded) TP4 Sat_time Defects Sat_qual Sat_serv Rep_wk Acc_rep Near_mis
ses Injuries Prod Absent Disp_clie
nt Disp_oth
ers Claims Learn Innov Sat_fac Sat_wag
es Sat_prof Sat_harm Corr. Coeff. -0.156 -0.165 -0.096 -0.026 -0.051 -0.066 -0.026 0.073 0.096 -0.189 -0.008 -0.263* 0.260* 0.131 0.077 0.145 0.220 -0.054 -0.050 0.140 0.408** 1.000 Innov
Sig. (2-tailed) 0.217 0.194 0.452 0.837 0.690 0.607 0.837 0.566 0.454 0.135 0.952 0.037 0.038 0.301 0.546 0.253 0.099 0.672 0.694 0.270 0.001 . Corr. Coeff. 0.064 0.043 0.022 0.230 -0.001 0.008 0.024 0.376** -0.128 0.344** 0.512** 0.038 -0.149 -0.028 -0.032 0.287* -0.358** -0.112 -0.129 -0.332** 0.082 -0.138 1.000 Sat_fac Sig. (2-tailed) 0.613 0.736 0.863 0.067 0.991 0.947 0.853 0.002 0.316 0.005 0.000 0.766 0.239 0.825 0.802 0.022 0.006 0.380 0.311 0.007 0.522 0.278 . Corr. Coeff. 0.130 0.126 0.102 0.197 -0.046 -0.037 -0.038 0.291** -0.081 0.202 0.261** -0.035 -0.162 -0.142 -0.131 0.315* -0.363** -0.175 -0.286* -0.244 -0.057 -0.104 0.582** 1.000 Sat_wage
s Sig. (2-tailed) 0.306 0.321 0.424 0.118 0.718 0.770 0.768 0.020 0.527 0.109 0.037 0.787 0.201 0.262 0.301 0.011 0.006 0.167 0.022 0.052 0.655 0.412 0.000 . Corr. Coeff. 0.056 0.057 0.087 0.413** -0.013 0.017 0.029 0.290* -0.054 0.447** 0.433** -0.219 -0.028 -0.111 -0.011 -0.023 -0.239 -0.253* -0.142 -0.226 -0.113 -0.030 0.173 0.233 1.000 Sat_prof Sig. (2-tailed) 0.662 0.657 0.492 0.001 0.917 0.893 0.818 0.020 0.675 0.000 0.000 0.085 0.825 0.384 0.930 0.859 0.074 0.044 0.262 0.072 0.372 0.814 0.173 0.064 . Corr. Coeff. 0.027 0.017 0.018 0.372** 0.085 0.113 0.107 0.323** -0.008 0.429** 0.593** -0.237 0.090 -0.091 0.106 0.210 -0.131 -0.282* -0.179 -0.271* 0.235 0.140 0.293* 0.074 0.546** 1.000 Sat_harm Sig. (2-tailed) 0.830 0.892 0.888 0.002 0.504 0.374 0.402 0.009 0.948 0.000 0.000 0.061 0.478 0.473 0.404 0.096 0.331 0.024 0.156 0.030 0.061 0.271 0.019 0.562 0.000 .
**. Correlation is significant at the 0.01 level (2-tailed). *. Correlation is significant at the 0.05 level (2-tailed).
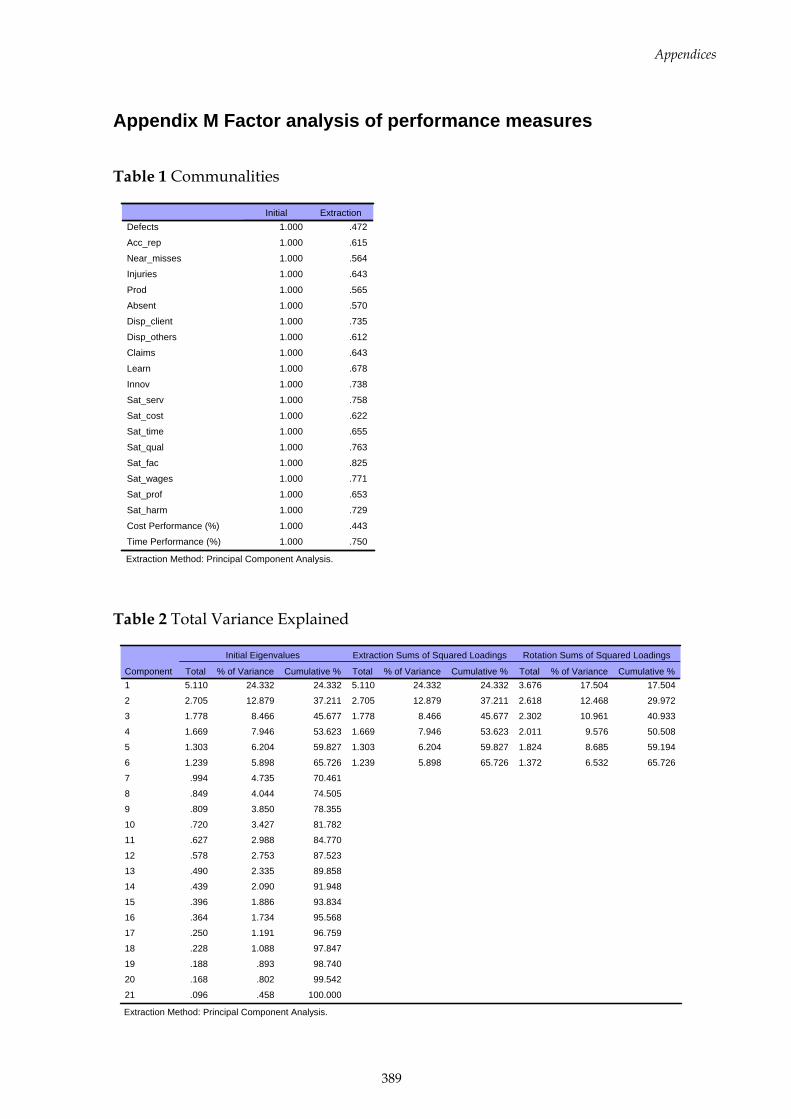
Appendices
389
Appendix M Factor analysis of performance measures
Table 1 Communalities
1.000 .472
1.000 .615
1.000 .564
1.000 .643
1.000 .565
1.000 .570
1.000 .735
1.000 .612
1.000 .643
1.000 .678
1.000 .738
1.000 .758
1.000 .622
1.000 .655
1.000 .763
1.000 .825
1.000 .771
1.000 .653
1.000 .729
1.000 .443
1.000 .750
Defects
Acc_rep
Near_misses
Injuries
Prod
Absent
Disp_client
Disp_others
Claims
Learn
Innov
Sat_serv
Sat_cost
Sat_time
Sat_qual
Sat_fac
Sat_wages
Sat_prof
Sat_harm
Cost Performance (%)
Time Performance (%)
Initial Extraction
Extraction Method: Principal Component Analysis.
Table 2 Total Variance Explained
5.110 24.332 24.332 5.110 24.332 24.332 3.676 17.504 17.504
2.705 12.879 37.211 2.705 12.879 37.211 2.618 12.468 29.972
1.778 8.466 45.677 1.778 8.466 45.677 2.302 10.961 40.933
1.669 7.946 53.623 1.669 7.946 53.623 2.011 9.576 50.508
1.303 6.204 59.827 1.303 6.204 59.827 1.824 8.685 59.194
1.239 5.898 65.726 1.239 5.898 65.726 1.372 6.532 65.726
.994 4.735 70.461
.849 4.044 74.505
.809 3.850 78.355
.720 3.427 81.782
.627 2.988 84.770
.578 2.753 87.523
.490 2.335 89.858
.439 2.090 91.948
.396 1.886 93.834
.364 1.734 95.568
.250 1.191 96.759
.228 1.088 97.847
.188 .893 98.740
.168 .802 99.542
.096 .458 100.000
Component1
2
3
4
5
6
7
8
9
10
11
12
13
14
15
16
17
18
19
20
21
Total % of Variance Cumulative % Total % of Variance Cumulative % Total % of Variance Cumulative %
Initial Eigenvalues Extraction Sums of Squared Loadings Rotation Sums of Squared Loadings
Extraction Method: Principal Component Analysis.
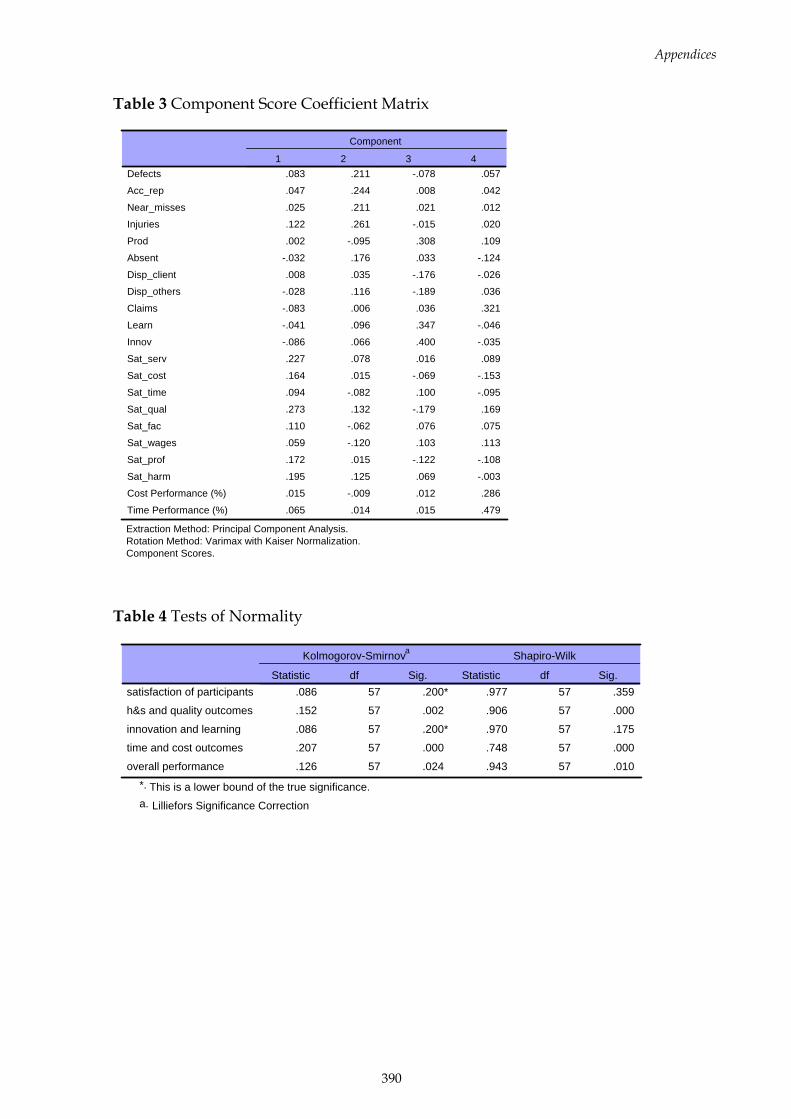
Appendices
390
Table 3 Component Score Coefficient Matrix
.083 .211 -.078 .057
.047 .244 .008 .042
.025 .211 .021 .012
.122 .261 -.015 .020
.002 -.095 .308 .109
-.032 .176 .033 -.124
.008 .035 -.176 -.026
-.028 .116 -.189 .036
-.083 .006 .036 .321
-.041 .096 .347 -.046
-.086 .066 .400 -.035
.227 .078 .016 .089
.164 .015 -.069 -.153
.094 -.082 .100 -.095
.273 .132 -.179 .169
.110 -.062 .076 .075
.059 -.120 .103 .113
.172 .015 -.122 -.108
.195 .125 .069 -.003
.015 -.009 .012 .286
.065 .014 .015 .479
Defects
Acc_rep
Near_misses
Injuries
Prod
Absent
Disp_client
Disp_others
Claims
Learn
Innov
Sat_serv
Sat_cost
Sat_time
Sat_qual
Sat_fac
Sat_wages
Sat_prof
Sat_harm
Cost Performance (%)
Time Performance (%)
1 2 3 4
Component
Extraction Method: Principal Component Analysis. Rotation Method: Varimax with Kaiser Normalization. Component Scores.
Table 4 Tests of Normality
.086 57 .200* .977 57 .359
.152 57 .002 .906 57 .000
.086 57 .200* .970 57 .175
.207 57 .000 .748 57 .000
.126 57 .024 .943 57 .010
satisfaction of participants
h&s and quality outcomes
innovation and learning
time and cost outcomes
overall performance
Statistic df Sig. Statistic df Sig.
Kolmogorov-Smirnova Shapiro-Wilk
This is a lower bound of the true significance.*.
Lilliefors Significance Correctiona.

Appendices
391
Appendix N Kruskal-Wallis and Mann-Whitney ANOVA, and Bivariate correlation results for performance and contextual factors
Table 1 Mann-Whitney Test Statistics
Statistics satisfaction of participants
h&s and quality outcomes
innovation and learning
time and cost outcomes
overall performance
Proj_type1 Mann-Whitney U 248.000 222.000 214.000 296.000 270.000 Wilcoxon W 458.000 687.000 679.000 506.000 480.000 Z -1.030 -1.545 -1.703 -.079 -.594 Asymp. Sig. (2-tailed) .303 .122 .089 .937 .552
Proj_type2b Mann-Whitney U 256.000 176.000 237.000 178.000 254.000 Wilcoxon W 409.000 329.000 390.000 706.000 407.000 Z -.336 -2.016 -.735 -1.974 -.378 Asymp. Sig. (2-tailed) .737 .044 .462 .048 .705
Proj_type3 Mann-Whitney U 138.000 140.000 108.000 119.000 90.000 Wilcoxon W 958.000 960.000 928.000 147.000 910.000 Z -.060 .000 -.956 -.627 -1.494 Asymp. Sig. (2-tailed) .952 1.000 .339 .530 .135
Proj_type4b Mann-Whitney U 160.000 138.000 111.000 181.000 178.000 Wilcoxon W 790.000 204.000 177.000 811.000 244.000 Z -.837 -1.403 -2.099 -.296 -.373 Asymp. Sig. (2-tailed) .403 .160 .036 .767 .709
Prev_wk Mann-Whitney U 276.000 332.000 294.000 314.000 301.000 Wilcoxon W 979.000 1035.000 484.000 1017.000 491.000 Z -1.307 -.337 -.995 -.649 -.874 Asymp. Sig. (2-tailed) .191 .736 .320 .516 .382
Involve_des Mann-Whitney U 361.000 343.000 254.000 354.000 278.000 Wilcoxon W 796.000 668.000 579.000 679.000 603.000 Z -.026 -.338 -1.882 -.147 -1.466 Asymp. Sig. (2-tailed) .979 .735 .060 .883 .143
Table 2 Kruskal-Wallis ANOVA results
Statistics satisfaction of participants
h&s and quality outcomes
innovation and learning
time and cost outcomes
overall performance
Proj_type2 Chi-Square 1.817 8.351 .800 6.853 2.994 df 3 3 3 3 3 Asymp. Sig. .611 .039 .849 .077 .393
Proj_type4 Chi-Square 7.811 10.034 7.838 8.003 10.103 df 7 7 7 7 7 Asymp. Sig. .350 .187 .347 .332 .183
Proj_loc Chi-Square 16.747 18.803 7.632 10.339 14.659 df 11 11 11 11 11 Asymp. Sig. .116 .065 .746 .500 .199
Proc_route Chi-Square 4.848 4.708 7.714 4.764 9.639 df 6 6 6 6 6 Asymp. Sig. .563 .582 .260 .574 .141
Most_infl Chi-Square 7.696 3.431 4.206 2.890 4.478 df 4 4 4 4 4 Asymp. Sig. .103 .488 .379 .576 .345
Top_prior Chi-Square 5.648 5.179 3.338 2.134 2.433 df 3 3 3 3 3 Asymp. Sig. .130 .159 .342 .545 .488
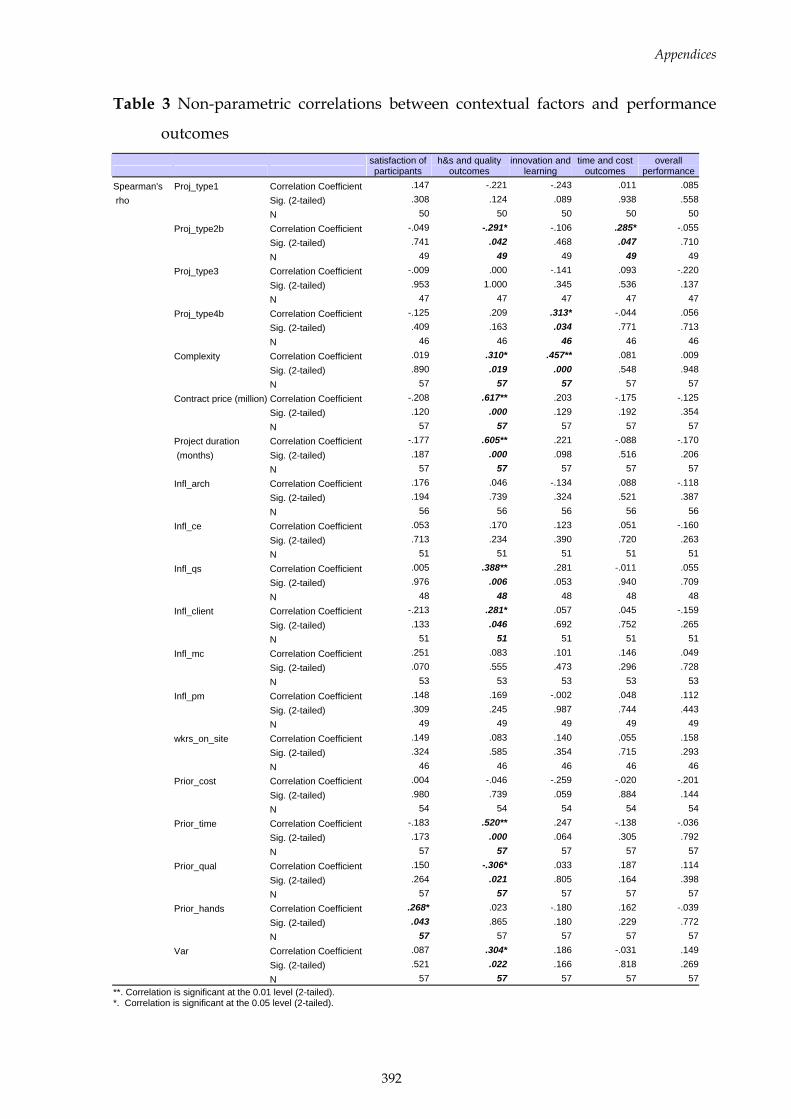
Appendices
392
Table 3 Non-parametric correlations between contextual factors and performance
outcomes
satisfaction of participants
h&s and quality outcomes
innovation and learning
time and cost outcomes
overall performance
Spearman's Proj_type1 Correlation Coefficient .147 -.221 -.243 .011 .085 rho Sig. (2-tailed) .308 .124 .089 .938 .558 N 50 50 50 50 50 Proj_type2b Correlation Coefficient -.049 -.291* -.106 .285* -.055 Sig. (2-tailed) .741 .042 .468 .047 .710 N 49 49 49 49 49 Proj_type3 Correlation Coefficient -.009 .000 -.141 .093 -.220 Sig. (2-tailed) .953 1.000 .345 .536 .137 N 47 47 47 47 47 Proj_type4b Correlation Coefficient -.125 .209 .313* -.044 .056 Sig. (2-tailed) .409 .163 .034 .771 .713 N 46 46 46 46 46 Complexity Correlation Coefficient .019 .310* .457** .081 .009 Sig. (2-tailed) .890 .019 .000 .548 .948 N 57 57 57 57 57 Contract price (million) Correlation Coefficient -.208 .617** .203 -.175 -.125 Sig. (2-tailed) .120 .000 .129 .192 .354 N 57 57 57 57 57 Project duration Correlation Coefficient -.177 .605** .221 -.088 -.170 (months) Sig. (2-tailed) .187 .000 .098 .516 .206 N 57 57 57 57 57 Infl_arch Correlation Coefficient .176 .046 -.134 .088 -.118 Sig. (2-tailed) .194 .739 .324 .521 .387 N 56 56 56 56 56 Infl_ce Correlation Coefficient .053 .170 .123 .051 -.160 Sig. (2-tailed) .713 .234 .390 .720 .263 N 51 51 51 51 51 Infl_qs Correlation Coefficient .005 .388** .281 -.011 .055 Sig. (2-tailed) .976 .006 .053 .940 .709 N 48 48 48 48 48 Infl_client Correlation Coefficient -.213 .281* .057 .045 -.159 Sig. (2-tailed) .133 .046 .692 .752 .265 N 51 51 51 51 51 Infl_mc Correlation Coefficient .251 .083 .101 .146 .049 Sig. (2-tailed) .070 .555 .473 .296 .728 N 53 53 53 53 53 Infl_pm Correlation Coefficient .148 .169 -.002 .048 .112 Sig. (2-tailed) .309 .245 .987 .744 .443 N 49 49 49 49 49 wkrs_on_site Correlation Coefficient .149 .083 .140 .055 .158 Sig. (2-tailed) .324 .585 .354 .715 .293 N 46 46 46 46 46 Prior_cost Correlation Coefficient .004 -.046 -.259 -.020 -.201 Sig. (2-tailed) .980 .739 .059 .884 .144 N 54 54 54 54 54 Prior_time Correlation Coefficient -.183 .520** .247 -.138 -.036 Sig. (2-tailed) .173 .000 .064 .305 .792 N 57 57 57 57 57 Prior_qual Correlation Coefficient .150 -.306* .033 .187 .114 Sig. (2-tailed) .264 .021 .805 .164 .398 N 57 57 57 57 57 Prior_hands Correlation Coefficient .268* .023 -.180 .162 -.039 Sig. (2-tailed) .043 .865 .180 .229 .772 N 57 57 57 57 57 Var Correlation Coefficient .087 .304* .186 -.031 .149 Sig. (2-tailed) .521 .022 .166 .818 .269 N 57 57 57 57 57**. Correlation is significant at the 0.01 level (2-tailed). *. Correlation is significant at the 0.05 level (2-tailed).
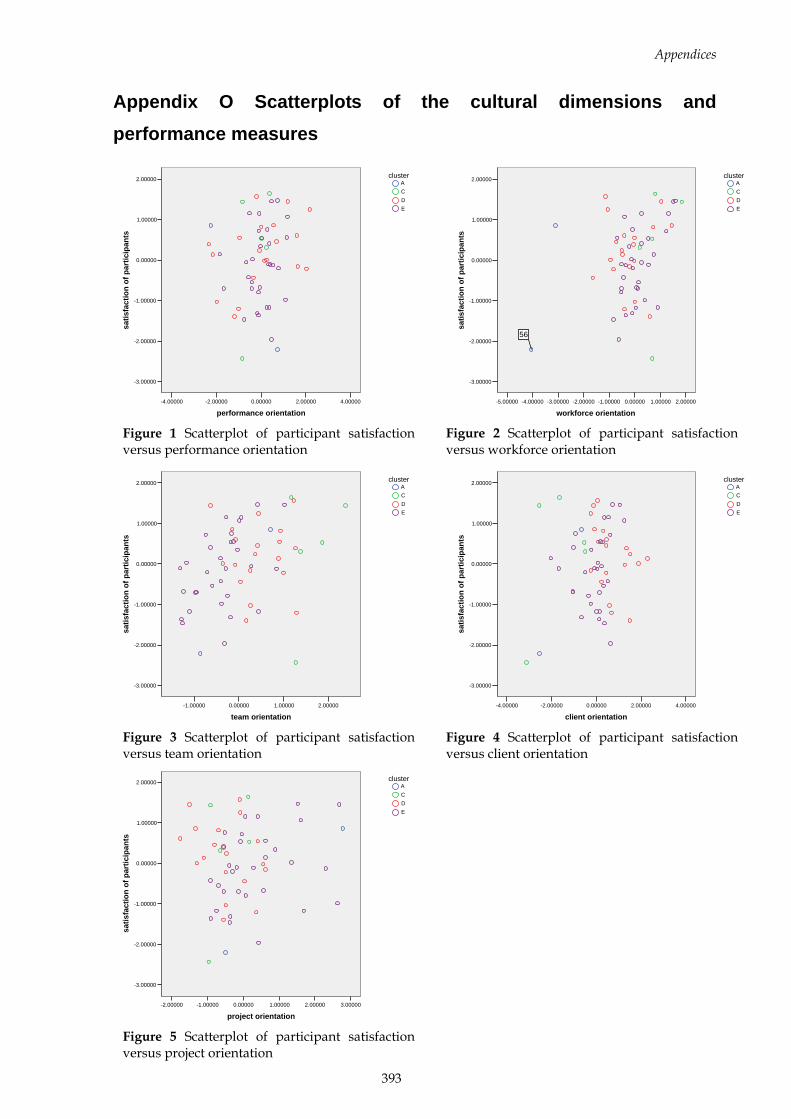
Appendices
393
Appendix O Scatterplots of the cultural dimensions and performance measures
4.000002.000000.00000-2.00000-4.00000
performance orientation
2.00000
1.00000
0.00000
-1.00000
-2.00000
-3.00000
satis
fact
ion
of p
artic
ipan
ts
EDCA
cluster
2.000001.000000.00000-1.00000
team orientation
2.00000
1.00000
0.00000
-1.00000
-2.00000
-3.00000
satis
fact
ion
of p
artic
ipan
ts
EDCA
cluster
4.000002.000000.00000-2.00000-4.00000
client orientation
2.00000
1.00000
0.00000
-1.00000
-2.00000
-3.00000
satis
fact
ion
of p
artic
ipan
ts
EDCA
cluster
3.000002.000001.000000.00000-1.00000-2.00000
project orientation
2.00000
1.00000
0.00000
-1.00000
-2.00000
-3.00000
satis
fact
ion
of p
artic
ipan
ts
EDCA
cluster
2.000001.000000.00000-1.00000-2.00000-3.00000-4.00000-5.00000
workforce orientation
2.00000
1.00000
0.00000
-1.00000
-2.00000
-3.00000
satis
fact
ion
of p
artic
ipan
ts
56
EDCA
cluster
Figure 1 Scatterplot of participant satisfaction versus performance orientation
Figure 2 Scatterplot of participant satisfaction versus workforce orientation
Figure 3 Scatterplot of participant satisfaction versus team orientation
Figure 4 Scatterplot of participant satisfaction versus client orientation
Figure 5 Scatterplot of participant satisfaction versus project orientation
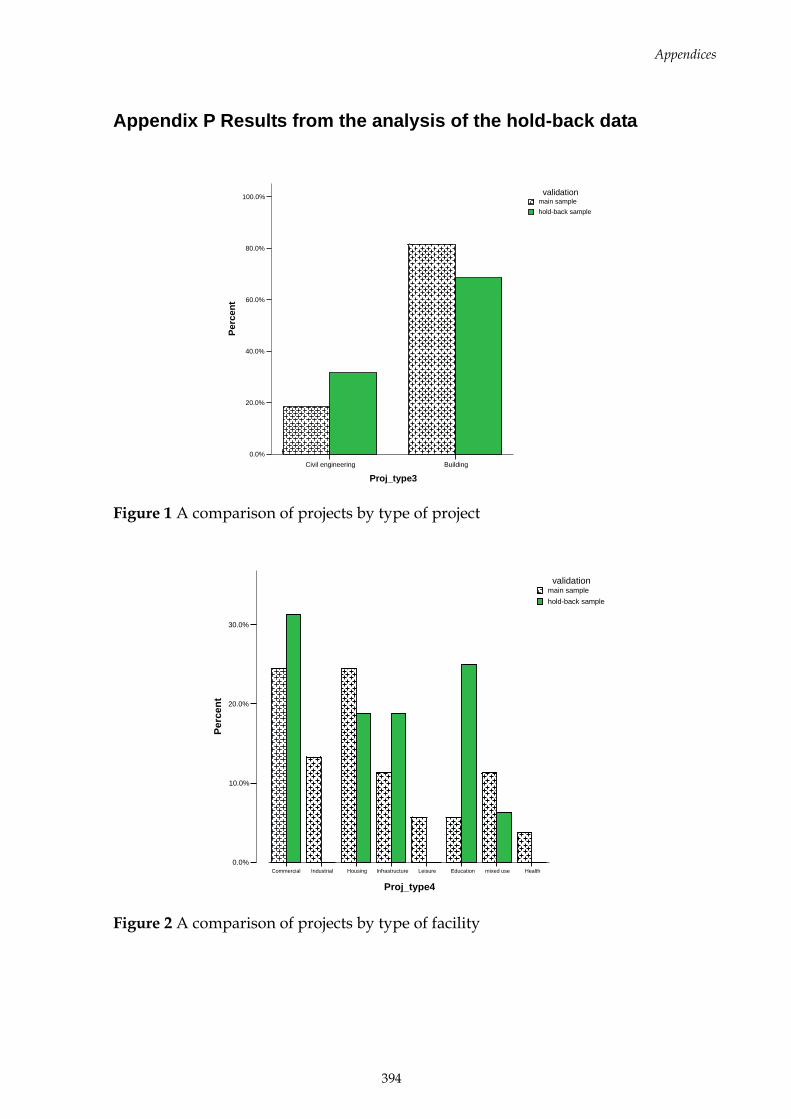
Appendices
394
Appendix P Results from the analysis of the hold-back data
BuildingCivil engineering
Proj_type3
100.0%
80.0%
60.0%
40.0%
20.0%
0.0%
Perc
ent
hold-back samplemain samplevalidation
Figure 1 A comparison of projects by type of project
Healthmixed useEducationLeisureInfrastructureHousingIndustrialCommercial
Proj_type4
30.0%
20.0%
10.0%
0.0%
Perc
ent
hold-back samplemain samplevalidation
Figure 2 A comparison of projects by type of facility
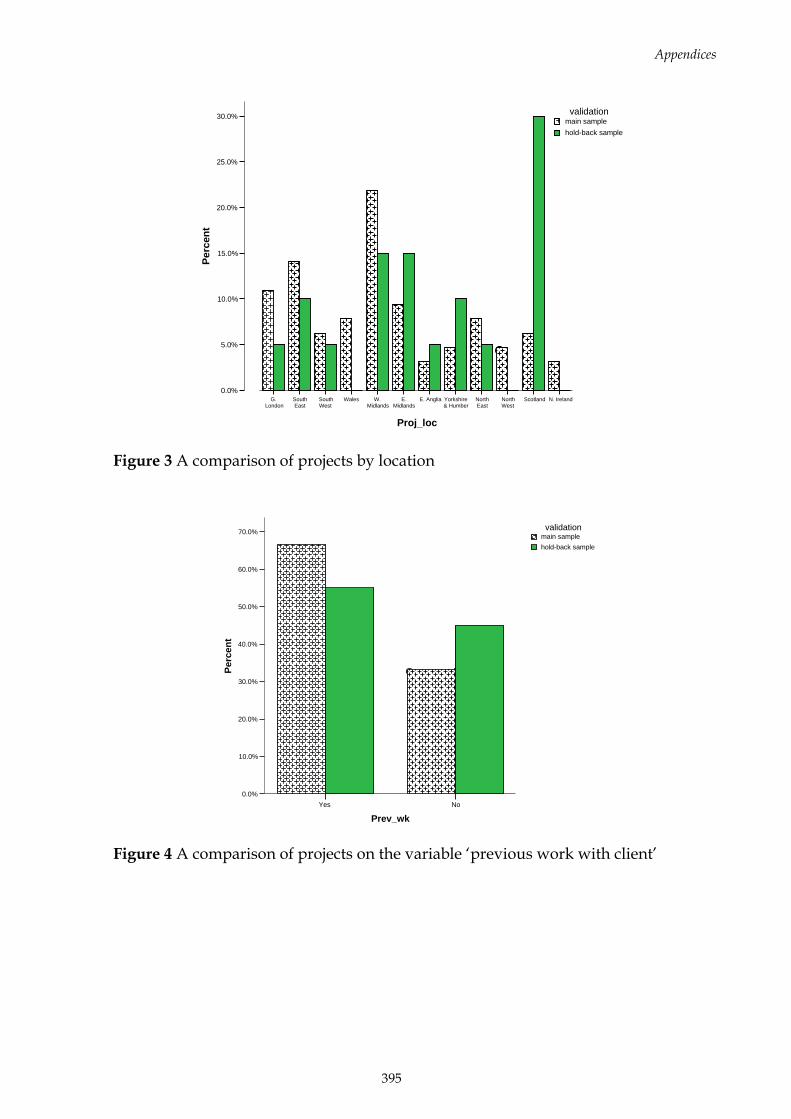
Appendices
395
N. IrelandScotlandNorthWest
NorthEast
Yorkshire& Humber
E. AngliaE.Midlands
W.Midlands
WalesSouthWest
SouthEast
G.London
Proj_loc
30.0%
25.0%
20.0%
15.0%
10.0%
5.0%
0.0%
Perc
ent
hold-back samplemain samplevalidation
Figure 3 A comparison of projects by location
NoYes
Prev_wk
70.0%
60.0%
50.0%
40.0%
30.0%
20.0%
10.0%
0.0%
Perc
ent
hold-back samplemain samplevalidation
Figure 4 A comparison of projects on the variable ‘previous work with client’
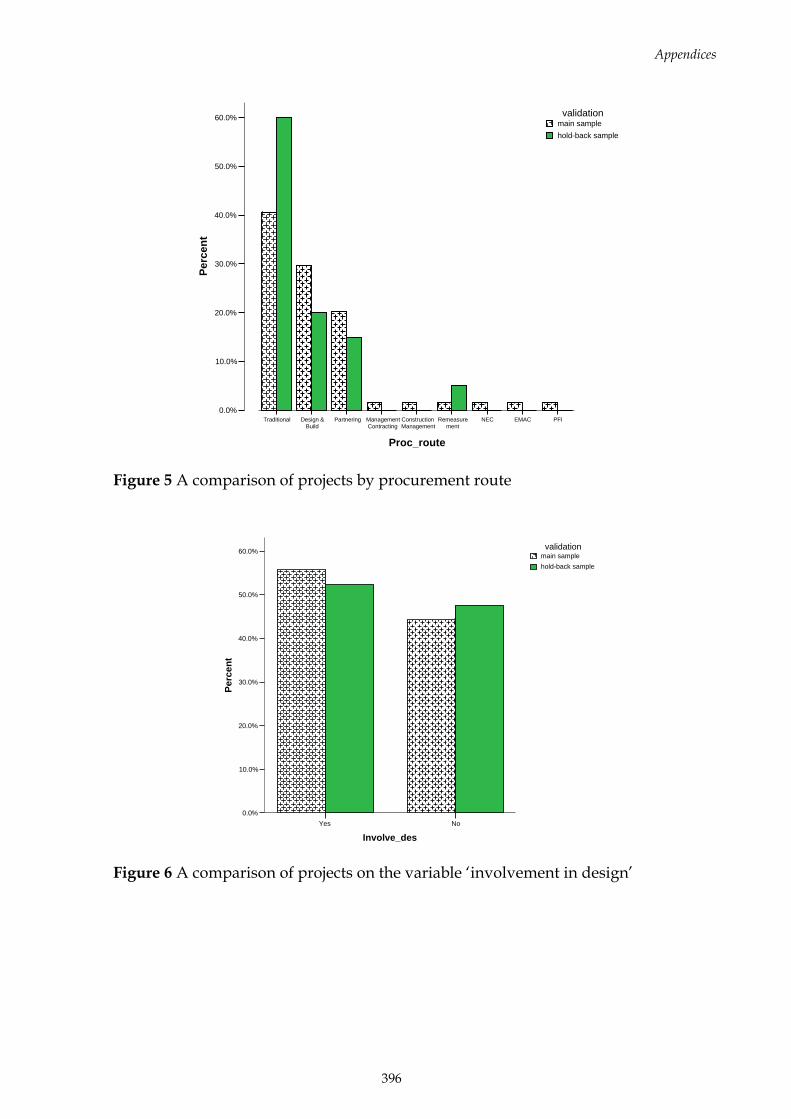
Appendices
396
PFIEMACNECRemeasurement
ConstructionManagement
ManagementContracting
PartneringDesign &Build
Traditional
Proc_route
60.0%
50.0%
40.0%
30.0%
20.0%
10.0%
0.0%
Perc
ent
hold-back samplemain samplevalidation
Figure 5 A comparison of projects by procurement route
NoYes
Involve_des
60.0%
50.0%
40.0%
30.0%
20.0%
10.0%
0.0%
Perc
ent
hold-back samplemain samplevalidation
Figure 6 A comparison of projects on the variable ‘involvement in design’
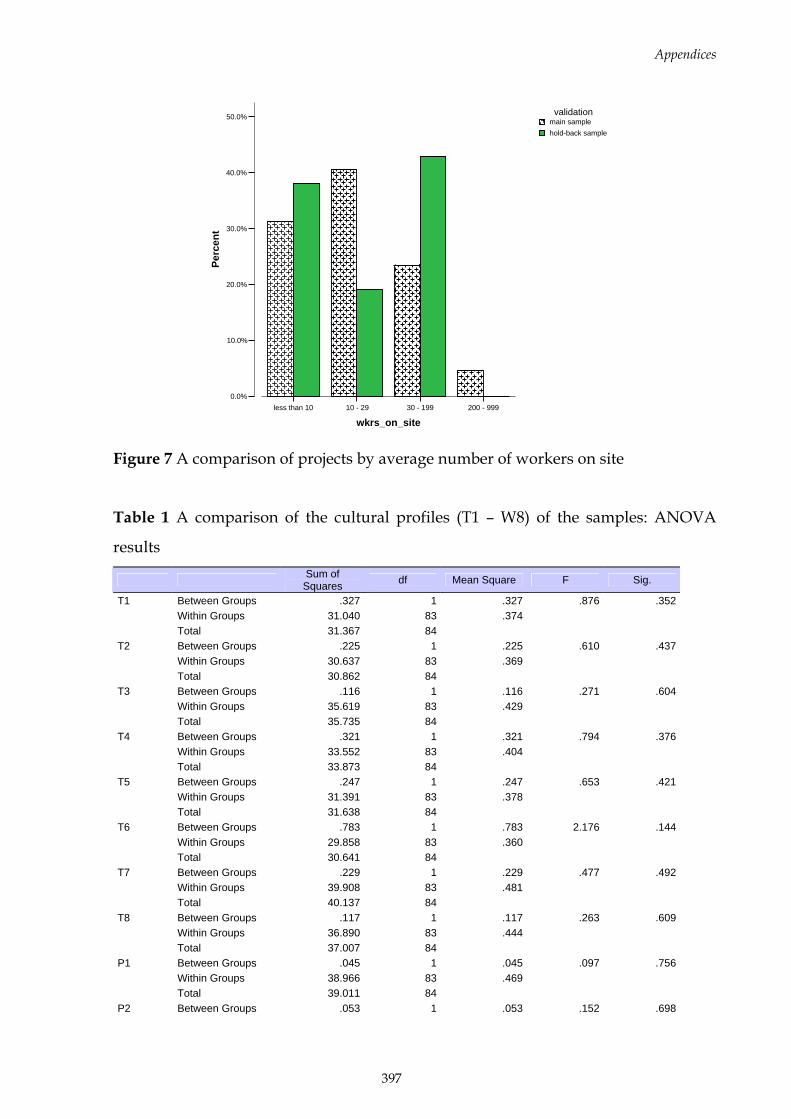
Appendices
397
200 - 99930 - 19910 - 29less than 10
wkrs_on_site
50.0%
40.0%
30.0%
20.0%
10.0%
0.0%
Perc
ent
hold-back samplemain samplevalidation
Figure 7 A comparison of projects by average number of workers on site
Table 1 A comparison of the cultural profiles (T1 – W8) of the samples: ANOVA
results
Sum of Squares df Mean Square F Sig.
T1 Between Groups .327 1 .327 .876 .352 Within Groups 31.040 83 .374 Total 31.367 84 T2 Between Groups .225 1 .225 .610 .437 Within Groups 30.637 83 .369 Total 30.862 84 T3 Between Groups .116 1 .116 .271 .604 Within Groups 35.619 83 .429 Total 35.735 84 T4 Between Groups .321 1 .321 .794 .376 Within Groups 33.552 83 .404 Total 33.873 84 T5 Between Groups .247 1 .247 .653 .421 Within Groups 31.391 83 .378 Total 31.638 84 T6 Between Groups .783 1 .783 2.176 .144 Within Groups 29.858 83 .360 Total 30.641 84 T7 Between Groups .229 1 .229 .477 .492 Within Groups 39.908 83 .481 Total 40.137 84 T8 Between Groups .117 1 .117 .263 .609 Within Groups 36.890 83 .444 Total 37.007 84 P1 Between Groups .045 1 .045 .097 .756 Within Groups 38.966 83 .469 Total 39.011 84 P2 Between Groups .053 1 .053 .152 .698

Appendices
398
Sum of Squares df Mean Square F Sig.
Within Groups 29.047 83 .350 Total 29.100 84 P3 Between Groups .089 1 .089 .229 .633 Within Groups 32.341 83 .390 Total 32.430 84 P4 Between Groups .084 1 .084 .193 .662 Within Groups 36.315 83 .438 Total 36.399 84 P5 Between Groups .345 1 .345 .900 .346 Within Groups 31.781 83 .383 Total 32.125 84 P6 Between Groups .027 1 .027 .074 .787 Within Groups 30.183 83 .364 Total 30.210 84 P7 Between Groups .649 1 .649 1.863 .176 Within Groups 28.916 83 .348 Total 29.565 84 P8 Between Groups 1.078 1 1.078 2.837 .096 Within Groups 31.521 83 .380 Total 32.599 84 P9 Between Groups .006 1 .006 .013 .909 Within Groups 36.198 83 .436 Total 36.204 84 W1 Between Groups 3.430 1 3.430 2.767 .100 Within Groups 102.906 83 1.240 Total 106.337 84 W2 Between Groups .849 1 .849 2.288 .134 Within Groups 30.781 83 .371 Total 31.629 84 W3 Between Groups .167 1 .167 .371 .544 Within Groups 37.396 83 .451 Total 37.563 84 W4 Between Groups .158 1 .158 .452 .503 Within Groups 28.969 83 .349 Total 29.127 84 W5 Between Groups 1.186 1 1.186 1.900 .172 Within Groups 51.797 83 .624 Total 52.983 84 W6 Between Groups .064 1 .064 .144 .705 Within Groups 36.806 83 .443 Total 36.869 84 W7 Between Groups .004 1 .004 .009 .925 Within Groups 40.050 83 .483 Total 40.055 84 W8 Between Groups .045 1 .045 .078 .780 Within Groups 47.925 83 .577 Total 47.970 84
Appendices
399
Appendix Q Summary report sent to survey respondents
A REPORT ON AN INVESTIGATION INTO THE IMPACT OF CULTURE ON
CONSTRUCTION PROJECT PERFORMANCE
Nii A. Ankrah
School of Engineering and the Built Environment University of Wolverhampton
Wulfruna Street
Wolverhampton
WV1 1SB
Phone: 01902 323581
Mobile: 079 57494817
Fax: 01902 322743
E-mail: [email protected]
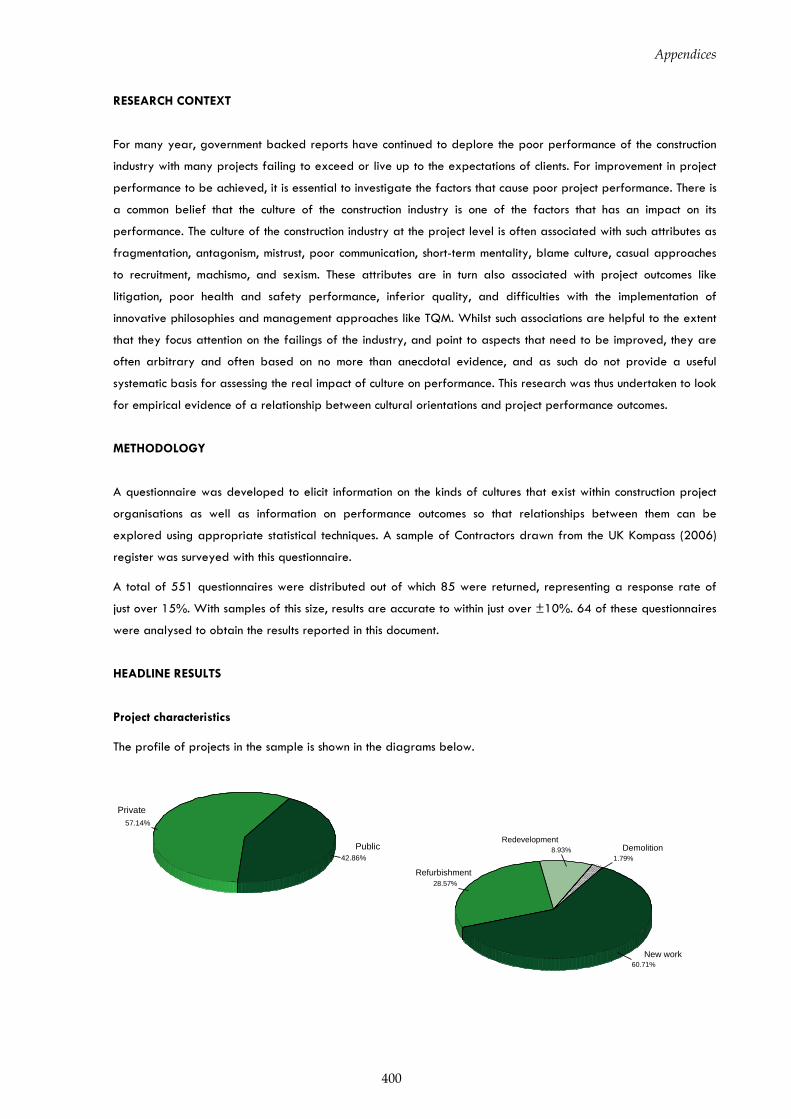
Appendices
400
RESEARCH CONTEXT
For many year, government backed reports have continued to deplore the poor performance of the construction
industry with many projects failing to exceed or live up to the expectations of clients. For improvement in project
performance to be achieved, it is essential to investigate the factors that cause poor project performance. There is
a common belief that the culture of the construction industry is one of the factors that has an impact on its
performance. The culture of the construction industry at the project level is often associated with such attributes as
fragmentation, antagonism, mistrust, poor communication, short-term mentality, blame culture, casual approaches
to recruitment, machismo, and sexism. These attributes are in turn also associated with project outcomes like
litigation, poor health and safety performance, inferior quality, and difficulties with the implementation of
innovative philosophies and management approaches like TQM. Whilst such associations are helpful to the extent
that they focus attention on the failings of the industry, and point to aspects that need to be improved, they are
often arbitrary and often based on no more than anecdotal evidence, and as such do not provide a useful
systematic basis for assessing the real impact of culture on performance. This research was thus undertaken to look
for empirical evidence of a relationship between cultural orientations and project performance outcomes.
METHODOLOGY
A questionnaire was developed to elicit information on the kinds of cultures that exist within construction project
organisations as well as information on performance outcomes so that relationships between them can be
explored using appropriate statistical techniques. A sample of Contractors drawn from the UK Kompass (2006)
register was surveyed with this questionnaire.
A total of 551 questionnaires were distributed out of which 85 were returned, representing a response rate of
just over 15%. With samples of this size, results are accurate to within just over ±10%. 64 of these questionnaires
were analysed to obtain the results reported in this document.
HEADLINE RESULTS
Project characteristics
The profile of projects in the sample is shown in the diagrams below.
57.14%
42.86%Public
Private
1.79%8.93%
28.57%
60.71%
DemolitionRedevelopment
Refurbishment
New work
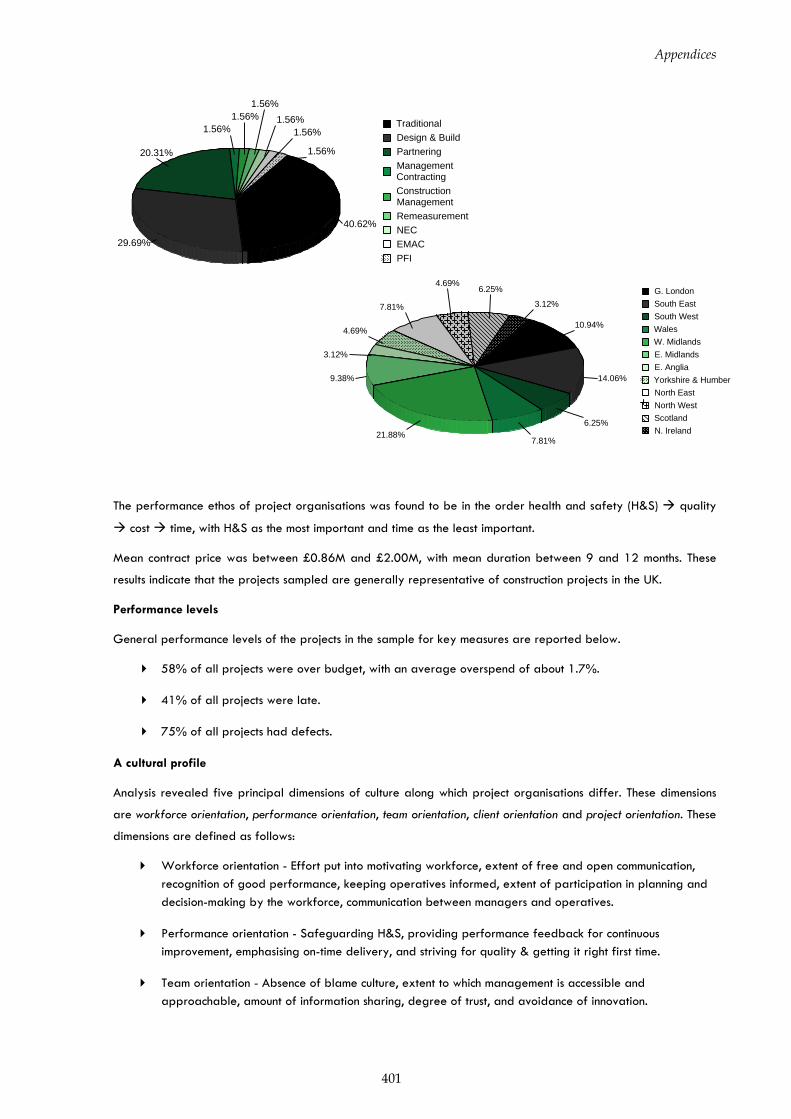
Appendices
401
The performance ethos of project organisations was found to be in the order health and safety (H&S) quality
cost time, with H&S as the most important and time as the least important.
Mean contract price was between £0.86M and £2.00M, with mean duration between 9 and 12 months. These
results indicate that the projects sampled are generally representative of construction projects in the UK.
Performance levels
General performance levels of the projects in the sample for key measures are reported below.
58% of all projects were over budget, with an average overspend of about 1.7%.
41% of all projects were late.
75% of all projects had defects.
A cultural profile
Analysis revealed five principal dimensions of culture along which project organisations differ. These dimensions
are workforce orientation, performance orientation, team orientation, client orientation and project orientation. These
dimensions are defined as follows:
Workforce orientation - Effort put into motivating workforce, extent of free and open communication, recognition of good performance, keeping operatives informed, extent of participation in planning and decision-making by the workforce, communication between managers and operatives.
Performance orientation - Safeguarding H&S, providing performance feedback for continuous improvement, emphasising on-time delivery, and striving for quality & getting it right first time.
Team orientation - Absence of blame culture, extent to which management is accessible and approachable, amount of information sharing, degree of trust, and avoidance of innovation.
1.56%
1.56%1.56%
1.56%1.56%
1.56%
20.31%
29.69%
40.62%
PFIEMACNECRemeasurement
ConstructionManagement
ManagementContracting
PartneringDesign & BuildTraditional
3.12%
6.25%4.69%
7.81%
4.69%
3.12%
9.38%
21.88%7.81%
6.25%
14.06%
10.94%
N. IrelandScotlandNorth WestNorth EastYorkshire & HumberE. AngliaE. MidlandsW. MidlandsWalesSouth WestSouth EastG. London
Appendices
402
Client orientation - Effort put into educating client, extent to which client satisfaction is monitored, precedence of client’s needs, and amount of contact & communication with the client.
Project orientation - Extent to which participants identify with the project, the extent to which direct labour is used (as opposed to subcontracting), and effort put into waste elimination.
A performance profile
Analysis of performance measures revealed four principal performance measures of participant satisfaction, H&S
and quality outcomes, innovation and learning, and time and cost outcomes. These performance measures are
defined as follows:
Participant satisfaction - This encompasses client satisfaction with service, quality, cost and time, management satisfaction with project harmony and profitability, and operative satisfaction with conditions and wages, as well as the absence of claims.
H&S and quality outcomes - This relates to accidents reported, injuries occuring, near misses reported, extent of defects, and the level of absenteeism on the project.
Innovation and learning - This encompasses the measures of innovation, learning, and productivity.
Time and cost outcomes - This encompasses the measures of time performance, claims, and cost performance.
Relationship between culture and performance
Analysis of the data revealed a number of relationships between these cultural orientations and performance
outcomes. The main findings are summarised below:
Projects with higher participant satisfaction were those with higher team and workforce orientations;
Projects with better H&S and quality outcomes were those with higher project and team orientations;
Projects with higher levels of innovation and learning were those with higher workforce orientation but lower team orientation;
None of the dimensions were associated with time and cost outcomes implying that factors other than the cultural dimensions influence performance;
Projects with higher overall performance were those with higher project and workforce orientations; and lastly
There is no evidence that the client or performance orientations influence performance outcomes.
CONCLUSION
These findings which are based on empirical evidence support the thesis that culture does matter in the quest for
performance improvement. It is therefore recommended that project participants, and in particular Main
Contractors, devote more effort and resources towards improving the orientations of their construction project
organisations in respect of the dimensions of culture identified as having significant impacts on project
performance outcomes, particularly workforce orientation, team orientation and project orientation.

Appendices
403
PLEASE PROVIDE SOME COMMENTS ON THE VALIDITY OF THE RESEARCH FINDINGS
1. The research found that the projects with higher participant satisfaction were those with higher team and workforce orientations. From your experience, how valid is this finding? ………………………………………………………………………………………………………………………….……………………………………………………………………………………………………
2. The research found that the projects with better H&S and quality outcomes were those with higher project and team orientations. From your experience, how valid is this finding? ………………………………………………………………………………………………………………………….……………………………………………………………………………………………………
3. The research found that the projects with higher innovation and learning were those with higher workforce orientations. From your experience, how valid is this finding? ………………………………………………………………………………………………………………………….……………………………………………………………………………………………………
4. The research also found that the projects with higher innovation and learning were those with lower team orientations. From your experience, is this finding a valid reflection of what happens on construction projects? ………………………………………………………………………………………………………………………….……………………………………………………………………………………………………
5. The research found that none of the dimensions of culture were associated with time and cost outcomes. From your experience, is this finding a valid reflection of what happens on construction projects? ……………………………………………………………………………………………………………… ………………………………………………………………………………………………………………
6. The research also found no evidence to link client and performance orientations with any of the performance outcomes. From your experience, how valid is this finding? ………………………………………………………………………………………………………………………….……………………………………………………………………………………………………
You are welcome to add any further thoughts you have on the validity and relevance of any of these findings
.………………………………………………………………………………………………………………………
…………….…………………………………………………………………………………………………………
………………………….……………………………………………………………………………………………
……………………………………….………………………………………………………………………………
……………………………………………………………………………………………………………………….
General information
Please indicate your Name …………………………………………………………………………………………
Please indicate your Position (Optional) ……………………………………………………………………………
How many years of experience do you have in construction? ………………………………………………………
Please return this form by fax, email or by post. Contact details are provided on the cover page. To discuss the findings reported, you may call 07957494817 or 01902323581.
Thank you for taking part in this research. If you wish to make any further contribution or would like to receive further information about the research, please feel free to contact the researcher.
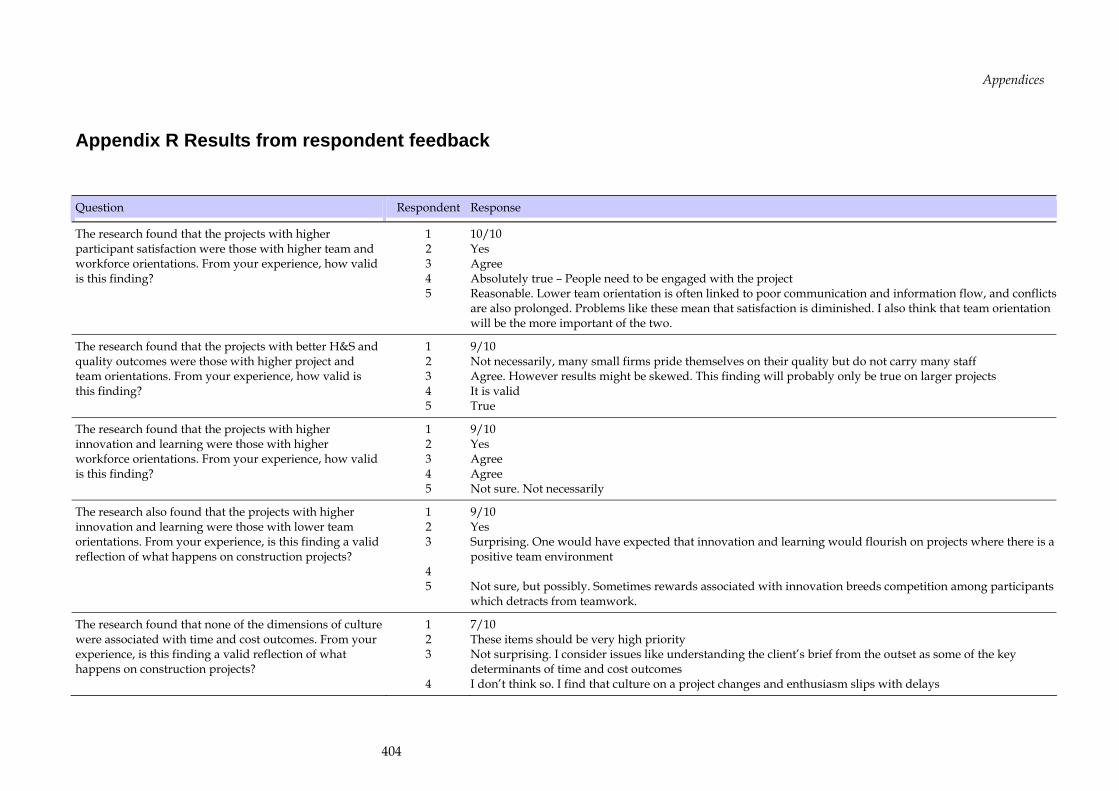
Appendices
404
Appendix R Results from respondent feedback
Question Respondent Response
The research found that the projects with higher participant satisfaction were those with higher team and workforce orientations. From your experience, how valid is this finding?
1 2 3 4 5
10/10 Yes Agree Absolutely true – People need to be engaged with the project Reasonable. Lower team orientation is often linked to poor communication and information flow, and conflictsare also prolonged. Problems like these mean that satisfaction is diminished. I also think that team orientation will be the more important of the two.
The research found that the projects with better H&S and quality outcomes were those with higher project and team orientations. From your experience, how valid is this finding?
1 2 3 4 5
9/10 Not necessarily, many small firms pride themselves on their quality but do not carry many staff Agree. However results might be skewed. This finding will probably only be true on larger projects It is valid True
The research found that the projects with higher innovation and learning were those with higher workforce orientations. From your experience, how valid is this finding?
1 2 3 4 5
9/10 Yes Agree Agree Not sure. Not necessarily
The research also found that the projects with higher innovation and learning were those with lower team orientations. From your experience, is this finding a valid reflection of what happens on construction projects?
1 2 3
4 5
9/10 Yes Surprising. One would have expected that innovation and learning would flourish on projects where there is a positive team environment Not sure, but possibly. Sometimes rewards associated with innovation breeds competition among participants which detracts from teamwork.
The research found that none of the dimensions of culture were associated with time and cost outcomes. From your experience, is this finding a valid reflection of what happens on construction projects?
1 2 3
4
7/10 These items should be very high priority Not surprising. I consider issues like understanding the client’s brief from the outset as some of the key determinants of time and cost outcomes I don’t think so. I find that culture on a project changes and enthusiasm slips with delays
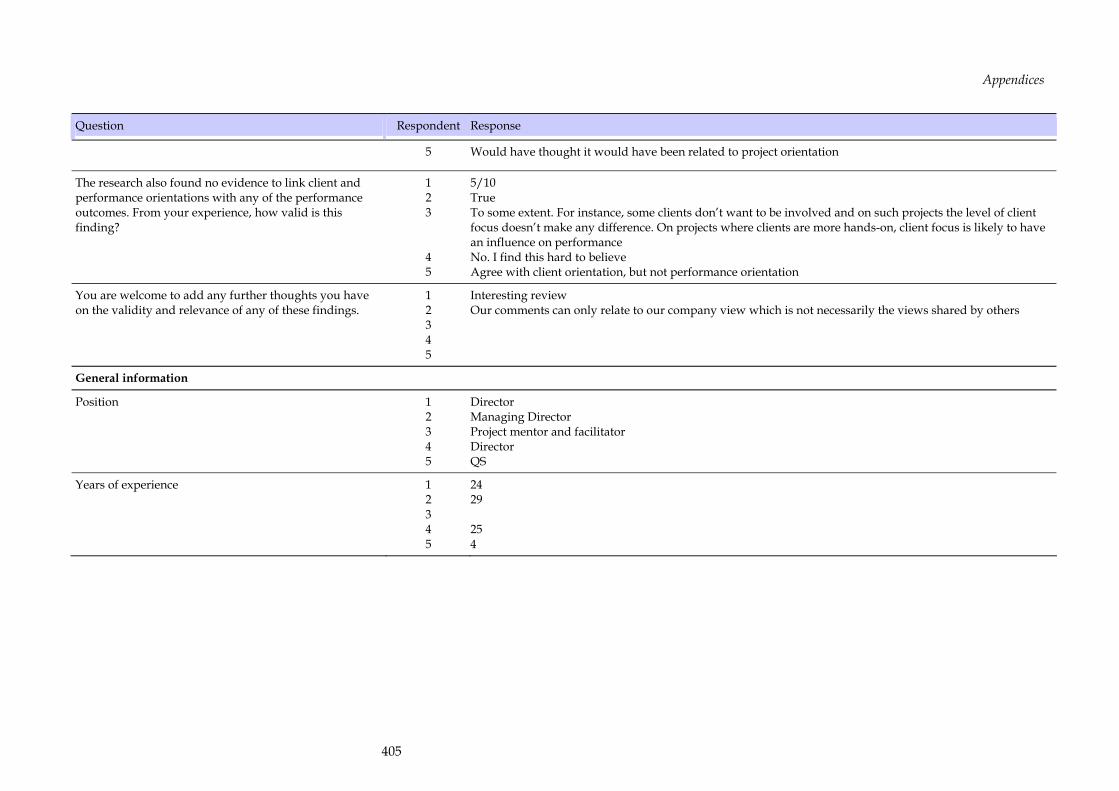
Appendices
405
Question Respondent Response
5 Would have thought it would have been related to project orientation
The research also found no evidence to link client and performance orientations with any of the performance outcomes. From your experience, how valid is this finding?
1 2 3
4 5
5/10 True To some extent. For instance, some clients don’t want to be involved and on such projects the level of client focus doesn’t make any difference. On projects where clients are more hands-on, client focus is likely to have an influence on performance No. I find this hard to believe Agree with client orientation, but not performance orientation
You are welcome to add any further thoughts you have on the validity and relevance of any of these findings.
1 2 3 4 5
Interesting review Our comments can only relate to our company view which is not necessarily the views shared by others
General information
Position 1 2 3 4 5
Director Managing Director Project mentor and facilitator Director QS
Years of experience 1 2 3 4 5
24 29 25 4