Embed Size (px)
Citation preview
An investigation into the effects of nano copper oxide to
the soil invertebrates Eisenia andrei and Folsomia
canadida
by
Jessica Velicogna
A thesis submitted to the Faculty of Graduate and Postdoctoral
Affairs in partial fulfillment of the requirements for the degree of
Master of Science
in
Chemical and Environmental Toxicology
Carleton University
Ottawa, Ontario
© 2019, Jessica Velicogna
ii
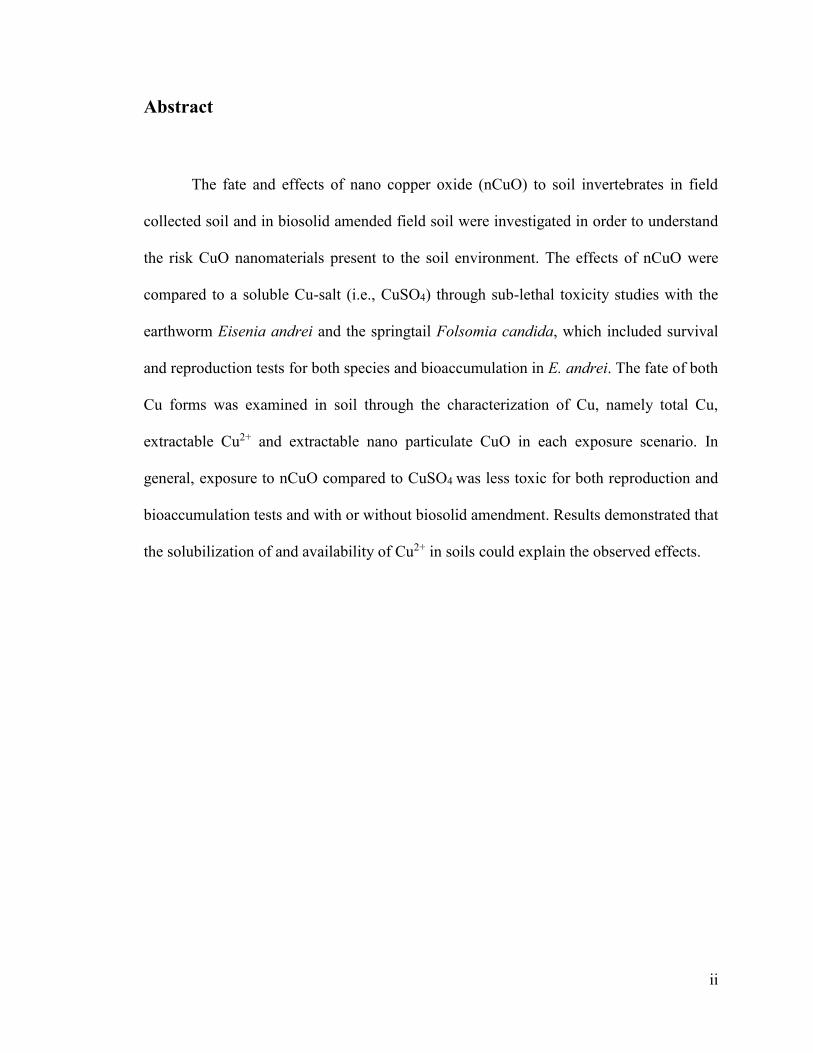
Abstract
The fate and effects of nano copper oxide (nCuO) to soil invertebrates in field
collected soil and in biosolid amended field soil were investigated in order to understand
the risk CuO nanomaterials present to the soil environment. The effects of nCuO were
compared to a soluble Cu-salt (i.e., CuSO4) through sub-lethal toxicity studies with the
earthworm Eisenia andrei and the springtail Folsomia candida, which included survival
and reproduction tests for both species and bioaccumulation in E. andrei. The fate of both
Cu forms was examined in soil through the characterization of Cu, namely total Cu,
extractable Cu2+ and extractable nano particulate CuO in each exposure scenario. In
general, exposure to nCuO compared to CuSO4 was less toxic for both reproduction and
bioaccumulation tests and with or without biosolid amendment. Results demonstrated that
the solubilization of and availability of Cu2+ in soils could explain the observed effects.
iii
Acknowledgements
I would like to acknowledge and thank Dr. Dina Schwertfeger for sharing her expertise in
soil chemistry and for teaching and guiding me in learning analytical techniques including
Cu ISE and single particle ICP-MS. I wish to thank Heather McShane for her assistance in
coordinating and collection of biosolids, Jianjun Wang at the Carleton University Nano
Imaging facility for his contribution to the TEM-EDS imaging analysis, Equilibrium
Environmental for soil collection, and Dr. Sabina Halappanavar and Dongmei Wu of
Health Canada for providing access and assistance on the Cytoviva enhanced dark-field
spectrometer. I would like to thank the following students for their hard-work in preparing
samples, conducting Cu ISE, pH and moisture content measurements and assisting with
test maintenance: Alexander Jesmer, Claudia Beer and, Joner Kuo. I would also like to
thank my colleagues in the soil toxicology laboratory at Environment and Climate Change
Canada for their assistance with test takedowns and the overall support of the Biological
Assessment and Standardization Section: Heather Lemieux, Patrick Boyd, Ellyn Ritchie,
Chris Fraser and Rick Scroggins. I wish to thank Dr. Myron Smith and Dr. Maria deRosa,
Dr. Bill Willmore of Carleton University, Dr. Jules Blais of University of Ottawa and, Dr.
Stacey Robinson of Environment Canada for their time and scientific insight. Finally, I
would like to thank Dr. Juliska Princz for her constructive review of test plans, results and
reports, scientific insight, and ongoing support in general without which this work would
not be possible.
iv
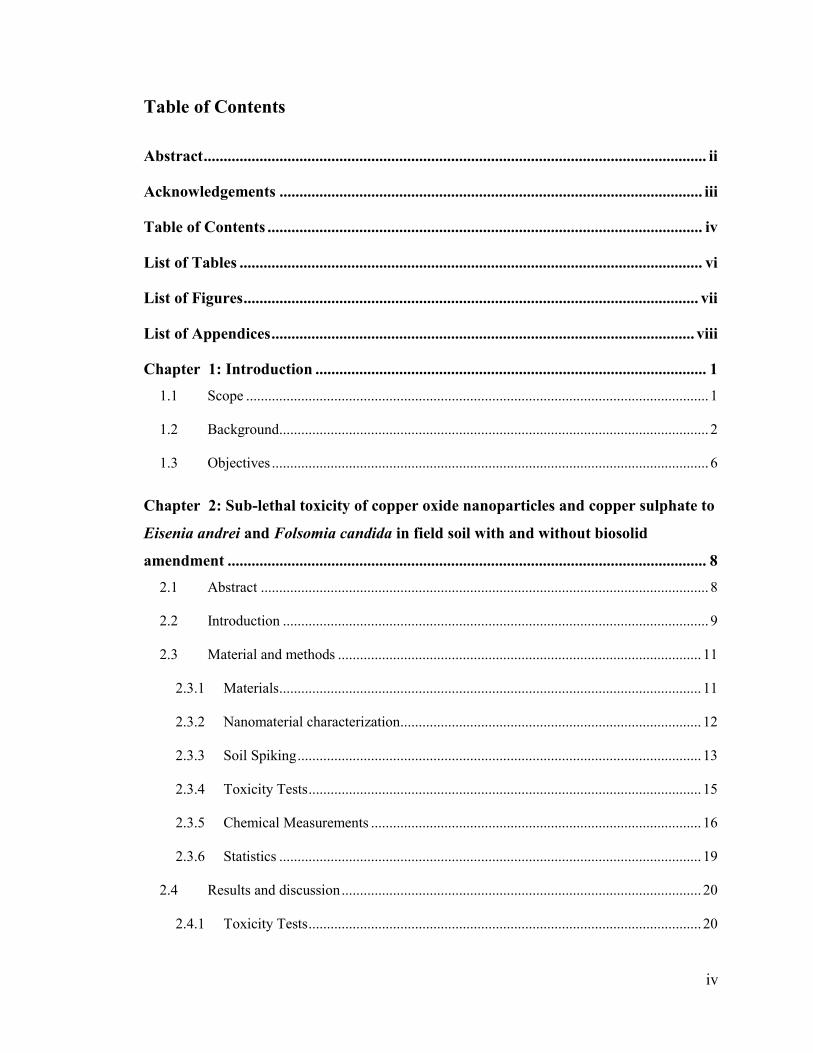
Table of Contents
Abstract .............................................................................................................................. ii
Acknowledgements .......................................................................................................... iii
Table of Contents ............................................................................................................. iv
List of Tables .................................................................................................................... vi
List of Figures .................................................................................................................. vii
List of Appendices .......................................................................................................... viii
Chapter 1: Introduction .................................................................................................. 1
1.1 Scope .............................................................................................................................. 1
1.2 Background..................................................................................................................... 2
1.3 Objectives ....................................................................................................................... 6
Chapter 2: Sub-lethal toxicity of copper oxide nanoparticles and copper sulphate to
Eisenia andrei and Folsomia candida in field soil with and without biosolid
amendment ........................................................................................................................ 8
2.1 Abstract .......................................................................................................................... 8
2.2 Introduction .................................................................................................................... 9
2.3 Material and methods ................................................................................................... 11
2.3.1 Materials ................................................................................................................... 11
2.3.2 Nanomaterial characterization.................................................................................. 12
2.3.3 Soil Spiking .............................................................................................................. 13
2.3.4 Toxicity Tests ........................................................................................................... 15
2.3.5 Chemical Measurements .......................................................................................... 16
2.3.6 Statistics ................................................................................................................... 19
2.4 Results and discussion .................................................................................................. 20
2.4.1 Toxicity Tests ........................................................................................................... 20
v
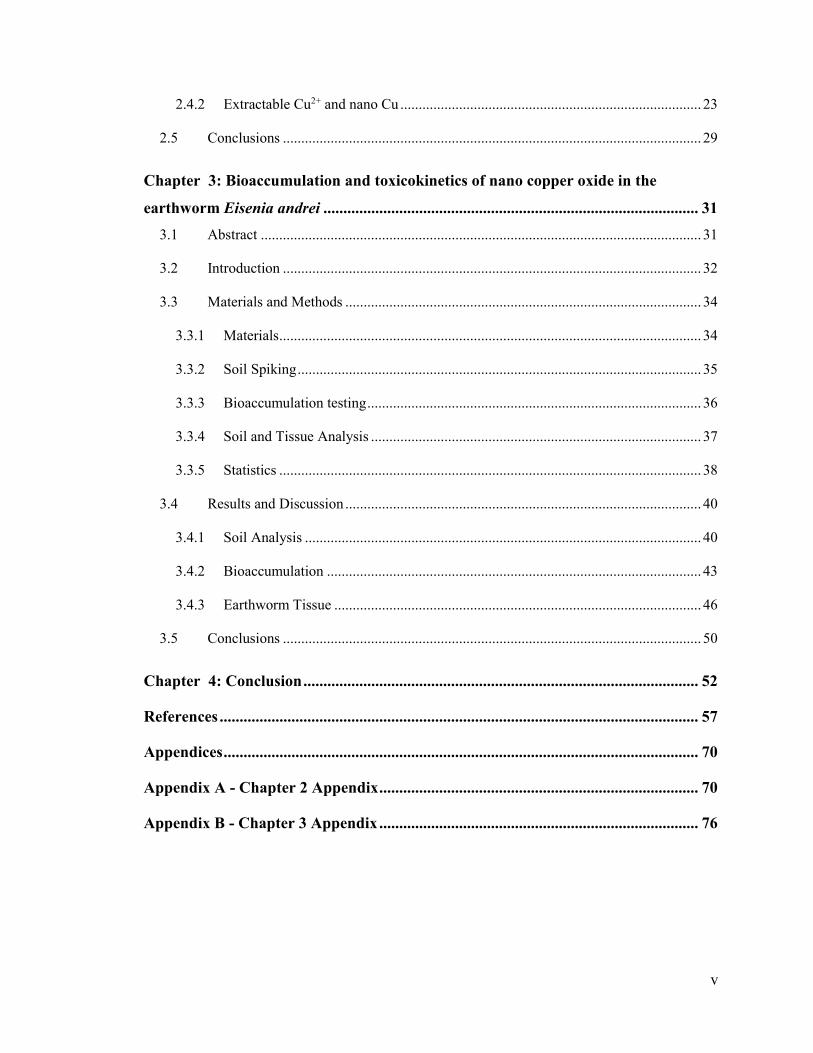
2.4.2 Extractable Cu2+ and nano Cu .................................................................................. 23
2.5 Conclusions .................................................................................................................. 29
Chapter 3: Bioaccumulation and toxicokinetics of nano copper oxide in the
earthworm Eisenia andrei .............................................................................................. 31
3.1 Abstract ........................................................................................................................ 31
3.2 Introduction .................................................................................................................. 32
3.3 Materials and Methods ................................................................................................. 34
3.3.1 Materials ................................................................................................................... 34
3.3.2 Soil Spiking .............................................................................................................. 35
3.3.3 Bioaccumulation testing ........................................................................................... 36
3.3.4 Soil and Tissue Analysis .......................................................................................... 37
3.3.5 Statistics ................................................................................................................... 38
3.4 Results and Discussion ................................................................................................. 40
3.4.1 Soil Analysis ............................................................................................................ 40
3.4.2 Bioaccumulation ...................................................................................................... 43
3.4.3 Earthworm Tissue .................................................................................................... 46
3.5 Conclusions .................................................................................................................. 50
Chapter 4: Conclusion ................................................................................................... 52
References ........................................................................................................................ 57
Appendices ....................................................................................................................... 70
Appendix A - Chapter 2 Appendix ................................................................................ 70
Appendix B - Chapter 3 Appendix ................................................................................ 76
vi
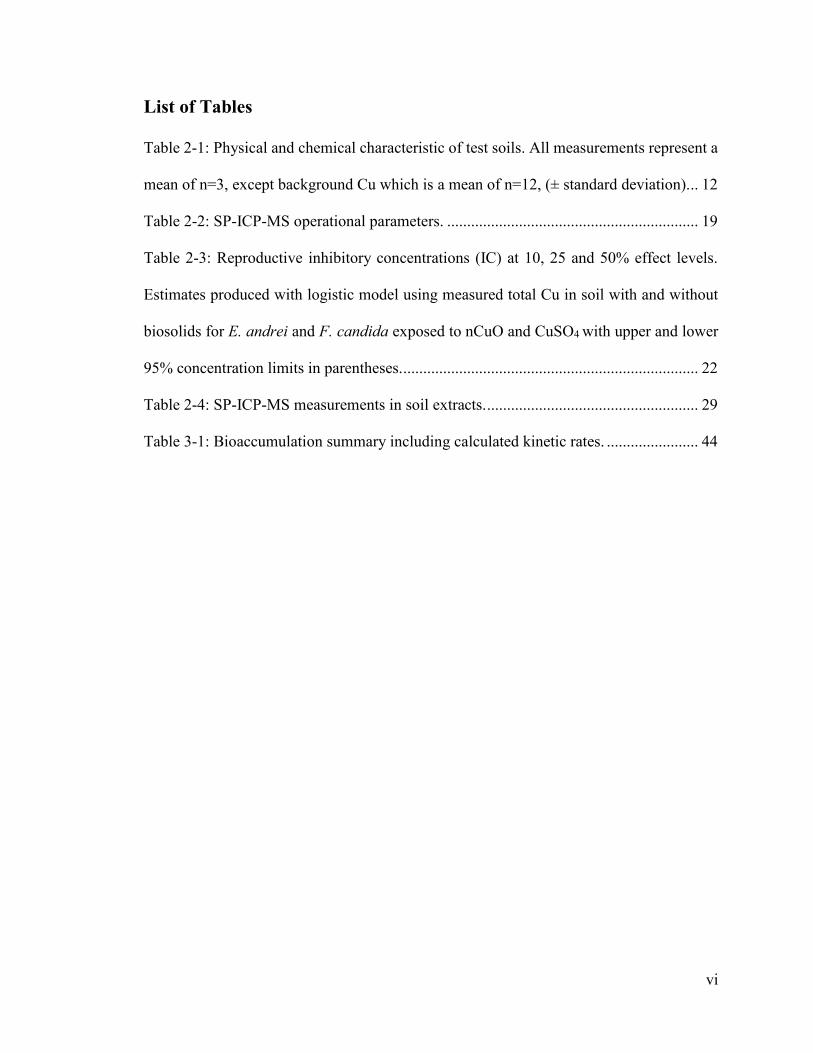
List of Tables
Table 2-1: Physical and chemical characteristic of test soils. All measurements represent a
mean of n=3, except background Cu which is a mean of n=12, (± standard deviation). .. 12
Table 2-2: SP-ICP-MS operational parameters. ............................................................... 19
Table 2-3: Reproductive inhibitory concentrations (IC) at 10, 25 and 50% effect levels.
Estimates produced with logistic model using measured total Cu in soil with and without
biosolids for E. andrei and F. candida exposed to nCuO and CuSO4 with upper and lower
95% concentration limits in parentheses. .......................................................................... 22
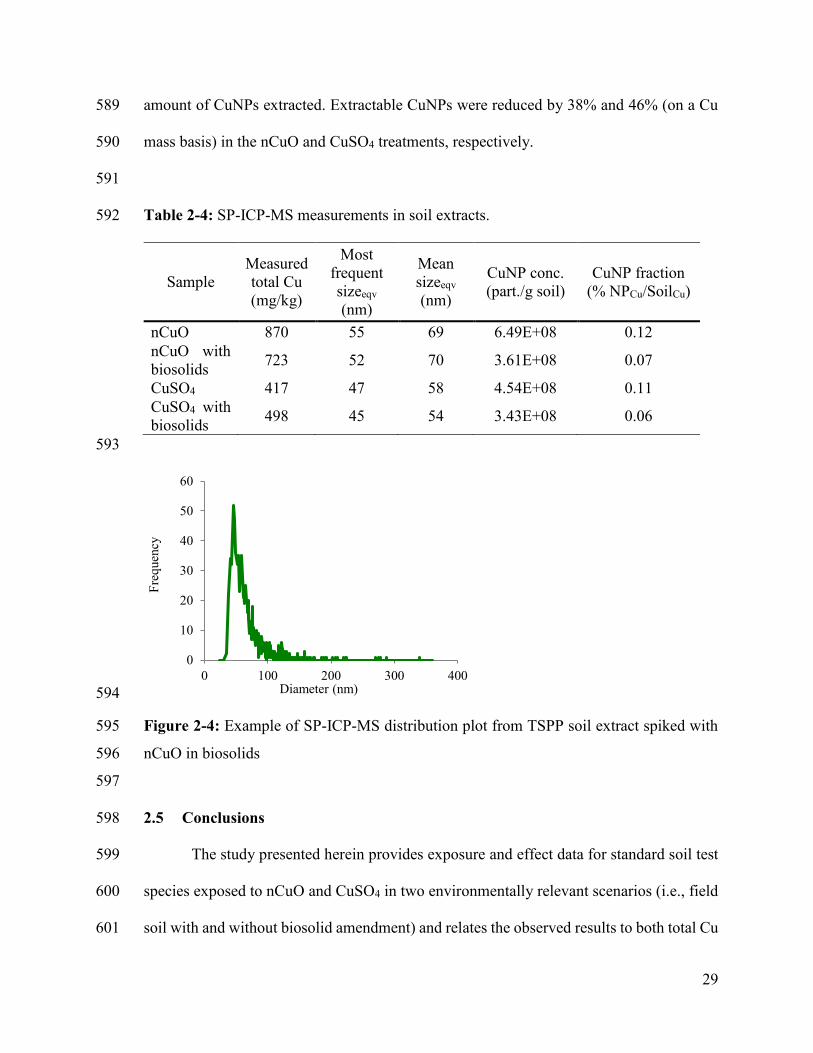
Table 2-4: SP-ICP-MS measurements in soil extracts. ..................................................... 29
Table 3-1: Bioaccumulation summary including calculated kinetic rates. ....................... 44
vii
List of Figures
Figure 2-1: TEM images of nCuO in methanol (A), nanopure water (B) and, soil pore-
water (C and D). ................................................................................................................ 13
Figure 2-2: Dose-response relationships of E. andrei reproductive inhibition based on total
measured soil Cu (left) and extractable Cu2+ (right). ...................................................... 23
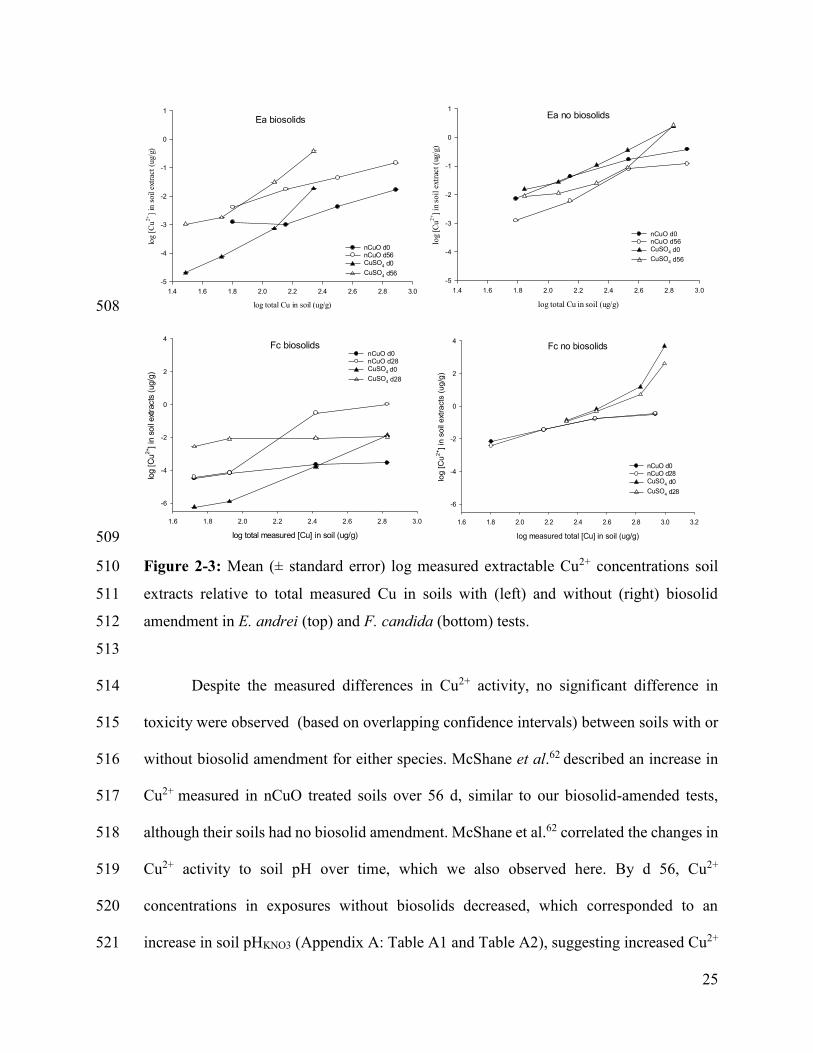
Figure 2-3: Mean (± standard error) log measured extractable Cu2+ concentrations soil
extracts relative to total measured Cu in soils with (left) and without (right) biosolid
amendment in E. andrei (top) and F. candida (bottom) tests. .......................................... 25
Figure 2-4: Example of SP-ICP-MS distribution plot from TSPP soil extract spiked with
nCuO in biosolids ............................................................................................................. 29
Figure 3-1: Mean (± SD) measured total Cu concentration (ug/g) soil (with and without
biosolid amendment). ........................................................................................................ 41
Figure 3-2: Mean (± SE) available Cu2+ measured KNO3 soil extracts throughout uptake
phase. ................................................................................................................................ 43
Figure 3-3: Modelled kinetic uptake and elimination curves based on total Cu (solid lines)
and extractable Cu2+ (dashed lines) in soil and, measured total Cu in tissues (♦). ........... 46
Figure 3-4: Hyperspectral images of d-21 earthworm tissues (nCuO no biosolid) with,
spectra matching nCuO highlighted in red. A – chloragogenous tissue; B – muscle tissue;
C – epidermis; D – gut. ..................................................................................................... 49
Figure 3-5: Example of E. andrei section used for enhanced dark-field hyperspectral
microscopy, with region of sections marked (A-D) corresponding to the images in Figure
3-4 (A – chloragogenous tissue; B – muscle tissue; C – epidermis; D – gut). ................. 50
viii
List of Appendices
Appendix A – Chapter 2 Appendix
Table A 1: Mean (± standard error (SE)) measured total Cu, Cu2+ activity, and the pH of
the KNO3 extracts for ISE measurements for the Eisenia andrei reproduction assays. NA
= not available 71
Table A 2: Mean (± standard error (SE)) measured total Cu, Cu2+ activity, and the pH of
the KNO3 extracts for ISE measurements for the Folsomia candida reproduction assays.
NA = not available 72
Table A 3: Toxicity endpoints based on measured extractable Cu2+ for E. andrei and F.
candida exposed to nCuO and CuSO4 in soil with and without biosolid amendment.
Reproduction inhibitory concentrations (IC) are provided for 10, 25 and 50% effect levels
with upper and lower 95% confidence limits in parentheses 73
Table A 4: Mean (± standard error (SE)) adult survival, juvenile production, soil pHCaCl2
and moisture content for the Eisenia andrei reproduction assays. 74
Table A 5: Mean (± standard error (SE)) for adult survival, juvenile production, soil pHCaCl2
and moisture content for the Folsomia candida reproduction assays. 75
Appendix B - Chapter 3 Appendix
Table B 1: Mean measured Cu2+ in KNO3 soil extracts (log ug/g) and mean pH (SE =
standard error) 76
Table B 2: Mean corrected (for background) total Cu measured throughout
bioaccumulation tests in soil and tissues. (SE = standard error) 77
1
Chapter 1: Introduction 1
1.1 Scope 2
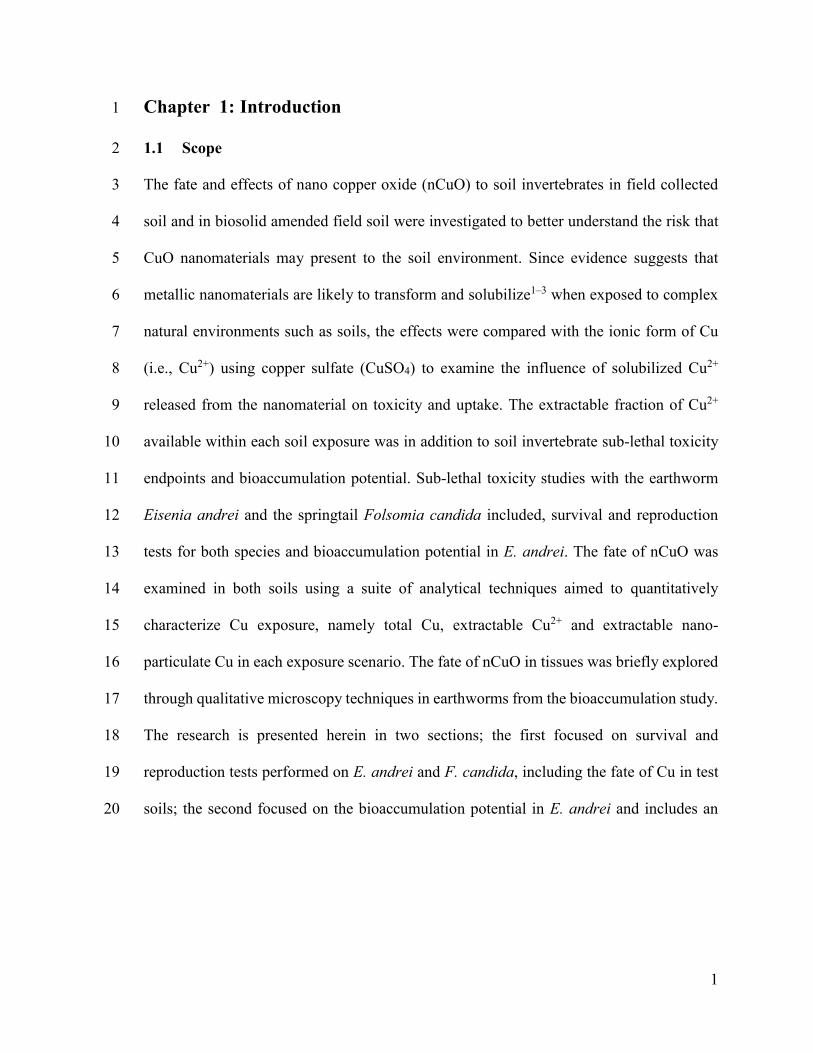
The fate and effects of nano copper oxide (nCuO) to soil invertebrates in field collected 3
soil and in biosolid amended field soil were investigated to better understand the risk that 4
CuO nanomaterials may present to the soil environment. Since evidence suggests that 5
metallic nanomaterials are likely to transform and solubilize1–3 when exposed to complex 6
natural environments such as soils, the effects were compared with the ionic form of Cu 7
(i.e., Cu2+) using copper sulfate (CuSO4) to examine the influence of solubilized Cu2+ 8
released from the nanomaterial on toxicity and uptake. The extractable fraction of Cu2+ 9
available within each soil exposure was in addition to soil invertebrate sub-lethal toxicity 10
endpoints and bioaccumulation potential. Sub-lethal toxicity studies with the earthworm 11
Eisenia andrei and the springtail Folsomia candida included, survival and reproduction 12
tests for both species and bioaccumulation potential in E. andrei. The fate of nCuO was 13
examined in both soils using a suite of analytical techniques aimed to quantitatively 14
characterize Cu exposure, namely total Cu, extractable Cu2+ and extractable nano-15
particulate Cu in each exposure scenario. The fate of nCuO in tissues was briefly explored 16
through qualitative microscopy techniques in earthworms from the bioaccumulation study. 17
The research is presented herein in two sections; the first focused on survival and 18
reproduction tests performed on E. andrei and F. candida, including the fate of Cu in test 19
soils; the second focused on the bioaccumulation potential in E. andrei and includes an 20
2
investigation of the fate of the nCuO in earthworm tissues. Together these two studies 21
represent the scope of the work completed. 22
23
1.2 Background 24
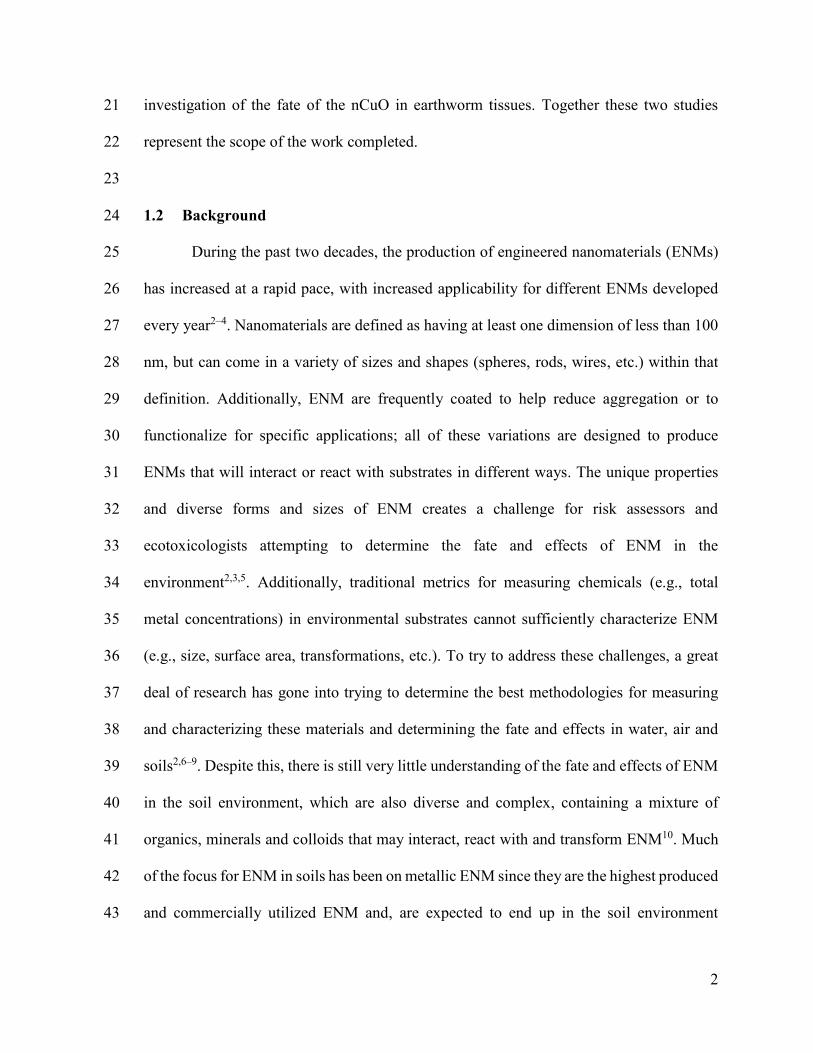
During the past two decades, the production of engineered nanomaterials (ENMs) 25
has increased at a rapid pace, with increased applicability for different ENMs developed 26
every year2–4. Nanomaterials are defined as having at least one dimension of less than 100 27
nm, but can come in a variety of sizes and shapes (spheres, rods, wires, etc.) within that 28
definition. Additionally, ENM are frequently coated to help reduce aggregation or to 29
functionalize for specific applications; all of these variations are designed to produce 30
ENMs that will interact or react with substrates in different ways. The unique properties 31
and diverse forms and sizes of ENM creates a challenge for risk assessors and 32
ecotoxicologists attempting to determine the fate and effects of ENM in the 33
environment2,3,5. Additionally, traditional metrics for measuring chemicals (e.g., total 34
metal concentrations) in environmental substrates cannot sufficiently characterize ENM 35
(e.g., size, surface area, transformations, etc.). To try to address these challenges, a great 36
deal of research has gone into trying to determine the best methodologies for measuring 37
and characterizing these materials and determining the fate and effects in water, air and 38
soils2,6–9. Despite this, there is still very little understanding of the fate and effects of ENM 39
in the soil environment, which are also diverse and complex, containing a mixture of 40
organics, minerals and colloids that may interact, react with and transform ENM10. Much 41
of the focus for ENM in soils has been on metallic ENM since they are the highest produced 42
and commercially utilized ENM and, are expected to end up in the soil environment 43
3
through: deposition from air, sedimentation and agricultural applications4. Additionally, 44
research has shown that metallic ENMs can be concentrated in sewage sludge (biosolids) 45
during wastewater treatment11,12. Biosolids are commonly used as a fertilizer on agronomic 46
lands, making their contamination with ENMs a concern from an environmental 47
perspective. Key soil properties that determine the stability of a metallic ENM within a 48
natural soil environment have been identified as pH, organic matter, clay content, and to a 49
lesser extent, cation exchange capacity, carbonates and amorphous Fe13,2,14,15,16. 50
Due to its unique properties, such as anti-fungal, excellent electrical and heat 51
conduction and extreme weather resistance, copper ENMs are used in a large variety of 52
technologies4. In 2010, the estimated global production of Cu-based ENMs was 53
approximately 200 tons per year, with the majority of production originating as catalysts, 54
electronics and optics, and coatings, paints and pigments4. These uses, along with the 55
incorporation and use of Cu ENMs as a biocide for wood preservation (e.g., fence and deck 56
treatments), and agronomic applications17 have led to soils being identified as a major sink 57
for Cu ENMs4,18,19. Although copper is an essential trace element for organisms, it can be 58
toxic in higher concentrations13,20,21. At elevated copper concentrations, the formation of 59
reactive oxygen species through the Fenton reaction (i.e., Cu+ + H2O2 → Cu2+ + ●OH + 60
OH-) can modify the structure of function of essential biomolecules, which can cause acute 61
and chronic toxic effects. For example, the EC50 for reproduction in E. andrei in a natural 62
reference soil was previously reported as 130.9 mg Cu/ kg soil13. Despite extensive 63
research on the bulk form of Cu, relatively little is known about how soil characteristics 64
affect interactions between Cu ENMs, soil and soil organisms18. In recent years, there has 65
been some research into the effects of Cu ENMs in the environment with much of the 66
4
attention given to aquatic organisms. With regards to soil organisms, the majority of studies 67
has been on plants and the soil microbial community and few on soil invertebrates10,14. The 68
research on the effects of Cu ENMs are conflicting, with some studies suggesting nano-69
specific effects through greater or different effects compared to a bulk Cu couterpart22,23, 70
and others attributing the effects observed from Cu ENMs to the release of copper ions 71
through the solubilization of the ENM18. 72
Soil invertebrates represent an important part of the ecosystem, as primary 73
consumers they play an integral role in organic decomposition and the cycling of nutrients 74
in the soil environment. With regards to the effects Cu ENMs have on soil invertebrate 75
species, Amorim and Scott-Fordsmand24 demonstrated nano-specific effects on 76
reproduction and avoidance response when Enchytraeus albidus were exposed to Cu 77
ENMs in soil, as exhibited by little to no dissolution of the ENM, relative to the Cu salt. 78
Further studies on the same species have observed varying response patterns in oxidative 79
stress and differential gene expression between Cu salt and Cu ENMs25, but with no 80
differences in lipid, carbohydrate and protein energy reserves26. In contrast, a study using 81
Eisenia fetida demonstrated significant effects on reproduction for CuCl2 (salt) relative to 82
Cu ENMs, and observed oxidation of the Cu ENM surface, suggestive of dissolution and 83
release of Cu ions as a contributor of toxicity27. Unrine et al.28 reported metallothionein 84
induction upon exposure of E. fetida to Cu ENM and CuSO4 in soil, with greater sensitivity 85
to the Cu salt (i.e., CuSO4); however, the authors also observed that oxidized Cu ENMs 86
were taken up by the test organisms, which may result in Cu ‘hot spots’ within tissue. 87
Gomes et al.29 also detected partial oxidation of Cu ENM, but with limited dissolution, and 88
found that the Cu salt (CuCl2) was more toxic than the Cu ENM when Enchytraeus 89
5
crypticus were exposed to these substances in a natural soil. Evidence of Cu ENMs taken 90
up into tissue may result in bioaccumulation and trophic transfer, however, studies 91
examining the uptake and elimination rates of metal ENMs in earthworm are rare30. Despite 92
growing interest in the effect of metal ENMs on terrestrial systems, ecotoxicity studies on 93
soil dwelling species remain limited relative to aquatic based studies2,31. 94
Due to the complex, multi-phase properties of the soil matrix, the quantitative 95
analysis of nanoparticles in soils requires an operationally defined soil extraction procedure 96
that targets the desired soil metal fraction without driving undesirable transformation 97
processes (e.g. dissolution)3,16,32. Commonly, metallic ENM are compared with their ionic 98
or bulk base material as a positive control to try to tease apart effects caused through the 99
dissolution process in environmental matrices versus those caused by the ENM itself (i.e., 100
small size, large surface area, higher reactivity, etc.). Recently, more emphasis has been 101
put on not simply comparing results to the bulk form, but quantifying the extractable 102
solubilized fraction2. In soils, this frequently results in reporting the soluble fraction in soil 103
pore-water or soil extracts10,33. Characterizing the nanomaterial once in the soil is important 104
to understand transformations that may occur in the environment such as homo-105
aggregation, hetero-aggregation, dissolution, binding or coating with other components of 106
the soil. Sample preparation techniques are required to render the extract suitable for 107
analysis (e.g. removal of micron-sized particulates), thus the soil extraction technique, 108
preparation and analysis are inextricably linked9. There is no standard method for 109
measuring ENM in environmental matrices and usually a suite of techniques is required31. 110
Each methodology has limitations, which is why typically more than one is utilized and 111
often the selection is based on availability. For example, it is generally agreed that good 112
6
characterization of nano material(s) should include more than one of the following: 113
electron microscopy techniques (e.g., transmission electron microscope (TEM), scanning 114
electron microscope (SEM), energy dispersive x-ray spectroscopy (EDS)), sizing 115
techniques (e.g., hydrodynamic size via dynamic light scattering (DLS), single particle 116
inductively-coupled plasma – mass spectrometry (SP-ICP-MS)), light spectroscopy 117
techniques (e.g., UV-VIS, enhanced dark-field hyperspectral imaging) or synchrotron 118
techniques (e.g., x-ray absorption fine structure (XAFS), x-ray absorption near edge 119
structure (XANES)). 120
121
1.3 Objectives 122
The work presented seeks to address the following four objectives: 123
1. Determine if nCuO has an effect on the survival and reproduction of Eisenia andrei 124
and Folsomia candida 125
2. Determine if any observed effects of E. andrei and F. candida survival and 126
reproduction can be attributed to the extractable (extractable) Cu2+ concentrations 127
in soil. 128
3. Examine the fate of Cu nanomaterial in soil and biosolid-amended soil. 129
4. Assess the bioaccumulation potential of nCuO in E. andrei and determine if Cu 130
nanomaterial is taken up into tissue. 131
132
The first three objectives are examined in Chapter 2: Sub-lethal toxicity of copper 133
oxide nanoparticles and copper sulphate to Eisenia andrei and Folsomia candida in field 134
soil with and without biosolid amendment. Standardized survival and reproduction tests 135
7
were conducted using E. andrei and F. candida exposed to nCuO or CuSO4 in soils with 136
and without biosolid amendment. The results were statistically analyzed based on both total 137
Cu and extractable Cu2+ measurements in the test soils to determine effects at the 10th, 25th 138
and 50th percentile levels (i.e., EC10, EC25, and EC50). Sub-samples of soils from the E. 139
andrei reproduction tests were extracted for single particle inductively coupled mass 140
spectrometry (SP-ICP-MS) analysis to assess the presence and size of nano-particulate Cu. 141
The fourth objective is addressed in Chapter 3: Bioaccumulation and toxicokinetics of 142
nano copper oxide in the earthworm Eisenia andrei. The uptake and elimination of both 143
nCuO and CuSO4 was measured in E. andrei in field soil with and without biosolid 144
amendment. Biota-to-soil accumulation factors (BSAF) at steady state, as well as kinetic 145
uptake and elimination rates, are presented for each exposure scenario. Additionally, a 146
qualitative assessment of uptake of intact nCuO particles into earthworm tissue was 147
completed using enhanced dark-field hyperspectral imaging, a light microscopy technique 148
that can match materials based on the spectrum captured by the visible near-infrared (400 149
– 1000nm) spectrophotometer34. 150
151
8
Chapter 2: Sub-lethal toxicity of copper oxide nanoparticles and copper 152
sulphate to Eisenia andrei and Folsomia candida in field soil with and 153
without biosolid amendment 154
155
2.1 Abstract 156
As engineered nanomaterials continue to find novel applications and places in everyday 157
uses, assessing their potential risk to the environment remains a challenge. In soil 158
ecosystems, this is particularly true due to the complex nature of soil and, the potential 159
interactions between engineered and natural materials. Copper oxide nanomaterials 160
(nCuO) and copper sulfate (CuSO4) exposures in soil were compared in two 161
environmentally relevant scenarios: field soil with and without biosolid amendment. 162
Subsequent chronic effects were evaluated for two invertebrate soil species within the 163
exposure scenarios: the earthworm Eisenia andrei and the collembolan, Folsomia candida. 164
The observed results were evaluated based on both total Cu and extractable Cu2+ 165
concentrations within the test soils to determine if solubilized Cu2+ released from nCuO 166
could explain the observed effects. Ionic Cu2+ was measured in KNO3 soil extracts (using 167
a Cu ion selective electrode) to represent the fraction of solubilized Cu2+ available to 168
invertebrates in the soil exposures. Exposure to nCuO in soil had a more pronounced 169
adverse effect on E. andrei reproduction when compared to F. candida reproduction, 170
irrespective of the source of nCuO exposure (i.e., direct application or application via 171
amendment of spiked biosolids). There were no significant differences in toxicity observed 172
between the nCuO and CuSO4 treatments for either test species. The results demonstrated 173
9
that the observed inhibition of reproduction, when exposed to nCuO, was likely attributable 174
to the solubilization and availability of Cu2+. 175
176
2.2 Introduction 177
Within the past decade, the production of engineered nanomaterials (ENMs) has 178
increased at a rapid pace, with numerous applications being developed for different 179
metallic ENMs yearly. Due to unique properties, such as excellent electrical and heat 180
conduction and extreme weather resistance, copper ENMs are used in a large variety of 181
technologies35. In 2010, the global production of Cu-based ENMs was approximately 200 182
metric tons per year, with the majority of production originating as catalysts, electronics, 183
optical devices and, coatings, paints and pigments36. These uses, along with the 184
incorporation and use of Cu NMs as a biocide for wood preservation (e.g., fence and deck 185
treatments), have led to soils being identified as a major sink for Cu ENMs18,36. In addition, 186
there is evidence showing that metallic ENMs may be concentrated in sewage sludge 187
(biosolids) during wastewater treatment processes11,12. Biosolids are used as a fertilizer on 188
agricultural lands in many regions including across Canada, making their contamination 189
with ENMs a concern from an environmental perspective. The evaluation of the risk that 190
metallic ENMs may pose to the soil environment has been presented in the literature as a 191
complex problem that depends on the physical and chemical properties of the ENM and 192
specific soil type12,2,29. With regards to Cu ENMs, two possible risk assessment models 193
apply; that toxicity is primarily the result of dissolution and the release of the Cu2+ free ion, 194
making traditional risk assessment applicable, or that there is a nano-specific toxicity (i.e. 195
10
toxicity not attributed to the Cu2+ free ion) that may be significant and therefore traditional 196
risk assessment models are not applicable. 197
Despite extensive toxicological research on the soluble form of Cu, we are only just 198
beginning to understand how different soil and ENM characteristics affect interactions 199
between the ENM, soil and soil organisms11. Griffitt et al.22 and Lee et al.23 suggested that 200
observed toxicological effects were nano-specific; however, recent studies have shown 201
toxicity to be correlated to the extractable soluble form of Cu (i.e.,, Cu2+)27,37–39. With 202
regards to soil invertebrate species, Amorim and Scott-Fordsmand24 demonstrated nano-203
specific effects on reproduction and avoidance response when Enchytraeus albidus were 204
exposed to Cu ENMs (uncoated Cu nanoparticles) in field soil, as exhibited by little to no 205
dissolution of the ENM, relative to Cu salt (CuCl2). Further studies on Enchytraeus spp. 206
have also shown varying response patterns in oxidative stress and differential gene 207
expression between exposure to Cu salt and Cu ENMs29, but no differences in lipid, 208
carbohydrate and protein energy reserves26. In contrast, a study using Eisenia fetida 209
demonstrated significant effects on reproduction for CuCl2 (salt) relative to Cu 210
nanoparticles (NP), and observed oxidation of the Cu NP surface, suggestive of dissolution 211
and release of Cu ions as a contributor of toxicity27. Unrine et al.40 observed 212
metallothionein induction upon exposure of E. fetida to Cu NP and CuSO4 in soil, with 213
greater sensitivity to the Cu salt; however, the authors also observed that the test organisms 214
took up oxidized Cu NPs. Gomes et al.29 also detected partial oxidation of Cu NP, but with 215
limited dissolution (based on XANES analysis for oxidized Cu NP), and found that Cu salt 216
(CuCl2) was more toxic than the Cu NP in Enchytraeus crypticus exposed to these 217
substances in a natural soil. Despite growing interest in the effect of metal ENMs on 218
11
terrestrial systems, ecotoxicity studies on soil dwelling species remain limited relative to 219
aquatic based studies2. 220
The present study evaluated the toxic effects of nano-copper oxide (nCuO) to the 221
invertebrate species, Eisenia andrei (earthworm) and Folsomia candida (collembola), 222
relative to a soluble form of Cu (CuSO4). The study incorporated the use of a natural field 223
soil in the presence and absence of biosolids in order to examine different exposure 224
scenarios. The study also incorporated the measurement of ion activity (Cu2+) within each 225
exposure scenario to determine the influence of available Cu2+ on the observed toxicity, 226
and to help identify instances where organism responses exceeded those predicted by Cu2+, 227
indicative of a nano-specific effect. The use of two invertebrate species provides a better 228
understanding of how diverse species may be affected, which in turn can inform 229
environmental risk assessment processes. 230
231
2.3 Material and methods 232
2.3.1 Materials 233
All tests were performed in a field-collected agricultural sandy loam soil from Vulcan, 234
Alberta, Canada; once collected, the soil was air-dried, sieved (4-mm mesh) and 235
homogenized. The general physico-chemical characteristics of the test soils are described 236
in Table 2-1. The biosolids were obtained from a wastewater treatment plant in St. 237
Hyacinthe (Québec, Canada), as a 20% solids cake. The catchment area of the wastewater 238
treatment plant includes small towns and agriculture lands, but no industrial input. The 239
characterization of the biosolids is described elsewhere41 in brief, the biosolids had a pH 240
of 7.97; total solids content of 46600 mg/kg; and Cu concentration of 6.89 mg/kg. After 241
12
sampling, the biosolids were distributed in packages of 500 g wet weight (wt.) and frozen 242
(-20°C) until required for use. Copper sulphate (CuSO4) was used to test the readily soluble 243
form of Cu and nano copper oxide (nCuO) as a <50 nm powder, was used to test the nano 244
form; both were purchased from Sigma Aldrich Canada. 245
246
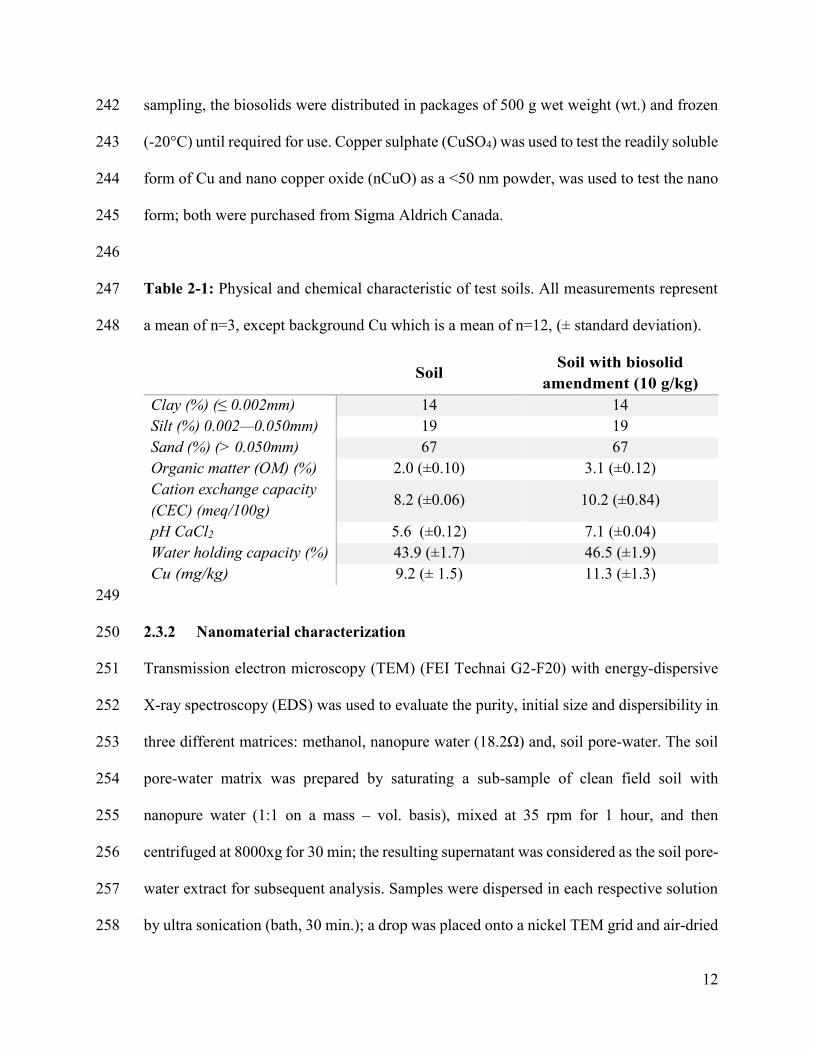
Table 2-1: Physical and chemical characteristic of test soils. All measurements represent 247
a mean of n=3, except background Cu which is a mean of n=12, (± standard deviation). 248
Soil Soil with biosolid
amendment (10 g/kg)
Clay (%) (≤ 0.002mm) 14 14
Silt (%) 0.002—0.050mm) 19 19
Sand (%) (> 0.050mm) 67 67
Organic matter (OM) (%) 2.0 (±0.10) 3.1 (±0.12)
Cation exchange capacity
(CEC) (meq/100g) 8.2 (±0.06) 10.2 (±0.84)
pH CaCl2 5.6 (±0.12) 7.1 (±0.04)
Water holding capacity (%) 43.9 (±1.7) 46.5 (±1.9)
Cu (mg/kg) 9.2 (± 1.5) 11.3 (±1.3)
249
2.3.2 Nanomaterial characterization 250
Transmission electron microscopy (TEM) (FEI Technai G2-F20) with energy-dispersive 251
X-ray spectroscopy (EDS) was used to evaluate the purity, initial size and dispersibility in 252
three different matrices: methanol, nanopure water (18.2Ω) and, soil pore-water. The soil 253
pore-water matrix was prepared by saturating a sub-sample of clean field soil with 254
nanopure water (1:1 on a mass – vol. basis), mixed at 35 rpm for 1 hour, and then 255
centrifuged at 8000xg for 30 min; the resulting supernatant was considered as the soil pore-256
water extract for subsequent analysis. Samples were dispersed in each respective solution 257
by ultra sonication (bath, 30 min.); a drop was placed onto a nickel TEM grid and air-dried 258
13
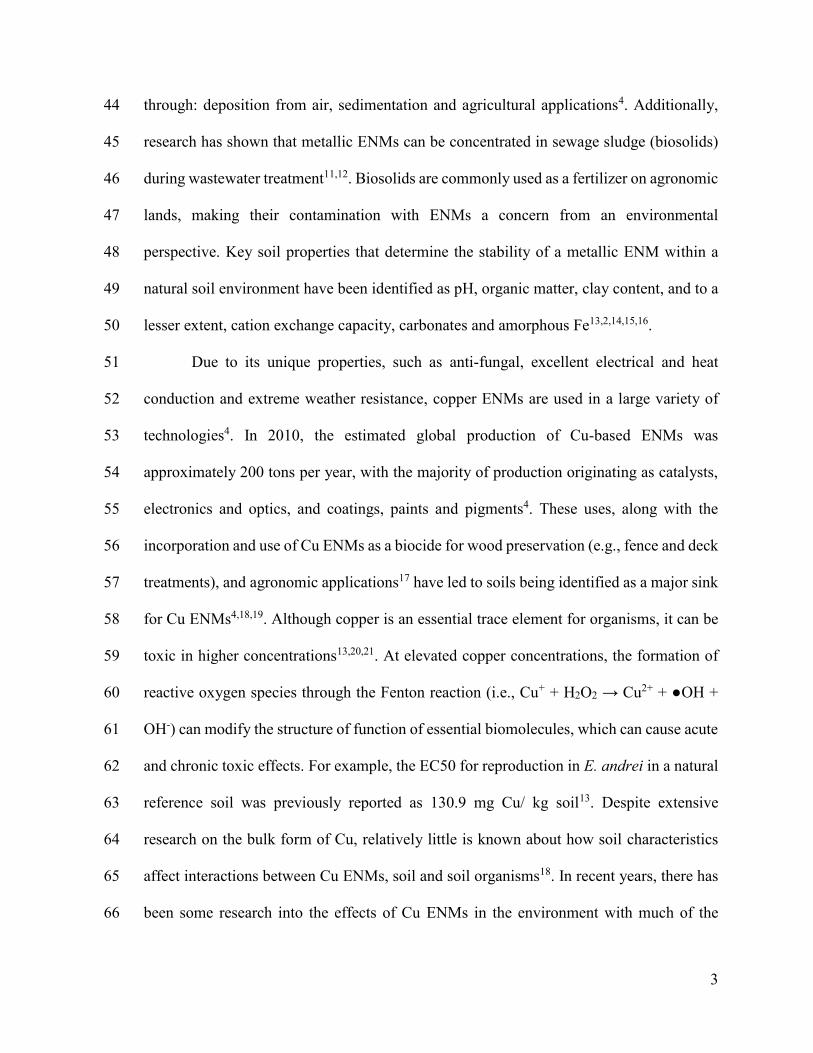
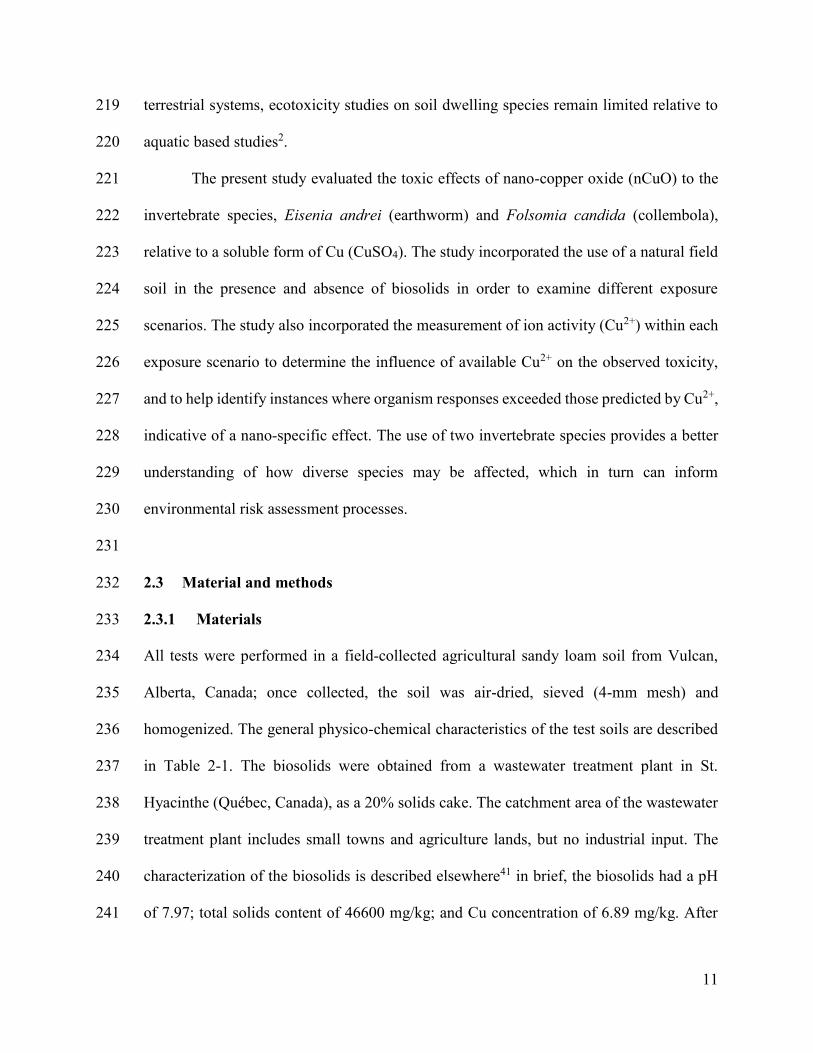
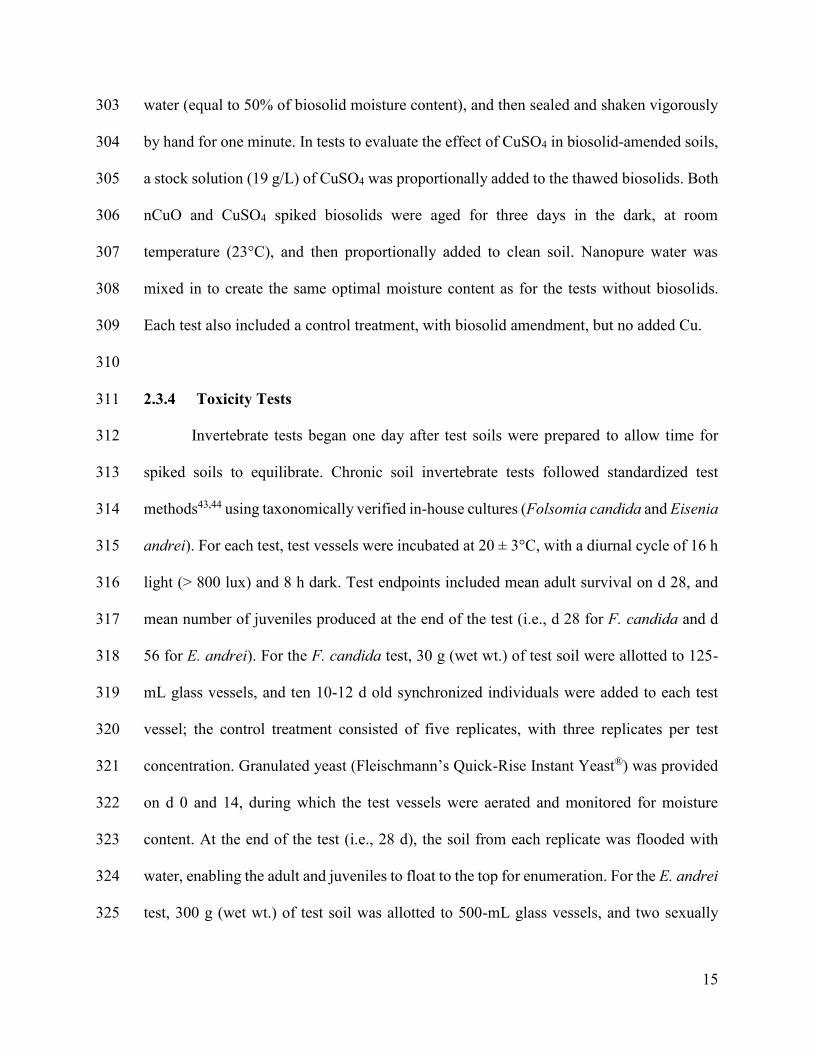
in a nano-enclosure for TEM-EDS analysis. TEM analyses revealed that the nCuO material 259
was highly agglomerated in all three solutions ( 260
Figure 2-1). The nCuO particles appeared to be somewhat spherical, with diameters 261
generally ranging from 25 to 60 nm, and in some cases up to 100 nm. The agglomerates/ 262
aggregates in the methanol and water matrices appeared to be in the range of 100 to 200 263
nm. In the soil pore-water extract, there were much larger particles and aggregates, which 264
were harder to delineate due to the presence of the organic matter. As the nCuO, powder 265
was not readily dispersible in water, nor soil pore-water, it was dry mixed into the soil to 266
ensure better homogeneity of the Cu-spiked samples. 267
268
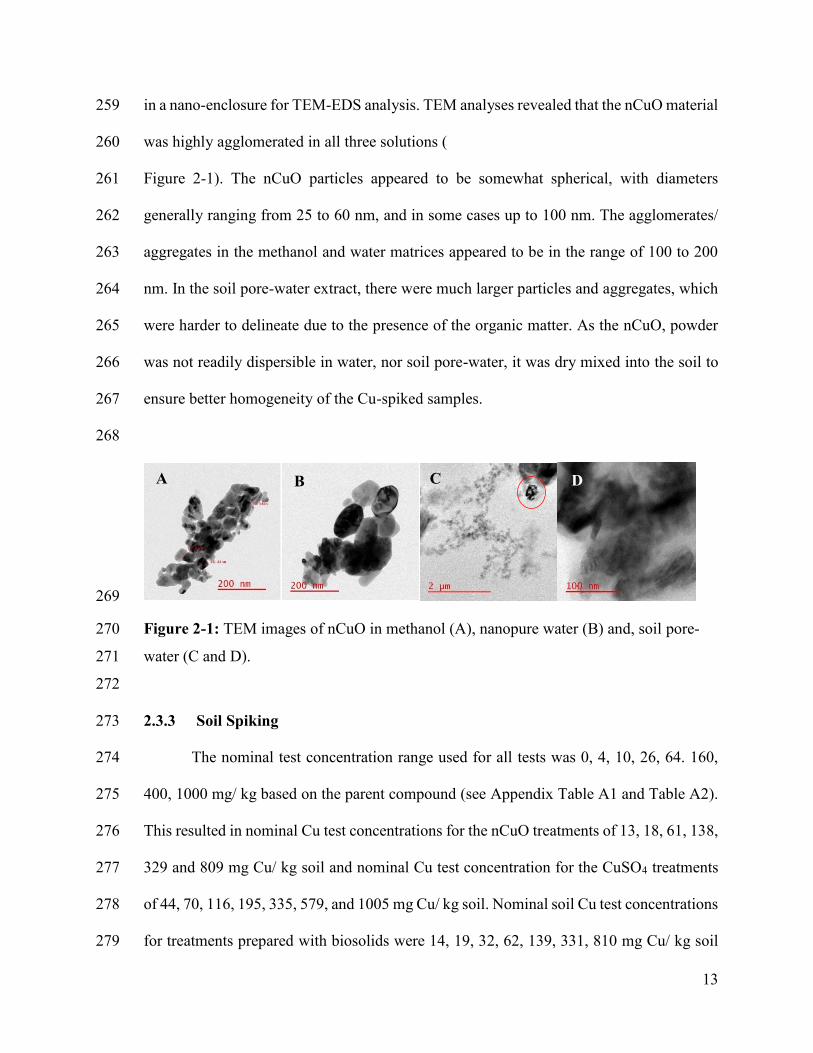
269
Figure 2-1: TEM images of nCuO in methanol (A), nanopure water (B) and, soil pore-270
water (C and D). 271
272
2.3.3 Soil Spiking 273
The nominal test concentration range used for all tests was 0, 4, 10, 26, 64. 160, 274
400, 1000 mg/ kg based on the parent compound (see Appendix Table A1 and Table A2). 275
This resulted in nominal Cu test concentrations for the nCuO treatments of 13, 18, 61, 138, 276
329 and 809 mg Cu/ kg soil and nominal Cu test concentration for the CuSO4 treatments 277
of 44, 70, 116, 195, 335, 579, and 1005 mg Cu/ kg soil. Nominal soil Cu test concentrations 278
for treatments prepared with biosolids were 14, 19, 32, 62, 139, 331, 810 mg Cu/ kg soil 279
A B D C
14
and 13, 15, 22, 37, 75, 171, 409 mg Cu/ kg soil for nCuO and CuSO4 respectively. 280
Concentrations were selected in order to capture environmentally relevant levels (i.e. just 281
above background) on the low end and, to try to achieve 50% effects values on the high 282
end. Hereafter, nominal concentrations refer to the expected soil Cu concentration; 283
however, all results presented are based on measured values. 284
For the nCuO tests without biosolids, powdered nCuO was added directly to the 285
soil and mixed using a rotary mixer for 12 h to create a stock soil equivalent to the highest 286
test concentration (i.e., 860 mg/kg [nominal]). Aliquots of the spiked stock soil were then 287
diluted with clean soil to create the test concentration series. Nanopure water (18.2Ω) was 288
then mixed into the spiked soil samples using an electric mixer to raise the soil moisture 289
content to an optimal content of 20% (i.e., 46.5% of the soil’s water holding capacity). To 290
create the CuSO4 test concentrations, CuSO4 was added directly to the soil from a stock 291
solution (41 g/L) prepared by dissolving CuSO4 in nanopure water. Each test also included 292
a control treatment, with no added Cu. The mean total measured Cu in each soil treatment 293
can be found in Appendix A (Table A1 and Table A2). 294
For tests that incorporated biosolids, the required wet mass of biosolids was 295
calculated based on the biosolid cake containing 20% solids, and an application rate of 10 296
g dry biosolid per kg soil42. Frozen biosolids were sub-sampled into polypropylene 297
containers, sealed and incubated for three days in the dark, at room temperature (23°C), 298
allowing the material to thaw prior to Cu additions. In order to spike the biosolids with 299
nCuO, the amount of powdered nCuO required for each treatment was first added to a small 300
portion of soil (equivalent to 50% of dry mass of biosolid) and dry-mixed on a rotary mixer 301
for 12 h. The nCuO-soil carrier was then added to the thawed biosolids along with nanopure 302
15
water (equal to 50% of biosolid moisture content), and then sealed and shaken vigorously 303
by hand for one minute. In tests to evaluate the effect of CuSO4 in biosolid-amended soils, 304
a stock solution (19 g/L) of CuSO4 was proportionally added to the thawed biosolids. Both 305
nCuO and CuSO4 spiked biosolids were aged for three days in the dark, at room 306
temperature (23°C), and then proportionally added to clean soil. Nanopure water was 307
mixed in to create the same optimal moisture content as for the tests without biosolids. 308
Each test also included a control treatment, with biosolid amendment, but no added Cu. 309
310
2.3.4 Toxicity Tests 311
Invertebrate tests began one day after test soils were prepared to allow time for 312
spiked soils to equilibrate. Chronic soil invertebrate tests followed standardized test 313
methods43,44 using taxonomically verified in-house cultures (Folsomia candida and Eisenia 314
andrei). For each test, test vessels were incubated at 20 ± 3°C, with a diurnal cycle of 16 h 315
light (> 800 lux) and 8 h dark. Test endpoints included mean adult survival on d 28, and 316
mean number of juveniles produced at the end of the test (i.e., d 28 for F. candida and d 317
56 for E. andrei). For the F. candida test, 30 g (wet wt.) of test soil were allotted to 125-318
mL glass vessels, and ten 10-12 d old synchronized individuals were added to each test 319
vessel; the control treatment consisted of five replicates, with three replicates per test 320
concentration. Granulated yeast (Fleischmann’s Quick-Rise Instant Yeast®) was provided 321
on d 0 and 14, during which the test vessels were aerated and monitored for moisture 322
content. At the end of the test (i.e., 28 d), the soil from each replicate was flooded with 323
water, enabling the adult and juveniles to float to the top for enumeration. For the E. andrei 324
test, 300 g (wet wt.) of test soil was allotted to 500-mL glass vessels, and two sexually 325
16
mature adults were added to each test vessel; each treatment, including the control 326
consisted of 10 replicates. The mean (± standard deviation) adult wet wt. of E. andrei used 327
was 465 ± 137 mg for tests without biosolids, and 399 ± 88 mg for tests with biosolids. 328
Earthworms were fed 2 mL of Magic Worm Food® (Magic Products Inc., USA) on d 0, 14, 329
28 and 42, during which nanopure water was added to maintain the soil’s moisture content. 330
On d 28 of the test, adult E. andrei were removed, and the cocoons and juveniles were 331
incubated for an additional 28 d, where after, the soils were manually sifted and the 332
juveniles enumerated on d 56. 333
334
2.3.5 Chemical Measurements 335
Sub-samples of test soil were taken at the beginning and end of each test for soil 336
moisture content and pHCaCl2 analyses. Triplicate samples were also taken for total Cu 337
(beginning of test only) and extractable Cu2+ (beginning and end of test). Total copper was 338
measured by acid digestion (ACS grade nitric acid (5mL of 5% solution) and hydrochloric 339
acid (5mL of 5% solution)) of soil samples (~0.5g) followed by inductively coupled 340
plasma-mass spectrometry (ICP-MS) via a commercial laboratory (Maxxam Analytics, 341
Ottawa, Canada45); the reportable detection limit was 0.5 µg/g. Soil extracts for Cu2+ ion 342
measurements were prepared by extracting sub-samples of soil with 0.01 M potassium 343
nitrite (KNO3) in a 1:5 soil to extractant ratio. The slurry was mixed using a rotary mixer 344
at 35 rpm for 2 h, and the samples were then centrifuged at 8000xg for 30 min. The 345
electrochemical potential and pH were measured in the filtered (0.45 µm nylon) 346
supernatant of each extract. Extractable Cu2+ was measured using an IonPlus series model 347
9629 cupric ion selective electrode (ISE) (Orion Research Inc.) attached to a voltmeter 348
17
(Accument® XL50, Fisher Scientific Inc.). The electrochemical potential in samples was 349
related to Cu2+ activity via a calibration procedure previously described in Rachou et al46. 350
Briefly, a set of iminodiacetic-buffered Cu solutions (0.1 mM) were prepared wherein Cu2+ 351
activity was varied in each by adding increasing volumes of 0.1 M nitric acid (HNO3). The 352
measured pH of each Cu calibration solution was then input into the chemical speciation 353
program, Visual MINTEQ47, along with the other solution components, to derive the 354
corresponding Cu2+ activities in each solution. The relationship between pHKNO3 and Cu2+ 355
in the calibration solutions was: 356
𝑙𝑜𝑔 𝐶𝑢2+ = −0.09(𝑝𝐻)2 − 0.245(𝑝𝐻) − 3.586 (1) 357
This relationship was then used to calibrate the probe by relating the measured 358
electrochemical potential measured in each solution to the corresponding Cu2+ activity. 359
The probe was re-standardized after every six samples, and all measurements were taken 360
at room temperature (21°C). The method detection limit (MDL) for Cu2+ measured in the 361
soil extract was determined by producing six replicate control soil extracts, taking the 362
reading interspersed with other samples. The mean of these six replicate control samples 363
plus three standard deviations of that mean was used to determine the MDL. A MDL of -364
8.15 mol/L (log Cu2+) in the extract was determined. 365
The presence of Cu NPs in the test soil was measured by conducting a side 366
experiment wherein the dispersible Cu NP fraction was extracted from nCuO- and CuSO4-367
spiked soil samples using the soil dispersing reagent tetra sodium pyrophosphate (TSSP), 368
according the optimized method described by Schwertfeger et al.7 and subsequently 369
analyzed by single-particle ICP-MS (SP-ICP-MS). TSPP has been shown to disperse 370
unbound or loosely bound nanoparticles in the soil solution while limiting dissolution7. The 371
18
test samples for this experiment were prepared with either nCuO (nominal concentration 372
of 800 mg Cu/kg) or CuSO4 (nominal concentration of 400 mg Cu/Kg), and sets of samples 373
were prepared with and without biosolid amendment, according to the soil spiking 374
procedures described above (section 2.3.3). The prepared test samples were then aged for 375
three weeks at room temperature in aerated containers while the moisture was kept at 70% 376
WHC. After 21 d, the soil samples were air-dried and re-homogenized by sieving to 1 mm. 377
Sub-samples (0.5 g) were weighed into 50-mL centrifuge tubes, to which 50 mL of 2.5 mM 378
TSPP was added. Samples were mixed on a rotary mixer at 30 rpm for 30 min, followed 379
by further dispersion with an ultrasonic probe (60 watts, OMNI International Sonic Ruptor 380
250 ultrasonic homogenizer, micro-titanium tip, 20 kHz) for 1.5 min. Gravimetric 381
sedimentation (18 h, 20°C) was used to settle out large particles and subsamples were taken 382
between 0.5 to 1.0 cm below the extract surface using a micropipette in order to avoid 383
particles > 1 µm, as estimated using Stoke’s law48. Subsamples were diluted 100x in 384
Nanopure water and analyzed the same day by SP-ICP-MS using a NexION 300D ICP-385
MS (PerkinElmerTM) operating in single particle mode with the SyngistixTM Nano-386
Application module (PerkinElmer Inc., Waltham, MA). Instrumental and data acquisition 387
parameters of the analysis are provided in Table 2-2. Transport efficiency was determined 388
by the particle size method49 using a 60 nm Au suspension (NIST Reference Material 389
8013). Dissolved Cu calibration was performed using solutions ranging from 0.2 to 10 µg/L 390
prepared using ASA standard Cu solution (1% HNO3). Large dissolved analyte 391
concentrations can interfere with particle analyte intensities; therefore, the analysis 392
followed the dilution series approach described in Schwertfeger et al7. While SP-ICP-MS 393
measures the amount of Cu mass in discrete particles, particle size can only be accurately 394
19
estimated if geometry and elemental composition (i.e., mass fraction) of the particles are 395
known. Because these parameters are not known for the Cu-containing nanoparticles in the 396
soil extracts, the data were processed using a default spherical shape and Cu mass fraction 397
of 1 to calculate an equivalent mono-metal particle size, denoted with the subscript “eqv” 398
(e.g., sizeeqv) in order to facilitate understanding the amount of mass detected in the 399
particles. The method detection limit for dissolved Cu was calculated as 0.3 µg/L, which 400
translated to a particle size detection limit of approximately 20 nm. 401
402
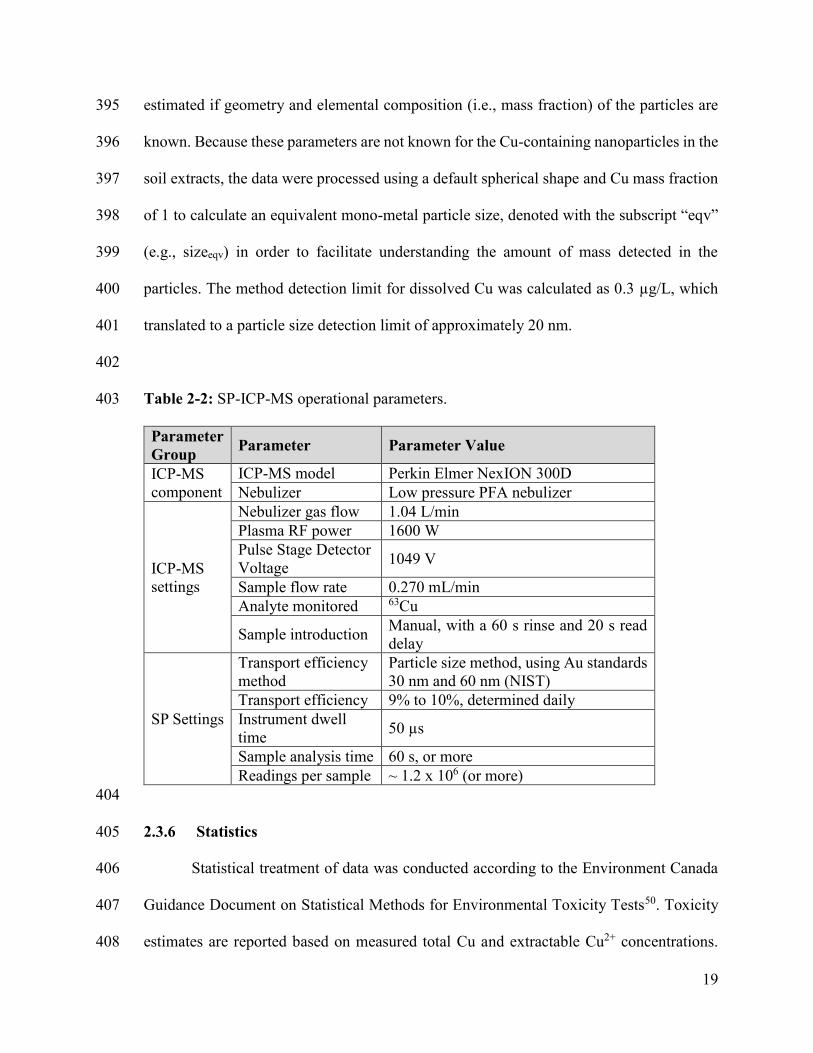
Table 2-2: SP-ICP-MS operational parameters. 403
Parameter
Group Parameter Parameter Value
ICP-MS
component
ICP-MS model Perkin Elmer NexION 300D
Nebulizer Low pressure PFA nebulizer
ICP-MS
settings
Nebulizer gas flow 1.04 L/min
Plasma RF power 1600 W
Pulse Stage Detector
Voltage 1049 V
Sample flow rate 0.270 mL/min
Analyte monitored 63Cu
Sample introduction Manual, with a 60 s rinse and 20 s read
delay
SP Settings
Transport efficiency
method
Particle size method, using Au standards
30 nm and 60 nm (NIST)
Transport efficiency 9% to 10%, determined daily
Instrument dwell
time 50 µs
Sample analysis time 60 s, or more
Readings per sample ~ 1.2 x 10⁶ (or more)
404
2.3.6 Statistics 405
Statistical treatment of data was conducted according to the Environment Canada 406
Guidance Document on Statistical Methods for Environmental Toxicity Tests50. Toxicity 407
estimates are reported based on measured total Cu and extractable Cu2+ concentrations. 408

20
Measured total Cu and Cu2+ concentrations were log-transformed for statistical analysis. 409
Significant effects were determined with ANOVA where p > 0.05 indicated no difference 410
among treatments. Quantitative data (juvenile production) were analyzed by nonlinear 411
regression using SYSTAT 13: of the models assessed, the logistic model yielded the 412
smallest residual mean square error, and was selected as the model of best fit in all cases 413
based on total Cu concentration. When the juvenile production data was assessed based on 414
extractable Cu2+ data, either the logistic or gomertz model were selected as model of best 415
fit (Appendix A: Table A3). Assumptions of normality of homoscedascity of residuals were 416
assessed using the Shaprio-Wilks and Levene’s tests, respectively. The E. andrei data did 417
not meet one or both model assumptions (depending on the test); however, the results from 418
regression analysis were reported regardless, in order to prevent the less preferred linear 419
interpolation method of analysis, whereby only a portion of the data are used to derive the 420
test endpoints51. Concentrations inhibitory (ICx) to reproduction were determined at 10, 25 421
and 50% effect levels, with upper and lower 95% confidence limits. 422
423
2.4 Results and discussion 424
2.4.1 Toxicity Tests 425
Despite differences in Cu doses across treatments as described in the section 2.2 426
and Appendix A (Table A1 and Table A2), the recovery of Cu was acceptable with greater 427
recovery attained in soils without biosolid amendment. Mean Cu recovery was 99% (SD = 428
8.3) for CuSO4 and 101% (SD = 7.9) for nCuO in soils without biosolid amendment. In 429
soils amended with biosolids, the recoveries were 84% (SD = 12.2) and 91% (SD = 12.2) 430
for CuSO4 and nCuO, respectively. Test validity criteria43,44 were met for all endpoints and 431
21
both species in all tests. The derived toxicity estimates for inhibition of reproduction, based 432
on measured total Cu is provided in Table 2-3. Both F. candida and E. andrei adult survival 433
were unaffected by exposure to nCuO (p > 0.17), regardless of biosolid amendment 434
(Appendix A: Table A4 and Table A5). The lack of significant effects in adult earthworm 435
survival correspond with other studies conducted with concentrations of nCuO in soil 436
ranging up to 1000 mg Cu/ kg27,52,53. For earthworms exposed to CuSO4 in soils without 437
biosolid amendment, there was an effect on adult survival at concentrations > 678 mg Cu/ 438
kg only. E. andrei reproduction was the most sensitive endpoint overall, with the order of 439
toxicity (from most to least toxic) as follows: CuSO4 (with biosolids) > CuSO4 (no 440
biosolids) ≈ nCuO (no biosolids) > nCuO (with biosolids) (Figure 2-2). However, given 441
the overlap in 95% confidence limits, the difference in reproductive toxicity between 442
biosolid and non-biosolid exposures was not significant (Table 2-3). Similar trends were 443
evident, concerning species and endpoint sensitivity when analyzed based on Cu2+ 444
(Appendix A: Table A3); also with no discernable difference in toxicity between the Cu 445
forms detected. These results suggest that available Cu2+ released in the test soils account 446
for the observed toxicity. As such, discussion of the reproductive inhibition in E. andrei is 447
addressed in context of extractable Cu2+ below in section 2.4.2. 448
449
22
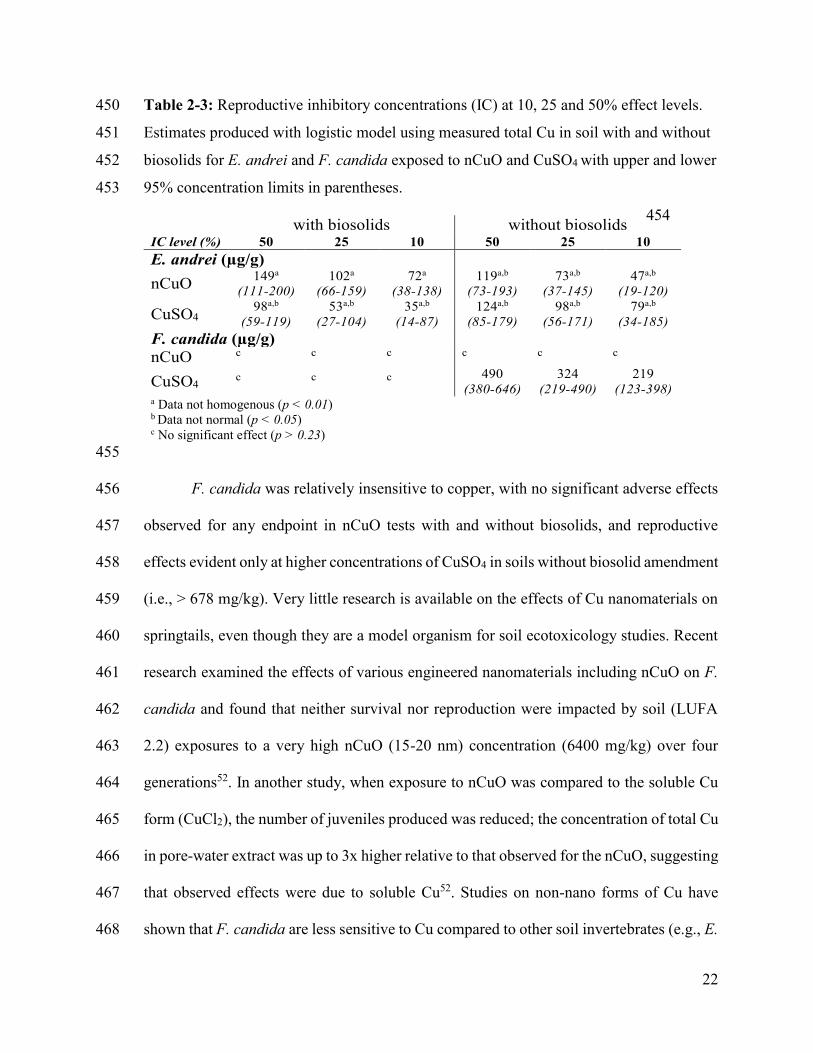
Table 2-3: Reproductive inhibitory concentrations (IC) at 10, 25 and 50% effect levels. 450
Estimates produced with logistic model using measured total Cu in soil with and without 451
biosolids for E. andrei and F. candida exposed to nCuO and CuSO4 with upper and lower 452
95% concentration limits in parentheses. 453
454
455
F. candida was relatively insensitive to copper, with no significant adverse effects 456
observed for any endpoint in nCuO tests with and without biosolids, and reproductive 457
effects evident only at higher concentrations of CuSO4 in soils without biosolid amendment 458
(i.e., > 678 mg/kg). Very little research is available on the effects of Cu nanomaterials on 459
springtails, even though they are a model organism for soil ecotoxicology studies. Recent 460
research examined the effects of various engineered nanomaterials including nCuO on F. 461
candida and found that neither survival nor reproduction were impacted by soil (LUFA 462
2.2) exposures to a very high nCuO (15-20 nm) concentration (6400 mg/kg) over four 463
generations52. In another study, when exposure to nCuO was compared to the soluble Cu 464
form (CuCl2), the number of juveniles produced was reduced; the concentration of total Cu 465
in pore-water extract was up to 3x higher relative to that observed for the nCuO, suggesting 466
that observed effects were due to soluble Cu52. Studies on non-nano forms of Cu have 467
shown that F. candida are less sensitive to Cu compared to other soil invertebrates (e.g., E. 468
with biosolids without biosolids IC level (%) 50 25 10 50 25 10
E. andrei (µg/g)
nCuO 149a
(111-200)
102a
(66-159)
72a
(38-138)
119a,b
(73-193)
73a,b
(37-145)
47a,b
(19-120)
CuSO4 98a,b
(59-119)
53a,b
(27-104)
35a,b
(14-87)
124a,b
(85-179)
98a,b
(56-171)
79a,b
(34-185)
F. candida (µg/g)
nCuO c c c c c c
CuSO4 c c c
490
(380-646)
324
(219-490)
219
(123-398) a Data not homogenous (p < 0.01) b Data not normal (p < 0.05) c No significant effect (p > 0.23)
23
crypticus, E. andrei)54,55 , and that effect levels for survival and reproduction range from 469
EC50s of 2270 mg Cu/kg56 to no effect at concentrations greater then 750 kg/ha55. The 470
difference in the biological response of these two organisms may explain the difference in 471
sensitivity observed herein. It is known that earthworms will accumulate metals in 472
chloragocytes, which are then slowly eliminated57,58. However, springtails eliminate metals 473
from the gut by merocrine and holocrine secretion59. The route of exposure to springtails 474
is primarily through dermal absorption of soil pore water. Springtails regularly moult as 475
they grow; this shedding of their exoskeleton may also serve as a way to remove toxicants 476
from their bodies. 477
478
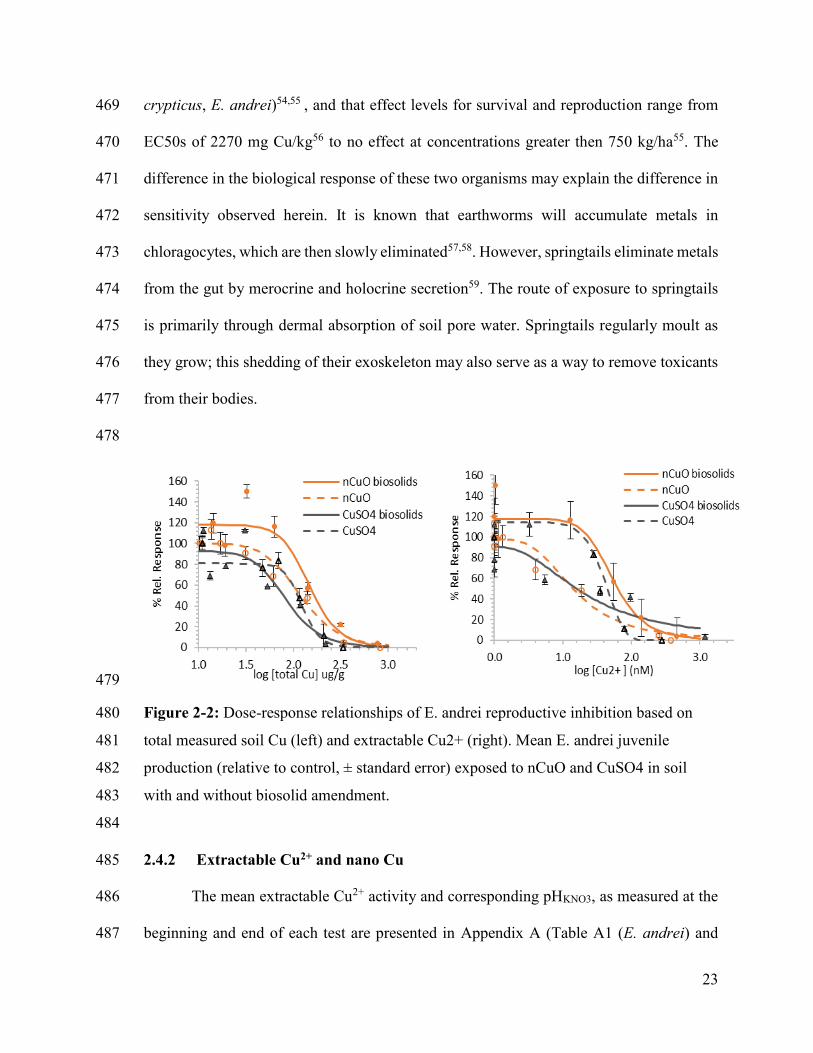
479
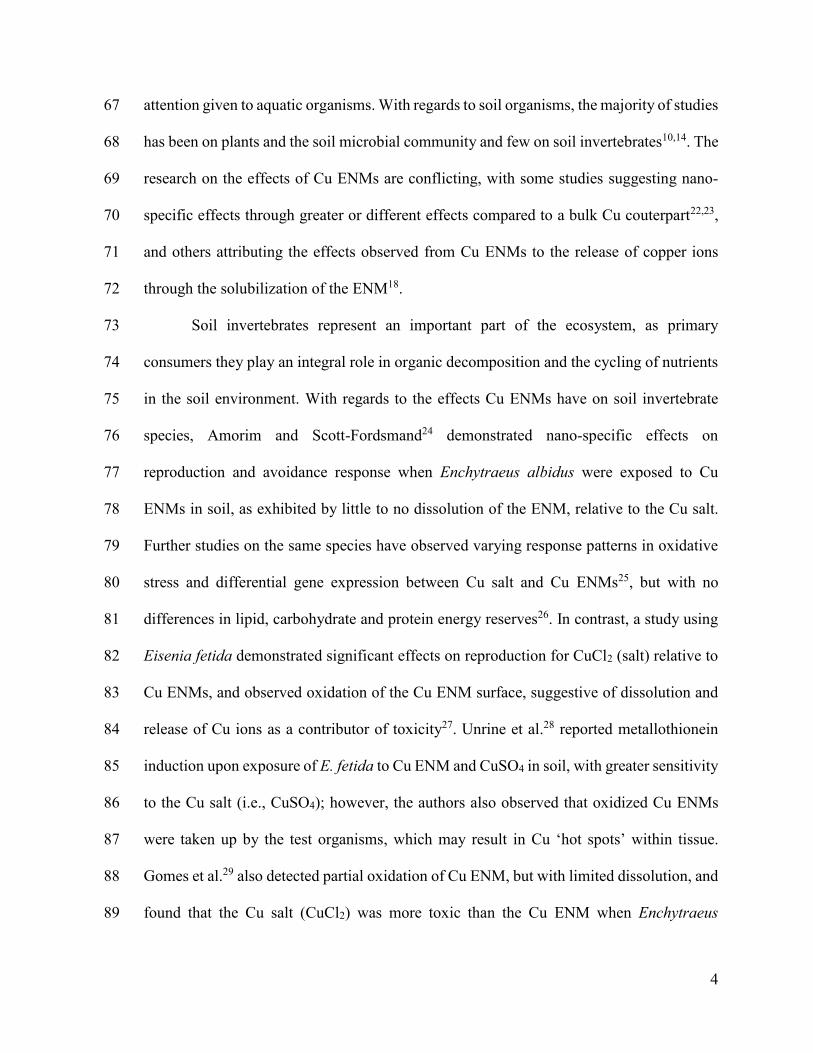
Figure 2-2: Dose-response relationships of E. andrei reproductive inhibition based on 480
total measured soil Cu (left) and extractable Cu2+ (right). Mean E. andrei juvenile 481
production (relative to control, ± standard error) exposed to nCuO and CuSO4 in soil 482
with and without biosolid amendment. 483
484
2.4.2 Extractable Cu2+ and nano Cu 485
The mean extractable Cu2+ activity and corresponding pHKNO3, as measured at the 486
beginning and end of each test are presented in Appendix A (Table A1 (E. andrei) and 487
24
Table A2 (F. candida)). Extractable Cu2+ was evaluated within this study to determine 488
whether Cu2+ activity could explain the observed toxic response between a readily soluble 489
form of Cu (i.e., CuSO4) and a nano-form (i.e., nCuO) in soil. In soils, it has been suggested 490
that the toxicity to soil organisms may be predicted based on the dissolution, transformation 491
or stability of the metallic nanomaterial60,61. The rate of transformation or dissolution of 492
metallic nanomaterials in soils can be difficult to predict, as there are many variables to 493
consider such as the nanomaterial itself (e.g., size, coating, etc.), as well as the environment 494
(e.g., pH, % OM, cation exchange capacity (CEC), clay content) within which it 495
resides12,61. Moreover, a lack of soil-based studies investigating these variables adds to the 496
difficulty in predicting nanomaterial transformations2. For nCuO, dissolution would 497
increase the release and bioavailability of Cu2+, which would elicit Cu2+ toxicity when 498
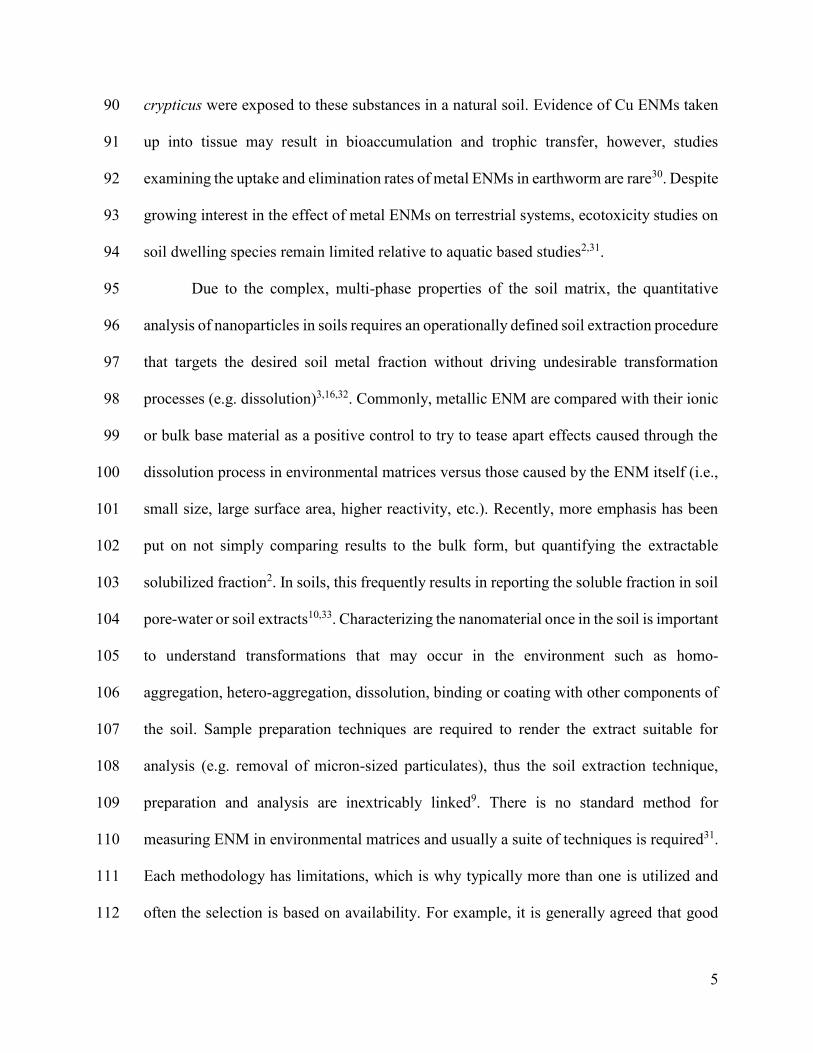
exceeding the tolerable threshold limit for an organism. Extractable Cu2+ increased with 499
increasing total Cu concentration at both test start (d 0) and test end (d 28 and d 56 for F. 500
candida and E. andrei, respectively) (Figure 2-3). Based on extractable Cu2+, a difference 501
in Cu2+ activity was noted in tests with biosolid amendments, whereby Cu2+ concentration 502
increased after at least four weeks (i.e., F. candida tests) of aging in test soil (Figure 2-3). 503
In the absence of biosolids, the Cu2+ activity remained relatively consistent over the test 504
duration for both the earthworm (56 d – Figure 2-3) and collembolan (28 d –Figure 2-3) 505
tests. 506
507
25
Ea biosolids
log total Cu in soil (ug/g)
1.4 1.6 1.8 2.0 2.2 2.4 2.6 2.8 3.0
log
[Cu
2+]
in s
oil
extr
act
(ug/
g)
-5
-4
-3
-2
-1
0
1
nCuO d0nCuO d56CuSO
4 d0
CuSO4 d56
Ea no biosolids
log total Cu in soil (ug/g)
1.4 1.6 1.8 2.0 2.2 2.4 2.6 2.8 3.0
log
[Cu
2+]
in s
oil
ext
ract
(ug
/g)
-5
-4
-3
-2
-1
0
1
nCuO d0nCuO d56CuSO
4 d0
CuSO4 d56
508
Fc biosolids
log total measured [Cu] in soil (ug/g)
1.6 1.8 2.0 2.2 2.4 2.6 2.8 3.0
log [
Cu
2+]
in s
oil
ext
racts
(ug/g
)
-6
-4
-2
0
2
4
nCuO d0nCuO d28CuSO
4 d0
CuSO4 d28
Fc no biosolids
log measured total [Cu] in soil (ug/g)
1.6 1.8 2.0 2.2 2.4 2.6 2.8 3.0 3.2
log [C
u2
+] in
soil
ext
racts
(ug/g
)
-6
-4
-2
0
2
4
nCuO d0nCuO d28CuSO
4 d0
CuSO4 d28
509
Figure 2-3: Mean (± standard error) log measured extractable Cu2+ concentrations soil 510
extracts relative to total measured Cu in soils with (left) and without (right) biosolid 511
amendment in E. andrei (top) and F. candida (bottom) tests. 512
513
Despite the measured differences in Cu2+ activity, no significant difference in 514
toxicity were observed (based on overlapping confidence intervals) between soils with or 515
without biosolid amendment for either species. McShane et al.62 described an increase in 516
Cu2+ measured in nCuO treated soils over 56 d, similar to our biosolid-amended tests, 517
although their soils had no biosolid amendment. McShane et al.62 correlated the changes in 518
Cu2+ activity to soil pH over time, which we also observed here. By d 56, Cu2+ 519
concentrations in exposures without biosolids decreased, which corresponded to an 520
increase in soil pHKNO3 (Appendix A: Table A1 and Table A2), suggesting increased Cu2+ 521
26
fixation and subsequent reduction in the extractable Cu pool. Contrastingly, exposures with 522
biosolids showed increased Cu2+ concentrations by 56 d, which corresponded to decreases 523
in soil pHKNO3 (Figure 2-3 and Table A1). The reduction in soil pH drives the dissolution 524
of Cu. Samarajeewa et al.63 have shown that soils amended with biosolids show increased 525
microbial activity and decomposition rates, which in turn acidifies the soil. Since Cu has a 526
strong affinity for organic matter, it is likely that much of the added Cu initially bound to 527
the organic residues in the biosolids were then released via microbial decomposition, or 528
via proton exchange from the increased soil acidity. This happened largely in the CuSO4 529
treatments, which showed a 28-fold increase in Cu2+ concentrations by 56 d, compared to 530
the nCuO treatments, which only showed a 12-fold increase (Table A1). It is possible that 531
some of the nCuO was stabilized by the biosolid residues12,61, thus reducing the initial 532
dissolution of the particle and subsequent pool of organically bound Cu2+. 533
Frequently, the toxicity of metallic nanomaterials in the environment can be 534
explained based on the dissolution of the nanomaterial into its base ionic form and/ 535
or, a nano-specific effect60. Studies examining the effects of nCuO in the soil 536
environment to date are no different, with some concluding that toxicity observed 537
may be attributed to available Cu2+, and others describing a nano-specific effect. A 538
nano-specific effect would result in an effect on test organisms that is either different 539
from an ionic treatment or could not be explained by measured Cu2+ activity in the 540
test media. Since E. andrei reproduction was the most sensitive endpoint, this data 541
was used to compare the dose response based on extractable Cu2+ and total Cu 542
(Figure 2-2) in order to determine if the extractable Cu2+ could explain differences in 543
effects between the nCuO and CuSO4 treatments. Examining the data in this way shifted 544
27
the order of toxicity slightly to nCuO (no biosolids) ≈ CuSO4 (biosolids) > CuSO4 (no 545
biosolids) ≈ nCuO (biosolids). However, once the confidence limits were considered, there 546
was no significant difference in toxicity to E. andrei between the two forms of Cu when 547
expressed as Cu2+ concentrations (Table A3). The modelled ICx at the 10th, 25th, and 50th 548
percentile based on concentration of extractable Cu2+ for both species are provided in 549
Appendix A (Table A3). 550
Examples of both conclusions (i.e., toxicity due to nano form vs. release of Cu2+ 551
ions) are present in the literature for earthworms, particularly for sub-lethal effects. When 552
E. fetida was exposed to either CuCl2 or nCuO (80 nm) in a sandy loam soil, exposure to 553
CuCl2 exerted a greater effect on reproduction and adult survival, leading to the hypothesis 554
that toxicity may have been due to the release of Cu ions; however, Cu2+ activities were 555
not reported27. In another species of earthworm (Metaphire posthuma) exposed to either 556
CuSO4 or nCuO in a natural soil, an immunotoxic effect was observed, indicative of 557
oxidative stress attributed to a significant decrease in coelomocyte counts compared to the 558
controls39. In this instance, the evidence of oxidative stress was observed in both nCuO and 559
CuSO4 exposures, with greater effects in the CuSO4, indicative that effects were likely due 560
to Cu2+ activity39. Unrine et al.53 did not observe significant sub-lethal toxicity in E. fetida 561
exposed to Cu NP concentrations up to 65 mg/kg; however, they did observe Cu2+ ions and 562
oxidized Cu NPs accumulated in earthworm tissues at concentrations ≥ 20 mg/kg. This 563
could suggest a nano-specific effect whereby nCuO may be taken up into earthworm tissues 564
and act as a source of Cu2+ ions; however, in this instance, the authors found no evidence 565
that nCuO in the tissue was releasing Cu ions53. A study, which compared effects of 566
exposure to nCuO to CuCl2 in the oligochaete E. cryticus over its entire life span (approx. 567
28
200 d), found that organisms had shorter lifespan, delayed reproduction and, produced 568
fewer juveniles when exposed to nCuO64. The authors concluded that since they could not 569
definitively correlate the observed reproduction effects to measured available Cu2+ (using 570
Cu ISE) in soil pore-water over 28 d, a nano-specific effect may have been possible64. 571
SP-ICP-MS results from a side experiment, which was conducted to investigate the 572
potential presence of CuNPs in the exposure media, revealed that nano-particulate Cu was 573
detected in all nCuO and CuSO4 treatments analyzed. The detection of CuNPs in the CuSO4 574
treatments not only illustrates the lack of specificity of the SP-ICP-MS analysis for pristine, 575
engineered NPs, but also the degree to which Cu2+ transformed into detectable Cu-576
containing nanoparticles. As extractable Cu2+ was also observed in the nCuO treatments 577
(see extractable Cu2+ results above), it is likely that dissolved Cu2+ precipitated into solid-578
phase (i.e., particulate) transformation products in both the nCuO treatments, as well as in 579
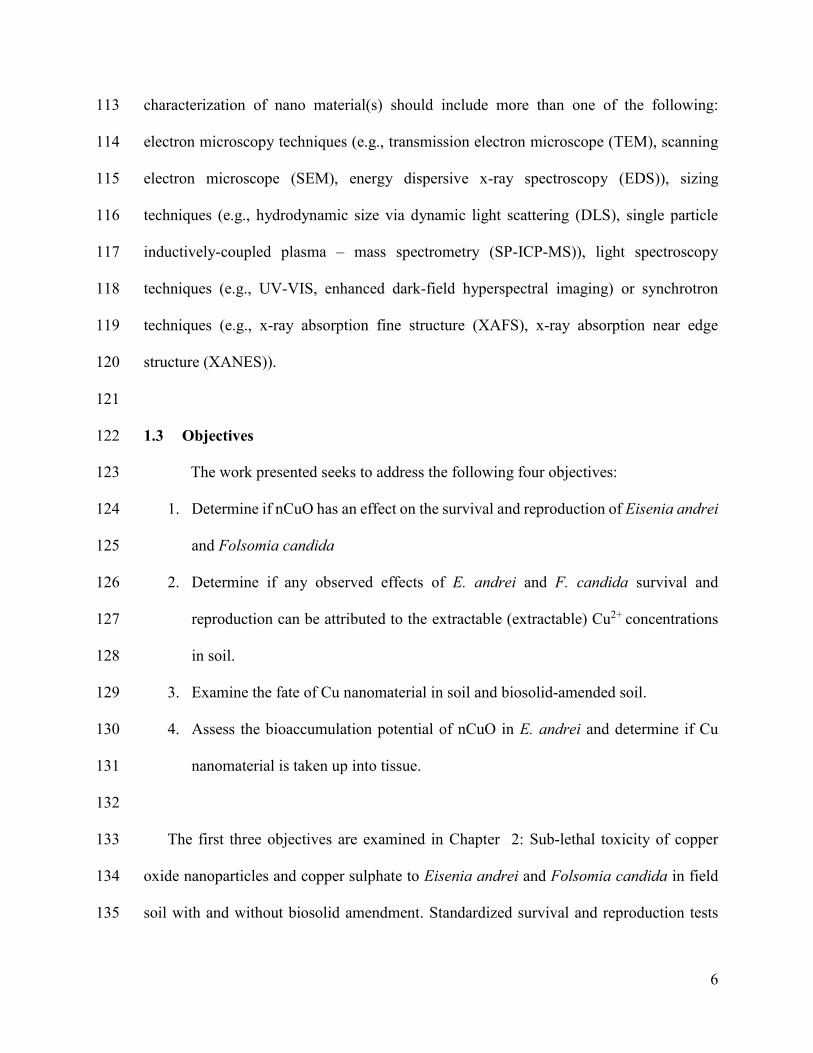
the readily soluble CuSO4 treatments. Overall, there was very little dispersible nano-580
particulate Cu extracted from samples (i.e., <0.2 % of total soil Cu) (Table 2-4), indicating 581
that much of the added nCuO remained (or further) agglomerated/aggregated at the micron 582
(or larger) size, or was oxidized/solubilized and contributed to the dissolved Cu pool. Of 583
the detectable, dispersible Cu-containing nano-particulates in the extracts, the most 584
frequent sizes (i.e.,, equivalent pure Cu0, spherical diameter) were 55 and 52 nm in the 585
nCuO treatments, (without and with biosolids, respectively) and 47 and 45 nm in the 586
CuSO4 treatments (without and with biosolids, respectively) (Table 2-4). While the 587
presence of biosolids had little effect on the size of particles extracted, it reduced the overall 588
29
amount of CuNPs extracted. Extractable CuNPs were reduced by 38% and 46% (on a Cu 589
mass basis) in the nCuO and CuSO4 treatments, respectively. 590
591
Table 2-4: SP-ICP-MS measurements in soil extracts. 592
Sample
Measured
total Cu
(mg/kg)
Most
frequent
sizeeqv
(nm)
Mean
sizeeqv
(nm)
CuNP conc.
(part./g soil)
CuNP fraction
(% NPCu/SoilCu)
nCuO 870 55 69 6.49E+08 0.12
nCuO with
biosolids 723 52 70 3.61E+08 0.07
CuSO4 417 47 58 4.54E+08 0.11
CuSO4 with
biosolids 498 45 54 3.43E+08 0.06
593
594
Figure 2-4: Example of SP-ICP-MS distribution plot from TSPP soil extract spiked with 595
nCuO in biosolids 596
597
2.5 Conclusions 598
The study presented herein provides exposure and effect data for standard soil test 599
species exposed to nCuO and CuSO4 in two environmentally relevant scenarios (i.e., field 600
soil with and without biosolid amendment) and relates the observed results to both total Cu 601
0
10
20
30
40
50
60
0 100 200 300 400
Fre
quen
cy
Diameter (nm)
30
and Cu2+ concentrations within the test soils. This approach showed that E. andrei 602
reproduction was more sensitive upon exposure to nCuO when compared to F. candida 603
survival and reproduction, irrespective of the source of nCuO exposure (i.e., with or 604
without biosolids) but did not significantly affect toxicity results. Comparison of the effects 605
of a metallic nanomaterial to its ionic counterpart is an approach that has been previously 606
used to determine if the nano form poses a greater risk than its soluble counterpart26,41. As 607
current risk assessment models for metals are based on the premise that ionic activity 608
correlates to level of risk, this study sought to evaluate the application of this approach to 609
nCuO. There was no significant difference in toxicity between the Cu forms and the Cu2+ 610
activity in the soil exposures indicated that the observed sub-lethal toxicity was most likely 611
due to the extractable Cu2+, rather than a nano-specific effect. However, the pool of 612
extractable Cu2+ changed throughout the exposure duration and depended on the soil 613
exposure scenarios (i.e., with or without biosolids). This finding would indicate that current 614
risk assessment models based on the solubilized metal form might be applicable for Cu; 615
however, time for particle dissolution becomes an important factor to consider for nCuO. 616
Given the sub-lethal effects observed on E. andrei reproduction, further investigation into 617
the fate of nCuO in these organisms should be completed to examine whether nCuO is 618
taken up, thereby potentially providing a point source of Cu2+ ions within the organism. 619
31
Chapter 3: Bioaccumulation and toxicokinetics of nano copper oxide in 620
the earthworm Eisenia andrei 621
622
3.1 Abstract 623
With the number of novel applications and increase in routine uses for metal and 624
metal-oxide engineered nanomaterials continuing to increase, the understanding of their 625
potential risk and fate in the environment remains a challenge. In soil ecosystems, this is 626
particularly true due to the complex nature of soil and, the potential interactions between 627
engineered and natural materials. In order to assess the potential of nCuO to bioaccumulate, 628
earthworms (Eisenia andrei) were exposed to copper oxide nanomaterials (nCuO) and 629
copper sulfate (CuSO4) in field soil with and without biosolids. Earthworms were exposed 630
during a 21-day uptake phase, then removed to clean field soil for a 21-day elimination 631
with sampling of soil and tissues throughout in order to estimate the uptake and elimination 632
kinetics of Cu and compare between nano (nCuO) and ionic forms (CuSO4). Both the biota-633
to-soil accumulation factor (BSAF) and kinetic bioaccumulation factor (BAFk) were 634
greater in CuSO4 exposures both with and without biosolid amendment compared to nCuO. 635
However, the elimination and therefore the calculated half-life was much longer in 636
earthworms exposed to nCuO. Qualitative assessment of nCuO in earthworm tissue was 637
completed through enhanced dark-field hyperspectral imaging to look at the fate in the 638
earthworm tissue and, revealed that most nCuO was associated with the gut or epidermis 639
of the worm. 640
641
32
3.2 Introduction 642
The global use of engineered nanomaterials (ENM) continues to increase. While 643
there is a wide range of ENM produced, metallic ENM represent the largest amount 644
produced worldwide4. Soils are predicted to be a significant environmental sink for metallic 645
ENM4,65, either through land applications of biosolids contaminated with ENM from the 646
waste water stream11, deposition from the air or, direct contamination via agricultural 647
applications; however, studies examining the fate, toxicity and bioaccumulation of ENM 648
in soils remain relatively rare2,14. Copper ENM have a wide variety of applications 649
including in conductors and semi-conductors, catalysts in the manufacturing of 650
electronics35, fungicides in agriculture, and as wood preservatives66. Most recently, the 651
lethal and chronic toxicity of Cu ENM in soils has been investigated for plants67, microbial 652
communities and soil invertebrates68, although much of the work completed to date has 653
been in artificial substrates2,6, and the need for studies in natural soil is widely recognized68. 654
For those studies that have been conducted in natural soil environment, most have 655
presented evidence that Cu ENM are generally less toxic then their bulk or ionic 656
counterparts27,39,52,69 (Chapter 2:, though there is no consensus on this68, 24,69. Regardless, 657
it is clear that understanding the fate of the Cu ENM in both the soil and exposed organism 658
is needed to understand or assess the risk an ENM may pose in the soil environment. 659
Two proposed modes of ecotoxicity by Cu ENM are: (a) that the ENM interacts 660
with the environmental substrate and through transformation processes, solubilize, 661
releasing Cu2+ ions, thus resulting in toxicity similar to that observed from bulk or soluble 662
Cu materials; or (b) that the Cu ENM can be taken up (due to their small size) through 663
regular cell transport processes, and once internalized, release Cu2+ ions6 (this is sometimes 664
33
referred to as the Trojan horse effect30). Either, or, a combination of both fates may be the 665
cause of observed effects on survival, growth and reproduction in soil organisms. 666
Generally, this is tested by comparing the effects of a nano form with a soluble metal salt 667
(e.g. CuSO4, Cu(NO3)2, CuCl2). In some cases, the amount of dissolved Cu2+ is measured 668
in soil pore-water or a soil extract to represent the fraction of Cu2+ available to soil 669
organisms68. Unfortunately, due to the variety of approaches used to compare between 670
ionic and non-ionic (i.e., nano) effects, it is difficult for risk assessors to compare across 671
studies for the assessment of the potential risk of Cu ENM in the soil environment30,68. A 672
better understanding might be attained if comparisons of the effects of ionic Cu2+ and 673
studies on the fate of the ENM in the environment (i.e., soil) is combined with an 674
examination of the fate of Cu ENM in the test organism. Bioaccumulation testing can 675
provide evidence for the potential uptake and elimination of test materials, including the 676
kinetic rates associated with these parameters indicating the potential of trophic transfer. 677
However, with regards to Cu ENM, very few studies have incorporated the use of 678
bioaccumulation with soil invertebrates30,70. Urine et al.53 presented evidence that Cu ENM 679
could be taken up into earthworm tissue when exposed in artificial soil; however, they did 680
not evaluate elimination kinetics. Earthworms are known to internalize metals from their 681
environment71, and are able to regulate the accumulation of metals to some extent72,73. 682
The research presented herein examined the uptake and elimination kinetics of nano 683
Cu oxide (nCuO) in the earthworm Eisenia andrei when exposed to the substance in a 684
natural soil. Measurements of extractable Cu2+ in spiked field soil and in spiked biosolid 685
amended into field soil were compared between nCuO and ionic Cu (as CuSO4) throughout 686
the metal exposure, or uptake phase, of testing. Models suggest that biosolids are a likely 687
34
route of exposure to the soil environment through the waste water stream for metallic ENM 688
including nCuO74. The relationship between the BSAFs and modeled kinetic uptake rates 689
between different exposures, were evaluated to determine if extractable Cu2+ 690
measurements can predict rates of uptake. Through, enhanced dark-field hyperspectral 691
imaging of earthworm tissues after exposure to nCuO, a qualitative assessment of the fate 692
of nCuO in earthworm tissue was also explored. 693
694
3.3 Materials and Methods 695
3.3.1 Materials 696
Nano copper oxide (nCuO) and copper sulphate (CuSO4) were purchased from Sigma 697
Aldrich Canada. Nano CuO was purchased as < 50 nm dry powder and in-house 698
characterization was completed to confirm size, size distribution and aggregation state in 699
water, soil pore-water and biosolid extracts via transmission electron microscope (TEM). 700
Test soil was collected from Vulcan, Alberta, Canada and characterized as a sandy loam 701
(Error! Reference source not found.). The collected field soil was air-dried, sieved (< 4 m702
m), homogenized, and then distributed into 20-L pails and stored at room temperature 703
(~20°) until use. Biosolids were collected from a wastewater treatment facility in St. 704
Hyacinthe, Quebec, Canada which has no industrial inputs (primarily agriculture and 705
residential). The biosolids were collected as a 20% solids cake and are described 706
elsewhere75; in brief, the biosolids had a pH of 7.97; total solids content of 46600 mg/kg; 707
and Cu concentration of 6.89 mg/kg. Freshly collected biosolids were distributed into 708
35
freezer bags and frozen (-20°C) until use. The physical and chemical characteristics of the 709
soil and biosolid-amended soil are described in Table 2-1. 710
711
3.3.2 Soil Spiking 712
The nominal test concentration consisted of sub-lethal concentrations (based on 713
previous toxicity experiments) of 6 and 11 mg Cu/ kg soil for CuSO4 and nCuO tests, 714
respectively. To spike nCuO into soils without biosolids, powdered nCuO was added 715
directly to pre-weighed, air-dried soil and, mixed using a rotary mixer for 12 hours. To 716
create the CuSO4 spiked soil with no biosolid; 100 mL of a 1.12 g/L stock solution of 717
CuSO4 in nanopure water (18.2 Ω) was added directly to the soil. For both nCuO and 718
CuSO4 treatments, nanopure water was then mixed into the spiked soil using an electric 719
mixer to raise the soil moisture content to an optimal content of 20% (i.e., 46.5% of the 720
soil’s water holding capacity) and to ensure sample homogeneity. Each test also included 721
control treatments, with no added Cu. 722
For tests that incorporated biosolids, the required wet mass of biosolids was 723
calculated based on the biosolid cake containing 20% solids, and an application rate of 10 724
g dry biosolid per kg soil42. Frozen biosolids were sub-sampled into polypropylene 725
containers, sealed and incubated for three days in the dark, at room temperature (23°C), 726
allowing the material to thaw prior to Cu addition. In order to spike the biosolids with 727
nCuO, the amount of powdered nCuO required was first added to a small portion of soil 728
(equivalent to 50% of dry mass of biosolid) and dry-mixed on a rotary mixer for 12 h. The 729
nCuO-soil carrier was then added to the thawed biosolids along with nanopure water (equal 730
to 50% of biosolid moisture content), and then sealed and shaken vigorously by hand for 731
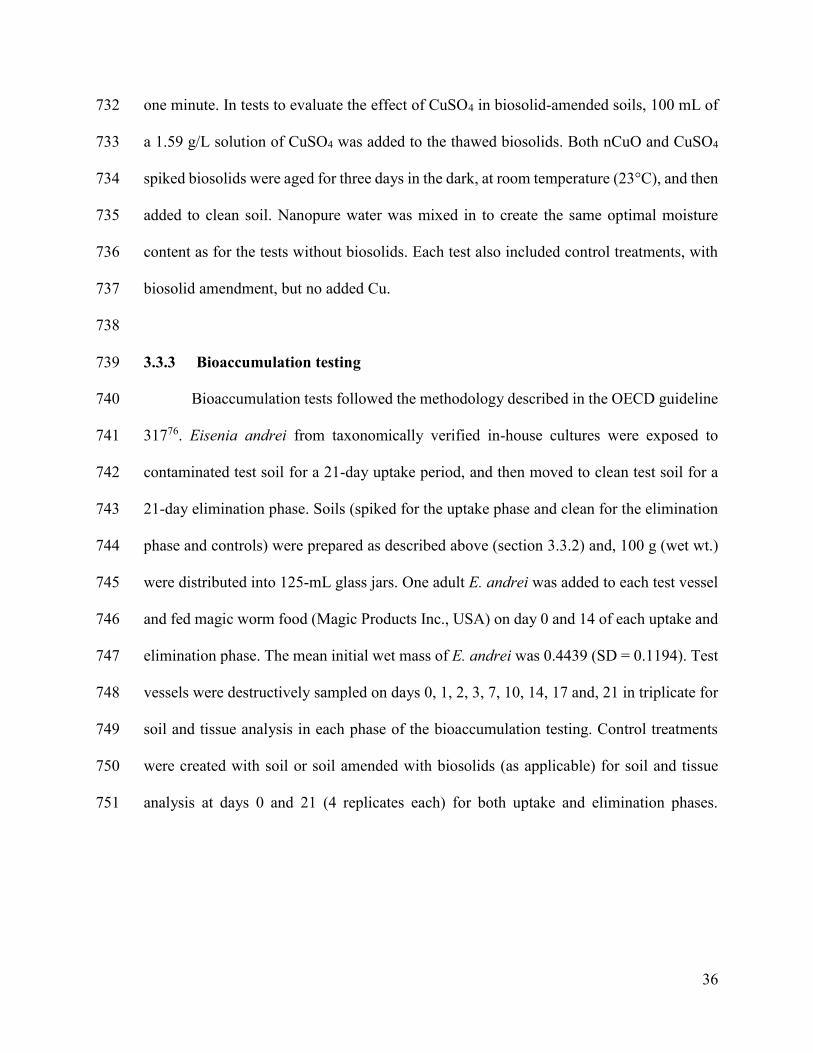
36
one minute. In tests to evaluate the effect of CuSO4 in biosolid-amended soils, 100 mL of 732
a 1.59 g/L solution of CuSO4 was added to the thawed biosolids. Both nCuO and CuSO4 733
spiked biosolids were aged for three days in the dark, at room temperature (23°C), and then 734
added to clean soil. Nanopure water was mixed in to create the same optimal moisture 735
content as for the tests without biosolids. Each test also included control treatments, with 736
biosolid amendment, but no added Cu. 737
738
3.3.3 Bioaccumulation testing 739
Bioaccumulation tests followed the methodology described in the OECD guideline 740
31776. Eisenia andrei from taxonomically verified in-house cultures were exposed to 741
contaminated test soil for a 21-day uptake period, and then moved to clean test soil for a 742
21-day elimination phase. Soils (spiked for the uptake phase and clean for the elimination 743
phase and controls) were prepared as described above (section 3.3.2) and, 100 g (wet wt.) 744
were distributed into 125-mL glass jars. One adult E. andrei was added to each test vessel 745
and fed magic worm food (Magic Products Inc., USA) on day 0 and 14 of each uptake and 746
elimination phase. The mean initial wet mass of E. andrei was 0.4439 (SD = 0.1194). Test 747
vessels were destructively sampled on days 0, 1, 2, 3, 7, 10, 14, 17 and, 21 in triplicate for 748
soil and tissue analysis in each phase of the bioaccumulation testing. Control treatments 749
were created with soil or soil amended with biosolids (as applicable) for soil and tissue 750
analysis at days 0 and 21 (4 replicates each) for both uptake and elimination phases. 751
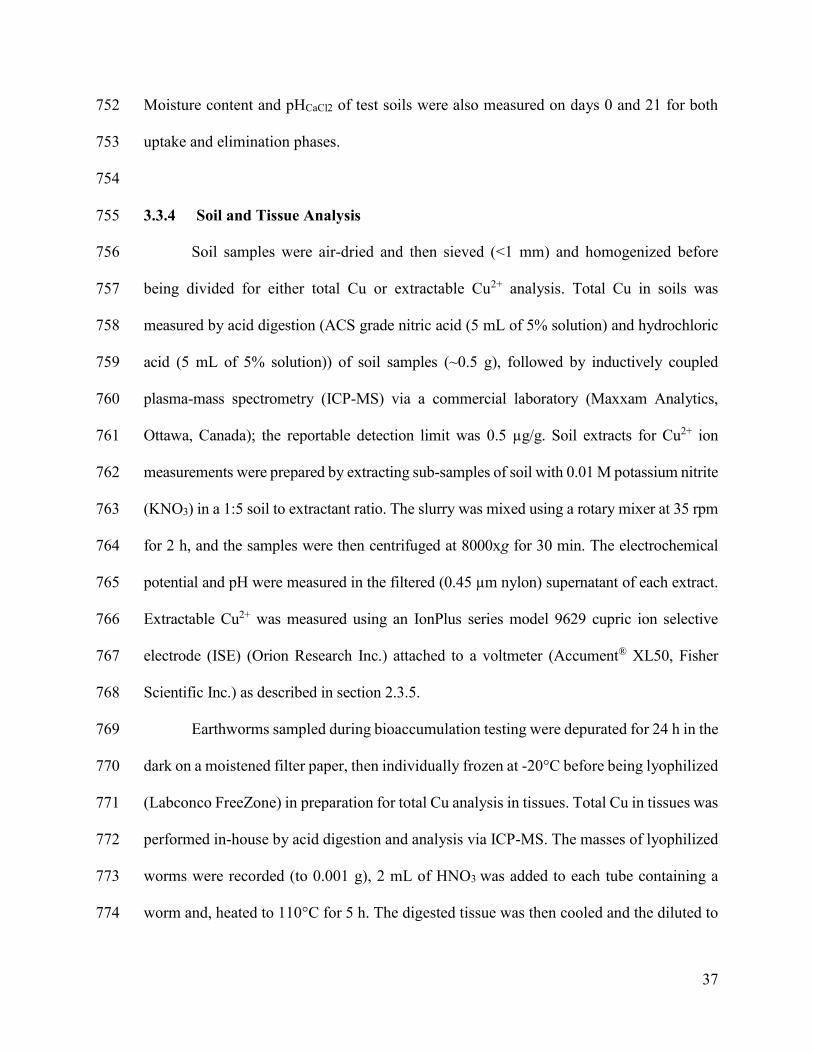
37
Moisture content and pHCaCl2 of test soils were also measured on days 0 and 21 for both 752
uptake and elimination phases. 753
754
3.3.4 Soil and Tissue Analysis 755
Soil samples were air-dried and then sieved (<1 mm) and homogenized before 756
being divided for either total Cu or extractable Cu2+ analysis. Total Cu in soils was 757
measured by acid digestion (ACS grade nitric acid (5 mL of 5% solution) and hydrochloric 758
acid (5 mL of 5% solution)) of soil samples (~0.5 g), followed by inductively coupled 759
plasma-mass spectrometry (ICP-MS) via a commercial laboratory (Maxxam Analytics, 760
Ottawa, Canada); the reportable detection limit was 0.5 µg/g. Soil extracts for Cu2+ ion 761
measurements were prepared by extracting sub-samples of soil with 0.01 M potassium nitrite 762
(KNO3) in a 1:5 soil to extractant ratio. The slurry was mixed using a rotary mixer at 35 rpm 763
for 2 h, and the samples were then centrifuged at 8000xg for 30 min. The electrochemical 764
potential and pH were measured in the filtered (0.45 µm nylon) supernatant of each extract. 765
Extractable Cu2+ was measured using an IonPlus series model 9629 cupric ion selective 766
electrode (ISE) (Orion Research Inc.) attached to a voltmeter (Accument® XL50, Fisher 767
Scientific Inc.) as described in section 2.3.5. 768
Earthworms sampled during bioaccumulation testing were depurated for 24 h in the 769
dark on a moistened filter paper, then individually frozen at -20°C before being lyophilized 770
(Labconco FreeZone) in preparation for total Cu analysis in tissues. Total Cu in tissues was 771
performed in-house by acid digestion and analysis via ICP-MS. The masses of lyophilized 772
worms were recorded (to 0.001 g), 2 mL of HNO3 was added to each tube containing a 773
worm and, heated to 110°C for 5 h. The digested tissue was then cooled and the diluted to 774
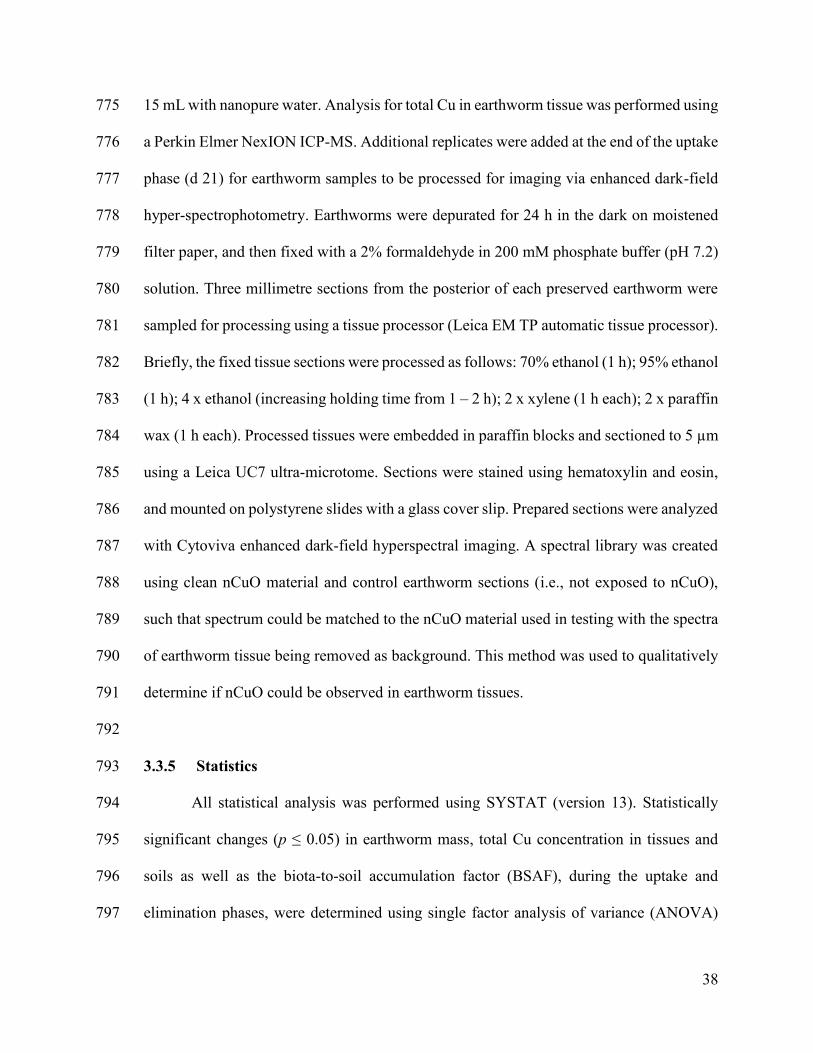
38
15 mL with nanopure water. Analysis for total Cu in earthworm tissue was performed using 775
a Perkin Elmer NexION ICP-MS. Additional replicates were added at the end of the uptake 776
phase (d 21) for earthworm samples to be processed for imaging via enhanced dark-field 777
hyper-spectrophotometry. Earthworms were depurated for 24 h in the dark on moistened 778
filter paper, and then fixed with a 2% formaldehyde in 200 mM phosphate buffer (pH 7.2) 779
solution. Three millimetre sections from the posterior of each preserved earthworm were 780
sampled for processing using a tissue processor (Leica EM TP automatic tissue processor). 781
Briefly, the fixed tissue sections were processed as follows: 70% ethanol (1 h); 95% ethanol 782
(1 h); 4 x ethanol (increasing holding time from 1 – 2 h); 2 x xylene (1 h each); 2 x paraffin 783
wax (1 h each). Processed tissues were embedded in paraffin blocks and sectioned to 5 µm 784
using a Leica UC7 ultra-microtome. Sections were stained using hematoxylin and eosin, 785
and mounted on polystyrene slides with a glass cover slip. Prepared sections were analyzed 786
with Cytoviva enhanced dark-field hyperspectral imaging. A spectral library was created 787
using clean nCuO material and control earthworm sections (i.e., not exposed to nCuO), 788
such that spectrum could be matched to the nCuO material used in testing with the spectra 789
of earthworm tissue being removed as background. This method was used to qualitatively 790
determine if nCuO could be observed in earthworm tissues. 791
792
3.3.5 Statistics 793
All statistical analysis was performed using SYSTAT (version 13). Statistically 794
significant changes (p ≤ 0.05) in earthworm mass, total Cu concentration in tissues and 795
soils as well as the biota-to-soil accumulation factor (BSAF), during the uptake and 796
elimination phases, were determined using single factor analysis of variance (ANOVA) 797
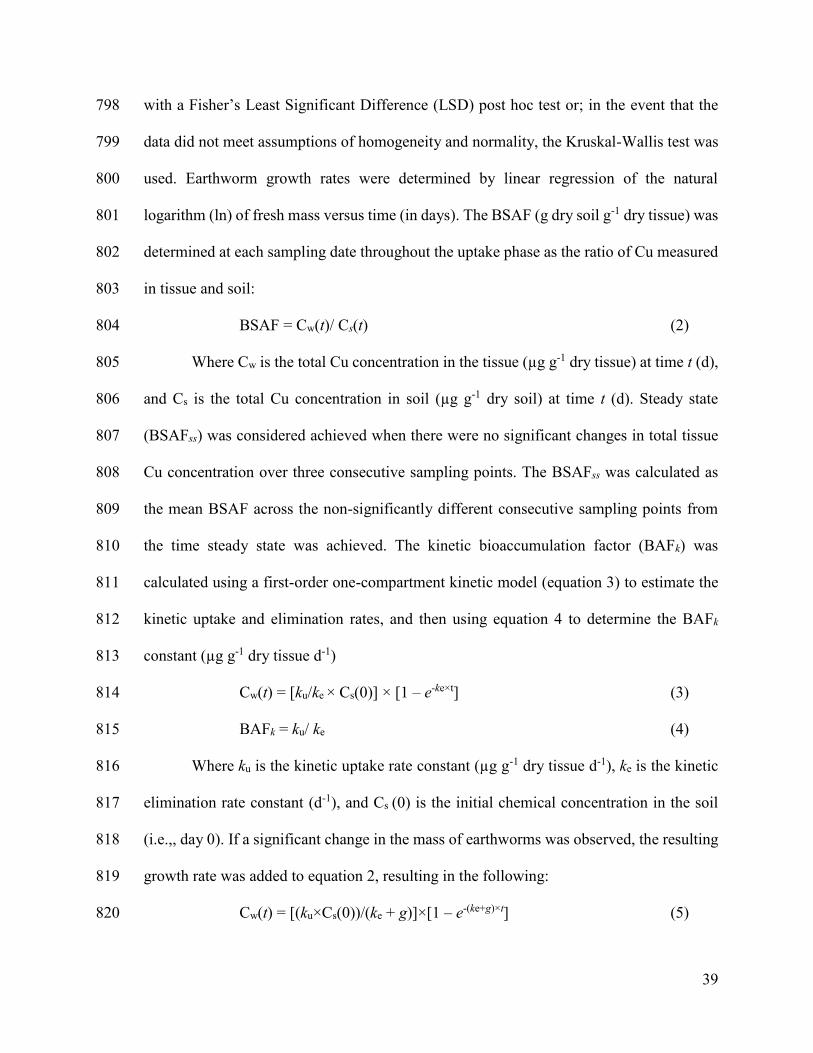
39
with a Fisher’s Least Significant Difference (LSD) post hoc test or; in the event that the 798
data did not meet assumptions of homogeneity and normality, the Kruskal-Wallis test was 799
used. Earthworm growth rates were determined by linear regression of the natural 800
logarithm (ln) of fresh mass versus time (in days). The BSAF (g dry soil g-1 dry tissue) was 801
determined at each sampling date throughout the uptake phase as the ratio of Cu measured 802
in tissue and soil: 803
BSAF = Cw(t)/ Cs(t) (2) 804
Where Cw is the total Cu concentration in the tissue (µg g-1 dry tissue) at time t (d), 805
and Cs is the total Cu concentration in soil (µg g-1 dry soil) at time t (d). Steady state 806
(BSAFss) was considered achieved when there were no significant changes in total tissue 807
Cu concentration over three consecutive sampling points. The BSAFss was calculated as 808
the mean BSAF across the non-significantly different consecutive sampling points from 809
the time steady state was achieved. The kinetic bioaccumulation factor (BAFk) was 810
calculated using a first-order one-compartment kinetic model (equation 3) to estimate the 811
kinetic uptake and elimination rates, and then using equation 4 to determine the BAFk 812
constant (µg g-1 dry tissue d-1) 813
Cw(t) = [ku/ke × Cs(0)] × [1 – e-ke×t] (3) 814
BAFk = ku/ ke (4) 815
Where ku is the kinetic uptake rate constant (µg g-1 dry tissue d-1), ke is the kinetic 816
elimination rate constant (d-1), and Cs (0) is the initial chemical concentration in the soil 817
(i.e.,, day 0). If a significant change in the mass of earthworms was observed, the resulting 818
growth rate was added to equation 2, resulting in the following: 819
Cw(t) = [(ku×Cs(0))/(ke + g)]×[1 – e-(ke+g)×t] (5) 820
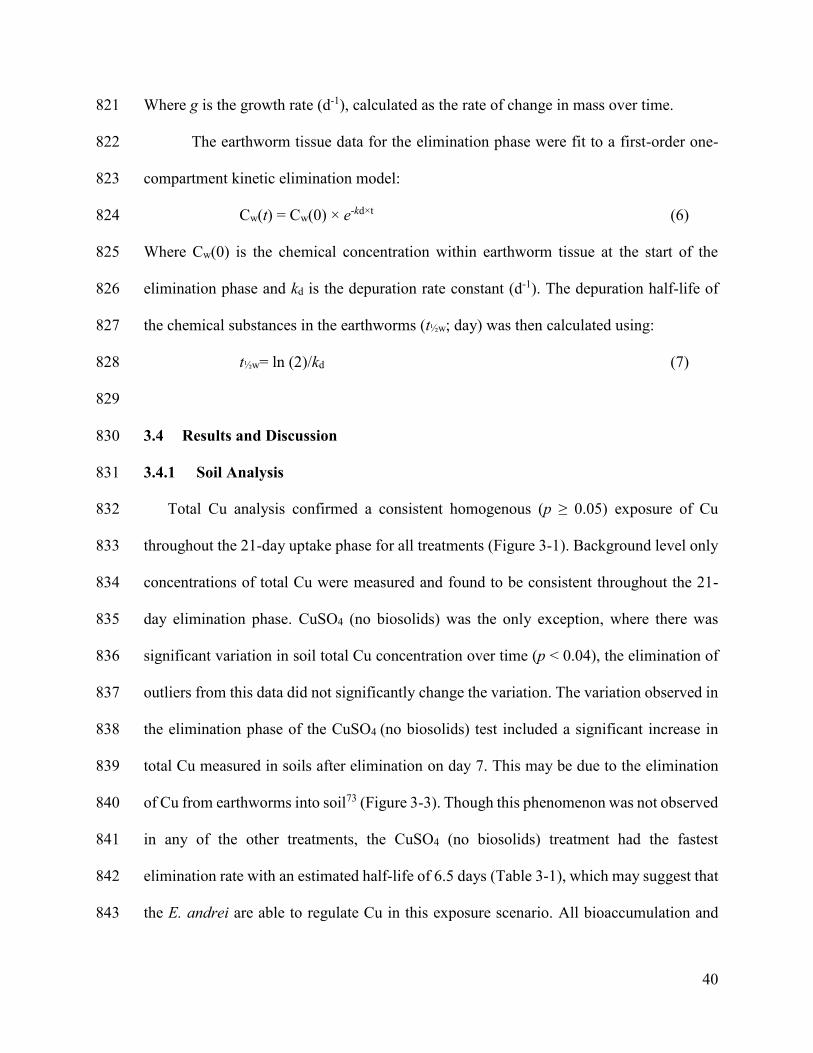
40
Where g is the growth rate (d-1), calculated as the rate of change in mass over time. 821
The earthworm tissue data for the elimination phase were fit to a first-order one-822
compartment kinetic elimination model: 823
Cw(t) = Cw(0) × e-kd×t (6) 824
Where Cw(0) is the chemical concentration within earthworm tissue at the start of the 825
elimination phase and kd is the depuration rate constant (d-1). The depuration half-life of 826
the chemical substances in the earthworms (t½w; day) was then calculated using: 827
t½w= ln (2)/kd (7) 828
829
3.4 Results and Discussion 830
3.4.1 Soil Analysis 831
Total Cu analysis confirmed a consistent homogenous (p ≥ 0.05) exposure of Cu 832
throughout the 21-day uptake phase for all treatments (Figure 3-1). Background level only 833
concentrations of total Cu were measured and found to be consistent throughout the 21-834
day elimination phase. CuSO4 (no biosolids) was the only exception, where there was 835
significant variation in soil total Cu concentration over time (p < 0.04), the elimination of 836
outliers from this data did not significantly change the variation. The variation observed in 837
the elimination phase of the CuSO4 (no biosolids) test included a significant increase in 838
total Cu measured in soils after elimination on day 7. This may be due to the elimination 839
of Cu from earthworms into soil73 (Figure 3-3). Though this phenomenon was not observed 840
in any of the other treatments, the CuSO4 (no biosolids) treatment had the fastest 841
elimination rate with an estimated half-life of 6.5 days (Table 3-1), which may suggest that 842
the E. andrei are able to regulate Cu in this exposure scenario. All bioaccumulation and 843
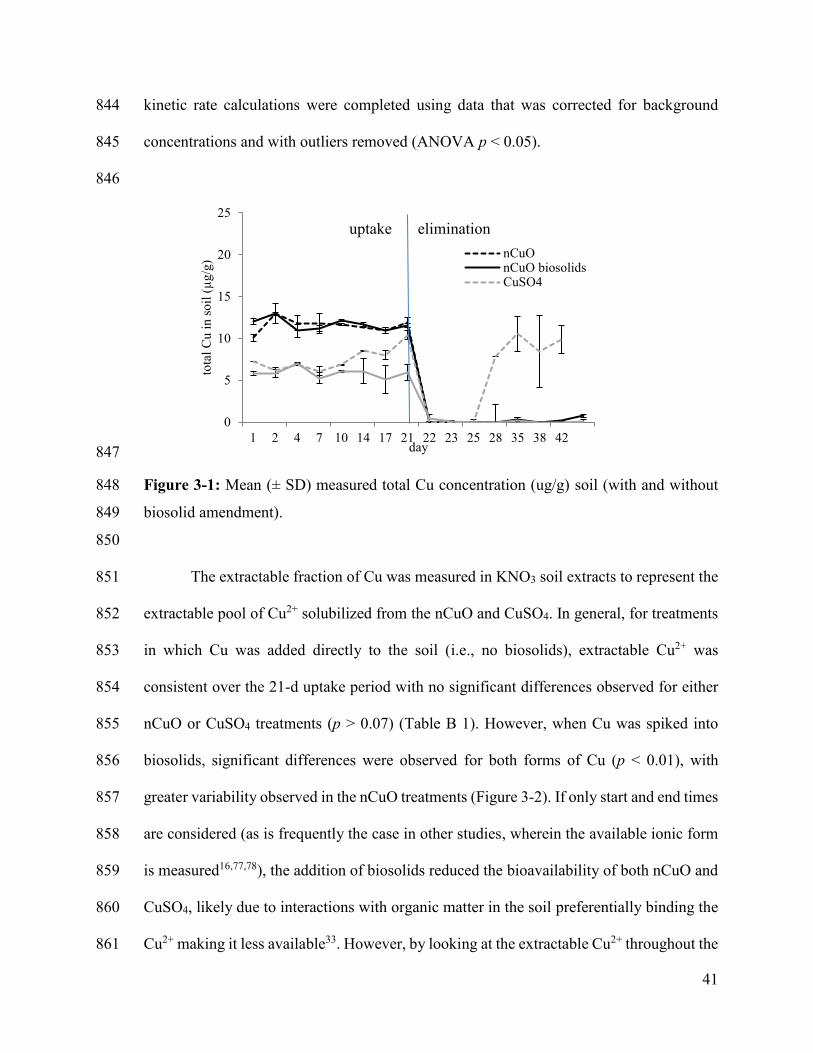
41
kinetic rate calculations were completed using data that was corrected for background 844
concentrations and with outliers removed (ANOVA p < 0.05). 845
846
847
Figure 3-1: Mean (± SD) measured total Cu concentration (ug/g) soil (with and without 848
biosolid amendment). 849
850
The extractable fraction of Cu was measured in KNO3 soil extracts to represent the 851
extractable pool of Cu2+ solubilized from the nCuO and CuSO4. In general, for treatments 852
in which Cu was added directly to the soil (i.e., no biosolids), extractable Cu2+ was 853
consistent over the 21-d uptake period with no significant differences observed for either 854
nCuO or CuSO4 treatments (p > 0.07) (Table B 1). However, when Cu was spiked into 855
biosolids, significant differences were observed for both forms of Cu (p < 0.01), with 856
greater variability observed in the nCuO treatments (Figure 3-2). If only start and end times 857
are considered (as is frequently the case in other studies, wherein the available ionic form 858
is measured16,77,78), the addition of biosolids reduced the bioavailability of both nCuO and 859
CuSO4, likely due to interactions with organic matter in the soil preferentially binding the 860
Cu2+ making it less available33. However, by looking at the extractable Cu2+ throughout the 861
0
5
10
15
20
25
1 2 4 7 10 14 17 21 22 23 25 28 35 38 42
tota
l C
u i
n s
oil
(µ
g/g
)
day
nCuOnCuO biosolidsCuSO4
uptake elimination
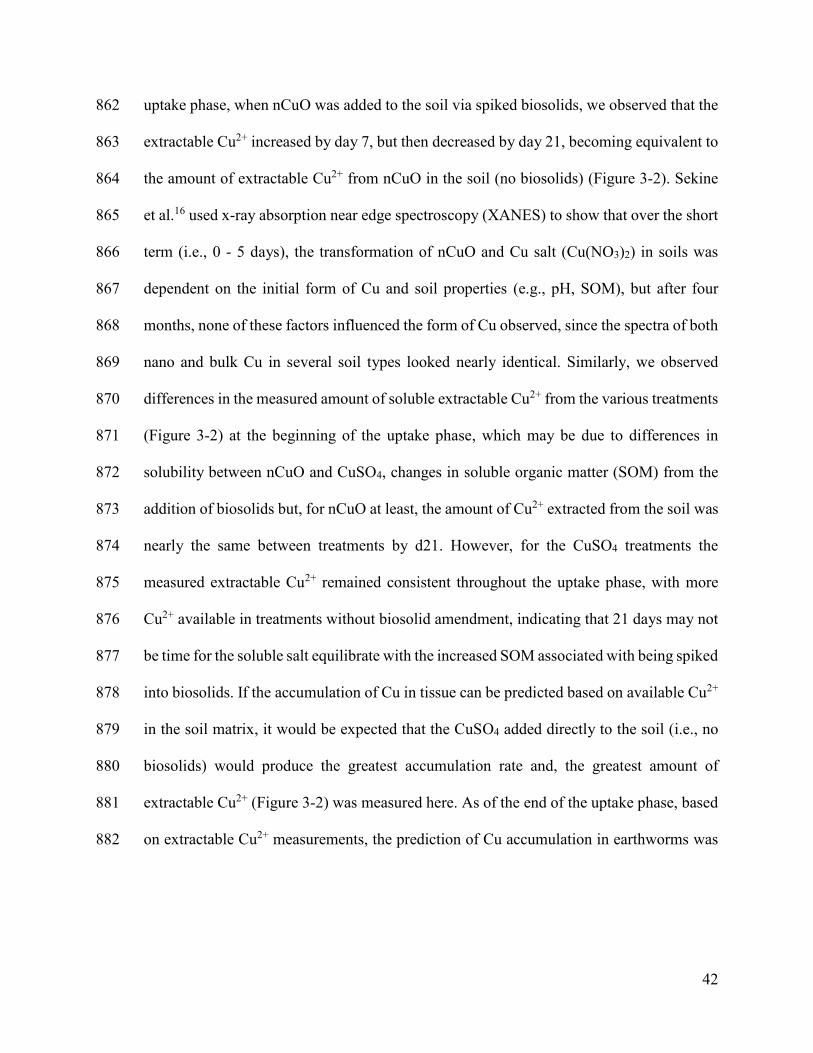
42
uptake phase, when nCuO was added to the soil via spiked biosolids, we observed that the 862
extractable Cu2+ increased by day 7, but then decreased by day 21, becoming equivalent to 863
the amount of extractable Cu2+ from nCuO in the soil (no biosolids) (Figure 3-2). Sekine 864
et al.16 used x-ray absorption near edge spectroscopy (XANES) to show that over the short 865
term (i.e., 0 - 5 days), the transformation of nCuO and Cu salt (Cu(NO3)2) in soils was 866
dependent on the initial form of Cu and soil properties (e.g., pH, SOM), but after four 867
months, none of these factors influenced the form of Cu observed, since the spectra of both 868
nano and bulk Cu in several soil types looked nearly identical. Similarly, we observed 869
differences in the measured amount of soluble extractable Cu2+ from the various treatments 870
(Figure 3-2) at the beginning of the uptake phase, which may be due to differences in 871
solubility between nCuO and CuSO4, changes in soluble organic matter (SOM) from the 872
addition of biosolids but, for nCuO at least, the amount of Cu2+ extracted from the soil was 873
nearly the same between treatments by d21. However, for the CuSO4 treatments the 874
measured extractable Cu2+ remained consistent throughout the uptake phase, with more 875
Cu2+ available in treatments without biosolid amendment, indicating that 21 days may not 876
be time for the soluble salt equilibrate with the increased SOM associated with being spiked 877
into biosolids. If the accumulation of Cu in tissue can be predicted based on available Cu2+ 878
in the soil matrix, it would be expected that the CuSO4 added directly to the soil (i.e., no 879
biosolids) would produce the greatest accumulation rate and, the greatest amount of 880
extractable Cu2+ (Figure 3-2) was measured here. As of the end of the uptake phase, based 881
on extractable Cu2+ measurements, the prediction of Cu accumulation in earthworms was 882
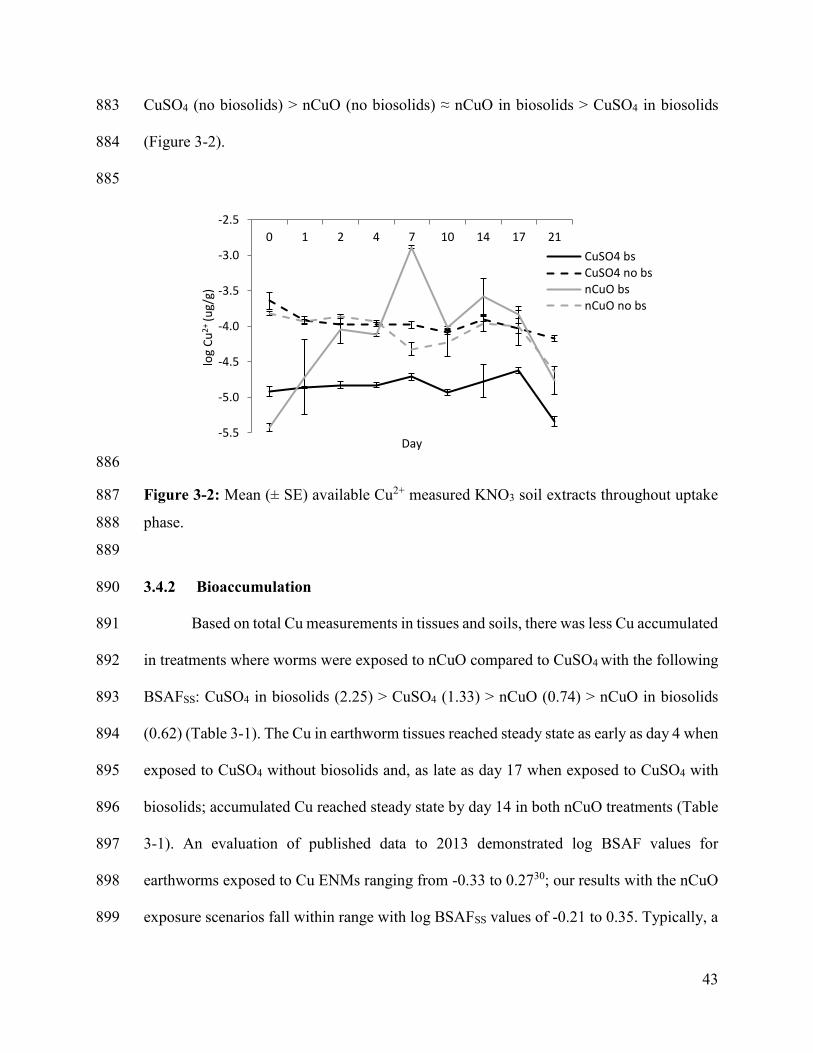
43
CuSO4 (no biosolids) > nCuO (no biosolids) ≈ nCuO in biosolids > CuSO4 in biosolids 883
(Figure 3-2). 884
885
886
Figure 3-2: Mean (± SE) available Cu2+ measured KNO3 soil extracts throughout uptake 887
phase. 888
889
3.4.2 Bioaccumulation 890
Based on total Cu measurements in tissues and soils, there was less Cu accumulated 891
in treatments where worms were exposed to nCuO compared to CuSO4 with the following 892
BSAFSS: CuSO4 in biosolids (2.25) > CuSO4 (1.33) > nCuO (0.74) > nCuO in biosolids 893
(0.62) (Table 3-1). The Cu in earthworm tissues reached steady state as early as day 4 when 894
exposed to CuSO4 without biosolids and, as late as day 17 when exposed to CuSO4 with 895
biosolids; accumulated Cu reached steady state by day 14 in both nCuO treatments (Table 896
3-1). An evaluation of published data to 2013 demonstrated log BSAF values for 897
earthworms exposed to Cu ENMs ranging from -0.33 to 0.2730; our results with the nCuO 898
exposure scenarios fall within range with log BSAFSS values of -0.21 to 0.35. Typically, a 899
-5.5
-5.0
-4.5
-4.0
-3.5
-3.0
-2.5
0 1 2 4 7 10 14 17 21
log
Cu
2+ (u
g/g)
Day
CuSO4 bsCuSO4 no bsnCuO bsnCuO no bs
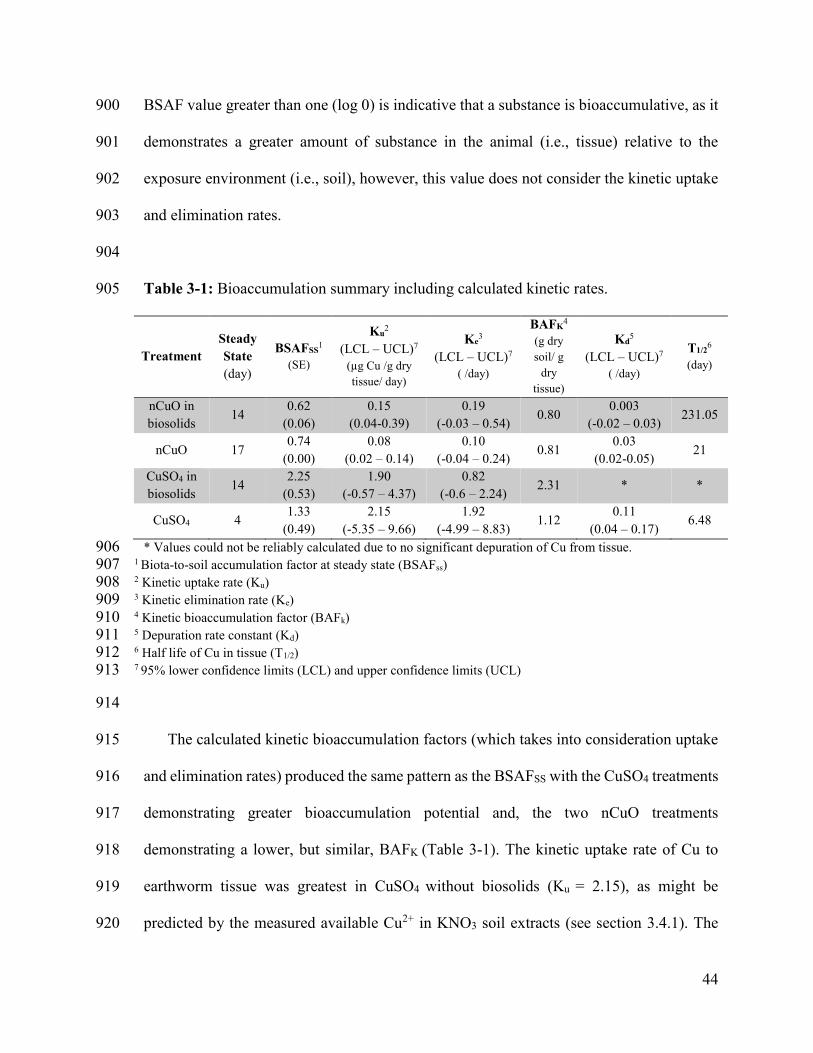
44
BSAF value greater than one (log 0) is indicative that a substance is bioaccumulative, as it 900
demonstrates a greater amount of substance in the animal (i.e., tissue) relative to the 901
exposure environment (i.e., soil), however, this value does not consider the kinetic uptake 902
and elimination rates. 903
904
Table 3-1: Bioaccumulation summary including calculated kinetic rates. 905
Treatment
Steady
State
(day)
BSAFSS1
(SE)
Ku2
(LCL – UCL)7
(µg Cu /g dry
tissue/ day)
Ke3
(LCL – UCL)7
( /day)
BAFK4
(g dry
soil/ g
dry
tissue)
Kd5
(LCL – UCL)7
( /day)
T1/26
(day)
nCuO in
biosolids 14
0.62
(0.06)
0.15
(0.04-0.39)
0.19
(-0.03 – 0.54) 0.80
0.003
(-0.02 – 0.03) 231.05
nCuO 17 0.74
(0.00)
0.08
(0.02 – 0.14)
0.10
(-0.04 – 0.24) 0.81
0.03
(0.02-0.05) 21
CuSO4 in
biosolids 14
2.25
(0.53)
1.90
(-0.57 – 4.37)
0.82
(-0.6 – 2.24) 2.31 * *
CuSO4 4 1.33
(0.49)
2.15
(-5.35 – 9.66)
1.92
(-4.99 – 8.83) 1.12
0.11
(0.04 – 0.17) 6.48
* Values could not be reliably calculated due to no significant depuration of Cu from tissue. 906 1 Biota-to-soil accumulation factor at steady state (BSAFss) 907 2 Kinetic uptake rate (Ku) 908 3 Kinetic elimination rate (Ke) 909 4 Kinetic bioaccumulation factor (BAFk) 910 5 Depuration rate constant (Kd) 911 6 Half life of Cu in tissue (T1/2) 912 7 95% lower confidence limits (LCL) and upper confidence limits (UCL) 913
914
The calculated kinetic bioaccumulation factors (which takes into consideration uptake 915
and elimination rates) produced the same pattern as the BSAFSS with the CuSO4 treatments 916
demonstrating greater bioaccumulation potential and, the two nCuO treatments 917
demonstrating a lower, but similar, BAFK (Table 3-1). The kinetic uptake rate of Cu to 918
earthworm tissue was greatest in CuSO4 without biosolids (Ku = 2.15), as might be 919
predicted by the measured available Cu2+ in KNO3 soil extracts (see section 3.4.1). The 920
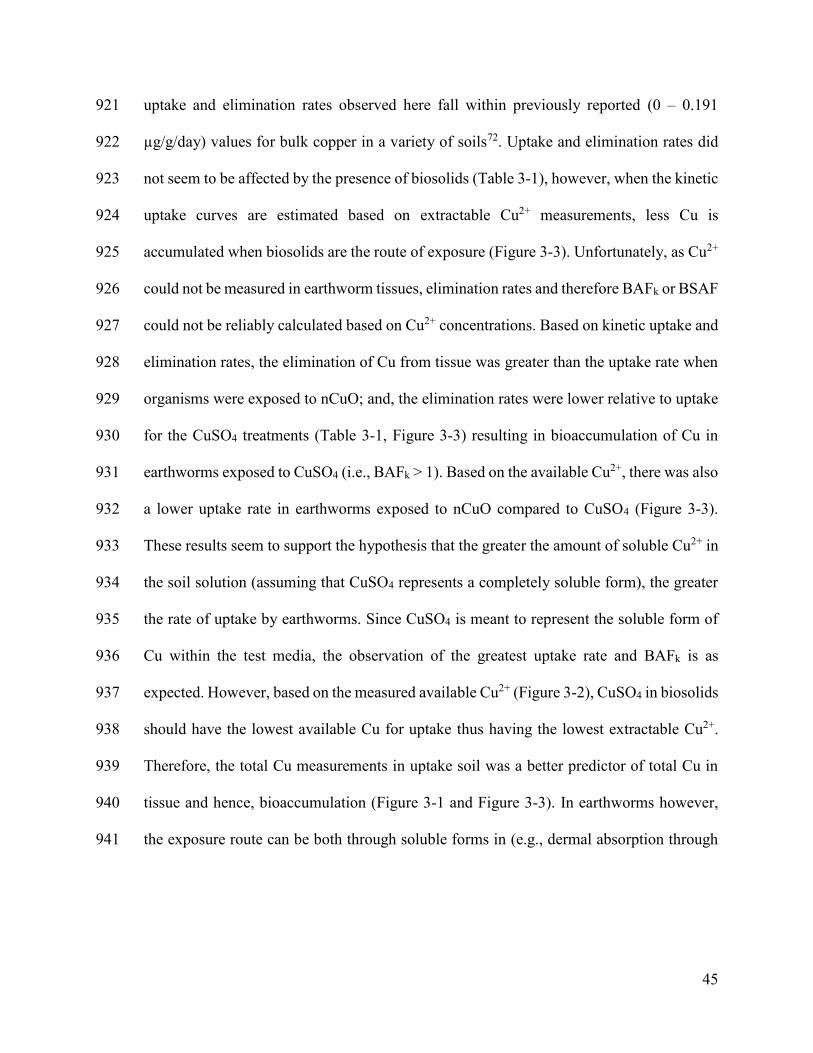
45
uptake and elimination rates observed here fall within previously reported (0 – 0.191 921
µg/g/day) values for bulk copper in a variety of soils72. Uptake and elimination rates did 922
not seem to be affected by the presence of biosolids (Table 3-1), however, when the kinetic 923
uptake curves are estimated based on extractable Cu2+ measurements, less Cu is 924
accumulated when biosolids are the route of exposure (Figure 3-3). Unfortunately, as Cu2+ 925
could not be measured in earthworm tissues, elimination rates and therefore BAFk or BSAF 926
could not be reliably calculated based on Cu2+ concentrations. Based on kinetic uptake and 927
elimination rates, the elimination of Cu from tissue was greater than the uptake rate when 928
organisms were exposed to nCuO; and, the elimination rates were lower relative to uptake 929
for the CuSO4 treatments (Table 3-1, Figure 3-3) resulting in bioaccumulation of Cu in 930
earthworms exposed to CuSO4 (i.e., BAFk > 1). Based on the available Cu2+, there was also 931
a lower uptake rate in earthworms exposed to nCuO compared to CuSO4 (Figure 3-3). 932
These results seem to support the hypothesis that the greater the amount of soluble Cu2+ in 933
the soil solution (assuming that CuSO4 represents a completely soluble form), the greater 934
the rate of uptake by earthworms. Since CuSO4 is meant to represent the soluble form of 935
Cu within the test media, the observation of the greatest uptake rate and BAFk is as 936
expected. However, based on the measured available Cu2+ (Figure 3-2), CuSO4 in biosolids 937
should have the lowest available Cu for uptake thus having the lowest extractable Cu2+. 938
Therefore, the total Cu measurements in uptake soil was a better predictor of total Cu in 939
tissue and hence, bioaccumulation (Figure 3-1 and Figure 3-3). In earthworms however, 940
the exposure route can be both through soluble forms in (e.g., dermal absorption through 941
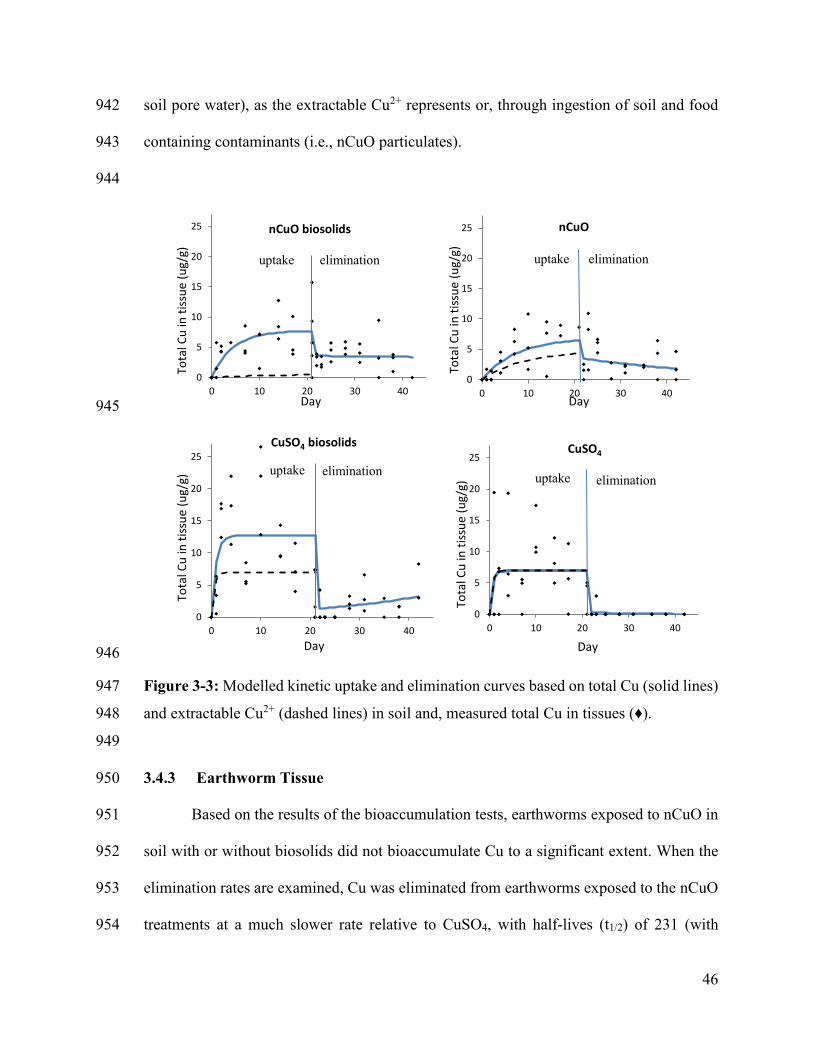
46
soil pore water), as the extractable Cu2+ represents or, through ingestion of soil and food 942
containing contaminants (i.e., nCuO particulates). 943
944
945
946
Figure 3-3: Modelled kinetic uptake and elimination curves based on total Cu (solid lines) 947
and extractable Cu2+ (dashed lines) in soil and, measured total Cu in tissues (♦). 948
949
3.4.3 Earthworm Tissue 950
Based on the results of the bioaccumulation tests, earthworms exposed to nCuO in 951
soil with or without biosolids did not bioaccumulate Cu to a significant extent. When the 952
elimination rates are examined, Cu was eliminated from earthworms exposed to the nCuO 953
treatments at a much slower rate relative to CuSO4, with half-lives (t1/2) of 231 (with 954
0
5
10
15
20
25
0 10 20 30 40
Tota
l Cu
in t
issu
e (u
g/g)
Day
nCuO biosolids
uptake elimination
0
5
10
15
20
25
0 10 20 30 40
Tota
l Cu
in t
issu
e (u
g/g)
Day
nCuO
uptake elimination
0
5
10
15
20
25
0 10 20 30 40
Tota
l Cu
in t
issu
e (u
g/g)
Day
CuSO4 biosolids
uptake elimination
0
5
10
15
20
25
0 10 20 30 40
Tota
l Cu
in t
issu
e (u
g/g)
Day
CuSO4
uptake elimination
47
biosolids) and 21 (without biosolids) days. Other authors have presented evidence that 955
despite lower or no difference in the BSAF of metallic ENM compared to their bulk 956
counterparts, there may be uptake of the ENM into soil invertebrate tissues30. If ENM are 957
within tissue, it may result in a slow release of the base material (i.e., Cu2+) and prolong or 958
delay the potential for toxicity, sometimes referred to as the Trojan horse effect2. 959
To determine if nCuO was taken up into earthworm tissue throughout the uptake 960
phase of this study, tissues from day 21 of the nCuO treatment without biosolid amendment 961
were preserved and processed for analysis with enhanced dark field hyperspectral imaging. 962
Through this method, contaminated tissue samples were compared with control tissues and 963
with the nCuO material on its own (i.e., pristine), resulting in images in which only areas 964
that contain the spectrum matching nCuO are highlighted (Figure 3-4). The resulting 965
images provide evidence that nCuO was taken into E. andrei tissue intact, with nearly all 966
associated with the gut or epidermis (i.e., C and D - Figure 3-3 and Figure 3-4) when 967
compared to muscle (Figure 3-3 and Figure 3-4 – B) or chloragogenous tissues (Figure 3-3 968
Figure 3-4 – A), these areas were looked on as they are the most likely tissues to accumulate 969
metals. Copper ENM have previously been shown to associate with epidermis cells in the 970
earthworm E. fetida when exposed to nCuO in a standard reference field soil (Lufa 2.2)78. 971
Despite depurating, the earthworms for 24 h, processing the tissue for thin sectioning and 972
embedding in paraffin wax particles of soil and nCuO were still observed in the gut of the 973
worm in the study presented here. It has previously been demonstrated that 24 h should be 974
sufficient to depurate Cu from contaminated E. andrei, but that there is no way to 975
completely eliminate all soil particles (and therefore, associated nCuO) from the animals73. 976
If the nCuO were accumulating in earthworm tissue through the gut, it would likely be 977
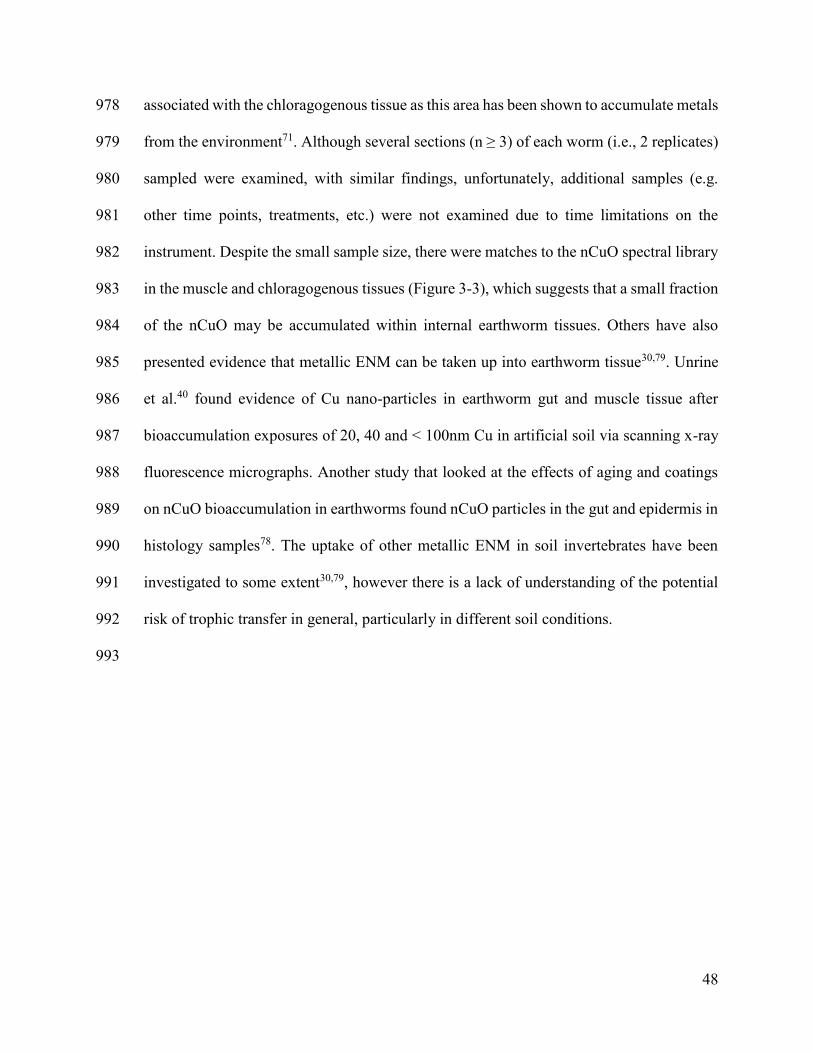
48
associated with the chloragogenous tissue as this area has been shown to accumulate metals 978
from the environment71. Although several sections (n ≥ 3) of each worm (i.e., 2 replicates) 979
sampled were examined, with similar findings, unfortunately, additional samples (e.g. 980
other time points, treatments, etc.) were not examined due to time limitations on the 981
instrument. Despite the small sample size, there were matches to the nCuO spectral library 982
in the muscle and chloragogenous tissues (Figure 3-3), which suggests that a small fraction 983
of the nCuO may be accumulated within internal earthworm tissues. Others have also 984
presented evidence that metallic ENM can be taken up into earthworm tissue30,79. Unrine 985
et al.40 found evidence of Cu nano-particles in earthworm gut and muscle tissue after 986
bioaccumulation exposures of 20, 40 and < 100nm Cu in artificial soil via scanning x-ray 987
fluorescence micrographs. Another study that looked at the effects of aging and coatings 988
on nCuO bioaccumulation in earthworms found nCuO particles in the gut and epidermis in 989
histology samples78. The uptake of other metallic ENM in soil invertebrates have been 990
investigated to some extent30,79, however there is a lack of understanding of the potential 991
risk of trophic transfer in general, particularly in different soil conditions. 992
993
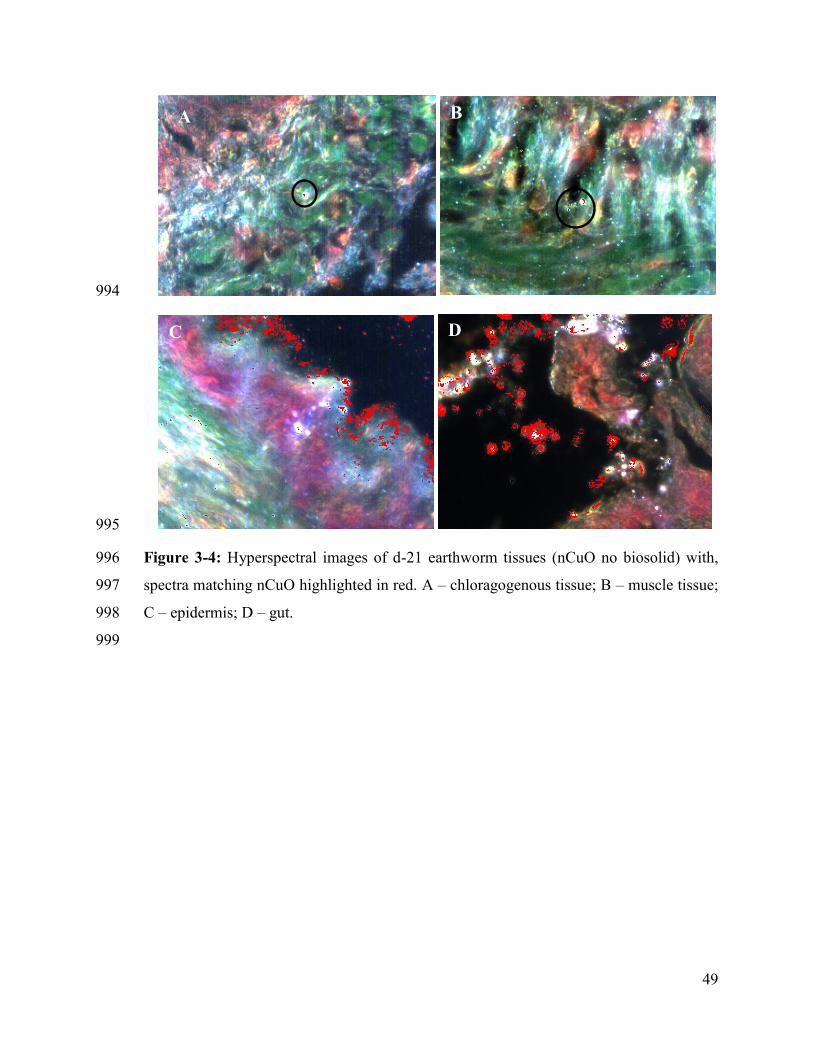
49
994
995
Figure 3-4: Hyperspectral images of d-21 earthworm tissues (nCuO no biosolid) with, 996
spectra matching nCuO highlighted in red. A – chloragogenous tissue; B – muscle tissue; 997
C – epidermis; D – gut. 998
999
A
C
B
D
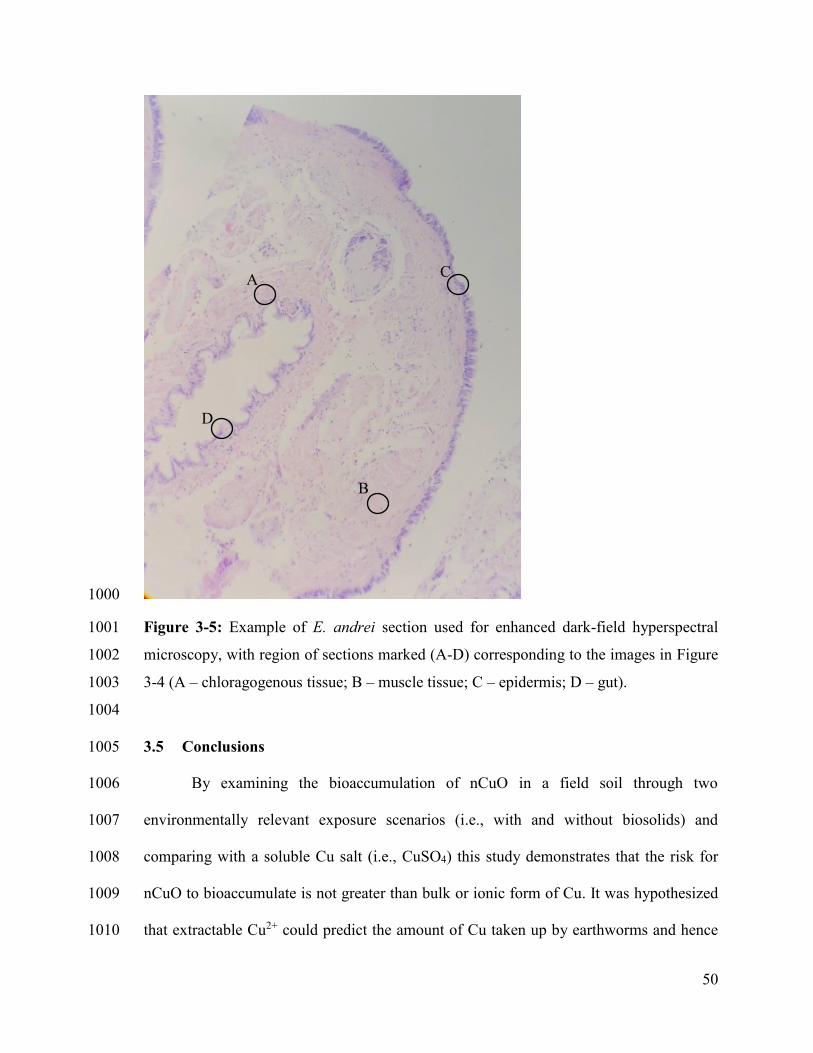
50
1000
Figure 3-5: Example of E. andrei section used for enhanced dark-field hyperspectral 1001
microscopy, with region of sections marked (A-D) corresponding to the images in Figure 1002
3-4 (A – chloragogenous tissue; B – muscle tissue; C – epidermis; D – gut). 1003
1004
3.5 Conclusions 1005
By examining the bioaccumulation of nCuO in a field soil through two 1006
environmentally relevant exposure scenarios (i.e., with and without biosolids) and 1007
comparing with a soluble Cu salt (i.e., CuSO4) this study demonstrates that the risk for 1008
nCuO to bioaccumulate is not greater than bulk or ionic form of Cu. It was hypothesized 1009
that extractable Cu2+ could predict the amount of Cu taken up by earthworms and hence 1010
A
B
C
D
51
the biota-to-soil accumulation factor (BSAF), however this was found not to be true. 1011
Though the presence of biosolids did not significantly affect the estimated BSAF or kinetic 1012
bioaccumulation rates (BAFk) for either nCuO or CuSO4, it did influence the stability and 1013
concentration of measured Cu2+ in uptake phase soil extracts. Earthworms are known to be 1014
able to regulate copper72 and evidence of regulation is seen here in the nCuO treatments 1015
through higher kinetic elimination rates compared to uptake rates and the ability to 1016
maintain low levels of internal body Cu concentration. Despite the low (< 1) BAFk 1017
estimates for nCuO in this study, evidence of nCuO particles taken up into earthworm 1018
tissues was observed by d21, the majority of which was associated with the epidermis or 1019
gut of the earthworm, but a small amount was also seen in muscle and chloragogenous 1020
tissue. This indicates that nano-particles taken up from soils are translocated in E. andrei 1021
for storage (over the long-term); unfortunately, the enhanced dark-field hyperspectral 1022
imaging technique used to identify nCuO particles in earthworm tissues is not quantitative. 1023
Future work is required to better understand the effects metallic ENM have once taken up 1024
into tissue and see if these materials pose a risk for trophic transfer, over a longer time-1025
period or if they are regulated similarly to bulk Cu in earthworms. 1026
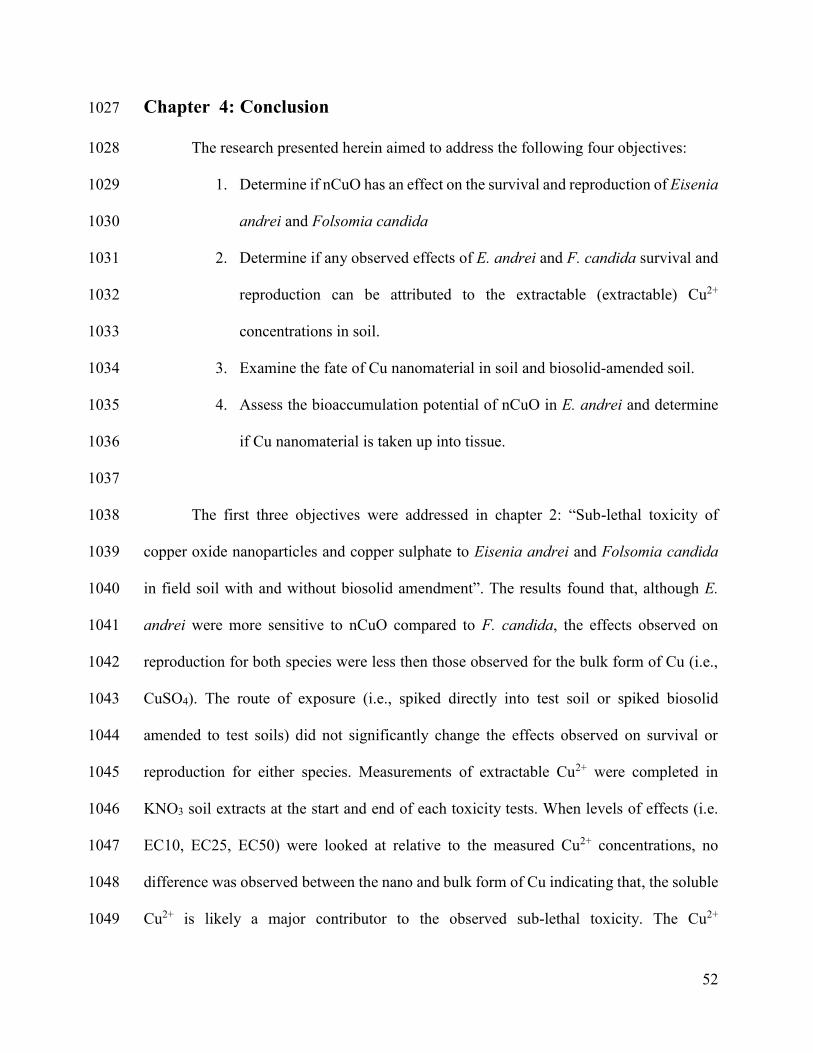
52
Chapter 4: Conclusion 1027
The research presented herein aimed to address the following four objectives: 1028
1. Determine if nCuO has an effect on the survival and reproduction of Eisenia 1029
andrei and Folsomia candida 1030
2. Determine if any observed effects of E. andrei and F. candida survival and 1031
reproduction can be attributed to the extractable (extractable) Cu2+ 1032
concentrations in soil. 1033
3. Examine the fate of Cu nanomaterial in soil and biosolid-amended soil. 1034
4. Assess the bioaccumulation potential of nCuO in E. andrei and determine 1035
if Cu nanomaterial is taken up into tissue. 1036
1037
The first three objectives were addressed in chapter 2: “Sub-lethal toxicity of 1038
copper oxide nanoparticles and copper sulphate to Eisenia andrei and Folsomia candida 1039
in field soil with and without biosolid amendment”. The results found that, although E. 1040
andrei were more sensitive to nCuO compared to F. candida, the effects observed on 1041
reproduction for both species were less then those observed for the bulk form of Cu (i.e., 1042
CuSO4). The route of exposure (i.e., spiked directly into test soil or spiked biosolid 1043
amended to test soils) did not significantly change the effects observed on survival or 1044
reproduction for either species. Measurements of extractable Cu2+ were completed in 1045
KNO3 soil extracts at the start and end of each toxicity tests. When levels of effects (i.e. 1046
EC10, EC25, EC50) were looked at relative to the measured Cu2+ concentrations, no 1047
difference was observed between the nano and bulk form of Cu indicating that, the soluble 1048
Cu2+ is likely a major contributor to the observed sub-lethal toxicity. The Cu2+ 1049
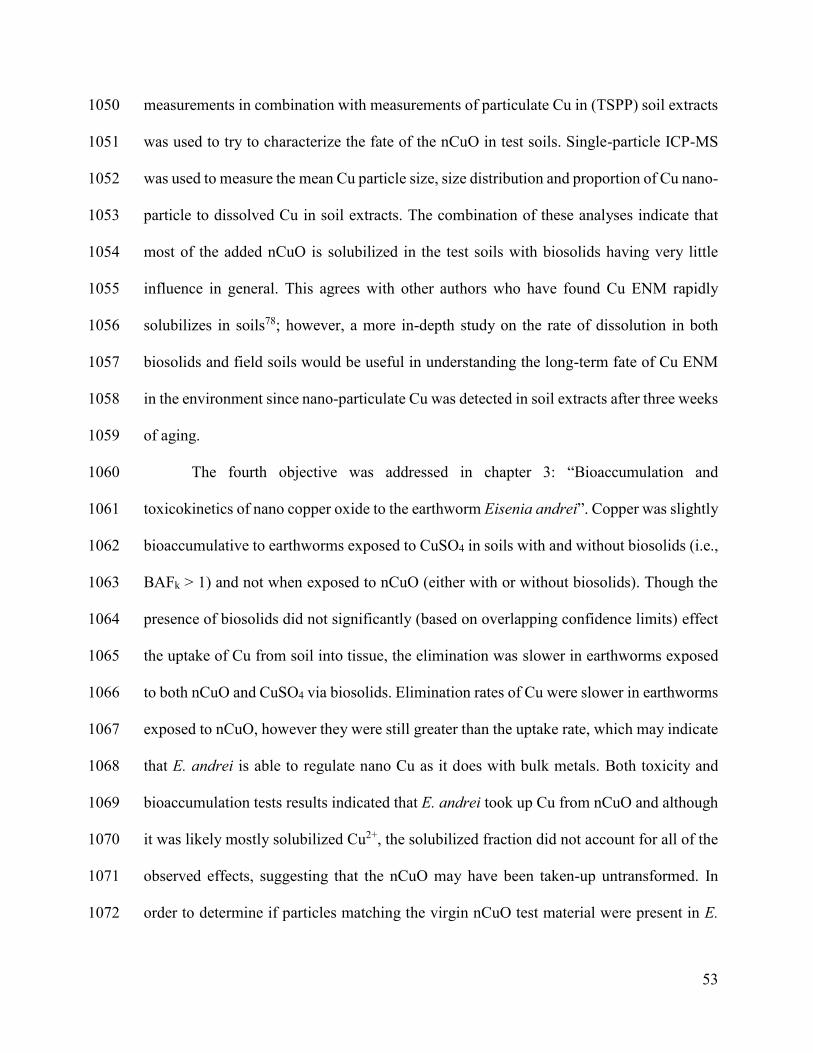
53
measurements in combination with measurements of particulate Cu in (TSPP) soil extracts 1050
was used to try to characterize the fate of the nCuO in test soils. Single-particle ICP-MS 1051
was used to measure the mean Cu particle size, size distribution and proportion of Cu nano-1052
particle to dissolved Cu in soil extracts. The combination of these analyses indicate that 1053
most of the added nCuO is solubilized in the test soils with biosolids having very little 1054
influence in general. This agrees with other authors who have found Cu ENM rapidly 1055
solubilizes in soils78; however, a more in-depth study on the rate of dissolution in both 1056
biosolids and field soils would be useful in understanding the long-term fate of Cu ENM 1057
in the environment since nano-particulate Cu was detected in soil extracts after three weeks 1058
of aging. 1059
The fourth objective was addressed in chapter 3: “Bioaccumulation and 1060
toxicokinetics of nano copper oxide to the earthworm Eisenia andrei”. Copper was slightly 1061
bioaccumulative to earthworms exposed to CuSO4 in soils with and without biosolids (i.e., 1062
BAFk > 1) and not when exposed to nCuO (either with or without biosolids). Though the 1063
presence of biosolids did not significantly (based on overlapping confidence limits) effect 1064
the uptake of Cu from soil into tissue, the elimination was slower in earthworms exposed 1065
to both nCuO and CuSO4 via biosolids. Elimination rates of Cu were slower in earthworms 1066
exposed to nCuO, however they were still greater than the uptake rate, which may indicate 1067
that E. andrei is able to regulate nano Cu as it does with bulk metals. Both toxicity and 1068
bioaccumulation tests results indicated that E. andrei took up Cu from nCuO and although 1069
it was likely mostly solubilized Cu2+, the solubilized fraction did not account for all of the 1070
observed effects, suggesting that the nCuO may have been taken-up untransformed. In 1071
order to determine if particles matching the virgin nCuO test material were present in E. 1072
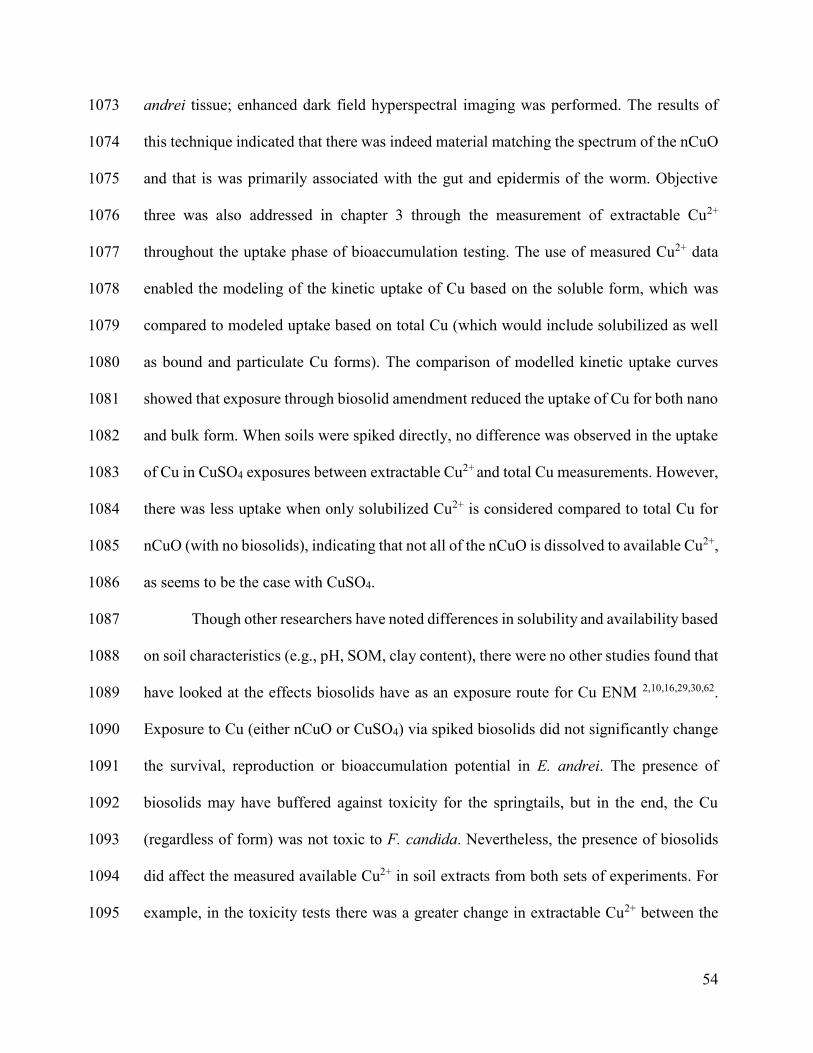
54
andrei tissue; enhanced dark field hyperspectral imaging was performed. The results of 1073
this technique indicated that there was indeed material matching the spectrum of the nCuO 1074
and that is was primarily associated with the gut and epidermis of the worm. Objective 1075
three was also addressed in chapter 3 through the measurement of extractable Cu2+ 1076
throughout the uptake phase of bioaccumulation testing. The use of measured Cu2+ data 1077
enabled the modeling of the kinetic uptake of Cu based on the soluble form, which was 1078
compared to modeled uptake based on total Cu (which would include solubilized as well 1079
as bound and particulate Cu forms). The comparison of modelled kinetic uptake curves 1080
showed that exposure through biosolid amendment reduced the uptake of Cu for both nano 1081
and bulk form. When soils were spiked directly, no difference was observed in the uptake 1082
of Cu in CuSO4 exposures between extractable Cu2+ and total Cu measurements. However, 1083
there was less uptake when only solubilized Cu2+ is considered compared to total Cu for 1084
nCuO (with no biosolids), indicating that not all of the nCuO is dissolved to available Cu2+, 1085
as seems to be the case with CuSO4. 1086
Though other researchers have noted differences in solubility and availability based 1087
on soil characteristics (e.g., pH, SOM, clay content), there were no other studies found that 1088
have looked at the effects biosolids have as an exposure route for Cu ENM 2,10,16,29,30,62. 1089
Exposure to Cu (either nCuO or CuSO4) via spiked biosolids did not significantly change 1090
the survival, reproduction or bioaccumulation potential in E. andrei. The presence of 1091
biosolids may have buffered against toxicity for the springtails, but in the end, the Cu 1092
(regardless of form) was not toxic to F. candida. Nevertheless, the presence of biosolids 1093
did affect the measured available Cu2+ in soil extracts from both sets of experiments. For 1094
example, in the toxicity tests there was a greater change in extractable Cu2+ between the 1095
55
start and end of tests (in both E. andrei and F. candida tests) when Cu was spiked into 1096
biosolids. For the bioaccumulation tests, there was greater variability in the measured Cu2+ 1097
through out the uptake phase (particularly for nCuO) when biosolids were present. The 1098
addition of biosolids did not change the percent organic matter in the test soil very much 1099
(i.e., 2.0 % without biosolids and 3.1% with biosolid amendment), and increased the pH 1100
(i.e., from 5.6 to 7.1). Nevertheless, the data presented here suggests that the ability to use 1101
extractable Cu2+ measurements to represent the available soluble form of Cu and to predict 1102
toxicity or bioaccumulation potential is likely tied to the soil conditions. 1103
Soil invertebrates represent an important part of the ecosystem, as primary 1104
consumers they play an integral role in organic decomposition and the cycling of nutrients 1105
in the soil environment. As such, soil invertebrates are frequently used in standardized 1106
toxicity studies to evaluate the health of a soil environment or the risk of a substance to the 1107
soil environment. Risk assessors rely on the data produced from these studies when making 1108
regulatory decisions. Comparison of the effects of a metallic nanomaterial to its ionic 1109
counterpart is an approach that has been previously used to determine if a nano form poses 1110
a greater risk than its soluble counterpart26,41. As current risk assessment models for metals 1111
are based on the premise that ionic activity correlates to level of risk, this study sought to 1112
evaluate the application of this approach to nCuO. The toxicity results suggest that the 1113
ionic activity of Cu from nCuO was able to predict the risk to earthworm and springtail 1114
reproductive success. However, the ionic activity could not predict the risk of 1115
bioaccumulation of Cu from nCuO in earthworms. Earthworms are known to be able to 1116
regulate copper72 and evidence of regulation is presented here. Future work is required to 1117
better understand the if earthworms regulate metallic ENM in the same way as their bulk 1118
56
counter-parts, and if metallic ENM taken up can translocate within tissue and if they 1119
represent a risk via trophic transfer. 1120
57
References 1121
(1) Lowry, G. V; Gregory, K. B.; Apte, S. C.; Lead, J. R. Transformations of 1122
Nanomaterials in the Environment - Focus Issue. Chem. Eng. News Arch. 2016, 90 1123
(45), 30. https://doi.org/10.1021/cen-09045-ad19. 1124
(2) Lead, J. R.; Batley, G. E.; Alvarez, P. J. J.; Croteau, M. N.; Handy, R. D.; 1125
McLaughlin, M. J.; Judy, J. D.; Schirmer, K. Nanomaterials in the Environment: 1126
Behavior, Fate, Bioavailability, and effects—An Updated Review. Environ. 1127
Toxicol. Chem. 2018. https://doi.org/10.1002/etc.4147. 1128
(3) Nowack, B.; Baalousha, M.; Bornhöft, N.; Chaudhry, Q.; Cornelis, G.; Cotterill, J.; 1129
Gondikas, A.; Hassellöv, M.; Lead, J.; Mitrano, D. M.; et al. Progress towards the 1130
Validation of Modeled Environmental Concentrations of Engineered 1131
Nanomaterials by Analytical Measurements. Environ. Sci. Nano 2015, 2 (5), 421–1132
428. https://doi.org/10.1039/c5en00100e. 1133
(4) Keller, A. A.; Lazareva, A. Predicted Releases of Engineered Nanomaterials: From 1134
Global to Regional to Local. Environ. Sci. Technol. Lett. 2013, 1 (1), 65–70. 1135
https://doi.org/10.1021/ez400106t. 1136
(5) Ju-Nam, Y.; Lead, J. R. Manufactured Nanoparticles: An Overview of Their 1137
Chemistry, Interactions and Potential Environmental Implications. Sci. Total 1138
Environ. 2008, 400 (1–3), 396–414. 1139
https://doi.org/10.1016/j.scitotenv.2008.06.042. 1140
(6) Andy, R. I. D. H.; Yon, D. E. Y. L.; Ahendra, S. H. M.; Aughlin, M. I. J. M. C. L.; 1141
Ead, J. A. R. L.; Klaine, S. J.; Alvarez, P. J. J.; Batley, G. E.; Fernandes, T. F.; 1142
Handy, R. D.; et al. Nanomaterials in the Environment: Behavior, Fate, 1143
58
Bioavailability, and Effects. Environ. Toxicol. Chem. 2008, 27 (9), 1825–1851. 1144
(7) Schwertfeger, D. M.; Velicogna, J. R.; Jesmer, A. H.; Saatcioglu, S.; McShane, H.; 1145
Scroggins, R. P.; Princz, J. I. Extracting Metallic Nanoparticles from Soils for 1146
Quantitative Analysis: Method Development Using Engineered Silver 1147
Nanoparticles and SP-ICP-MS. Anal. Chem. 2017, 89 (4), 2505–2513. 1148
https://doi.org/10.1021/acs.analchem.6b04668. 1149
(8) Schwertfeger, Di.; Velicogna, J.; Jesmer, A.; McShane, H.; Scroggins, R.; Princz, 1150
J. Ion Exchange Technique (IET) to Characterise Ag+ Exposure in Soil Extracts 1151
Contaminated with Engineered Silver Nanoparticles. Environ. Chem. 2017, 14 (2), 1152
123–133. https://doi.org/10.1071/EN16136. 1153
(9) Schwertfeger, D. M.; Velicogna, J. R.; Jesmer, A. H.; Scroggins, R. P.; Princz, J. I. 1154
Single Particle-Inductively Coupled Plasma Mass Spectroscopy Analysis of 1155
Metallic Nanoparticles in Environmental Samples with Large Dissolved Analyte 1156
Fractions. Anal. Chem. 2016, 88 (20), 9908–9914. 1157
https://doi.org/10.1021/acs.analchem.6b02716. 1158
(10) McKee, M. S.; Filser, J. Impacts of Metal-Based Engineered Nanomaterials on 1159
Soil Communities. Environ. Sci: Nano. 2016. https://doi.org/10.1039/c6en00007j. 1160
(11) Brar, S. K.; Verma, M.; Tyagi, R. D.; Surampalli, R. Y. Engineered Nanoparticles 1161
in Wastewater and Wastewater Sludge - Evidence and Impacts. Waste Manag. 1162
2010, 30 (3), 504–520. https://doi.org/10.1016/j.wasman.2009.10.012. 1163
(12) Yang, Y.; Wang, Y.; Westerhoff, P.; Hristovski, K.; Jin, V. L.; Johnson, M. V. V; 1164
Arnold, J. G. Metal and Nanoparticle Occurrence in Biosolid-Amended Soils. Sci. 1165
Total Environ. 2014, 485–486 (1), 441–449. 1166
59
https://doi.org/10.1016/j.scitotenv.2014.03.122. 1167
(13) Caetano, A. L.; Marques, C. R.; Gonçalves, F.; da Silva, E. F.; Pereira, R. Copper 1168
Toxicity in a Natural Reference Soil: Ecotoxicological Data for the Derivation of 1169
Preliminary Soil Screening Values. Ecotoxicology 2016, 25 (1), 163–177. 1170
https://doi.org/10.1007/s10646-015-1577-7. 1171
(14) Tourinho, P. S.; van Gestel, C. A. M.; Lofts, S.; Svendsen, C.; Soares, A. M. V. 1172
M.; Loureiro, S. Metal-Based Nanoparticles in Soil: Fate, Behavior, and Effects on 1173
Soil Invertebrates. Environ. Toxicol. Chem. 2012, 31 (8), 1679–1692. 1174
https://doi.org/10.1002/etc.1880. 1175
(15) Julich, D.; Gäth, S. Sorption Behavior of Copper Nanoparticles in Soils Compared 1176
to Copper Ions. Geoderma 2014, 235–236, 127–132. 1177
https://doi.org/10.1016/j.geoderma.2014.07.003. 1178
(16) Sekine, R.; Marzouk, E. R.; Khaksar, M.; Scheckel, K. G.; Stegemeier, J. P.; 1179
Lowry, G. V.; Donner, E.; Lombi, E. Aging of Dissolved Copper and Copper-1180
Based Nanoparticles in Five Different Soils: Short-Term Kinetics vs. Long-Term 1181
Fate. J. Environ. Qual. 2017, 46 (6), 1198. 1182
https://doi.org/10.2134/jeq2016.12.0485. 1183
(17) Liu, R.; Lal, R. Potentials of Engineered Nanoparticles as Fertilizers for Increasing 1184
Agronomic Productions. Sci. Total Environ. 2015, 514, 131–139. 1185
https://doi.org/10.1016/j.scitotenv.2015.01.104. 1186
(18) Anjum, N. A.; Adam, V.; Kizek, R.; Duarte, A. C.; Pereira, E.; Iqbal, M.; 1187
Lukatkin, A. S.; Ahmad, I. Nanoscale Copper in the Soil-Plant System - Toxicity 1188
and Underlying Potential Mechanisms. Environ. Res. 2015, 138, 306–325. 1189
60
https://doi.org/10.1016/j.envres.2015.02.019. 1190
(19) Garner, K. L.; Suh, S.; Keller, A. A. Assessing the Risk of Engineered 1191
Nanomaterials in the Environment: Development and Application of the nanoFate 1192
Model. Environ. Sci. Technol. 2017, 51 (10). 1193
https://doi.org/10.1021/acs.est.6b05279. 1194
(20) Sandstead, H. H. Requirements and Toxicity of Essential Trace Elements, 1195
Illustrated by Zinc and Copper. Am. J. Clin. Nutr. 1995, 61 (3 SUPPL.). 1196
(21) Heikens, A.; Peijnenburg, W. J. G. M.; Hendriks, A. J. Bioaccumulation of Heavy 1197
Metals in Terrestrial Invertebrates. Environ. Pollut. 2001, 113 (3), 385–393. 1198
https://doi.org/10.1016/S0269-7491(00)00179-2. 1199
(22) Griffitt, R. J.; Weil, R.; Hyndman, K. A.; Denslow, N. D.; Powers, K.; Taylor, D.; 1200
Barber, D. S. Exposure to Copper Nanoparticles Causes Gill Injury and Acute 1201
Lethality in Zebrafish (Danio Rerio). Environ. Sci. Technol. 2007, 41 (23), 8178–1202
8186. https://doi.org/10.1021/es071235e. 1203
(23) Lee, W.-M.; A, Y.-J.; Yoon, H.; Kweon, H.-S. Toxicity and Bioavailability of 1204
Copper Nanoparticles to Teh Terrestrial Plants Mung Bean and Wheat. Environ. 1205
Toxicol. Chem. 2008, 27 (9), 1915–1921. https://doi.org/10.1897/07-481.1. 1206
(24) Amorim, M. J. B.; Scott-Fordsmand, J. J. Toxicity of Copper Nanoparticles and 1207
CuCl 2 Salt to Enchytraeus Albidus Worms: Survival, Reproduction and 1208
Avoidance Responses. Environ. Pollut. 2012, 164, 164–168. 1209
https://doi.org/10.1016/j.envpol.2012.01.015. 1210
(25) Gomes, T.; Pereira, C. G.; Cardoso, C.; Pinheiro, J. P.; Cancio, I.; Bebianno, M. J. 1211
Accumulation and Toxicity of Copper Oxide Nanoparticles in the Digestive Gland 1212
61
of Mytilus Galloprovincialis. Aquat. Toxicol. 2012, 118–119, 72–79. 1213
https://doi.org/10.1016/j.aquatox.2012.03.017. 1214
(26) Amorim, M. J. B.; Gomes, S. I. L.; Soares, A. M. V. M.; Scott-Fordsmand, J. J. 1215
Energy Basal Levels and Allocation among Lipids, Proteins, and Carbohydrates in 1216
Enchytraeus Albidus: Changes Related to Exposure to Cu Salt and Cu 1217
Nanoparticles. Water. Air. Soil Pollut. 2012, 223 (1), 477–482. 1218
https://doi.org/10.1007/s11270-011-0867-9. 1219
(27) Heckmann, L. H.; Hovgaard, M. B.; Sutherland, D. S.; Autrup, H.; Besenbacher, 1220
F.; Scott-Fordsmand, J. J. Limit-Test Toxicity Screening of Selected Inorganic 1221
Nanoparticles to the Earthworm Eisenia Fetida. Ecotoxicology 2011, 20 (1), 226–1222
233. https://doi.org/10.1007/s10646-010-0574-0. 1223
(28) Hendren, C. O.; Lowry, G. V.; Unrine, J. M.; Wiesner, M. R. A Functional Assay-1224
Based Strategy for Nanomaterial Risk Forecasting. Sci. Total Environ. 2015, pp 1225
1029–1037. https://doi.org/10.1016/j.scitotenv.2015.06.100. 1226
(29) Gomes, S. I. L.; Murphy, M.; Nielsen, M. T.; Kristiansen, S. M.; Amorim, M. J. 1227
B.; Scott-Fordsmand, J. J. Cu-Nanoparticles Ecotoxicity - Explored and 1228
Explained? Chemosphere 2015. 1229
(30) Hou, W. C.; Westerhoff, P.; Posner, J. D. Biological Accumulation of Engineered 1230
Nanomaterials: A Review of Current Knowledge. Environ. Sci. Process. Impacts 1231
2013, 15 (1), 103–122. https://doi.org/10.1039/c2em30686g. 1232
(31) Klaine, S. J.; Alvarez, P. J. J.; Batley, G. E.; Fernandes, T. F.; Handy, R. D.; Lyon, 1233
D. Y.; Mahendra, S.; McLaughlin, M. J.; Lead, J. R. Nanomaterials in the 1234
Environment: Behavior, Fate, Bioavailability, and Effects. Environ. Toxicol. 1235
62
Chem. 2008, 27 (9), 1825–1851. https://doi.org/10.1897/08-090.1. 1236
(32) Gottschalk, F.; Kost, E.; Nowack, B. Engineered Nanomaterials in Water and 1237
Soils: A Risk Quantification Based on Probabilistic Exposure and Effect 1238
Modeling. Environ. Toxicol. Chem. 2013, 32 (6), 1278–1287. 1239
https://doi.org/10.1002/etc.2177. 1240
(33) Mcshane, H. a O.; Whalen, J.; Sunahara, G.; Hendershot, W. H. Differences in 1241
Soil Solution Chemistry between Soils Amended with Nano- Sized CuO or Cu 1242
Reference Materials : Implications for Nanotoxicity Tests Cu Reference Materials 1243
Environ. Sci. Technol. 2014, 1–14. https://doi.org/10.1021/es500141h. 1244
(34) Zamora-Perez, P.; Tsoutsi, D.; Xu, R.; Rivera-Gil, P. Hyperspectral-Enhanced 1245
Dark Field Microscopy for Single and Collective Nanoparticle Characterization in 1246
Biological Environments. Materials (Basel). 2018, 11 (2). 1247
https://doi.org/10.3390/ma11020243. 1248
(35) Gawande, M. B.; Goswami, A.; Felpin, F.-X.; Asefa, T.; Huang, X.; Silva, R.; 1249
Zou, X.; Zboril, R.; Varma, R. S. Cu and Cu-Based Nanoparticles: Synthesis and 1250
Applications in Catalysis. Chem. Rev. 2016, 116 (6), 3722–3811. 1251
https://doi.org/10.1021/acs.chemrev.5b00482. 1252
(36) Keller, A. A.; McFerran, S.; Lazareva, A.; Suh, S. Global Life Cycle Releases of 1253
Engineered Nanomaterials. J. Nanoparticle Res. 2013, 15 (6). 1254
https://doi.org/10.1007/s11051-013-1692-4. 1255
(37) Noordhoek, J. W.; Verweij, R. A.; Van Gestel, C. A. M.; Van Straalen, N. M.; 1256
Roelofs, D. No Effect of Selected Engineered Nanomaterials on Reproduction and 1257
Survival of the Springtail Folsomia Candida. Environ. Sci. Nano 2018, 5 (2). 1258
63
https://doi.org/10.1039/c7en00824d. 1259
(38) Goncalves, M. F. M.; Gomes, S. I. L.; Scott-Fordsmand, J. J.; Amorim, M. J. B. 1260
Shorter Lifetime of a Soil Invertebrate Species When Exposed to Copper Oxide 1261
Nanoparticles in a Full Lifespan Exposure Test. Sci. Rep. 2017, 7 (1). 1262
https://doi.org/10.1038/s41598-017-01507-8. 1263
(39) Gautam, A.; Ray, A.; Mukherjee, S.; Das, S.; Pal, K.; Das, S.; Karmakar, P.; Ray, 1264
M.; Ray, S. Immunotoxicity of Copper Nanoparticle and Copper Sulfate in a 1265
Common Indian Earthworm. Ecotoxicol. Environ. Saf. 2018, 148 (November 1266
2017), 620–631. https://doi.org/10.1016/j.ecoenv.2017.11.008. 1267
(40) Unrine, J. M.; Tsyusko, O. V.; Hunyadi, S. E.; Judy, J. D.; Bertsch, P. M. Effects 1268
of Particle Size on Chemical Speciation and Bioavailability of Copper to 1269
Earthworms () Exposed to Copper Nanoparticles. J. Environ. Qual. 2010, 39 (6), 1270
1942. https://doi.org/10.2134/jeq2009.0387. 1271
(41) Jesmer, A. H.; Velicogna, J. R.; Schwertfeger, D. M.; Scroggins, R. P.; Princz, J. I. 1272
The Toxicity of Silver to Soil Organisms Exposed to Silver Nanoparticles and 1273
Silver Nitrate in Biosolids-Amended Field Soil. Environ. Toxicol. Chem. 2017, 36 1274
(10). https://doi.org/10.1002/etc.3834. 1275
(42) Ontario, T. G. of. Nutrient Management Act. 2002, 1–88. 1276
(43) Environment Canada. Biological Test Method : Tests for Toxicity of Contaminated 1277
Soil to Earthworms ( Eisenia Andrei ,; 2007. 1278
(44) Environment Canada. Biological Test Method : Test for Measuring Survival and 1279
Reproduction of Springtails Exposed to Contaminants in Soil; 2014. 1280
(45) US EPA. SW846 Method 6020B “Inductively Coupled Plasma - Mass 1281
64
Spectrometry”, Revision 2. U.S. Environ. Prot. Agency 2014, No. July, 1–68. 1282
(46) Rachou, J.; Gagnon, C.; Sauvé, S. Use of an Ion-Selective Electrode for Free 1283
Copper Measurements in Low Salinity and Low Ionic Strength Matrices. Environ. 1284
Chem. 2007, 4 (2), 90–97. https://doi.org/10.1071/EN06036. 1285
(47) Gustafsson, J. P. Visual MINTEQ. Version 3.1, KTH, Stockholm, Sweden. 2013, p 1286
http://vminteq.lwr.kth.se/download/ (accessed Sept. 1287
(48) HILLEL, D. Texture, Particle Size Distribution, and Specific Surface. In 1288
Fundamentals of Soil Physics; 2013; pp 55–69. https://doi.org/10.1016/b978-0-08-1289
091870-9.50009-1. 1290
(49) Jarolimek, C.; Ranville, J. F.; Higgins, C. P.; Pace, H. E.; Rogers, N. J.; Coleman, 1291
V. a. Correction to Determining Transport Efficiency for the Purpose of Counting 1292
and Sizing Nanoparticles via Single Particle Inductively Coupled Plasma Mass 1293
Spectrometry. Anal. Chem. 2012, 84 (10), 4633–4633. 1294
https://doi.org/10.1021/ac300942m. 1295
(50) Environment Canada. (With June 2007 Amendments); 2007. 1296
(51) Zajdlik and Associates Inc. . Research and Validation: Non-Linear Regression in 1297
Toxicity Tests. Report for Biological Assessment and Standardization Section. 1298
Environment Canada; 2014. 1299
(52) Noordhoek, J. W.; Verweij, R. A.; Van Gestel, C. A. M.; Van Straalen, N. M.; 1300
Roelofs, D. No Effect of Selected Engineered Nanomaterials on Reproduction and 1301
Survival of the Springtail Folsomia Candida. Environ. Sci. Nano 2018. 1302
https://doi.org/10.1039/c7en00824d. 1303
(53) Unrine, J. M.; Tsyusko, O. V.; Hunyadi, S. E.; Judy, J. D.; Bertsch, P. M. Effects 1304
65
of Particle Size on Chemical Speciation and Bioavailability of Copper to 1305
Earthworms () Exposed to Copper Nanoparticles. J. Environ. Qual. 2010, 39 (6), 1306
1942. https://doi.org/10.2134/jeq2009.0387. 1307
(54) Santorufo, L.; Van Gestel, C. A. M.; Maisto, G. Ecotoxicological Assessment of 1308
Metal-Polluted Urban Soils Using Bioassays with Three Soil Invertebrates. 1309
Chemosphere 2012, 88 (4), 418–425. 1310
https://doi.org/10.1016/j.chemosphere.2012.02.057. 1311
(55) De Boer, T. E.; Tas, N.; Braster, M.; Temminghoff, E. J. M.; Röling, W. F. M.; 1312
Roelofs, D. The Influence of Long-Term Copper Contaminated Agricultural Soil 1313
at Different pH Levels on Microbial Communities and Springtail Transcriptional 1314
Regulation. Environ. Sci. Technol. 2012, 46 (1), 60–68. 1315
https://doi.org/10.1021/es2013598. 1316
(56) Criel, P.; Lock, K.; Van Eeckhout, H.; Oorts, K.; Smolders, E.; Janssen, C. R. 1317
Influence of Soil Properties on Copper Toxicity for Two Soil Invertebrates. 1318
Environ. Toxicol. Chem. 2008, 27 (8), 1748–1755. https://doi.org/10.1897/07-1319
545.1. 1320
(57) Leveque, T.; Capowiez, Y.; Schreck, E.; Mazzia, C.; Auffan, M.; Foucault, Y.; 1321
Austruy, A.; Dumat, C. Assessing Ecotoxicity and Uptake of Metals and 1322
Metalloids in Relation to Two Different Earthworm Species (Eiseina Hortensis and 1323
Lumbricus Terrestris). Environ. Pollut. 2013, 179, 232–241. 1324
https://doi.org/10.1016/j.envpol.2013.03.066. 1325
(58) Vijver, M. G.; Van Gestel, C. A. M.; Lanno, R. P.; Van Straalen, N. M.; 1326
Peijnenburg, W. J. G. M. Internal Metal Sequestration and Its Ecotoxicological 1327
66
Relevance: A Review. Environ. Sci. Technol. 2004, pp 4705–4712. 1328
https://doi.org/10.1021/es040354g. 1329
(59) Noordhoek, J. W.; Pipicelli, F.; Barone, I.; Franken, O.; Montagne-Wajer, K.; 1330
Mariën, J.; Verweij, R. A.; Van Gestel, C. A. M.; Van Straalen, N. M.; Roelofs, D. 1331
Phenotypic and Transcriptional Responses Associated with Multi-Generation 1332
Exposure of: Folsomia Candida to Engineered Nanomaterials. Environ. Sci. Nano 1333
2018, 5 (10), 2426–2439. https://doi.org/10.1039/c8en00456k. 1334
(60) Gomes, S. I. L.; Murphy, M.; Nielsen, M. T.; Kristiansen, S. M.; Amorim, M. J. 1335
B.; Scott-Fordsmand, J. J. Cu-Nanoparticles Ecotoxicity - Explored and 1336
Explained? Chemosphere 2015, 139, 240–245. 1337
https://doi.org/10.1016/j.chemosphere.2015.06.045. 1338
(61) Julich, D.; Gäth, S. Sorption Behavior of Copper Nanoparticles in Soils Compared 1339
to Copper Ions. Geoderma 2014, 235–236, 127–132. 1340
https://doi.org/10.1016/j.geoderma.2014.07.003. 1341
(62) McShane, H. V. A.; Sunahara, G. I.; Whalen, J. K.; Hendershot, W. H. Differences 1342
in Soil Solution Chemistry between Soils Amended with Nanosized CuO or Cu 1343
Reference Materials: Implications for Nanotoxicity Tests. Environ. Sci. Technol. 1344
2014, 48 (14), 8135–8142. https://doi.org/10.1021/es500141h. 1345
(63) Samarajeewa, A. D.; Velicogna, J. R.; Princz, J. I.; Subasinghe, R. M.; Scroggins, 1346
R. P.; Beaudette, L. A. Effect of Silver Nano-Particles on Soil Microbial Growth, 1347
Activity and Community Diversity in a Sandy Loam Soil. Environ. Pollut. 2017, 1348
220. https://doi.org/10.1016/j.envpol.2016.09.094. 1349
(64) Goncalves, M. F. M.; Gomes, S. I. L.; Scott-Fordsmand, J. J.; Amorim, M. J. B. 1350
67
Shorter Lifetime of a Soil Invertebrate Species When Exposed to Copper Oxide 1351
Nanoparticles in a Full Lifespan Exposure Test. Sci. Rep. 2017, 7 (1), 1–8. 1352
https://doi.org/10.1038/s41598-017-01507-8. 1353
(65) Amde, M.; Liu, J. fu; Tan, Z. Q.; Bekana, D. Transformation and Bioavailability of 1354
Metal Oxide Nanoparticles in Aquatic and Terrestrial Environments. A Review. 1355
Environ. Pollut. 2017, 230, 250–267. 1356
https://doi.org/10.1016/j.envpol.2017.06.064. 1357
(66) Grillo, R.; Rosa, A. H.; Fraceto, L. F. Engineered Nanoparticles and Organic 1358
Matter: A Review of the State-of-the-Art. Chemosphere. Elsevier Ltd January 1, 1359
2015, pp 608–619. https://doi.org/10.1016/j.chemosphere.2014.07.049. 1360
(67) V.D., R.; T., M.; S., S.; S., M.; V., T.; V., C.; A., F. Effects of Copper 1361
Nanoparticles (CuO NPs) on Crop Plants: A Mini Review. Bionanoscience 2018, 8 1362
(1), 36–42. https://doi.org/10.1007/s12668-017-0466-3. 1363
(68) McKee, M. S.; Filser, J. Impacts of Metal-Based Engineered Nanomaterials on 1364
Soil Communities. Environmental Science: Nano. Royal Society of Chemistry 1365
2016, pp 506–533. https://doi.org/10.1039/c6en00007j. 1366
(69) Goncalves, M. F. M.; Gomes, S. I. L.; Scott-Fordsmand, J. J.; Amorim, M. J. B. 1367
Shorter Lifetime of a Soil Invertebrate Species When Exposed to Copper Oxide 1368
Nanoparticles in a Full Lifespan Exposure Test. Sci. Rep. 2017, 7 (1). 1369
https://doi.org/10.1038/s41598-017-01507-8. 1370
(70) Kwak, J. Il; An, Y. J. Ecotoxicological Effects of Nanomaterials on Earthworms: 1371
A Review. Hum. Ecol. Risk Assess. 2015. 1372
(71) fischer, E.; Molnár, L. Environmental Aspects of the Chloragogenous Tissue of 1373
68
Earthworms. Soil Biol. Biochem. 1992. https://doi.org/10.1016/0038-1374
0717(92)90177-Y. 1375
(72) Ardestani, M. M.; Van Straalen, N. M.; Van Gestel, C. A. M. Uptake and 1376
Elimination Kinetics of Metals in Soil Invertebrates: A Review. Environmental 1377
Pollution. 2014. https://doi.org/10.1016/j.envpol.2014.06.026. 1378
(73) Arnold, R. E.; Hodson, M. E. Effect of Time and Mode of Depuration on Tissue 1379
Copper Concentrations of the Earthworms Eisenia Andrei, Lumbricus Rubellus 1380
and Lumbricus Terrestris. Environ. Pollut. 2007, 148 (1), 21–30. 1381
https://doi.org/10.1016/j.envpol.2006.11.003. 1382
(74) Garner, K. L.; Suh, S.; Keller, A. A. Assessing the Risk of Engineered 1383
Nanomaterials in the Environment: Development and Application of the nanoFate 1384
Model. Environ. Sci. Technol. 2017, 51 (10), 5541–5551. 1385
https://doi.org/10.1021/acs.est.6b05279. 1386
(75) Jesmer, A. H.; Velicogna, J. R.; Schwertfeger, D. M.; Scroggins, R. P.; Princz, J. I. 1387
The Toxicity of Silver to Soil Organisms Exposed to Silver Nanoparticles and 1388
Silver Nitrate in Biosolids-Amended Field Soil. Environ. Toxicol. Chem. 2017, 36 1389
(10), 2756–2765. https://doi.org/10.1002/etc.3834. 1390
(76) Guidelines, O.; The, F. O. R.; Of, T. Bioaccumulation in Terrestrial Oligochaetes. 1391
2010, No. July. 1392
(77) McShane, H. V. A.; Sunahara, G. I.; Whalen, J. K.; Hendershot, W. H. Differences 1393
in Soil Solution Chemistry between Soils Amended with Nanosized CuO or Cu 1394
Reference Materials: Implications for Nanotoxicity Tests. Environ. Sci. Technol. 1395
69
2014, 48 (14), 8135–8142. https://doi.org/10.1021/es500141h. 1396
(78) Tatsi, K.; Shaw, B. J.; Hutchinson, T. H.; Handy, R. D. Copper Accumulation and 1397
Toxicity in Earthworms Exposed to CuO Nanomaterials: Effects of Particle 1398
Coating and Soil Ageing. Ecotoxicol. Environ. Saf. 2018, 166 (May), 462–473. 1399
https://doi.org/10.1016/j.ecoenv.2018.09.054. 1400
(79) Velicogna, J. R.; Schwertfeger, D. M.; Jesmer, A. H.; Scroggins, R. P.; Princz, J. I. 1401
The Bioaccumulation of Silver in Eisenia Andrei Exposed to Silver Nanoparticles 1402
and Silver Nitrate in Soil. NanoImpact 2017, 6. 1403
https://doi.org/10.1016/j.impact.2017.03.001. 1404
1405
70
Appendices 1406
1407
Appendix A - Chapter 2 Appendix 1408
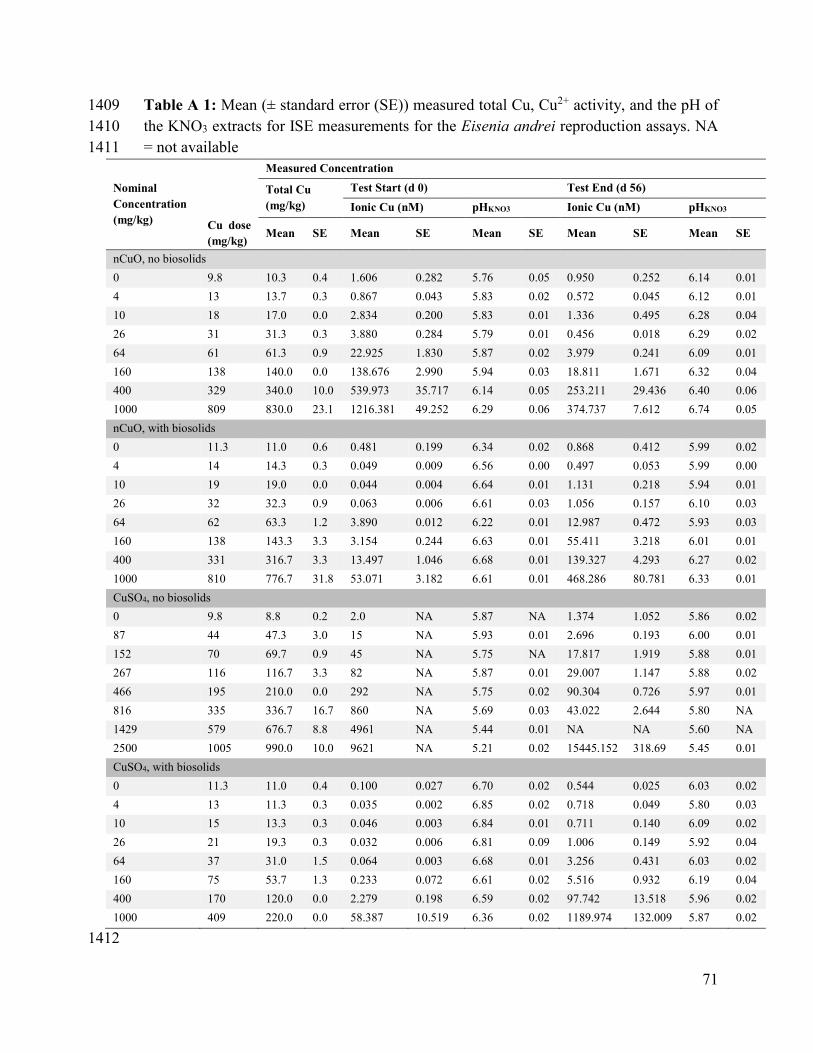
71
Table A 1: Mean (± standard error (SE)) measured total Cu, Cu2+ activity, and the pH of 1409
the KNO3 extracts for ISE measurements for the Eisenia andrei reproduction assays. NA 1410
= not available 1411
Nominal
Concentration
(mg/kg)
Measured Concentration
Total Cu
(mg/kg)
Test Start (d 0) Test End (d 56)
Ionic Cu (nM) pHKNO3 Ionic Cu (nM) pHKNO3
Cu dose
(mg/kg) Mean SE Mean SE Mean SE Mean SE Mean SE
nCuO, no biosolids
0 9.8 10.3 0.4 1.606 0.282 5.76 0.05 0.950 0.252 6.14 0.01
4 13 13.7 0.3 0.867 0.043 5.83 0.02 0.572 0.045 6.12 0.01
10 18 17.0 0.0 2.834 0.200 5.83 0.01 1.336 0.495 6.28 0.04
26 31 31.3 0.3 3.880 0.284 5.79 0.01 0.456 0.018 6.29 0.02
64 61 61.3 0.9 22.925 1.830 5.87 0.02 3.979 0.241 6.09 0.01
160 138 140.0 0.0 138.676 2.990 5.94 0.03 18.811 1.671 6.32 0.04
400 329 340.0 10.0 539.973 35.717 6.14 0.05 253.211 29.436 6.40 0.06
1000 809 830.0 23.1 1216.381 49.252 6.29 0.06 374.737 7.612 6.74 0.05
nCuO, with biosolids
0 11.3 11.0 0.6 0.481 0.199 6.34 0.02 0.868 0.412 5.99 0.02
4 14 14.3 0.3 0.049 0.009 6.56 0.00 0.497 0.053 5.99 0.00
10 19 19.0 0.0 0.044 0.004 6.64 0.01 1.131 0.218 5.94 0.01
26 32 32.3 0.9 0.063 0.006 6.61 0.03 1.056 0.157 6.10 0.03
64 62 63.3 1.2 3.890 0.012 6.22 0.01 12.987 0.472 5.93 0.03
160 138 143.3 3.3 3.154 0.244 6.63 0.01 55.411 3.218 6.01 0.01
400 331 316.7 3.3 13.497 1.046 6.68 0.01 139.327 4.293 6.27 0.02
1000 810 776.7 31.8 53.071 3.182 6.61 0.01 468.286 80.781 6.33 0.01
CuSO4, no biosolids
0 9.8 8.8 0.2 2.0 NA 5.87 NA 1.374 1.052 5.86 0.02
87 44 47.3 3.0 15 NA 5.93 0.01 2.696 0.193 6.00 0.01
152 70 69.7 0.9 45 NA 5.75 NA 17.817 1.919 5.88 0.01
267 116 116.7 3.3 82 NA 5.87 0.01 29.007 1.147 5.88 0.02
466 195 210.0 0.0 292 NA 5.75 0.02 90.304 0.726 5.97 0.01
816 335 336.7 16.7 860 NA 5.69 0.03 43.022 2.644 5.80 NA
1429 579 676.7 8.8 4961 NA 5.44 0.01 NA NA 5.60 NA
2500 1005 990.0 10.0 9621 NA 5.21 0.02 15445.152 318.69 5.45 0.01
CuSO4, with biosolids
0 11.3 11.0 0.4 0.100 0.027 6.70 0.02 0.544 0.025 6.03 0.02
4 13 11.3 0.3 0.035 0.002 6.85 0.02 0.718 0.049 5.80 0.03
10 15 13.3 0.3 0.046 0.003 6.84 0.01 0.711 0.140 6.09 0.02
26 21 19.3 0.3 0.032 0.006 6.81 0.09 1.006 0.149 5.92 0.04
64 37 31.0 1.5 0.064 0.003 6.68 0.01 3.256 0.431 6.03 0.02
160 75 53.7 1.3 0.233 0.072 6.61 0.02 5.516 0.932 6.19 0.04
400 170 120.0 0.0 2.279 0.198 6.59 0.02 97.742 13.518 5.96 0.02
1000 409 220.0 0.0 58.387 10.519 6.36 0.02 1189.974 132.009 5.87 0.02
1412
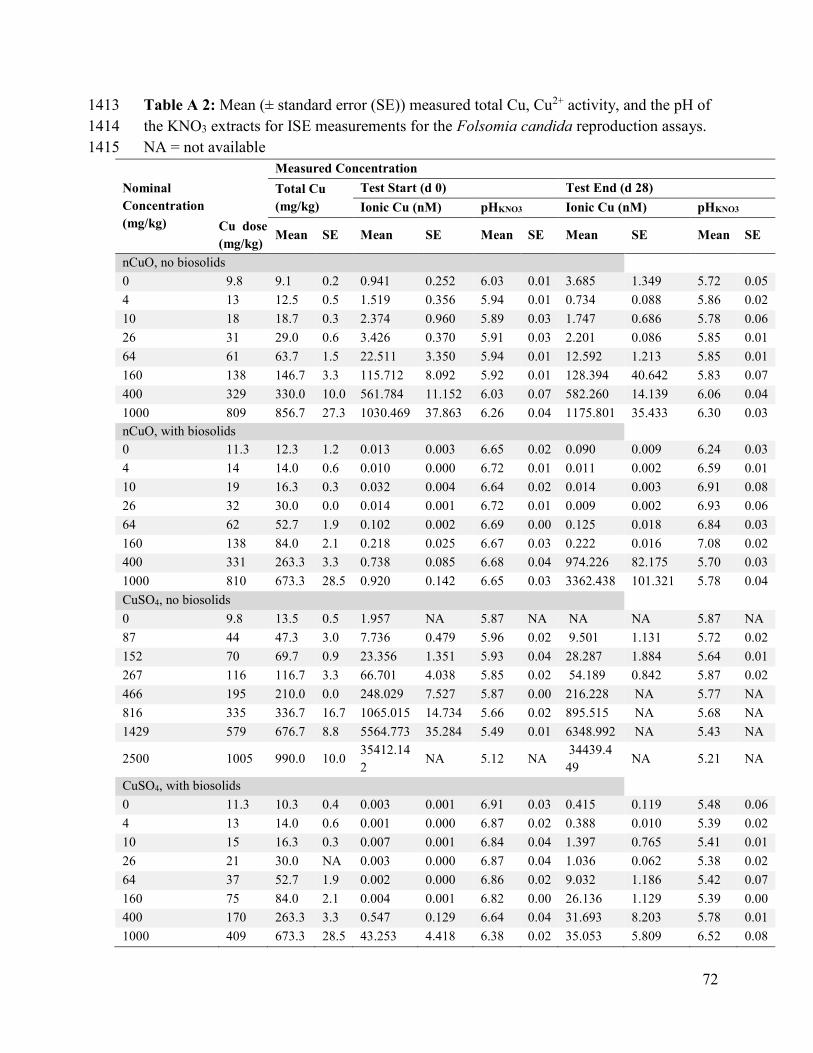
72
Table A 2: Mean (± standard error (SE)) measured total Cu, Cu2+ activity, and the pH of 1413
the KNO3 extracts for ISE measurements for the Folsomia candida reproduction assays. 1414
NA = not available 1415
Nominal
Concentration
(mg/kg)
Measured Concentration
Total Cu
(mg/kg)
Test Start (d 0) Test End (d 28)
Ionic Cu (nM) pHKNO3 Ionic Cu (nM) pHKNO3
Cu dose
(mg/kg) Mean SE Mean SE Mean SE Mean SE Mean SE
nCuO, no biosolids
0 9.8 9.1 0.2 0.941 0.252 6.03 0.01 3.685 1.349 5.72 0.05
4 13 12.5 0.5 1.519 0.356 5.94 0.01 0.734 0.088 5.86 0.02
10 18 18.7 0.3 2.374 0.960 5.89 0.03 1.747 0.686 5.78 0.06
26 31 29.0 0.6 3.426 0.370 5.91 0.03 2.201 0.086 5.85 0.01
64 61 63.7 1.5 22.511 3.350 5.94 0.01 12.592 1.213 5.85 0.01
160 138 146.7 3.3 115.712 8.092 5.92 0.01 128.394 40.642 5.83 0.07
400 329 330.0 10.0 561.784 11.152 6.03 0.07 582.260 14.139 6.06 0.04
1000 809 856.7 27.3 1030.469 37.863 6.26 0.04 1175.801 35.433 6.30 0.03
nCuO, with biosolids
0 11.3 12.3 1.2 0.013 0.003 6.65 0.02 0.090 0.009 6.24 0.03
4 14 14.0 0.6 0.010 0.000 6.72 0.01 0.011 0.002 6.59 0.01
10 19 16.3 0.3 0.032 0.004 6.64 0.02 0.014 0.003 6.91 0.08
26 32 30.0 0.0 0.014 0.001 6.72 0.01 0.009 0.002 6.93 0.06
64 62 52.7 1.9 0.102 0.002 6.69 0.00 0.125 0.018 6.84 0.03
160 138 84.0 2.1 0.218 0.025 6.67 0.03 0.222 0.016 7.08 0.02
400 331 263.3 3.3 0.738 0.085 6.68 0.04 974.226 82.175 5.70 0.03
1000 810 673.3 28.5 0.920 0.142 6.65 0.03 3362.438 101.321 5.78 0.04
CuSO4, no biosolids
0 9.8 13.5 0.5 1.957 NA 5.87 NA NA NA 5.87 NA
87 44 47.3 3.0 7.736 0.479 5.96 0.02 9.501 1.131 5.72 0.02
152 70 69.7 0.9 23.356 1.351 5.93 0.04 28.287 1.884 5.64 0.01
267 116 116.7 3.3 66.701 4.038 5.85 0.02 54.189 0.842 5.87 0.02
466 195 210.0 0.0 248.029 7.527 5.87 0.00 216.228 NA 5.77 NA
816 335 336.7 16.7 1065.015 14.734 5.66 0.02 895.515 NA 5.68 NA
1429 579 676.7 8.8 5564.773 35.284 5.49 0.01 6348.992 NA 5.43 NA
2500 1005 990.0 10.0 35412.14
2 NA 5.12 NA
34439.4
49 NA 5.21 NA
CuSO4, with biosolids
0 11.3 10.3 0.4 0.003 0.001 6.91 0.03 0.415 0.119 5.48 0.06
4 13 14.0 0.6 0.001 0.000 6.87 0.02 0.388 0.010 5.39 0.02
10 15 16.3 0.3 0.007 0.001 6.84 0.04 1.397 0.765 5.41 0.01
26 21 30.0 NA 0.003 0.000 6.87 0.04 1.036 0.062 5.38 0.02
64 37 52.7 1.9 0.002 0.000 6.86 0.02 9.032 1.186 5.42 0.07
160 75 84.0 2.1 0.004 0.001 6.82 0.00 26.136 1.129 5.39 0.00
400 170 263.3 3.3 0.547 0.129 6.64 0.04 31.693 8.203 5.78 0.01
1000 409 673.3 28.5 43.253 4.418 6.38 0.02 35.053 5.809 6.52 0.08
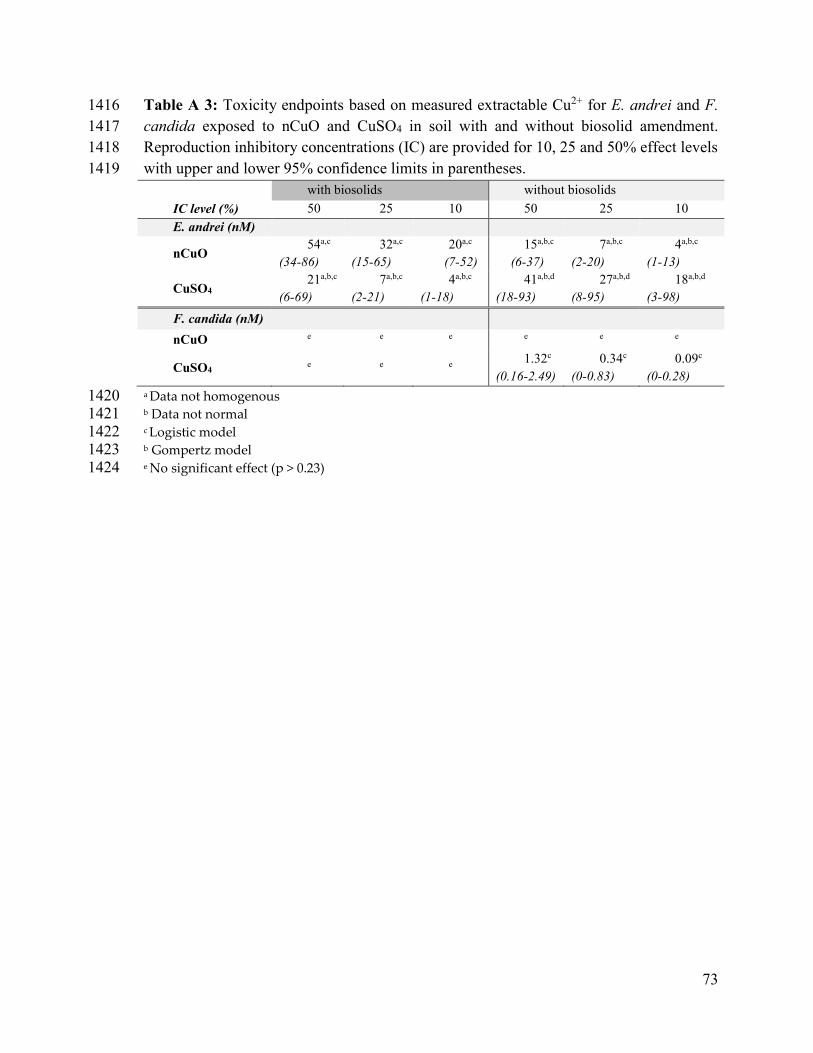
73
Table A 3: Toxicity endpoints based on measured extractable Cu2+ for E. andrei and F. 1416
candida exposed to nCuO and CuSO4 in soil with and without biosolid amendment. 1417
Reproduction inhibitory concentrations (IC) are provided for 10, 25 and 50% effect levels 1418
with upper and lower 95% confidence limits in parentheses. 1419 with biosolids without biosolids
IC level (%) 50 25 10 50 25 10
E. andrei (nM)
nCuO 54a,c
(34-86)
32a,c
(15-65)
20a,c
(7-52)
15a,b,c
(6-37)
7a,b,c
(2-20)
4a,b,c
(1-13)
CuSO4 21a,b,c
(6-69)
7a,b,c
(2-21)
4a,b,c
(1-18)
41a,b,d
(18-93)
27a,b,d
(8-95)
18a,b,d
(3-98)
F. candida (nM)
nCuO e e e e e e
CuSO4 e e e 1.32c
(0.16-2.49)
0.34c
(0-0.83)
0.09c
(0-0.28)
a Data not homogenous 1420 b Data not normal 1421 c Logistic model 1422 b Gompertz model 1423 e No significant effect (p > 0.23) 1424
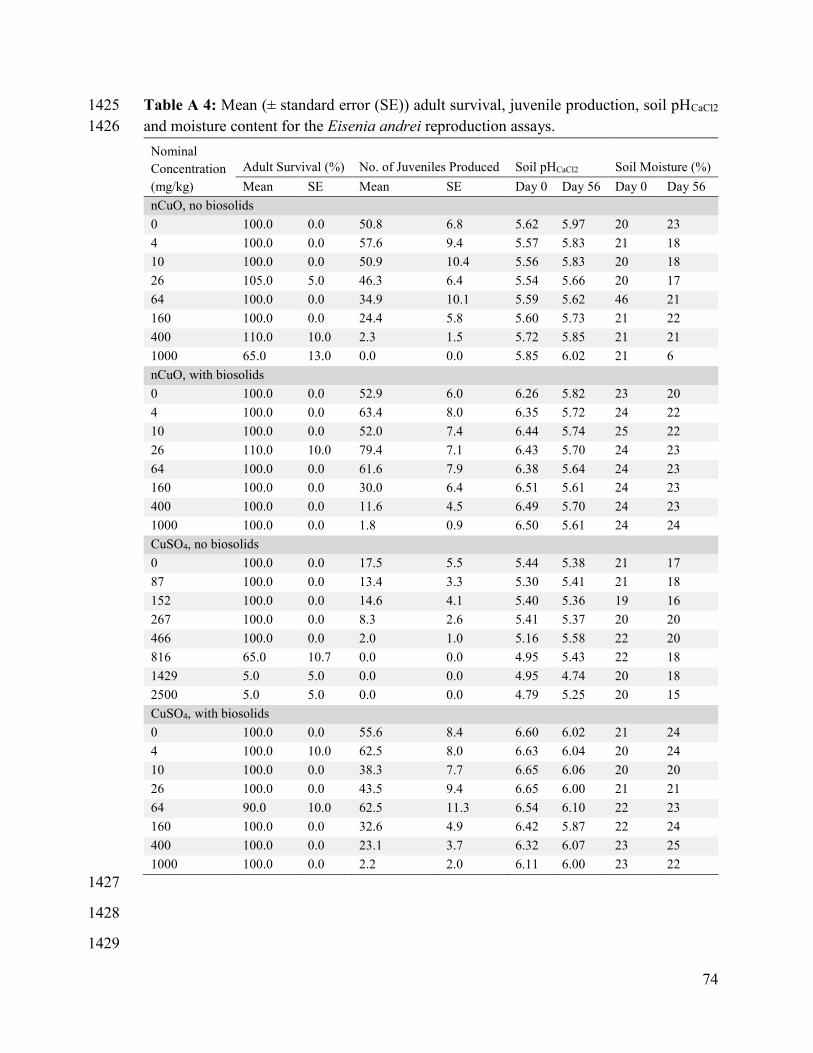
74
Table A 4: Mean (± standard error (SE)) adult survival, juvenile production, soil pHCaCl2 1425
and moisture content for the Eisenia andrei reproduction assays. 1426
Nominal
Concentration
(mg/kg)
Adult Survival (%) No. of Juveniles Produced Soil pHCaCl2 Soil Moisture (%)
Mean SE Mean SE Day 0 Day 56 Day 0 Day 56
nCuO, no biosolids
0 100.0 0.0 50.8 6.8 5.62 5.97 20 23
4 100.0 0.0 57.6 9.4 5.57 5.83 21 18
10 100.0 0.0 50.9 10.4 5.56 5.83 20 18
26 105.0 5.0 46.3 6.4 5.54 5.66 20 17
64 100.0 0.0 34.9 10.1 5.59 5.62 46 21
160 100.0 0.0 24.4 5.8 5.60 5.73 21 22
400 110.0 10.0 2.3 1.5 5.72 5.85 21 21
1000 65.0 13.0 0.0 0.0 5.85 6.02 21 6
nCuO, with biosolids
0 100.0 0.0 52.9 6.0 6.26 5.82 23 20
4 100.0 0.0 63.4 8.0 6.35 5.72 24 22
10 100.0 0.0 52.0 7.4 6.44 5.74 25 22
26 110.0 10.0 79.4 7.1 6.43 5.70 24 23
64 100.0 0.0 61.6 7.9 6.38 5.64 24 23
160 100.0 0.0 30.0 6.4 6.51 5.61 24 23
400 100.0 0.0 11.6 4.5 6.49 5.70 24 23
1000 100.0 0.0 1.8 0.9 6.50 5.61 24 24
CuSO4, no biosolids
0 100.0 0.0 17.5 5.5 5.44 5.38 21 17
87 100.0 0.0 13.4 3.3 5.30 5.41 21 18
152 100.0 0.0 14.6 4.1 5.40 5.36 19 16
267 100.0 0.0 8.3 2.6 5.41 5.37 20 20
466 100.0 0.0 2.0 1.0 5.16 5.58 22 20
816 65.0 10.7 0.0 0.0 4.95 5.43 22 18
1429 5.0 5.0 0.0 0.0 4.95 4.74 20 18
2500 5.0 5.0 0.0 0.0 4.79 5.25 20 15
CuSO4, with biosolids
0 100.0 0.0 55.6 8.4 6.60 6.02 21 24
4 100.0 10.0 62.5 8.0 6.63 6.04 20 24
10 100.0 0.0 38.3 7.7 6.65 6.06 20 20
26 100.0 0.0 43.5 9.4 6.65 6.00 21 21
64 90.0 10.0 62.5 11.3 6.54 6.10 22 23
160 100.0 0.0 32.6 4.9 6.42 5.87 22 24
400 100.0 0.0 23.1 3.7 6.32 6.07 23 25
1000 100.0 0.0 2.2 2.0 6.11 6.00 23 22
1427
1428
1429
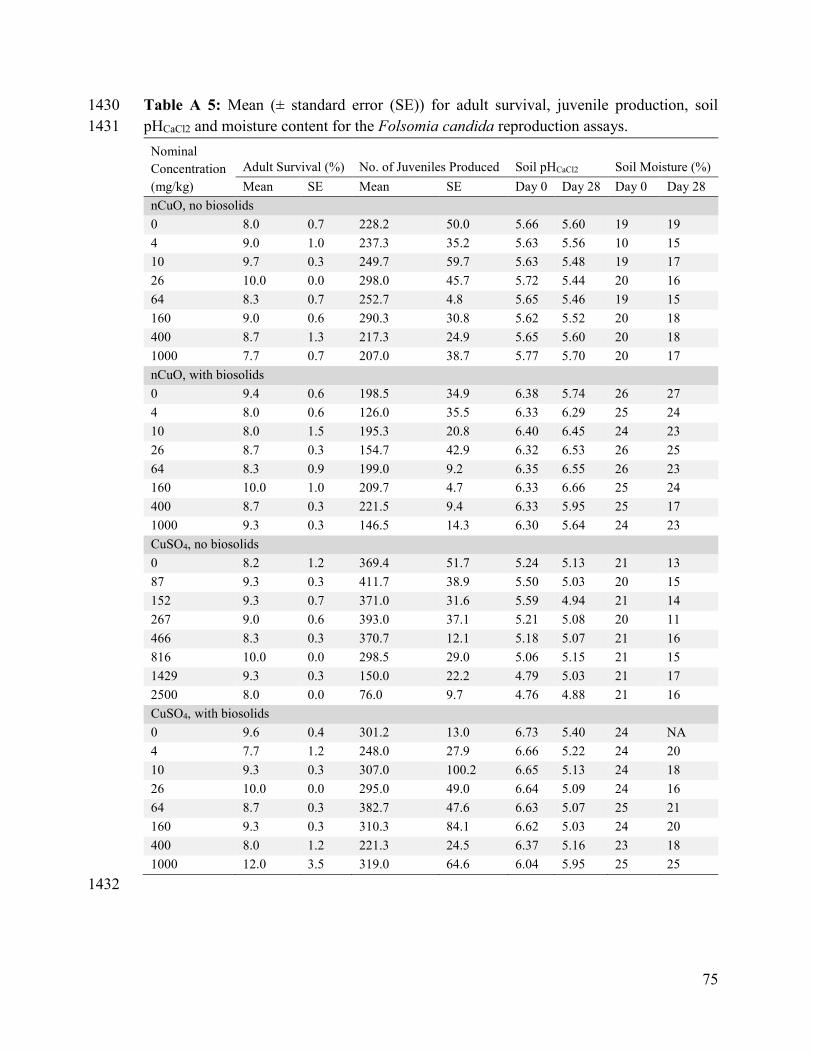
75
Table A 5: Mean (± standard error (SE)) for adult survival, juvenile production, soil 1430
pHCaCl2 and moisture content for the Folsomia candida reproduction assays. 1431
Nominal
Concentration
(mg/kg)
Adult Survival (%) No. of Juveniles Produced Soil pHCaCl2 Soil Moisture (%)
Mean SE Mean SE Day 0 Day 28 Day 0 Day 28
nCuO, no biosolids
0 8.0 0.7 228.2 50.0 5.66 5.60 19 19
4 9.0 1.0 237.3 35.2 5.63 5.56 10 15
10 9.7 0.3 249.7 59.7 5.63 5.48 19 17
26 10.0 0.0 298.0 45.7 5.72 5.44 20 16
64 8.3 0.7 252.7 4.8 5.65 5.46 19 15
160 9.0 0.6 290.3 30.8 5.62 5.52 20 18
400 8.7 1.3 217.3 24.9 5.65 5.60 20 18
1000 7.7 0.7 207.0 38.7 5.77 5.70 20 17
nCuO, with biosolids
0 9.4 0.6 198.5 34.9 6.38 5.74 26 27
4 8.0 0.6 126.0 35.5 6.33 6.29 25 24
10 8.0 1.5 195.3 20.8 6.40 6.45 24 23
26 8.7 0.3 154.7 42.9 6.32 6.53 26 25
64 8.3 0.9 199.0 9.2 6.35 6.55 26 23
160 10.0 1.0 209.7 4.7 6.33 6.66 25 24
400 8.7 0.3 221.5 9.4 6.33 5.95 25 17
1000 9.3 0.3 146.5 14.3 6.30 5.64 24 23
CuSO4, no biosolids
0 8.2 1.2 369.4 51.7 5.24 5.13 21 13
87 9.3 0.3 411.7 38.9 5.50 5.03 20 15
152 9.3 0.7 371.0 31.6 5.59 4.94 21 14
267 9.0 0.6 393.0 37.1 5.21 5.08 20 11
466 8.3 0.3 370.7 12.1 5.18 5.07 21 16
816 10.0 0.0 298.5 29.0 5.06 5.15 21 15
1429 9.3 0.3 150.0 22.2 4.79 5.03 21 17
2500 8.0 0.0 76.0 9.7 4.76 4.88 21 16
CuSO4, with biosolids
0 9.6 0.4 301.2 13.0 6.73 5.40 24 NA
4 7.7 1.2 248.0 27.9 6.66 5.22 24 20
10 9.3 0.3 307.0 100.2 6.65 5.13 24 18
26 10.0 0.0 295.0 49.0 6.64 5.09 24 16
64 8.7 0.3 382.7 47.6 6.63 5.07 25 21
160 9.3 0.3 310.3 84.1 6.62 5.03 24 20
400 8.0 1.2 221.3 24.5 6.37 5.16 23 18
1000 12.0 3.5 319.0 64.6 6.04 5.95 25 25
1432
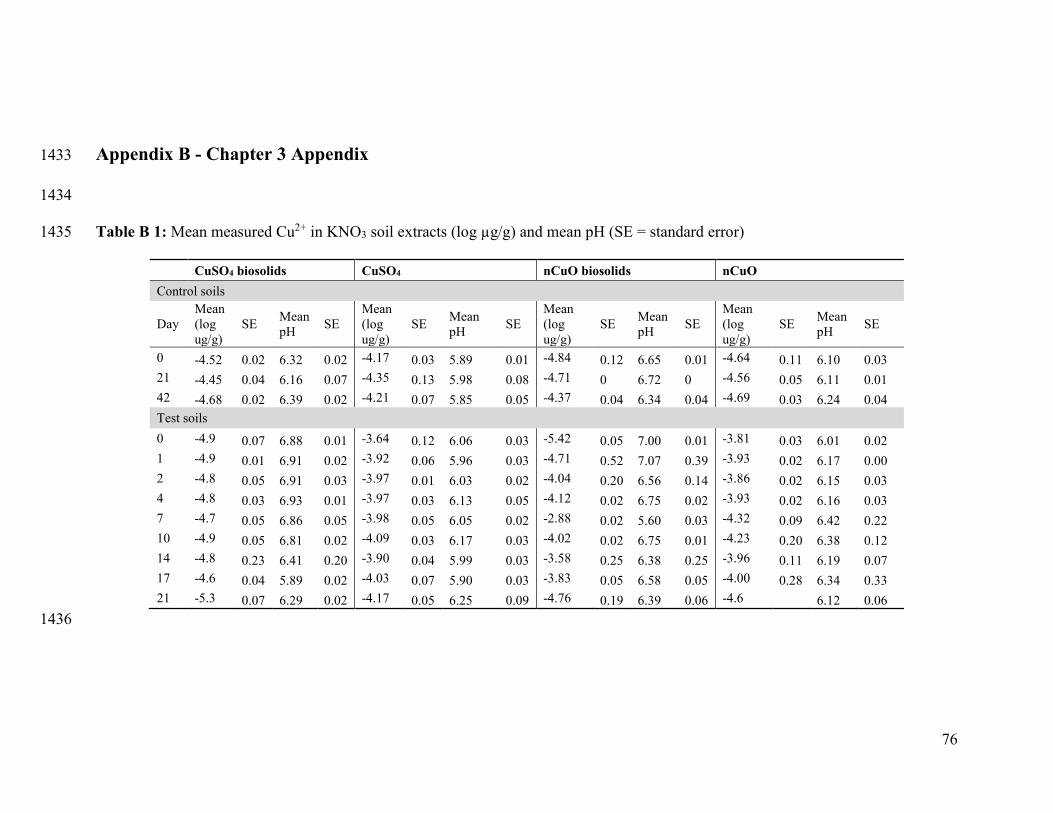
76
Appendix B - Chapter 3 Appendix 1433
1434
Table B 1: Mean measured Cu2+ in KNO3 soil extracts (log µg/g) and mean pH (SE = standard error) 1435
CuSO4 biosolids CuSO4 nCuO biosolids nCuO
Control soils
Day
Mean
(log
ug/g)
SE Mean
pH SE
Mean
(log
ug/g)
SE Mean
pH SE
Mean
(log
ug/g)
SE Mean
pH SE
Mean
(log
ug/g)
SE Mean
pH SE
0 -4.52 0.02 6.32 0.02 -4.17 0.03 5.89 0.01 -4.84 0.12 6.65 0.01 -4.64 0.11 6.10 0.03
21 -4.45 0.04 6.16 0.07 -4.35 0.13 5.98 0.08 -4.71 0 6.72 0 -4.56 0.05 6.11 0.01
42 -4.68 0.02 6.39 0.02 -4.21 0.07 5.85 0.05 -4.37 0.04 6.34 0.04 -4.69 0.03 6.24 0.04
Test soils
0 -4.9 0.07 6.88 0.01 -3.64 0.12 6.06 0.03 -5.42 0.05 7.00 0.01 -3.81 0.03 6.01 0.02
1 -4.9 0.01 6.91 0.02 -3.92 0.06 5.96 0.03 -4.71 0.52 7.07 0.39 -3.93 0.02 6.17 0.00
2 -4.8 0.05 6.91 0.03 -3.97 0.01 6.03 0.02 -4.04 0.20 6.56 0.14 -3.86 0.02 6.15 0.03
4 -4.8 0.03 6.93 0.01 -3.97 0.03 6.13 0.05 -4.12 0.02 6.75 0.02 -3.93 0.02 6.16 0.03
7 -4.7 0.05 6.86 0.05 -3.98 0.05 6.05 0.02 -2.88 0.02 5.60 0.03 -4.32 0.09 6.42 0.22
10 -4.9 0.05 6.81 0.02 -4.09 0.03 6.17 0.03 -4.02 0.02 6.75 0.01 -4.23 0.20 6.38 0.12
14 -4.8 0.23 6.41 0.20 -3.90 0.04 5.99 0.03 -3.58 0.25 6.38 0.25 -3.96 0.11 6.19 0.07
17 -4.6 0.04 5.89 0.02 -4.03 0.07 5.90 0.03 -3.83 0.05 6.58 0.05 -4.00 0.28 6.34 0.33
21 -5.3 0.07 6.29 0.02 -4.17 0.05 6.25 0.09 -4.76 0.19 6.39 0.06 -4.6 6.12 0.06
1436
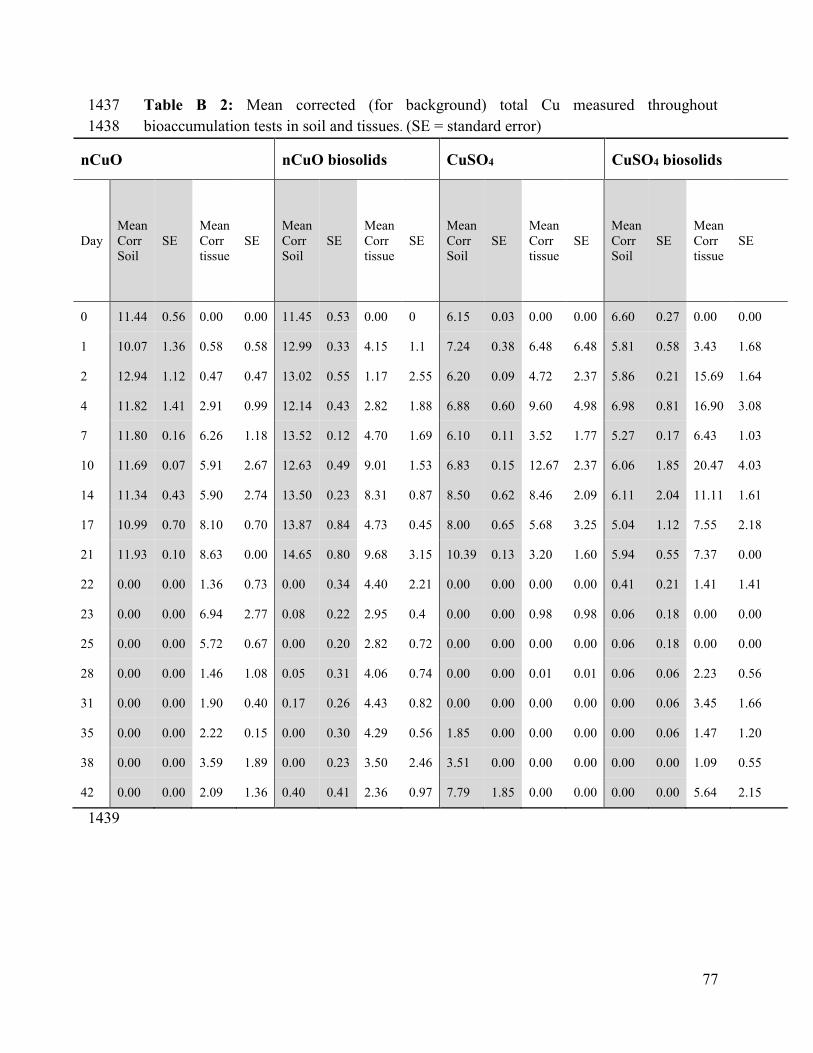
77
Table B 2: Mean corrected (for background) total Cu measured throughout 1437
bioaccumulation tests in soil and tissues. (SE = standard error) 1438
nCuO nCuO biosolids CuSO4 CuSO4 biosolids
Day
Mean
Corr
Soil
SE
Mean
Corr
tissue
SE
Mean
Corr
Soil
SE
Mean
Corr
tissue
SE
Mean
Corr
Soil
SE
Mean
Corr
tissue
SE
Mean
Corr
Soil
SE
Mean
Corr
tissue
SE
0 11.44 0.56 0.00 0.00 11.45 0.53 0.00 0 6.15 0.03 0.00 0.00 6.60 0.27 0.00 0.00
1 10.07 1.36 0.58 0.58 12.99 0.33 4.15 1.1 7.24 0.38 6.48 6.48 5.81 0.58 3.43 1.68
2 12.94 1.12 0.47 0.47 13.02 0.55 1.17 2.55 6.20 0.09 4.72 2.37 5.86 0.21 15.69 1.64
4 11.82 1.41 2.91 0.99 12.14 0.43 2.82 1.88 6.88 0.60 9.60 4.98 6.98 0.81 16.90 3.08
7 11.80 0.16 6.26 1.18 13.52 0.12 4.70 1.69 6.10 0.11 3.52 1.77 5.27 0.17 6.43 1.03
10 11.69 0.07 5.91 2.67 12.63 0.49 9.01 1.53 6.83 0.15 12.67 2.37 6.06 1.85 20.47 4.03
14 11.34 0.43 5.90 2.74 13.50 0.23 8.31 0.87 8.50 0.62 8.46 2.09 6.11 2.04 11.11 1.61
17 10.99 0.70 8.10 0.70 13.87 0.84 4.73 0.45 8.00 0.65 5.68 3.25 5.04 1.12 7.55 2.18
21 11.93 0.10 8.63 0.00 14.65 0.80 9.68 3.15 10.39 0.13 3.20 1.60 5.94 0.55 7.37 0.00
22 0.00 0.00 1.36 0.73 0.00 0.34 4.40 2.21 0.00 0.00 0.00 0.00 0.41 0.21 1.41 1.41
23 0.00 0.00 6.94 2.77 0.08 0.22 2.95 0.4 0.00 0.00 0.98 0.98 0.06 0.18 0.00 0.00
25 0.00 0.00 5.72 0.67 0.00 0.20 2.82 0.72 0.00 0.00 0.00 0.00 0.06 0.18 0.00 0.00
28 0.00 0.00 1.46 1.08 0.05 0.31 4.06 0.74 0.00 0.00 0.01 0.01 0.06 0.06 2.23 0.56
31 0.00 0.00 1.90 0.40 0.17 0.26 4.43 0.82 0.00 0.00 0.00 0.00 0.00 0.06 3.45 1.66
35 0.00 0.00 2.22 0.15 0.00 0.30 4.29 0.56 1.85 0.00 0.00 0.00 0.00 0.06 1.47 1.20
38 0.00 0.00 3.59 1.89 0.00 0.23 3.50 2.46 3.51 0.00 0.00 0.00 0.00 0.00 1.09 0.55
42 0.00 0.00 2.09 1.36 0.40 0.41 2.36 0.97 7.79 1.85 0.00 0.00 0.00 0.00 5.64 2.15
1439
![Egyptian Journal of Chemistry...copper metal and copper oxide nanoparticles into PP polymer matrix. Nano copper oxide was more effective as antimicrobial agent than Cu nano-metal [9]](https://img.pdfslide.us/doc/110x75/60b55dde3afed16e9c6a46ff/egyptian-journal-of-chemistry-copper-metal-and-copper-oxide-nanoparticles-into.jpg)


![Synthesis of Copper Oxide Nano Rods by Microwave Assisted ... No... · nano‐rings [13], NiS2 nano‐cubes [14], CuS nano‐prisms [15], and rose‐like ZnO [16] with their excellent](https://img.pdfslide.us/doc/110x75/5f3bc957902ddc6d745261d0/synthesis-of-copper-oxide-nano-rods-by-microwave-assisted-no-nanoarings.jpg)