Embed Size (px)
Citation preview
An Investigation intoChoice of Place of BirthMiranda Dodwell & Rod Gibson

Published by NCT, Alexandra House, Oldham Terrace, London W3 6NH
ISBN: 978-0-9563281-0-6
© Report NCT, 2009.
© All figures and tables NCT and Rod Gibson Associates Ltd.
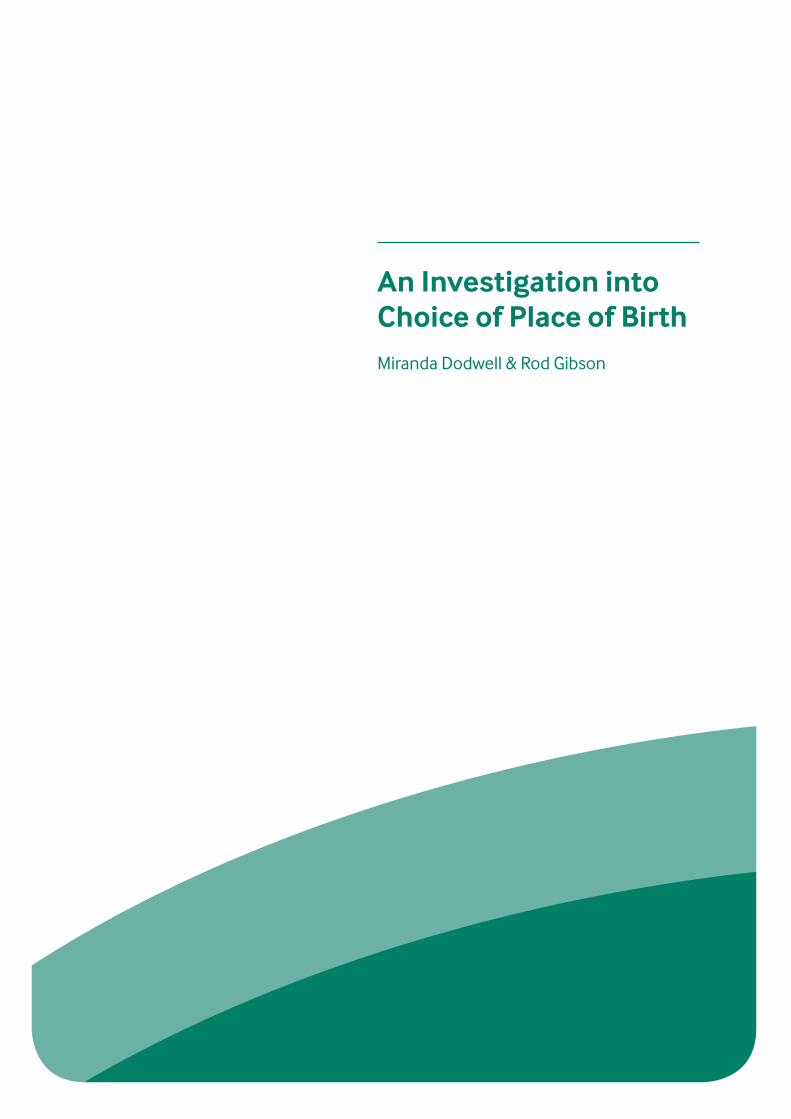
Foreward The NCT is an active advocate of women and families having genuine access to choice of place of birth. It is our understanding that having a range of places to give birth enables families to choose a place where they will feel comfortable, safe and have access to the carers and facilities they value. Some families put greater emphasis on being able to get to know their midwife, guaranteed access to a birth pool and being able to stay together after the birth, for example, and will therefore be keen to access a home birth or a birth centre. Others want to know that there is an obstetrician, an epidural service and a neonatal unit immediately available and will opt for a hospital birth. Some consider an alongside birth centre their preferred option as it provides ‘the best of both worlds’, a low-technology environment with support for achieving a normal birth but with short transfer times to access medical facilities if they are wanted or needed.
Some parents are clear that they want medical services; conversely some are keen to have midwife-led care and avoid interventions if possible. Many parents experience a dilemma – on the one hand they want what they perceive to be safer, on the other hand they would like facilities that provide for their emotional and social needs. Currently, as relatively few hospital units offer high continuity of midwifery care or access to a birth pool as a regular feature of care and facilities for partners to stay, it can be difficult to satisfy both needs at once.
There are, however, positive exceptions to this rule – hospital services that provide caseload midwifery care, make high use of birth pools, and have facilities for involving partners. The NCT welcomes these developments. Alongside midwife-led birth centres, which specialise in promoting normal birth and supporting the psycho-social transition to parenthood while offering ease of access to medical services as and when needed, also provide win-win solutions. The NCT wants all women in all areas to have access to a birth centre as a mainstream option.
We know from formal evidence and from the heart-felt personal experiences that parents share with NCT workers and supporters that many parents struggle to access home birth or have no birth centre in their area. We know that many more parents have no experience of out of hospital birth at all or are fearful at the prospect of being away from hospital.
To investigate the extent of choice in the UK, the NCT commissioned independent analysts, Rod Gibson (RG) and Miranda Dodwell (MD), to undertake a piece of research. As the founders of BirthChoiceUK (www.birthchoiceuk.com) they have extensive experience of analysing official maternity statistics and data collected locally. The research addresses the extent of the full range of birth place choices – home birth, access to a birth centre and hospital birth – in all areas of the UK, using thresholds of provision set by the NCT.
Mary Newburn, Head of Research and Information, NCT
3 An investigation into choice of place of birth
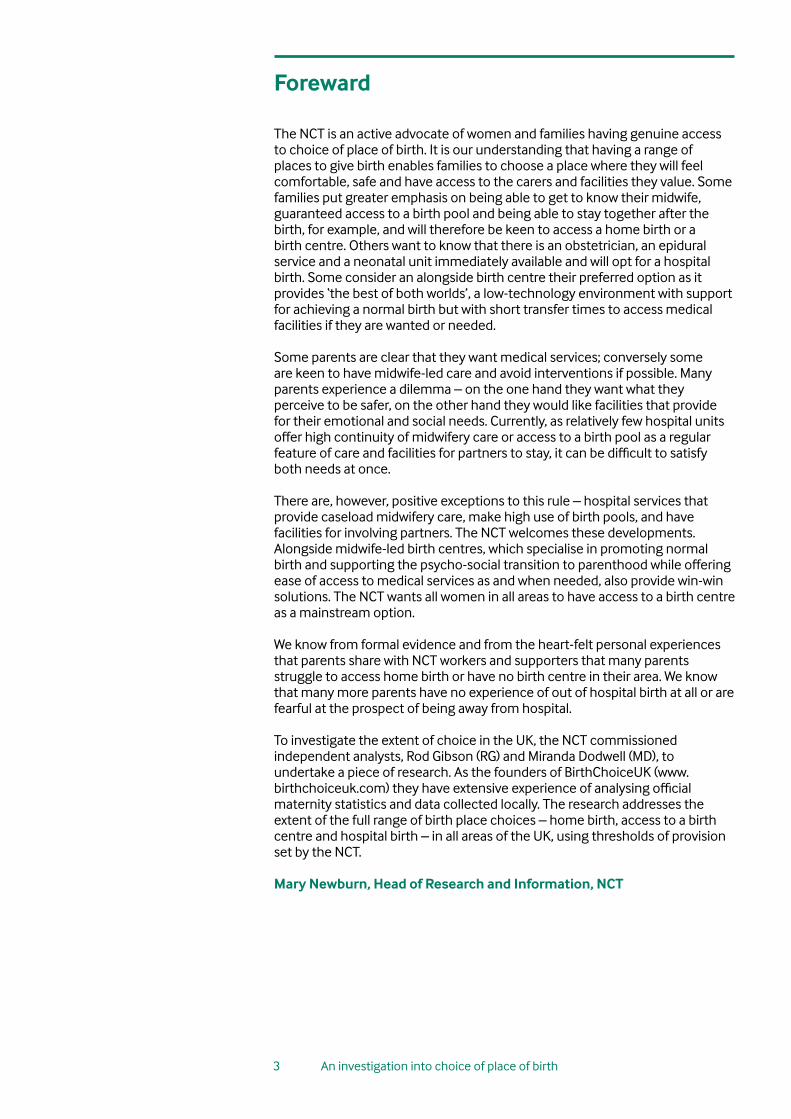
Contents
Foreword 3
List of Figures 5
List of Tables 5
1. Summary 6
2. Introduction 7
3. Commitments to choice 8
England 8
Wales 8
NICE guidance for England and Wales 8
Scotland 8
Northern Ireland 8
UK consensus statement on normal birth 9
4. Defining Choice 10
Access to home birth 10
Access to a birth centre or obstetric unit 10
Calculating time and distance 11
Urban and rural designations 11
5. Methods 12
Administrative geography 12
Distribution of pregnant women across the UK 12
Location of maternity units 13
Home birth rates 14
Distances to maternity units 16
6. Results 19
Choice of home birth 19
Choice of obstetric unit and birth centre 19
Full choice of birth location 19
Changes since 2001 21
Home birth in 2001 21
Maternity units in 2001 22
Full choice of birth settings in 2001 23
Sensitivity of indicators of choice 25
7. Summary and conclusion 27
8. Appendix 1: The Department of Health commitment 28
The national choice guarantees 28
9. Appendix 2: Urban/rural definitions 29
England and Wales 29
Scotland 31
Northern Ireland 32
10. Appendix 3: Geographical statistics 33
11. Appendix 4: Additional 2001 maps 34
12. References 37
4 An investigation into choice of place of birth

List of figures
Figure 1: Map of population density of women of childbearing age 13
Figure 2: Location of maternity units in the UK (2008) 14
Figure 3: Home births rates for 2007 15
Figure 4: Percentage of women of childbearing age by 2007 home birth rate 16
Figure 5: Distance to nearest obstetric unit (2008) 17
Figure 6: Distance to nearest birth centre (2008) 17
Figure 7: Maximum distance to nearest obstetric unit and nearest birth centre (2008) 18
Figure 8: Areas of the UK where the home birth rate is greater than 5% (2007) 19
Figure 9: Areas where women had a choice of both a birth centre and an obstetric unit (2008) 19
Figure 10: Areas of the UK where women had the choice of a home birth, birth centre and obstetric unit (2008) 20
Figure 11: Home birth rates in 2001 (5% or above) 22
Figure 12: Choice of birth centre and obstetric unit (2001) 23
Figure 13: Choice of home birth, birth centre and obstetric unit (2001) 24
Figure 14a: Contour plot showing distribution of choice (2008) 26
Figure 14b: Surface plot showing distribution of choice (2008) 26
Figure 15: Map showing urban and rural regions as defined in this project. 32
Figure 16: Resolution used for mapping 34
Figure 17: Home birth rates (2001) 35
Figure 18: Location of maternity units (2001) 35
Figure 19: Maximum distance to birth centre and obstetric unit (2001) 36
List of Tables
Table 1 : Proportion of childbearing women in the UK living in each country (n= 12 million) 12
Table 2a: Percentage of women who had choice in the UK (2008) 20
Table 2b: Percentage of women who had choice in England (2008) 21
Table 3: Change in home birth rate between 2001 and 2007 21
Table 4 : Number of maternity units in the UK in 2001 and 2008 22
Table 5a: Percentage of women who had choice in the UK in 2001 24
Table 5b: Percentage of women who had choice in England in 2001 24
Table 6: Classification of urban and rural areas in England and Wales 29
Table 7: Classification of urban and rural aeas of Scotland 30
Table 8: Classification of urban and rural areas in Northern Ireland 31
Table 9: Geographical areas for statistical purposes for the four countries of the UK 33
5 An investigation into choice of place of birth

6 An investigation into choice of place of birth
Summary
There is a shared policy commitment across the United Kingdom (UK) to extend the choices available to health services users. The government’s implementation plan for the maternity services in England, Maternity Matters, sets out several ‘choice guarantees’ for women by the end of 2009, including choice of place of birth. This study investigated how many women throughout the UK had the choice of a full range of birth settings (birth at home, in a birth centre or in an obstetric unit) in 2008 as a means of assessing how much further development would be needed in order to achieve the recommendation.
Nationally collated home birth rates were combined with the known locations of obstetric units and birth centres to determine how many women had reasonable access to a home birth service and a choice of types of maternity units. Thresholds of service provision which represented reasonable choice were agreed between the NCT and the researchers. These were: a local home birth rate of 5% or more and access to maternity units within an estimated 30 minute journey. The study shows that 11.2% of the population of childbearing women live in an area with a home birth rate of 5% or more, and on average 57.4% live within an estimated 30 minute journey time of both a birth centre and obstetric unit. Across the UK, only 4.2% of women have reasonable access to all three settings to give birth, using these proxy measures of access. The rate for England is very similar at 4.7%. This situation has improved since 2001 when only 1.1% of women in the UK and 1.3% in England had the full range of options using these measures.
This data suggests that it is unlikely that the government will fulfil its ‘choice guarantee’ to women in England by the end of 2009. Developing the provision of home birth services would be an effective way of increasing the options available to women, as access is not limited by geographical proximity to a facility or the need for major capital investment.
1

7 An investigation into choice of place of birth
2 Introduction
Government departments across the UK share a policy commitment to extending the choices available to health services users. Extending choice in the maternity services has been at the forefront of this development, partly as a result of lobbying by childbirth activists and midwives. Ministers have now pledged a ‘choice guarantee’ in England such that by the end of 2009 women will be able to choose between the three options of birth setting: home, birth centre and hospital care.1 (See Appendix 1.)
This study was established to investigate the extent of choice of place of birth in the UK, using the latest available national data and comparing the extent of choice in 2008 with 2001. This would provide a benchmark enabling a judgement to be made about the extent to which the promise of choice has been fulfilled so far and what further action may be needed to deliver on the government’s promise in England, and to provide a similar standard of choice in the other countries of the UK.
In order to assess the percentage of women having ‘real’ access to a full choice (all three options), or some choice (more than one option), it was necessary to agree some proxy measures of ‘reasonable access’ to the different types of setting for birth locations. These were agreed between the policy and research leads at the NCT and the researchers (RG and MD). They are necessarily subjective, but the rationale for proxy measures is explained so that others may assess the validity of the assumptions made.
The project used pre-defined geographical areas as a basis for mapping choice, and identified the distribution of pregnant women across the UK. The location of maternity units and home birth rates across the UK were determined, together with the distance women had to travel from where they lived to the nearest birth centre and obstetric unit. Using the agreed definitions of choice, it was possible to calculate the extent of choice of birth location and create maps to show this visually.
The results are indicative, based on the modelling of choice across the whole of the UK using a set of assumptions and available geographical and population data. They are not intended to provide accurate information about individual communities or specific addresses. Estimates have not taken into account the capacity of maternity units, though this is discussed in the summary and conclusion (see page 30). For the purposes of the modelling, it is assumed that all maternity units have unlimited capacity.

8 An investigation into choice of place of birth
Commitments to ChoiceEngland
The Department of Health’s policy document Maternity Matters sets out the ‘choice guarantee’ for women and their partners in England.1 This guarantees that by the end of 2009, depending on their circumstances, women and their partners will be able to choose where they wish to give birth, at home, in any available midwifery unit or in a hospital. Providers that offer high quality services and can meet local needs are encouraged to increase capacity so that they can provide maternity services to women from outside their area.1
Wales
The Welsh Assembly Government’s document A framework for realising the potential of midwives in Wales, recommended in 2002 that ‘Healthy women with normal pregnancies should be encouraged to consider home as an appropriate alternative to hospital for giving birth’.2 Ministers in Wales proposed a target rate of 10% home births by 2007. This target was not achieved but the rate did rise from 1.9% in 2001 to 3.7% in 2007.
Subsequently, the National Service Framework for Wales stated that women should expect to be ‘…given information about locally available services to allow them to choose the most appropriate options for pregnancy care, birth and postnatal care’ and that ‘…women who choose home delivery as their birth option [should be] supported in that choice’.3
NICE guidance for England and Wales
The Intrapartum Care Guideline produced by NICE in 2007 stated that women should be offered the choice of planning birth at home, in a midwifery unit or in an obstetric unit, and given certain information to enable her to make that choice.4
Scotland
In Scotland ‘women should have the right to choose how and where to give birth’ according to Principle 11 of the Framework for Maternity Services in Scotland, published in 2001. This noted that ‘…community maternity units may be considered for low risk women with a normal pregnancy… this may provide a model of care for remote and rural areas, offering a local service choice for women in the absence of other options of care’.5
Home birth rates in Scotland were 1.5% in 2007, lower than in both England and Wales, but an increase from less than 1% before 2002. In some areas it was as high as 5%.
The Scottish Government Health Directorates has established the Keeping Childbirth Natural and Dynamic programme which aims to maximise opportunities for women to have as natural a birth experience as possible. This may promote births both in community maternity units and at home.6,7
Northern Ireland
In Northern Ireland, a consultation about the provision of community maternity units took place in 2003.8 This was followed by an announcement from the Health Minister in 2004 that Boards and Trust would be allowed to develop standalone community midwifery units in additional to ‘alongside’ units because ‘…such units have the potential to offer a safe and effective additional tier of choice for women in Northern Ireland, in locations where they are supported by local professionals and safe and effective emergency transfer arrangements are in place’.9 As a result, Health Boards are planning
3

to offer this service in some areas.10 Home birth rates in Northern Ireland are low, at around 0.3% and have increased very little over recent years. No policies are in place to routinely offer home births to women.
UK consensus statement on normal birth
This document from the Maternity Care Working Party states that with appropriate care and support the majority of healthy women can give birth with a minimum of medical procedures. One of its recommendations for action to promote normal birth is the provision of choice of place of birth.11,12
9 An investigation into choice of place of birth
10 An investigation into choice of place of birth
Defining Choice
The three options for birth from which parents can make a choice, depending on their health status, are as follows:
• home birth,• birth in a midwife-led unit or ‘birth centre’ or• birth in an obstetric unit.
A midwife-led unit or birth centre can be either a standalone unit or an alongside unit (co-located with an obstetric unit). In order to determine the extent of choice some proxy measures of ‘reasonable access’ to all three birth settings were agreed.
Access to home birth
The NCT has identified that for a woman to have reasonable access to a home birth, there needs to be provision of a local home birth service with sufficient midwives working in the community to meet the demand, information about arranging a home birth and support from local health professionals. This study was unable to look in detail at local provision; instead it aims to provide an overview and it makes some assumptions.
Actual home birth rates have been used as a proxy measure for access to choice. There is wide variation in home birth rates around the UK and it appears that where there is a proactive approach to offering a home birth service there is up-take from women. It may be that in some communities women and families have a greater or lesser inclination towards home birth, but those attitudes and beliefs are influenced by the extent of the service provided, by staffing levels and the information about different birth settings provided by midwives, GPs and hospital doctors.13,14 Some local areas have home birth rates of over 10%, for example, West Somerset (14%) and Mid-Suffolk (12%) and whole counties have achieved home birth rates over 5%. The three counties with the highest overall home birth rate are Cornwall (7.4%), Suffolk (6%) and Devon (5.7%).15
In consultation with NCT policy and research leads, the researchers agreed that a 5% or greater home birth rate was an appropriate proxy measure of reasonable access to a home birth. This proposition was tested with a group of internal and external stakeholders at the NCT’s Research Advisory Group meeting on 26 March 2009. Those present agreed that this was a suitable threshold for estimating access to ‘real’ choice.
The actual home birth rate is known to include women who have an unplanned birth at home and to exclude women who plan a home birth but transfer to hospital care during pregnancy or labour. It is likely that, on average, about 0.3% of all births are unplanned home births.16 There may be substantial variation of transfer rates around the UK and it was decided that using actual rates collected via birth registration systems would be the most suitable indicator of choice for UK-wide modelling purposes.
Access to a birth centre or obstetric unit
For the purposes of modelling choice, it was decided that a suitable proxy measure for being able to choose to go to an obstetric unit or birth centre was ‘reasonable’ travelling time, and that this could be estimated according to distance from the unit. This measure reflects the service infrastructure but does not take into account the provision of information to women nor the local support for using different settings.
4

11 An investigation into choice of place of birth
Members of the NCT’s Campaigns Advisory Groups for each of the four countries of the UK and NCT antenatal teachers were asked how far they thought that women would be prepared to travel to access a maternity unit. In general it was thought that a journey time of up to 30 minutes while in active labour to reach a maternity unit was the upper threshold of reasonable access.
Although it is possible to calculate individual travel times and road distances using online route-finders, over 30 million journeys were to be considered in the project so this was not feasible. A proxy measure of distance therefore had to be used. It was decided to use straight line distances to each maternity unit and make adjustments to translate distances into journey times.
Calculating time and distance
Rural areas - It was considered that in rural areas, the average speed would be 40 miles per hour. Therefore a journey of 20 miles by road would take a mean time of 30 minutes. On average, the actual road distance is about 1.3 times the straight line distance, so a 20 miles road journey would be approximately 15 miles on a straight line basis.
Urban areas - Urban travel speeds are approximately half rural ones. It is therefore estimated that it would take on average 30 minutes to travel a straight line distance of 7.5 miles. Based on these factors, it was considered that women had reasonable access to a birth centre or obstetric unit if it was within 7.5 miles in an urban area or 15 miles in a rural area.
Urban and rural designations
Areas were designated urban or rural according to classifications by the relevant statistical authorities of the four countries of the UK (Appendix 2). Adjustments were made to take account of estuaries, bays and rivers to disallow journeys across them. In the absence of knowledge of local geography, however, there may remain a few incidences where geographically unfeasible journeys have been permitted.
MethodsAdministrative geography
Each of the UK countries use local authorities (also known as council areas in Scotland and local district councils in Northern Ireland) as administrative areas for the purpose of reporting statistics. However each local authority is divided up into smaller regions. In England and Wales data is collected for Lower Layer Super Output Areas (LSOA – mean population 1,500) and these can be aggregated into Middle Layer Output Areas (MSOA – mean population 7,200). The boundaries of LSOAs and MSOAs are based on producing even population estimates rather than even sized areas, so they can cover geographical areas of different sizes depending on population density. A similar process happens in Scotland and Ireland, although the geographical areas are named differently.
For this project, data from the smallest administrative area possible was used. Maps for this project were drawn using the software Map Maker, using MSOAs as the smallest unit. Data from LSOAs within each MSOA were averaged and plotted on the map.
Further details of administrative geography and mapping techniques are included in Appendix 3.
Distribution of pregnant women across the UK
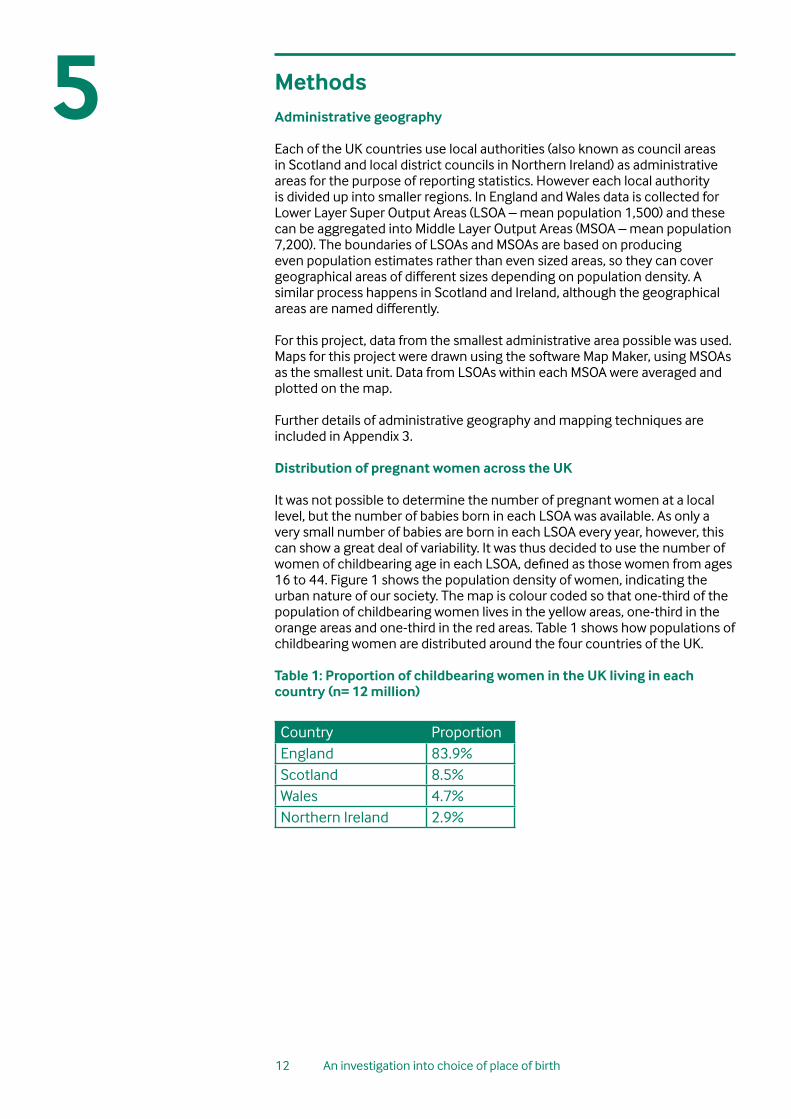
It was not possible to determine the number of pregnant women at a local level, but the number of babies born in each LSOA was available. As only a very small number of babies are born in each LSOA every year, however, this can show a great deal of variability. It was thus decided to use the number of women of childbearing age in each LSOA, defined as those women from ages 16 to 44. Figure 1 shows the population density of women, indicating the urban nature of our society. The map is colour coded so that one-third of the population of childbearing women lives in the yellow areas, one-third in the orange areas and one-third in the red areas. Table 1 shows how populations of childbearing women are distributed around the four countries of the UK.
Table 1: Proportion of childbearing women in the UK living in each country (n= 12 million) Country ProportionEngland 83.9%Scotland 8.5%Wales 4.7%Northern Ireland 2.9%
12 An investigation into choice of place of birth
5
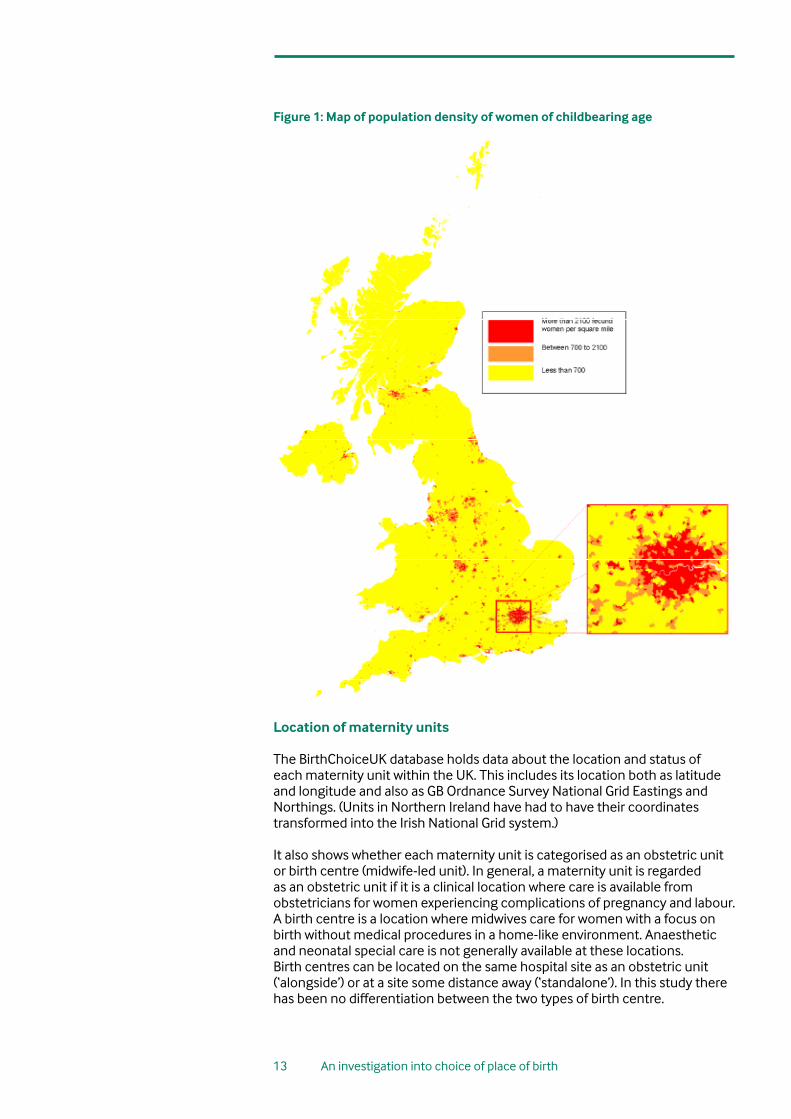
Figure 1: Map of population density of women of childbearing age
Location of maternity units
The BirthChoiceUK database holds data about the location and status of each maternity unit within the UK. This includes its location both as latitude and longitude and also as GB Ordnance Survey National Grid Eastings and Northings. (Units in Northern Ireland have had to have their coordinates transformed into the Irish National Grid system.)
It also shows whether each maternity unit is categorised as an obstetric unit or birth centre (midwife-led unit). In general, a maternity unit is regarded as an obstetric unit if it is a clinical location where care is available from obstetricians for women experiencing complications of pregnancy and labour. A birth centre is a location where midwives care for women with a focus on birth without medical procedures in a home-like environment. Anaesthetic and neonatal special care is not generally available at these locations. Birth centres can be located on the same hospital site as an obstetric unit (‘alongside’) or at a site some distance away (‘standalone’). In this study there has been no differentiation between the two types of birth centre.
13 An investigation into choice of place of birth
14 An investigation into choice of place of birth
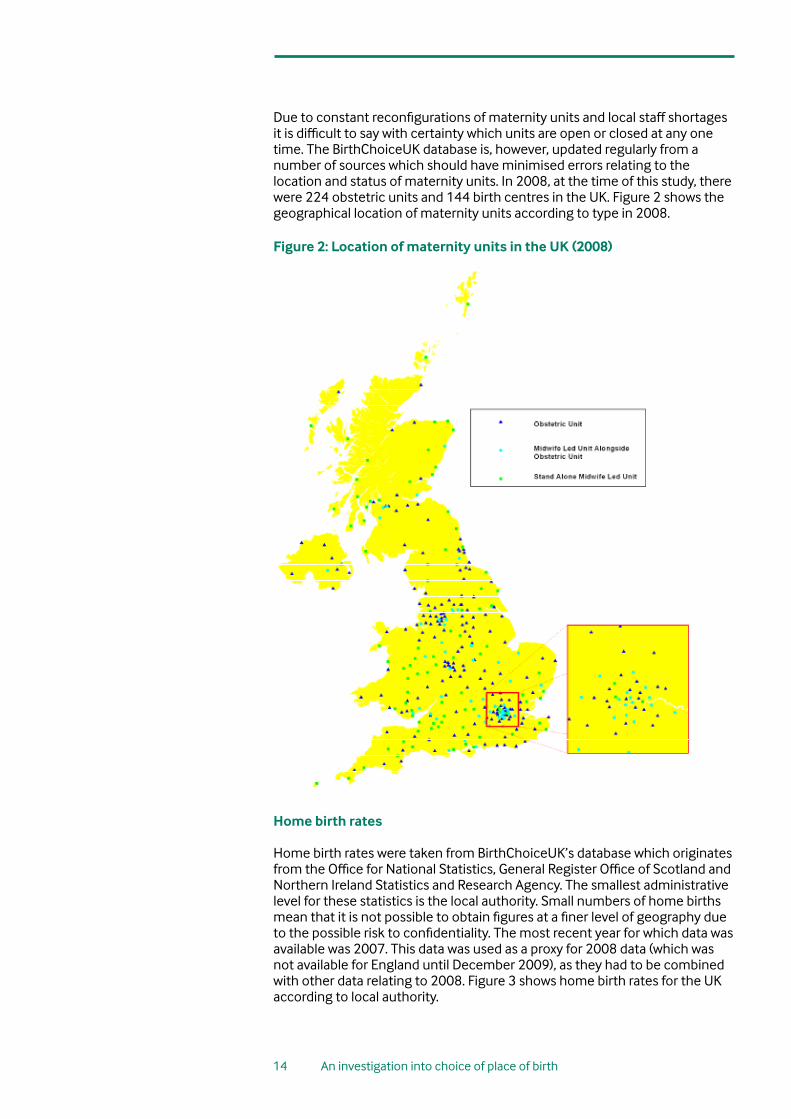
Due to constant reconfigurations of maternity units and local staff shortages it is difficult to say with certainty which units are open or closed at any one time. The BirthChoiceUK database is, however, updated regularly from a number of sources which should have minimised errors relating to the location and status of maternity units. In 2008, at the time of this study, there were 224 obstetric units and 144 birth centres in the UK. Figure 2 shows the geographical location of maternity units according to type in 2008.
Figure 2: Location of maternity units in the UK (2008)
Home birth rates Home birth rates were taken from BirthChoiceUK’s database which originates from the Office for National Statistics, General Register Office of Scotland and Northern Ireland Statistics and Research Agency. The smallest administrative level for these statistics is the local authority. Small numbers of home births mean that it is not possible to obtain figures at a finer level of geography due to the possible risk to confidentiality. The most recent year for which data was available was 2007. This data was used as a proxy for 2008 data (which was not available for England until December 2009), as they had to be combined with other data relating to 2008. Figure 3 shows home birth rates for the UK according to local authority.

15 An investigation into choice of place of birth
Figure 3: Home births rates for 2007
Sources: ONS, GROS, NISRA
Despite government policy to support choice of place of birth since the early 1990s, home birth rates in the UK are still most commonly in the 1 to 3% range. The mean home birth rate for the UK is 2.7%. Figure 4 shows that just over 18% of women are living in an area with a home birth rate between 2 and 2.5% (the mode). However, small numbers of local authorities have a home birth rate which is much higher. Over 10% of women live in a local authority with a home birth rate of 5% or more, including over 1% living where there is a rate above 8%.

16 An investigation into choice of place of birth
Figure 4: Percentage of women of childbearing age by 2007 home birth rate
Distances to maternity units
Figures 5, 6 and 7 show distances women would have to travel to reach their nearest maternity unit. These were calculated using the coordinates of each maternity unit and the central point of each Lower Layer Super Output Area. The colour-coded maps have been produced on the basis of the average straight line distance that a women living in each LSOA would have to travel. Yellow represents an average distance of a maternity unit within one mile and red represents having to travel an average of 20 miles or more to a maternity unit. There are shades of orange in between. Altogether, twenty shades of colour have been used to span the spectrum from yellow to red to give a graduation effect. Figure 5 shows the distance to an obstetric unit in 2008 and Figure 6 shows the distances that women in different areas would need to travel to access a birth centre, either ‘freestanding’ in a community hospital or other community setting or situated alongside an obstetric unit in a district general hospital or tertiary unit setting. As there are fewer birth centres than obstetric maternity units, the distances that many women would have to travel to access one are considerably greater, so Figure 6 has a higher proportion of areas shaded in dark orange or red than Figure 5.
Figure 7 combines the information from Figures 5 and 6 and shows how far women would have to travel to reach both an obstetric and birth centre. Yellow represents having both an obstetric unit and a birth centre within one mile and red represents not having both kinds of units within 20 miles. This has a higher proportion of areas shaded in dark orange or red than both Figure 5 and 6, as fewer women have both types of maternity unit within a close distance.

17 An investigation into choice of place of birth
Figure 5: Distance to nearest obstetric unit (2008)
Figure 6: Distance to nearest birth centre (2008)

18 An investigation into choice of place of birth
Figure 7: Maximum distance to nearest obstetric unit and nearest birth centre (2008)

19 An investigation into choice of place of birth
Results
Choice of home birth
According to the definition of choice selected, 11.2% of women have the choice of a home birth as they live in an area with a home birth rate of 5% or above. Figure 8 shows local authority areas of the UK where the home birth rate is above 5%.
Choice of obstetric unit and birth centre
Using the criteria chosen for reasonable access (living within 7.5 miles in urban areas of both type of unit or within 15 miles in rural areas), Figure 9 shows the country divided into areas where women have a choice of both a birth centre and an obstetric unit within a reasonable distance. Green areas have a choice of type of maternity unit, red areas do not. According to this analysis, 57.4% of the population of childbearing women have reasonable access to both an obstetric unit and a birth centre.
Full choice of birth location
These choices can be combined to show how many women across the UK have the choice of all three birth locations and this is shown in Figure 10. In total, the green areas of the map account for 4.2% of the population of childbearing women. Table 2a shows how the population of childbearing women is distributed according to how much choice of birth setting they have. Of the 11% who have a reasonable choice of home birth, 4% also have reasonable access to both an obstetric unit and a birth centre and 7% do not. Of the 57% who have a choice of types of maternity unit, only 4% also live in an area with a home birth rate of 5% or over. The remaining 53% live in an area with a lower home birth rate, where it is considered that access may be more restricted.
6
Figure 8: Areas of the UK where the home birth rate is greater than 5% (2007)
Figure 9: Areas where women had a choice of both a birth centre and an obstetric unit (2008)
20 An investigation into choice of place of birth
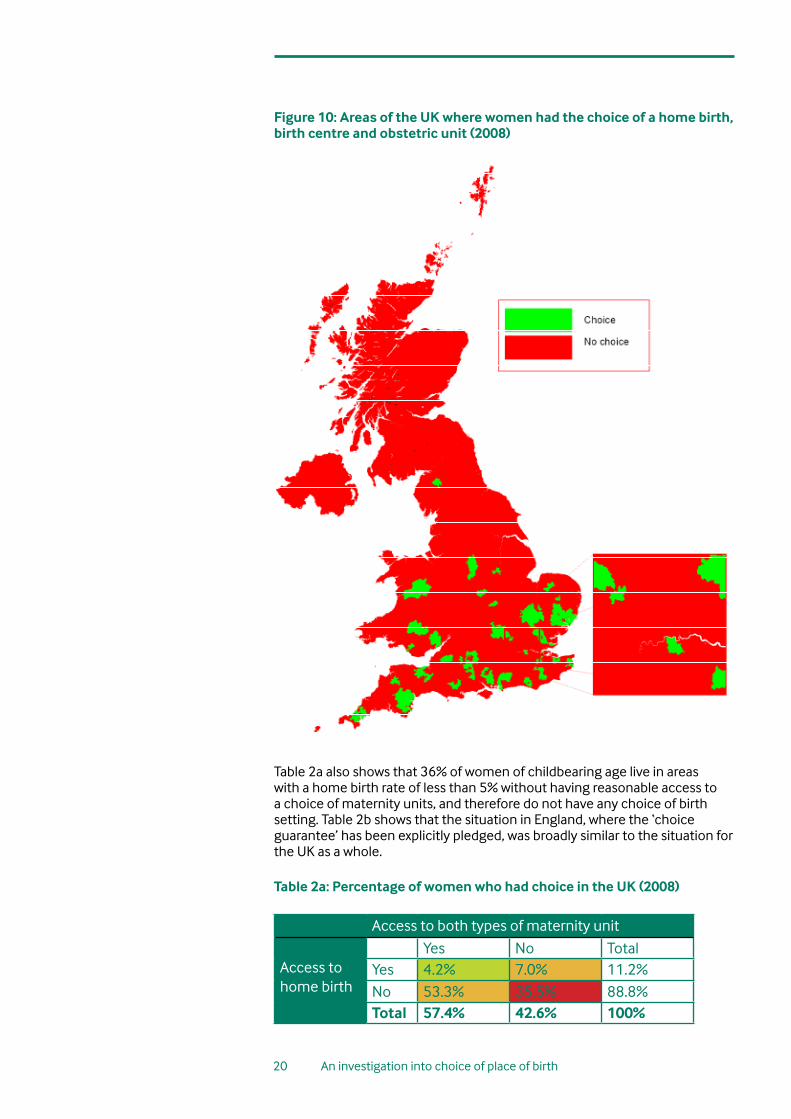
Figure 10: Areas of the UK where women had the choice of a home birth, birth centre and obstetric unit (2008)
Table 2a also shows that 36% of women of childbearing age live in areas with a home birth rate of less than 5% without having reasonable access to a choice of maternity units, and therefore do not have any choice of birth setting. Table 2b shows that the situation in England, where the ‘choice guarantee’ has been explicitly pledged, was broadly similar to the situation for the UK as a whole. Table 2a: Percentage of women who had choice in the UK (2008)
Access to both types of maternity unit
Access tohome birth
Yes No TotalYes 4.2% 7.0% 11.2%No 53.3% 35.5% 88.8%Total 57.4% 42.6% 100%

21 An investigation into choice of place of birth
Table 2b: Percentage of women who had choice in England (2008)
Access to both types of maternity unit
Access tohome birth
Yes No TotalYes 4.7% 7.4% 12.1%No 54.6% 33.4% 87.9%Total 59.3% 40.7% 100%
Changes since 2001 Home birth in 2001 Table 3 shows the change in home birth rates since 2001. The rates have increased in all countries of the UK but have shown the greatest increase in Wales, where the government set a target of a 10% home birth rate. Although the target has not been achieved across the whole of Wales, there are local areas with high home birth rates. Bridgend has a home birth rate of 10.6% and Powys of 8.5%. In 2001, there were 12,621 home births in the UK which had grown to 20,547 in 2007, an increase of 62.8% compared to an increase in total births during the same period of 15.3%. Table 3: Change in home birth rate between 2001 and 2007
Country 2001 2007England 2.1% 2.8%Wales 1.9% 3.7%Scotland 0.9% 1.5%Northern Ireland 0.2% 0.3%UK 1.9% 2.7%

22 An investigation into choice of place of birth
Figure 11: Home birth rates in 2001 (5% or above)
Figure 11 shows those areas of the UK with a home birth rate of 5% or above in 2001. At the time, 4.1% of the population of childbearing women lived in a local authority with a home birth rate of 5% or above. This had increased in 2008 to 11.2%.
Maternity units in 2001
Table 4 shows the change in the number of birth centres and obstetric units since 2001. The number of obstetric units has reduced by 19, which reflects a policy of centralising obstetric units that was advocated in Making it better: for Mother and Baby.17 Conversely, the number of birth centres has increased by 28, a development supported by the national service framework for maternity services and the implementation plan.18,1
Table 4: Number of maternity units in the UK in 2001 and 2008
2001 2008Birth centres 116 144Obstetric units 243 224
Figure 12 shows those areas where women had reasonable access to both a birth centre and an obstetric unit in 2001. At that time, 41.1% of women had reasonable access to both types of maternity unit according to the study definition. This increased in 2008 to 57.4%.

23 An investigation into choice of place of birth
Figure 12: Choice of birth centre and obstetric unit (2001)
Full choice of birth settings in 2001
Combining the components of choice, which this study has defined as a home birth rate over 5% and access to both an obstetric unit and a birth centre within a average journey time of approximately 30 minutes, results show that 1.1% of women in 2001 had access to a full range of birth locations, which had risen to 4.2% in 2008. This suggests that the opportunity to make a full range of choices has increased by a factor of almost 4 but the absolute level of full choice is still extremely low. Figure 13 shows areas of the UK where women have that choice.

24 An investigation into choice of place of birth
Figure 13: Choice of home birth, birth centre and obstetric unit (2001)
Table 5a and 5b show that there have been improvements in access to choice of place of birth since 2001. Table 5a shows that at that time, of the 4% of women who had a choice of home birth, only 1% also lived in an area with a choice of type of maternity. In 2001, 56% of women were not presented with any real choices of birth setting compared with 36% in 2008. Table 5b shows broadly similar findings regarding access to the three options for birth in England in 2001. Additional maps relating to 2001 can be found in Appendix 4. Table 5a: Percentage of women who had choice in the UK in 2001
Access to both types of maternity unit
Access tohome birth
Yes No TotalYes 1.1% 2.9% 4.1%No 40.0% 56.0% 95.9%Total 41.1% 58.9% 100%
Table 5b: Percentage of women who had choice in England in 2001
Access to both types of maternity unit
Access tohome birth
Yes No TotalYes 1.3% 3.5% 4.8%No 42.4% 52.7% 95.2%Total 43.7% 56.3% 100%
25 An investigation into choice of place of birth
Sensitivity of indicators of choice
The researchers were aware that using different indicators of choice would affect the results. Therefore, as well as consulting with the research and campaigns advisory groups of the NCT, including external stakeholders, the researchers undertook further analysis to identify how sensitive the results were to a change in the thresholds used to indicate ‘reasonable access’, and therefore the extent of choice.
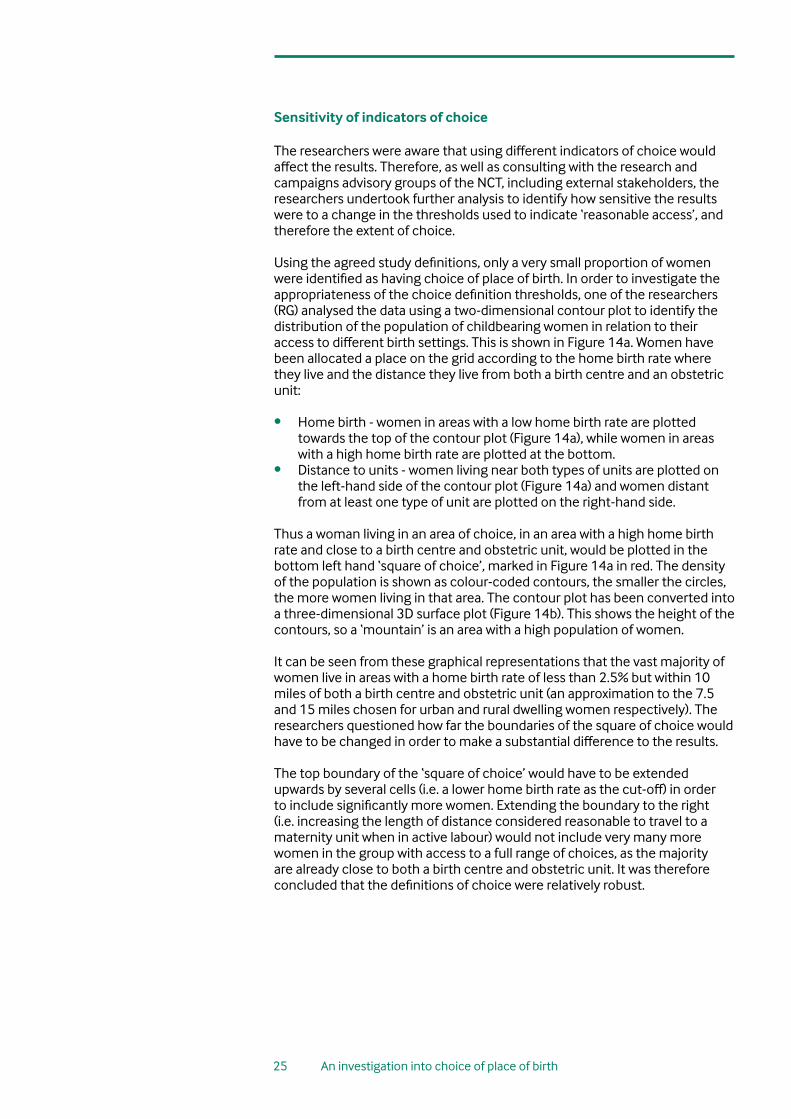
Using the agreed study definitions, only a very small proportion of women were identified as having choice of place of birth. In order to investigate the appropriateness of the choice definition thresholds, one of the researchers (RG) analysed the data using a two-dimensional contour plot to identify the distribution of the population of childbearing women in relation to their access to different birth settings. This is shown in Figure 14a. Women have been allocated a place on the grid according to the home birth rate where they live and the distance they live from both a birth centre and an obstetric unit:
• Home birth - women in areas with a low home birth rate are plotted towards the top of the contour plot (Figure 14a), while women in areas with a high home birth rate are plotted at the bottom.
• Distance to units - women living near both types of units are plotted on the left-hand side of the contour plot (Figure 14a) and women distant from at least one type of unit are plotted on the right-hand side.
Thus a woman living in an area of choice, in an area with a high home birth rate and close to a birth centre and obstetric unit, would be plotted in the bottom left hand ‘square of choice’, marked in Figure 14a in red. The density of the population is shown as colour-coded contours, the smaller the circles, the more women living in that area. The contour plot has been converted into a three-dimensional 3D surface plot (Figure 14b). This shows the height of the contours, so a ‘mountain’ is an area with a high population of women.
It can be seen from these graphical representations that the vast majority of women live in areas with a home birth rate of less than 2.5% but within 10 miles of both a birth centre and obstetric unit (an approximation to the 7.5 and 15 miles chosen for urban and rural dwelling women respectively). The researchers questioned how far the boundaries of the square of choice would have to be changed in order to make a substantial difference to the results.
The top boundary of the ‘square of choice’ would have to be extended upwards by several cells (i.e. a lower home birth rate as the cut-off) in order to include significantly more women. Extending the boundary to the right (i.e. increasing the length of distance considered reasonable to travel to a maternity unit when in active labour) would not include very many more women in the group with access to a full range of choices, as the majority are already close to both a birth centre and obstetric unit. It was therefore concluded that the definitions of choice were relatively robust.
26 An investigation into choice of place of birth
Figure 14a: Contour plot showing distribution of choice (2008)
Figure 14b: Surface plot showing distribution of choice (2008)

27 An investigation into choice of place of birth
Summary and Conclusion This research was commissioned to determine the extent of choice of place of birth for women living in the UK. It used home birth rates for 2007 as a proxy for 2008 rates (which will not be available for England until December 2009) and 2008 data for maternity units.
Using the study definition of choice, the results demonstrate that very few women (4.2%) had a full choice of birth setting. The majority of women have access to both a birth centre and an obstetric unit (57.4%), but most do not have reasonable access to home birth (88.8%). It is concluded that 36% of women do not have access to reasonable choice about where they give birth. These women will have to go to their nearest maternity unit or face the alternatives – a possibly long journey to another maternity unit. They may request a home birth but in an area where rates are low this may be difficult to achieve as professional confidence and support, and the necessary infrastructure, may be lacking.
Although many women have geographical access to both a birth centre and an obstetric unit, this study has not considered whether they are being offered as a realistic choice to women. If they are running at or above full capacity then effective choice would be reduced for many women. If they are running at below full capacity, this choice may not, in practice, be offered to women with unbiased information about their benefits and limitations. Feedback to BirthChoiceUK and to the NCT suggests that staff shortages also mean that birth centres are often subject to temporary closure and economic pressures put them at risk of permanent closure. Monitoring the capacity and utilisation of units should form part of any concerted effort to monitor choice.
Choice has generally increased since 2001, with more women now being able to access a choice of type of maternity unit and more women having the choice of a home birth. However, the situation in 2008 still falls a long way short of all women having a full choice, with over 95% still unable to access all three birth locations. The government promised a full choice to all women in England by the end of 2009 but this is unlikely to be realised, even if there has been a dramatic increase in home birth rates and investment in infrastructure over the last two years.
In order to increase the number of women who have a full choice, the most effective way would be to give more women across the UK access to a home birth service. Home birth rates that are close to four times the national average have been achieved in a number of areas, which leads to the conclusion that significant increases could be achieved across the whole country.
There are also some areas of the UK where a woman’s choice could be improved by the introduction of a birth centre, shown as areas of red in Figure 6. This research has generated mapping techniques which can now be used to monitor womens’ choice of birth location in the future as new data becomes available.
7

28 An investigation into choice of place of birth
Appendix 1: The Department of Health commitmentMaternity Matters made the following ‘maternity services commitment’:1
The national choice guarantees
2.1 By the end of 2009, four national choice guarantees will be available to all women and their partners. By having these guarantees, women and their partners are given the opportunity to make informed choices throughout pregnancy, birth and during the postnatal period:
i. Choice of how to access maternity care – When they first learn that they are pregnant, women and their partners will be able to go straight to a midwife if they wish, or to their General Practitioner. Self-referral into the local midwifery service is a choice that will speed up and enable earlier access to maternity services.
ii. Choice of type of antenatal care – Depending on their circumstances, women and their partners will be able to choose between midwifery care or care provided by a team of maternity health professionals including midwives and obstetricians. For some women, team care will be the safest option.
iii. Choice of place of birth – Depending on their circumstances, women and their partners will be able to choose where they wish to give birth. In making their decision, women will need to understand that their choice of place of birth will affect the choice of pain relief available to them. For example, epidural anaesthesia will only be available in hospitals where there is a 24-hour obstetric anaesthetic service.
The options for place of birth are:
• Birth supported by a midwife at home
• Birth supported by a midwife in a local midwifery facility such as a designated local midwifery unit or birth centre. The unit might be based in the community, or in a hospital; patterns of care vary across the country to reflect different local needs. These units promote a philosophy of normal and natural labour and childbirth. Women will be able to choose any other available midwifery unit in England.
• Birth supported by a maternity team in a hospital. The team may include midwives, obstetricians, paediatricians and anaesthetists. For some women, this type of care will be the safest option but they too should have a choice of hospital. All women will be able to choose any available hospital in England.
i. These choice guarantees are separate from choice in elective care.
ii. Maternal requests for caesarean section should be managed in accordance with the NICE guidance on caesarean section.
iii. In addition to local options, providers that offer high-quality services and can meet local needs are encouraged to increase capacity so that they can provide maternity services to women from outside their area. If those services are available, a woman may choose to access maternity services outside her area. This is already happening in some areas.
iv. Choice of postnatal care – After going home, women and their partners will have a choice of how and where to access postnatal care. This will be provided either at home or in a community setting, such as a Sure Start Children’s Centre.
8

29 An investigation into choice of place of birth
Appendix 2: Urban/rural definitions
Standard settlement definitions were used for each of the four countries of the UK to determine which areas of the UK were urban and rural. This was used in the project to calculate how accessible maternity units were for women living in different areas. Although the classification areas were determined by each country, one of the researchers (RG) allocated them as rural or urban for the purposes of the study. In general areas with a population of over 10,000 were described as urban.
England and Wales
Output areas were assigned to urban or rural categories based on the National Statistics Rural and Urban Classification of Output Areas (http://www.statistics.gov.uk/geography/nrudp.asp). There are eight classifications, two of which were regarded as urban for the purposes of this project, accounting for nearly 86% of the population of England and nearly 70% of the population of Wales (Table 6.) Table 6: Classification of urban and rural areas in England and Wales
Classification England Wales Allocation1 0.2% 1.8% Rural2 0.2% 1.2% Rural3 0.1% 1.9% Rural4 0.5% 7.5% Rural5 81.0% 61.1% Urban6 4.8% 8.3% Urban7 4.4% 6.9% Rural8 8.9% 11.3% Rural
1. Urban ≥ 10k – sparse: Output Area (OA) falls within urban settlements with a population of 10,000 or more and the wider surrounding area is sparsely populated.
2. Town and Fringe – sparse: OA falls within the small town and fringe areas category and the wider surrounding area is sparsely populated.
3. Village – sparse: OA falls within the village category and the wider surrounding area is sparsely populated.
4. Hamlet and Isolated Dwelling – sparse: OA falls within the hamlet and isolated dwelling category and the wider surrounding area is sparsely populated.
5. Urban ≥ 10k – less sparse: OA falls within urban settlements with a population of 10,000 or more and the wider surrounding area is less sparsely populated.
6. Town and Fringe – less sparse: OA falls within the small town and fringe areas category and the wider surrounding area is less sparsely populated.
7. Village – less sparse: OA falls within the village category and the wider surrounding area is less sparsely populated.
8. Hamlet and Isolated Dwelling – less sparse: OA falls within the hamlet and isolated dwelling category and the wider surrounding area is less sparsely populated.
9

30 An investigation into choice of place of birth
Scotland
The eight-fold breakdown of the Scottish Government Urban Rural Classification was used as the basis of the allocation of areas as either rural or urban for the purposes of this project. The first two classifications were regarded as urban, which accounted for over 68% of the population of Scotland
Table 7: Classification of urban and rural areas of Scotland
Classification Scotland Allocation1 41.6% Urban2 26.5% Urban3 7.0% Rural4 1.7% Rural5 1.0% Rural6 15.4% Rural7 3.9% Rural8 2.9% Rural
1. Large Urban Area: Settlement of over 125,000 people.
2. Other Urban Area: Settlement of 10,000 to 125,000 people.
3. Accessible Small Town: Settlement of 3,000 to 10,000 people, within 30 minutes drive of a settlement of 10,000 or more.
4. Remote Small Town: Settlement of 3,000 to 10,000 people, with a drive time of 30 to 60 minutes to a settlement of 10,000 or more.
5. Very Remote Small Town: Settlement of 3,000 to 10,000 people, with a drive time of over 60 minutes to a settlement of 10,000 or more.
6. Accessible Rural: Settlement of less than 3,000 people, within 30 minutes drive of a settlement of 10,000 or more.
7. Remote Rural: Settlement of less than 3,000 people, with a drive time of 30 to 60 minutes to a settlement of 10,000 or more.
8. Very Remote Rural: Settlement of less than 3,000 people, with a drive time of over 60 minutes to a settlement of 10,000 or more.
31 An investigation into choice of place of birth
Northern Ireland
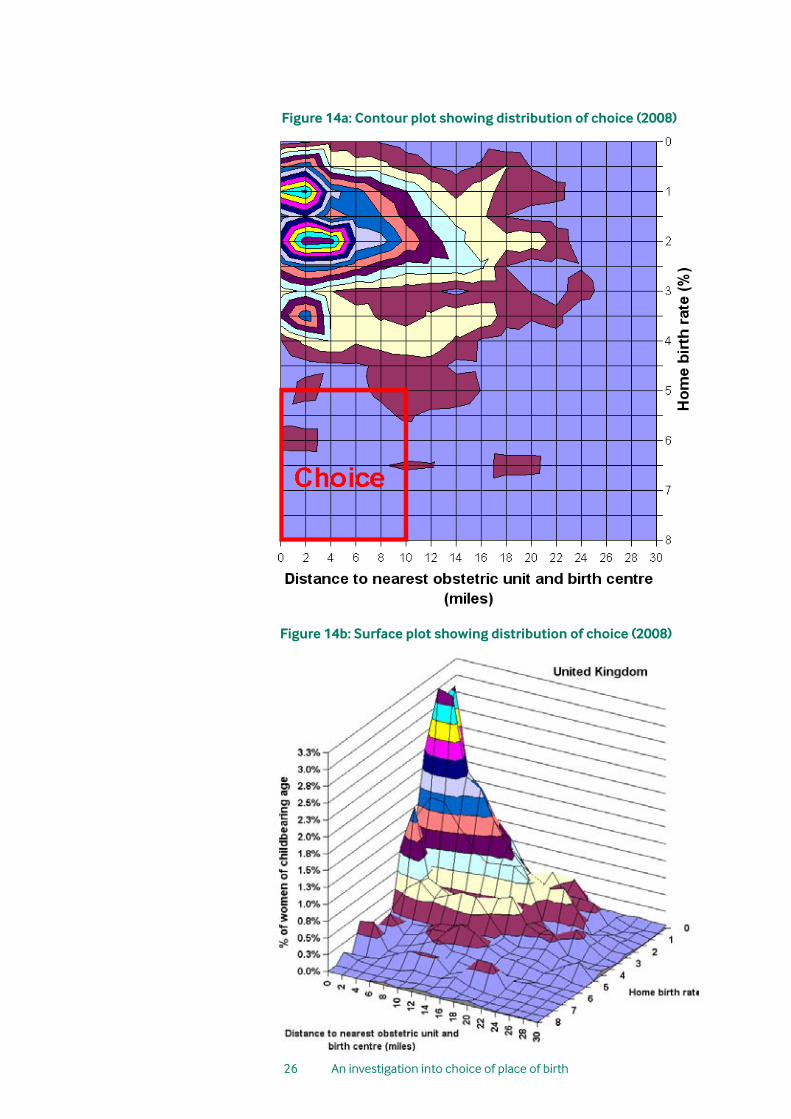
For Northern Ireland, statutory settlement development limits provided by the Department of the Environment Planning Service have been generally used as the best geographical delineation for defining settlements. These provide eight classifications, four of which have been regarded as urban for the purposes of this project, accounting for about 60% of the population. Table 8: Classification of urban and rural areas in Northern Ireland
Classification Scotland AllocationA 34.8% UrbanB 5.8% UrbanC 13.3% UrbanD 6.2% UrbanE 6.2% RuralF 4.0% RuralG 4.4% RuralH 25.4% Rural
A = Belfast: Metropolitan Urban Area
B = Derry: Urban Area
C = Large Town: 18,000 and under 75,000 people
D = Medium Town: 10,000 and under 18,000 people
E = Small Town: 4,500 and under 10,000 people
F = Intermediate Settlement: 2,250 and under 4,500 people
G = Village: 1,000 and under 2,250 people
H = Small Village, Hamlet or Open Countryside: less than 1,000 people

32 An investigation into choice of place of birth
Figure 15: Map showing urban and rural regions as defined in this project.

33 An investigation into choice of place of birth
Appendix 3: Geographical statisticsFor the purposes of compiling statistics, the UK is divided up into small regions called Output Areas, which are aggregated at a number of levels. Each country of the UK has its own system for managing geographical statistics and these are shown in the table below, including the names of the aggregated levels and the number of each.
Table 9: Geographical areas for statistical purposes for the four countries of the UK
England and Wales – Office for National Statistics (ONS)England Wales
Output Areas 165,665 9,769Lower Layer Super Output Areas (LSOA)
32,482 1,896
Middle Layer Super Output Areas (MSOA)
6,781 413
Local Authorities 354 22Scotland (General Register Office for Scotland)
Output Areas 42,604Data Zone 6,505Intermediate Geography
1,235
Local Authorities (Council Areas)
32
Northern Ireland (Census Office for Northern Ireland)Output Areas 5,022Super Output Areas 890Local Authorities (Local Government Districts)
27
10
34 An investigation into choice of place of birth
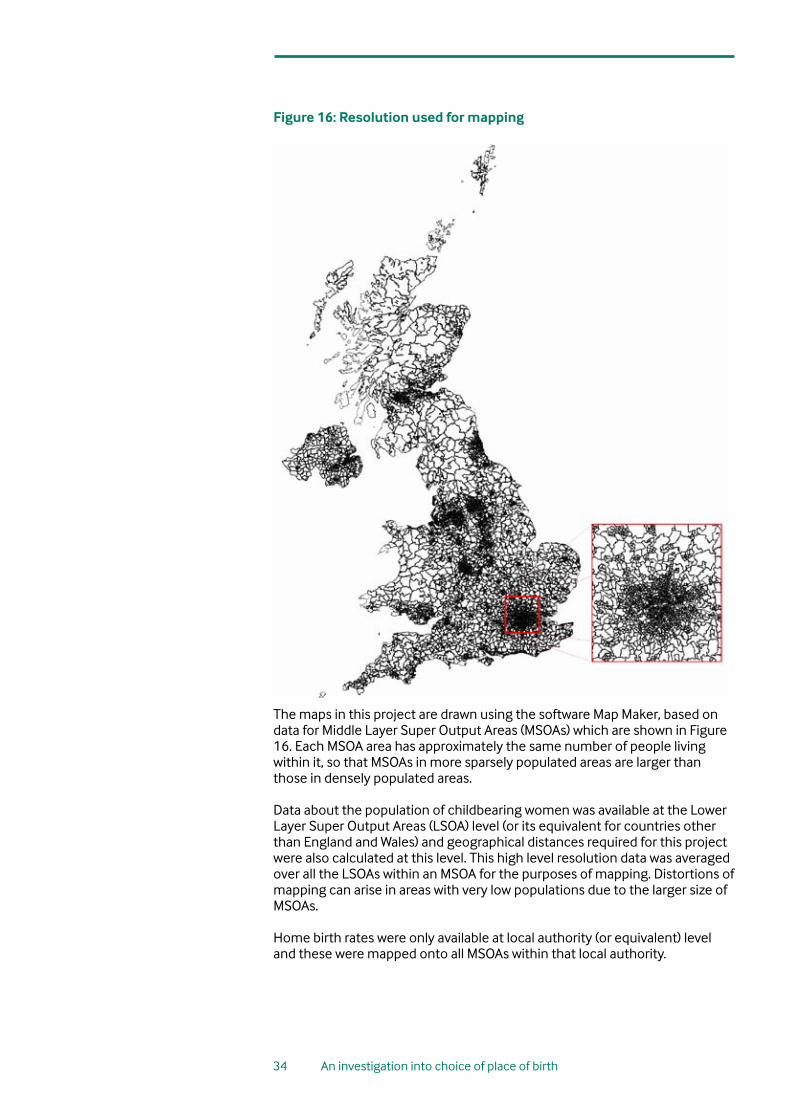
Figure 16: Resolution used for mapping
The maps in this project are drawn using the software Map Maker, based on data for Middle Layer Super Output Areas (MSOAs) which are shown in Figure 16. Each MSOA area has approximately the same number of people living within it, so that MSOAs in more sparsely populated areas are larger than those in densely populated areas.
Data about the population of childbearing women was available at the Lower Layer Super Output Areas (LSOA) level (or its equivalent for countries other than England and Wales) and geographical distances required for this project were also calculated at this level. This high level resolution data was averaged over all the LSOAs within an MSOA for the purposes of mapping. Distortions of mapping can arise in areas with very low populations due to the larger size of MSOAs.
Home birth rates were only available at local authority (or equivalent) level and these were mapped onto all MSOAs within that local authority.

35 An investigation into choice of place of birth
Appendix 4: Additional 2001 mapsFigure 17: Home birth rates (2001)
Figure 18: Location of maternity units (2001)
11

36 An investigation into choice of place of birth
Figure 19: Maximum distance to birth centre and obstetric unit (2001)
37 An investigation into choice of place of birth
References1. Department of Health. Maternity matters: choice, access and continuity
of care in a safe service. London: Department of Health; 2007. Available from: http://www.dh.gov.uk/en/Publicationsandstatistics/Publications/PublicationsPolicyAndGuidance/DH_073312
2. ‘Realising the potential; A strategic framework for nursing, midwifery and health visiting in Wales into the 21st century. Briefing paper 4. “Delivering the future in Wales” A framework for realising the potential of midwives in Wales. Cardiff: Welsh Assembly Government; 2002.
3. Welsh Assembly Government. National Service Framework for Children, Young People and Maternity Services in Wales. Cardiff: Welsh Assembly Government; 2005
4. National Collaborating Centre for Women’s and Children’s Health. Intrapartum care: care of healthy women and their babies during childbirth. Clinical Guideline. London: RCOG Press; 2007. Available from: http://guidance.nice.org.uk/CG55/niceguidance/pdf/English
5. Scottish Executive. A framework for maternity services in Scotland. Scottish Executive: Edinburgh; 2001. Available from: http://www.scotland.gov.uk/library3/health/ffms-00.asp ; http://www.scotland.gov.uk/library3/health/fmms1.pdf ; http://www.scotland.gov.uk/library3/health/fmms2.pdf http://www.scotland.gov.uk/library3/health/fmms3.pdf
6. Scottish Government. Keeping Childbirth Natural and Dynamic. Available from: http://www.scotland.gov.uk/Topics/Health/NHS
7. Holmes A. Keeping Childbirth Natural & Dynamic. New Digest 2009;(47):15.
8. Department of Health SS&PS. Community midwifery units: consultation paper. Belfast: DHSSPSNI; 2003. Available from: http://www.dhsspsni.gov.uk/econsultation/Community_Midwifery_Units.pdf
9. Community Midwifery Units to be developed in NI. Available from: http://www.4ni.co.uk/northern_ireland_news.asp?id=31647
10. Northern Ireland Executive. Health Minister announces community midwifery unit at new Downe hospital. Available from: http://www.northernireland.gov.uk/news/news-dhssps/news-dhssps-may-2008/news-dhssps-070508-health-minister-announces.htm
12

38 An investigation into choice of place of birth
11. Maternity Care Working Party. Making normal birth a reality. Consensus statement from the Maternity Care Working Party: our shared views about the need to recognise, facilitate and audit normal birth. National Childbirth Trust; Royal College of Midwives; Royal College of Obstetricians and Gynaecologists; 2007. Available from: http://www.appg-maternity.org.uk/
12. Werkmeister G, Jokinen M, Mahmood T, et al. Making normal labour and birth a reality - developing a multi-disciplinary consensus. Midwifery 2008;24(3):256-9.
13. Barber T, Rogers J, Marsh S. The Birth Place Choices Project: phase one. British Journal of Midwifery 2006;14(10):609-13.
14. Beake S, Bick D. Maternity services policy: does the rhetoric match the reality? British Journal of Midwifery 2007;15(2):89-93.
15. BirthChoiceUK. Home birth rates. Available from: http://www.birthchoiceuk.com/HomeBirthRates.htm
16. Murphy JF, Dauncey M, Gray OP, et al. Planned and unplanned deliveries at home: implications of a changing ratio. BMJ 1984;288(6428):1429-32.
17. Shribman S. Making it better: for mother and baby. Clinical case for change. London: Department of Health; 2007. Available from: http://www.dh.gov.uk/en/Publicationsandstatistics/Publications/PublicationsPolicyAndGuidance/DH_065053
18. Department of Health. National Service Framework for Children, Young People and Maternity Services. London: Department of Health; Department for Education and Skills; 2004. Available from: http://www.dh.gov.uk/PolicyAndGuidance/HealthAndSocialCareTopics/ChildrenServices/ChildrenServicesInformation/fs/en

ISBN: 978-0-9550328-8-1