Embed Size (px)
Citation preview
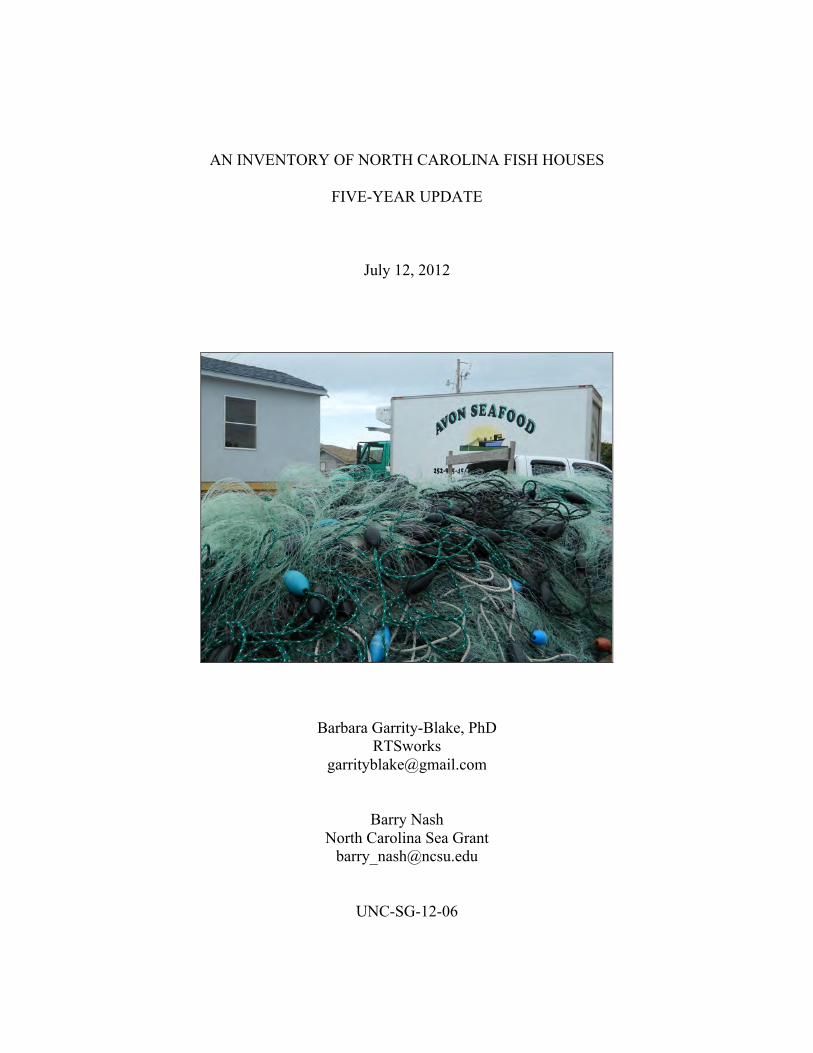
AN INVENTORY OF NORTH CAROLINA FISH HOUSES
FIVE-YEAR UPDATE
July 12, 2012
Barbara Garrity-Blake, PhD RTSworks
Barry Nash
North Carolina Sea Grant [email protected]
UNC-SG-12-06

2
Acknowledgments: We would like to thank the following for their help and expertise:
Col. Rex Lanier and Don Hesselman of the North Carolina Division of Marine Fisheries;
Steve Murphy with the North Carolina Department of Environment and Natural
Resources; Marc Turano of North Carolina Sea Grant; and the many North Carolina
fishing industry participants who took time to answer our questions and share their
expertise. We also thank North Carolina Sea Grant for funding this project (through
NOAA grant # NA10OAR4170080), and thank Katie Mosher of Sea Grant for her sharp
eye and editing skills.

3
Executive Summary
In 2006, the North Carolina legislature established a study committee to examine
the loss of working waterfront and public access sites along the coastal shoreline. In
support of that effort, we undertook a statewide inventory of wholesale seafood packing
facilities, known locally as fish houses (Garrity-Blake and Nash 2007). Our inventory
indicated that the number of fish houses fell by almost a third from 2000 to 2006.
This research represents a five-year update of the initial fish house inventory. We
wanted to examine if North Carolina continues to lose domestic seafood packing capacity
and to what extent. We asked how those in operation are adapting to ongoing challenges
that affect the seafood industry. We explored whether recent waterfront access legislation
and initiatives are perceived by the industry as beneficial and delivering positive results.
We found that the state continues to lose domestic seafood packing capacity, but
at a slower rate compared to the real estate boom period of 2001 to 2006. We calculated a
net loss of nine fish houses from 2006 to 2011, or a 9.78 percent reduction, compared to
an almost 30 percent reduction from 2001 to 2006. Overall, we calculated a net loss of 47
facilities from 2001 to 2011, or a 36 percent decline in the last decade.
Reasons for fish house closures include depressed domestic market prices
undercut by unprecedented levels of imported seafood, declines in high-volume fisheries
due in part to tighter fisheries restrictions and quotas, and a labor crisis. Transitioning
from high volume to more localized, diverse markets and expanding into retail trade and
local foods markets are some key strategies employed to increase profit margins. New
initiatives such as branding programs and property tax breaks for waterfront fish houses
were also cited as positives in a depressed economy.

4
Quality Seafood, Cedar Island, North Carolina
(Photo by B. Garrity-Blake)
Introduction
In 2006, we undertook an inventory of the number of seafood packing/processing
facilities in North Carolina. This was during the height of the housing and property boom
in the United States, especially pronounced in coastal areas. A series of articles in the
Raleigh News and Observer described an unprecedented level of property acquisition and
development on the coast, including the rural “Inner Banks” region along the Albemarle
and Pamlico sounds. Not only was North Carolina losing public access points and
affordable vacation areas such as campgrounds and ocean fishing piers, the state’s
already stressed seafood industry was threatened with the loss of working waterfronts as

5
an increasing number of commercial parcels were sold and converted to high-end
residential properties.
In 2006 the North Carolina legislature established a Waterfront Access Study
Committee to examine the loss of working waterfront and public access points along the
coast. In support of this effort, we undertook an inventory of wholesale seafood packing
facilities from the Virginia to the South Carolina border via site visits and phone surveys.
We identified a universe of wholesale seafood packing facilities in North Carolina to
determine the number of facilities that had closed since 2001. We initially calculated a 33
percent reduction in the number of fish houses from 2001 to 2006, although we have
since corrected and revised those numbers to just below 30 percent.
In 2007, state legislators passed a bill to help protect public access and working
waterfronts (Appendix A), adopting key recommendations of the Waterfront Access
Study Committee. This included a provision for property tax relief for water-dependent
seafood and ocean pier facilities, as well as a $20 million fund for the state acquisition of
waterfront properties for public access.
The purpose of an inventory update was to determine if, and to what extent, North
Carolina continues to lose working waterfront and seafood production capacity. We also
examined how seafood dealers are coping with ongoing challenges such as competition
from foreign imports, high fuel and other operating costs, labor shortages, and regulatory
burdens (Garrity-Blake and Nash 2007). Finally, we examined the extent to which
emerging initiatives such as working waterfront legislation, seafood branding efforts, and
direct marketing models are familiar to and considered beneficial by industry members.

6
Clams Prepared for Grading and Bagging
(Photo by B. Garrity-Blake)
Methods
As a baseline for this inventory, we began with a list of wholesale seafood
facilities identified in 2006. We contacted as many of these businesses as possible, and
employed snowball sampling techniques to compile an updated inventory of businesses
that were in operation as of summer and fall 2011. We also received updated lists of
seafood wholesalers and crab-picking operations from the North Carolina Division of
Marine Fisheries and Shellfish Sanitation Section under the N.C. Department of
Environment and Natural Resources.
As in the 2007 inventory, we define a “fish house” as a facility that packs North
Carolina wild-caught finfish and/or shellfish primarily for wholesale distribution. Many
variations were included in our sample, such as companies that sell imported as well as
domestic products, companies that conduct retail as well as wholesale sales, and
companies that process value-added products. Most, but not all, facilities identified were

7
water dependent. We excluded mariculture and softshell crab businesses, and other
companies that do not purchase wild-caught products from North Carolina fishermen. We
also excluded small operators who hold a dealer’s license, but do not run a packing
facility serving local harvesters.1
We divided our sample into three regions according to boundaries established by
the North Carolina Division of Marine Fisheries: the northeast region (Currituck,
Pasquatank, Chowan, Hertford, Bertie, Tyrrell and Dare counties), the central region
(Beaufort, Hyde, Pamlico and Carteret counties), and the southeast region (Onslow,
Pender, New Hanover and Brunswick counties). The northeast region encompasses the
northern Outer Banks and the Albemarle Sound, and includes fishing ports such as
Elizabeth City, Wanchese and Hatteras Village. The central region is a vast area,
including Pamlico Sound and associated rivers and creeks, harboring western ports like
Engelhard, Swan Quarter and Belhaven, as well Core Sound ports like Cedar Island,
Davis and Beaufort. The southeast region has no major estuary, and includes commercial
fishing sites at Sneads Ferry, Varnamtown and Holden Beach.
Of the 83 facilities identified as currently operating, we interviewed 54 seafood
processors (65 percent). Some interviews were conducted face-to-face during site visits,
while others were conducted by telephone. We asked questions similar to our 2006
survey for comparative data, and sought information on new trends and initiatives as well
(Appendix B). Virtually all company representatives were willing to participate in our
survey, keen to describe specific challenges with which they were dealing. Almost all
1 License data on seafood dealers does not reflect the number of wholesale seafood facilities serving multiple fishermen. For example, 832 individuals held fish dealer licenses in 2011 (North Carolina Division of Marine Fisheries 2011), compared to the 83 packing facilities we identified in our current inventory.

8
respondents indicated a willingness to participate in any future research that would
determine the economic value and significance of the seafood industry to North Carolina.
Working Waterfront in Hatteras, North Carolina
(Photo by B. Garrity-Blake)
The Inventory
Research during the summer and fall of 2011 enabled us to update as well as
revise numbers calculated for the 2006 inventory.2 Tracking the status of fish houses
identified as open in 2006 (n=92), 14 additional closures have occurred within the last
five years. At the same time, 5 new facilities opened that created working waterfront area
2 Numbers were revised because 10 wholesale operations were overlooked in our initial survey. Also, three businesses formerly under contract and counted as “closed” continue to operate as fish houses because the real estate transactions fell through. We therefore went back and counted them as open in the 2006 tally.

9
in new or long-dormant sites.3 The 14 closures and 5 new openings resulted in a net loss
of 9 wholesale seafood facilities from 2006 to 2011 (n=83), or a 9.78 percent decline in
the past five years. We counted 83 fish houses currently in operation in North Carolina,
compared to 92 listed five years ago. Of these 83 facilities, 11 are certified to pick
crabmeat, compared to 15 in 2006.
Initially, we calculated a 33.3 percent decline in fish houses from 2001 to 2006.
With our revised figures, the decline is not as sharp: 38 of 130 facilities identified had
closed since 2001, representing a 29.2 percent decline from 2001 to 2006 (Figure 1). The
reduction is steep, however, compared to the more recent decline of 9.78 percent.
Figure 1: Number of Operating N.C. Fish Houses for 2001, 2006, 2011
Altogether, we found a net loss of 47 fish houses in North Carolina since 2001, or a 36.1
percent decline in the past decade, with 83 facilities operating today (Table 1).
3 Businesses taking over working fish houses were not counted as additional facilities in our inventory because this maintains, rather than increases, processing capacity.

10
2001 2006 2011 2001-2011
Number Open 130 92 83 Number Closed (Net) 38 9 47 Percent Change -29.2 -9.78 -36.1
Table 1: Number of Fish Houses and Closures in N.C. 2001 to 2011
As was the case in our 2006 inventory, the majority of fish house closures
occurred in the coast’s central region. Of the 47 fish houses identified as open in the
central region in 2006, 10 have since closed compared to 2 closures in the northeast and 2
in the southeast. All but one of the 5 newly opened facilities were located in the central
region as well, bringing the net number of closures to 6 for that area.
The fact that the coast’s central region showed the highest fluctuation in number
of seafood businesses is due to a variety of factors. First, the geographical boundaries of
the central region are vast — from western Pamlico Sound communities to Core Sound
communities in Down East Carteret County — and include the highest number of fishing
communities and associated facilities. Second, seafood companies along the western edge
of Pamlico Sound are especially vulnerable to high fuel prices, inshore regulations and
water quality issues, while facilities in the northeast and southeast regions have, for the
most part, easier access to both ocean and sound fisheries.4 Core Sound fisheries have
shown a dramatic decline as well. Thirty years ago “the poundage of commercial catch in
4 Fuel prices have made it increasingly cost prohibitive for larger vessels to traverse Pamlico Sound to the ocean. Small-boat operators have been restricted from trawling in certain bays and rivers near their communities and must expend more fuel to reach harvest areas. Also, southern flounder regulations eliminated the “pan-size” market for small operators, and dockside crab and shrimp prices remain stagnant. A socioeconomic study of North Carolina fishermen found that overall, ocean fisheries have held or increased in value in recent years, compared to declining values of estuary fisheries (Crosson 2009).

11
this small area exceeded that of any other region of the North Carolina coast with the
exception of the Atlantic Ocean,” yet seafood values from Core Sound today are about
one-fifth of what they were in 1995 (Crosson 2007b, North Carolina Division of Marine
Fisheries 2011).
Several factors contribute to the slowdown in fish house closures, including
emerging market strategies and initiatives described below. The fact that we find nearly a
10 percent reduction versus an almost 30 percent reduction in our earlier survey should
also be considered in context of a deflated real-estate market and an ongoing recession, as
coastal property values plunged after 2007.5 The depressed real-estate market affected
those wishing to sell working waterfront property. Case in point: three fish houses that
we tracked, slated to sell in 2006, continue to operate as seafood wholesale businesses
today because the contracts reportedly fell through. The collapse of the housing market
decreased non-fishing job opportunities in construction and associated industries as well.
Although numerous strategies and initiatives are proving helpful to the seafood business,
and some companies holding key fishing permits are flourishing and even expanding, a
strong rebound of the coastal real-estate market would likely be accompanied by an
uptick in the rate of fish house closures.6
5 The North Carolina Association of Realtors reports that the average sale of an existing home fell 11 percent statewide and 25 percent in coastal areas since 2007. The 2011 property revaluations for Carteret and Brunswick counties show waterfront values dropping 25 percent or more (Price 2011). 6 It remains to be seen if the 36 percent decline in fish houses in the last decade represents the loss of critical production and associated infrastructure needed to sustain today’s industry or a stabilization of the industry with less overall processing capacity and competition.

12
Shrimp Trawl Gear
(Photo by B. Garrity-Blake)
2007 Waterfront Access Legislation
In response to an unprecedented level of coastal development along North
Carolina’s beaches, sounds and rivers, the North Carolina General Assembly enacted
legislation in 2007, including two significant measures addressing the issue of waterfront
access to public trust waters. First, a $20 million Waterfront Access and Marine Industry
(WAMI) fund was established for the state to purchase properties for public access sites.
Thirteen properties were purchased, with supplemental funding, in the three coastal
regions. These sites are in various stages of completion. Projects have mainly taken the

13
form of boat ramps for recreational boaters and commercial fishermen, with plans in
selected areas for commercial dockage as well (Appendix C).7
The second legislative action pertinent to the seafood industry was the expansion
of an existing Present Use Value (PUV) taxation program used for agriculture,
horticulture and forestry to waterfront commercial fishing operations and commercial
pier owners. PUV taxation serves as a property tax break that enables businesses to pay a
lower rate based on the use of the property rather than the current real-estate value. The
difference is deferred annually unless or until the property changes use.
PUV taxation for working waterfront properties is probably the most directly
effective piece of the 2007 legislation for the seafood industry. However, we found low
awareness of this program among seafood wholesalers. Of 54 respondents, almost half
(n=24 or 44.4 percent) were unaware of the PUV program. Several respondents were
surprised to learn of the program through our survey and expressed an intention to
explore the option for the next tax year.
We were especially interested in the extent to which waterfront businesses,
presumably eligible for PUV taxation, took advantage of the tax break. We surveyed 45
respondents with waterfront fish houses, 24 of whom were aware of the PUV legislation
(53 percent). Of the 24 respondents familiar with PUV, however, only eight said they
took advantage of the tax break. The 16 respondents who did not make use of PUV
taxation cited a variety of reasons. About a third leased their property and were simply
not eligible for the program. The remaining few expressed a variety of reasons for not
pursuing PUV taxation, including a reluctance to take advantage of government
7 With the decline in the number of fish houses and dockage statewide, coupled with the rise in fuel prices, some fishermen are turning to smaller operations and launching boats at ramps via trailer. It is not uncommon to see seafood transportation trucks loading at harbors and boat ramps, as well as at fish houses.

14
assistance, a distain for additional paperwork, and a dislike for deferred taxes that would
have to be paid eventually should the property change use. In addition to information
collected from seafood wholesalers, we surveyed tax offices in coastal counties and
found that Brunswick County had the most PUV working waterfront parcels (17),
followed by Carteret (7) and Dare (4).8
Those who took advantage of PUV taxation reported saving from $3,000 to
$5,000 in property taxes per year, and were satisfied with the program. No one
characterized PUV as key to their survival, but found the tax break helpful. A fish house
owner summed it up by saying, “every little bit helps.” Therefore the relatively small
number of people now using Present Use Value taxation is less a reflection of the
program’s effectiveness and more a matter of low awareness that the opportunity exists.
This scenario underscores a need for the state to better communicate legislative changes
and programs to targeted communities.
Market Trends
In this section, we describe market trends and emerging strategies employed by
seafood wholesalers to adapt to the challenges they face. The majority of dealers
surveyed, particularly those who sold strictly wholesale, participate in interstate trade in
long-established Eastern Seaboard markets to New York, Philadelphia, Baltimore and
Virginia, as well as south to Florida and as far west as Texas. Less than 10 respondents
said they sold to overseas markets, including Canada, China, France, Japan and Korea.
Many respondents sold seafood to markets and restaurants within North Carolina, as
8 A News and Observer reporter surveyed tax offices in coastal county in 2011 and found “about two dozen” seafood wholesalers that had taken advantage of PUV taxation, half of which were in Brunswick County (Price 2011).

15
well: 39 percent said they sold the majority of their product to in-state markets, while 44
percent shipped the majority of product out of state. Also, 17 percent reported a 50/50
split between in and out-of-state markets. Some dealers took part in profitable local foods
markets further inland, and a few used overnight shipping to transport local seafood to
community supported agriculture marketers located in the state’s piedmont area. In
general, North Carolina seafood was more likely to enter interstate commerce if a fish
house was strictly engaged in the wholesale trade.
We asked survey participants to estimate what percentage of their annual sales
derived from domestic and imported seafood. Over half (63 percent) reported dealing in
domestic seafood only. Of those dealing in domestic seafood only, 57 percent said they
bought product strictly from North Carolina fishermen, while others also bought product
from Gulf Coast and Atlantic Seaboard states. Also, 35 percent of respondents said they
sold a mix of domestic and imported products. The ratio of imported to domestic seafood
ranged from 1 to 50 percent imported, but most of those surveyed who dealt in imports
reported that anywhere from 20 to 40 percent of seafood sold was imported. Imported
products include catfish, crabmeat, king, Dungeness and snow crab legs, flounder,
grouper, mahi-mahi, salmon, sea trout, shrimp, snapper, sword, tilapia, tuna, and wahoo.
The blue crab fishery continues to be the state’s most valuable domestic seafood
product. The profitable markets for soft crabs and live hard crabs are in Maryland and
New York. Shrimp, the second most valuable fishery despite low market prices, is sold to
North Carolina retail marketers or processors with the capability to freeze and sell
volume to interstate grocery chains and food distributors. Surplus shrimp is sold to Gulf
Coast processors known as “breaders.” These are high-volume food manufacturers that

16
comingle foreign and domestic shrimp and create a number of value-added products for
economy markets, such as battered-and-breaded frozen shrimp. Local oysters are sold in
state or to markets in Virginia and Maryland. Snapper and grouper are sold to Canada;
dogfish are shipped to Europe; and Asian traders favor flounder, squid and crabs. Other
local commodities cited by respondents include clams, croaker, bluefish, mackerel, mahi-
mahi, mullet, sea bass, speckled trout, spot, striped bass, triggerfish, tuna and weakfish.
A promising trend for the North Carolina seafood industry is the widespread local
foods movement, a consumer-driven emphasis on whole, local foods and community-
based food systems as opposed to industrialized, processed foods. Heightened consumer
awareness of the environmental and human health costs of farm-raised imported seafood
has resulted in more consumers asking about the origins of seafood and requesting fresh,
locally harvested products. A 2008 University of North Carolina at Chapel Hill survey of
North Carolina seafood consumers found that supporting local fishing communities
factored into the purchasing decisions of 94 percent of respondents (O’Sullivan and
Anderson 2008). A 2010 survey conducted by University of North Carolina at
Greensboro at the North Carolina Seafood Festival in Morehead City showed that 84
percent of respondents preferred local seafood over imports when given a choice (Nash
and Andreatta 2011).9
We asked fish house owners if they had observed an increased demand for locally
caught seafood in recent years, with 67 percent noting that the demand for local seafood
has increased, while 17 percent noting that demand has remained stable over time. Also,
12 percent felt that demand for local seafood has not increased. One respondent
9 This reflects a national trend. Market research indicates consumers believe that local foods are of higher quality than imported (Sloan 2008). Consumers seek out authentic products that can be traced to a “special place,” such as Copper River Salmon, which bodes well for branding programs (Sloan 2007).

17
suggested that customers were more price-driven regardless of product origin. Four
percent were unsure because their customer base valued consistency of supply more than
product origin. These businesses routinely marketed both local and imported products to
ensure the continuity of their seafood inventory for grocery-chain and food-distributor
accounts.
Local seafood branding programs, also known as “local catch” groups, were
viewed favorably by seafood wholesalers familiar with the effort. Thirty-one percent of
respondents said that they were members of Carteret Catch, Brunswick Catch, Outer
Banks Catch or Ocracoke Fresh. Several dealers said that the higher profile these
programs have given local seafood had improved their sales. Yet, 69 percent of the
respondents did not participate or were unfamiliar with the programs, namely because
their businesses fell outside of “catch” group boundaries. Businesses in western
Albemarle and Pamlico sound communities, for instance, had no “local catch” programs
to join.
Several dealers reported that retail sales of seafood were more profitable than
wholesale. Some had only recently ventured into retail sales, diversifying their business
as a survival strategy in a tough economy. Also, 67 percent of respondents operated retail
outlets to augment their wholesale businesses. Retail was seen as more profitable than
wholesale because dealers can set prices and receive money at the point-of-sale. One
dealer said, “Retail pays the bills while wholesale breaks even.” Another dealer noted his
retail business had been “a big help” given declining prices for his shrimp in the
wholesale sector. A third noted that his retail store had “really improved” his margins.

18
The manager of Ocracoke Seafood Company, a fish house run by the non-profit
Ocracoke Working Watermen’s Association since 2005, credits their retail market as the
sector that boosted annual sales from $383,589 in 2006 to $921,454 in 2010 (OWWA
2011). “You’ve got to target all markets,” the manager emphasized. “High-end, volume,
retail — all of it.”
Some processors received a better price for products by preparing and/or selling
value-added items such as crab cakes and stuffed flounder. Nearly 29 percent of
respondents manufactured or marketed items such as frozen crab cakes, deviled crabs,
ready-to-eat salads and spreads, stuffed fillets or shrimp, bacon-wrapped scallops,
restructured scallop “medallions,” smoked fish, frozen oysters on the half shell, and
peeled-and-deveined shrimp. A dealer indicated that his value-added seafood sold best
during the summer season and at holidays. Dealers who did not offer value-added
seafood cited the capital-intensive nature of value-added production, insufficient labor to
diversify into new ventures, or the ultra-competitive market for new products from large
grocery chains and interstate food distributors.
The Community Supported Fisheries (CSF) model, a relatively new direct-
marketing system whereby members (typically from inland metropolitan areas) buy
shares of seafood in advance and have it delivered fresh, was less familiar to wholesalers
and received mixed reviews.10 Sixty percent were unfamiliar with CSFs, while 34 percent
were aware of the concept. Two respondents operated their own CSFs. Of those who
were familiar, comments were varied: a CSF was said to be “better suited for retailers
than wholesalers”; CSFs seemed to be “a lot of work”; and an oversupply of certain
10 The first CSF was piloted in Carteret County in 2008 with support from the North Carolina Fishery Resource Grant Program. The concept has since spread across the nation and to Canada, Europe and Australia (Nash and Andretta 2011).

19
commodities “could undermine contracts,” leading to the collapse of pre-arranged sales
agreements. A dealer noted that CSFs would be beneficial if businesses catered to a high
wage-earning demographic that could pay premium prices for local seafood. A couple of
dealers complained that CSFs “took too much seafood out of the community” and that
CSF owners “wanted it both ways,” selling high-end products to customers and then
wanting to “dump” the remainder at fish houses.
The use of the Internet and social media was not widespread among respondents.
Most (69 percent) had no Internet presence at all. But 17 percent had websites or were
relying on websites operated by local seafood educational initiatives to raise the visibility
of their businesses. Two companies advertised with a website/Facebook combination and
another used a website/Google Adwords combination to connect with customers. Only
six percent of those responding were using Facebook to advertise their businesses, and
were pleased with the consumer traffic they had received as a result. Just one respondent
reported maintaining a presence on Twitter.
We asked respondents if their business had changed for the better or worse during
the last five years and what factors allowed them to stay engaged in the commercial
seafood industry. Fifteen percent said their businesses had improved, while 21 percent
reported their sales had remained stable. Ten percent indicated their business
performance had fluctuated between “good and bad,” and a full 46 percent said their sales
had worsened over time. A prominent wholesale dealer summed up his business this way:
wholesale is a high-volume, low profit-margin enterprise. Profits decline in direct
proportion to a reduction in the volume of seafood sold. Price remains the deciding factor

20
among his in-state grocery chain clients and interstate food distributors, even among
customers that prefer North Carolina commodities over imports.
The majority of those with improved sales took part in one or several of the
abovementioned strategies: retail sales, value-added products, state and regional “wild-
caught” branding programs and advertisements, and Internet and social media. Other
strategies included offering customers recipes with their purchase and playing
educational seafood videos in their retail store. Many pointed out that those with the
“right” permits, namely sea scallop permits, were most successful. One wholesaler, for
example, was able to expand his business due to the high value of sea scallops, and
planned to open a restaurant that featured local seafood. One of the largest seafood
companies in North Carolina expanded to a global scale years ago with a presence in
Europe and South America, and attributed its success to “the Good Lord” and having a
presence on the global stage.
Davis Seafood, Sneads Ferry, North Carolina
(Photo by B. Garrity-Blake)

21
“Your success today is determined by how you set yourself up in the past.”
Seafood Processor, Wanchese, North Carolina
Current Issues
North Carolina has a rich and diverse fisheries environment, including regional
differences, gear types, fishing methods, markets and issues. In this section, we will
describe across-the-board issues that seafood dealers frequently cited, with some regional
or fishery-specific examples. The top issues cited by respondents can be grouped into
three categories: access to fisheries resources, labor and economics. Responses were
more or less consistent with a study of North Carolina seafood dealers that found the top
issues to be regulations and closures that restrict product supply, competition with
imported products, and low market prices (Hadley and Crosson 2010).11
Access to Resources
The most frequent complaint from industry members pertained to what they see as
the mismanagement of particular fisheries resulting in loss of access to fish. “The
management councils have too much power and manage according to politics, not
science,” said a New Hanover County dealer. Black sea bass, for example, a federally
managed limited-access fishery, recently lost much of its economic viability for North
Carolina fishermen due to trip limits, size limits, and a shortened season that eliminated
an important winter sea bass fishery. “The window for black sea bass became very small,
and when it opened, all permit holders jumped in and the price crashed,” explained a
11 McInerny and Bianchi concluded that depressed ex-value prices and declining harvests since 1997 were primarily due to regulations and natural fluctuations in fisheries stocks (2009).

22
Carteret County seafood dealer. A New Hanover County processor said, “Every charter
boat fisherman used to go sea bass potting in the winter — now the bass population is
exploding and nobody can catch them.” An Onslow County wholesaler remarked that his
family was negotiating the sale of their fish house, a decision triggered by the “last straw”
of losing the winter black sea bass fishery. “That kept us afloat in the winter, and now we
can’t fish till June. The annual quota will be caught up in five or six weeks.”12
A similar scenario has unfolded for other fisheries: a Brunswick County processor
almost entirely dependent on vermilion snapper or “bee-liners” is now struggling
economically after sharp harvest reductions. “We went from a year-round fishery to a six-
week fishery,” he stated. “Yet, the waters are stacked with vermilion.” The annual
dogfish quota for North Carolina was caught in about 15 days in 2011; the annual striped
bass quota has been known to fill within days as well.13 “I’m not against regulations,”
said a processor. “It’s just gotten out of hand.” A recently imposed 100-pound trip limit
on weakfish for Atlantic coast fishermen has increased the problem of regulatory discards
and created difficulties in a variety of harvest methods that catch weakfish as bycatch.
“Last year’s trout (weakfish) limits from the ASMFC put a stop to long-hauling,” said a
Down East seafood dealer. “We can’t afford to haul and catch over the limit.” The
Atlantic States Marine Fisheries Commission manages the shared fisheries for 15
Atlantic Coast states from Maine to Florida.
12 The dealer added that his family’s fish house will likely become a high-end marina after it is sold, and expressed concern that “commercial boats won’t be able to afford dockage — waterfront access will get tighter.” 13 Striped bass was declared fully recovered by the federal government in 1995 but continues to be tightly restricted. A Dare County processor felt that increased predation from striped bass — as well as dogfish —was linked to a scarcity of weakfish “who lives up to his name and can’t get out of his own way.”

23
Harvest restrictions, quotas and limited access have made it difficult for many
wholesalers to sustain high-volume markets. “We need volume,” said a Dare County
processor. “Let somebody catch something instead of shoving everyone in a corner.”
Limited-access fisheries can be lucrative for permit holders, but often leads to
consolidation in the hands of a few and robs North Carolina fishermen of much-needed
flexibility in moving from fishery to fishery. “Sea scallops is the only part of the seafood
industry moving forward, with consolidation in that fishery,” observed a Carteret County
dealer. Permit costs are driven up as larger companies accumulate shares. For example,
federal sea scallop and ground fishery permits can sell for well over $1million per permit
— out of range for most small-boat fishermen and fish companies.14 Even those holding
permits are not guaranteed security. “We invest so much money in permits,” a processor
pointed out, “but then have no say in management.”
Although restrictions and quotas were cited by respondents as the primary barrier
to accessing fishery resources, changing climatic conditions were mentioned as well.
Warmer water temperatures in late fall, for example, are believed to delay or discourage
the southern migration of northern fish, such as American croaker. “They’re staying north
longer,” said a Dare County dealer. “We’ve had too many brokers and not enough
croakers!” The summer of 2011 was especially hot, and at least one processor wondered
if a poor shrimp and fish season was linked to higher water temperatures. Severe
nor’easters and hurricanes — nothing new to eastern North Carolina — have taken an
especially harsh toll on fishing communities in recent years. Hurricane Irene wreaked
havoc in the central and northeastern coastal communities, damaging fish houses, gear
14 The federal catch-share system, granting individuals, communities or organizations a quota share, only seems to exacerbate the trend toward the privatization and capitalization of U.S. fisheries.

24
and some navigable areas. Long-term effects on fish and shellfish stocks remain to be
seen.15
Labor
Labor issues figured prominently in our survey as seafood dealers complained of
too few harvesters landing product, and in particular a lack of young fishermen. “We
need fishermen,” said a Dare County processor. “We are completely dependent on them.”
Operating costs (e.g, equipment, bait, fuel, repairs, permits) and the cost of living (e.g.,
insurance, mortgage payments, utilities, groceries) were cited as reasons young people,
especially those with families, are disinclined to enter or stay in commercial fishing.
“They can’t bear the risk,” a dealer pointed out. “How can they invest in permits when
they don’t know what the government will shut down next?”
The reduction and aging of the state’s seafood labor force is supported by data
from the North Carolina Division of Marine Fisheries, showing a decline in the number
of Standard Commercial Fishing License holders and an increase in Retired Commercial
Fishing License holders from 2000 to 2010 (Table 2). A series of socioeconomic studies
of Albemarle-Pamlico Sound (Crosson 2007a), Core Sound (Crosson 2007b) and Atlantic
Ocean (Crosson 2009) fisheries showed the average age of fishermen to be 51.
15 North Carolina commercial fishermen received no state-funded disaster relief in the aftermath of Hurricane Irene. This is in contrast to past catastrophes such as Hurricane Floyd (Cheuvront 2005).

25
Year Standard Commercial
Retired Commercial
Total Commercial
2010 5,547 1,104 6,651 2005 6,301 754 7,055 2000 6,990 514 7,504
Table 2: Number of Standard and Retired Commercial Fishing License Holders
(Source: North Carolina Division of Marine Fisheries 2011)
Labor shortages are affecting shore-based operations as well, as processors
reported a need for fish house workers. “Even the Hispanics are leaving,” said a Dare
County dealer. Numerous respondents complained about the difficulty of finding
dependable, hard-working employees. Several wholesalers said that having family
members work in the business was their saving grace.
The crabmeat-processing industry, greatly dependent on Latino workers since the
1990s, is grappling with changes in the H2-B visa program for temporary workers. The
U.S. Department of Labor is implementing increases in hourly wage requirements. North
Carolina processors, who pay on the average of $7.41 an hour, are facing a wage hike
requirement of more than $3 per hour (Turano 2011).
Outcry from crab-processing companies already struggling with slim profit
margins resulted in a delay, however, as this proposal is being reviewed on a permit-by-
permit basis. “This wage hike will destroy us,” a processor said. “We can’t find local
labor to fill the void — that’s why we had to go to the visa program in the first place.”
According to a Maryland study, every lost H2-B visa job leads to an estimated loss of
2.54 domestic jobs (Lipton 2008). Following this formula, a loss of 206 H2-B visa
workers would lead to an estimated loss of 523 domestic jobs throughout the North
Carolina coastal economy, and $7.9 million in revenue (Efland 2011).
26
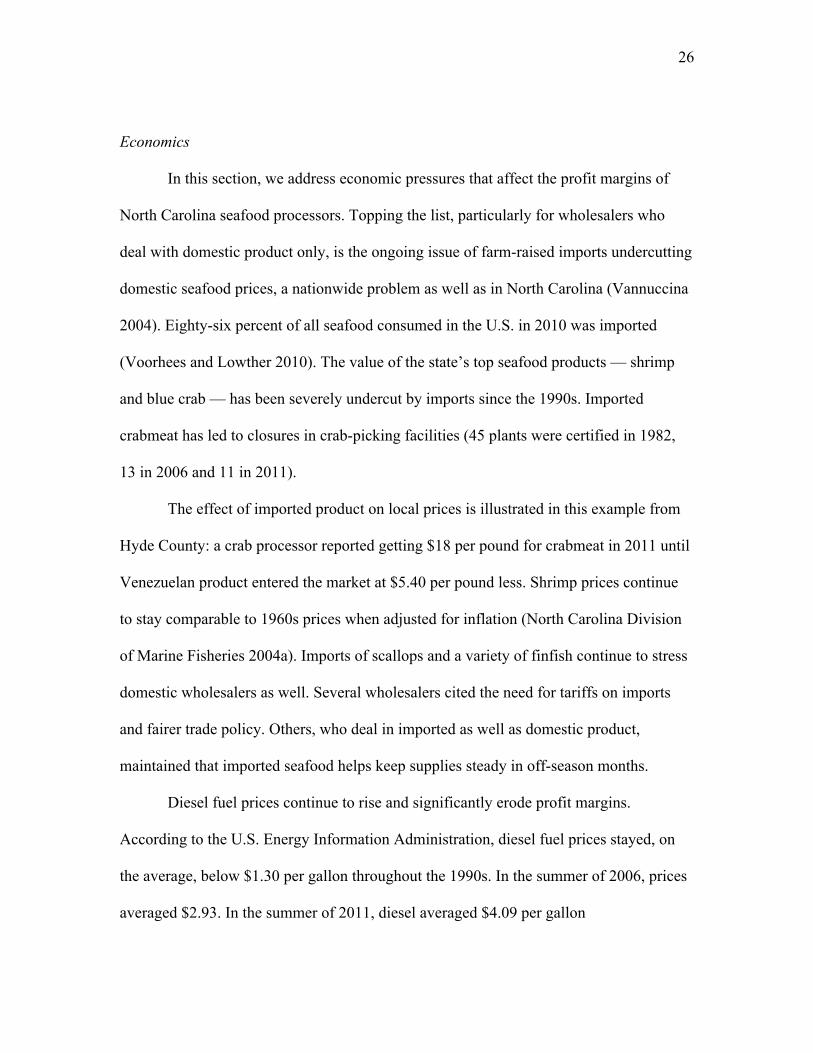
Economics
In this section, we address economic pressures that affect the profit margins of
North Carolina seafood processors. Topping the list, particularly for wholesalers who
deal with domestic product only, is the ongoing issue of farm-raised imports undercutting
domestic seafood prices, a nationwide problem as well as in North Carolina (Vannuccina
2004). Eighty-six percent of all seafood consumed in the U.S. in 2010 was imported
(Voorhees and Lowther 2010). The value of the state’s top seafood products — shrimp
and blue crab — has been severely undercut by imports since the 1990s. Imported
crabmeat has led to closures in crab-picking facilities (45 plants were certified in 1982,
13 in 2006 and 11 in 2011).
The effect of imported product on local prices is illustrated in this example from
Hyde County: a crab processor reported getting $18 per pound for crabmeat in 2011 until
Venezuelan product entered the market at $5.40 per pound less. Shrimp prices continue
to stay comparable to 1960s prices when adjusted for inflation (North Carolina Division
of Marine Fisheries 2004a). Imports of scallops and a variety of finfish continue to stress
domestic wholesalers as well. Several wholesalers cited the need for tariffs on imports
and fairer trade policy. Others, who deal in imported as well as domestic product,
maintained that imported seafood helps keep supplies steady in off-season months.
Diesel fuel prices continue to rise and significantly erode profit margins.
According to the U.S. Energy Information Administration, diesel fuel prices stayed, on
the average, below $1.30 per gallon throughout the 1990s. In the summer of 2006, prices
averaged $2.93. In the summer of 2011, diesel averaged $4.09 per gallon

27
(http://www.eia.gov/petroleum/gasdiesel/). Seafood dealers are affected by high fuel
costs both on and off the water. Fishermen who pay some $4,000 to fill a 1,000-gallon
tank are less inclined to take chances burning fuel in search of fish. Seafood
transportation companies are disinclined to send trucks to distant packing houses with
frequency unless a high volume of product can be assured. Wholesalers who fuel their
own boats and trucks experience the impact of high fuel costs even more directly.
Conditions beyond the control of industry members make fuel conservation
difficult. North Carolina’s recent large-mesh gillnet requirements, for example, compel
fishermen to make two runs per day to fishing grounds rather than one, burning twice the
fuel for the same amount of catch. A reduction in federal funds for dredging waterways
and inlets has an economic impact on the seafood industry, as well. Vessels packing out
of Varnamtown, for instance, have been unable to pass through the shoaled-up Lockwood
Folly Inlet since 2009 and must now steam up the Intracoastal Waterway to the Cape
Fear River at Southport to reach the ocean, burning more fuel. Severe shoaling of Oregon
Inlet has been an issue for years, forcing larger vessels from Wanchese and northeastern
fishing ports to offload their catch in Virginia or north. An overall reduction in haul-
out/repair facilities has necessitated vessels to steam further for routine maintenance as
well.16
16 The lack of working waterfront areas (e.g., haul-out facilities and dockage) for larger vessels remains an issue in North Carolina. For example, Hatteras Island has one remaining boat yard, and it is currently for sale. A fish house owner expressed interest in securing a working-waterfront conservation easement for his property, but to do so would require new legislation.

28
Conclusion and Recommendations
North Carolina accounts for some 23 percent of the total value of seafood
landings from Florida to New York (McInerny and Bianchi 2009), and the economic
impact of seafood dealers in state is estimated to be $255 million (Hadley and Crosson
2010). Although the rate of fish house closures and the associated loss of working
waterfront and domestic seafood processing capacity has slowed compared to our 2006
assessment, it could worsen if the real estate market improves in the near term. Loss of
access to fishery resources remains a prime issue as quotas, limited entry fisheries, and
tighter state and federal fishing restrictions reduce harvest options and flexibility. Other
issues that threaten the viability of the industry include the aging of fishing participants,
the influx of cheaper seafood imports, and the shortage of labor to catch and process
seafood.
Domestic wholesale processors are adapting to economic pressures in a variety of
ways, including diversifying into retail sales, offering value-added products that
command higher market prices, capitalizing on local seafood branding efforts and the
local foods movement, and developing websites or experimenting with social media to
both educate consumers and increase seafood sales. These emerging initiatives were cited
as positives in depressed economy. Some businesses appear to be transitioning from high
volume to more localized and diverse markets. The success of Ocracoke’s fish house, run
by a non-profit fishermen’s association, is an example of an innovative model with a
promising outlook.
The 2007 Waterfront Access legislation grew out of a concern for declining
working waterfront and water access. Although legislation enabled the state to acquire

29
properties for commercial and recreational use, this has mainly taken the form of boat
ramps for smaller vessels, and industry members continue to worry about the loss of dock
space for larger vessels and the loss of access to fuel, ice, seafood packing/ distribution
and repair facilities. The Present Use Value taxation program is viewed as beneficial by
those who have taken advantage of it, but our survey indicates a low level of awareness
that the program exists.
The following are recommendations arising from this study to better support
small businesses involved in the domestic seafood industry and strengthen seafood-
processing capacity in North Carolina.
1. Reconvene the Waterfront Access Study Committee to review the effectiveness of
legislative actions and identify actions not yet enacted that would further the goal
of waterfront access and better position the state for potential federal funds. E.g.,
consider legislative authorization of voluntary working waterfront conservation
easements and the creation of a state Seafood Development and Working
Waterfront Preservation Trust fund similar to that for farmlands in GS 106-744.
2. Increase state funding for branding and marketing, including support for the
umbrella organization N.C. Catch (that supports Carteret Catch, Brunswick Catch,
Outer Banks Catch and Ocracoke Fresh) and the establishment of area-specific
programs for areas not yet covered such as: Albemarle, Pamlico, Onslow, New
Hanover and Pender counties. Explore the establishment of shared-use
infrastructure for the North Carolina seafood industry to aggregate and hold
frozen product to enhance profitability. The Hazard Analysis & Critical Control

30
Points (HACCP) certification, a shared seafood-safety monitoring program,
would alleviate the burden of paperwork on individuals. The ability to freeze
product, such as shrimp, would help address the periodic glut of seafood that
results in substantial drops in market prices when supply exceeds demand.
3. Support ongoing efforts to establish/strengthen supply chains and transportation
routes to inland markets in North Carolina where demand for local seafood is
high. This would complement existing routes to interstate-wholesale markets
along the Eastern Seaboard.
4. Hold workshops on energy efficiency for commercial- and recreational-vessel
owners, and make available grants or low-interest loans to replace or upgrade
commercial gear and vessel engines for greater fuel efficiency similar to what is
offered in Alaska (http://www.commerce.state.ak.us/ded/fin/vgu.cfml).
5. Explore ways to incentivize fishing as a small business to better support existing
participants and help recruit new entrants into the seafood industry. For example,
a high-school junior fishermen apprenticeship program in partnership with the
fishing industry and North Carolina State University engineers could enlist youth
to learn how to fish commercially (qualifying for one of 1,500 available licenses)
and help explore/develop alternative fuels and gear innovations that would benefit
the industry.
6. Explore ways to better leverage a sustainable source of state and federal funds for
dredging harbors and inlets to protect North Carolina’s seafood industry.

31
References
Cheuvront, Brian
2005. Lasting Impacts of Hurricanes on North Carolina’s Commercial Fishermen: Follow-Up Survey. N.C. Department of Environment and Natural Resources, N.C. Division of Marine Fisheries, Morehead City, NC.
Crosson, Scott
2009. A Social and Economic Analysis of Commercial Fisheries in North Carolina: Atlantic Ocean. N.C. Department of Environment and Natural Resources, N.C. Division of Marine Fisheries, Morehead City, NC.
2007a. A Social and Economic Analysis of Commercial Fisheries in North Carolina: Albemarle and Pamlico Sounds. N.C. Department of Environment and Natural Resources, N.C. Division of Marine Fisheries, Morehead City, NC.
2007b. A Social and Economic Analysis of Commercial Fisheries in North Carolina: Albemarle and Pamlico Sounds. N.C. Department of Environment and Natural Resources, N.C. Division of Marine Fisheries, Morehead City, NC.
Efland, Brian
2011. Economic Impact of H2-B Visa Workers in the North Carolina Crab Processing Industry. Publication # UNC-SG-12-04B. North Carolina Sea Grant, Raleigh, NC.
Garrity-Blake, Barbara and Barry Nash
2007. An Inventory of North Carolina Fish Houses. Publication # UNC-SG-07-06. North Carolina Sea Grant, Raleigh, NC.
Hadley, John and Scott Crosson
2010. A Business and Economic Profile of Seafood Dealers in North Carolina. N.C. Department of Environment and Natural Resources, N.C. Division of Marine Fisheries, Morehead City, NC.
Lipton, D.W.
2008. An economic analysis of guest workers in Maryland’s blue crab industry. Publication # UM-SG-SGEP-2008-01. Maryland Sea Grant Extension, College Park, Md.
McInerny, Stephanie A. and Alan J. Bianchi
2009. An Economic Profile Analysis of the Commercial Fishing Industry of North Carolina Including Profiles for Interjurisdictionally-Managed Species. N.C.

32
Department of Environment and Natural Resources, N.C. Division of Marine Fisheries, Morehead City, NC.
North Carolina Division of Marine Fisheries
2011. North Carolina License and Statistics Section Annual Report. N.C. Department of Environment and Natural Resources, N.C. Division of Marine Fisheries, Morehead City, NC. 2004. Understanding the Value and Importance of North Carolina’s Marine Fisheries: A Workshop in Socioeconomics. N.C. Department of Environment and Natural Resources, N.C. Division of Marine Fisheries, Morehead City, NC.
Mosher, Katie.
2011. Local Catch…And the Survey Says: Local Seafood Reigns. Coastwatch, Winter. Available at http://www.ncseagrant.org/home/coastwatch/coastwatch-articles?task=showArticle&id=688. North Carolina Sea Grant, Raleigh, NC.
Nash, Barry and Susan Andreatta.
2011. New Business Models for Small-Scale Fishermen and Seafood Processors. Publication # UNC-SG-11-05.North Carolina Sea Grant, Raleigh, NC,
Ocracoke Working Watermen’s Association.
2011. Fish House News. End of Summer Report. O’Sullivan, R.G. and Anderson, A.
2008. “Collaborative Evaluation Marketing Assessment.” Evaluation, Assessment & Policy Connections.
Price, Jay
2011. Push to protect coast’s flavor and accessibility gains traction. News and Observer, April 15.
Sloan, Elizabeth.
2007. Supermarkets Take a ‘Fresh’ Approach. Food Technology. 61(3):32. Sloan, Elizabeth. 2007. Top 10 Food Trends. Food Technology, 61(4):35. Sloan, Elizabeth. 2008. Top 10 Functional Food Trends. Food Technology, 62(4):37. Turano, Marc J.
2011. Wage Survey of North Carolina Crab Processors. Publication # UNC-SG-12-04A. North Carolina Sea Grant, Raleigh, NC.
United States Energy Information Administration
33
2012. Gasoline and Diesel Fuel Update. Accessed March 15, 2012. http://www.eia.gov/petroleum/gasdiesel/.
Vannuccina, Stefania
2004. Overview of Fish Production, Utilization, Consumption, and Trade. Food and Agriculture Organization Report, Data and Statistics Unit, Rome, Italy.
Voorhees, David Van and Alan Lowther. 2010. Fisheries of the United States. Office of Science and Technology, National Marine Fisheries Service, Washington, DC.
34
Appendix A
GENERAL ASSEMBLY OF NORTH CAROLINA
SESSION 2007
SESSION LAW 2007-485
SENATE BILL 646 AN ACT TO PROVIDE PROPERTY TAX RELIEF FOR WORKING WATERFRONT PROPERTY, TO ESTABLISH THE ADVISORY COMMITTEE FOR THE COORDINATION OF WATERFRONT ACCESS, TO MAKE EXPANDED PUBLIC ACCESS TO COASTAL WATERS A PRIORITY IN PLANNING STATE ROAD PROJECTS, TO INCREASE FEES FOR VESSELTITLING, TO WAIVE PERMIT FEES FOR EMERGENCY COASTAL AREA MANAGEMENT ACT PERMITS, AND TO DIRECT A STUDY OF CONSTRUCTION AND REPAIR IN REGULATED FLOOD ZONES, AS RECOMMENDED BY THE WATERFRONT ACCESS STUDY COMMITTEE. The General Assembly of North Carolina enacts: PART I. PROPERTY TAX RELIEF FOR WORKING WATERFRONT PROPERTY. SECTION 1. Article 12 of Subchapter II of Chapter 105 of the General Statutes is amended by adding the following new section to read: "§ 105-277.14. Taxation of working waterfront property. (a) Definitions. – The following definitions apply in this section: (1)Coastal fishing waters. – Defined in G.S. 113-129. (2)Commercial fishing operation. – Defined in G.S. 113-168. (3)Fish processing. – Processing fish, as defined in G.S. 113-129, for sale. (4) Working waterfront property. – Any of the following property that has, for the most recent three-year period, produced an average gross income of at least one thousand dollars ($1,000):
a. A pier that extends into coastal fishing waters and limits access to those who pay a fee. b. Real property that is adjacent to coastal fishing waters and is primarily used for a commercial fishing operation or fish processing, including adjacent land that is under improvements used for one of these purposes.

35
(b) Classification. – Working waterfront property is designated a special class of property under Section 2(2) of Article V of the North Carolina Constitution and must be appraised, assessed, and taxed on the basis of the value of the property in its present use rather than on its true value. Working waterfront property includes land reasonably necessary for the convenient use of the property. (c) Deferred Taxes. – The difference between the taxes that are due on working waterfront property taxed on the basis of its present use and that would be due if the property were taxed on the basis of its true value is a lien on the property. The difference in taxes must be carried forward in the records of each taxing unit as deferred taxes. The deferred taxes become due when the property no longer qualifies as working waterfront property. The tax for the fiscal year that opens in the calendar year in which deferred taxes become due is computed as if the property had not been classified for that year, and taxes for the preceding three fiscal years that have been deferred are immediately payable, together with interest, as provided in G.S. 105-360 for unpaid taxes. Interest accrues on the deferred taxes due as if they had been payable on the dates on which they originally became due. If only a part of the property no longer qualifies as working waterfront property, the assessor must determine the amount of deferred taxes applicable to that part and that amount becomes payable with interest. Upon the payment of any taxes deferred under this section for the three years immediately preceding a disqualification, all liens arising under this subsection are extinguished. (d) Application. – To obtain the benefit of this section, the owner of working waterfront property must submit an application for classification and exclusion to the assessor of the county in which the property is located, and the assessor must approve the application. An application must contain the information and be in the form required by the assessor. An initial application must be filed during the regular listing period of the year for which the benefit of this classification is first claimed or within 30 days of the date shown on a notice of change in valuation made pursuant to G.S. 105-286 or G.S. 105-287. A new application is not required to be submitted unless the property is transferred or becomes ineligible for classification under this section." PART II. ADVISORY COMMITTEE FOR THE COORDINATION OF WATERFRONT ACCESS. SECTION 2.1. There is established the Advisory Committee for the Coordination of Waterfront Access within the Department of Environment and Natural Resources. The Advisory Committee shall be composed of the following members: (1) The Secretary of Environment and Natural Resources or the Secretary's designee, Chair. (2) The Director of the Division of Coastal Management of the Department of Environment and Natural Resources or the Director's designee.

36
(3) The Director of the Division of Parks and Recreation of the Department of Environment and Natural Resources or the Director's designee. (4) The Director of the Division of Marine Fisheries of the Department of Environment and Natural Resources or the Director's designee. (5) The Director of the Division of Aquariums of the Department of Environment and Natural Resources or the Director's designee. (6) The Executive Director of the Wildlife Resources Commission or the Executive Director's designee. (7) A representative of the State Property Office appointed by the Secretary of Administration. (8) The Executive Director of North Carolina Sea Grant. (9) One local government representative appointed by the North Carolina League of Municipalities. (10) One local government representative appointed by the North Carolina Association of County Commissioners. SECTION 2.2. The Advisory Committee for the Coordination of Waterfront Access shall: (1) Develop a coordinated plan for providing greater waterfront access in the State. This plan shall specifically address geographic diversity of waterfront access, diversity of types of waterfront access, and funding for waterfront access. The entities represented on the Advisory Committee shall adhere to the plan to the maximum extent practicable. (2) Develop recommendations for increasing and improving waterfront access in the State. SECTION 2.3. The Advisory Committee shall report its progress in implementing this Part, including any recommendations developed pursuant to this Part, to the Joint Legislative Commission on Seafood and Aquaculture no later than October 1 of each year. The first report required by this section shall be submitted no later than October 1, 2008. PART III. DIRECT THE DEPARTMENT OF TRANSPORTATION TO EXPAND PUBLIC ACCESS TO COASTAL WATERS. SECTION 3.1. G.S. 136-18 is amended by adding a new subdivision to read: "(40) To expand public access to coastal waters in its road project planning and construction programs. The Department shall work with the Wildlife Resources

37
Commission, other State agencies, and other government entities to address public access to coastal waters along the roadways, bridges, and other transportation infrastructure owned or maintained by the Department. The Department shall adhere to all applicable design standards and guidelines in implementation of this enhanced access. The Department shall report on its progress in expanding public access to coastal waters to the Joint Legislative Commission on Seafood and Aquaculture and to the Joint Legislative Transportation Oversight Commission no later than March 1 of each year." SECTION 3.2. The first report required by G.S. 136-18, as enacted by this section, is due no later than March 1, 2008. PART IV. INCREASE BOATING FUNDING. SECTION 4.1. G.S. 75A-3(c) reads as rewritten:"(c) The Boating Account is established within the Wildlife Resources Fund created under G.S. 143-250. Interest and other investment income earned by the Account accrues to the Account. All moneys collected pursuant to the numbering and titling provisions of this Chapter shall be credited to this Account. Motor fuel excise tax revenue is credited to the Account under G.S. 105-449.126. The Commission shall use revenue in the Account, subject to the Executive Budget Act and the Personnel Act, for the administration and enforcement of this Chapter; for activities relating to boating and water safety including education and waterway marking and improvement; and for boating access area acquisition, development, and maintenance. The Commission shall use at least three dollars ($3.00) of each one-year certificate of number fee and at least nine dollars ($9.00) of each three-year certificate of number fee collected under the numbering provisions of G.S. 75A-5 for boating access area acquisition, development, and maintenance." SECTION 4.2. G.S. 75A-5(a) reads as rewritten: "(a) Application for Certificate of Number and Fees. – The owner of each vessel requiring numbering by this State shall file an application for a certificate of number with the Commission. The Commission shall furnish application forms and shall prescribe the information contained in the application form. The application shall be signed by the owner of the vessel or the owner's agent and shall be accompanied by a fee of ten dollars ($10.00) fee. The fee is fifteen dollars ($15.00) for a one-year period or by a fee of twenty-five dollars ($25.00) forty dollars ($40.00) for a three-year period; provided, however, there shall be no fee charged for period. The fee does not apply to vessels owned and operated by nonprofit rescue squads if they are operated exclusively for rescue purposes, including rescue training. The owner shall have the option of selecting a one-year numbering period or a three-year numbering period. Upon receipt of the application in approved form, the Commission shall enter the application in its records and issue the owner a certificate of number stating the identification number awarded to the vessel and the name and address of the owner, and a validation decal indicating the expiration date of the certificate of number. The owner shall paint on or attach to each side of the bow of the vessel the identification number in such manner as may be prescribed by rules of the Commission in order that it may be clearly visible. The identification number shall be maintained in legible condition. The validation decal shall be displayed on the starboard bow of the vessel immediately

38
following the number. The certificate of number shall be pocket size and shall be available for inspection on the vessel for which the certificate is issued at all times the vessel is in operation. Any person charged with failing to so carry a certificate of number shall not be convicted if the person produces in court a certificate of number previously issued to the owner that was valid at the time of the alleged violation." SECTION 4.3. G.S. 75A-5(c) reads as rewritten: "(c) Change of Ownership. – Should the ownership of a vessel change, a new application form with a fee of ten dollars ($10.00) for a one-year period or by a fee of twenty-five dollars ($25.00) for a three-year period in the amount set in subsection (a) of this section shall be filed with the Commission and a new certificate bearing the same identification number shall be awarded to the new owner in the same manner as an original certificate of number. Possession of the certificate shall in cases involving prosecution for violation of any provision of this Chapter be prima facie evidence that the person whose name appears on the certificate is the owner of the vessel referred to on the certificate." SECTION 4.4. G.S. 75A-5(h) reads as rewritten: "(h) Renewal of Certificates. – An owner of a vessel awarded a certificate of number pursuant to this Chapter shall renew the certificate on or before the first day of the month after which the certificate expires; otherwise, the certificate shall lapse and be void until such time as it may thereafter be renewed. Application for renewal shall be submitted on a form approved by the Commission and shall be accompanied by a fee of ten dollars ($10.00) for a one-year period or by a fee of twenty-five dollars ($25.00) for a three-year period; provided, there shall be no fee in the amount set in subsection (a) of this section. No fee is required for a period of one year for renewal of certificates of number that have been previously issued to commercial fishing vessels as defined in G.S. 75A-5.1, upon compliance with all of the requirements of that section." PART V. WAIVER OF FEES FROM CAMA EMERGENCY PERMITS. SECTION 5. G.S. 113A-118(f) reads as rewritten: "(f) The Secretary may issue special emergency permits under this Article. These permits may only be issued in those extraordinary situations in which life or structural property is in imminent danger as a result of storms, sudden failure of man-made structures, or similar occurrence. These permits may carry any conditions necessary to protect the public interest, consistent with the emergency situation and the impact of the proposed development. If an application for an emergency permit includes work beyond that necessary to reduce imminent dangers to life or property, the emergency permit shall be limited to that development reasonably necessary to reduce the imminent danger; all further development shall be considered under ordinary permit procedures. This emergency permit authority of the Secretary shall extend to all development in areas of environmental concern, whether major or minor development, and the mandatory notice provisions of G.S. 113A-119(b) shall not apply to these emergency permits. To the extent feasible, these emergency permits shall be coordinated with any emergency permits required under G.S. 113-229(e1). The fees associated with any permit issued pursuant to this subsection or rules adopted pursuant to this subsection shall be waived."

39
PART VI. STUDY CONSTRUCTION AND REPAIR IN REGULATED FLOOD ZONES. SECTION 6. The Division of Emergency Management of the Department of Crime Control and Public Safety shall study ways to facilitate the construction and repair of water dependent structures such as fish processing and packing facilities and boat repair and building facilities located in regulated flood zones. The Division shall report the results of its study, including any recommendations, to the Joint Legislative Commission on Seafood and Aquaculture by March 1, 2008. PART VII. EFFECTIVE DATE. SECTION 7. Section 1 of this act is effective for taxes imposed for taxable years beginning on or after July 1, 2009. Sections 4.1 through 4.4 of this act become effective January 1, 2008. The remainder of this act is effective when it becomes law. In the General Assembly read three times and ratified this the 2nd day of August, 2007. s/ Beverly E. Perdue President of the Senate s/ Joe Hackney Speaker of the House of Representatives s/ Michael F. Easley Governor Approved 12:25 p.m. this 30th day of August, 2007

40
Appendix B
2011 North Carolina Fish House Survey
(B. Garrity-Blake, Barry Nash)
This survey is being conducted to profile the number and status of seafood packers and processors. The survey is part of a larger effort to help the North Carolina seafood industry develop competitive advantages in a global economy. This effort has been funded by North Carolina Sea Grant. Your participation is voluntary. Information will be kept confidential. 1. Name of company, start date, owner/manager, and location.
2. Names of other fish houses in the area still operating. 3. Names of fish houses in area that have recently closed (w/in last five years)? 4. Approximate amount of seafood (in pounds) your business handles annually? 5. What percentage of your annual sales is from DOMESTIC seafood versus IMPORTED? 5b. Of your domestic product, what percentage is caught by NC fisherman? 6. What are your top five domestic products in descending order? Has this changed in past five years (any species gaining or losing value)? 7. What are your top five imported products? Has this changed in past five years? 8. Since 2005, has the demand for local seafood harvested by NC fishermen changed (increase/decreased)? 9. Has the price you pay to fishermen for any species changed appreciably in the past five years (increasing/decreasing)? Why? (List species and value fluctuation) 10. What percentage of your domestic products goes where [commodity specific]?
A. NC restaurants/markets B. Out-of-state restaurants/markets (e.g. Fulton’s Fish Market in NYC) C. Out-of-state processors (e.g. shrimp breading facilities in GA, LA) D. Foreign Markets (e.g. flounder to Asian traders) E. Other
11. Have you adopted any of the following strategies to increase the value of North Carolina seafood?

41
A. Offered pre-prepared or “value added” seafood such as frozen crab cakes,
refrigerated, ready-to-eat dips and salads or peeled-and-deveined shrimp; B. Opened a retail business adjacent to your wholesale operation; C. Promoted local seafood through the local seafood branding programs Outer Banks
Catch, Carteret Catch, or Brunswick Catch; D. Launched a website and / or advertised using social media (Facebook or Twitter); E. Anything else?
12. Are you familiar with Community Supported Fisheries, a direct-marketing strategy for domestic seafood? If so, do you believe CSFs can boost revenues for your business?" 13. What are your infrastructure needs? Do you have adequate:
A. Labor (fishermen, packers, etc.) B. Dockage/water access C. Gear/ repair facilities D. Trucking services E. Freezing/ processing capabilities F. Other?
14. Is your business located on water (water dependent)? 15. Are you aware of the property tax break for fish houses made available in 2010? Did you take advantage of it? Was it helpful? 16. Overall, has your business changed for better or worse during the last five years, and to what do you attribute your ability to stay in business? 17. What are your plans for the future? 18. Further thoughts/comments on what would help your business? 19. What ideas do you have for sustaining the North Carolina seafood industry for the long term? 20. Would you be interested in talking part in a more in-depth economic analysis this winter gauging the value of and opportunities for the NC seafood industry?

42
Appendix C
Waterfront Access Marine Industry Fund Projects (Final)
1. Swan Quarter (Hyde County): Acquire 10.175 acres adjacent to WRC property at Fisherman's Wharf. $766,024 (DMF).
2. Alligator River (Tyrrell County): Build rock jetty, bulkhead and build 10 boat slips on DOT property at foot of bridge. $452,760 (Alb-Pam Nat. Estuary).
3. Engelhard (Hyde County): Develop expansion of Wanchese Seafood Industrial Park in Hyde County. Dept. of Commerce responsible for marketing/leasing. $1,413,255 (Commerce).
4. Jennette's Pier (Dare County): Assist in construction costs to replace Jennette's Pier and build handicapped beach access wheelchair ramp. $1,540,000 (Aquariums).
5. Manns Harbor (Dare County): Purchase marina and assist with construction of three new boat ramps, parking for 75-90, additional docking for loading and unloading commercial vessels. $4,290,675 (WRC).
6. Cahoon Seafood (Hyde County): Purchase Cahoon Seafood and fund site development plan for reconstruction of property. $387,436 (DMF).
7. Cedar Island (Carteret County): Purchase 30.84 acres from Gary Larka. $ 1,660,432 (DMF).
8. Radio Island (Carteret County): Extend pier, build six boat ramps, and add parking at Radio Island access. Build dockhouse and restrooms. $1,190,000 (DOA).
9. Dinah's Landing (Beaufort County): Expand Dinah’s Landing boat ramp at Goose Creek State Park with parking lot improvements. $240,000 (Parks).
10. Emerald Isle Pier (Carteret County): Planning, design and site preparation for Aquarium pier at Emerald Isle. $2,200,000 (Aquariums).
11. Hampstead Tract (Pender County): Purchase property adjacent to Anchors Away Boat Yard for public boat access. Help fund development of boating access with three launch lanes, 75 parking spaces, fixed and floating docks. $2,879,606 (WRC).
12. Sunset Harbor (Brunswick County): Purchase land adjacent to WRC boat ramp at Sunset Harbor. $915,000 (WRC).
13. Fulcher Landing Road (Onslow): Land acquisition for boat access site. Help fund construction of two new boat ramps, dredging an existing channel, parking lot with 34 spaces, floating and fixed docks. $2,062,573 (WRC).