Embed Size (px)
DESCRIPTION
This book will provide basic knowledge of bond market for student and beginner in this field.
Citation preview
JWBK090-FM JWBK090/Brown March 1, 2006 9:41 Char Count= 0
An Introduction to the Bond Markets
Patrick J. Brown
iii


JWBK090-FM JWBK090/Brown March 1, 2006 9:41 Char Count= 0
An Introduction to the Bond Markets
i

JWBK090-FM JWBK090/Brown March 1, 2006 9:41 Char Count= 0
For other titles in the Wiley Finance Seriesplease see www.wiley.com/finance
ii

JWBK090-FM JWBK090/Brown March 1, 2006 9:41 Char Count= 0
An Introduction to the Bond Markets
Patrick J. Brown
iii
JWBK090-FM JWBK090/Brown March 1, 2006 9:41 Char Count= 0
Copyright C© 2006 John Wiley & Sons Ltd, The Atrium, Southern Gate, Chichester,West Sussex PO19 8SQ, England
Telephone (+44) 1243 779777
Email (for orders and customer service enquiries): [email protected] our Home Page on www.wiley.com
All Rights Reserved. No part of this publication may be reproduced, stored in a retrieval system or transmitted inany form or by any means, electronic, mechanical, photocopying, recording, scanning or otherwise, except underthe terms of the Copyright, Designs and Patents Act 1988 or under the terms of a licence issued by the CopyrightLicensing Agency Ltd, 90 Tottenham Court Road, London W1T 4LP, UK, without the permission in writing of thePublisher. Requests to the Publisher should be addressed to the Permissions Department, John Wiley & Sons Ltd,The Atrium, Southern Gate, Chichester, West Sussex PO19 8SQ, England, or emailed to [email protected], orfaxed to (+44) 1243 770620.
Designations used by companies to distinguish their products are often claimed as trademarks. All brand namesand product names used in this book are trade names, service marks, trademarks or registered trademarks of theirrespective owners. The Publisher is not associated with any product or vendor mentioned in this book.
This publication is designed to provide accurate and authoritative information in regard to the subject mattercovered. It is sold on the understanding that the Publisher is not engaged in rendering professional services.If professional advice or other expert assistance is required, the services of a competent professional should besought.
Other Wiley Editorial Offices
John Wiley & Sons Inc., 111 River Street, Hoboken, NJ 07030, USA
Jossey-Bass, 989 Market Street, San Francisco, CA 94103-1741, USA
Wiley-VCH Verlag GmbH, Boschstr. 12, D-69469 Weinheim, Germany
John Wiley & Sons Australia Ltd, 42 McDougall Street, Milton, Queensland 4064, Australia
John Wiley & Sons (Asia) Pte Ltd, 2 Clementi Loop #02-01, Jin Xing Distripark, Singapore 129809
John Wiley & Sons Canada Ltd, 22 Worcester Road, Etobicoke, Ontario, Canada M9W 1L1
Wiley also publishes its books in a variety of electronic formats. Some content that appears in print may not beavailable in electronic books.
Library of Congress Cataloging-in-Publication Data
Brown, Patrick J.An introduction to the bond markets / Patrick J. Brown.
p. cm.Includes bibliographical references and index.ISBN-13: 978-0-470-01583-4 (cloth : alk. paper)ISBN-10: 0-470-01583-7 (cloth : alk. paper)
1. Bonds. 2. Bond market. I. Title.HG4651.B685 2006332.63′23—dc22
2006004502
British Library Cataloguing in Publication Data
A catalogue record for this book is available from the British Library
ISBN 13 978-0-470-01583-4 (HB)ISBN 10 0-470-01583-7 (HB)
Typeset in 10/12pt Times by TechBooks, New Delhi, IndiaPrinted and bound in Great Britain by Antony Rowe Ltd, Chippenham, WiltshireThis book is printed on acid-free paper responsibly manufactured from sustainable forestryin which at least two trees are planted for each one used for paper production.
iv
JWBK090-FM JWBK090/Brown March 1, 2006 9:41 Char Count= 0
To my wife, Katy
. . . so I decided to go East and learn the bond business. Everybody I knew was in thebond business, so I supposed it could support one more single man.
The Great Gatsby – F. Scott Fitzgerald
v

JWBK090-FM JWBK090/Brown March 1, 2006 9:41 Char Count= 0
vi
JWBK090-FM JWBK090/Brown March 1, 2006 9:41 Char Count= 0
Contents
Preface xi
Disclaimer xv
Introduction xvii
1 What is a Bond and Who Issues Them? 11.1 Description of a bond 2
1.1.1 The issuer 21.1.2 Size and currency 21.1.3 Type 21.1.4 Coupon payments and frequency 21.1.5 Redemption amount and maturity dates 31.1.6 Embedded options 41.1.7 Guarantee 51.1.8 Where quoted and traded 6
1.2 The difference between corporate bonds and equities 7
2 Types of Bonds and Other Instruments 92.1 Fixed-rate bonds 9
2.1.1 Straight coupon bonds 92.1.2 Zero-coupon bonds 102.1.3 Undated or irredeemable bonds 112.1.4 Strippable bonds and strips 112.1.5 Bonds with sinking funds 132.1.6 Step-up or graduated-rate bonds 142.1.7 Annuities 15
2.2 Floating-rate notes 162.2.1 Undated or perpetual floating-rate notes 19
2.3 Index-linked bonds 192.4 Hybrid bonds 22
vii
JWBK090-FM JWBK090/Brown March 1, 2006 9:41 Char Count= 0
viii Contents
2.5 Other instrument types 222.5.1 Treasury bills 222.5.2 Certificates of deposit 222.5.3 Commercial paper 232.5.4 Medium-term notes 242.5.5 Preference shares 252.5.6 Permanent interest bearing shares 26
3 How Do You Price and Value a Bond? 273.1 Compound interest 273.2 Discounting and yield considerations 293.3 Accrued interest 323.4 How Bonds are quoted 343.5 Bond pricing 363.6 Yields and related measures 38
3.6.1 Current yield 393.6.2 Simple yield to maturity 403.6.3 Redemption yield 413.6.4 Life and duration 473.6.5 Modified duration 523.6.6 Convexity 563.6.7 Dispersion 57
3.7 Floating-rate notes 593.7.1 Simple margin (FRN) 593.7.2 Discounted margin (FRN) 60
3.8 Real redemption yield 623.9 Money market yields and discounts 63
4 Bond Options and Variants 654.1 Callable bonds 654.2 Putable bonds 674.3 Convertible bonds 694.4 Dual Currency bonds 734.5 Mortgage-backed securities 734.6 Collateralized debt obligations 744.7 Bonds with conditional coupon changes 754.8 Reverse floaters 754.9 Bonds with warrants attached 77
5 Yield Curves 795.1 Yield curve shapes 795.2 Zero-coupon or spot yield curves 825.3 Forward or forward–forward yield curves 845.4 Par yield curves 855.5 Investment strategies for possible yield curve changes 88
JWBK090-FM JWBK090/Brown March 1, 2006 9:41 Char Count= 0
Contents ix
6 Repos 956.1 Classic repos 1006.2 Sell/buy-backs 1036.3 Stock borrowing/lending 104
7 Option Calculations 1077.1 Buying a call option 1077.2 Writing a call option 1087.3 Buying a put option 1087.4 Writing a put option 1107.5 Theoretical value of an option 1107.6 Combining options 111
8 Credit and Other Risks and Ratings 1158.1 Credit risk 115
8.1.1 Covenants 1168.1.2 Ratings 117
8.2 Liquidity 119
9 Swaps, Futures and Derivatives 1239.1 Swaps 123
9.1.1 Interest rate swap 1239.1.2 Asset swap 1309.1.3 Cross-currency swap 1309.1.4 Basis swap 1329.1.5 Forward rate agreement 132
9.2 Credit risk in swaps 1339.3 Swaptions 1339.4 Futures 1339.5 Credit default swaps 137
10 Portfolio and Other Considerations 14110.1 Holding period returns 14110.2 Immunization 14310.3 Portfolio measures 14410.4 Allowing for tax 145
11 Indices 14711.1 Bond Index classifications 14711.2 Choosing indices 14811.3 Index data calculations 14911.4 Index continuity 150
11.4.1 Large changes in the constituents of the index 15011.4.2 Gaps in subindex calculations 15111.4.3 Bonds dropped due to lack of prices 15111.4.4 Ratings downgrade 152
JWBK090-FM JWBK090/Brown March 1, 2006 9:41 Char Count= 0
x Contents
Appendix A. Using the Companion Website 153
Appendix B. Mathematical Formulae 155B.1 Accrued interest 155B.2 Current yield 158B.3 Simple yield to maturity 158B.4 Redemption yield 159B.5 Duration 162B.6 Modified duration 163B.7 Convexity 164B.8 Dispersion 165B.9 Annuities 166B.10 Simple margin 167B.11 Discounted margin 167B.12 Real redemption yield 168B.13 Convertible calculations 169B.14 Discount 170B.15 Money market yield 171B.16 Certificate of deposit yield 171B.17 Warrant calculations 171B.18 Compounding frequency adjustments 172B.19 Portfolio yield 174B.20 Portfolio Macaulay duration 175B.21 Portfolio modified duration 175
Appendix C. Bond Market Glossary 177
References 215
Index 217
JWBK090-FM JWBK090/Brown March 1, 2006 9:41 Char Count= 0
Preface
In contrast to the equity markets, why is it that to the average private investor or non-bondmarket professional that bonds and the bond markets around the world are a closed book? Thisis surprising when you consider that:� Bonds are intrinsically safer investments than equities.� Bonds are usually easier to value than equities. After all, they often have predefined returns.� The size of the bond markets and the trading of derivatives based on bonds between financial
institutions is many, many times larger than that of the equity markets. Worldwide the sizeof the bond markets is measured in trillions of US dollars ($1 trillion = $1 000 000 000 000).For example, the repo markets (essentially a form of short-term secured borrowing usingbonds as collateral) in Europe have a daily turnover in excess $1 trillion; the interest rateand currency swap markets have outstanding transactions with a nominal value in excess of$180 trillion, etc.
However, possibly the question has been put the wrong way round. We should possibly beasking, why are the equity markets so attractive? Many people like to have a gamble, and theyregard the equity markets as an attractive place to do this. People like to think that they are ableto assess the prospects of a company, presumably better than the market, and in the processmake a fortune. Holding bonds, on the other hand, with their predefined returns, does not offerthis possibility. After all, how many people are prepared to put £1 into a sweepstake, whichhas a 1 in 1000 possibility of producing a payout of £1000, compared with the number whoare prepared to accept £1 if there is a 1 in 1000 chance that they are prepared to pay out £1000.The odds for both strategies are identical.
This lack of sex appeal of bonds is only part of the problem, and even this can be removedwith the use of futures, swaps and other derivatives, although these are often not directlyavailable to the private investor. However, this approach, with its highly mathematical basis,makes the bond markets even more remote and unattractive to many people.
Another significant reason for the lack of interest in the bond markets, in spite of their size,is their lack of transparency. With the equity markets many, if not most, national newspaperspublish daily closing prices of leading equity shares. It is true that they also publish closingprices for domestic government bonds, but the great majority of outstanding bonds are notissued by governments. Even the Financial Times produces daily prices for well under 100bonds, out of the many thousands of outstanding public bonds in Europe. The bond pricediscovery process is much more complicated than for equities, for although many eurobonds
xi
JWBK090-FM JWBK090/Brown March 1, 2006 9:41 Char Count= 0
xii Preface
are quoted on the Luxembourg or London stock exchanges, nearly all the trading is doneoff-exchange.
Lack of transparency in the bond market does not stop with price discovery. With equityshares, companies have to produce annual accounts and periodic updates which are madeavailable to all shareholders and which can be easily obtained by other interested parties.These help in evaluating the worth of the shares. On the other hand, with bonds, at least inEurope, the annual accounts do not normally identify the breakdown of the outstanding debt.Similarly, it is often quite difficult, at least for an individual, to find the individual terms andguarantees associated with the debt instruments.
The purpose of the book is to give an introduction to the bond markets to readers who havean interest in understanding what they are, how they work and how they can be used, but whodo not want to be intimidated by mathematical formulae. As a result it is hoped that readerswill be able to evaluate the appropriateness of investing in the bond markets. This is achievedby frequently illustrating the points graphically, relegating most of the mathematical formulaeto Appendix A and supplementing the book with a companion website.
The book stands up in its own right without using the website. However, in order to takefull advantage of it, users will need a PC with Excel. The website enables readers to:� enter bond details and calculate expected returns;� calculate annuity payments;� produce a variety of yield curves and from them project expected interest rates in the future;� calculate returns for the reader’s own bond market portfolio of investments, based on a
variety of scenarios about future interest rates and the user’s investment time horizon; etc.
Another objective of this book is to try to demystify at least some of the bond market terminol-ogy, so that it is possible for non-bond market professionals to understand how the instrumentswork and to appreciate the expected gains. To illustrate this let us consider two examples.
If you are offered two, otherwise identical investments, one that pays 4 % every six months(that is 8 % per year) and the other that pays 8.16 % once a year, which one should you choose,or does it not matter? This is the sort of problem that has occurred in the past in the UK, andno doubt other countries, with savings rates offered by building societies and other financialinstitutions. This problem has, at least partly, been solved by a requirement to publish theAnnual Equivalent Interest Rate.
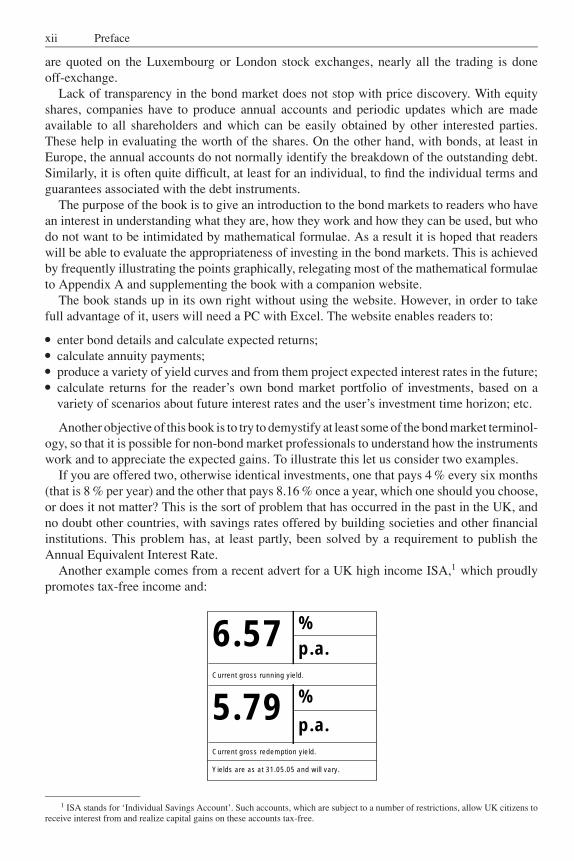
Another example comes from a recent advert for a UK high income ISA,1 which proudlypromotes tax-free income and:
%6.57 p.a.Current gross running yield.
%5.79p.a.
Current gross redemption yield.
Yields are as at 31.05.05 and will vary.
1 ISA stands for ‘Individual Savings Account’. Such accounts, which are subject to a number of restrictions, allow UK citizens toreceive interest from and realize capital gains on these accounts tax-free.
JWBK090-FM JWBK090/Brown March 1, 2006 9:41 Char Count= 0
Preface xiii
In the small print it also says: ‘In order to generate a high level of income, the Trust invests incompanies that offer bonds with a significant level of risk to capital.’
How many people not trading in the market actually understand what these two figures mean,and would allow for the possibility of some of the investments either defaulting or having tobe sold at a loss prior to any default? I know that many of the people that I know do not.
To give the providers of the ISA their due, it does say further on in the small print that: ‘It[the redemption yield] will be lower than the current running yield if the capital value of thetrust is expected to decrease. Both yields will vary.’ So unsurprisingly, they are expecting thecapital value of the ISA to decrease!
It is very difficult, if not impossible, to predict the future return on ordinary shares. However,with fixed interest investments, subject of course to the issuer not getting into serious trouble,the future cash flows arising from the investment are usually specified, although the issuer maysometimes be able to exercise an option that changes the cash flows. Similarly, with floatingrate instruments, the future returns are usually specified relative to some external measure,such as LIBOR (London Interbank Offer Rate) or EURIBOR (Euro Interbank Offer Rate).
You would think that the defined terms would be an advantage and would encourage invest-ment in bonds. However, this means that you cannot buy a bond investment that will give youalmost unlimited gains as one always hopes one can with an equity share. On the other hand,although not for the novice, it is possible to obtain similar gains, or losses, to those on equities,using bond derivatives.
Bonds are essentially intrinsically safer investments than equities. There is no reason whypeople should not understand how bonds work and be happy to invest in them. After all, anyonebuying a house on a mortgage is in effect just issuing a bond to the company from whom theyare borrowing the money.

JWBK090-FM JWBK090/Brown March 1, 2006 9:41 Char Count= 0
xiv
JWBK090-FM JWBK090/Brown March 1, 2006 9:41 Char Count= 0
Disclaimer
Neither the author nor John Wiley & Sons, Ltd accept any responsibility or liability for loss ordamage occasioned to any person or property through using the material, instructions, methodsor ideas contained herein, or acting or refraining from acting as a result of such use. The authorand Publisher expressly disclaim all implied warranties, including merchantability of fitnessfor any particular purpose.
xv

JWBK090-FM JWBK090/Brown March 1, 2006 9:41 Char Count= 0
xvi
JWBK090-FM JWBK090/Brown March 1, 2006 9:41 Char Count= 0
Introduction
Trading in bonds or loans is not a recent invention. Although stock exchanges date from theearly 15th century,1 by the beginning of the 17th century trading and speculation in governmentstocks and shares in the Dutch East India Company on the Amsterdam stock market was carriedout in a modern way. Although Amsterdam is often referred to as the ‘first stock market’, stateloan stocks had been negotiable much earlier in Venice, in Genoa and before 1328 in Florence.There are references to French ‘Rentes sur l’Hotel de Ville’ (municipal stocks) in 1522 andstock markets in the Hanseatic towns from the 15th century.
It appears that the Rentes sur l’Hotel de Ville did not play the same role as annuities didin England, but remained a safe gilt-edged investment, which was often immobilized in aninheritance, difficult to negotiate and subject to tax on sale. Based on a French text2 written in1706, it compares the French situation to that pertaining in Italy, Holland or England where‘State bonds (are bought and transferred) like all buildings, with no cost or formality.’ Moreover,the English annuities could also be regarded as an alternative currency, sufficiently guaranteed,carrying interest and immediately convertible into liquid cash at the Exchange. However, whatwas new to Amsterdam was the volume, the liquidity of the market, the publicity and thefreedom to speculate.
The purpose of this book is to give a basic introduction to the workings of the securitiesmarkets and the bond market in particular. It will look at the different types of instruments,explain how they differ and are traded. It will try, at least partially, to answer questions such as:� What is a bond?� Who issues bonds?� Why do people issue bonds and why do investors buy them?� How does it differ from an equity or ordinary share?� How safe is my investment in a bond?� How much money will I get back?� When will I get the money back?� Why does a bond yield more/less than an equity?� How do you value a bond?� How can you make use of bonds?
1 Bruges dates from 1409, Antwerp 1460, Lyons 1462, Toulouse 1469, Amsterdam 1530, London 1554: see Fernand Braudel(1982).
2 See Fernand Braudel (1982).
xvii
JWBK090-FM JWBK090/Brown March 1, 2006 9:41 Char Count= 0
xviii Introduction
This book is intended to be an introduction to the bond markets and as a result the formu-lae for how to calculate redemption yields, duration, convexity, discounted margins or othercalculations are delegated whenever possible into Appendix B.3 Similarly, it does not go intothe details of the various traded futures and derivative contracts. Neither does it go into allthe possible variations and options on the different instruments. The major security housesand hedge funds employ ‘rocket scientists’ to construct new variations every week, sometimeswith disastrous effects. (Even today, what happened to Long Term Capital Management sendsshivers around the world’s capital markets.)
After the Introduction, the first chapter in the book describes what a bond is and who issuesthem. This is followed by a chapter that describes the main standard types of bonds, includingfixed-rate, floating-rate and index-linked bonds, together with some of the tradeable moneymarket instruments, which behave in a similar way to short-dated bonds. The description ofbonds with a variety of embedded options, such as call and put options, has been relegated toChapter 4. Chapter 3 describes how bonds are priced and valued. It introduces the concepts ofaccrued interest, current and redemption yields, Macaulay and modified durations, convexityand dispersion, together with why they are calculated. For floating-rate notes, it also describesthe simple and discounted margin calculations, and real redemption yields for index-linkedbonds. The results of the calculations are often illustrated graphically with the formulae rele-gated to Appendix B. The next chapter, Chapter 4, describes bonds with a variety of options,together with the effect that the options can have on the valuation of the instrument.
Chapter 5 on yield curves describes the different types of yield curves, including spot, parand forward curves, and how they can be calculated. It also discusses how yield curves can beused to develop strategies that may increase the return on a bond portfolio. A discussion of therepo market follows in the next chapter. Repos are essentially just a form of short-term securedborrowing which are used extensively and help in making the financial markets run smoothly.It also discusses the differences between classic repos, sell and buy-back agreements and stocklending.
Chapter 7 looks at the profits and losses that can be achieved by buying and writing options,together with a flavour of how they can be used. Non-structural instrument risks are discussedin the next chapter. This includes credit risk and bond ratings, together with the liquidity riskthat can occur if it is necessary to realize a holding in a non-benchmark bond before its maturity.
Chapter 9 describes swaps, futures and other derivatives. It looks at the size and varietyof standard interest rate swaps together with a number of variations, including asset swaps,cross-currency swaps, basis swaps and forward rate agreements. It goes on to discuss futuresand credit default swaps.
Chapter 10 discusses a variety of topics including holding period returns, immunization,the calculation of portfolio durations and yields and allowing for tax on interest payments andcapital profits. This is followed by a chapter on bond indices. It discusses the appropriatenessof using one index against another when comparing the performance of a portfolio.
Appendix A describes the programs that have been supplied on the companion website.Some of the programs allow users to create their own bonds and simulate the effect of variouschanges in rates or prices. Others allow you to create and modify yield curves, and see theireffect on bond values. Appendix B gives the mathematical formulae for most of the calculationsdescribed and used in the preceding chapters, while Appendix C is a bond market glossary.
3 Many of these formulae can be found in Patrick Brown (1998).
JWBK090-01 JWBK090/Brown February 25, 2006 7:32 Char Count= 0
1
What Is a Bond And Who Issues Them?
Over many years whenever I mentioned the bond market socially, people would often enquire‘What is a bond?’, as if bonds were something from outer space. This would never happen if onewere to mention the equity or share markets. On explaining that if bank loans or mortgageswere tradeable they could be regarded as types of bonds and that many governments raisemoney by issuing bonds, many people immediately lost interest. This need not be the case;bonds can be sexy! However, unlike equities, except in the case of a few structured deals, thepossibility, however remote, of a nearly infinite return is impossible.
In general terms, a bond is a loan by one party (the investor or holder) to another party(the issuer). The issuer gives the investor a guarantee that he or she will pay interest on theloan at regular intervals and repay the loan at a specified time in the future. In addition, theissuer may retain or grant embedded options that he or she or the investor can exercise inthe future.
The terms ‘bonds’1 and ‘loans’ have been used almost interchangeably throughout thebook. The description ‘note’ is also used extensively, but it frequently refers to a bond that wasoriginally issued for a period of not more than five years or to a floating-rate note. In addition,bonds have sometimes been referred to as ‘stocks’, which is a term that has been used by theBank of England over many years to refer to UK Government gilt-edged issues. Its use shouldnot be confused with ‘common stocks’, which are equity issues. The description of a bond isoften very easy to understand as in the following example.
Example 1.1 Bundesrepublik Deutschland 3 34
% Anleihe 2009
In January 1999, Germany issued €14 billion of this bond at a price of 100.34. It will payinterest every 4 January up to and including 4 January 2009, when it will be redeemed at100. It can be traded in multiples of €0.01 and is in a fully registered form. It is listed onall the German stock exchanges, and is thus tradeable.
In the above example, the issuer, in this case the German Republic, normally guarantees theissue, but the guarantees can vary from issuer to issuer and bond to bond. ‘Registered’ justmeans that the owner of the bonds is held on a central register.
Bonds are usually referred to by a combination of the issuer name, annual coupon rateper cent and the maturity date or dates. However, the description of the bond, especially inContinental Europe, may also include the year of issue or the series number. The descriptiondoes not normally specify the frequency of the coupon payments.
1 Sometimes the description ‘bond’ refers to an investment that includes some sort of insurance guarantee and implicit premium.Such investments are not discussed here.
1
JWBK090-01 JWBK090/Brown February 25, 2006 7:32 Char Count= 0
2 An Introduction to the Bond Markets
1.1 DESCRIPTION OF A BOND
A bond can generally be described in terms of its:� issuer;� size and currency;� type;� coupon payments and frequency;� redemption amount and maturity dates;� embedded options, such as whether and under what circumstances the bond can be redeemedearly;� guarantees relating to the payment of interest and return of capital; and� where quoted and traded.
1.1.1 The issuer
From the market’s point of view, there are very few restrictions as to who can issue bonds,provided they provide acceptable payment guarantees. However, financial service regulatorsoften have different views and impose a variety of capital adequacy restrictions.
The ‘issuer’ of a bond may be a country, regional government, local authority, bank, company,supranational organization or even an investment vehicle that has been created specifically forthe issue of this bond. The name of the bond issue is sometimes followed by either its issuenumber (as is the case with Japanese Government bonds) or its year of issue.
1.1.2 Size and currency
The size of a loan is often referred to as its ‘principal’ or ‘nominal amount’. Interest and capitalrepayments are based on the nominal amount and not the amount of money that is raised. Bondsare frequently issued at a price that is a small discount to their nominal or ‘par’ value. The issueroften agrees to pay back the nominal value of the bond at redemption, although sometimes hehas to pay a premium if he wants to repay it early.
The bond will also specify the currency of issue. Occasionally, usually in the past, anartificial currency unit, such as Special Drawing Rights or the European Currency Unit, hasbeen specified. In another variant, investors have even had the right to choose the currency inwhich they would like the interest paid and the capital repaid.
1.1.3 Type
Nearly all bonds can be categorized into one of three different types according to how theirinterest and capital repayments are calculated. These are ‘fixed-rate’, ‘floating-rate’ and ‘index-linked’ bonds. The majority of fixed-rate and floating-rate bonds are redeemed at par, whereaswith index-linked bonds the final redemption amount is also adjusted.
1.1.4 Coupon payments and frequency
The bond terms will specify the frequency and the amount of any coupon payments. The couponrate is usually specified as an annual percentage rate, irrespective of the coupon payment
JWBK090-01 JWBK090/Brown February 25, 2006 7:32 Char Count= 0
What Is a Bond And Who Issues Them? 3
frequency. The payment frequency will usually be annually, semi-annually, quarterly, monthlyor only at maturity. Most fixed-rate bonds pay coupons either annually or semi-annually,whereas floating-rate notes often pay coupons quarterly or monthly.
The coupon payments may be specified as either an actual fixed amount (fixed-rate bonds),variable according to some external measure such as an interbank interest rate (floating-ratenote) or index-linked to, e.g. in the case of UK index-linked issues, the UK Retail Price Index(RPI).
If a fixed-rate bond pays a coupon twice a year, except sometimes at the beginning and endof its life, the semi-annual coupon payment will be exactly half the annual rate. This is not sowith floating-rate notes, where the individual payments are dependent on the exact number ofdays in the period and the payment dates are adjusted to make sure that they fall on a marketbusiness day.
It is quite usual for bonds to have a long or a short first coupon payment period.
Example 1.2
An issuer may find that the conditions are currently attractive for the issue of, say, a 10 yearbond. However, because, for example, of when his or her income is received, or because itwould be desirable to make the coupon payments coincide with those of some other bondissues, a long or a short first interest period is required.
The bond is to be issued into a market where coupons are normally paid twice a year. Theissuer wishes to pay coupons in March and September each year. If the market conditionsin, say, January or February are attractive for the issue, then the first coupon payment willprobably be in the September, not the March immediately after the issue date. The couponpayment will then be increased to compensate the investor for the longer payment period.
Conversely, if the market conditions are not attractive for the issuance until April, thefirst coupon payment will frequently occur in September after issue, but the amount willnow be reduced because of the shorter time period.
1.1.5 Redemption amount and maturity dates
The terms of the bond will usually specify when the issuer will repay the bond (the ‘maturitydate’) and how much will be repaid (the ‘redemption value’). The bond terms could specifyseveral different dates and values or it could specify at any time between certain dates. These arediscussed further below. Except in the case of an annuity, a zero-coupon bond being called earlyor a capital restructuring, the redemption amount is rarely less than the nominal value of thebond. For most fixed-rate and floating-rate bonds, unless they are called early, the redemptionprice is ‘par’, i.e. equal to the nominal value. For index-linked bonds the redemption value willrise, or in rare cases even fall, in line with the relevant index.
The terms will normally highlight the final maturity date or in the case of a serial bond(which is redeemed in a number of different tranches) a range of dates. There is, however, anumber of bonds that do not specify a final maturity date. Instead, such bonds often specify thatthey may be redeemed by the issuer on or after a specified date, at a certain price, subject to,say, three months’ notice. (This is a ‘call option’ – see below). Such bonds are called ‘undatedbonds’, ‘irredeemables’ or ‘permanent interest-bearing securities’.
JWBK090-01 JWBK090/Brown February 25, 2006 7:32 Char Count= 0
4 An Introduction to the Bond Markets
1.1.6 Embedded options
As has been already indicated, bonds often give the issuer or the holder of the bond the option ofa choice at some time in the future. This section highlights some of the more common options.
Sometimes the embedded option is exercised not by the issuer or the holder but as a resultof some external event, e.g. if the tax status of the issue changes, making the issue unattractive,or the issuer is taken over by another company. This latter example provides extra security forinvestors, as it is not unknown for a company to take over another well-funded company andstrip out its assets. Bond holders, unfortunately, have no say in the running of a company.
Example 1.3 Ford Motor Company 6 38
% Debentures 2029
$1.5 billion of the debentures were issued at 98.817 in February 1999. It pays interestsemi-annually on 1 February and 1 August, and it will be redeemed at 100 on 1 February2029, unless its tax status changes. If this occurs, it may be called as a whole at any timeon 30 days’ notice from 9 February 1999 at 100.
A ‘call option’ gives the issuer the right to redeem the issue early after an appropriatenotice period. The terms may specify that the call option may only be exercised on or betweenspecified dates. The terms for the call are frequently different to the terms if the bond goes toits normal maturity date. A call option is included in all undated issues, and most asset-backedissues backed by mortgages.
Example 1.4 Aetna Life and Casualty Company 7 34
% Notes 2016
The company issued $200 million in July 1986 at 101. It pays interest annually on 17 Julyand will be redeemed on 17 July 2016 at 100 unless it is called earlier. The bond is callableas a whole or in part at any time on 30 days’ notice at the following rates: from 17 July2001 at 106; 2002 at 105; 2003 at 104; 2004 at 103; 2005 at 102; 2006 at 101 and 2007 at100. It is also callable if its tax status changes.
A ‘put option’ gives the bond holder the right to demand early redemption on one or moredates, or between specified dates. The put option may only be exercisable if a certain eventoccurs.
A ‘convertible bond’ gives the bond holder the right to convert the bonds into anotherinstrument, e.g. the ordinary shares of the issuer. The conversion option usually occurs at adate prior to the redemption of the bond, with the result that after this date, if the option is notexercised, they revert to being non-convertible bonds.
Example 1.5 Nichiei Company Ltd 1 34
% Convertible Bonds 2014
In February 1999 the company issued JPY 50 billion of convertible bonds at 100 for re-demption on 31 March 2014 unless called or converted beforehand. Interest is payablesemi-annually on 31 March and 30 September.
JWBK090-01 JWBK090/Brown February 25, 2006 7:32 Char Count= 0
What Is a Bond And Who Issues Them? 5
The bond may be called as a whole at any time on 30 days’ notice from 31 March 2004.The holders have the option to convert the bond into common stock of Nichiei Company Ltdfrom 22 March 1999 at JPY 8610 each and from 28 September 2000 at JPY 7636.2 each.The rights expire on 25 March 2014. The holders also have the option on 14 days’ noticeto require early repayment (a put option) on 31 March 2004 at 100 and 31 March 2009at 100.
A ‘bond with warrants attached’. Sometimes bonds are issued with attached warrants whichgive the holder the option to purchase other investments at a date in the future at a predefinedprice. This option is frequently the right to buy an equity share, but it could be the right to buya bond, a currency, an index or a basket of shares.
This book will concentrate on tradeable bonds, but the principles discussed apply equallyto non-tradeable bonds including private mortgages. A mortgage on a property is really just aform of bond, where the borrower (the mortgagee) gives a guarantee to the lending institutionthat he will repay the loan over a certain period. In this particular case, the payment and capitalrepayment terms of the loan are frequently modified during its life and the mortgagee has acall option, possibly with a penalty.
Sometimes the bond description includes two dates: e.g. the UK Government’s 7 34 %
Treasury 2012/2015. This means that the security will be redeemed between 2012 and 2015at the discretion of the issuer (the UK Government). Such a bond is said to be ‘callable’, i.e.subject to a call for redemption with suitable notice by the issuer between the two dates. Itshould be noted that the description of many callable bonds, especially corporate issues, onlygives the final maturity date although they are callable over possibly many years. Other bondsmay not have a redemption date specified at all in their name: e.g. 3 1
2 % War Loan. This bondwas issued on 1 December 1932 by the UK Government with the redemption terms specifiedas being able to be redeemed at the discretion of the issuer, on three month’s notice, at anytime after 1952 at 100. Since interest rates have been considerably higher than 3.5 % for nearlyall this period, the market price of the bond has been consistently below 100 and so it has notbeen in the interest of the government to redeem the bond.
1.1.7 Guarantee
The terms on which the issuer can issue the bond obviously depend on the guarantees that havebeen made about the payment of interest and repayment of the capital. Such guarantees canvary enormously from complete asset backing (where in the event of a default the investorscan access assets that are worth at least the value of their loan), to a negative pledge (wherethe issuer has guaranteed not to issue new bonds with a higher claim on the assets, althoughin Europe this may even exclude bank loans), to practically no guarantee at all. Governmentbonds often fall into the last category, but if they are issuing domestic bonds in their owncurrency these are often regarded as ‘risk free’, since the government often has the option toprint more money to satisfy any shortfall and thus service the debt. In such a situation the bondwould not be truly risk free as the repayment would be in a devalued currency. It remains tobe seen what emerges in the eurozone if such a situation were to occur, where the eurozonegovernments are restricted by the stability pact.
These days the majority of the larger publicly quoted bond issues are rated by one or moreof the rating agencies. These ratings are usually provided by the ratings agency just prior to
JWBK090-01 JWBK090/Brown February 25, 2006 7:32 Char Count= 0
6 An Introduction to the Bond Markets
issue, and are regularly reviewed during the life of the bond. The ratings evaluate the financialstrength of the issuer together with the bond’s covenants. The most secure bonds are rated‘AAA’ or ‘Aaa’, while the weakest bonds, which are usually already in default, are rated ‘D’.The rating does not in any way indicate the liquidity of the issue.
1.1.8 Where quoted and traded
The fact that a bond is quoted on a stock exchange does not necessarily mean that it is normallytraded on that exchange. Although this may be a reasonable assumption with some governmentbonds, in the Eurobond market, where the majority of public issues are quoted on either theLuxembourg or London stock exchanges, nearly all of the trading is done on the over-the-counter market directly with a market maker. The nominal stock exchange quotations are thereto give investors confidence on the amount and quality of disclosure that will be provided.
A bond is not likely to have many retail investors, unless it is quoted on an exchange or theissuer has made other dealing arrangements for it. Similarly, retail investors will be eliminatedif the minimum ‘denomination’, the minimum trading unit, of the bond is very high (e.g.$100 000).
The following are examples of typical bond profiles.
Example 1.6 Commonwealth of Australia 5 34
% Bonds 2011
In August 1998, Australia issued AUD 4 495 387 000 of the above bonds for redemption at100 on 15 June 2011. The bonds pay interest every six months on 15 June and 15 Decem-ber. They have a denomination AUD 1000 and are in registered form. The denominationstatement means that they can only be traded in multiples of AUD 1000.
Example 1.7 European Investment Bank 5 % Bonds 2007
In October 1995, the European Investment Bank issued CHF 500 million of 5 % bondsat 103.375 for redemption on 18 October 2007 at 100. Interest is payable annually on18 October and the bonds are issued in units of CHF 5000 and CHF 100 000 in bearer form.The holder of the bonds (the bearer) can go to the paying agent with the bearer certificateon the 18 October each year and get the interest payment.
Example 1.8 Bank of Scotland Subordinated Floating-Rate Notes 2010
In August 1995 £75 million were issued at 100. They will be redeemed at 100 on 2 August2010. The notes pay interest quarterly on 2 February, May, August and November, whichis set in advance at 0.45 % above the London Interbank Offer Rate for three month sterlingdeposits.
Example 1.9 Societe Generale Subordinated Floating-Rate Notes – Perpetual
$500 million of floating-rate notes were issued in November 1996 at 100.05. Interest ispayable semi-annually on 31 May and 30 November each year. The annual interest ratefor each semi-annual period will be set in advance at 0.075 % above the London InterbankOffer Rate for six month US dollar deposits.
JWBK090-01 JWBK090/Brown February 25, 2006 7:32 Char Count= 0
What Is a Bond And Who Issues Them? 7
Example 1.10 Canada 4 14
% Index-linked Real Return Bonds 2026
In December 1995, Canada issued CAD 5250 million of the real return bond, which will beredeemed on 1 December 2026. It pays interest semi-annually on 1 June and 1 December.The actual interest payments and redemption amount are linked to the increase in theCanadian Consumer Price Index over the period since the issue date.
The issuer of a bond commits to pay interest on the loan and to repay the capital at some timein the future. In some jurisdictions, it is important to distinguish between these two differenttypes of cash flows, as they may be treated differently from a tax point of view.
1.2 THE DIFFERENCE BETWEEN CORPORATEBONDS AND EQUITIES
Bonds may be issued by organizations that have equity shareholders and those that do not.The former category includes both quoted and private companies, whereas the latter includesgovernments, regional governments, local authorities and special-purpose investment vehicles.As discussed later, the special-purpose investment vehicles have been created so that a poolof usually mortgage loans can be securitized and taken off the balance sheet of the originalcompany. As this entity does not have any equity, the bonds are often split into several trancheswith different claims on the assets. The tranche with the lowest claim on the assets is thusacting as a pseudo-equity share, but without any upward potential.
If you look at the balance sheet of a company, you will see that it usually consists of anumber of loans of various types and one or sometimes more issues of equity shares. Theloans, irrespective of whether they represent short-term bank borrowing, unquoted or quotedtradeable bonds, can all be considered to be bonds, although some may have a higher priorityin terms of receiving payment than the others.
The main differences between bonds and equity shares are that:� The holders of the equity shares own the company (i.e. they own the equity of the company).Hence collectively they can determine the future direction of the company.� The holders of the bonds, on the other hand, are only entitled to the return of the loan plusinterest on it at the agreed rate. They do not have any say in the future direction of thecompany. Similarly, they are not entitled to any other assets of the company, unless theassets formed part of the guarantee when the bond was issued.
The differences between equities and bonds can best be illustrated by considering a simplifiedprofit and loss account of a company:
Value of salesLess cost of salesLess interest on loans, etc.
= Pre-tax incomeLess tax
= Earnings before dividendsLess preference dividendsLess ordinary dividends
= Retained earnings
JWBK090-01 JWBK090/Brown February 25, 2006 7:32 Char Count= 0
8 An Introduction to the Bond Markets
This illustrates that the retained earnings of a company are equal to the value of the sales,minus the cost of the sales, minus any financing costs (i.e. the interest on any bank or otherloans) and tax payable, and minus the cost of the dividends on the preference and ordinaryshares.
All the interest on the loans and the tax has to be paid before any dividend can be paid onthe preference and ordinary shares. Similarly the preference dividends (which are often for apredefined fixed amount) have to be paid in full before an ordinary dividend can be paid.
Some of the loans may be entitled to interest payments before any is paid to other ‘subordi-nated’ loans. In fact, there may be several levels of entitlement. The lowest level of bonds insome recent company buyouts are called ‘mezzanine bonds’, whose entitlement to interest isonly slightly before any equity if it exists.
The owners of the equity shares in a company, which are, by definition, more risky invest-ments than the company’s loans and bonds are compensated by:� being able to determine the future direction of the company;� in the event of the company going into (possibly voluntary) liquidation, being entitled to any
residual assets of the company; and� if the company is successful, being entitled to increasing dividends. If a company increasesits dividend, the price of the shares is also likely to increase.2
2 Although the stock market has often anticipated this action, the result is that the price does not instantly move in the anticipateddirection.
JWBK090-02 JWBK090/Brown February 28, 2006 17:22 Char Count= 0
2
Types of Bonds and Other Instruments
This chapter describes many of the different types of fixed-rate, floating-rate and index-linkedbonds and short-term money market instruments that have been issued, together with someother financial instruments that work in a similar way. Some of the more common embeddedbond options, such as the ability of the issuer to call (redeem early) a bond or of the holderbeing able to convert the bond into another issue, are described in a later chapter.
2.1 FIXED-RATE BONDS
This section looks at some of the principal types of fixed-rate bonds. In particular, it looks atstraight coupon paying bonds, zero-coupon bonds, undated or irredeemable bonds, strippablebonds and strips, bonds with sinking funds, step-up or graduated-rate bonds and annuities.
2.1.1 Straight coupon bonds
These are the most common type of bonds. They are one of the easiest to understand and oftenthe easiest to value.
A vanilla ‘bullet’ straight bond or ‘option-free’ bond gives the holder the right to receiveinterest periodically and have the capital returned on an agreed single date. Neither the issuernor the investor has the right to demand early repayment of the bond.
Most fixed-rate straight bonds pay coupons once or twice a year, although a few (often olderissues) pay interest four times a year. The majority of bonds in a specific market sector tend tohave the same coupon payment frequency.
In the UK, US, Australian, Canadian, Italian and Japanese domestic markets, coupons arenormally paid semi-annually. In the international eurodollar zone and most of the rest ofContinental Europe, however, coupons on straight bonds are paid annually.
Example 2.1 4 14
% US Treasury 15 August 2013
By 2005, the US Treasury had issued over $33 billion of this bond. It pays a coupon of2.125 % on 15 August and another coupon of 2.125 % on 15 February each year until it isredeemed at par (100) on 15 August 2013.
Example 2.2 4 % France Obligations Assimilables du Tresor (OAT) 25 April 2055
In 2005, the French Treasury issued this 50 year bond. It pays a coupon of 4 % on 25 Aprileach year up to and including its redemption at par on 25 April 2055.
Example 2.3 2 12
% UK Consolidated Loan (Consols) – Perpetual
This security was created in 1888 as a result of consolidating three previous bonds, notably:3 % Consolidated Annuities, originally issued in 1752; 3 % Reduced Annuities of 1752 and
9
JWBK090-02 JWBK090/Brown February 28, 2006 17:22 Char Count= 0
10 An Introduction to the Bond Markets
3 % New Annuities of 1855. Since 1903 it has paid a quarterly coupon at an annual rate of2 1
2 % on 5 January, April, July and October. Since 5 April 1923 it has been callable as awhole or in part on 90 days notice at 100.
It is conventional for a straight bond that pays an annual coupon to pay the same couponeach year irrespective of whether it is a leap year or not. Similarly, if they pay two couponsa year, they pay exactly half the coupon every six months. Even if you ignore weekends andbank holidays, a six month period can vary between 181 and 184 days: e.g. 1 February to1 August is 181 days or 182 days in a leap year and 1 August to 1 February is 184 days. If thecoupon falls on a Saturday, a Sunday or another non-business day, the holder has to wait untilthe following business day to get the payment. There is no adjustment in the amount paid forthe delay. This delay also applies to any redemption amount. In the past, issuers have takenadvantage of this by getting two extra days of the loan free of interest, e.g. Taylor Woodrow8 3
4 % 1 December 1990, which had a redemption day on a Saturday.In the next section you will see that payments and payment dates on floating-rate notes vary
from one payment to the next, even when the underlying interest rate has not changed, due tothe change in the number of days in the period and the occurrence of non-business days.
Sometimes an issuer will find that the current conditions are suitable for the issue of a newbond, but he or she would like to pay coupons at a different time of year. This can arise for avariety of reasons: it could be that the business is cyclical and the issuer would prefer to paythe interest shortly after the peak sales season, or quite frequently the issuer already has a bondin the market place and would like to make this new issue a new tranche of the same bond.This new tranche is designed to be fungible (i.e. interchangeable) with the existing bond afterthe first coupon date. This may help with raising capital in the future, since investors tend toprefer larger bond issues as they are often more liquid. As a result bonds are often issued witha special long or short first coupon period.
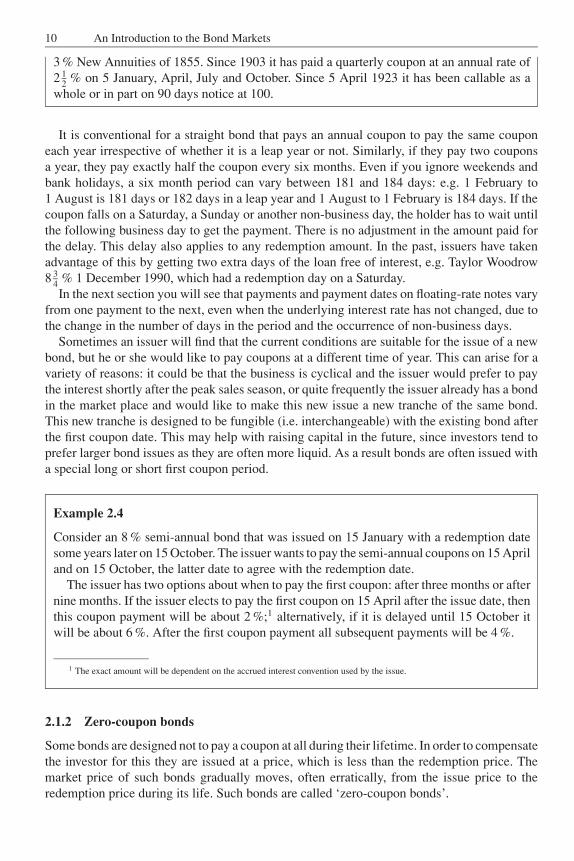
Example 2.4
Consider an 8 % semi-annual bond that was issued on 15 January with a redemption datesome years later on 15 October. The issuer wants to pay the semi-annual coupons on 15 Apriland on 15 October, the latter date to agree with the redemption date.
The issuer has two options about when to pay the first coupon: after three months or afternine months. If the issuer elects to pay the first coupon on 15 April after the issue date, thenthis coupon payment will be about 2 %;1 alternatively, if it is delayed until 15 October itwill be about 6 %. After the first coupon payment all subsequent payments will be 4 %.
1 The exact amount will be dependent on the accrued interest convention used by the issue.
2.1.2 Zero-coupon bonds
Some bonds are designed not to pay a coupon at all during their lifetime. In order to compensatethe investor for this they are issued at a price, which is less than the redemption price. Themarket price of such bonds gradually moves, often erratically, from the issue price to theredemption price during its life. Such bonds are called ‘zero-coupon bonds’.
JWBK090-02 JWBK090/Brown February 28, 2006 17:22 Char Count= 0
Types of Bonds and Other Instruments 11
Example 2.5 European Investment Bank 0 % 6/11/2026
The bond was issued in US dollars in November 1996 at 13.36. No coupons will be paidand it will be redeemed at par (100) on 6 November 2026.
An investor who purchased $1 million dollars nominal of the above bond at the issue datewould have paid $133 600. The terms specify that 30 years later the investor will get a singlepayment of $1 million, which is an increase in value in dollar terms of 648 %, or a compoundedannual return of 6.94 %.
2.1.3 Undated or irredeemable bonds
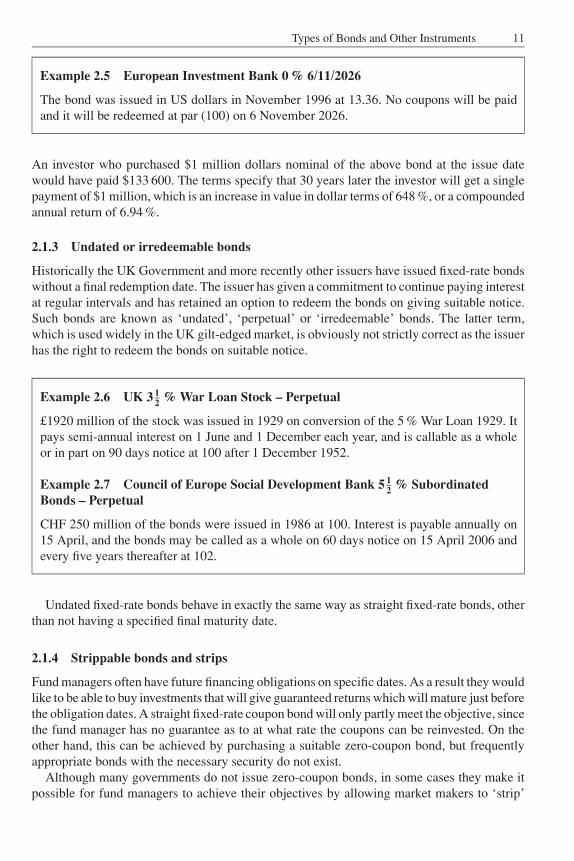
Historically the UK Government and more recently other issuers have issued fixed-rate bondswithout a final redemption date. The issuer has given a commitment to continue paying interestat regular intervals and has retained an option to redeem the bonds on giving suitable notice.Such bonds are known as ‘undated’, ‘perpetual’ or ‘irredeemable’ bonds. The latter term,which is used widely in the UK gilt-edged market, is obviously not strictly correct as the issuerhas the right to redeem the bonds on suitable notice.
Example 2.6 UK 3 12
% War Loan Stock – Perpetual
£1920 million of the stock was issued in 1929 on conversion of the 5 % War Loan 1929. Itpays semi-annual interest on 1 June and 1 December each year, and is callable as a wholeor in part on 90 days notice at 100 after 1 December 1952.
Example 2.7 Council of Europe Social Development Bank 5 12
% SubordinatedBonds – Perpetual
CHF 250 million of the bonds were issued in 1986 at 100. Interest is payable annually on15 April, and the bonds may be called as a whole on 60 days notice on 15 April 2006 andevery five years thereafter at 102.
Undated fixed-rate bonds behave in exactly the same way as straight fixed-rate bonds, otherthan not having a specified final maturity date.
2.1.4 Strippable bonds and strips
Fund managers often have future financing obligations on specific dates. As a result they wouldlike to be able to buy investments that will give guaranteed returns which will mature just beforethe obligation dates. A straight fixed-rate coupon bond will only partly meet the objective, sincethe fund manager has no guarantee as to at what rate the coupons can be reinvested. On theother hand, this can be achieved by purchasing a suitable zero-coupon bond, but frequentlyappropriate bonds with the necessary security do not exist.
Although many governments do not issue zero-coupon bonds, in some cases they make itpossible for fund managers to achieve their objectives by allowing market makers to ‘strip’
JWBK090-02 JWBK090/Brown February 28, 2006 17:22 Char Count= 0
12 An Introduction to the Bond Markets
some of their existing bonds. Stripping a fixed coupon bond means splitting each future interestpayment and the final capital repayment into a separate tradeable security. In effect, insteadof a conventional coupon paying bond, we now have a series of zero-coupon securities withdifferent maturity dates. This has been made possible, inter alia, in the US, French and UKgovernment bond markets.
Example 2.8
In May 2005 there was £172 million nominal of the UK Government 7 12 % Treasury Stock
2006 in stripped form. In other words the following zero-coupon bonds were created:
£6.45 million (= £172 million × 0.075 × 12 ) being redeemed on 7 June 2005
£6.45 million being redeemed on 7 December 2005£6.45 million being redeemed on 7 June 2006£6.45 million being redeemed on 7 December 2006 and£172 million of principal being redeemed on 7 December 2006
Note, in the above example, that the two tranches redeeming on 7 December 2006, one incomeand the other capital, have been kept separate. This is often done to allow for possible differenttax treatments.
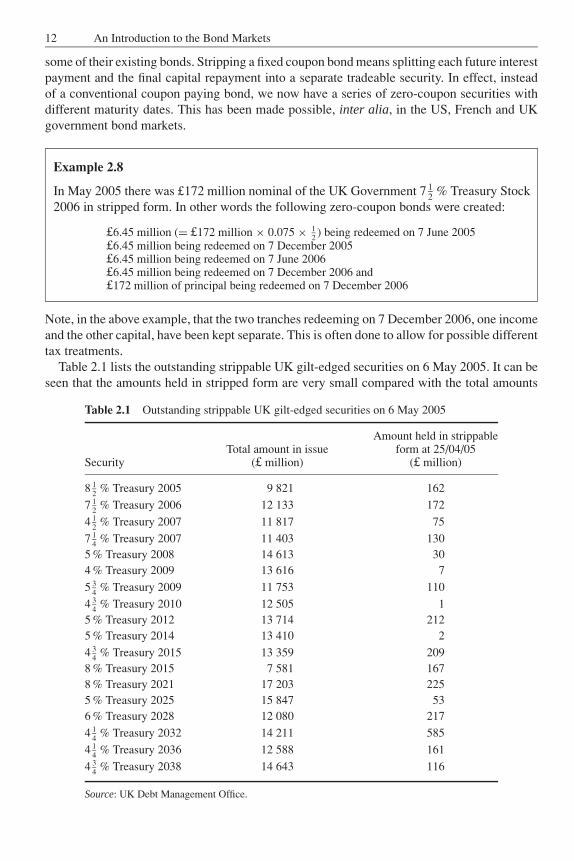
Table 2.1 lists the outstanding strippable UK gilt-edged securities on 6 May 2005. It can beseen that the amounts held in stripped form are very small compared with the total amounts
Table 2.1 Outstanding strippable UK gilt-edged securities on 6 May 2005
Amount held in strippableTotal amount in issue form at 25/04/05
Security (£ million) (£ million)
8 12 % Treasury 2005 9 821 162
7 12 % Treasury 2006 12 133 172
4 12 % Treasury 2007 11 817 75
7 14 % Treasury 2007 11 403 130
5 % Treasury 2008 14 613 304 % Treasury 2009 13 616 7
5 34 % Treasury 2009 11 753 110
4 34 % Treasury 2010 12 505 1
5 % Treasury 2012 13 714 2125 % Treasury 2014 13 410 2
4 34 % Treasury 2015 13 359 209
8 % Treasury 2015 7 581 1678 % Treasury 2021 17 203 2255 % Treasury 2025 15 847 536 % Treasury 2028 12 080 217
4 14 % Treasury 2032 14 211 585
4 14 % Treasury 2036 12 588 161
4 34 % Treasury 2038 14 643 116
Source: UK Debt Management Office.
JWBK090-02 JWBK090/Brown February 28, 2006 17:22 Char Count= 0
Types of Bonds and Other Instruments 13
in issue. These amounts are even smaller for the individual coupon strips. In order to partiallyrectify this situation, all the UK Treasury strippable bonds pay coupons on either 7 Marchand 7 September or 7 June and 7 December each year, and coupon strips from different bondscan be combined together. As at 25 April 2005, the total nominal value of the stripped bondspaying coupons in March and September is £743 million and that for those paying coupons inJune and December is £1885 million.
Strips, which allow pension funds and insurance companies to match their expected long-term liabilities more accurately, also enable them to offer guaranteed returns over several years,since the return is not dependent on any future coupon reinvestment rate.
It is sometimes possible, as is the case with the UK market, for market makers to recombineappropriate amounts of the stripped bonds and recreate ordinary coupon paying bonds.
2.1.5 Bonds with sinking funds
Sometimes bonds are issued with sinking funds. This means that the issuer, frequently acorporate body, puts away a certain amount of money in specified years to redeem part of theissue. Depending on the bond, the sinking fund may be used to:� Redeem a fixed proportion of each bond holding each time. Such bonds are also called serial
bonds.� Purchase bonds in the market up to a maximum price. If insufficient bonds can be purchasedthen the sinking fund may sometimes be used to redeem the bond shortfall by lot.� Redeem a proportion of the bonds by drawing lots.
Sinking funds, apart from in the case of serial bonds, enable some bond holdings to be com-pletely redeemed early whereas other holders have to wait until the final redemption date.
If the sinking fund can only be used to purchase bonds in the market place, its effect is toraise the price of the bond artificially until the allocation has been filled. However, it has noeffect on the expected cash flows of a long-term investor.
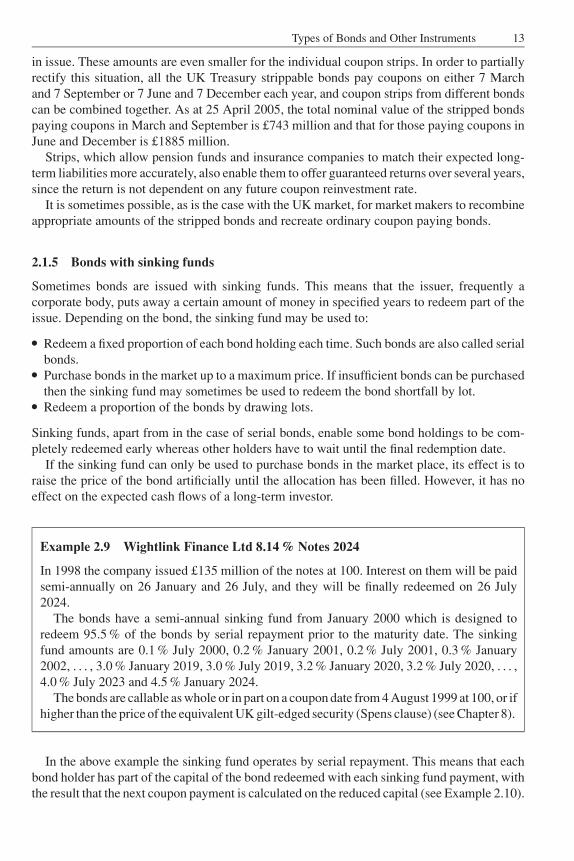
Example 2.9 Wightlink Finance Ltd 8.14 % Notes 2024
In 1998 the company issued £135 million of the notes at 100. Interest on them will be paidsemi-annually on 26 January and 26 July, and they will be finally redeemed on 26 July2024.
The bonds have a semi-annual sinking fund from January 2000 which is designed toredeem 95.5 % of the bonds by serial repayment prior to the maturity date. The sinkingfund amounts are 0.1 % July 2000, 0.2 % January 2001, 0.2 % July 2001, 0.3 % January2002, . . . , 3.0 % January 2019, 3.0 % July 2019, 3.2 % January 2020, 3.2 % July 2020, . . . ,4.0 % July 2023 and 4.5 % January 2024.
The bonds are callable as whole or in part on a coupon date from 4 August 1999 at 100, or ifhigher than the price of the equivalent UK gilt-edged security (Spens clause) (see Chapter 8).
In the above example the sinking fund operates by serial repayment. This means that eachbond holder has part of the capital of the bond redeemed with each sinking fund payment, withthe result that the next coupon payment is calculated on the reduced capital (see Example 2.10).
JWBK090-02 JWBK090/Brown February 28, 2006 17:22 Char Count= 0
14 An Introduction to the Bond Markets
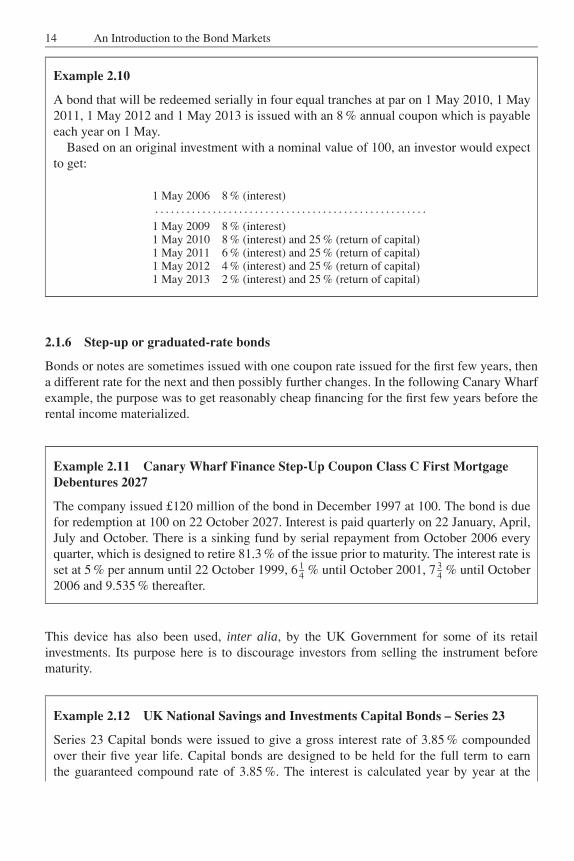
Example 2.10
A bond that will be redeemed serially in four equal tranches at par on 1 May 2010, 1 May2011, 1 May 2012 and 1 May 2013 is issued with an 8 % annual coupon which is payableeach year on 1 May.
Based on an original investment with a nominal value of 100, an investor would expectto get:
1 May 2006 8 % (interest). . . . . . . . . . . . . . . . . . . . . . . . . . . . . . . . . . . . . . . . . . . . . . . . . . . .
1 May 2009 8 % (interest)1 May 2010 8 % (interest) and 25 % (return of capital)1 May 2011 6 % (interest) and 25 % (return of capital)1 May 2012 4 % (interest) and 25 % (return of capital)1 May 2013 2 % (interest) and 25 % (return of capital)
2.1.6 Step-up or graduated-rate bonds
Bonds or notes are sometimes issued with one coupon rate issued for the first few years, thena different rate for the next and then possibly further changes. In the following Canary Wharfexample, the purpose was to get reasonably cheap financing for the first few years before therental income materialized.
Example 2.11 Canary Wharf Finance Step-Up Coupon Class C First MortgageDebentures 2027
The company issued £120 million of the bond in December 1997 at 100. The bond is duefor redemption at 100 on 22 October 2027. Interest is paid quarterly on 22 January, April,July and October. There is a sinking fund by serial repayment from October 2006 everyquarter, which is designed to retire 81.3 % of the issue prior to maturity. The interest rate isset at 5 % per annum until 22 October 1999, 6 1
4 % until October 2001, 7 34 % until October
2006 and 9.535 % thereafter.
This device has also been used, inter alia, by the UK Government for some of its retailinvestments. Its purpose here is to discourage investors from selling the instrument beforematurity.
Example 2.12 UK National Savings and Investments Capital Bonds – Series 23
Series 23 Capital bonds were issued to give a gross interest rate of 3.85 % compoundedover their five year life. Capital bonds are designed to be held for the full term to earnthe guaranteed compound rate of 3.85 %. The interest is calculated year by year at the
JWBK090-02 JWBK090/Brown February 28, 2006 17:22 Char Count= 0
Types of Bonds and Other Instruments 15
following rates:
Year Gross rates
1 3.25 %2 3.55 %3 3.85 %4 4.15 %5 4.46 %
No interest is paid on bonds repaid in the first year.
In the above example, the market in the bonds is controlled by the National Savings andInvestments backed by HM Treasury at predefined rates.
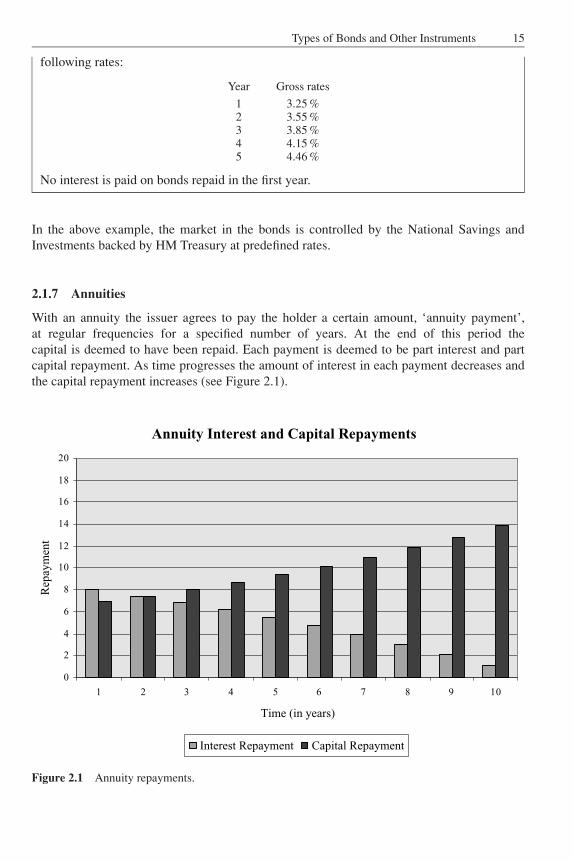
2.1.7 Annuities
With an annuity the issuer agrees to pay the holder a certain amount, ‘annuity payment’,at regular frequencies for a specified number of years. At the end of this period thecapital is deemed to have been repaid. Each payment is deemed to be part interest and partcapital repayment. As time progresses the amount of interest in each payment decreases andthe capital repayment increases (see Figure 2.1).
Annuity Interest and Capital Repayments
0
2
4
6
8
10
12
14
16
18
20
1 2 3 4 5 6 7 8 9 10
Time (in years)
Rep
aym
ent
Interest Repayment Capital Repayment
Figure 2.1 Annuity repayments.
JWBK090-02 JWBK090/Brown February 28, 2006 17:22 Char Count= 0
16 An Introduction to the Bond Markets
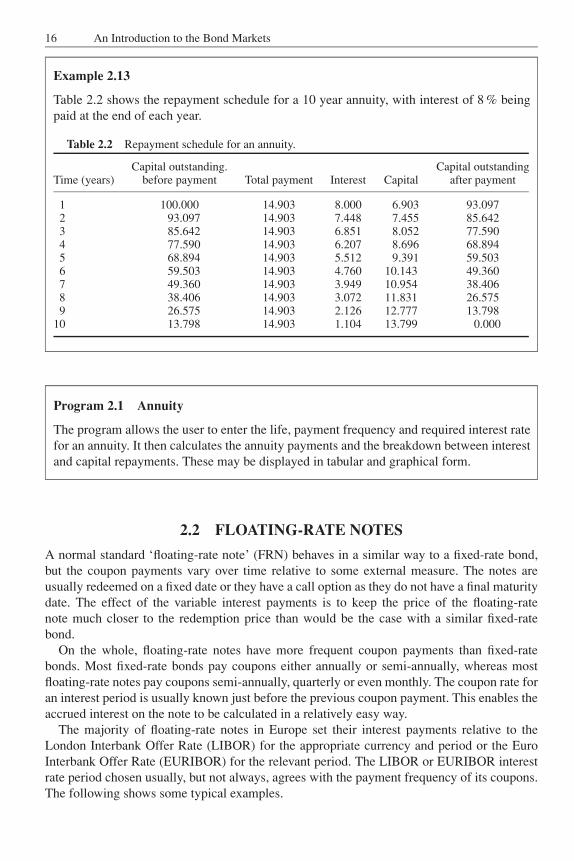
Example 2.13
Table 2.2 shows the repayment schedule for a 10 year annuity, with interest of 8 % beingpaid at the end of each year.
Table 2.2 Repayment schedule for an annuity.
Capital outstanding. Capital outstandingTime (years) before payment Total payment Interest Capital after payment
1 100.000 14.903 8.000 6.903 93.0972 93.097 14.903 7.448 7.455 85.6423 85.642 14.903 6.851 8.052 77.5904 77.590 14.903 6.207 8.696 68.8945 68.894 14.903 5.512 9.391 59.5036 59.503 14.903 4.760 10.143 49.3607 49.360 14.903 3.949 10.954 38.4068 38.406 14.903 3.072 11.831 26.5759 26.575 14.903 2.126 12.777 13.798
10 13.798 14.903 1.104 13.799 0.000
Program 2.1 Annuity
The program allows the user to enter the life, payment frequency and required interest ratefor an annuity. It then calculates the annuity payments and the breakdown between interestand capital repayments. These may be displayed in tabular and graphical form.
2.2 FLOATING-RATE NOTES
A normal standard ‘floating-rate note’ (FRN) behaves in a similar way to a fixed-rate bond,but the coupon payments vary over time relative to some external measure. The notes areusually redeemed on a fixed date or they have a call option as they do not have a final maturitydate. The effect of the variable interest payments is to keep the price of the floating-ratenote much closer to the redemption price than would be the case with a similar fixed-ratebond.
On the whole, floating-rate notes have more frequent coupon payments than fixed-ratebonds. Most fixed-rate bonds pay coupons either annually or semi-annually, whereas mostfloating-rate notes pay coupons semi-annually, quarterly or even monthly. The coupon rate foran interest period is usually known just before the previous coupon payment. This enables theaccrued interest on the note to be calculated in a relatively easy way.
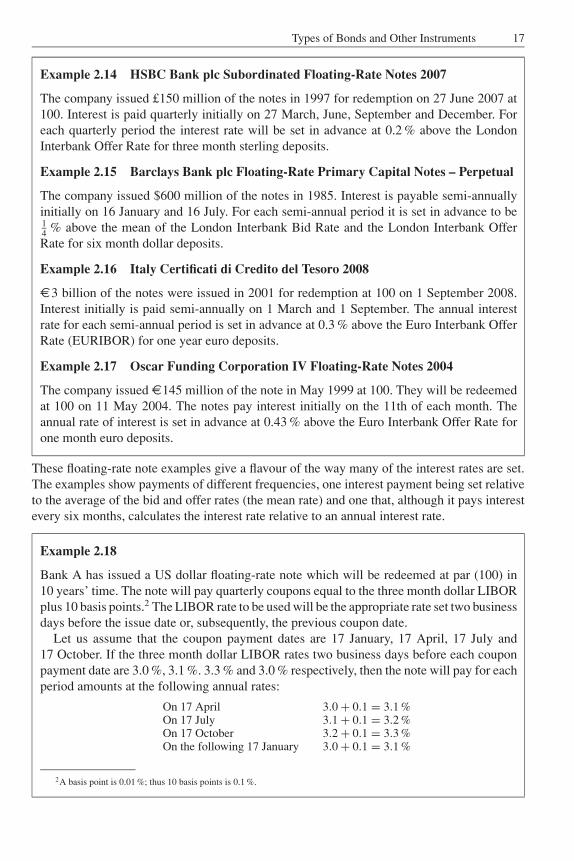
The majority of floating-rate notes in Europe set their interest payments relative to theLondon Interbank Offer Rate (LIBOR) for the appropriate currency and period or the EuroInterbank Offer Rate (EURIBOR) for the relevant period. The LIBOR or EURIBOR interestrate period chosen usually, but not always, agrees with the payment frequency of its coupons.The following shows some typical examples.
JWBK090-02 JWBK090/Brown February 28, 2006 17:22 Char Count= 0
Types of Bonds and Other Instruments 17
Example 2.14 HSBC Bank plc Subordinated Floating-Rate Notes 2007
The company issued £150 million of the notes in 1997 for redemption on 27 June 2007 at100. Interest is paid quarterly initially on 27 March, June, September and December. Foreach quarterly period the interest rate will be set in advance at 0.2 % above the LondonInterbank Offer Rate for three month sterling deposits.
Example 2.15 Barclays Bank plc Floating-Rate Primary Capital Notes – Perpetual
The company issued $600 million of the notes in 1985. Interest is payable semi-annuallyinitially on 16 January and 16 July. For each semi-annual period it is set in advance to be14 % above the mean of the London Interbank Bid Rate and the London Interbank OfferRate for six month dollar deposits.
Example 2.16 Italy Certificati di Credito del Tesoro 2008
€3 billion of the notes were issued in 2001 for redemption at 100 on 1 September 2008.Interest initially is paid semi-annually on 1 March and 1 September. The annual interestrate for each semi-annual period is set in advance at 0.3 % above the Euro Interbank OfferRate (EURIBOR) for one year euro deposits.
Example 2.17 Oscar Funding Corporation IV Floating-Rate Notes 2004
The company issued €145 million of the note in May 1999 at 100. They will be redeemedat 100 on 11 May 2004. The notes pay interest initially on the 11th of each month. Theannual rate of interest is set in advance at 0.43 % above the Euro Interbank Offer Rate forone month euro deposits.
These floating-rate note examples give a flavour of the way many of the interest rates are set.The examples show payments of different frequencies, one interest payment being set relativeto the average of the bid and offer rates (the mean rate) and one that, although it pays interestevery six months, calculates the interest rate relative to an annual interest rate.
Example 2.18
Bank A has issued a US dollar floating-rate note which will be redeemed at par (100) in10 years’ time. The note will pay quarterly coupons equal to the three month dollar LIBORplus 10 basis points.2 The LIBOR rate to be used will be the appropriate rate set two businessdays before the issue date or, subsequently, the previous coupon date.
Let us assume that the coupon payment dates are 17 January, 17 April, 17 July and17 October. If the three month dollar LIBOR rates two business days before each couponpayment date are 3.0 %, 3.1 %. 3.3 % and 3.0 % respectively, then the note will pay for eachperiod amounts at the following annual rates:
On 17 April 3.0 + 0.1 = 3.1 %On 17 July 3.1 + 0.1 = 3.2 %On 17 October 3.2 + 0.1 = 3.3 %On the following 17 January 3.0 + 0.1 = 3.1 %
2A basis point is 0.01 %; thus 10 basis points is 0.1 %.
JWBK090-02 JWBK090/Brown February 28, 2006 17:22 Char Count= 0
18 An Introduction to the Bond Markets
Floating-rate notes are quoted with a percentage clean price in the same way as vanillafixed-rate bonds. As the next coupon rate is normally already known at the start of the period,there is no problem in calculating accrued interest. However, these calculations are slightlydifferent to those of fixed-rate bonds. The main difference is that as floating-rate notes aretreated as quasi-money market instruments, the coupon payment dates are modified to alwaysoccur on a day when the relevant market is open. For example, the US market is deemed to beopen when the markets in New York are open, and the euro markets on Target business days.
In order to ensure that payment dates only occur on business days issuing houses frequentlyadopt the following convention:
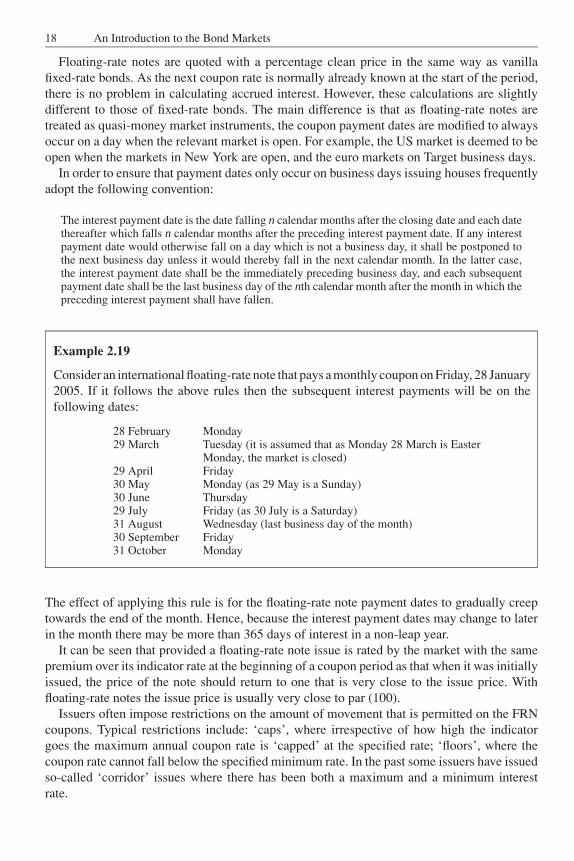
The interest payment date is the date falling n calendar months after the closing date and each datethereafter which falls n calendar months after the preceding interest payment date. If any interestpayment date would otherwise fall on a day which is not a business day, it shall be postponed tothe next business day unless it would thereby fall in the next calendar month. In the latter case,the interest payment date shall be the immediately preceding business day, and each subsequentpayment date shall be the last business day of the nth calendar month after the month in which thepreceding interest payment shall have fallen.
Example 2.19
Consider an international floating-rate note that pays a monthly coupon on Friday, 28 January2005. If it follows the above rules then the subsequent interest payments will be on thefollowing dates:
28 February Monday29 March Tuesday (it is assumed that as Monday 28 March is Easter
Monday, the market is closed)29 April Friday30 May Monday (as 29 May is a Sunday)30 June Thursday29 July Friday (as 30 July is a Saturday)31 August Wednesday (last business day of the month)30 September Friday31 October Monday
The effect of applying this rule is for the floating-rate note payment dates to gradually creeptowards the end of the month. Hence, because the interest payment dates may change to laterin the month there may be more than 365 days of interest in a non-leap year.
It can be seen that provided a floating-rate note issue is rated by the market with the samepremium over its indicator rate at the beginning of a coupon period as that when it was initiallyissued, the price of the note should return to one that is very close to the issue price. Withfloating-rate notes the issue price is usually very close to par (100).
Issuers often impose restrictions on the amount of movement that is permitted on the FRNcoupons. Typical restrictions include: ‘caps’, where irrespective of how high the indicatorgoes the maximum annual coupon rate is ‘capped’ at the specified rate; ‘floors’, where thecoupon rate cannot fall below the specified minimum rate. In the past some issuers have issuedso-called ‘corridor’ issues where there has been both a maximum and a minimum interestrate.
JWBK090-02 JWBK090/Brown February 28, 2006 17:22 Char Count= 0
Types of Bonds and Other Instruments 19
Example 2.20 Internationale Nederlanden Bank SubordinatedFloating-Rate Notes 2005
The company issued $300 million of the notes in 1993 for redemption at 100 on 18 October2005. The interest is paid semi-annually initially on 18 April and 18 October each year. Theannual interest rate for each semi-annual period is set in advance at 1
4 % below the LondonInterbank Offer Rate for six month dollar deposits, but subject to a minimum of 5 % and amaximum of 8 %.
In this example the calculated interest rate, if it was in the permitted range, was below theLondon Interbank Offer Rate.
2.2.1 Undated or perpetual floating-rate notes
A number of issuers, although in the main banks, have issued either hybrid fixed-rate andfloating-rate or just floating-rate undated or perpetual issues. Whereas governments or gov-ernment agencies are happy to issue perpetual fixed-rate issues, banks are more cautious andprefer to be able to reset the coupon rate from time to time.
Example 2.21 Abbey National 7.35 % Subordinated Capital Securities – Perpetual
The company issued $550 million of the securities in 1996 at 99.946. Interest is payablesemi-annually on 15 April and 15 October. Interest will be fixed at 7.35 % per annum untilOctober 2006; thereafter it will be reset every five years at 1.78 % above the five year USTreasury constant maturity rate.
The securities are callable as a whole every five years on 30 days’ notice from October2006 at 100, or if the tax status changes on a coupon date at 100 from October 1996.
Example 2.22 Sumitomo Bank International Finance Fixed/Floating-RateSubordinated Notes Series B – Perpetual
The bank issued JPY 19.5 billion of the notes in 1995 at 100. The notes pay interestannually on 30 June. Until June 2005 the interest rate was fixed at 5.15 %. Thereafter theannual interest rate will be fixed in advance to be 1 % above the London Interbank OfferRate for six month yen deposits and will be payable semi-annually on each 30 June and31 December. The margin rate changes from 1 % to 1.5 % from June 2010.
The bond is callable as a whole or in part on coupon dates only on 25 days’ notice from30 June 2005.
2.3 INDEX-LINKED BONDS
An index-linked bond is a bond where the coupons and the redemption value are linked tosome external index. This index frequently measures the inflation in the country where theyare issued. Thus a holder of index-linked bonds gets a return that is inflation proof relative to
JWBK090-02 JWBK090/Brown February 28, 2006 17:22 Char Count= 0
20 An Introduction to the Bond Markets
the index. As a result of this inflation-proofing attribute, index-linked bonds are usually issuedby governments in their domestic currency. However, there is in principle no reason why theycould not be issued by a corporation with, e.g. in the case of a mining company, bonds linkedto the world price of the mineral ore they are extracting.
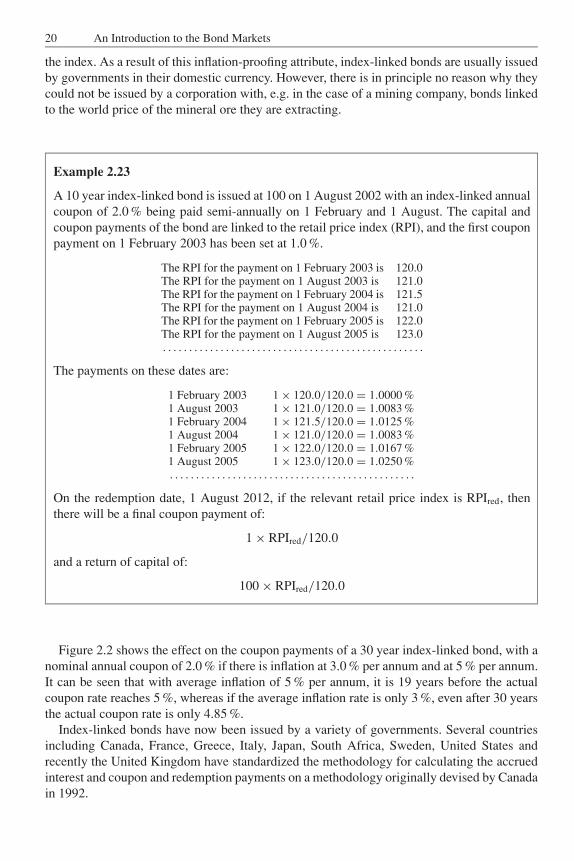
Example 2.23
A 10 year index-linked bond is issued at 100 on 1 August 2002 with an index-linked annualcoupon of 2.0 % being paid semi-annually on 1 February and 1 August. The capital andcoupon payments of the bond are linked to the retail price index (RPI), and the first couponpayment on 1 February 2003 has been set at 1.0 %.
The RPI for the payment on 1 February 2003 is 120.0The RPI for the payment on 1 August 2003 is 121.0The RPI for the payment on 1 February 2004 is 121.5The RPI for the payment on 1 August 2004 is 121.0The RPI for the payment on 1 February 2005 is 122.0The RPI for the payment on 1 August 2005 is 123.0. . . . . . . . . . . . . . . . . . . . . . . . . . . . . . . . . . . . . . . . . . . . . . . . . .
The payments on these dates are:
1 February 2003 1 × 120.0/120.0 = 1.0000 %1 August 2003 1 × 121.0/120.0 = 1.0083 %1 February 2004 1 × 121.5/120.0 = 1.0125 %1 August 2004 1 × 121.0/120.0 = 1.0083 %1 February 2005 1 × 122.0/120.0 = 1.0167 %1 August 2005 1 × 123.0/120.0 = 1.0250 %. . . . . . . . . . . . . . . . . . . . . . . . . . . . . . . . . . . . . . . . . . . . . . .
On the redemption date, 1 August 2012, if the relevant retail price index is RPIred, thenthere will be a final coupon payment of:
1 × RPIred/120.0
and a return of capital of:
100 × RPIred/120.0
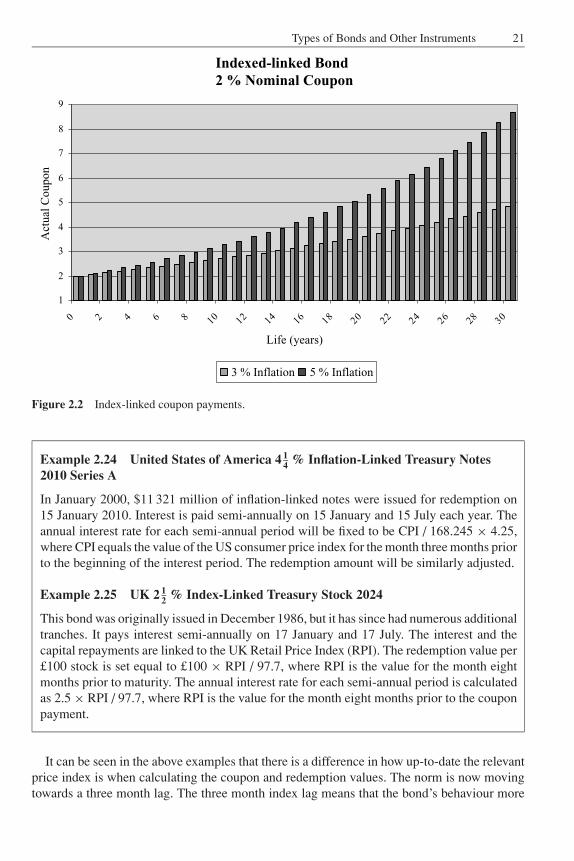
Figure 2.2 shows the effect on the coupon payments of a 30 year index-linked bond, with anominal annual coupon of 2.0 % if there is inflation at 3.0 % per annum and at 5 % per annum.It can be seen that with average inflation of 5 % per annum, it is 19 years before the actualcoupon rate reaches 5 %, whereas if the average inflation rate is only 3 %, even after 30 yearsthe actual coupon rate is only 4.85 %.
Index-linked bonds have now been issued by a variety of governments. Several countriesincluding Canada, France, Greece, Italy, Japan, South Africa, Sweden, United States andrecently the United Kingdom have standardized the methodology for calculating the accruedinterest and coupon and redemption payments on a methodology originally devised by Canadain 1992.
JWBK090-02 JWBK090/Brown February 28, 2006 17:22 Char Count= 0
Types of Bonds and Other Instruments 21
Indexed-linked Bond2 % Nominal Coupon
1
2
3
4
5
6
7
8
9
0 2 4 6 8 10 12 14 16 18 20 22 24 26 28 30
Life (years)
Act
ual
Co
up
on
3 % Inflation 5 % Inflation
Figure 2.2 Index-linked coupon payments.
Example 2.24 United States of America 4 14
% Inflation-Linked Treasury Notes2010 Series A
In January 2000, $11 321 million of inflation-linked notes were issued for redemption on15 January 2010. Interest is paid semi-annually on 15 January and 15 July each year. Theannual interest rate for each semi-annual period will be fixed to be CPI / 168.245 × 4.25,where CPI equals the value of the US consumer price index for the month three months priorto the beginning of the interest period. The redemption amount will be similarly adjusted.
Example 2.25 UK 2 12
% Index-Linked Treasury Stock 2024
This bond was originally issued in December 1986, but it has since had numerous additionaltranches. It pays interest semi-annually on 17 January and 17 July. The interest and thecapital repayments are linked to the UK Retail Price Index (RPI). The redemption value per£100 stock is set equal to £100 × RPI / 97.7, where RPI is the value for the month eightmonths prior to maturity. The annual interest rate for each semi-annual period is calculatedas 2.5 × RPI / 97.7, where RPI is the value for the month eight months prior to the couponpayment.
It can be seen in the above examples that there is a difference in how up-to-date the relevantprice index is when calculating the coupon and redemption values. The norm is now movingtowards a three month lag. The three month index lag means that the bond’s behaviour more
JWBK090-02 JWBK090/Brown February 28, 2006 17:22 Char Count= 0
22 An Introduction to the Bond Markets
closely matches the performance of the underlying index. Unfortunately, this is paid for byan increase in the complexity of the transaction calculations, as the next coupon amount is nolonger known before the start of the coupon period.
2.4 HYBRID BONDS
Bonds are sometimes issued that do not conveniently fit into any of the above categories.Examples of such bonds are ones where they perform as conventional fixed-rate bonds for thefirst few years of their lives and then change to being a floating-rate note, or possibly the otherway round. The former type are called ‘fixed/floating bonds’.
Example 2.26 Skandinaviska Enskilda Banken SubordinatedStep-Up Notes – Perpetual
The company issued £100 million of the notes in December 1996 at 100. Interest which willbe paid annually on 11 December will be fixed at 9.04 % until December 2006 and thereafterfor each semi-annual period fixed in advance at 2.5 % above the London Interbank OfferRate for six month sterling deposits.
2.5 OTHER INSTRUMENT TYPES
2.5.1 Treasury bills
Treasury bills are short-term money market instruments, with a life to maturity of typicallyfour weeks to 12 months. They are issued by a number of governments including the UK andUS. As they do not have a specified coupon, they are in effect zero-coupon instruments andare issued at a discount to their nominal (or face) value, at which price they are redeemed.
In the UK, the Debt Management Office issues Treasury bills on a weekly basis each Monday.It offers 28 day and 91 day Treasury bills each week and 182 day ones every month. SinceTreasury bills are pure discount instruments without a coupon, any new issue with the samematurity date as an existing issue is regarded as a new tranche of the existing bill. In September2005, there were over £22 billion of UK Treasury bills outstanding.
The extract given in Table 2.3 shows the results of the Treasury bill tender offer on2 December 2005. The length of the 28 day bill has been extended by one day as 2 January2006 is a bank holiday.
2.5.2 Certificates of deposit
A ‘certificate of deposit’ (CD) is a time deposit with a bank that cannot be withdrawn untilmaturity. They are generally issued by commercial banks and have a fixed maturity date (usuallybetween three months and five years) and specified coupon and payment dates. After issue,certificates of deposit are tradeable in a similar way to bonds and are often quoted on a yieldbasis. Short-term certificates of deposit tend to yield slightly more than a similar Treasury bill,
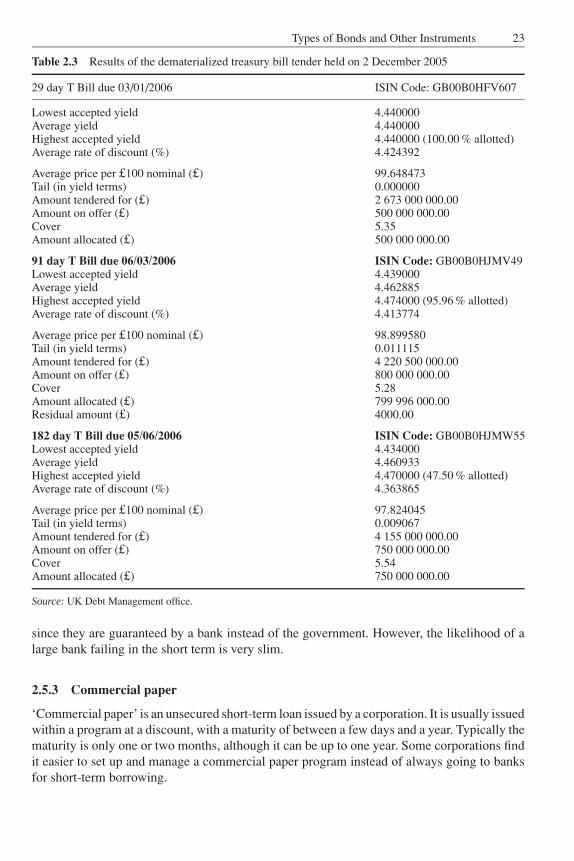
JWBK090-02 JWBK090/Brown February 28, 2006 17:22 Char Count= 0
Types of Bonds and Other Instruments 23
Table 2.3 Results of the dematerialized treasury bill tender held on 2 December 2005
29 day T Bill due 03/01/2006 ISIN Code: GB00B0HFV607
Lowest accepted yield 4.440000Average yield 4.440000Highest accepted yield 4.440000 (100.00 % allotted)Average rate of discount (%) 4.424392
Average price per £100 nominal (£) 99.648473Tail (in yield terms) 0.000000Amount tendered for (£) 2 673 000 000.00Amount on offer (£) 500 000 000.00Cover 5.35Amount allocated (£) 500 000 000.00
91 day T Bill due 06/03/2006 ISIN Code: GB00B0HJMV49Lowest accepted yield 4.439000Average yield 4.462885Highest accepted yield 4.474000 (95.96 % allotted)Average rate of discount (%) 4.413774
Average price per £100 nominal (£) 98.899580Tail (in yield terms) 0.011115Amount tendered for (£) 4 220 500 000.00Amount on offer (£) 800 000 000.00Cover 5.28Amount allocated (£) 799 996 000.00Residual amount (£) 4000.00
182 day T Bill due 05/06/2006 ISIN Code: GB00B0HJMW55Lowest accepted yield 4.434000Average yield 4.460933Highest accepted yield 4.470000 (47.50 % allotted)Average rate of discount (%) 4.363865
Average price per £100 nominal (£) 97.824045Tail (in yield terms) 0.009067Amount tendered for (£) 4 155 000 000.00Amount on offer (£) 750 000 000.00Cover 5.54Amount allocated (£) 750 000 000.00
Source: UK Debt Management office.
since they are guaranteed by a bank instead of the government. However, the likelihood of alarge bank failing in the short term is very slim.
2.5.3 Commercial paper
‘Commercial paper’ is an unsecured short-term loan issued by a corporation. It is usually issuedwithin a program at a discount, with a maturity of between a few days and a year. Typically thematurity is only one or two months, although it can be up to one year. Some corporations findit easier to set up and manage a commercial paper program instead of always going to banksfor short-term borrowing.
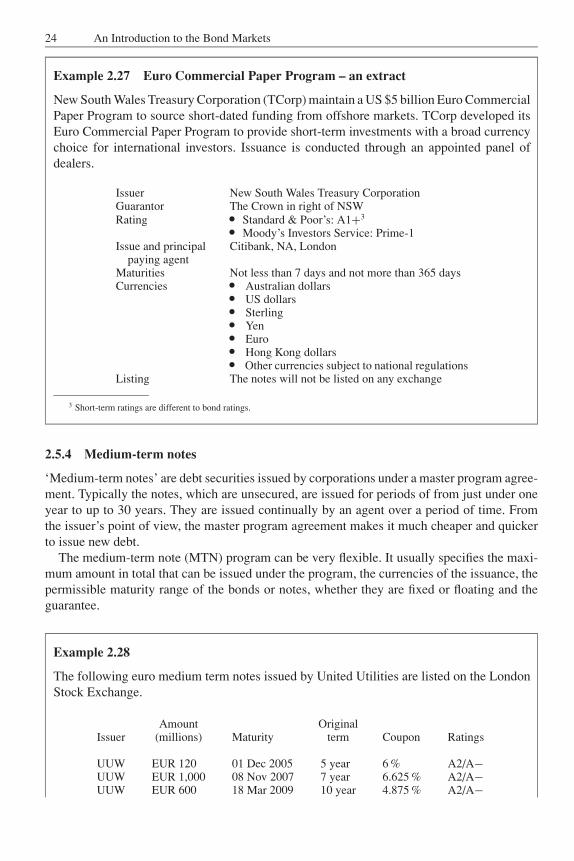
JWBK090-02 JWBK090/Brown February 28, 2006 17:22 Char Count= 0
24 An Introduction to the Bond Markets
Example 2.27 Euro Commercial Paper Program – an extract
New South Wales Treasury Corporation (TCorp) maintain a US $5 billion Euro CommercialPaper Program to source short-dated funding from offshore markets. TCorp developed itsEuro Commercial Paper Program to provide short-term investments with a broad currencychoice for international investors. Issuance is conducted through an appointed panel ofdealers.
Issuer New South Wales Treasury CorporationGuarantor The Crown in right of NSWRating � Standard & Poor’s: A1+3� Moody’s Investors Service: Prime-1Issue and principal Citibank, NA, London
paying agentMaturities Not less than 7 days and not more than 365 daysCurrencies � Australian dollars� US dollars� Sterling� Yen� Euro� Hong Kong dollars� Other currencies subject to national regulationsListing The notes will not be listed on any exchange
3 Short-term ratings are different to bond ratings.
2.5.4 Medium-term notes
‘Medium-term notes’ are debt securities issued by corporations under a master program agree-ment. Typically the notes, which are unsecured, are issued for periods of from just under oneyear to up to 30 years. They are issued continually by an agent over a period of time. Fromthe issuer’s point of view, the master program agreement makes it much cheaper and quickerto issue new debt.
The medium-term note (MTN) program can be very flexible. It usually specifies the maxi-mum amount in total that can be issued under the program, the currencies of the issuance, thepermissible maturity range of the bonds or notes, whether they are fixed or floating and theguarantee.
Example 2.28
The following euro medium term notes issued by United Utilities are listed on the LondonStock Exchange.
Amount OriginalIssuer (millions) Maturity term Coupon Ratings
UUW EUR 120 01 Dec 2005 5 year 6 % A2/A−UUW EUR 1,000 08 Nov 2007 7 year 6.625 % A2/A−UUW EUR 600 18 Mar 2009 10 year 4.875 % A2/A−
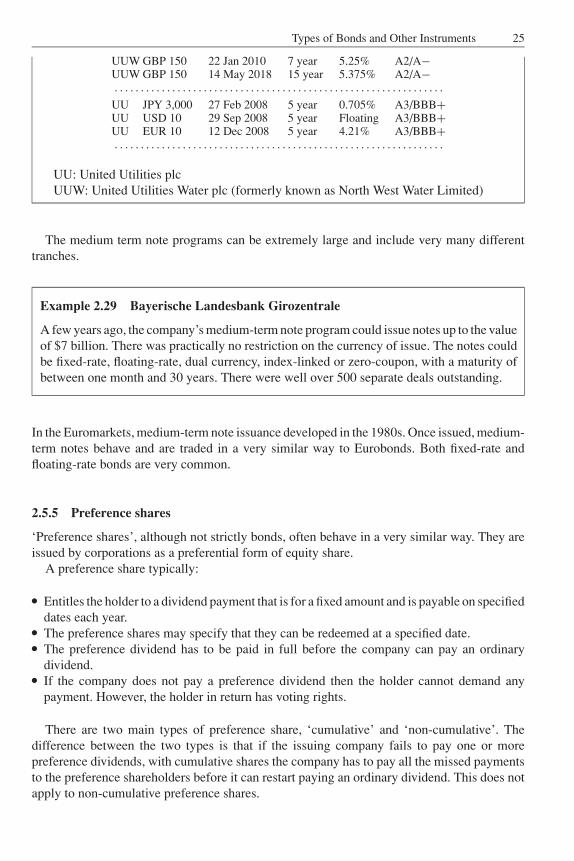
JWBK090-02 JWBK090/Brown February 28, 2006 17:22 Char Count= 0
Types of Bonds and Other Instruments 25
UUW GBP 150 22 Jan 2010 7 year 5.25% A2/A−UUW GBP 150 14 May 2018 15 year 5.375% A2/A−. . . . . . . . . . . . . . . . . . . . . . . . . . . . . . . . . . . . . . . . . . . . . . . . . . . . . . . . . . . . . . .
UU JPY 3,000 27 Feb 2008 5 year 0.705% A3/BBB+UU USD 10 29 Sep 2008 5 year Floating A3/BBB+UU EUR 10 12 Dec 2008 5 year 4.21% A3/BBB+. . . . . . . . . . . . . . . . . . . . . . . . . . . . . . . . . . . . . . . . . . . . . . . . . . . . . . . . . . . . . . .
UU: United Utilities plcUUW: United Utilities Water plc (formerly known as North West Water Limited)
The medium term note programs can be extremely large and include very many differenttranches.
Example 2.29 Bayerische Landesbank Girozentrale
A few years ago, the company’s medium-term note program could issue notes up to the valueof $7 billion. There was practically no restriction on the currency of issue. The notes couldbe fixed-rate, floating-rate, dual currency, index-linked or zero-coupon, with a maturity ofbetween one month and 30 years. There were well over 500 separate deals outstanding.
In the Euromarkets, medium-term note issuance developed in the 1980s. Once issued, medium-term notes behave and are traded in a very similar way to Eurobonds. Both fixed-rate andfloating-rate bonds are very common.
2.5.5 Preference shares
‘Preference shares’, although not strictly bonds, often behave in a very similar way. They areissued by corporations as a preferential form of equity share.
A preference share typically:� Entitles the holder to a dividend payment that is for a fixed amount and is payable on specifieddates each year.� The preference shares may specify that they can be redeemed at a specified date.� The preference dividend has to be paid in full before the company can pay an ordinarydividend.� If the company does not pay a preference dividend then the holder cannot demand anypayment. However, the holder in return has voting rights.
There are two main types of preference share, ‘cumulative’ and ‘non-cumulative’. Thedifference between the two types is that if the issuing company fails to pay one or morepreference dividends, with cumulative shares the company has to pay all the missed paymentsto the preference shareholders before it can restart paying an ordinary dividend. This does notapply to non-cumulative preference shares.
JWBK090-02 JWBK090/Brown February 28, 2006 17:22 Char Count= 0
26 An Introduction to the Bond Markets
Example 2.30 Peninsular and Oriental Steam Navigation Company (P&O) 5.5 %(net) Sterling Redeemable Non-cumulative Preferred Stock
The shares, which were issued in 1987, pay a 5.5 % dividend on 1 July each year, andmay be redeemed at any time after 31 December 1999 provided the directors have got anindependent advisor to agree that the continuation of the shares is not in the interests ofeither the shareholders or the company. Each share is redeemable at par (£1) plus a premiumof 20 p.
2.5.6 Permanent interest bearing shares
‘Permanent interest bearing shares’ (PIBS) are essentially a type of sterling preference sharethat arose in the UK as a result of special tax treatment for building societies. The maindifference between a PIBS and a bank preference share is that the coupons on PIBS are taxdeductible for building societies, whereas bank preference shares are not. Hence they can offera higher coupon.
Example 2.31 Manchester Building Society 8 % Permanent Interest Bearing Shares
On 1 November 1999 the company issued £5 000 000 of PIBS in denominations of £1 000.
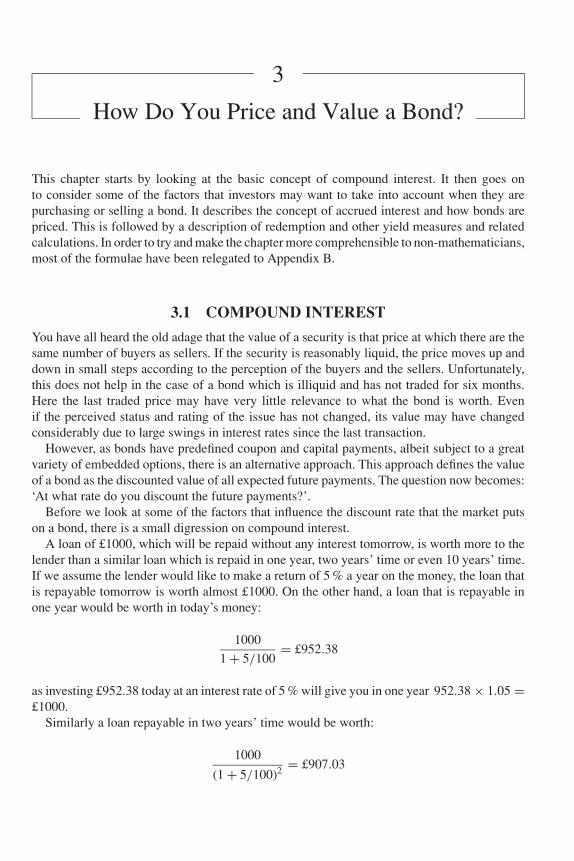
JWBK090-03 JWBK090/Brown March 4, 2006 1:42 Char Count= 0
3
How Do You Price and Value a Bond?
This chapter starts by looking at the basic concept of compound interest. It then goes onto consider some of the factors that investors may want to take into account when they arepurchasing or selling a bond. It describes the concept of accrued interest and how bonds arepriced. This is followed by a description of redemption and other yield measures and relatedcalculations. In order to try and make the chapter more comprehensible to non-mathematicians,most of the formulae have been relegated to Appendix B.
3.1 COMPOUND INTEREST
You have all heard the old adage that the value of a security is that price at which there are thesame number of buyers as sellers. If the security is reasonably liquid, the price moves up anddown in small steps according to the perception of the buyers and the sellers. Unfortunately,this does not help in the case of a bond which is illiquid and has not traded for six months.Here the last traded price may have very little relevance to what the bond is worth. Evenif the perceived status and rating of the issue has not changed, its value may have changedconsiderably due to large swings in interest rates since the last transaction.
However, as bonds have predefined coupon and capital payments, albeit subject to a greatvariety of embedded options, there is an alternative approach. This approach defines the valueof a bond as the discounted value of all expected future payments. The question now becomes:‘At what rate do you discount the future payments?’.
Before we look at some of the factors that influence the discount rate that the market putson a bond, there is a small digression on compound interest.
A loan of £1000, which will be repaid without any interest tomorrow, is worth more to thelender than a similar loan which is repaid in one year, two years’ time or even 10 years’ time.If we assume the lender would like to make a return of 5 % a year on the money, the loan thatis repayable tomorrow is worth almost £1000. On the other hand, a loan that is repayable inone year would be worth in today’s money:
1000
1 + 5/100= £952.38
as investing £952.38 today at an interest rate of 5 % will give you in one year 952.38 × 1.05 =£1000.
Similarly a loan repayable in two years’ time would be worth:
1000
(1 + 5/100)2 = £907.03
27
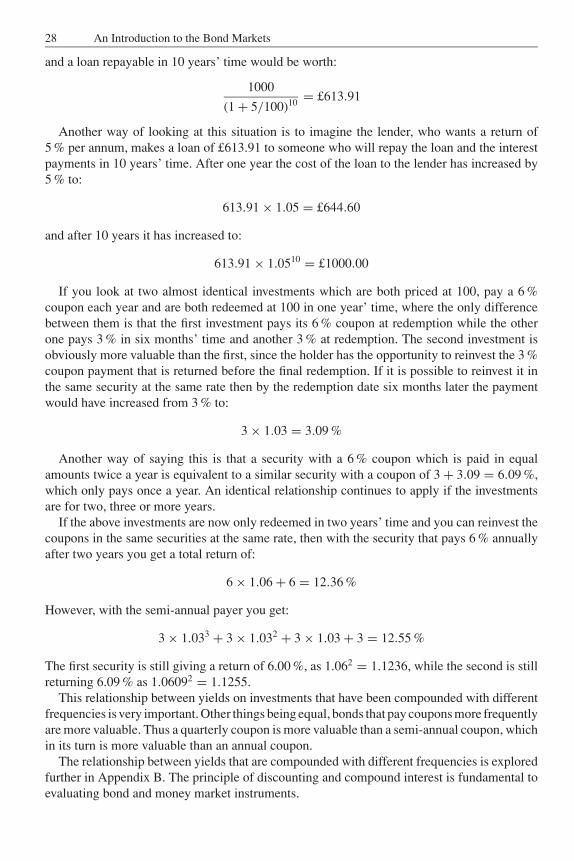
JWBK090-03 JWBK090/Brown March 4, 2006 1:42 Char Count= 0
28 An Introduction to the Bond Markets
and a loan repayable in 10 years’ time would be worth:
1000
(1 + 5/100)10 = £613.91
Another way of looking at this situation is to imagine the lender, who wants a return of5 % per annum, makes a loan of £613.91 to someone who will repay the loan and the interestpayments in 10 years’ time. After one year the cost of the loan to the lender has increased by5 % to:
613.91 × 1.05 = £644.60
and after 10 years it has increased to:
613.91 × 1.0510 = £1000.00
If you look at two almost identical investments which are both priced at 100, pay a 6 %coupon each year and are both redeemed at 100 in one year’ time, where the only differencebetween them is that the first investment pays its 6 % coupon at redemption while the otherone pays 3 % in six months’ time and another 3 % at redemption. The second investment isobviously more valuable than the first, since the holder has the opportunity to reinvest the 3 %coupon payment that is returned before the final redemption. If it is possible to reinvest it inthe same security at the same rate then by the redemption date six months later the paymentwould have increased from 3 % to:
3 × 1.03 = 3.09 %
Another way of saying this is that a security with a 6 % coupon which is paid in equalamounts twice a year is equivalent to a similar security with a coupon of 3 + 3.09 = 6.09 %,which only pays once a year. An identical relationship continues to apply if the investmentsare for two, three or more years.
If the above investments are now only redeemed in two years’ time and you can reinvest thecoupons in the same securities at the same rate, then with the security that pays 6 % annuallyafter two years you get a total return of:
6 × 1.06 + 6 = 12.36 %
However, with the semi-annual payer you get:
3 × 1.033 + 3 × 1.032 + 3 × 1.03 + 3 = 12.55 %
The first security is still giving a return of 6.00 %, as 1.062 = 1.1236, while the second is stillreturning 6.09 % as 1.06092 = 1.1255.
This relationship between yields on investments that have been compounded with differentfrequencies is very important. Other things being equal, bonds that pay coupons more frequentlyare more valuable. Thus a quarterly coupon is more valuable than a semi-annual coupon, whichin its turn is more valuable than an annual coupon.
The relationship between yields that are compounded with different frequencies is exploredfurther in Appendix B. The principle of discounting and compound interest is fundamental toevaluating bond and money market instruments.
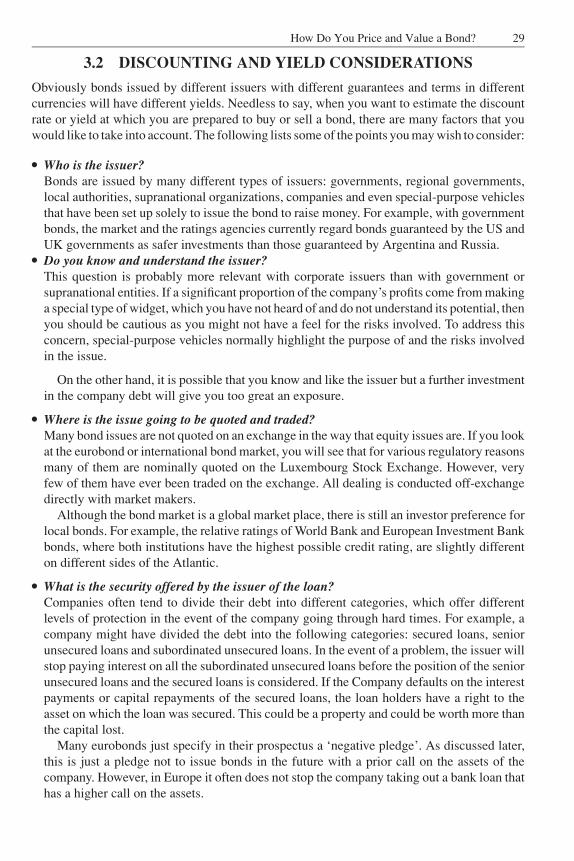
JWBK090-03 JWBK090/Brown March 4, 2006 1:42 Char Count= 0
How Do You Price and Value a Bond? 29
3.2 DISCOUNTING AND YIELD CONSIDERATIONS
Obviously bonds issued by different issuers with different guarantees and terms in differentcurrencies will have different yields. Needless to say, when you want to estimate the discountrate or yield at which you are prepared to buy or sell a bond, there are many factors that youwould like to take into account. The following lists some of the points you may wish to consider:� Who is the issuer?
Bonds are issued by many different types of issuers: governments, regional governments,local authorities, supranational organizations, companies and even special-purpose vehiclesthat have been set up solely to issue the bond to raise money. For example, with governmentbonds, the market and the ratings agencies currently regard bonds guaranteed by the US andUK governments as safer investments than those guaranteed by Argentina and Russia.� Do you know and understand the issuer?
This question is probably more relevant with corporate issuers than with government orsupranational entities. If a significant proportion of the company’s profits come from makinga special type of widget, which you have not heard of and do not understand its potential, thenyou should be cautious as you might not have a feel for the risks involved. To address thisconcern, special-purpose vehicles normally highlight the purpose of and the risks involvedin the issue.
On the other hand, it is possible that you know and like the issuer but a further investmentin the company debt will give you too great an exposure.� Where is the issue going to be quoted and traded?
Many bond issues are not quoted on an exchange in the way that equity issues are. If you lookat the eurobond or international bond market, you will see that for various regulatory reasonsmany of them are nominally quoted on the Luxembourg Stock Exchange. However, veryfew of them have ever been traded on the exchange. All dealing is conducted off-exchangedirectly with market makers.
Although the bond market is a global market place, there is still an investor preference forlocal bonds. For example, the relative ratings of World Bank and European Investment Bankbonds, where both institutions have the highest possible credit rating, are slightly differenton different sides of the Atlantic.� What is the security offered by the issuer of the loan?
Companies often tend to divide their debt into different categories, which offer differentlevels of protection in the event of the company going through hard times. For example, acompany might have divided the debt into the following categories: secured loans, seniorunsecured loans and subordinated unsecured loans. In the event of a problem, the issuer willstop paying interest on all the subordinated unsecured loans before the position of the seniorunsecured loans and the secured loans is considered. If the Company defaults on the interestpayments or capital repayments of the secured loans, the loan holders have a right to theasset on which the loan was secured. This could be a property and could be worth more thanthe capital lost.
Many eurobonds just specify in their prospectus a ‘negative pledge’. As discussed later,this is just a pledge not to issue bonds in the future with a prior call on the assets of thecompany. However, in Europe it often does not stop the company taking out a bank loan thathas a higher call on the assets.
JWBK090-03 JWBK090/Brown March 4, 2006 1:42 Char Count= 0
30 An Introduction to the Bond Markets� What is the coupon going to be on the bond?
The bond could have a fixed-rate coupon, a floating-rate one, an index-linked coupon or nocoupon at all. Depending on the investor’s requirements, some of these options may not beappropriate. For example, a zero-coupon bond is not appropriate for an investor who wantsa regular income, but it might be ideal for a pension fund or insurance company managerthat has a future liability that coincides with the redemption of the bond.� What is the coupon payment frequency of the bond?
A bond that pays quarterly is worth more than one that pays semi-annually, which inturn is worth more than one that only pays interest once a year, as you get the couponsearlier.� What is the investor’s expected direction of interest rates and over what time horizon?
If you expect interest rates to fall then purchasing a fixed-rate issue could be preferable to afloating-rate note, for with the latter your income will fall. Other things being equal, if yourprediction is correct, the capital value of the fixed-rate issue should rise, which will not bethe case with the floating-rate note.� What is the period of the loan?
Although most loans specify a final maturity date, the terms of the loan sometimes allow theissuer or the investor to demand an earlier redemption.� What is the duration of the loan?
This is different to the period of the loan. For example, compare a zero-coupon 10 year bondwhere you do not get any money back for 10 years with a 10 year bond that has an 8 %coupon. In the latter case the investor gets 8 % each year until the final year when he gets108 %. The duration of the loan measures the weighted average time the investor will haveto wait to get the money back. This is obviously less for the 8 % bond than the zero-couponone.� What options has the issuer given himself or herself?
The most normal option that an issuer might have is the ability to ‘call’ the bond, i.e. toredeem the bond early, if circumstances make this desirable. This could mean that a strategyinvolving a 20 year investment could be in tatters if the bond is called next week.� What options has the issuer given the investor?
These are almost always positive in the investor’s point of view. They could include a ‘put’option, i.e. a right to ask for early repayment, or the option to convert the bond at predefinedrates into another investment, such as the equity shares of the issuing company.� How great is the possibility that the issuer will not be able to repay the coupon payments
and the capital in a timely way?
In order to answer this question at least partially, many issues have now been given a creditrating by one or more credit rating agencies. The credit rating agencies analyse the accountsof the issuer and the covenants attached to the bond, and give the bond a rating – the higherthe rating, the smaller is the perceived chance of default. The highest rating that a bond canbe given is AAA or Aaa (according to the rating agency). The lowest rating is D, which isawarded when the bond is already in default.� What is the risk-free rate of return in the currency of the loan?
The risk-free rate of return is conventionally defined to be the yield on domestic governmentsecurities in the currency of the loan of an equivalent life to the bond being considered. Forexample, the risk-free interest rate on US dollar issues is that on US Treasury notes andbonds, and that for sterling issues is the yield on UK gilt-edged securities. The logic behindthis definition is that, at least theoretically, the issuer, the government, can if necessary just
JWBK090-03 JWBK090/Brown March 4, 2006 1:42 Char Count= 0
How Do You Price and Value a Bond? 31
print more money to service the payment of interest and the repayment of capital. Needlessto say, the payments would then be in a deflated currency.
In the Eurozone the risk-free rate of interest is considered to be the cost of money to theFrench and German governments.� What is the currency of the issue?
Currencies that have had inflation over the recent past will need to offer investors a higherrate of return than those with low inflation.
Example 3.1
In the first half of 2005, the Japanese Government, where there has been very little inflationin the last decade, could have issued bonds with a life of less than three years with a yieldto maturity of less than 0.15 % and only a yield of about 1 % for a bond with a 10 yearmaturity. In Switzerland, government issues of up to 10 years yield less than 2 %, whereasin the UK, gilt-edged issues, irrespective of their life to maturity, yield over 4 %.
It is unusual for bonds denominated in a currency to yield less than the equivalent domesticgovernment bonds.� What is the market’s expectation of the purchasing power of the currency when the
payments are made?
This is a question that is very relevant to an international investor. For example, a US dollardomiciled investor would only make an investment in currency A, which is expected todepreciate against the US dollar by 10 % per annum if a return of considerably more than10 % is expected in terms of currency A.� What is the liquidity of the security? If I want to sell, will I be able to get its proper value?
The stock markets and in particular the bond markets are notorious for not being able to sellyour investments at a reasonable price if something unexpected occurs. Unlike the equitymarkets where there is always trading in the equity shares of the larger companies, the tradingin a specific bond, other than major government bonds, tends to decrease as it gets older. Whyis this? The majority of corporate debt is eventually purchased and put into the portfolios ofpension funds and insurance companies. Such portfolios are essentially long-term holdersof debt, and the bonds are used to provide for future liabilities. When a bond is first issuedmany other investors may purchase it on a short-term basis, giving it liquidity.
There are various other factors that effect the liquidity of a bond:
1. The size of the issue. Larger bonds tend to be more liquid.2. Special terms. Special terms are sometimes designed to attract a specific group of in-
vestors, but they can have the effect of reducing the liquidity. They also make it harderto value the asset.
3. Number of market makers. Over several years it has been found that the most liquidbonds, other than government ones, in the eurobond market are those with the mostmarket makers. This could be just a ‘chicken and egg’ situation.
4. Bonds where the market makers quote a large price spread between the buying and sellingprices are almost by definition illiquid.
JWBK090-03 JWBK090/Brown March 4, 2006 1:42 Char Count= 0
32 An Introduction to the Bond Markets
3.3 ACCRUED INTEREST
Unlike equity shares, bonds usually have well-defined future cash flows which are paid onspecified dates, with the result that the market place makes allowance for how soon the nextinterest payment is going to be.
Consider a bond which pays interest of 8 % of its nominal value on 1 May each year. Otherthings being equal, one would expect the price you would have to pay for the bond to increaseup to 30 April each year, as the time before the next interest payment of 8 % progressivelydecreases. Thus halfway through the year on 1 November, one would expect that the value ofthe bond has increased by half the annual coupon. This increase in its value allowing for thenext coupon payment is called ‘accrued interest’. In most cases the accrued interest associatedwith a bond is not included in the quoted price of the instrument, and has to be added to theprice before ascertaining the purchase/sale cost.
The quoted price of a bond is called a ‘clean price’, if it does not include the accrued interest.If it includes the accrued interest, it is called a ‘dirty’ or ‘gross’ price.
Bonds accrue interest in a variety of ways. However, generally the accrued interest (AI )calculation is:
AI = g × number of days
days in year
where:
g annual coupon rate (%)Number of days number of days of accrued interest from the last coupon date or issue
date to the settlement date based on the type of calendar used for thebond
Days in year assumed number of days in the year, or the number of days in the period(i.e. between coupon dates) multiplied by the number of periods in theyear
In a few markets, if you purchase a bond for settlement just before a coupon payment date, thepurchaser is not entitled to the imminent coupon. It still goes to the seller. When this occursthe bond is said to be traded ‘ex-coupon’ or ‘XD’. When a bond is traded XD, the number ofdays of accrued interest may be negative.
There are three main ways of calculating the number of days of accrued interest:
1. Actual calendar days.2. Assuming that each month has 30 days (30E). This method used to be used for most
eurobonds, and is still frequently used for eurodollar bonds.3. Assuming that each month has 30 days, adjusting at the end of each month so that there
are always 30 days between the end of one month and the end of the next (30U). This isused for corporate bonds in the US.
The last two methods arose in the days prior to the extensive use of computers in order tosimplify the calculations. The detailed formulae for all the calculations are given in Appendix B.
Even with the actual calendar day calculation, there are variations. For example, withJapanese Government bonds, interest accrues every day except on 29 February in a leap year.
Similarly, in the denominator of the accrued interest equation, the number of days in yearcalculation varies from bond to bond, and even sometimes from coupon-payment period to
JWBK090-03 JWBK090/Brown March 4, 2006 1:42 Char Count= 0
How Do You Price and Value a Bond? 33
coupon-payment period for the same bond. The number of days in a year could be 360, 362,364, 365, 366 or 368 days.
These variations occur in a variety of ways. In practice there are five main ways of calculatingaccrued interest:
Actual/actual Actual calendar days divided by actual number ofdays in period times number of periods in year
Actual/360 Actual calendar days divided by 360Actual/365 Actual calendar days divided by 36530E/360 30 day month (European method) divided by 36030U/360 30 day month (US method) divided by 360
This list of calculation methods is not exhaustive. For example, in the swap market someinstruments accrue interest at a daily rate of 1/365 of the annual coupon in a non-leap yearand at a daily rate of 1/366 of the annual coupon in a leap year. Hence when a coupon periodbridges both a leap and a non-leap year, the daily accrual amount is adjusted on 1 January.
In markets that accrue interest on an actual/actual basis and pay interest twice a year, suchas the UK Government gilt-edged and the US Treasury markets, the number of days betweenone normal coupon date and the next can vary from 181 to 184 days.
The convention for fixed-rate bonds is to make all the coupon payments for full couponperiods in the year identical. Thus an 8 % bond paying coupons twice a year will make twopayments of 4 %, and if it pays quarterly, it will make four payments of 2 %. Thus in order toequalize the payments over periods with different number of days, the daily accrual rate hasto be suitably adjusted. In such cases another complication can arise if it is decided not to paythe first coupon until, say, nine months after the issue date. In this case the issue date will bein one ‘normal’ six month period with a certain number of days and the coupon payment inanother with a different number of days.
Example 3.2 UK 4 14
% Treasury Stock 2032
In May 2000, Her Majesty’s Treasury issued £11 580 million of the stock at 96.21. Thebond will be redeemed at 100 on 7 June 2032 and pays semi-annual interest on 7 June and7 December. The bond accrued interest from 25 May 2000 with the first interest paymentbeing on 7 December 2000. As there are 182 days from 7 December 1999 to 7 June 2000 and183 days from 7 June 2000 to 7 December 2000, the first interest payment thus consistedof 13 days accruing at a rate of 4.25/(182 × 2) per day and 183 days accruing at a rate of4.25/(183 × 2) per day.
Example 3.3 Bundesrepublik Deutschland 3 34
% Schatzanweisungen 2003
€10 billion of the bond was issued in September 2001 at 100.18 for redemption at 100 on12 September 2003. Interest was paid annually on 12 September and started accruing on14 September 2001. Hence the first interest payment on 12 September 2002 consisted ofonly 363 days accrued interest instead of 365 days that you would get in a full year.
The convention of splitting up the year into a number of nominally identical periods for thecalculation of fixed-rate coupon payments does not extend to the floating-rate market. Here, the
JWBK090-03 JWBK090/Brown March 4, 2006 1:42 Char Count= 0
34 An Introduction to the Bond Markets
convention is normally to accrue interest on an actual/360 basis, except in the case of sterling,where it is an actual/365 basis. As a result, over a year a non-sterling floating-rate note accruesmore interest than its nominal annual coupon.
Example 3.4
Consider a US dollar floating-rate note that pays a coupon on 30 June and 31 December2006. For both periods the nominal interest rate is 6.00 %. Assuming it accrues interest onan actual/360 basis, then as there are 181 days from 31 December 2005 to 30 June 2006and 184 days from 30 June to 31 December 2006:
The interest amount on 30 June 2006 will be: 6 × 181/360 = 3.0167 %The interest amount on 31 December 2006 will be: 6 × 184/360 = 3.0667 %The annual amount will be: 6 × 365/360 = 6.0833 %
Although the differences in the accrued interest calculations are not large, and for fixed-ratebonds average out over the year, they can be significant in the short term.
Example 3.5
Consider two otherwise identical 8.00 % bonds that accrue interest on 30E/360 and ac-tual/365 bases. The accrued interest for each of them in a non-leap year from 28 Februaryto 1 March is:
(30E/360) 3 days = 8 × 3/360 = 0.0667 %
(Actual/365) 1 day = 8 × 1/365 = 0.0219 %
However, over the year they both accrue 8.0000 % interest.
In the above extreme example, the difference in the dirty prices amounts to over four basispoints,1 which in the case of some liquid government securities is comparable to the differencebetween the market maker buying and selling prices.
3.4 HOW BONDS ARE QUOTED
Bonds and money market instruments are quoted in the market place in a variety of ways.This usually results in more complicated calculations than in the equity market in workingout how much, excluding expenses, you have to pay for a bond purchase. With equities, ifyou purchase 200 shares at a price of 15 then the total cost, excluding expenses, is normally200 × 15 = 3000. The calculations may be this simple for a bond transaction but usually theyare more complicated.
Bond prices are normally quoted as a percentage of their ‘nominal value’, the nominalamount of the loan, which except in the case of index-linked bonds is normally the amount
1 A basis point is 0.01 %.
JWBK090-03 JWBK090/Brown March 4, 2006 1:42 Char Count= 0
How Do You Price and Value a Bond? 35
you get back when the bond is redeemed. Bonds are tradeable in units, referred to as their‘denomination’. Some bonds are tradeable in very small units whereas others are not. Thosebonds that are designed to be purchased by retail investors as well as institutional investorstend to have small denominations (e.g. UK gilt-edged securities have a denomination of £0.01,German Government securities €0.01 and French Government securities €1), whereas withthose that are targeted solely at institutional investors, a denomination of $100 000 is notuncommon. The size of the bond’s denomination only restricts the quantity you are able tobuy. For example, it is not possible to purchase $50 000 worth of a bond that has a minimumdenomination of $100 000.
The following lists some of the ways bonds are quoted:� As a clean price, which is quoted as a percentage of the nominal value being purchased. Themajority of bonds are quoted in this way.
The cost of buying bonds quoted with a clean price is:
Cost = (clean price + accrued interest) × nominal/100� As a dirty price, which is again quoted as a percentage of the nominal value. The dirty orgross price is the price that includes any accrued interest. The cost is now given by:
Cost = dirty price × nominal/100
Although this used to be a fairly common method of quoting bond prices, it is now mostcommonly used when the bond is in default and the accrued interest calculation is problem-atic.� As an actual price. In a few cases, e.g. with French convertible issues, the bonds have astrange nominal value and often entitle the owner to purchase a single equity share. Theprice now reflects the cost of purchasing the share through the convertible:
Cost = actual price × number of bonds� As a discount to the nominal value. This method is usually restricted to money marketinstruments, where the only payment is return of the principal at redemption. The cost nowis given by:
Cost =(
1 − discount × fraction
100
)× nominal
where:
Discount is the quoted percentage rate.Fraction is the fraction of a year until redemption. In most markets this is calculated as
actual calendar days divided by 360 (or 365 in the case of sterling).� As a yield. When this occurs, as in the Australian Government market, the market regulatorhas to define exactly how a price is derived from the yield.2� As an inflation adjusted price. Some index-linked bonds, such as the new UK Governmentthree month indexation lagged bonds, quote a real clean price and a real accrued interest per
2 In the UK gilt-edged market, where bonds are normally quoted on a price basis, the United Kingdom Debt Management Officehas produced a booklet ‘Formulae for Calculating Gilt Prices from Yields’, (2005), which specifies how to calculate the price if it isquoted on a yield basis.
JWBK090-03 JWBK090/Brown March 4, 2006 1:42 Char Count= 0
36 An Introduction to the Bond Markets
£100 of nominal. The cost of such a purchase is given by:
Cost = (real clean price + real accrued interest) × index ratio × nominal/100
where the index ratio measures the indexation factor from issue up to the settlement date ofthe transaction.
Example 3.6
The price you would pay for £100 000 nominal of a UK index-linked gilt, first issued afterApril 2005, with a real coupon of 2 % paid semi-annually is calculated as follows. The giltsecurity was issued with a reference RPI value of 200. The current reference RPI is 250.The price of the stock in the market is 90, and at the settlement date there will be 91 daysof accrued interest in a period of 182 days:
Cost =(
90 + 1 × 91
182
)× 250
200× 100 000
100= 90.5 × 1250 = £113 125
3.5 BOND PRICING
Market makers will normally, but not always, quote a two-way price, e.g.
98.00 − 98.25
This means that they are prepared to buy the security from an investor at the lower ‘bid’ priceof 98.00 and sell it to an investor at the higher ‘offer’ or ‘ask’ price of 98.25. The differencebetween the bid and the offer prices is called the ‘price spread’. In some liquid markets,especially those trading government securities, market makers are obliged to quote two-wayprices. However, with some less liquid securities a market maker may only quote a one-waybid price, e.g.
98.00 bid only
This implies that the market maker is only prepared to buy the security at the specified price,as usually he or she has none of the security to sell and does not anticipate borrowing any at areasonable cost.
Since a bond yield rises when the price falls and vice versa, if an instrument is quoted on ayield or discount basis, the bid quotation is higher than the offered one. For example:
3.50 − 3.45
This means that the market maker is prepared to buy the security on a yield of 3.50 % and sellit on a yield of 3.45 %.
Consider the following fixed-rate bond which cannot be traded ex-coupon:
Issued on 15 January 2006 at 100. Pays interest of 6.00 % each yearon the 15 January and is redeemed on 15 January 2011 at 100.
If during its five year life the expected return on this bond remains at 6.00 %, then you wouldexpect the price you would have to pay for this bond to gradually rise throughout the year andthen drop back to 100 on 15 January (see Figure 3.1). The reason for this is that the holder will
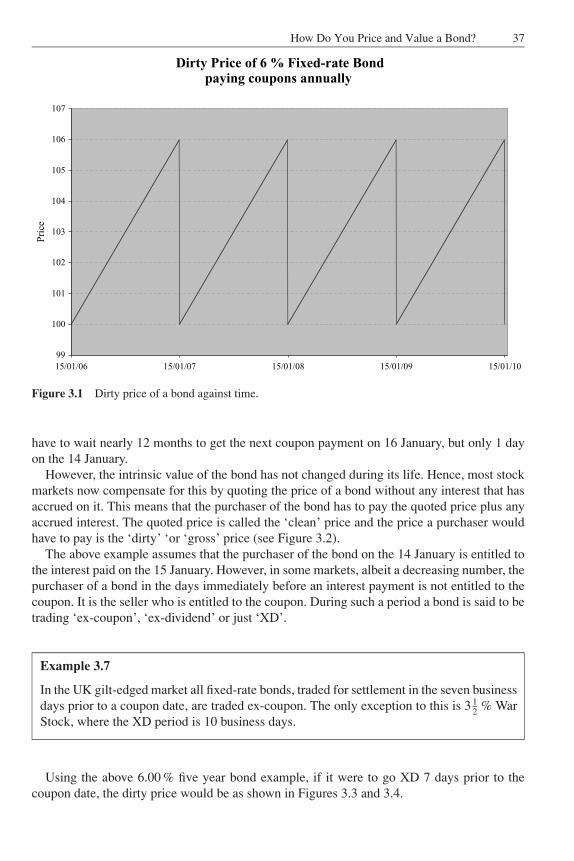
JWBK090-03 JWBK090/Brown March 4, 2006 1:42 Char Count= 0
How Do You Price and Value a Bond? 37
Dirty Price of 6 % Fixed-rate Bondpaying coupons annually
99
100
101
102
103
104
105
106
107
15/01/06 15/01/07 15/01/08 15/01/09 15/01/10
Pri
ce
Figure 3.1 Dirty price of a bond against time.
have to wait nearly 12 months to get the next coupon payment on 16 January, but only 1 dayon the 14 January.
However, the intrinsic value of the bond has not changed during its life. Hence, most stockmarkets now compensate for this by quoting the price of a bond without any interest that hasaccrued on it. This means that the purchaser of the bond has to pay the quoted price plus anyaccrued interest. The quoted price is called the ‘clean’ price and the price a purchaser wouldhave to pay is the ‘dirty’ ‘or ‘gross’ price (see Figure 3.2).
The above example assumes that the purchaser of the bond on the 14 January is entitled tothe interest paid on the 15 January. However, in some markets, albeit a decreasing number, thepurchaser of a bond in the days immediately before an interest payment is not entitled to thecoupon. It is the seller who is entitled to the coupon. During such a period a bond is said to betrading ‘ex-coupon’, ‘ex-dividend’ or just ‘XD’.
Example 3.7
In the UK gilt-edged market all fixed-rate bonds, traded for settlement in the seven businessdays prior to a coupon date, are traded ex-coupon. The only exception to this is 3 1
2 % WarStock, where the XD period is 10 business days.
Using the above 6.00 % five year bond example, if it were to go XD 7 days prior to thecoupon date, the dirty price would be as shown in Figures 3.3 and 3.4.
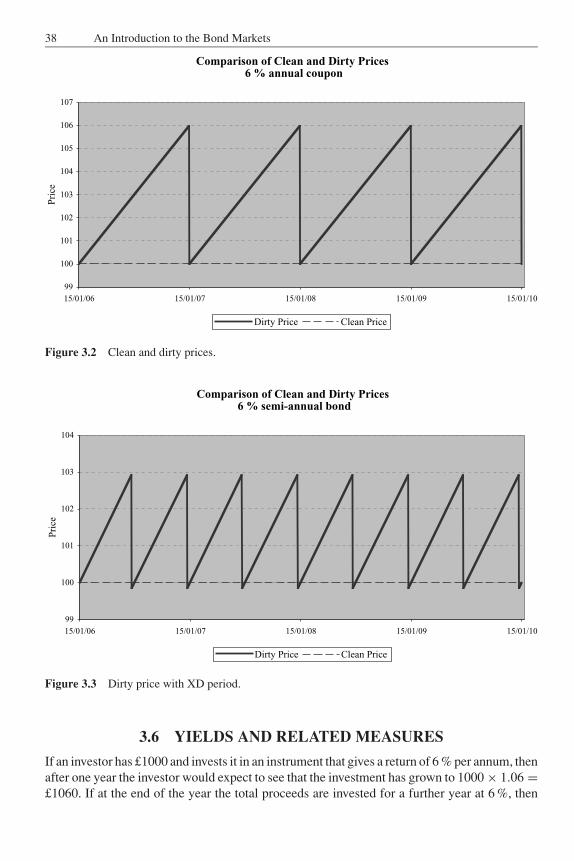
JWBK090-03 JWBK090/Brown March 4, 2006 1:42 Char Count= 0
38 An Introduction to the Bond Markets
Comparison of Clean and Dirty Prices6 % annual coupon
99
100
101
102
103
104
105
106
107
15/01/06 15/01/07 15/01/08 15/01/09 15/01/10
Pri
ce
Dirty Price Clean Price
Figure 3.2 Clean and dirty prices.
Comparison of Clean and Dirty Prices6 % semi-annual bond
99
100
101
102
103
104
15/01/06 15/01/07 15/01/08 15/01/09 15/01/10
Pri
ce
Dirty Price Clean Price
Figure 3.3 Dirty price with XD period.
3.6 YIELDS AND RELATED MEASURES
If an investor has £1000 and invests it in an instrument that gives a return of 6 % per annum, thenafter one year the investor would expect to see that the investment has grown to 1000 × 1.06 =£1060. If at the end of the year the total proceeds are invested for a further year at 6 %, then
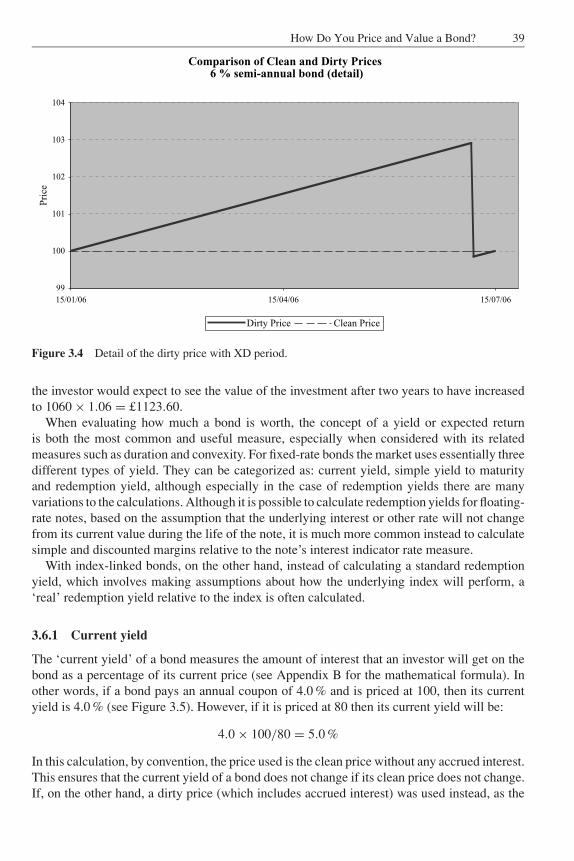
JWBK090-03 JWBK090/Brown March 4, 2006 1:42 Char Count= 0
How Do You Price and Value a Bond? 39
Comparison of Clean and Dirty Prices6 % semi-annual bond (detail)
99
100
101
102
103
104
15/01/06 15/04/06 15/07/06
Pri
ce
Dirty Price Clean Price
Figure 3.4 Detail of the dirty price with XD period.
the investor would expect to see the value of the investment after two years to have increasedto 1060 × 1.06 = £1123.60.
When evaluating how much a bond is worth, the concept of a yield or expected returnis both the most common and useful measure, especially when considered with its relatedmeasures such as duration and convexity. For fixed-rate bonds the market uses essentially threedifferent types of yield. They can be categorized as: current yield, simple yield to maturityand redemption yield, although especially in the case of redemption yields there are manyvariations to the calculations. Although it is possible to calculate redemption yields for floating-rate notes, based on the assumption that the underlying interest or other rate will not changefrom its current value during the life of the note, it is much more common instead to calculatesimple and discounted margins relative to the note’s interest indicator rate measure.
With index-linked bonds, on the other hand, instead of calculating a standard redemptionyield, which involves making assumptions about how the underlying index will perform, a‘real’ redemption yield relative to the index is often calculated.
3.6.1 Current yield
The ‘current yield’ of a bond measures the amount of interest that an investor will get on thebond as a percentage of its current price (see Appendix B for the mathematical formula). Inother words, if a bond pays an annual coupon of 4.0 % and is priced at 100, then its currentyield is 4.0 % (see Figure 3.5). However, if it is priced at 80 then its current yield will be:
4.0 × 100/80 = 5.0 %
In this calculation, by convention, the price used is the clean price without any accrued interest.This ensures that the current yield of a bond does not change if its clean price does not change.If, on the other hand, a dirty price (which includes accrued interest) was used instead, as the
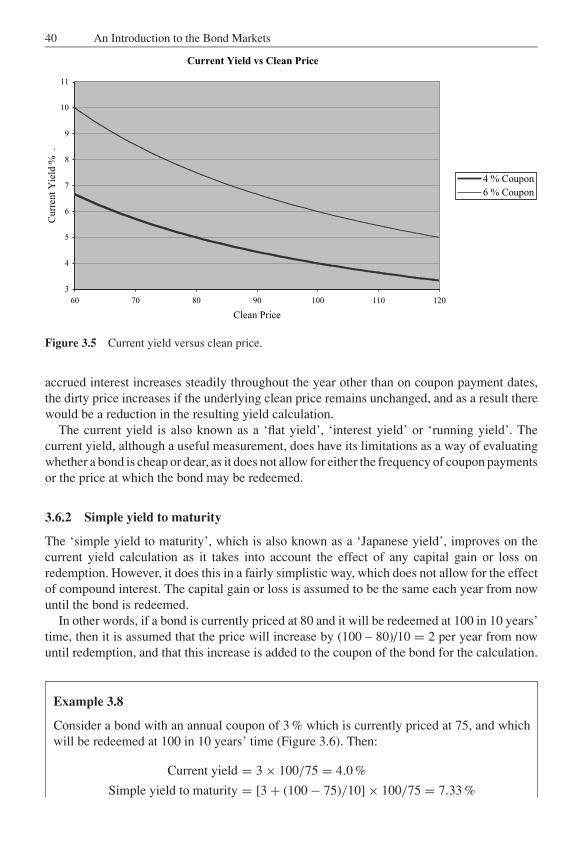
JWBK090-03 JWBK090/Brown March 4, 2006 1:42 Char Count= 0
40 An Introduction to the Bond Markets
3
4
5
6
7
8
9
10
11
Current Yield vs Clean Price
60 70 80 90 100 110 120
Clean Price
Curr
ent
Yie
ld %
.
4 % Coupon
6 % Coupon
Figure 3.5 Current yield versus clean price.
accrued interest increases steadily throughout the year other than on coupon payment dates,the dirty price increases if the underlying clean price remains unchanged, and as a result therewould be a reduction in the resulting yield calculation.
The current yield is also known as a ‘flat yield’, ‘interest yield’ or ‘running yield’. Thecurrent yield, although a useful measurement, does have its limitations as a way of evaluatingwhether a bond is cheap or dear, as it does not allow for either the frequency of coupon paymentsor the price at which the bond may be redeemed.
3.6.2 Simple yield to maturity
The ‘simple yield to maturity’, which is also known as a ‘Japanese yield’, improves on thecurrent yield calculation as it takes into account the effect of any capital gain or loss onredemption. However, it does this in a fairly simplistic way, which does not allow for the effectof compound interest. The capital gain or loss is assumed to be the same each year from nowuntil the bond is redeemed.
In other words, if a bond is currently priced at 80 and it will be redeemed at 100 in 10 years’time, then it is assumed that the price will increase by (100 – 80)/10 = 2 per year from nowuntil redemption, and that this increase is added to the coupon of the bond for the calculation.
Example 3.8
Consider a bond with an annual coupon of 3 % which is currently priced at 75, and whichwill be redeemed at 100 in 10 years’ time (Figure 3.6). Then:
Current yield = 3 × 100/75 = 4.0 %
Simple yield to maturity = [3 + (100 − 75)/10] × 100/75 = 7.33 %
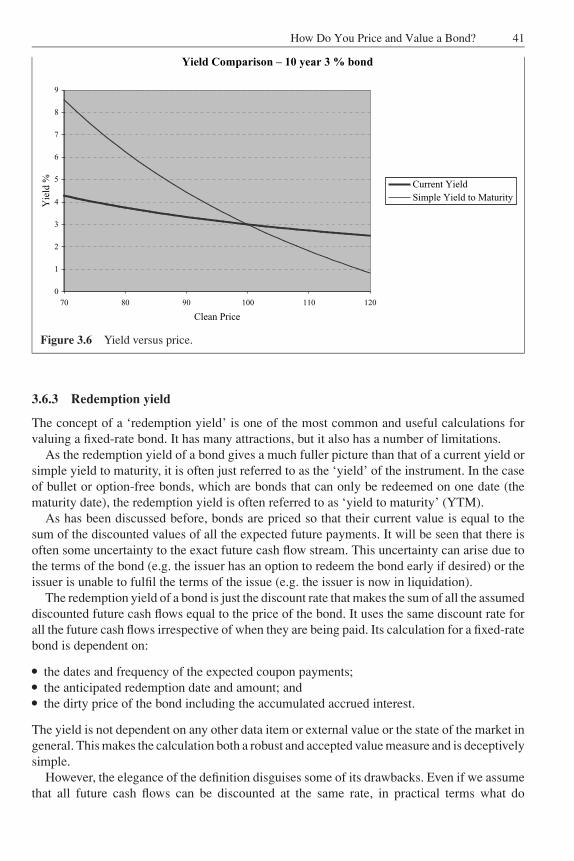
JWBK090-03 JWBK090/Brown March 4, 2006 1:42 Char Count= 0
How Do You Price and Value a Bond? 41
Yield Comparison – 10 year 3 % bond
0
1
2
3
4
5
6
7
8
9
70 80 90 100 110 120
Clean Price
Yie
ld % Current Yield
Simple Yield to Maturity
Figure 3.6 Yield versus price.
3.6.3 Redemption yield
The concept of a ‘redemption yield’ is one of the most common and useful calculations forvaluing a fixed-rate bond. It has many attractions, but it also has a number of limitations.
As the redemption yield of a bond gives a much fuller picture than that of a current yield orsimple yield to maturity, it is often just referred to as the ‘yield’ of the instrument. In the caseof bullet or option-free bonds, which are bonds that can only be redeemed on one date (thematurity date), the redemption yield is often referred to as ‘yield to maturity’ (YTM).
As has been discussed before, bonds are priced so that their current value is equal to thesum of the discounted values of all the expected future payments. It will be seen that there isoften some uncertainty to the exact future cash flow stream. This uncertainty can arise due tothe terms of the bond (e.g. the issuer has an option to redeem the bond early if desired) or theissuer is unable to fulfil the terms of the issue (e.g. the issuer is now in liquidation).
The redemption yield of a bond is just the discount rate that makes the sum of all the assumeddiscounted future cash flows equal to the price of the bond. It uses the same discount rate forall the future cash flows irrespective of when they are being paid. Its calculation for a fixed-ratebond is dependent on:� the dates and frequency of the expected coupon payments;� the anticipated redemption date and amount; and� the dirty price of the bond including the accumulated accrued interest.
The yield is not dependent on any other data item or external value or the state of the market ingeneral. This makes the calculation both a robust and accepted value measure and is deceptivelysimple.
However, the elegance of the definition disguises some of its drawbacks. Even if we assumethat all future cash flows can be discounted at the same rate, in practical terms what do
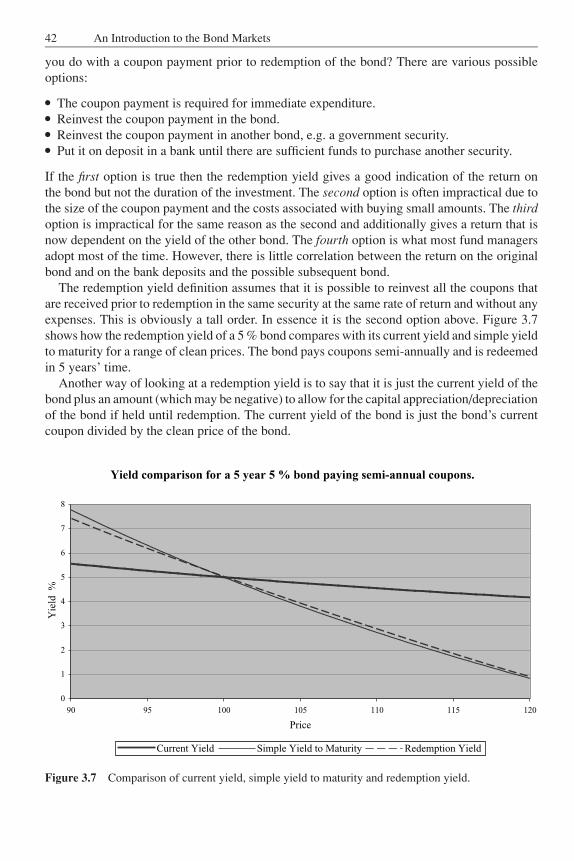
JWBK090-03 JWBK090/Brown March 4, 2006 1:42 Char Count= 0
42 An Introduction to the Bond Markets
you do with a coupon payment prior to redemption of the bond? There are various possibleoptions:� The coupon payment is required for immediate expenditure.� Reinvest the coupon payment in the bond.� Reinvest the coupon payment in another bond, e.g. a government security.� Put it on deposit in a bank until there are sufficient funds to purchase another security.
If the first option is true then the redemption yield gives a good indication of the return onthe bond but not the duration of the investment. The second option is often impractical due tothe size of the coupon payment and the costs associated with buying small amounts. The thirdoption is impractical for the same reason as the second and additionally gives a return that isnow dependent on the yield of the other bond. The fourth option is what most fund managersadopt most of the time. However, there is little correlation between the return on the originalbond and on the bank deposits and the possible subsequent bond.
The redemption yield definition assumes that it is possible to reinvest all the coupons thatare received prior to redemption in the same security at the same rate of return and without anyexpenses. This is obviously a tall order. In essence it is the second option above. Figure 3.7shows how the redemption yield of a 5 % bond compares with its current yield and simple yieldto maturity for a range of clean prices. The bond pays coupons semi-annually and is redeemedin 5 years’ time.
Another way of looking at a redemption yield is to say that it is just the current yield of thebond plus an amount (which may be negative) to allow for the capital appreciation/depreciationof the bond if held until redemption. The current yield of the bond is just the bond’s currentcoupon divided by the clean price of the bond.
Yield comparison for a 5 year 5 % bond paying semi-annual coupons.
0
1
2
3
4
5
6
7
8
90 95 100 105 110 115 120
Price
Yie
ld
%
Current Yield Simple Yield to Maturity Redemption Yield
Figure 3.7 Comparison of current yield, simple yield to maturity and redemption yield.
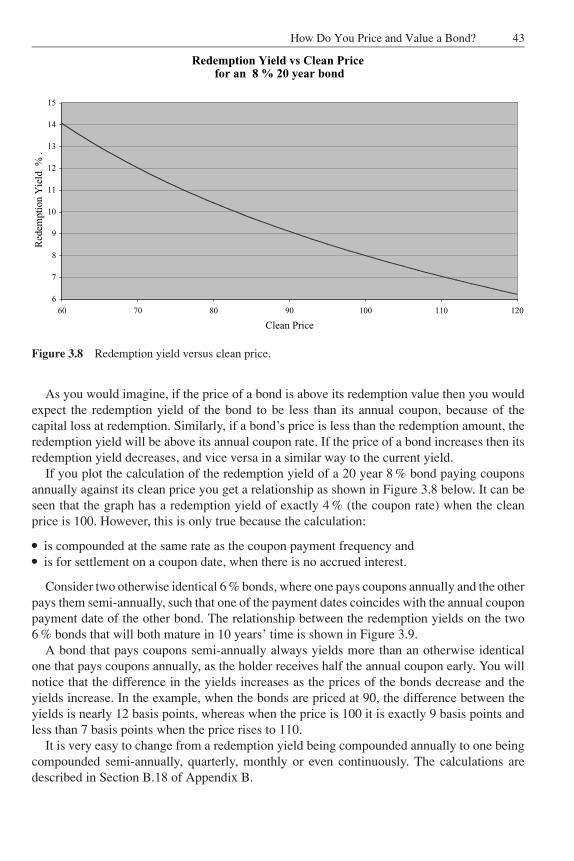
JWBK090-03 JWBK090/Brown March 4, 2006 1:42 Char Count= 0
How Do You Price and Value a Bond? 43
Redemption Yield vs Clean Pricefor an 8 % 20 year bond
6
7
8
9
10
11
12
13
14
15
60 70 80 90 100 110 120
Clean Price
Red
empti
on Y
ield
%
.
Figure 3.8 Redemption yield versus clean price.
As you would imagine, if the price of a bond is above its redemption value then you wouldexpect the redemption yield of the bond to be less than its annual coupon, because of thecapital loss at redemption. Similarly, if a bond’s price is less than the redemption amount, theredemption yield will be above its annual coupon rate. If the price of a bond increases then itsredemption yield decreases, and vice versa in a similar way to the current yield.
If you plot the calculation of the redemption yield of a 20 year 8 % bond paying couponsannually against its clean price you get a relationship as shown in Figure 3.8 below. It can beseen that the graph has a redemption yield of exactly 4 % (the coupon rate) when the cleanprice is 100. However, this is only true because the calculation:� is compounded at the same rate as the coupon payment frequency and� is for settlement on a coupon date, when there is no accrued interest.
Consider two otherwise identical 6 % bonds, where one pays coupons annually and the otherpays them semi-annually, such that one of the payment dates coincides with the annual couponpayment date of the other bond. The relationship between the redemption yields on the two6 % bonds that will both mature in 10 years’ time is shown in Figure 3.9.
A bond that pays coupons semi-annually always yields more than an otherwise identicalone that pays coupons annually, as the holder receives half the annual coupon early. You willnotice that the difference in the yields increases as the prices of the bonds decrease and theyields increase. In the example, when the bonds are priced at 90, the difference between theyields is nearly 12 basis points, whereas when the price is 100 it is exactly 9 basis points andless than 7 basis points when the price rises to 110.
It is very easy to change from a redemption yield being compounded annually to one beingcompounded semi-annually, quarterly, monthly or even continuously. The calculations aredescribed in Section B.18 of Appendix B.
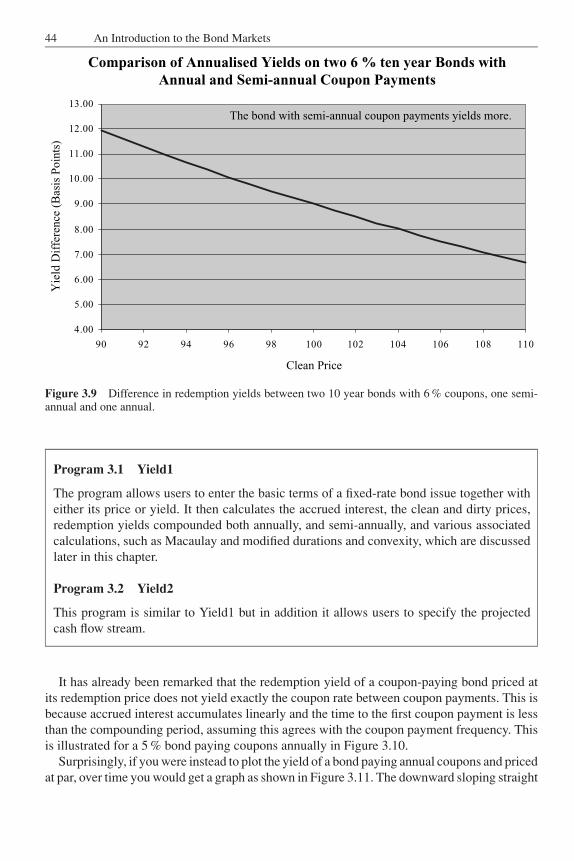
JWBK090-03 JWBK090/Brown March 4, 2006 1:42 Char Count= 0
44 An Introduction to the Bond Markets
Comparison of Annualised Yields on two 6 % ten year Bonds withAnnual and Semi-annual Coupon Payments
4.00
5.00
6.00
7.00
8.00
9.00
10.00
11.00
12.00
13.00
90 92 94 96 98 100 102 104 106 108 110
Clean Price
Yie
ld D
iffe
ren
ce (
Bas
is P
oin
ts)
The bond with semi-annual coupon payments yields more.
Figure 3.9 Difference in redemption yields between two 10 year bonds with 6 % coupons, one semi-annual and one annual.
Program 3.1 Yield1
The program allows users to enter the basic terms of a fixed-rate bond issue together witheither its price or yield. It then calculates the accrued interest, the clean and dirty prices,redemption yields compounded both annually, and semi-annually, and various associatedcalculations, such as Macaulay and modified durations and convexity, which are discussedlater in this chapter.
Program 3.2 Yield2
This program is similar to Yield1 but in addition it allows users to specify the projectedcash flow stream.
It has already been remarked that the redemption yield of a coupon-paying bond priced atits redemption price does not yield exactly the coupon rate between coupon payments. This isbecause accrued interest accumulates linearly and the time to the first coupon payment is lessthan the compounding period, assuming this agrees with the coupon payment frequency. Thisis illustrated for a 5 % bond paying coupons annually in Figure 3.10.
Surprisingly, if you were instead to plot the yield of a bond paying annual coupons and pricedat par, over time you would get a graph as shown in Figure 3.11. The downward sloping straight
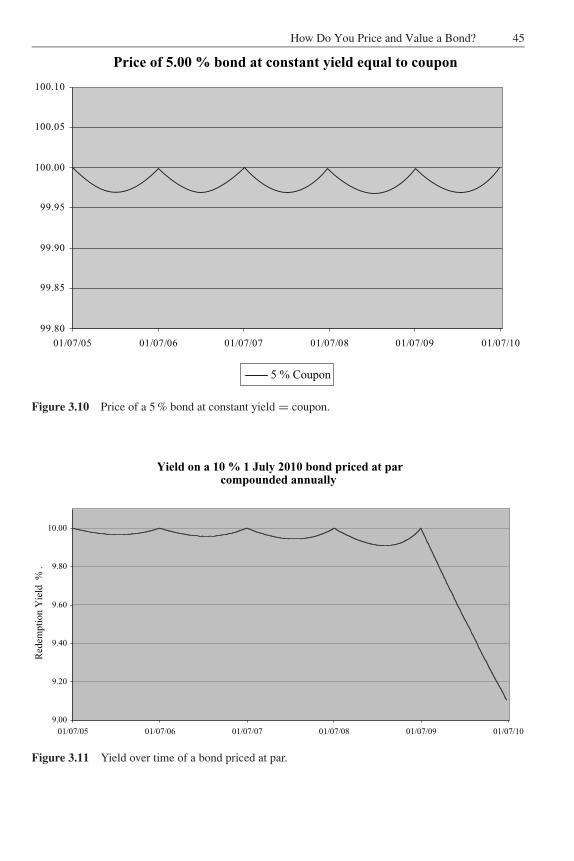
JWBK090-03 JWBK090/Brown March 4, 2006 1:42 Char Count= 0
How Do You Price and Value a Bond? 45
Price of 5.00 % bond at constant yield equal to coupon
99.80
99.85
99.90
99.95
100.00
100.05
100.10
01/07/05 01/07/06 01/07/07 01/07/08 01/07/09 01/07/10
5 % Coupon
Figure 3.10 Price of a 5 % bond at constant yield = coupon.
Yield on a 10 % 1 July 2010 bond priced at parcompounded annually
9.00
9.20
9.40
9.60
9.80
10.00
01/07/05 01/07/06 01/07/07 01/07/08 01/07/09 01/07/10
Red
emp
tio
n Y
ield
%
.
Figure 3.11 Yield over time of a bond priced at par.
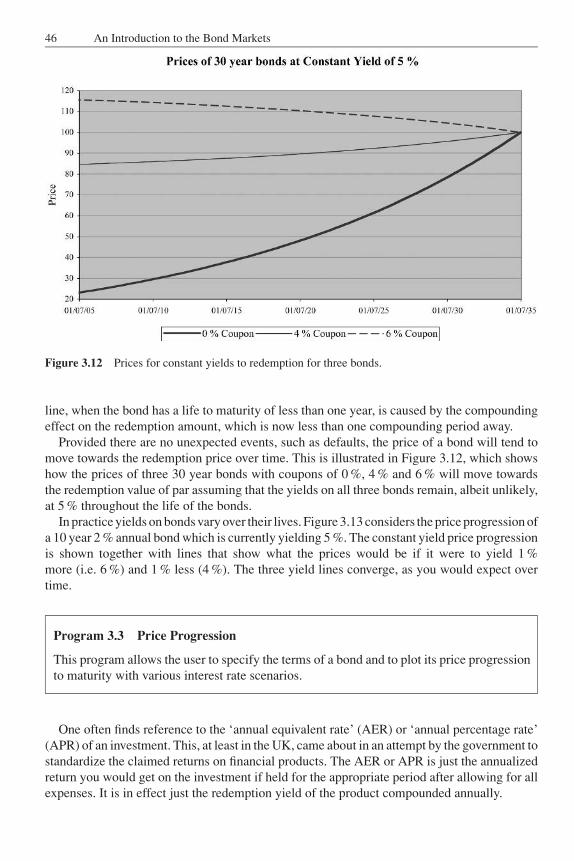
JWBK090-03 JWBK090/Brown March 4, 2006 1:42 Char Count= 0
46 An Introduction to the Bond Markets
Figure 3.12 Prices for constant yields to redemption for three bonds.
line, when the bond has a life to maturity of less than one year, is caused by the compoundingeffect on the redemption amount, which is now less than one compounding period away.
Provided there are no unexpected events, such as defaults, the price of a bond will tend tomove towards the redemption price over time. This is illustrated in Figure 3.12, which showshow the prices of three 30 year bonds with coupons of 0 %, 4 % and 6 % will move towardsthe redemption value of par assuming that the yields on all three bonds remain, albeit unlikely,at 5 % throughout the life of the bonds.
In practice yields on bonds vary over their lives. Figure 3.13 considers the price progression ofa 10 year 2 % annual bond which is currently yielding 5 %. The constant yield price progressionis shown together with lines that show what the prices would be if it were to yield 1 %more (i.e. 6 %) and 1 % less (4 %). The three yield lines converge, as you would expect overtime.
Program 3.3 Price Progression
This program allows the user to specify the terms of a bond and to plot its price progressionto maturity with various interest rate scenarios.
One often finds reference to the ‘annual equivalent rate’ (AER) or ‘annual percentage rate’(APR) of an investment. This, at least in the UK, came about in an attempt by the government tostandardize the claimed returns on financial products. The AER or APR is just the annualizedreturn you would get on the investment if held for the appropriate period after allowing for allexpenses. It is in effect just the redemption yield of the product compounded annually.
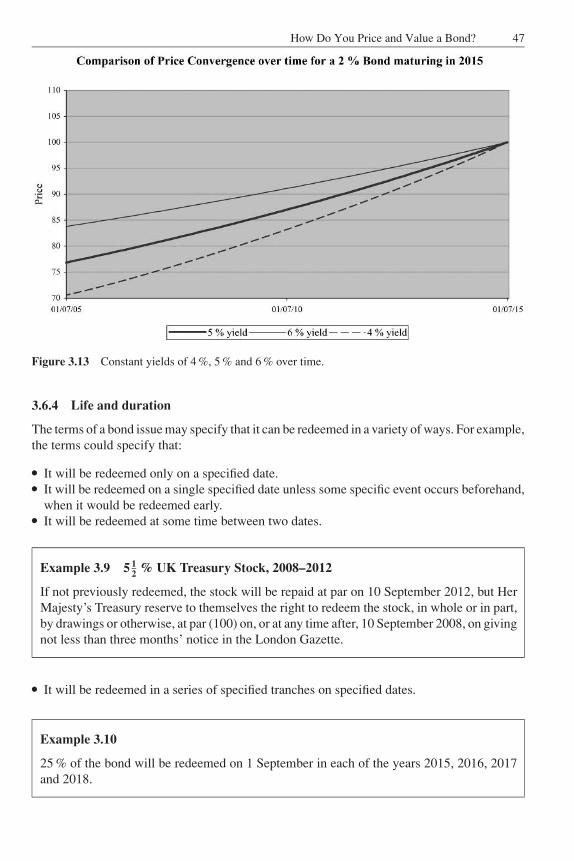
JWBK090-03 JWBK090/Brown March 4, 2006 1:42 Char Count= 0
How Do You Price and Value a Bond? 47
Figure 3.13 Constant yields of 4 %, 5 % and 6 % over time.
3.6.4 Life and duration
The terms of a bond issue may specify that it can be redeemed in a variety of ways. For example,the terms could specify that:� It will be redeemed only on a specified date.� It will be redeemed on a single specified date unless some specific event occurs beforehand,
when it would be redeemed early.� It will be redeemed at some time between two dates.
Example 3.9 5 12
% UK Treasury Stock, 2008–2012
If not previously redeemed, the stock will be repaid at par on 10 September 2012, but HerMajesty’s Treasury reserve to themselves the right to redeem the stock, in whole or in part,by drawings or otherwise, at par (100) on, or at any time after, 10 September 2008, on givingnot less than three months’ notice in the London Gazette.
� It will be redeemed in a series of specified tranches on specified dates.
Example 3.10
25 % of the bond will be redeemed on 1 September in each of the years 2015, 2016, 2017and 2018.
JWBK090-03 JWBK090/Brown March 4, 2006 1:42 Char Count= 0
48 An Introduction to the Bond Markets� It will be redeemed in a number of tranches, depending on the life of the underlying assets.This can happen with mortgage backed securities.� No final redemption date is specified. In this case there are usually specific circumstancesunder which the bond may be redeemed.
As a result the market uses several different measures for the life of a bond. If a bond is going tobe redeemed in exactly 10 years’ time then it is said, self-evidently, to have a ‘life to maturity’of 10 years.
For bonds that specify in their description a range of maturity dates, where the issuer hasthe option to redeem the bond at any time between the two dates, an ‘expected life’ is oftencalculated. For such bonds it is assumed that the issuer will always act in his or her own bestinterest; i.e. the issuer will redeem the bond early if it can be refinanced for a lower cost. As aresult the market calculates an expected life for the bond. For convenience, it is assumed thatif the bond is being traded above par, then the issuer could reissue the debt at a lower cost andsave money. In practice, the decision is not that simple, since this simplistic approach ignoresthe costs associated with issuing a new bond.
The expected life of such a bond is thus the period from the settlement date to the earliestpossible redemption date if its clean price is over par and to the last date if it is below par.
Example 3.11
Use the above example of 5 12 % Treasury Stock 2008–2012 (Example 3.9). During the
summer of 2005, the price of the bond was over 100, with the result that the expected lifeof the bond was 3 1
2 years. However, if the price had dropped below 100, its expected lifewould jump to 7 1
2 years.
If a bond is going to be redeemed in several tranches, then an ‘average life’ to its weightedaverage maturity date is often calculated.
Example 3.12
If 25 % of a bond is redeemed on 1 July 2020 and the remaining 75 % on 1 July 2024, thenthe average life of this bond will be calculated up to the weighted average of these twodates, i.e. to 1 July 2023.
Other bonds instead give the holder of the bond the option to request repayment of the bondearly. In such cases, it is assumed that the holder will act in his or her own best interest.However, redeeming the bond early just because the yield is greater is not always the correctaction.
Example 3.13
Consider a bond that has an annual coupon of 6.00 %, is currently priced at 99 and theholder has the right to redeem it in 30 days’ time at par (100). The bond will normally beredeemed in 5 years at par.
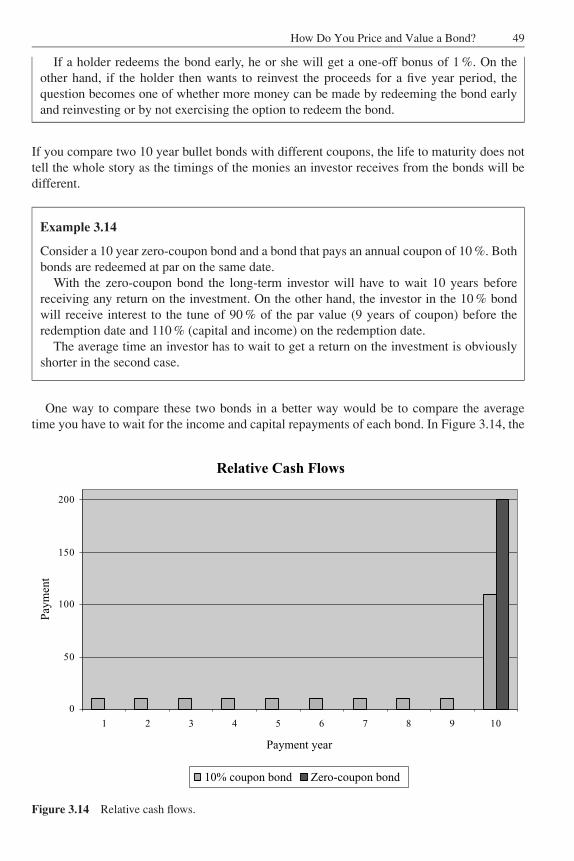
JWBK090-03 JWBK090/Brown March 4, 2006 1:42 Char Count= 0
How Do You Price and Value a Bond? 49
If a holder redeems the bond early, he or she will get a one-off bonus of 1 %. On theother hand, if the holder then wants to reinvest the proceeds for a five year period, thequestion becomes one of whether more money can be made by redeeming the bond earlyand reinvesting or by not exercising the option to redeem the bond.
If you compare two 10 year bullet bonds with different coupons, the life to maturity does nottell the whole story as the timings of the monies an investor receives from the bonds will bedifferent.
Example 3.14
Consider a 10 year zero-coupon bond and a bond that pays an annual coupon of 10 %. Bothbonds are redeemed at par on the same date.
With the zero-coupon bond the long-term investor will have to wait 10 years beforereceiving any return on the investment. On the other hand, the investor in the 10 % bondwill receive interest to the tune of 90 % of the par value (9 years of coupon) before theredemption date and 110 % (capital and income) on the redemption date.
The average time an investor has to wait to get a return on the investment is obviouslyshorter in the second case.
One way to compare these two bonds in a better way would be to compare the averagetime you have to wait for the income and capital repayments of each bond. In Figure 3.14, the
Relative Cash Flows
0
50
100
150
200
1 2 3 4 5 6 7 8 9 10
Payment year
Pay
men
t
10% coupon bond Zero-coupon bond
Figure 3.14 Relative cash flows.
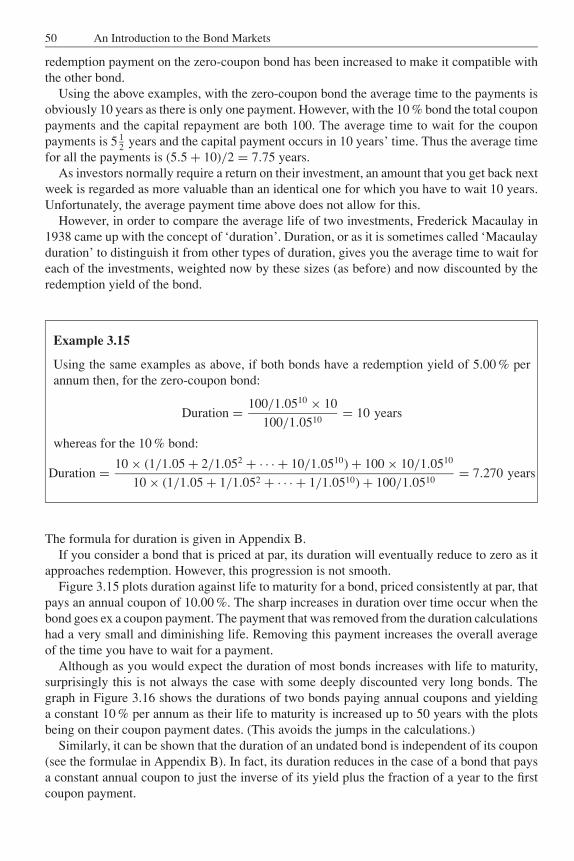
JWBK090-03 JWBK090/Brown March 4, 2006 1:42 Char Count= 0
50 An Introduction to the Bond Markets
redemption payment on the zero-coupon bond has been increased to make it compatible withthe other bond.
Using the above examples, with the zero-coupon bond the average time to the payments isobviously 10 years as there is only one payment. However, with the 10 % bond the total couponpayments and the capital repayment are both 100. The average time to wait for the couponpayments is 5 1
2 years and the capital payment occurs in 10 years’ time. Thus the average timefor all the payments is (5.5 + 10)/2 = 7.75 years.
As investors normally require a return on their investment, an amount that you get back nextweek is regarded as more valuable than an identical one for which you have to wait 10 years.Unfortunately, the average payment time above does not allow for this.
However, in order to compare the average life of two investments, Frederick Macaulay in1938 came up with the concept of ‘duration’. Duration, or as it is sometimes called ‘Macaulayduration’ to distinguish it from other types of duration, gives you the average time to wait foreach of the investments, weighted now by these sizes (as before) and now discounted by theredemption yield of the bond.
Example 3.15
Using the same examples as above, if both bonds have a redemption yield of 5.00 % perannum then, for the zero-coupon bond:
Duration = 100/1.0510 × 10
100/1.0510= 10 years
whereas for the 10 % bond:
Duration = 10 × (1/1.05 + 2/1.052 + · · · + 10/1.0510) + 100 × 10/1.0510
10 × (1/1.05 + 1/1.052 + · · · + 1/1.0510) + 100/1.0510= 7.270 years
The formula for duration is given in Appendix B.If you consider a bond that is priced at par, its duration will eventually reduce to zero as it
approaches redemption. However, this progression is not smooth.Figure 3.15 plots duration against life to maturity for a bond, priced consistently at par, that
pays an annual coupon of 10.00 %. The sharp increases in duration over time occur when thebond goes ex a coupon payment. The payment that was removed from the duration calculationshad a very small and diminishing life. Removing this payment increases the overall averageof the time you have to wait for a payment.
Although as you would expect the duration of most bonds increases with life to maturity,surprisingly this is not always the case with some deeply discounted very long bonds. Thegraph in Figure 3.16 shows the durations of two bonds paying annual coupons and yieldinga constant 10 % per annum as their life to maturity is increased up to 50 years with the plotsbeing on their coupon payment dates. (This avoids the jumps in the calculations.)
Similarly, it can be shown that the duration of an undated bond is independent of its coupon(see the formulae in Appendix B). In fact, its duration reduces in the case of a bond that paysa constant annual coupon to just the inverse of its yield plus the fraction of a year to the firstcoupon payment.
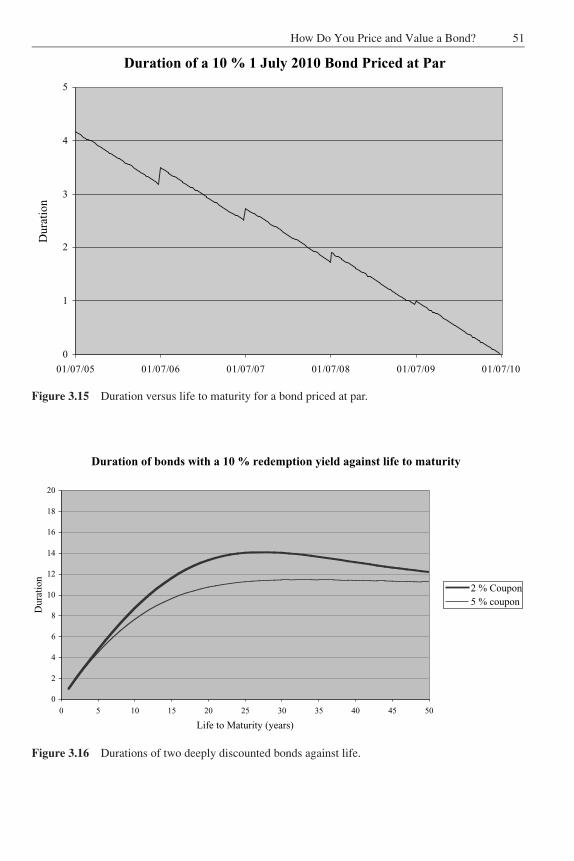
JWBK090-03 JWBK090/Brown March 4, 2006 1:42 Char Count= 0
How Do You Price and Value a Bond? 51
Duration of a 10 % 1 July 2010 Bond Priced at Par
0
1
2
3
4
5
01/07/05 01/07/06 01/07/07 01/07/08 01/07/09 01/07/10
Du
rati
on
Figure 3.15 Duration versus life to maturity for a bond priced at par.
Duration of bonds with a 10 % redemption yield against life to maturity
0
2
4
6
8
10
12
14
16
18
20
0 5 10 15 20 25 30 35 40 45 50
Life to Maturity (years)
Dura
tion
2 % Coupon
5 % coupon
Figure 3.16 Durations of two deeply discounted bonds against life.
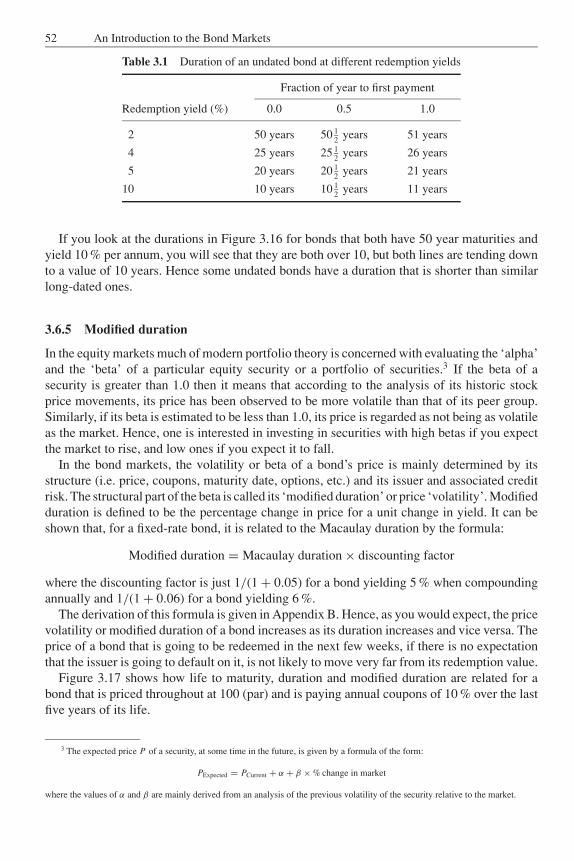
JWBK090-03 JWBK090/Brown March 4, 2006 1:42 Char Count= 0
52 An Introduction to the Bond Markets
Table 3.1 Duration of an undated bond at different redemption yields
Fraction of year to first payment
Redemption yield (%) 0.0 0.5 1.0
2 50 years 50 12 years 51 years
4 25 years 25 12 years 26 years
5 20 years 20 12 years 21 years
10 10 years 10 12 years 11 years
If you look at the durations in Figure 3.16 for bonds that both have 50 year maturities andyield 10 % per annum, you will see that they are both over 10, but both lines are tending downto a value of 10 years. Hence some undated bonds have a duration that is shorter than similarlong-dated ones.
3.6.5 Modified duration
In the equity markets much of modern portfolio theory is concerned with evaluating the ‘alpha’and the ‘beta’ of a particular equity security or a portfolio of securities.3 If the beta of asecurity is greater than 1.0 then it means that according to the analysis of its historic stockprice movements, its price has been observed to be more volatile than that of its peer group.Similarly, if its beta is estimated to be less than 1.0, its price is regarded as not being as volatileas the market. Hence, one is interested in investing in securities with high betas if you expectthe market to rise, and low ones if you expect it to fall.
In the bond markets, the volatility or beta of a bond’s price is mainly determined by itsstructure (i.e. price, coupons, maturity date, options, etc.) and its issuer and associated creditrisk. The structural part of the beta is called its ‘modified duration’ or price ‘volatility’. Modifiedduration is defined to be the percentage change in price for a unit change in yield. It can beshown that, for a fixed-rate bond, it is related to the Macaulay duration by the formula:
Modified duration = Macaulay duration × discounting factor
where the discounting factor is just 1/(1 + 0.05) for a bond yielding 5 % when compoundingannually and 1/(1 + 0.06) for a bond yielding 6 %.
The derivation of this formula is given in Appendix B. Hence, as you would expect, the pricevolatility or modified duration of a bond increases as its duration increases and vice versa. Theprice of a bond that is going to be redeemed in the next few weeks, if there is no expectationthat the issuer is going to default on it, is not likely to move very far from its redemption value.
Figure 3.17 shows how life to maturity, duration and modified duration are related for abond that is priced throughout at 100 (par) and is paying annual coupons of 10 % over the lastfive years of its life.
3 The expected price P of a security, at some time in the future, is given by a formula of the form:
PExpected = PCurrent + α + β × % change in market
where the values of α and β are mainly derived from an analysis of the previous volatility of the security relative to the market.
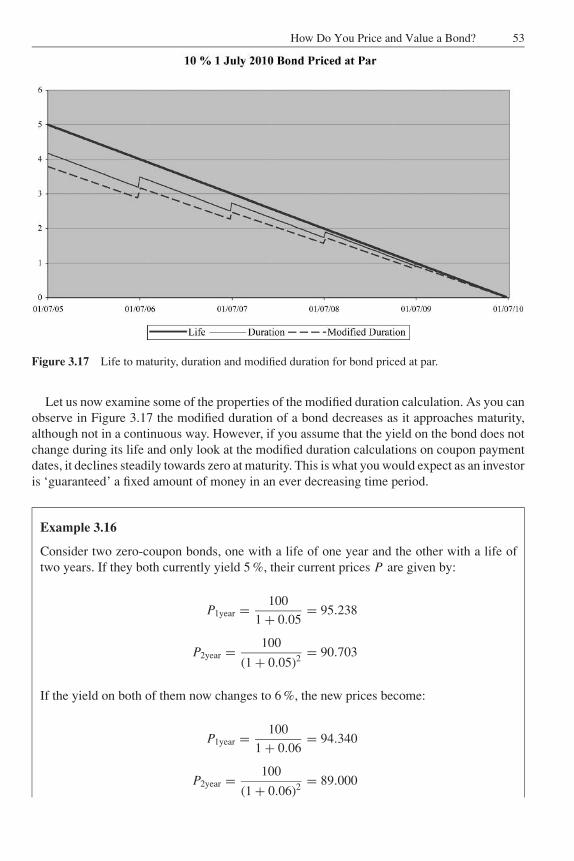
JWBK090-03 JWBK090/Brown March 4, 2006 1:42 Char Count= 0
How Do You Price and Value a Bond? 53
Figure 3.17 Life to maturity, duration and modified duration for bond priced at par.
Let us now examine some of the properties of the modified duration calculation. As you canobserve in Figure 3.17 the modified duration of a bond decreases as it approaches maturity,although not in a continuous way. However, if you assume that the yield on the bond does notchange during its life and only look at the modified duration calculations on coupon paymentdates, it declines steadily towards zero at maturity. This is what you would expect as an investoris ‘guaranteed’ a fixed amount of money in an ever decreasing time period.
Example 3.16
Consider two zero-coupon bonds, one with a life of one year and the other with a life oftwo years. If they both currently yield 5 %, their current prices P are given by:
P1year = 100
1 + 0.05= 95.238
P2year = 100
(1 + 0.05)2 = 90.703
If the yield on both of them now changes to 6 %, the new prices become:
P1year = 100
1 + 0.06= 94.340
P2year = 100
(1 + 0.06)2 = 89.000
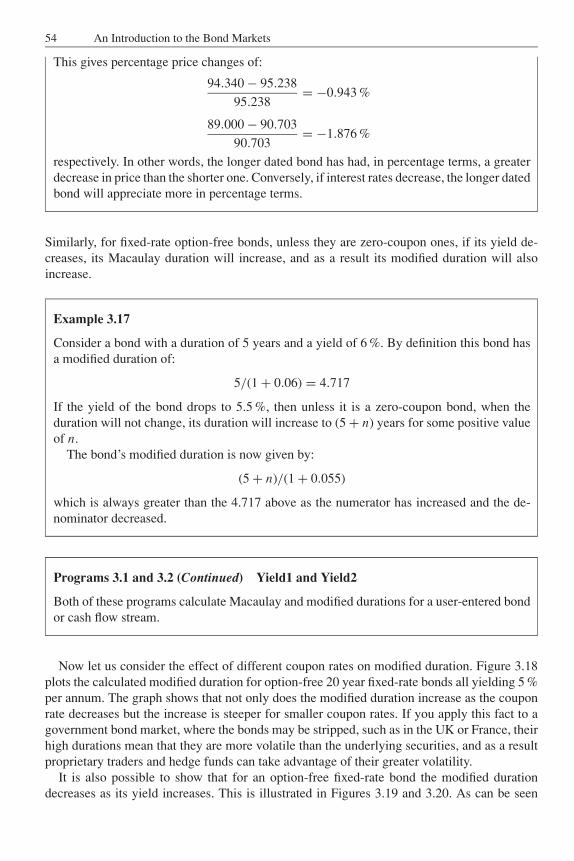
JWBK090-03 JWBK090/Brown March 4, 2006 1:42 Char Count= 0
54 An Introduction to the Bond Markets
This gives percentage price changes of:
94.340 − 95.238
95.238= −0.943 %
89.000 − 90.703
90.703= −1.876 %
respectively. In other words, the longer dated bond has had, in percentage terms, a greaterdecrease in price than the shorter one. Conversely, if interest rates decrease, the longer datedbond will appreciate more in percentage terms.
Similarly, for fixed-rate option-free bonds, unless they are zero-coupon ones, if its yield de-creases, its Macaulay duration will increase, and as a result its modified duration will alsoincrease.
Example 3.17
Consider a bond with a duration of 5 years and a yield of 6 %. By definition this bond hasa modified duration of:
5/(1 + 0.06) = 4.717
If the yield of the bond drops to 5.5 %, then unless it is a zero-coupon bond, when theduration will not change, its duration will increase to (5 + n) years for some positive valueof n.
The bond’s modified duration is now given by:
(5 + n)/(1 + 0.055)
which is always greater than the 4.717 above as the numerator has increased and the de-nominator decreased.
Programs 3.1 and 3.2 (Continued) Yield1 and Yield2
Both of these programs calculate Macaulay and modified durations for a user-entered bondor cash flow stream.
Now let us consider the effect of different coupon rates on modified duration. Figure 3.18plots the calculated modified duration for option-free 20 year fixed-rate bonds all yielding 5 %per annum. The graph shows that not only does the modified duration increase as the couponrate decreases but the increase is steeper for smaller coupon rates. If you apply this fact to agovernment bond market, where the bonds may be stripped, such as in the UK or France, theirhigh durations mean that they are more volatile than the underlying securities, and as a resultproprietary traders and hedge funds can take advantage of their greater volatility.
It is also possible to show that for an option-free fixed-rate bond the modified durationdecreases as its yield increases. This is illustrated in Figures 3.19 and 3.20. As can be seen
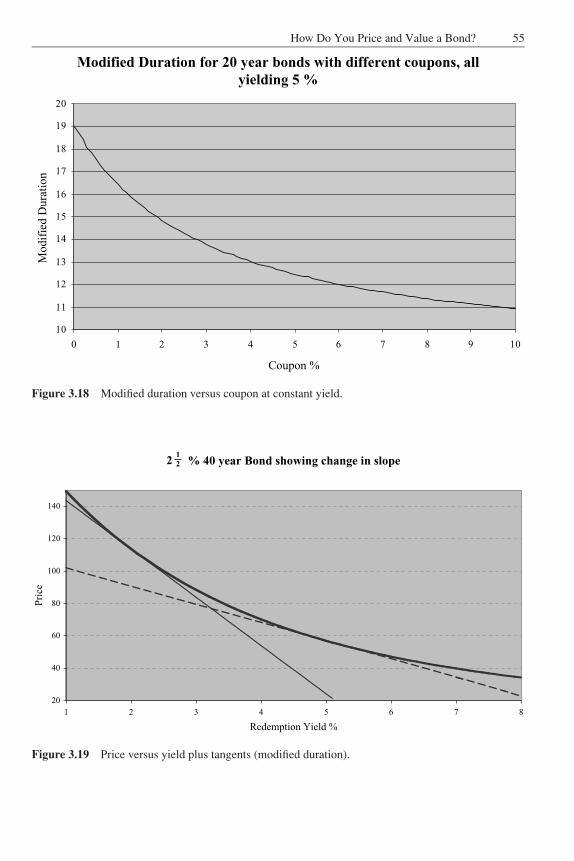
JWBK090-03 JWBK090/Brown March 4, 2006 1:42 Char Count= 0
How Do You Price and Value a Bond? 55
Modified Duration for 20 year bonds with different coupons, allyielding 5 %
10
11
12
13
14
15
16
17
18
19
20
0 1 2 3 4 5 6 7 8 9 10
Coupon %
Mo
dif
ied
Du
rati
on
Figure 3.18 Modified duration versus coupon at constant yield.
% 40 year Bond showing change in slope
20
40
60
80
100
120
140
1 2 3 4 5 6 7 8
Redemption Yield %
Pri
ce
212
Figure 3.19 Price versus yield plus tangents (modified duration).
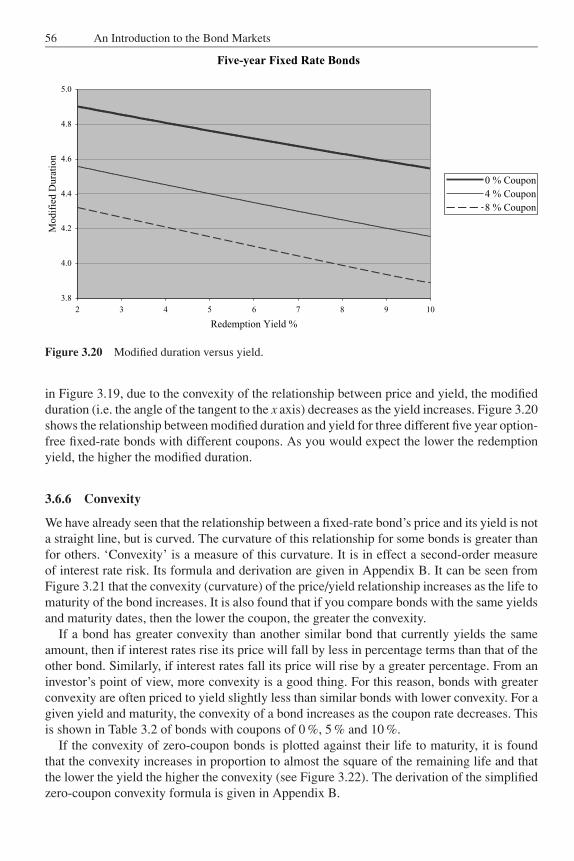
JWBK090-03 JWBK090/Brown March 4, 2006 1:42 Char Count= 0
56 An Introduction to the Bond Markets
Five-year Fixed Rate Bonds
3.8
4.0
4.2
4.4
4.6
4.8
5.0
2 3 4 5 6 7 8 9 10
Redemption Yield %
Modif
ied D
ura
tion
0 % Coupon
4 % Coupon
8 % Coupon
Figure 3.20 Modified duration versus yield.
in Figure 3.19, due to the convexity of the relationship between price and yield, the modifiedduration (i.e. the angle of the tangent to the x axis) decreases as the yield increases. Figure 3.20shows the relationship between modified duration and yield for three different five year option-free fixed-rate bonds with different coupons. As you would expect the lower the redemptionyield, the higher the modified duration.
3.6.6 Convexity
We have already seen that the relationship between a fixed-rate bond’s price and its yield is nota straight line, but is curved. The curvature of this relationship for some bonds is greater thanfor others. ‘Convexity’ is a measure of this curvature. It is in effect a second-order measureof interest rate risk. Its formula and derivation are given in Appendix B. It can be seen fromFigure 3.21 that the convexity (curvature) of the price/yield relationship increases as the life tomaturity of the bond increases. It is also found that if you compare bonds with the same yieldsand maturity dates, then the lower the coupon, the greater the convexity.
If a bond has greater convexity than another similar bond that currently yields the sameamount, then if interest rates rise its price will fall by less in percentage terms than that of theother bond. Similarly, if interest rates fall its price will rise by a greater percentage. From aninvestor’s point of view, more convexity is a good thing. For this reason, bonds with greaterconvexity are often priced to yield slightly less than similar bonds with lower convexity. For agiven yield and maturity, the convexity of a bond increases as the coupon rate decreases. Thisis shown in Table 3.2 of bonds with coupons of 0 %, 5 % and 10 %.
If the convexity of zero-coupon bonds is plotted against their life to maturity, it is foundthat the convexity increases in proportion to almost the square of the remaining life and thatthe lower the yield the higher the convexity (see Figure 3.22). The derivation of the simplifiedzero-coupon convexity formula is given in Appendix B.
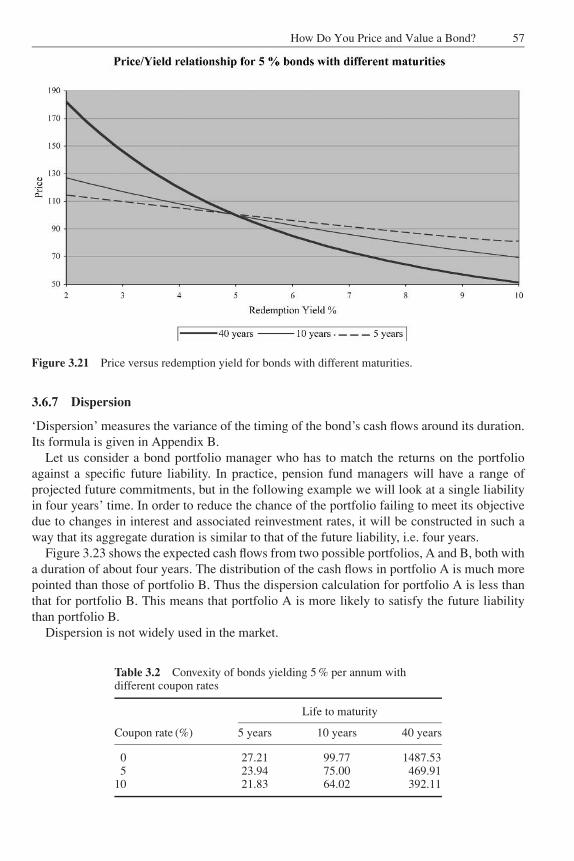
JWBK090-03 JWBK090/Brown March 4, 2006 1:42 Char Count= 0
How Do You Price and Value a Bond? 57
Figure 3.21 Price versus redemption yield for bonds with different maturities.
3.6.7 Dispersion
‘Dispersion’ measures the variance of the timing of the bond’s cash flows around its duration.Its formula is given in Appendix B.
Let us consider a bond portfolio manager who has to match the returns on the portfolioagainst a specific future liability. In practice, pension fund managers will have a range ofprojected future commitments, but in the following example we will look at a single liabilityin four years’ time. In order to reduce the chance of the portfolio failing to meet its objectivedue to changes in interest and associated reinvestment rates, it will be constructed in such away that its aggregate duration is similar to that of the future liability, i.e. four years.
Figure 3.23 shows the expected cash flows from two possible portfolios, A and B, both witha duration of about four years. The distribution of the cash flows in portfolio A is much morepointed than those of portfolio B. Thus the dispersion calculation for portfolio A is less thanthat for portfolio B. This means that portfolio A is more likely to satisfy the future liabilitythan portfolio B.
Dispersion is not widely used in the market.
Table 3.2 Convexity of bonds yielding 5 % per annum withdifferent coupon rates
Life to maturity
Coupon rate (%) 5 years 10 years 40 years
0 27.21 99.77 1487.535 23.94 75.00 469.91
10 21.83 64.02 392.11
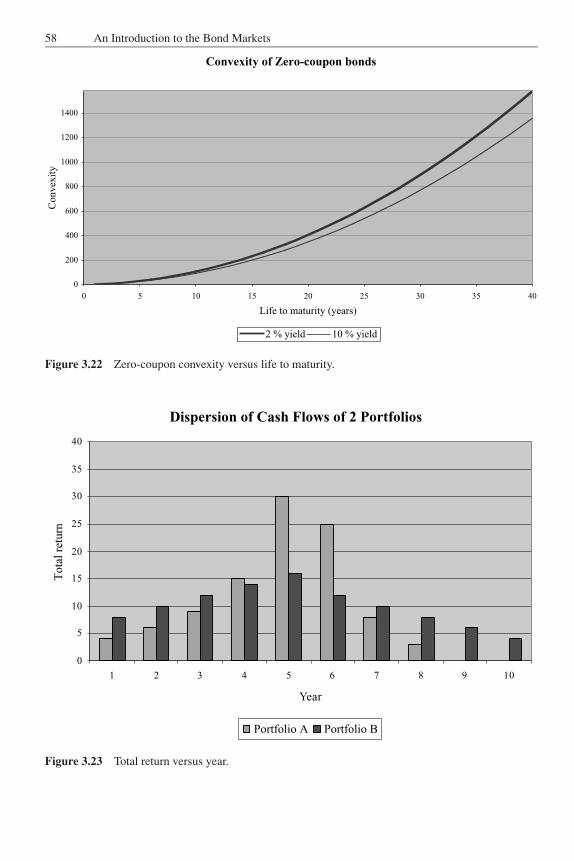
JWBK090-03 JWBK090/Brown March 4, 2006 1:42 Char Count= 0
58 An Introduction to the Bond Markets
Convexity of Zero-coupon bonds
0
200
400
600
800
1000
1200
1400
0 5 10 15 20 25 30 35 40
Life to maturity (years)
Convex
ity
2 % yield 10 % yield
Figure 3.22 Zero-coupon convexity versus life to maturity.
Dispersion of Cash Flows of 2 Portfolios
0
5
10
15
20
25
30
35
40
1 2 3 4 5 6 7 8 9 10
Year
To
tal
retu
rn
Portfolio A Portfolio B
Figure 3.23 Total return versus year.
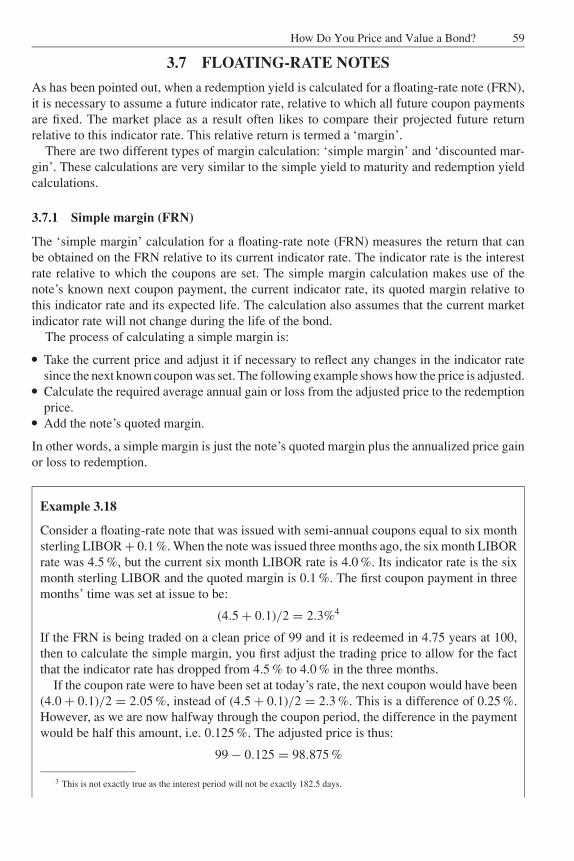
JWBK090-03 JWBK090/Brown March 4, 2006 1:42 Char Count= 0
How Do You Price and Value a Bond? 59
3.7 FLOATING-RATE NOTES
As has been pointed out, when a redemption yield is calculated for a floating-rate note (FRN),it is necessary to assume a future indicator rate, relative to which all future coupon paymentsare fixed. The market place as a result often likes to compare their projected future returnrelative to this indicator rate. This relative return is termed a ‘margin’.
There are two different types of margin calculation: ‘simple margin’ and ‘discounted mar-gin’. These calculations are very similar to the simple yield to maturity and redemption yieldcalculations.
3.7.1 Simple margin (FRN)
The ‘simple margin’ calculation for a floating-rate note (FRN) measures the return that canbe obtained on the FRN relative to its current indicator rate. The indicator rate is the interestrate relative to which the coupons are set. The simple margin calculation makes use of thenote’s known next coupon payment, the current indicator rate, its quoted margin relative tothis indicator rate and its expected life. The calculation also assumes that the current marketindicator rate will not change during the life of the bond.
The process of calculating a simple margin is:� Take the current price and adjust it if necessary to reflect any changes in the indicator ratesince the next known coupon was set. The following example shows how the price is adjusted.� Calculate the required average annual gain or loss from the adjusted price to the redemptionprice.� Add the note’s quoted margin.
In other words, a simple margin is just the note’s quoted margin plus the annualized price gainor loss to redemption.
Example 3.18
Consider a floating-rate note that was issued with semi-annual coupons equal to six monthsterling LIBOR + 0.1 %. When the note was issued three months ago, the six month LIBORrate was 4.5 %, but the current six month LIBOR rate is 4.0 %. Its indicator rate is the sixmonth sterling LIBOR and the quoted margin is 0.1 %. The first coupon payment in threemonths’ time was set at issue to be:
(4.5 + 0.1)/2 = 2.3%4
If the FRN is being traded on a clean price of 99 and it is redeemed in 4.75 years at 100,then to calculate the simple margin, you first adjust the trading price to allow for the factthat the indicator rate has dropped from 4.5 % to 4.0 % in the three months.
If the coupon rate were to have been set at today’s rate, the next coupon would have been(4.0 + 0.1)/2 = 2.05 %, instead of (4.5 + 0.1)/2 = 2.3 %. This is a difference of 0.25 %.However, as we are now halfway through the coupon period, the difference in the paymentwould be half this amount, i.e. 0.125 %. The adjusted price is thus:
99 − 0.125 = 98.875 %
3 This is not exactly true as the interest period will not be exactly 182.5 days.
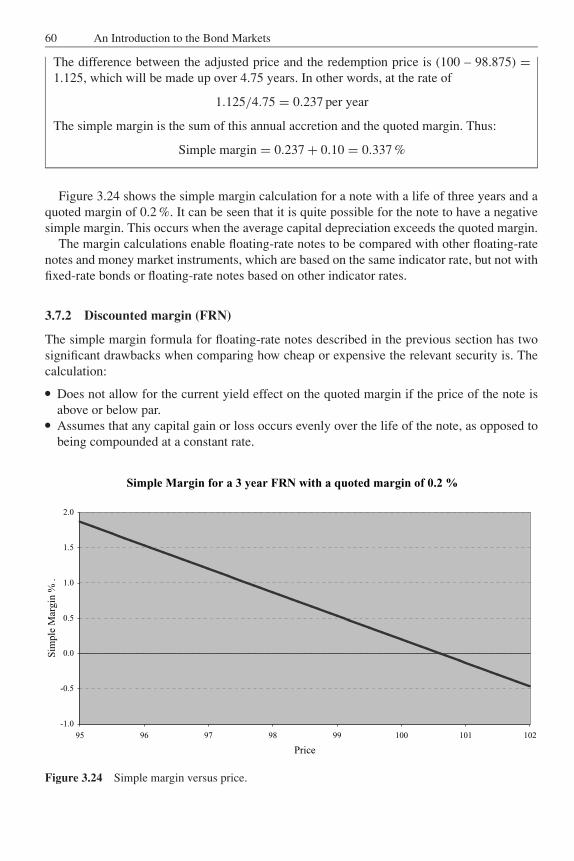
JWBK090-03 JWBK090/Brown March 4, 2006 1:42 Char Count= 0
60 An Introduction to the Bond Markets
The difference between the adjusted price and the redemption price is (100 – 98.875) =1.125, which will be made up over 4.75 years. In other words, at the rate of
1.125/4.75 = 0.237 per year
The simple margin is the sum of this annual accretion and the quoted margin. Thus:
Simple margin = 0.237 + 0.10 = 0.337 %
Figure 3.24 shows the simple margin calculation for a note with a life of three years and aquoted margin of 0.2 %. It can be seen that it is quite possible for the note to have a negativesimple margin. This occurs when the average capital depreciation exceeds the quoted margin.
The margin calculations enable floating-rate notes to be compared with other floating-ratenotes and money market instruments, which are based on the same indicator rate, but not withfixed-rate bonds or floating-rate notes based on other indicator rates.
3.7.2 Discounted margin (FRN)
The simple margin formula for floating-rate notes described in the previous section has twosignificant drawbacks when comparing how cheap or expensive the relevant security is. Thecalculation:� Does not allow for the current yield effect on the quoted margin if the price of the note is
above or below par.� Assumes that any capital gain or loss occurs evenly over the life of the note, as opposed tobeing compounded at a constant rate.
Simple Margin for a 3 year FRN with a quoted margin of 0.2 %
-1.0
-0.5
0.0
0.5
1.0
1.5
2.0
95 96 97 98 99 100 101 102
Price
Sim
ple
Mar
gin
% .
Figure 3.24 Simple margin versus price.
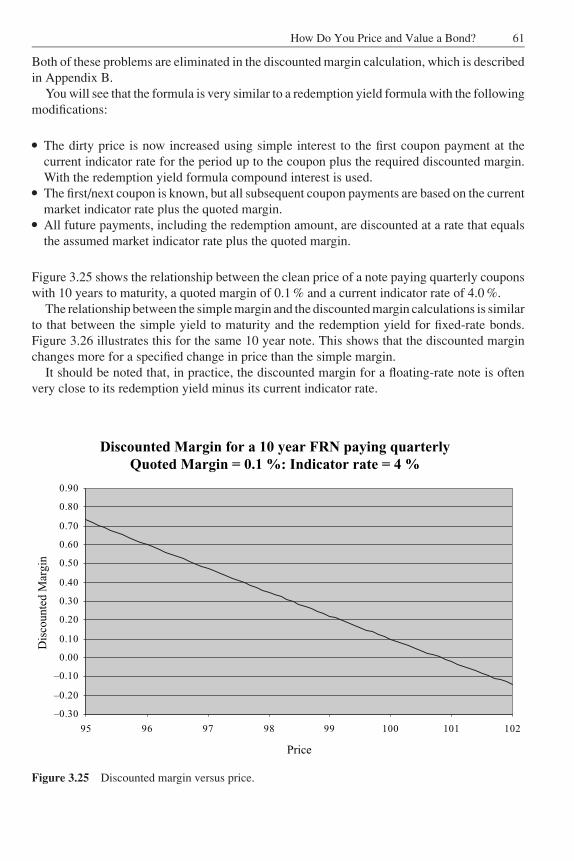
JWBK090-03 JWBK090/Brown March 4, 2006 1:42 Char Count= 0
How Do You Price and Value a Bond? 61
Both of these problems are eliminated in the discounted margin calculation, which is describedin Appendix B.
You will see that the formula is very similar to a redemption yield formula with the followingmodifications:� The dirty price is now increased using simple interest to the first coupon payment at the
current indicator rate for the period up to the coupon plus the required discounted margin.With the redemption yield formula compound interest is used.� The first/next coupon is known, but all subsequent coupon payments are based on the currentmarket indicator rate plus the quoted margin.� All future payments, including the redemption amount, are discounted at a rate that equalsthe assumed market indicator rate plus the quoted margin.
Figure 3.25 shows the relationship between the clean price of a note paying quarterly couponswith 10 years to maturity, a quoted margin of 0.1 % and a current indicator rate of 4.0 %.
The relationship between the simple margin and the discounted margin calculations is similarto that between the simple yield to maturity and the redemption yield for fixed-rate bonds.Figure 3.26 illustrates this for the same 10 year note. This shows that the discounted marginchanges more for a specified change in price than the simple margin.
It should be noted that, in practice, the discounted margin for a floating-rate note is oftenvery close to its redemption yield minus its current indicator rate.
Discounted Margin for a 10 year FRN paying quarterlyQuoted Margin = 0.1 %: Indicator rate = 4 %
–0.30
–0.20
–0.10
0.00
0.10
0.20
0.30
0.40
0.50
0.60
0.70
0.80
0.90
95 96 97 98 99 100 101 102
Price
Dis
cou
nte
d M
arg
in
Figure 3.25 Discounted margin versus price.
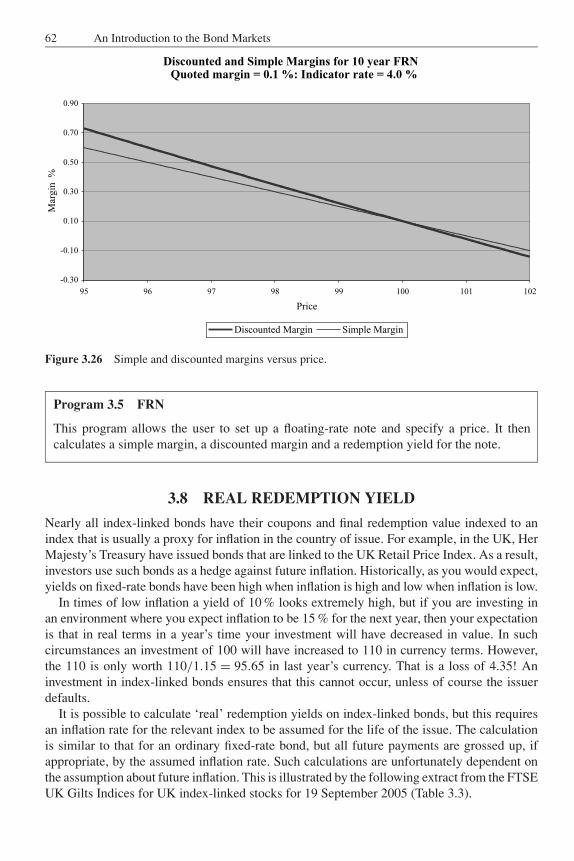
JWBK090-03 JWBK090/Brown March 4, 2006 1:42 Char Count= 0
62 An Introduction to the Bond Markets
Discounted and Simple Margins for 10 year FRNQuoted margin = 0.1 %: Indicator rate = 4.0 %
-0.30
-0.10
0.10
0.30
0.50
0.70
0.90
95 96 97 98 99 100 101 102
Price
Mar
gin
%
Discounted Margin Simple Margin
Figure 3.26 Simple and discounted margins versus price.
Program 3.5 FRN
This program allows the user to set up a floating-rate note and specify a price. It thencalculates a simple margin, a discounted margin and a redemption yield for the note.
3.8 REAL REDEMPTION YIELD
Nearly all index-linked bonds have their coupons and final redemption value indexed to anindex that is usually a proxy for inflation in the country of issue. For example, in the UK, HerMajesty’s Treasury have issued bonds that are linked to the UK Retail Price Index. As a result,investors use such bonds as a hedge against future inflation. Historically, as you would expect,yields on fixed-rate bonds have been high when inflation is high and low when inflation is low.
In times of low inflation a yield of 10 % looks extremely high, but if you are investing inan environment where you expect inflation to be 15 % for the next year, then your expectationis that in real terms in a year’s time your investment will have decreased in value. In suchcircumstances an investment of 100 will have increased to 110 in currency terms. However,the 110 is only worth 110/1.15 = 95.65 in last year’s currency. That is a loss of 4.35! Aninvestment in index-linked bonds ensures that this cannot occur, unless of course the issuerdefaults.
It is possible to calculate ‘real’ redemption yields on index-linked bonds, but this requiresan inflation rate for the relevant index to be assumed for the life of the issue. The calculationis similar to that for an ordinary fixed-rate bond, but all future payments are grossed up, ifappropriate, by the assumed inflation rate. Such calculations are unfortunately dependent onthe assumption about future inflation. This is illustrated by the following extract from the FTSEUK Gilts Indices for UK index-linked stocks for 19 September 2005 (Table 3.3).
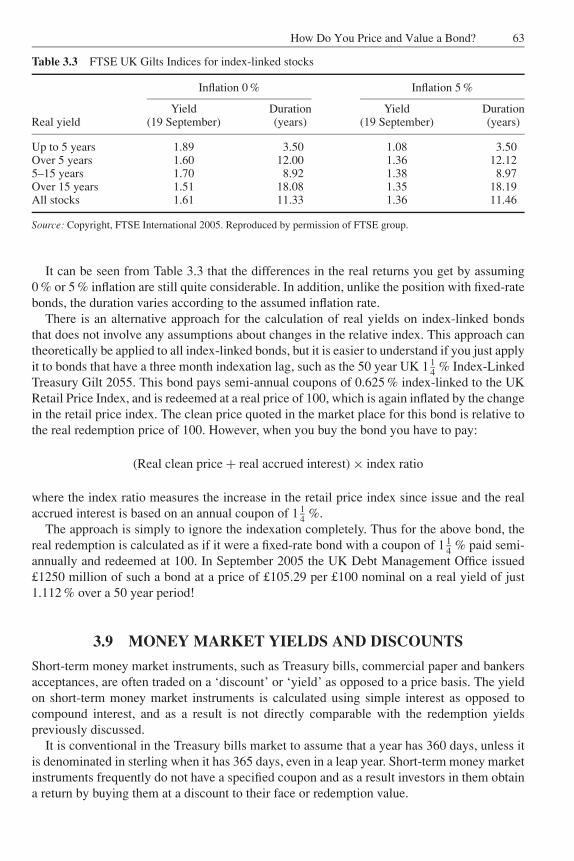
JWBK090-03 JWBK090/Brown March 4, 2006 1:42 Char Count= 0
How Do You Price and Value a Bond? 63
Table 3.3 FTSE UK Gilts Indices for index-linked stocks
Inflation 0 % Inflation 5 %
Yield Duration Yield DurationReal yield (19 September) (years) (19 September) (years)
Up to 5 years 1.89 3.50 1.08 3.50Over 5 years 1.60 12.00 1.36 12.125–15 years 1.70 8.92 1.38 8.97Over 15 years 1.51 18.08 1.35 18.19All stocks 1.61 11.33 1.36 11.46
Source: Copyright, FTSE International 2005. Reproduced by permission of FTSE group.
It can be seen from Table 3.3 that the differences in the real returns you get by assuming0 % or 5 % inflation are still quite considerable. In addition, unlike the position with fixed-ratebonds, the duration varies according to the assumed inflation rate.
There is an alternative approach for the calculation of real yields on index-linked bondsthat does not involve any assumptions about changes in the relative index. This approach cantheoretically be applied to all index-linked bonds, but it is easier to understand if you just applyit to bonds that have a three month indexation lag, such as the 50 year UK 1 1
4 % Index-LinkedTreasury Gilt 2055. This bond pays semi-annual coupons of 0.625 % index-linked to the UKRetail Price Index, and is redeemed at a real price of 100, which is again inflated by the changein the retail price index. The clean price quoted in the market place for this bond is relative tothe real redemption price of 100. However, when you buy the bond you have to pay:
(Real clean price + real accrued interest) × index ratio
where the index ratio measures the increase in the retail price index since issue and the realaccrued interest is based on an annual coupon of 1 1
4 %.The approach is simply to ignore the indexation completely. Thus for the above bond, the
real redemption is calculated as if it were a fixed-rate bond with a coupon of 1 14 % paid semi-
annually and redeemed at 100. In September 2005 the UK Debt Management Office issued£1250 million of such a bond at a price of £105.29 per £100 nominal on a real yield of just1.112 % over a 50 year period!
3.9 MONEY MARKET YIELDS AND DISCOUNTS
Short-term money market instruments, such as Treasury bills, commercial paper and bankersacceptances, are often traded on a ‘discount’ or ‘yield’ as opposed to a price basis. The yieldon short-term money market instruments is calculated using simple interest as opposed tocompound interest, and as a result is not directly comparable with the redemption yieldspreviously discussed.
It is conventional in the Treasury bills market to assume that a year has 360 days, unless itis denominated in sterling when it has 365 days, even in a leap year. Short-term money marketinstruments frequently do not have a specified coupon and as a result investors in them obtaina return by buying them at a discount to their face or redemption value.
JWBK090-03 JWBK090/Brown March 4, 2006 1:42 Char Count= 0
64 An Introduction to the Bond Markets
Example 3.19
A 90 day US dollar Treasury bill is issued at 99% of its face value. It will be redeemed atits face value (100 %) 90 days after issue. It is traded on a discount basis. The discount isgiven by:
Discount = (100 − 99) × 360
90= 4 %
As in the US dollar money market a year is deemed to have 360 days.
The discount is often converted into a yield so as to make it comparable with other moneymarket instruments. This yield is often called a ‘money market yield’. Using the above example,the money market yield is just 4 × 100/99 = 4.0404 %.
The formulae for discounts and money market yields are given in Appendix B.
Program 3.6 Discount
This program allows the user to enter the price or discount, accrual basis and life of a moneymarket instrument, and calculates its discount/price, money market yield and equivalentredemption yields compounded both annually and semi-annually.
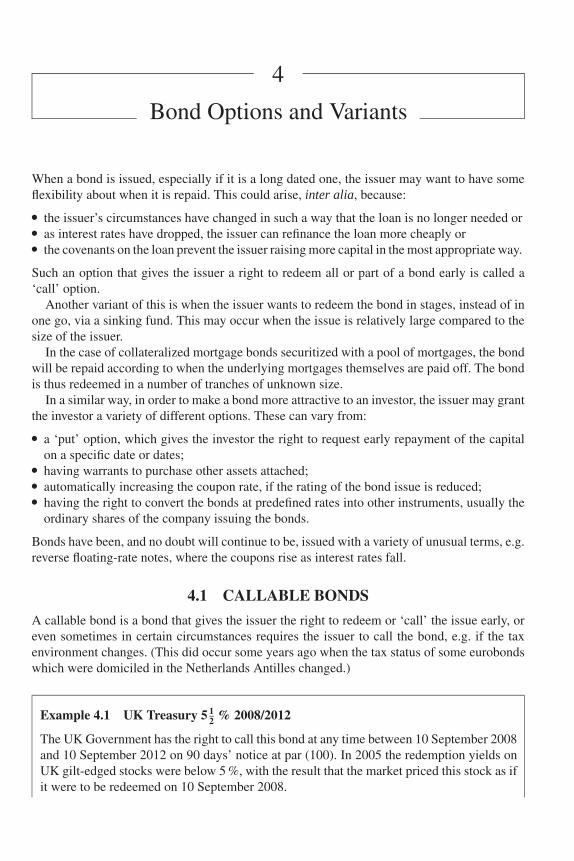
JWBK090-04 JWBK090/Brown March 3, 2006 14:1 Char Count= 0
4
Bond Options and Variants
When a bond is issued, especially if it is a long dated one, the issuer may want to have someflexibility about when it is repaid. This could arise, inter alia, because:� the issuer’s circumstances have changed in such a way that the loan is no longer needed or� as interest rates have dropped, the issuer can refinance the loan more cheaply or� the covenants on the loan prevent the issuer raising more capital in the most appropriate way.
Such an option that gives the issuer a right to redeem all or part of a bond early is called a‘call’ option.
Another variant of this is when the issuer wants to redeem the bond in stages, instead of inone go, via a sinking fund. This may occur when the issue is relatively large compared to thesize of the issuer.
In the case of collateralized mortgage bonds securitized with a pool of mortgages, the bondwill be repaid according to when the underlying mortgages themselves are paid off. The bondis thus redeemed in a number of tranches of unknown size.
In a similar way, in order to make a bond more attractive to an investor, the issuer may grantthe investor a variety of different options. These can vary from:� a ‘put’ option, which gives the investor the right to request early repayment of the capital
on a specific date or dates;� having warrants to purchase other assets attached;� automatically increasing the coupon rate, if the rating of the bond issue is reduced;� having the right to convert the bonds at predefined rates into other instruments, usually theordinary shares of the company issuing the bonds.
Bonds have been, and no doubt will continue to be, issued with a variety of unusual terms, e.g.reverse floating-rate notes, where the coupons rise as interest rates fall.
4.1 CALLABLE BONDS
A callable bond is a bond that gives the issuer the right to redeem or ‘call’ the issue early, oreven sometimes in certain circumstances requires the issuer to call the bond, e.g. if the taxenvironment changes. (This did occur some years ago when the tax status of some eurobondswhich were domiciled in the Netherlands Antilles changed.)
Example 4.1 UK Treasury 5 12 % 2008/2012
The UK Government has the right to call this bond at any time between 10 September 2008and 10 September 2012 on 90 days’ notice at par (100). In 2005 the redemption yields onUK gilt-edged stocks were below 5 %, with the result that the market priced this stock as ifit were to be redeemed on 10 September 2008.
65
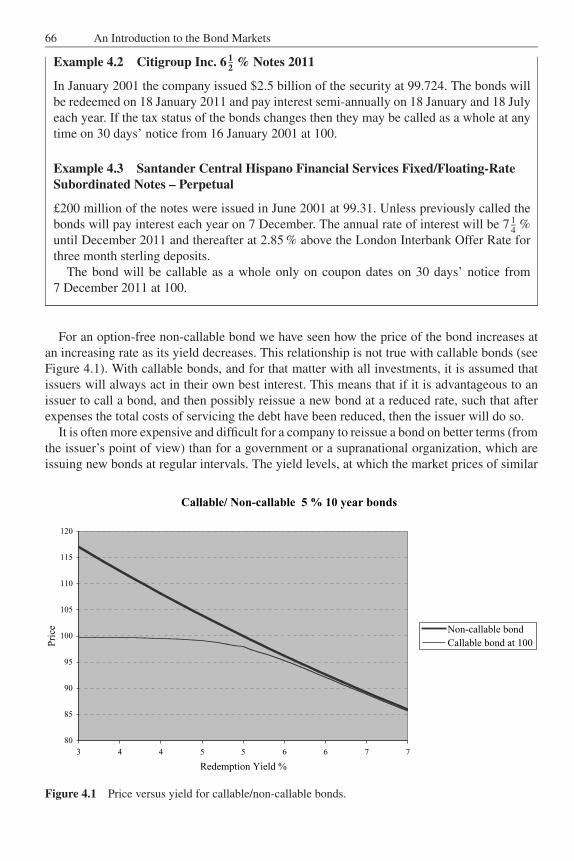
JWBK090-04 JWBK090/Brown March 3, 2006 14:1 Char Count= 0
66 An Introduction to the Bond Markets
Example 4.2 Citigroup Inc. 6 12 % Notes 2011
In January 2001 the company issued $2.5 billion of the security at 99.724. The bonds willbe redeemed on 18 January 2011 and pay interest semi-annually on 18 January and 18 Julyeach year. If the tax status of the bonds changes then they may be called as a whole at anytime on 30 days’ notice from 16 January 2001 at 100.
Example 4.3 Santander Central Hispano Financial Services Fixed/Floating-RateSubordinated Notes – Perpetual
£200 million of the notes were issued in June 2001 at 99.31. Unless previously called thebonds will pay interest each year on 7 December. The annual rate of interest will be 7 1
4%
until December 2011 and thereafter at 2.85 % above the London Interbank Offer Rate forthree month sterling deposits.
The bond will be callable as a whole only on coupon dates on 30 days’ notice from7 December 2011 at 100.
For an option-free non-callable bond we have seen how the price of the bond increases atan increasing rate as its yield decreases. This relationship is not true with callable bonds (seeFigure 4.1). With callable bonds, and for that matter with all investments, it is assumed thatissuers will always act in their own best interest. This means that if it is advantageous to anissuer to call a bond, and then possibly reissue a new bond at a reduced rate, such that afterexpenses the total costs of servicing the debt have been reduced, then the issuer will do so.
It is often more expensive and difficult for a company to reissue a bond on better terms (fromthe issuer’s point of view) than for a government or a supranational organization, which areissuing new bonds at regular intervals. The yield levels, at which the market prices of similar
Callable/ Non-callable 5 % 10 year bonds
80
85
90
95
100
105
110
115
120
3 4 4 5 5 6 6 7 7
Redemption Yield %
Pri
ce Non-callable bond
Callable bond at 100
Figure 4.1 Price versus yield for callable/non-callable bonds.
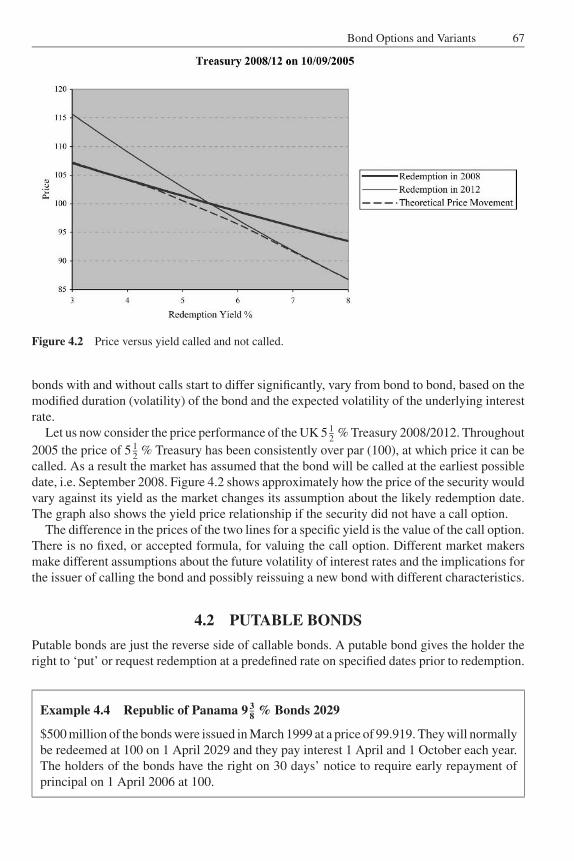
JWBK090-04 JWBK090/Brown March 3, 2006 14:1 Char Count= 0
Bond Options and Variants 67
Figure 4.2 Price versus yield called and not called.
bonds with and without calls start to differ significantly, vary from bond to bond, based on themodified duration (volatility) of the bond and the expected volatility of the underlying interestrate.
Let us now consider the price performance of the UK 5 12
% Treasury 2008/2012. Throughout
2005 the price of 5 12
% Treasury has been consistently over par (100), at which price it can becalled. As a result the market has assumed that the bond will be called at the earliest possibledate, i.e. September 2008. Figure 4.2 shows approximately how the price of the security wouldvary against its yield as the market changes its assumption about the likely redemption date.The graph also shows the yield price relationship if the security did not have a call option.
The difference in the prices of the two lines for a specific yield is the value of the call option.There is no fixed, or accepted formula, for valuing the call option. Different market makersmake different assumptions about the future volatility of interest rates and the implications forthe issuer of calling the bond and possibly reissuing a new bond with different characteristics.
4.2 PUTABLE BONDS
Putable bonds are just the reverse side of callable bonds. A putable bond gives the holder theright to ‘put’ or request redemption at a predefined rate on specified dates prior to redemption.
Example 4.4 Republic of Panama 9 38 % Bonds 2029
$500 million of the bonds were issued in March 1999 at a price of 99.919. They will normallybe redeemed at 100 on 1 April 2029 and they pay interest 1 April and 1 October each year.The holders of the bonds have the right on 30 days’ notice to require early repayment ofprincipal on 1 April 2006 at 100.
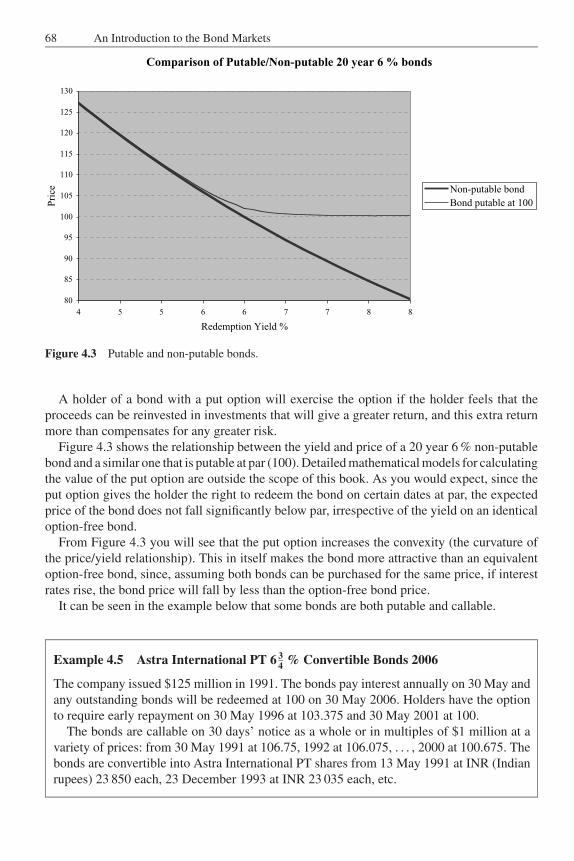
JWBK090-04 JWBK090/Brown March 3, 2006 14:1 Char Count= 0
68 An Introduction to the Bond Markets
Comparison of Putable/Non-putable 20 year 6 % bonds
80
85
90
95
100
105
110
115
120
125
130
4 5 5 6 6 7 7 8 8
Redemption Yield %
Pri
ce Non-putable bond
Bond putable at 100
Figure 4.3 Putable and non-putable bonds.
A holder of a bond with a put option will exercise the option if the holder feels that theproceeds can be reinvested in investments that will give a greater return, and this extra returnmore than compensates for any greater risk.
Figure 4.3 shows the relationship between the yield and price of a 20 year 6 % non-putablebond and a similar one that is putable at par (100). Detailed mathematical models for calculatingthe value of the put option are outside the scope of this book. As you would expect, since theput option gives the holder the right to redeem the bond on certain dates at par, the expectedprice of the bond does not fall significantly below par, irrespective of the yield on an identicaloption-free bond.
From Figure 4.3 you will see that the put option increases the convexity (the curvature ofthe price/yield relationship). This in itself makes the bond more attractive than an equivalentoption-free bond, since, assuming both bonds can be purchased for the same price, if interestrates rise, the bond price will fall by less than the option-free bond price.
It can be seen in the example below that some bonds are both putable and callable.
Example 4.5 Astra International PT 6 34 % Convertible Bonds 2006
The company issued $125 million in 1991. The bonds pay interest annually on 30 May andany outstanding bonds will be redeemed at 100 on 30 May 2006. Holders have the optionto require early repayment on 30 May 1996 at 103.375 and 30 May 2001 at 100.
The bonds are callable on 30 days’ notice as a whole or in multiples of $1 million at avariety of prices: from 30 May 1991 at 106.75, 1992 at 106.075, . . . , 2000 at 100.675. Thebonds are convertible into Astra International PT shares from 13 May 1991 at INR (Indianrupees) 23 850 each, 23 December 1993 at INR 23 035 each, etc.
JWBK090-04 JWBK090/Brown March 3, 2006 14:1 Char Count= 0
Bond Options and Variants 69
4.3 CONVERTIBLE BONDS
Convertible bonds are usually normal straight bonds that, in addition, give the holder the optionto convert the bonds into another security at predefined rates and dates. The conversion termsmay be exercisable on specific dates, e.g. once a year, or continuously for part of the life ofthe bond. The conversion terms may also differ on different dates.
Example 4.6 Hammerson plc 6 12 % Subordinated Convertible Bonds 2006
The company issued £110 million of the bond in 1996. It pays interest semi-annually on12 June and 12 December and will be redeemed at 100 on 12 June 2006, if not called orconverted earlier. The holders may convert the bonds into Hammerson plc shares from 23July 1996 to 5 June 2006, when the rights expire, at a cost of £4.356 each.
The bond is callable as a whole or in multiples of £5 million at any time on 30 days’notice from 26 June 2001.
Example 4.7 Hankyu Corporation 1 12 % Convertible Bonds 2006
JPY 10 billion of the bonds were issued in 1996 at 100. They pay interest semi-annually on31 March and 30 September and will be redeemed on 30 September 2006 if they still exist.The holders have an option on 14 days’ notice to require early repayment on 30 September2003 at 101.5, unless the share price has been at least 120 % of the conversion price.
The bond is callable if its tax status changes. The bond is convertible into HankyuCorporation common stock from 29 October 1996 at JPY 680 each, and then at JPY 510each from 21 December 1999. The rights expire on 22 September 2006.
Convertible bonds have advantages for both issuers and investors, but at a cost. From thepoint of view of the issuer, a convertible bond enables:� Capital to be raised at a slightly lower cost than would have been possible with a straight
bond issue.� It does not, at least initially, dilute the equity base by issuing more equity shares as analternative to issuing a bond, as the terms of the convertible can postpone the possible issueof any new shares for several years.
From the investor’s point of view, the purchase of a convertible means:� The investor has bought an issue with an option to convert, usually into equity shares, atsome stage in the future if circumstances make this desirable. For this option a small amountof interest is given up.� The investor has acquired an investment with a fixed rate of interest, which is more secureand is, usually in the initial years, greater than the income that would have been receivedhad the investor instead invested directly in the equity shares. However, it should be pointedout that, as you would expect, it normally costs more to purchase an equity via a convertiblethan directly. It is variations in this premium that some hedge funds attempt to exploit.
The following example illustrates the basic convertible calculations of ‘conversion price’,‘exercise cost’, ‘conversion premium/discount’ and ‘break-even period’.
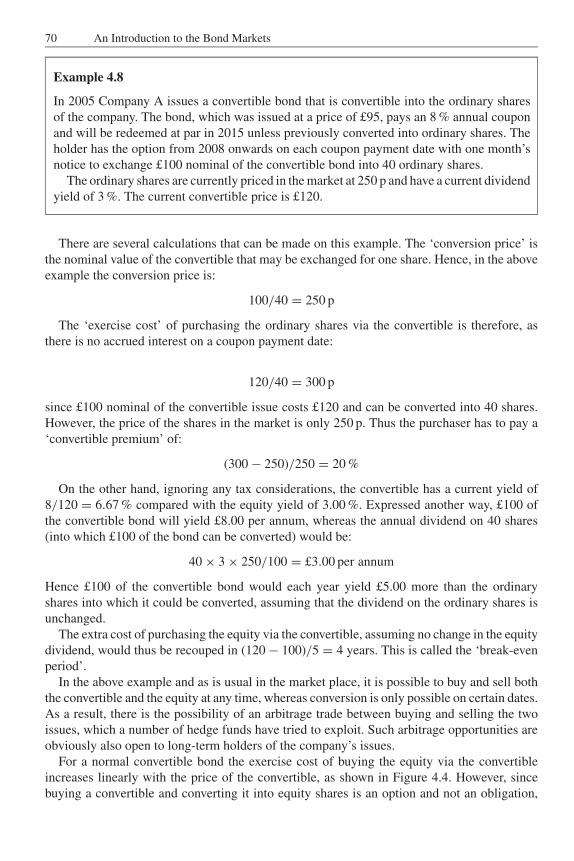
JWBK090-04 JWBK090/Brown March 3, 2006 14:1 Char Count= 0
70 An Introduction to the Bond Markets
Example 4.8
In 2005 Company A issues a convertible bond that is convertible into the ordinary sharesof the company. The bond, which was issued at a price of £95, pays an 8 % annual couponand will be redeemed at par in 2015 unless previously converted into ordinary shares. Theholder has the option from 2008 onwards on each coupon payment date with one month’snotice to exchange £100 nominal of the convertible bond into 40 ordinary shares.
The ordinary shares are currently priced in the market at 250 p and have a current dividendyield of 3 %. The current convertible price is £120.
There are several calculations that can be made on this example. The ‘conversion price’ isthe nominal value of the convertible that may be exchanged for one share. Hence, in the aboveexample the conversion price is:
100/40 = 250 p
The ‘exercise cost’ of purchasing the ordinary shares via the convertible is therefore, asthere is no accrued interest on a coupon payment date:
120/40 = 300 p
since £100 nominal of the convertible issue costs £120 and can be converted into 40 shares.However, the price of the shares in the market is only 250 p. Thus the purchaser has to pay a‘convertible premium’ of:
(300 − 250)/250 = 20 %
On the other hand, ignoring any tax considerations, the convertible has a current yield of8/120 = 6.67 % compared with the equity yield of 3.00 %. Expressed another way, £100 ofthe convertible bond will yield £8.00 per annum, whereas the annual dividend on 40 shares(into which £100 of the bond can be converted) would be:
40 × 3 × 250/100 = £3.00 per annum
Hence £100 of the convertible bond would each year yield £5.00 more than the ordinaryshares into which it could be converted, assuming that the dividend on the ordinary shares isunchanged.
The extra cost of purchasing the equity via the convertible, assuming no change in the equitydividend, would thus be recouped in (120 − 100)/5 = 4 years. This is called the ‘break-evenperiod’.
In the above example and as is usual in the market place, it is possible to buy and sell boththe convertible and the equity at any time, whereas conversion is only possible on certain dates.As a result, there is the possibility of an arbitrage trade between buying and selling the twoissues, which a number of hedge funds have tried to exploit. Such arbitrage opportunities areobviously also open to long-term holders of the company’s issues.
For a normal convertible bond the exercise cost of buying the equity via the convertibleincreases linearly with the price of the convertible, as shown in Figure 4.4. However, sincebuying a convertible and converting it into equity shares is an option and not an obligation,
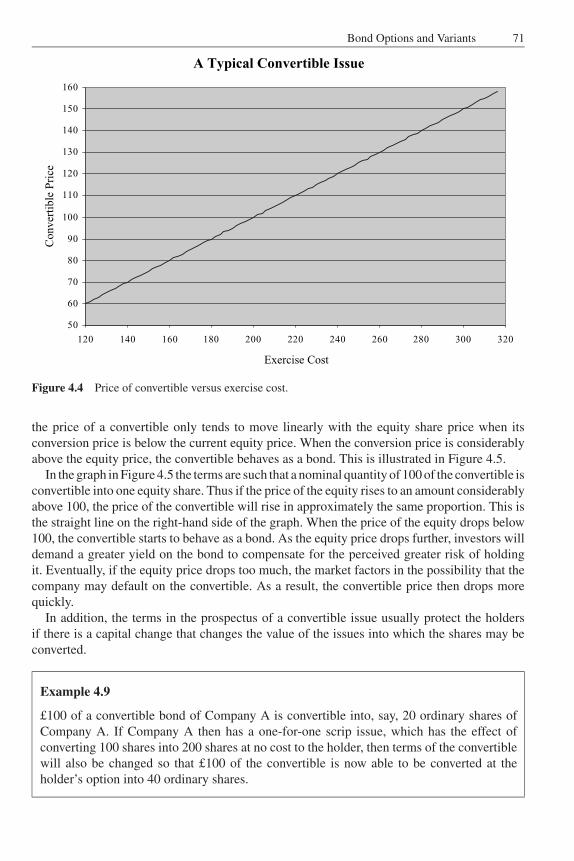
JWBK090-04 JWBK090/Brown March 3, 2006 14:1 Char Count= 0
Bond Options and Variants 71
A Typical Convertible Issue
50
60
70
80
90
100
110
120
130
140
150
160
120 140 160 180 200 220 240 260 280 300 320
Exercise Cost
Conver
tible
Pri
ce
Figure 4.4 Price of convertible versus exercise cost.
the price of a convertible only tends to move linearly with the equity share price when itsconversion price is below the current equity price. When the conversion price is considerablyabove the equity price, the convertible behaves as a bond. This is illustrated in Figure 4.5.
In the graph in Figure 4.5 the terms are such that a nominal quantity of 100 of the convertible isconvertible into one equity share. Thus if the price of the equity rises to an amount considerablyabove 100, the price of the convertible will rise in approximately the same proportion. This isthe straight line on the right-hand side of the graph. When the price of the equity drops below100, the convertible starts to behave as a bond. As the equity price drops further, investors willdemand a greater yield on the bond to compensate for the perceived greater risk of holdingit. Eventually, if the equity price drops too much, the market factors in the possibility that thecompany may default on the convertible. As a result, the convertible price then drops morequickly.
In addition, the terms in the prospectus of a convertible issue usually protect the holdersif there is a capital change that changes the value of the issues into which the shares may beconverted.
Example 4.9
£100 of a convertible bond of Company A is convertible into, say, 20 ordinary shares ofCompany A. If Company A then has a one-for-one scrip issue, which has the effect ofconverting 100 shares into 200 shares at no cost to the holder, then terms of the convertiblewill also be changed so that £100 of the convertible is now able to be converted at theholder’s option into 40 ordinary shares.
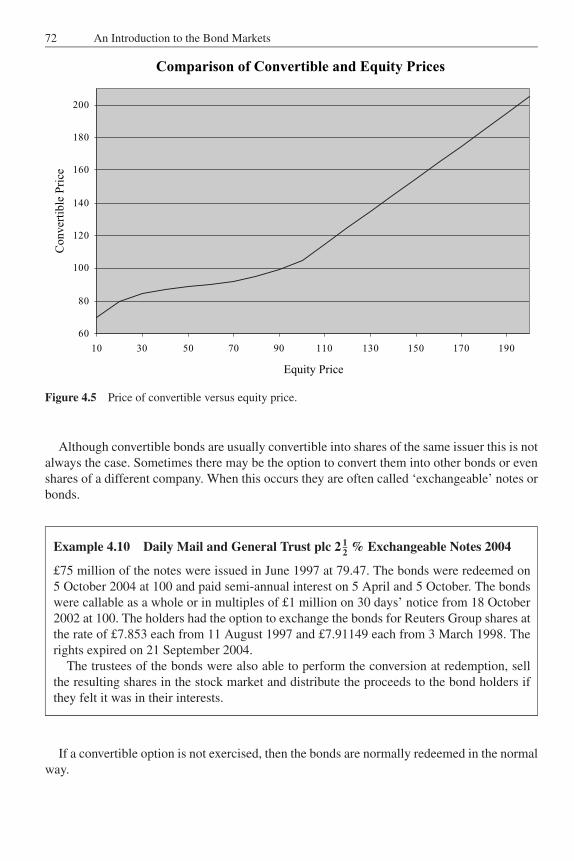
JWBK090-04 JWBK090/Brown March 3, 2006 14:1 Char Count= 0
72 An Introduction to the Bond Markets
Comparison of Convertible and Equity Prices
60
80
100
120
140
160
180
200
10 30 50 70 90 110 130 150 170 190
Equity Price
Co
nv
erti
ble
Pri
ce
Figure 4.5 Price of convertible versus equity price.
Although convertible bonds are usually convertible into shares of the same issuer this is notalways the case. Sometimes there may be the option to convert them into other bonds or evenshares of a different company. When this occurs they are often called ‘exchangeable’ notes orbonds.
Example 4.10 Daily Mail and General Trust plc 2 12 % Exchangeable Notes 2004
£75 million of the notes were issued in June 1997 at 79.47. The bonds were redeemed on5 October 2004 at 100 and paid semi-annual interest on 5 April and 5 October. The bondswere callable as a whole or in multiples of £1 million on 30 days’ notice from 18 October2002 at 100. The holders had the option to exchange the bonds for Reuters Group shares atthe rate of £7.853 each from 11 August 1997 and £7.91149 each from 3 March 1998. Therights expired on 21 September 2004.
The trustees of the bonds were also able to perform the conversion at redemption, sellthe resulting shares in the stock market and distribute the proceeds to the bond holders ifthey felt it was in their interests.
If a convertible option is not exercised, then the bonds are normally redeemed in the normalway.
JWBK090-04 JWBK090/Brown March 3, 2006 14:1 Char Count= 0
Bond Options and Variants 73
4.4 DUAL CURRENCY BONDS
In order to take advantage of current differences in interest rates and projected changes incurrency exchange rates, bonds have been issued with interest and capital repayments indifferent currencies. As you would expect, there are many variations in the terms of suchinstruments. Two variations are illustrated in the New South Wales Treasury issues below.
Example 4.11 New South Wales Treasury Corporation 3 % Dual Currency Issue2001
JPY 23 billion of the bond was issued in 1997 at 100 with maturity on 20 August 2001.Bonds of JPY 500 000 were issued in bearer form. Interest is paid semi-annually on 20February and 20 August in yen. However, each bond is redeemed at US $4444.44 based ona fixed exchange rate of $1 = JPY 112.5.
Example 4.12 New South Wales Treasury Corporation 5.15 % Dual Currency Issue2005
JPY 15 billion of the bond was issued in 1995 at 96.5 for redemption on 31 January 2005 at100 in yen. Interest, which is payable annually on 31 January, is paid in Australian dollars(AUD) at the fixed exchange rate of AUD 1 = JPY 75.11.
4.5 MORTGAGE-BACKED SECURITIES
Covered bonds or Pfandbrief are bonds issued by banks and are secured on a pool of mort-gages or public loans. These bonds remain on the bank’s balance sheet and behave as con-ventional secured bonds. This section, on the other hand, describes asset-backed securities ormortgage-backed securities, which have been taken off the balance sheet of the original com-pany and put into a special-purpose vehicle.
‘Mortgage-backed securities’ (MBS) are conventional asset-backed securities, which havebeen secured on a pool of separate mortgages. However, there is often the provision that aproportion of the bonds will be redeemed early if the underlying mortgages are redeemed.Such securities are very common in the US. There are many reasons why the homeownermay wish to redeem a mortgage early. From the security point of view, any payments made inexcess of the scheduled principal repayments are called ‘prepayments’.
Thus at the end of any interest period (usually monthly) a payment may be made whichconsists of three parts:� interest;� scheduled capital repayment;� capital prepayment.
The first two components behave in the same way as an annuity, but the third componentis unpredictable. It is frequently assumed, if the mortgage pool, on which the security isbased is sufficiently large, that a fixed proportion of the bonds will be redeemed each year.Hence a redemption yield and a valuation can be derived for the MBS. However, choosing
JWBK090-04 JWBK090/Brown March 3, 2006 14:1 Char Count= 0
74 An Introduction to the Bond Markets
the prepayment rate is not always that simple. If the current interest rates are at or above theprevailing interest rate when the MBS was created, then the prepayment rate caused by peoplewanting to sell their houses is fairly predictable. On the other hand, if the current interest rateis below the original interest rate, then many of the mortgagees may repay their loans earlyand refinance their debts at a cheaper rate.
4.6 COLLATERALIZED DEBT OBLIGATIONS
Many securities have been created that are classified under the generic heading of ‘asset-backed securities’ (ABS). These are frequently created by bundling, often non-marketable,assets together into a marketable security. This process is called ‘securitization’.
The following lists a few of the many different types of assets that have been securitized:� An institution’s loan book. This enables the loan book to be taken off the institution’s balancesheet.� A pool of mortgages, creating a mortgage-backed security.� Credit card debt.� Car loan debt.
When the ‘collateralized debt obligation’ (CDO) has been created by the securitizationprocess, investors have the guarantee of the underlying assets and are entitled to receiveinterest payments generated by them. When the underlying assets mature, the created securityor securities are often redeemed by lot or proportionally according to the holding size.
Bundling the underlying assets together can create a security that is rated higher than wouldbe the case for any of the individual assets. This process may be further enhanced by splittingthe pool of assets into two, three or more securities with different risk profiles, the most securetranche often being rated ‘AAA’.
Example 4.13
A large pool of mortgages has been securitized as follows:
Interest PrincipalTranche A Paid on principal outstanding Receives all scheduled and
prepayment of principaluntil completely paid off
Tranche B Paid on principal outstanding After tranche A, receives allscheduled and prepaymentof principal until completelypaid off
Tranche C Paid on principal outstanding After tranche B, receives allscheduled and prepaymentof principal
In the above example, tranche A obviously has the shortest expected life and should be the mostsecure. Tranche C has the longest life and is the least secure, as any default on the underlying
JWBK090-04 JWBK090/Brown March 3, 2006 14:1 Char Count= 0
Bond Options and Variants 75
assets is met in the first case by tranche C. To compensate for this tranche A is often issuedwith a lower coupon than tranche B, whose coupon is less than that of tranche C.
There are, of course, many different methods of splitting the anticipated returns betweenthe different tranches. For example, with a ‘stripped mortgage-backed security’ one tranche isentitled to all the interest payments, whereas the other tranche is entitled to all the principalrepayments.
4.7 BONDS WITH CONDITIONAL COUPON CHANGES
In the late 1990s a number of companies wanted to raise very large amounts of debt relative totheir size. In order to make the debt more palatable to the market they issued it with a couponthat would be automatically increased if the major credit companies downgraded the debt tobelow a specific rating. Most, but not all, of the companies issuing bonds with conditionalcoupon changes were in the telecoms sector, where the debt was used to buy 3G mobiletelephone licences.
Example 4.14 British Telecommunications plc 7 12 % Notes 2016
In February 2001 the company issued £700 million of the notes at 99.113. The bonds if notpreviously called are redeemable on 7 December 2016 at 100. They pay interest annuallyon 7 December.
The coupon rate will be reset and increased by 14
% for each reduction in the credit ratingof the borrower made by Standard & Poor or Moody from their original ratings of A- andA3 respectively. Should there be any subsequent improvement in the rating then the couponwill be reduced by 1
4%, but in no circumstances will the coupon be reduced to below 7 1
2%.
The bonds are also callable from 15 February 2001 at 100.
In a number of cases the bonds were downgraded, which automatically caused the couponsto be increased.
4.8 REVERSE FLOATERS
An interesting variation on floating-rate notes is the concept of ‘reverse floating-rate notes’.From a technical point of view they behave in a similar way to ordinary floating-rate notes,except that now the coupon rate is set to a fixed amount less the reference indicator rate.However, this means that the reference coupon rate is no longer related to the current marketrates, with the result that the price, unlike normal floating-rate notes, can and does move somedistance from par.
Example 4.15
Consider a reverse floating-rate note that pays monthly coupons of 8 % minus the LIBORrate for one month sterling deposits. Hence if the LIBOR rate is 5 %, it will pay interest atthe annual rate of (8 − 5) = 3 %. If LIBOR decreases to 4 %, the payment will increase to(8 − 4) = 4 %.
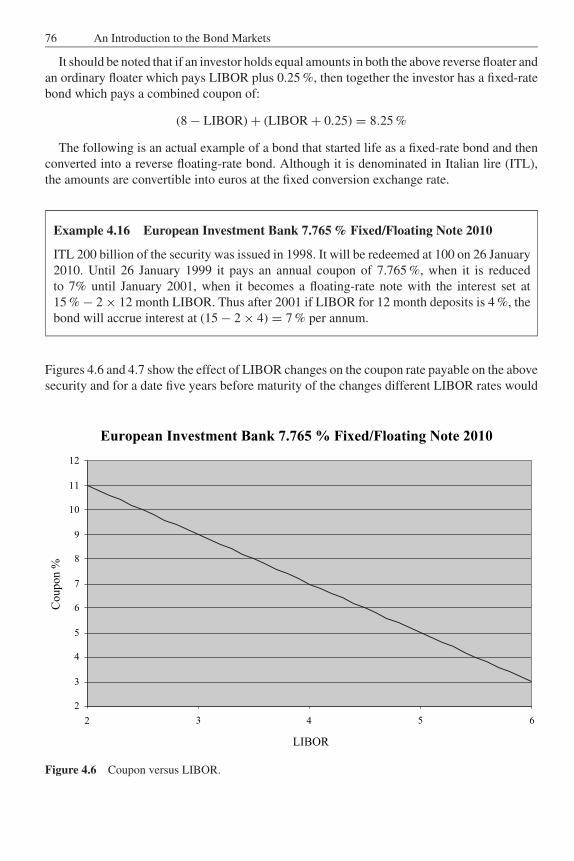
JWBK090-04 JWBK090/Brown March 3, 2006 14:1 Char Count= 0
76 An Introduction to the Bond Markets
It should be noted that if an investor holds equal amounts in both the above reverse floater andan ordinary floater which pays LIBOR plus 0.25 %, then together the investor has a fixed-ratebond which pays a combined coupon of:
(8 − LIBOR) + (LIBOR + 0.25) = 8.25 %
The following is an actual example of a bond that started life as a fixed-rate bond and thenconverted into a reverse floating-rate bond. Although it is denominated in Italian lire (ITL),the amounts are convertible into euros at the fixed conversion exchange rate.
Example 4.16 European Investment Bank 7.765 % Fixed/Floating Note 2010
ITL 200 billion of the security was issued in 1998. It will be redeemed at 100 on 26 January2010. Until 26 January 1999 it pays an annual coupon of 7.765 %, when it is reducedto 7% until January 2001, when it becomes a floating-rate note with the interest set at15 % − 2 × 12 month LIBOR. Thus after 2001 if LIBOR for 12 month deposits is 4 %, thebond will accrue interest at (15 − 2 × 4) = 7 % per annum.
Figures 4.6 and 4.7 show the effect of LIBOR changes on the coupon rate payable on the abovesecurity and for a date five years before maturity of the changes different LIBOR rates would
European Investment Bank 7.765 % Fixed/Floating Note 2010
2
3
4
5
6
7
8
9
10
11
12
2 4
LIBOR
Co
up
on
%
3 5 6
Figure 4.6 Coupon versus LIBOR.
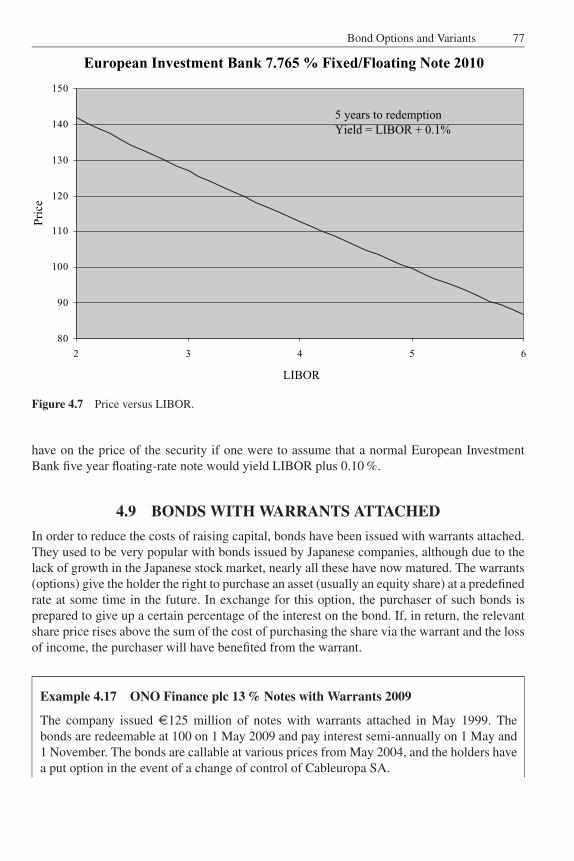
JWBK090-04 JWBK090/Brown March 3, 2006 14:1 Char Count= 0
Bond Options and Variants 77
European Investment Bank 7.765 % Fixed/Floating Note 2010
80
90
100
110
120
130
140
150
2 43 65
LIBOR
Pri
ce
5 years to redemption
Yield = LIBOR + 0.1%
Figure 4.7 Price versus LIBOR.
have on the price of the security if one were to assume that a normal European InvestmentBank five year floating-rate note would yield LIBOR plus 0.10 %.
4.9 BONDS WITH WARRANTS ATTACHED
In order to reduce the costs of raising capital, bonds have been issued with warrants attached.They used to be very popular with bonds issued by Japanese companies, although due to thelack of growth in the Japanese stock market, nearly all these have now matured. The warrants(options) give the holder the right to purchase an asset (usually an equity share) at a predefinedrate at some time in the future. In exchange for this option, the purchaser of such bonds isprepared to give up a certain percentage of the interest on the bond. If, in return, the relevantshare price rises above the sum of the cost of purchasing the share via the warrant and the lossof income, the purchaser will have benefited from the warrant.
Example 4.17 ONO Finance plc 13 % Notes with Warrants 2009
The company issued €125 million of notes with warrants attached in May 1999. Thebonds are redeemable at 100 on 1 May 2009 and pay interest semi-annually on 1 May and1 November. The bonds are callable at various prices from May 2004, and the holders havea put option in the event of a change of control of Cableuropa SA.
JWBK090-04 JWBK090/Brown March 3, 2006 14:1 Char Count= 0
78 An Introduction to the Bond Markets
Each note was issued with one equity value certificate, which entitles the holder to receivea cash payment equal to the value of 0.002 244 131 6 shares of Cableuropa SA on the earlierof an initial public offering or a takeover of Cableuropa SA or 1 May 2009.
Example 4.18 Dow Mining Company Ltd 4 58 % Notes with Warrants 1997–2001
$50 million of the bond was issued at 100 in April 1997. It was guaranteed by the IndustrialBank of Japan and was due for redemption on 24 April 2001. The notes were issued inbearer form with a nominal value of $10 000.
Each note had two warrants attached, which entitled the holder to purchase JPY 633 750of common stock of Dow Mining Company Ltd at JPY 395 per share from 8 May 1997 to17 April 2001.
Bonds with warrants were often traded initially with the warrants attached, but after a shortperiod the warrants were detached and were traded separately.
The warrant, which is just an option, usually has some value even if the ‘exercise price’of purchasing the asset with the warrant is more expensive than purchasing it directly. Thisis because the market factors in the possibility that the price of the underlying asset mightincrease above the exercise price before the expiry of the warrant. If the warrant’s exerciseprice is less than the current price of the relevant asset, then the difference is referred to as its‘intrinsic value’.
Example 4.19
If the warrant entitles the issuer to purchase one share at a price of 50 and the share iscurrently trading at 65, then its intrinsic value is 15.
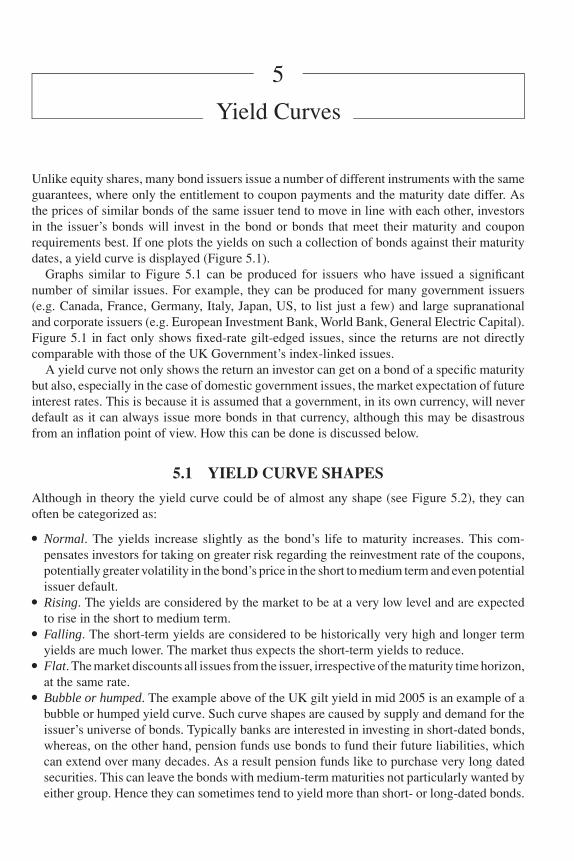
JWBK090-05 JWBK090/Brown March 1, 2006 9:49 Char Count= 0
5
Yield Curves
Unlike equity shares, many bond issuers issue a number of different instruments with the sameguarantees, where only the entitlement to coupon payments and the maturity date differ. Asthe prices of similar bonds of the same issuer tend to move in line with each other, investorsin the issuer’s bonds will invest in the bond or bonds that meet their maturity and couponrequirements best. If one plots the yields on such a collection of bonds against their maturitydates, a yield curve is displayed (Figure 5.1).
Graphs similar to Figure 5.1 can be produced for issuers who have issued a significantnumber of similar issues. For example, they can be produced for many government issuers(e.g. Canada, France, Germany, Italy, Japan, US, to list just a few) and large supranationaland corporate issuers (e.g. European Investment Bank, World Bank, General Electric Capital).Figure 5.1 in fact only shows fixed-rate gilt-edged issues, since the returns are not directlycomparable with those of the UK Government’s index-linked issues.
A yield curve not only shows the return an investor can get on a bond of a specific maturitybut also, especially in the case of domestic government issues, the market expectation of futureinterest rates. This is because it is assumed that a government, in its own currency, will neverdefault as it can always issue more bonds in that currency, although this may be disastrousfrom an inflation point of view. How this can be done is discussed below.
5.1 YIELD CURVE SHAPES
Although in theory the yield curve could be of almost any shape (see Figure 5.2), they canoften be categorized as:� Normal. The yields increase slightly as the bond’s life to maturity increases. This com-
pensates investors for taking on greater risk regarding the reinvestment rate of the coupons,potentially greater volatility in the bond’s price in the short to medium term and even potentialissuer default.� Rising. The yields are considered by the market to be at a very low level and are expectedto rise in the short to medium term.� Falling. The short-term yields are considered to be historically very high and longer termyields are much lower. The market thus expects the short-term yields to reduce.� Flat. The market discounts all issues from the issuer, irrespective of the maturity time horizon,at the same rate.� Bubble or humped. The example above of the UK gilt yield in mid 2005 is an example of abubble or humped yield curve. Such curve shapes are caused by supply and demand for theissuer’s universe of bonds. Typically banks are interested in investing in short-dated bonds,whereas, on the other hand, pension funds use bonds to fund their future liabilities, whichcan extend over many decades. As a result pension funds like to purchase very long datedsecurities. This can leave the bonds with medium-term maturities not particularly wanted byeither group. Hence they can sometimes tend to yield more than short- or long-dated bonds.
79
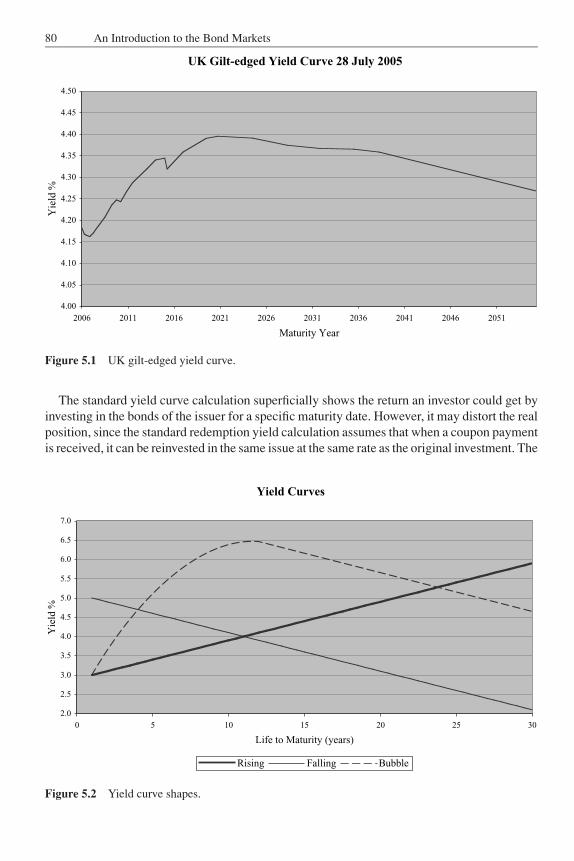
JWBK090-05 JWBK090/Brown March 1, 2006 9:49 Char Count= 0
80 An Introduction to the Bond Markets
UK Gilt-edged Yield Curve 28 July 2005
4.00
4.05
4.10
4.15
4.20
4.25
4.30
4.35
4.40
4.45
4.50
2006 2011 2016 2021 2026 2031 2036 2041 2046 2051
Maturity Year
Yie
ld %
Figure 5.1 UK gilt-edged yield curve.
The standard yield curve calculation superficially shows the return an investor could get byinvesting in the bonds of the issuer for a specific maturity date. However, it may distort the realposition, since the standard redemption yield calculation assumes that when a coupon paymentis received, it can be reinvested in the same issue at the same rate as the original investment. The
Yield Curves
2.0
2.5
3.0
3.5
4.0
4.5
5.0
5.5
6.0
6.5
7.0
0 5 10 15 20 25 30
Life to Maturity (years)
Yie
ld %
Rising Falling Bubble
Figure 5.2 Yield curve shapes.
JWBK090-05 JWBK090/Brown March 1, 2006 9:49 Char Count= 0
Yield Curves 81
yield curve calculation does not allow for bonds with differing coupons, which have differentdurations for the same maturity date.
The coupon reinvestment problem can be illustrated by the following example with a slightlyincreasing yield curve, which is a fairly common shape.
Example 5.1
All the bonds of the issuer pay annual coupons and sit on the issuer’s yield curve. This yieldcurve increases by 0.1 % for each year of life. The yield for a one year bond is 4.0 %. A fiveyear bond paying an annual coupon sitting on the yield curve will thus yield 4.4 %.
If you assume, albeit unlikely, that the yield curve does not move over the life of the bondand ignore all transaction expenses, then we have the following scenario:
Life of bond Reinvestment rate on coupon5 years 4.4 %4 years 4.3 %3 years 4.2 %2 years 4.1 %1 year 4.0 %
The total return on a five year bond, assuming it is not a zero-coupon one, is thus obviouslyless than the expected 4.4 %, as the coupon cannot be reinvested at 4.4 %.
The position can be further distorted if the yield curve includes issues with significantlydiffering annual coupon rates.
Example 5.2
Consider an issuer who has two outstanding issues both redeemed in 10 years’ time: one witha 10 % annual coupon yielding 5.00 % and the other a zero-coupon bond yielding 5.25 %.Superficially if you plot the yield against maturity for the two bonds the zero-coupon bondlooks cheap. However, the duration (average time to getting one’s money back in interestand capital repayments, after discounting the amounts by the redemption yield rate) of the10 % bond is 7.270 years compared with 10 years for the zero-coupon bond.
It is then necessary to look at the shape of the issuer’s yield curve to determine the expectedreinvestment returns on the coupon payments of the 10 % bond, before it is possible to assesswhich of the bonds is cheapest.
This potential problem can be overcome by instead using the data of the individual bondsto construct a zero-coupon or spot yield curve. Such a curve measures the implied return youwould get on a theoretical zero-coupon bond with each maturity date. From the spot yieldcurve, it is also possible to calculate both par and forward yield curves in a straightforwardway. These are discussed below.
JWBK090-05 JWBK090/Brown March 1, 2006 9:49 Char Count= 0
82 An Introduction to the Bond Markets
5.2 ZERO-COUPON OR SPOT YIELD CURVES
The problems of investors not being able to reinvest the coupon payments in the bond at thebond’s original redemption yield and that of comparing bonds with different coupons can beremoved if you only consider zero-coupon bonds. Unfortunately there are very few, if any,issuers who have issued a sufficient number of similar zero-coupon bonds with an adequatedistribution of redemption dates or have bond strips of an appropriate size and liquidity.
It is not possible to calculate a spot (or zero-coupon) yield curve directly from a redemptionyield curve as the calculation needs additional information about the individual bonds on whichthe curve is based. In particular, it needs to have details about the cash flows of all the bonds.In order to solve this problem, theoretical zero-coupon bonds are constructed for the issuerfrom the issuer’s normal coupon bonds.
Each coupon bond can be regarded as a combination of several zero-coupon bonds withdifferent maturity dates. This is simply the process that occurs when a bond is stripped.
Example 5.3
$1000 of a bond that is redeemed at par in 5 years’ time and pays an annual coupon of 5 %can, if one ignores any tax considerations, be regarded as:
$50 of a zero-coupon bond that matures in 1 year$50 of a zero-coupon bond that matures in 2 years$50 of a zero-coupon bond that matures in 3 years$50 of a zero-coupon bond that matures in 4 years and$1050 of a zero-coupon bond that matures in 5 years
The method of constructing the zero-coupon or spot1 yield curve is to consider in turn each ofthe relevant bonds in the order of their life to maturity.
With the shortest bond, all of its cash flows, including the redemption payment, are con-sidered to yield the same as its redemption yield. We will call this y1. The next shortest bondis then considered. It is first split into its constituent zero-coupon components. All those cashflows with a life of less than that of the shortest bond are assumed to have the same yield as theshortest bond, i.e. y1. The remaining cash flows are then assumed to have a yield of y2, wherey2 is calculated in such a way that the dirty price of the bond is just the sum of its future cashflows discounted now by a combination of y1 and y2. This is just a variation of the definitionof a redemption yield, which states that the redemption yield is the discount rate that makesthe dirty price equal to the sum of all the discounted future cash flows.
The process is then repeated for the third bond, using yields y1 and y2, calculating a newdiscount rate y3 for the cash flows paid after the redemption of the second bond. Subsequentbonds are treated in the same way. As a result a series of yields y1, y2, . . . , yn are created fordifferent periods. These are just the components of the zero-coupon yield curve.
It is worthwhile pointing out that as the bonds that make up a yield curve may be traded onthe open market and there is no restriction on what the investor does with the coupon payments,it is not possible for an investor to get a greater return from reinvesting the coupon payment
1 A spot interest rate for a period n is the yield you get from investing in an instrument that does not give you any return until theend of the period n when it is redeemed, i.e. it is the yield on a zero-coupon bond of life n.
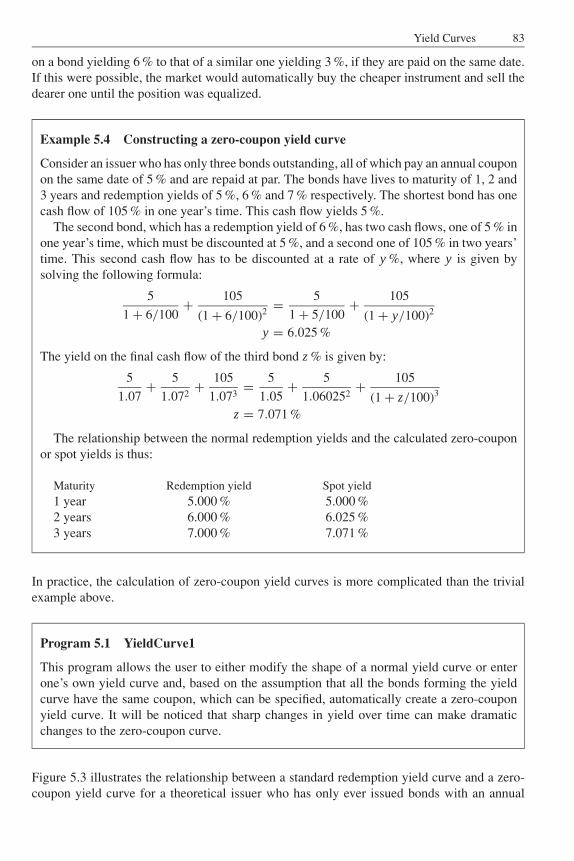
JWBK090-05 JWBK090/Brown March 1, 2006 9:49 Char Count= 0
Yield Curves 83
on a bond yielding 6 % to that of a similar one yielding 3 %, if they are paid on the same date.If this were possible, the market would automatically buy the cheaper instrument and sell thedearer one until the position was equalized.
Example 5.4 Constructing a zero-coupon yield curve
Consider an issuer who has only three bonds outstanding, all of which pay an annual couponon the same date of 5 % and are repaid at par. The bonds have lives to maturity of 1, 2 and3 years and redemption yields of 5 %, 6 % and 7 % respectively. The shortest bond has onecash flow of 105 % in one year’s time. This cash flow yields 5 %.
The second bond, which has a redemption yield of 6 %, has two cash flows, one of 5 % inone year’s time, which must be discounted at 5 %, and a second one of 105 % in two years’time. This second cash flow has to be discounted at a rate of y %, where y is given bysolving the following formula:
5
1 + 6/100+ 105
(1 + 6/100)2 = 5
1 + 5/100+ 105
(1 + y/100)2
y = 6.025 %
The yield on the final cash flow of the third bond z % is given by:
5
1.07+ 5
1.072+ 105
1.073= 5
1.05+ 5
1.060252+ 105
(1 + z/100)3
z = 7.071 %
The relationship between the normal redemption yields and the calculated zero-couponor spot yields is thus:
Maturity Redemption yield Spot yield1 year 5.000 % 5.000 %2 years 6.000 % 6.025 %3 years 7.000 % 7.071 %
In practice, the calculation of zero-coupon yield curves is more complicated than the trivialexample above.
Program 5.1 YieldCurve1
This program allows the user to either modify the shape of a normal yield curve or enterone’s own yield curve and, based on the assumption that all the bonds forming the yieldcurve have the same coupon, which can be specified, automatically create a zero-couponyield curve. It will be noticed that sharp changes in yield over time can make dramaticchanges to the zero-coupon curve.
Figure 5.3 illustrates the relationship between a standard redemption yield curve and a zero-coupon yield curve for a theoretical issuer who has only ever issued bonds with an annual
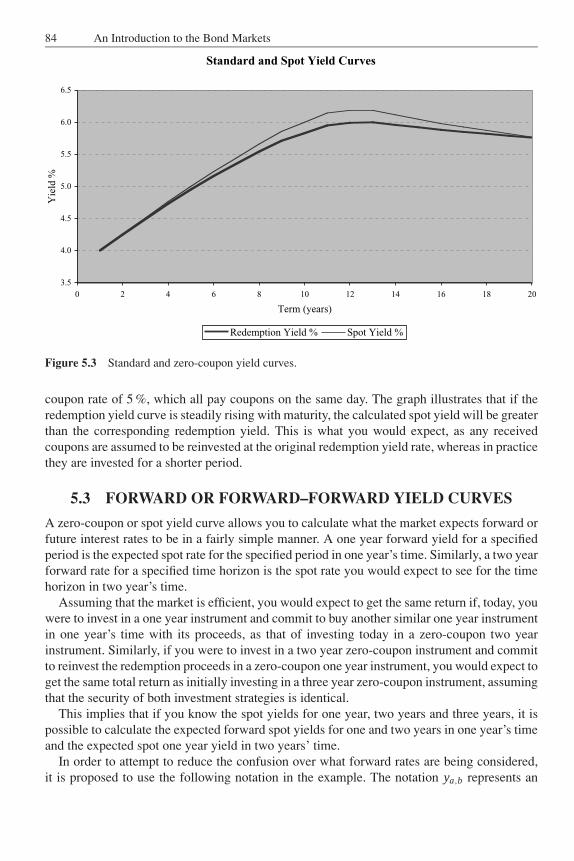
JWBK090-05 JWBK090/Brown March 1, 2006 9:49 Char Count= 0
84 An Introduction to the Bond Markets
Standard and Spot Yield Curves
3.5
4.0
4.5
5.0
5.5
6.0
6.5
0 2 4 6 8 10 12 14 16 18 20
Term (years)
Yie
ld %
Redemption Yield % Spot Yield %
Figure 5.3 Standard and zero-coupon yield curves.
coupon rate of 5 %, which all pay coupons on the same day. The graph illustrates that if theredemption yield curve is steadily rising with maturity, the calculated spot yield will be greaterthan the corresponding redemption yield. This is what you would expect, as any receivedcoupons are assumed to be reinvested at the original redemption yield rate, whereas in practicethey are invested for a shorter period.
5.3 FORWARD OR FORWARD–FORWARD YIELD CURVES
A zero-coupon or spot yield curve allows you to calculate what the market expects forward orfuture interest rates to be in a fairly simple manner. A one year forward yield for a specifiedperiod is the expected spot rate for the specified period in one year’s time. Similarly, a two yearforward rate for a specified time horizon is the spot rate you would expect to see for the timehorizon in two year’s time.
Assuming that the market is efficient, you would expect to get the same return if, today, youwere to invest in a one year instrument and commit to buy another similar one year instrumentin one year’s time with its proceeds, as that of investing today in a zero-coupon two yearinstrument. Similarly, if you were to invest in a two year zero-coupon instrument and committo reinvest the redemption proceeds in a zero-coupon one year instrument, you would expect toget the same total return as initially investing in a three year zero-coupon instrument, assumingthat the security of both investment strategies is identical.
This implies that if you know the spot yields for one year, two years and three years, it ispossible to calculate the expected forward spot yields for one and two years in one year’s timeand the expected spot one year yield in two years’ time.
In order to attempt to reduce the confusion over what forward rates are being considered,it is proposed to use the following notation in the example. The notation ya,b represents an
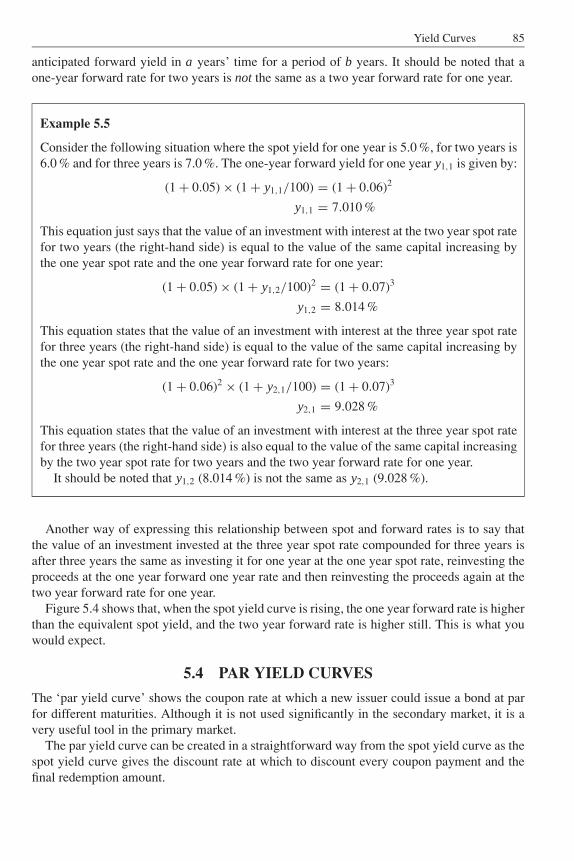
JWBK090-05 JWBK090/Brown March 1, 2006 9:49 Char Count= 0
Yield Curves 85
anticipated forward yield in a years’ time for a period of b years. It should be noted that aone-year forward rate for two years is not the same as a two year forward rate for one year.
Example 5.5
Consider the following situation where the spot yield for one year is 5.0 %, for two years is6.0 % and for three years is 7.0 %. The one-year forward yield for one year y1,1 is given by:
(1 + 0.05) × (1 + y1,1/100) = (1 + 0.06)2
y1,1 = 7.010 %
This equation just says that the value of an investment with interest at the two year spot ratefor two years (the right-hand side) is equal to the value of the same capital increasing bythe one year spot rate and the one year forward rate for one year:
(1 + 0.05) × (1 + y1,2/100)2 = (1 + 0.07)3
y1,2 = 8.014 %
This equation states that the value of an investment with interest at the three year spot ratefor three years (the right-hand side) is equal to the value of the same capital increasing bythe one year spot rate and the one year forward rate for two years:
(1 + 0.06)2 × (1 + y2,1/100) = (1 + 0.07)3
y2,1 = 9.028 %
This equation states that the value of an investment with interest at the three year spot ratefor three years (the right-hand side) is also equal to the value of the same capital increasingby the two year spot rate for two years and the two year forward rate for one year.
It should be noted that y1,2 (8.014 %) is not the same as y2,1 (9.028 %).
Another way of expressing this relationship between spot and forward rates is to say thatthe value of an investment invested at the three year spot rate compounded for three years isafter three years the same as investing it for one year at the one year spot rate, reinvesting theproceeds at the one year forward one year rate and then reinvesting the proceeds again at thetwo year forward rate for one year.
Figure 5.4 shows that, when the spot yield curve is rising, the one year forward rate is higherthan the equivalent spot yield, and the two year forward rate is higher still. This is what youwould expect.
5.4 PAR YIELD CURVES
The ‘par yield curve’ shows the coupon rate at which a new issuer could issue a bond at parfor different maturities. Although it is not used significantly in the secondary market, it is avery useful tool in the primary market.
The par yield curve can be created in a straightforward way from the spot yield curve as thespot yield curve gives the discount rate at which to discount every coupon payment and thefinal redemption amount.
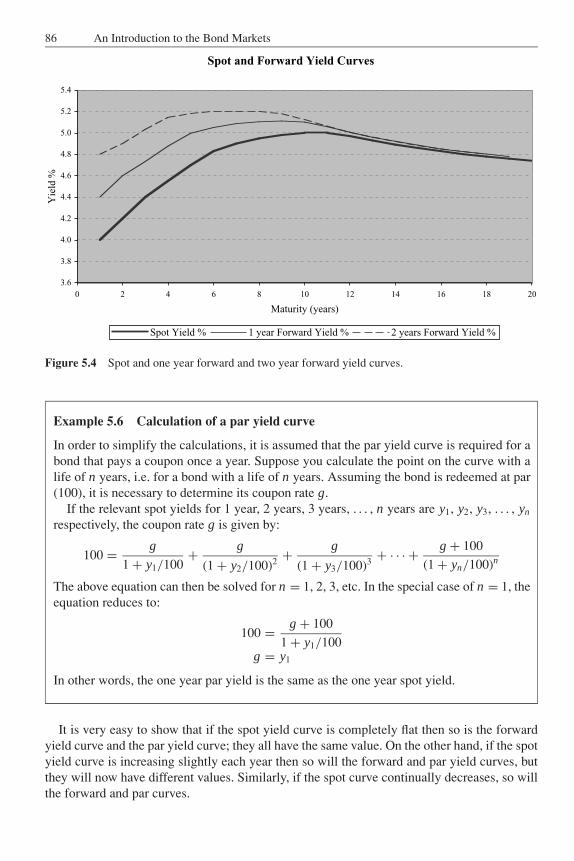
JWBK090-05 JWBK090/Brown March 1, 2006 9:49 Char Count= 0
86 An Introduction to the Bond Markets
Spot and Forward Yield Curves
3.6
3.8
4.0
4.2
4.4
4.6
4.8
5.0
5.2
5.4
0 2 4 6 8 10 12 14 16 18 20
Maturity (years)
Yie
ld %
Spot Yield % 1 year Forward Yield % 2 years Forward Yield %
Figure 5.4 Spot and one year forward and two year forward yield curves.
Example 5.6 Calculation of a par yield curve
In order to simplify the calculations, it is assumed that the par yield curve is required for abond that pays a coupon once a year. Suppose you calculate the point on the curve with alife of n years, i.e. for a bond with a life of n years. Assuming the bond is redeemed at par(100), it is necessary to determine its coupon rate g.
If the relevant spot yields for 1 year, 2 years, 3 years, . . . , n years are y1, y2, y3, . . . , yn
respectively, the coupon rate g is given by:
100 = g
1 + y1/100+ g
(1 + y2/100)2 + g
(1 + y3/100)3 + · · · + g + 100
(1 + yn/100)n
The above equation can then be solved for n = 1, 2, 3, etc. In the special case of n = 1, theequation reduces to:
100 = g + 100
1 + y1/100g = y1
In other words, the one year par yield is the same as the one year spot yield.
It is very easy to show that if the spot yield curve is completely flat then so is the forwardyield curve and the par yield curve; they all have the same value. On the other hand, if the spotyield curve is increasing slightly each year then so will the forward and par yield curves, butthey will now have different values. Similarly, if the spot curve continually decreases, so willthe forward and par curves.
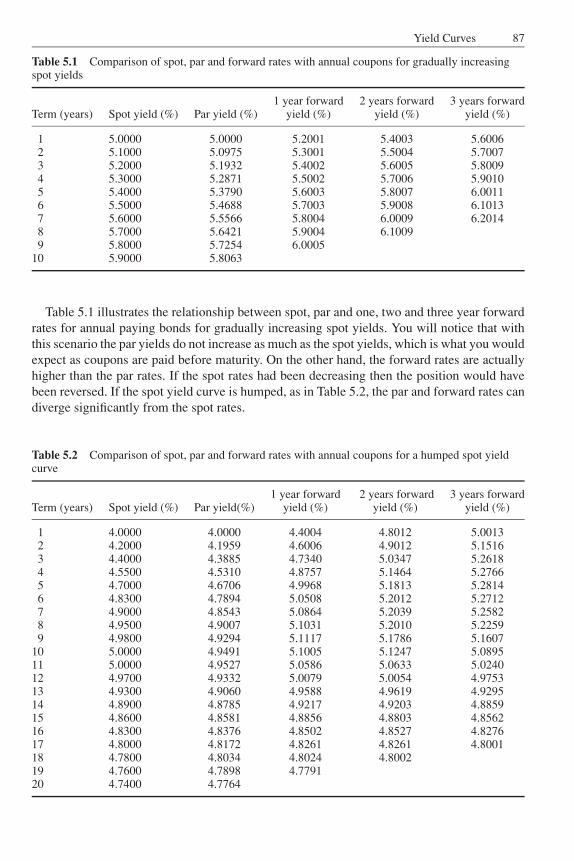
JWBK090-05 JWBK090/Brown March 1, 2006 9:49 Char Count= 0
Yield Curves 87
Table 5.1 Comparison of spot, par and forward rates with annual coupons for gradually increasingspot yields
1 year forward 2 years forward 3 years forwardTerm (years) Spot yield (%) Par yield (%) yield (%) yield (%) yield (%)
1 5.0000 5.0000 5.2001 5.4003 5.60062 5.1000 5.0975 5.3001 5.5004 5.70073 5.2000 5.1932 5.4002 5.6005 5.80094 5.3000 5.2871 5.5002 5.7006 5.90105 5.4000 5.3790 5.6003 5.8007 6.00116 5.5000 5.4688 5.7003 5.9008 6.10137 5.6000 5.5566 5.8004 6.0009 6.20148 5.7000 5.6421 5.9004 6.10099 5.8000 5.7254 6.0005
10 5.9000 5.8063
Table 5.1 illustrates the relationship between spot, par and one, two and three year forwardrates for annual paying bonds for gradually increasing spot yields. You will notice that withthis scenario the par yields do not increase as much as the spot yields, which is what you wouldexpect as coupons are paid before maturity. On the other hand, the forward rates are actuallyhigher than the par rates. If the spot rates had been decreasing then the position would havebeen reversed. If the spot yield curve is humped, as in Table 5.2, the par and forward rates candiverge significantly from the spot rates.
Table 5.2 Comparison of spot, par and forward rates with annual coupons for a humped spot yieldcurve
1 year forward 2 years forward 3 years forwardTerm (years) Spot yield (%) Par yield(%) yield (%) yield (%) yield (%)
1 4.0000 4.0000 4.4004 4.8012 5.00132 4.2000 4.1959 4.6006 4.9012 5.15163 4.4000 4.3885 4.7340 5.0347 5.26184 4.5500 4.5310 4.8757 5.1464 5.27665 4.7000 4.6706 4.9968 5.1813 5.28146 4.8300 4.7894 5.0508 5.2012 5.27127 4.9000 4.8543 5.0864 5.2039 5.25828 4.9500 4.9007 5.1031 5.2010 5.22599 4.9800 4.9294 5.1117 5.1786 5.1607
10 5.0000 4.9491 5.1005 5.1247 5.089511 5.0000 4.9527 5.0586 5.0633 5.024012 4.9700 4.9332 5.0079 5.0054 4.975313 4.9300 4.9060 4.9588 4.9619 4.929514 4.8900 4.8785 4.9217 4.9203 4.885915 4.8600 4.8581 4.8856 4.8803 4.856216 4.8300 4.8376 4.8502 4.8527 4.827617 4.8000 4.8172 4.8261 4.8261 4.800118 4.7800 4.8034 4.8024 4.800219 4.7600 4.7898 4.779120 4.7400 4.7764
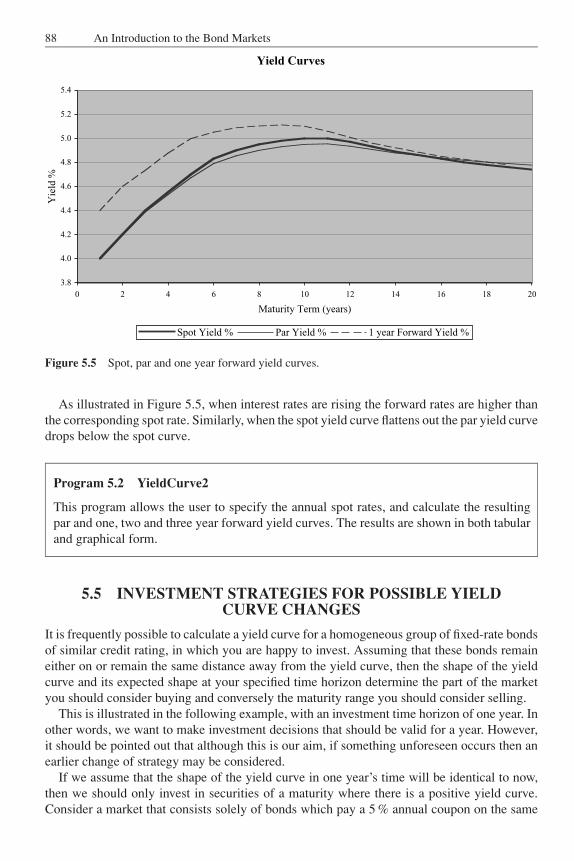
JWBK090-05 JWBK090/Brown March 1, 2006 9:49 Char Count= 0
88 An Introduction to the Bond Markets
Yield Curves
3.8
4.0
4.2
4.4
4.6
4.8
5.0
5.2
5.4
0 2 4 6 8 10 12 14 16 18 20
Maturity Term (years)
Yie
ld %
Spot Yield % Par Yield % 1 year Forward Yield %
Figure 5.5 Spot, par and one year forward yield curves.
As illustrated in Figure 5.5, when interest rates are rising the forward rates are higher thanthe corresponding spot rate. Similarly, when the spot yield curve flattens out the par yield curvedrops below the spot curve.
Program 5.2 YieldCurve2
This program allows the user to specify the annual spot rates, and calculate the resultingpar and one, two and three year forward yield curves. The results are shown in both tabularand graphical form.
5.5 INVESTMENT STRATEGIES FOR POSSIBLE YIELDCURVE CHANGES
It is frequently possible to calculate a yield curve for a homogeneous group of fixed-rate bondsof similar credit rating, in which you are happy to invest. Assuming that these bonds remaineither on or remain the same distance away from the yield curve, then the shape of the yieldcurve and its expected shape at your specified time horizon determine the part of the marketyou should consider buying and conversely the maturity range you should consider selling.
This is illustrated in the following example, with an investment time horizon of one year. Inother words, we want to make investment decisions that should be valid for a year. However,it should be pointed out that although this is our aim, if something unforeseen occurs then anearlier change of strategy may be considered.
If we assume that the shape of the yield curve in one year’s time will be identical to now,then we should only invest in securities of a maturity where there is a positive yield curve.Consider a market that consists solely of bonds which pay a 5 % annual coupon on the same
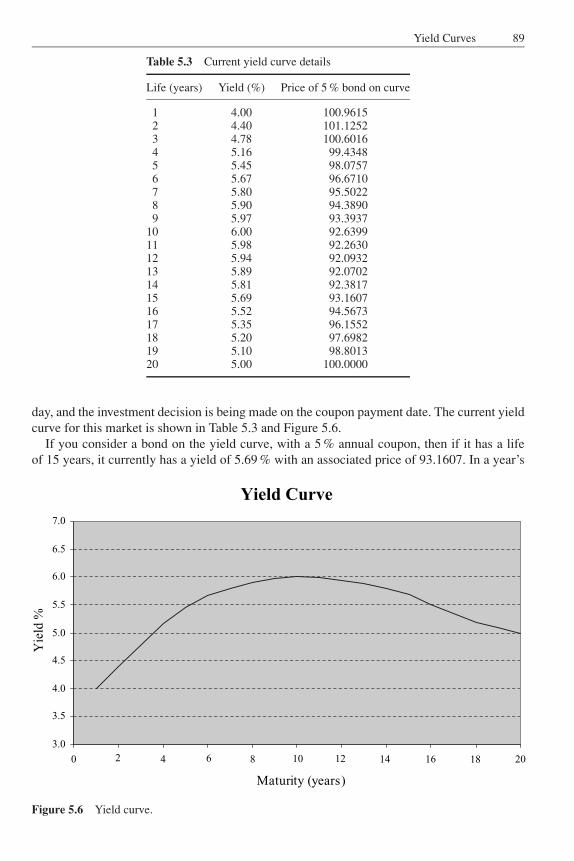
JWBK090-05 JWBK090/Brown March 1, 2006 9:49 Char Count= 0
Yield Curves 89
Table 5.3 Current yield curve details
Life (years) Yield (%) Price of 5 % bond on curve
1 4.00 100.96152 4.40 101.12523 4.78 100.60164 5.16 99.43485 5.45 98.07576 5.67 96.67107 5.80 95.50228 5.90 94.38909 5.97 93.3937
10 6.00 92.639911 5.98 92.263012 5.94 92.093213 5.89 92.070214 5.81 92.381715 5.69 93.160716 5.52 94.567317 5.35 96.155218 5.20 97.698219 5.10 98.801320 5.00 100.0000
day, and the investment decision is being made on the coupon payment date. The current yieldcurve for this market is shown in Table 5.3 and Figure 5.6.
If you consider a bond on the yield curve, with a 5 % annual coupon, then if it has a lifeof 15 years, it currently has a yield of 5.69 % with an associated price of 93.1607. In a year’s
Yield Curve
3.0
3.5
4.0
4.5
5.0
5.5
6.0
6.5
7.0
0 4 8 10 12 14 16 18 20
Maturity (years)
Yie
ld %
2 6
Figure 5.6 Yield curve.
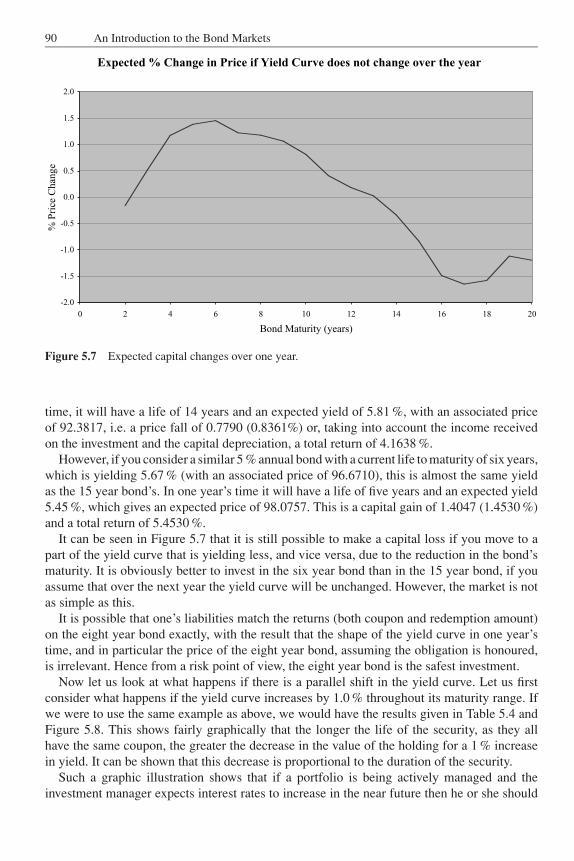
JWBK090-05 JWBK090/Brown March 1, 2006 9:49 Char Count= 0
90 An Introduction to the Bond Markets
Expected % Change in Price if Yield Curve does not change over the year
-2.0
-1.5
-1.0
-0.5
0.0
0.5
1.0
1.5
2.0
0 2 4 6 8 10 12 14 16 18 20
Bond Maturity (years)
% P
rice
Chan
ge
Figure 5.7 Expected capital changes over one year.
time, it will have a life of 14 years and an expected yield of 5.81 %, with an associated priceof 92.3817, i.e. a price fall of 0.7790 (0.8361%) or, taking into account the income receivedon the investment and the capital depreciation, a total return of 4.1638 %.
However, if you consider a similar 5 % annual bond with a current life to maturity of six years,which is yielding 5.67 % (with an associated price of 96.6710), this is almost the same yieldas the 15 year bond’s. In one year’s time it will have a life of five years and an expected yield5.45 %, which gives an expected price of 98.0757. This is a capital gain of 1.4047 (1.4530 %)and a total return of 5.4530 %.
It can be seen in Figure 5.7 that it is still possible to make a capital loss if you move to apart of the yield curve that is yielding less, and vice versa, due to the reduction in the bond’smaturity. It is obviously better to invest in the six year bond than in the 15 year bond, if youassume that over the next year the yield curve will be unchanged. However, the market is notas simple as this.
It is possible that one’s liabilities match the returns (both coupon and redemption amount)on the eight year bond exactly, with the result that the shape of the yield curve in one year’stime, and in particular the price of the eight year bond, assuming the obligation is honoured,is irrelevant. Hence from a risk point of view, the eight year bond is the safest investment.
Now let us look at what happens if there is a parallel shift in the yield curve. Let us firstconsider what happens if the yield curve increases by 1.0 % throughout its maturity range. Ifwe were to use the same example as above, we would have the results given in Table 5.4 andFigure 5.8. This shows fairly graphically that the longer the life of the security, as they allhave the same coupon, the greater the decrease in the value of the holding for a 1 % increasein yield. It can be shown that this decrease is proportional to the duration of the security.
Such a graphic illustration shows that if a portfolio is being actively managed and theinvestment manager expects interest rates to increase in the near future then he or she should
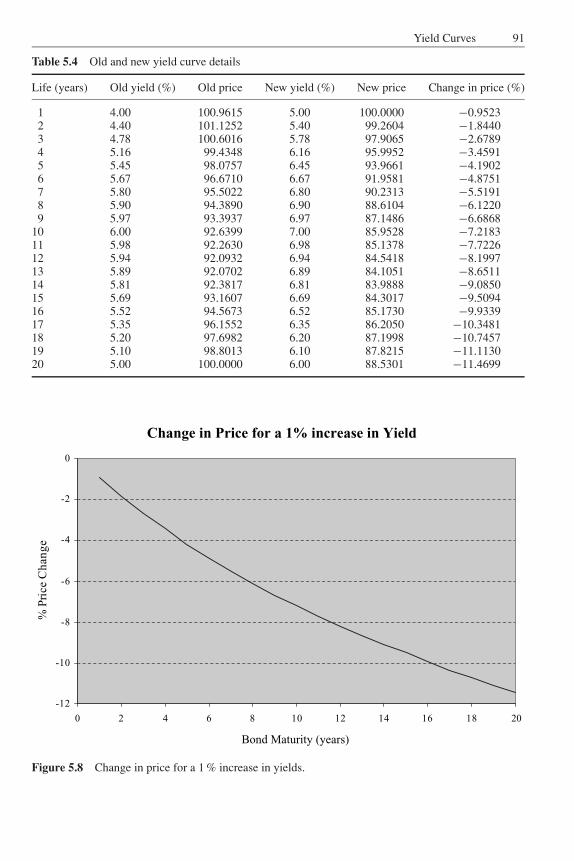
JWBK090-05 JWBK090/Brown March 1, 2006 9:49 Char Count= 0
Yield Curves 91
Table 5.4 Old and new yield curve details
Life (years) Old yield (%) Old price New yield (%) New price Change in price (%)
1 4.00 100.9615 5.00 100.0000 −0.95232 4.40 101.1252 5.40 99.2604 −1.84403 4.78 100.6016 5.78 97.9065 −2.67894 5.16 99.4348 6.16 95.9952 −3.45915 5.45 98.0757 6.45 93.9661 −4.19026 5.67 96.6710 6.67 91.9581 −4.87517 5.80 95.5022 6.80 90.2313 −5.51918 5.90 94.3890 6.90 88.6104 −6.12209 5.97 93.3937 6.97 87.1486 −6.6868
10 6.00 92.6399 7.00 85.9528 −7.218311 5.98 92.2630 6.98 85.1378 −7.722612 5.94 92.0932 6.94 84.5418 −8.199713 5.89 92.0702 6.89 84.1051 −8.651114 5.81 92.3817 6.81 83.9888 −9.085015 5.69 93.1607 6.69 84.3017 −9.509416 5.52 94.5673 6.52 85.1730 −9.933917 5.35 96.1552 6.35 86.2050 −10.348118 5.20 97.6982 6.20 87.1998 −10.745719 5.10 98.8013 6.10 87.8215 −11.113020 5.00 100.0000 6.00 88.5301 −11.4699
Change in Price for a 1% increase in Yield
-12
-10
-8
-6
-4
-2
0
0 2 4 6 8 10 12 14 16 18 20
Bond Maturity (years)
% P
rice
Ch
ang
e
Figure 5.8 Change in price for a 1 % increase in yields.
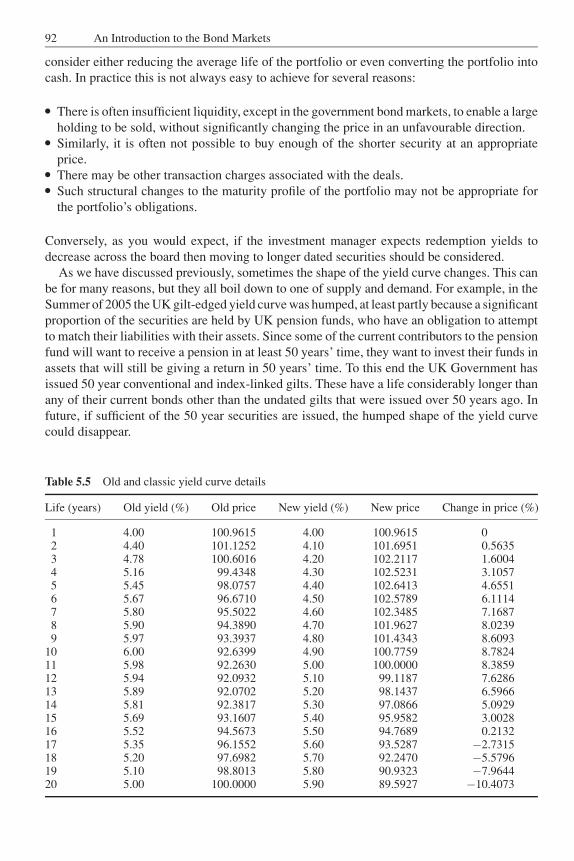
JWBK090-05 JWBK090/Brown March 1, 2006 9:49 Char Count= 0
92 An Introduction to the Bond Markets
consider either reducing the average life of the portfolio or even converting the portfolio intocash. In practice this is not always easy to achieve for several reasons:� There is often insufficient liquidity, except in the government bond markets, to enable a large
holding to be sold, without significantly changing the price in an unfavourable direction.� Similarly, it is often not possible to buy enough of the shorter security at an appropriateprice.� There may be other transaction charges associated with the deals.� Such structural changes to the maturity profile of the portfolio may not be appropriate forthe portfolio’s obligations.
Conversely, as you would expect, if the investment manager expects redemption yields todecrease across the board then moving to longer dated securities should be considered.
As we have discussed previously, sometimes the shape of the yield curve changes. This canbe for many reasons, but they all boil down to one of supply and demand. For example, in theSummer of 2005 the UK gilt-edged yield curve was humped, at least partly because a significantproportion of the securities are held by UK pension funds, who have an obligation to attemptto match their liabilities with their assets. Since some of the current contributors to the pensionfund will want to receive a pension in at least 50 years’ time, they want to invest their funds inassets that will still be giving a return in 50 years’ time. To this end the UK Government hasissued 50 year conventional and index-linked gilts. These have a life considerably longer thanany of their current bonds other than the undated gilts that were issued over 50 years ago. Infuture, if sufficient of the 50 year securities are issued, the humped shape of the yield curvecould disappear.
Table 5.5 Old and classic yield curve details
Life (years) Old yield (%) Old price New yield (%) New price Change in price (%)
1 4.00 100.9615 4.00 100.9615 02 4.40 101.1252 4.10 101.6951 0.56353 4.78 100.6016 4.20 102.2117 1.60044 5.16 99.4348 4.30 102.5231 3.10575 5.45 98.0757 4.40 102.6413 4.65516 5.67 96.6710 4.50 102.5789 6.11147 5.80 95.5022 4.60 102.3485 7.16878 5.90 94.3890 4.70 101.9627 8.02399 5.97 93.3937 4.80 101.4343 8.6093
10 6.00 92.6399 4.90 100.7759 8.782411 5.98 92.2630 5.00 100.0000 8.385912 5.94 92.0932 5.10 99.1187 7.628613 5.89 92.0702 5.20 98.1437 6.596614 5.81 92.3817 5.30 97.0866 5.092915 5.69 93.1607 5.40 95.9582 3.002816 5.52 94.5673 5.50 94.7689 0.213217 5.35 96.1552 5.60 93.5287 −2.731518 5.20 97.6982 5.70 92.2470 −5.579619 5.10 98.8013 5.80 90.9323 −7.964420 5.00 100.0000 5.90 89.5927 −10.4073
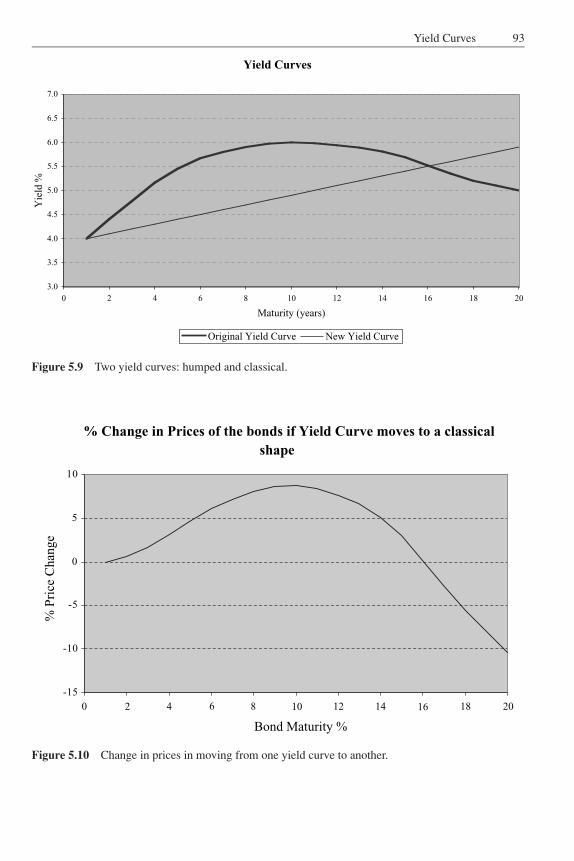
JWBK090-05 JWBK090/Brown March 1, 2006 9:49 Char Count= 0
Yield Curves 93
Yield Curves
3.0
3.5
4.0
4.5
5.0
5.5
6.0
6.5
7.0
0 2 4 6 8 10 12 14 16 18 20
Maturity (years)
Yie
ld %
Original Yield Curve New Yield Curve
Figure 5.9 Two yield curves: humped and classical.
% Change in Prices of the bonds if Yield Curve moves to a classical shape
-15
-10
-5
0
5
10
0 4 8 10 12 14 16 18 20
Bond Maturity %
% P
rice
Chan
ge
2 6
Figure 5.10 Change in prices in moving from one yield curve to another.
JWBK090-05 JWBK090/Brown March 1, 2006 9:49 Char Count= 0
94 An Introduction to the Bond Markets
Why would an investor who does not need to be protected against long-term liabilities wantto buy 30 year securities that yield less than 10 year securities with the same guarantees? Theinvestor could of course be taking a punt on long-term interest rates dropping in the short term.In such a case, a 30 year bond will appreciate more than a 10 year bond. Other than that, sucha decision has to be based on other expected structural changes to the market.
In principle, as we have discussed, we would expect over the long term for a yield curve torevert to the classical shape of increasing slightly over its life. Let us now consider the sameyield curve we discussed before, but assume that the yield curve moves to the classic shapeshown in Table 5.5 and Figures 5.9 and 5.10. This shows, as you would expect, that if youpredict that the hump in the middle of the yield curve is to disappear then it is best to invest inbonds with the same maturity as the hump.
Program 5.3 YieldCurve3
This program allows the user to enter the current yield curve in the market, make assumptionsabout its change in shape or enter a projected yield curve at a specified date in the future. Itthen displays the two yield curves and, for a specified coupon rate and payment frequency,the expected change in prices.
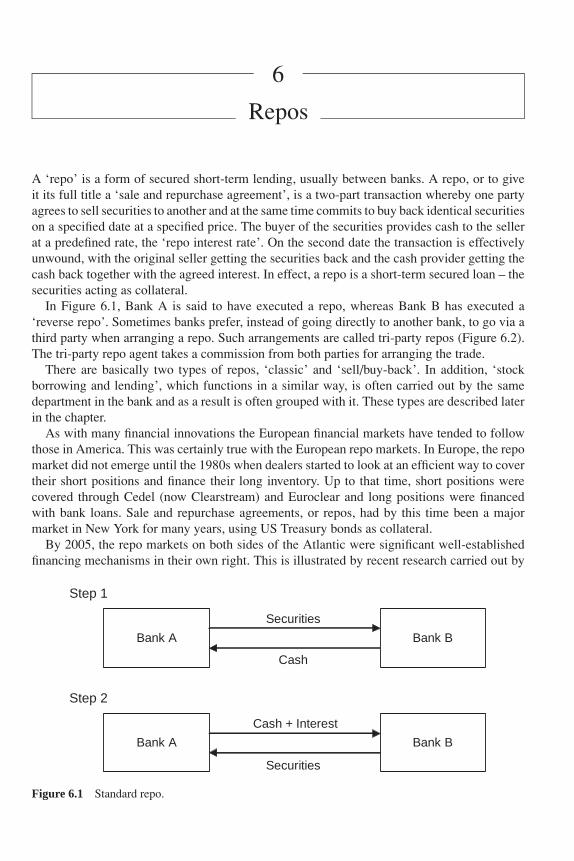
JWBK090-06 JWBK090/Brown March 4, 2006 1:45 Char Count= 0
6
Repos
A ‘repo’ is a form of secured short-term lending, usually between banks. A repo, or to giveit its full title a ‘sale and repurchase agreement’, is a two-part transaction whereby one partyagrees to sell securities to another and at the same time commits to buy back identical securitieson a specified date at a specified price. The buyer of the securities provides cash to the sellerat a predefined rate, the ‘repo interest rate’. On the second date the transaction is effectivelyunwound, with the original seller getting the securities back and the cash provider getting thecash back together with the agreed interest. In effect, a repo is a short-term secured loan – thesecurities acting as collateral.
In Figure 6.1, Bank A is said to have executed a repo, whereas Bank B has executed a‘reverse repo’. Sometimes banks prefer, instead of going directly to another bank, to go via athird party when arranging a repo. Such arrangements are called tri-party repos (Figure 6.2).The tri-party repo agent takes a commission from both parties for arranging the trade.
There are basically two types of repos, ‘classic’ and ‘sell/buy-back’. In addition, ‘stockborrowing and lending’, which functions in a similar way, is often carried out by the samedepartment in the bank and as a result is often grouped with it. These types are described laterin the chapter.
As with many financial innovations the European financial markets have tended to followthose in America. This was certainly true with the European repo markets. In Europe, the repomarket did not emerge until the 1980s when dealers started to look at an efficient way to covertheir short positions and finance their long inventory. Up to that time, short positions werecovered through Cedel (now Clearstream) and Euroclear and long positions were financedwith bank loans. Sale and repurchase agreements, or repos, had by this time been a majormarket in New York for many years, using US Treasury bonds as collateral.
By 2005, the repo markets on both sides of the Atlantic were significant well-establishedfinancing mechanisms in their own right. This is illustrated by recent research carried out by
Step 1
Bank A Bank B
Securities
Cash
Step 2
Bank A Bank B
Cash + Interest
Securities
Figure 6.1 Standard repo.
95
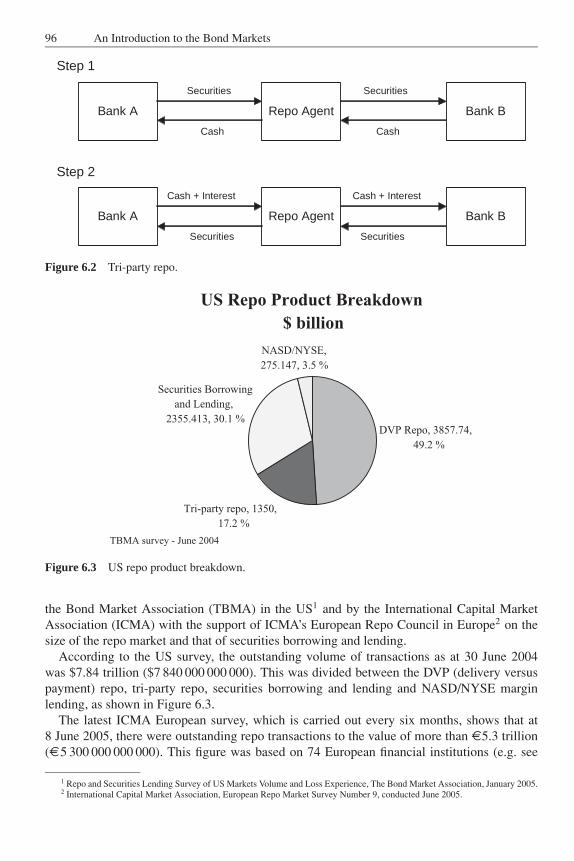
JWBK090-06 JWBK090/Brown March 4, 2006 1:45 Char Count= 0
96 An Introduction to the Bond Markets
Step 1
Bank A Repo Agent Bank B
Securities
Cash
Securities
Cash
Step 2
Bank A Repo Agent Bank B
Cash + Interest
Securities
Cash + Interest
Securities
Figure 6.2 Tri-party repo.
US Repo Product Breakdown$ billion
DVP Repo, 3857.74,
49.2 %
Tri-party repo, 1350,
17.2 %
Securities Borrowing
and Lending,
2355.413, 30.1 %
NASD/NYSE,
275.147, 3.5 %
TBMA survey - June 2004
Figure 6.3 US repo product breakdown.
the Bond Market Association (TBMA) in the US1 and by the International Capital MarketAssociation (ICMA) with the support of ICMA’s European Repo Council in Europe2 on thesize of the repo market and that of securities borrowing and lending.
According to the US survey, the outstanding volume of transactions as at 30 June 2004was $7.84 trillion ($7 840 000 000 000). This was divided between the DVP (delivery versuspayment) repo, tri-party repo, securities borrowing and lending and NASD/NYSE marginlending, as shown in Figure 6.3.
The latest ICMA European survey, which is carried out every six months, shows that at8 June 2005, there were outstanding repo transactions to the value of more than €5.3 trillion(€5 300 000 000 000). This figure was based on 74 European financial institutions (e.g. see
1 Repo and Securities Lending Survey of US Markets Volume and Loss Experience, The Bond Market Association, January 2005.2 International Capital Market Association, European Repo Market Survey Number 9, conducted June 2005.
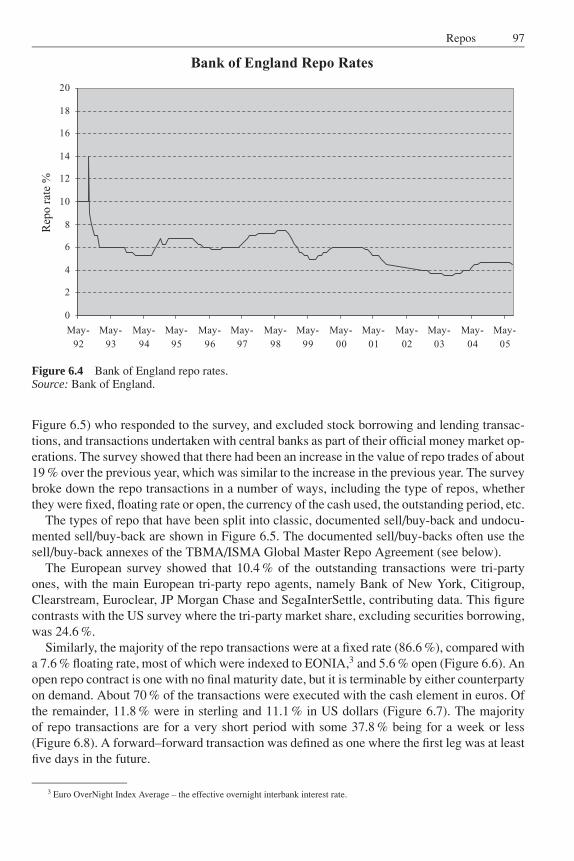
JWBK090-06 JWBK090/Brown March 4, 2006 1:45 Char Count= 0
Repos 97
Bank of England Repo Rates
0
2
4
6
8
10
12
14
16
18
20
May-
92
May-
93
May-
94
May-
95
May-
96
May-
97
May-
98
May-
99
May-
00
May-
01
May-
02
May-
03
May-
04
May-
05
Rep
o r
ate
%
Figure 6.4 Bank of England repo rates.Source: Bank of England.
Figure 6.5) who responded to the survey, and excluded stock borrowing and lending transac-tions, and transactions undertaken with central banks as part of their official money market op-erations. The survey showed that there had been an increase in the value of repo trades of about19 % over the previous year, which was similar to the increase in the previous year. The surveybroke down the repo transactions in a number of ways, including the type of repos, whetherthey were fixed, floating rate or open, the currency of the cash used, the outstanding period, etc.
The types of repo that have been split into classic, documented sell/buy-back and undocu-mented sell/buy-back are shown in Figure 6.5. The documented sell/buy-backs often use thesell/buy-back annexes of the TBMA/ISMA Global Master Repo Agreement (see below).
The European survey showed that 10.4 % of the outstanding transactions were tri-partyones, with the main European tri-party repo agents, namely Bank of New York, Citigroup,Clearstream, Euroclear, JP Morgan Chase and SegaInterSettle, contributing data. This figurecontrasts with the US survey where the tri-party market share, excluding securities borrowing,was 24.6 %.
Similarly, the majority of the repo transactions were at a fixed rate (86.6 %), compared witha 7.6 % floating rate, most of which were indexed to EONIA,3 and 5.6 % open (Figure 6.6). Anopen repo contract is one with no final maturity date, but it is terminable by either counterpartyon demand. About 70 % of the transactions were executed with the cash element in euros. Ofthe remainder, 11.8 % were in sterling and 11.1 % in US dollars (Figure 6.7). The majorityof repo transactions are for a very short period with some 37.8 % being for a week or less(Figure 6.8). A forward–forward transaction was defined as one where the first leg was at leastfive days in the future.
3 Euro OverNight Index Average – the effective overnight interbank interest rate.
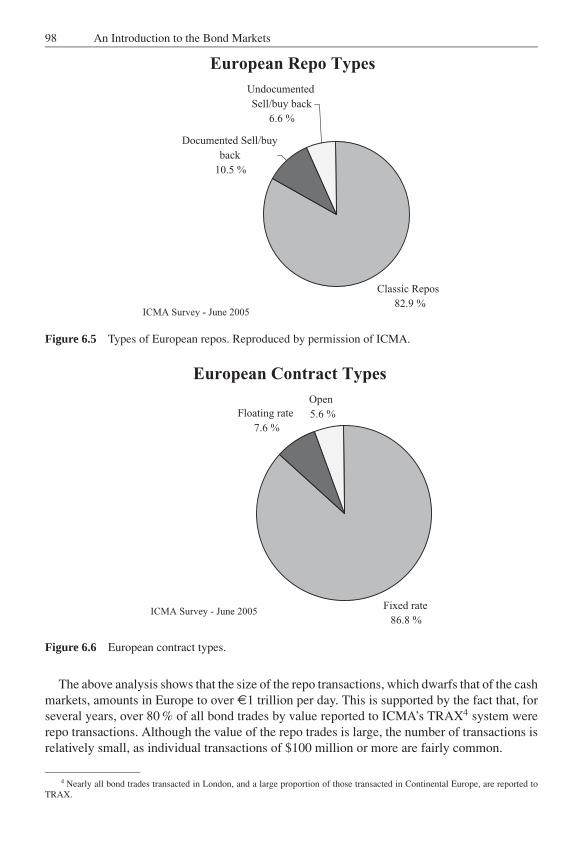
JWBK090-06 JWBK090/Brown March 4, 2006 1:45 Char Count= 0
98 An Introduction to the Bond Markets
European Repo Types
Classic Repos
82.9 %
Documented Sell/buy
back
10.5 %
Undocumented
Sell/buy back
6.6 %
ICMA Survey - June 2005
Figure 6.5 Types of European repos. Reproduced by permission of ICMA.
European Contract Types
Fixed rate
86.8 %
Floating rate
7.6 %
Open
5.6 %
ICMA Survey - June 2005
Figure 6.6 European contract types.
The above analysis shows that the size of the repo transactions, which dwarfs that of the cashmarkets, amounts in Europe to over €1 trillion per day. This is supported by the fact that, forseveral years, over 80 % of all bond trades by value reported to ICMA’s TRAX4 system wererepo transactions. Although the value of the repo trades is large, the number of transactions isrelatively small, as individual transactions of $100 million or more are fairly common.
4 Nearly all bond trades transacted in London, and a large proportion of those transacted in Continental Europe, are reported toTRAX.
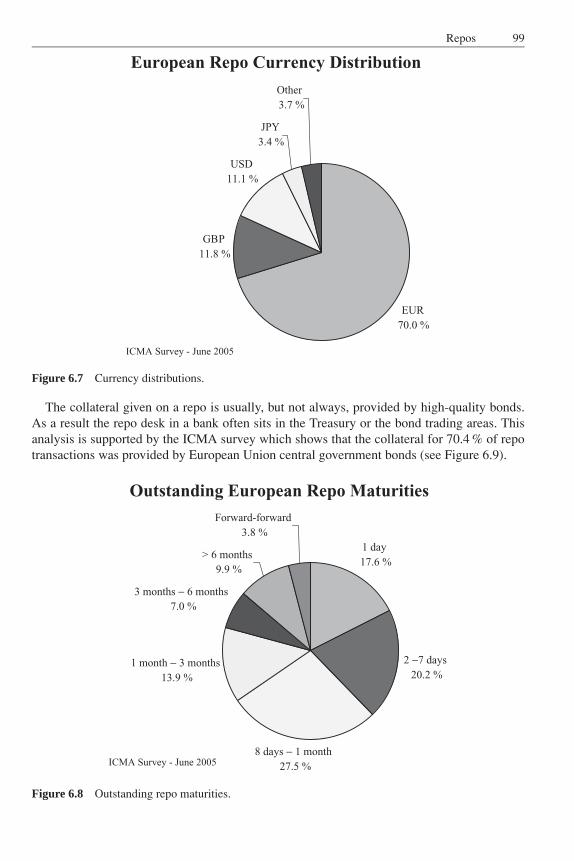
JWBK090-06 JWBK090/Brown March 4, 2006 1:45 Char Count= 0
Repos 99
European Repo Currency Distribution
EUR
70.0 %
GBP
11.8 %
USD
11.1 %
JPY
3.4 %
Other
3.7 %
ICMA Survey - June 2005
Figure 6.7 Currency distributions.
The collateral given on a repo is usually, but not always, provided by high-quality bonds.As a result the repo desk in a bank often sits in the Treasury or the bond trading areas. Thisanalysis is supported by the ICMA survey which shows that the collateral for 70.4 % of repotransactions was provided by European Union central government bonds (see Figure 6.9).
Outstanding European Repo Maturities
1 day
17.6 %
2 −7 days
20.2 %
8 days − 1 month
27.5 %
1 month − 3 months
13.9 %
3 months − 6 months
7.0 %
> 6 months
9.9 %
Forward-forward
3.8 %
ICMA Survey - June 2005
Figure 6.8 Outstanding repo maturities.
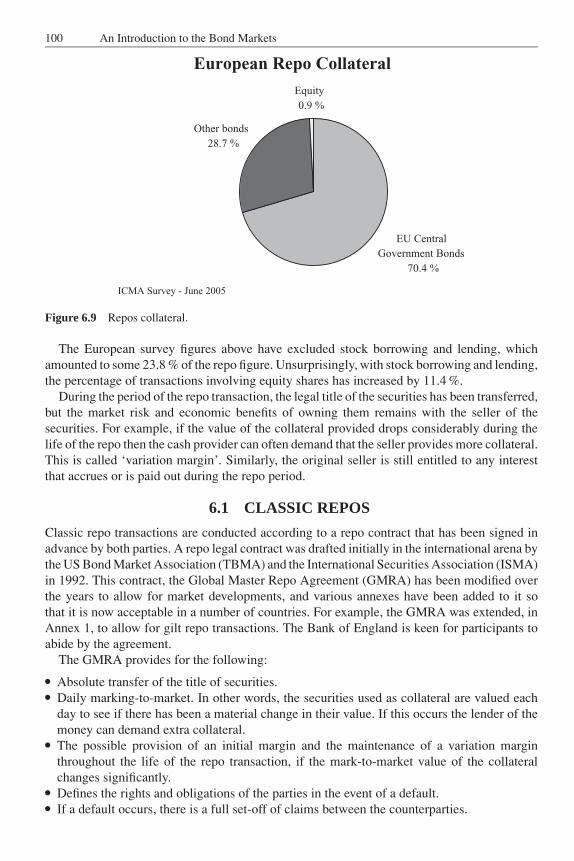
JWBK090-06 JWBK090/Brown March 4, 2006 1:45 Char Count= 0
100 An Introduction to the Bond Markets
European Repo Collateral
EU Central
Government Bonds
70.4 %
Other bonds
28.7 %
Equity
0.9 %
ICMA Survey - June 2005
Figure 6.9 Repos collateral.
The European survey figures above have excluded stock borrowing and lending, whichamounted to some 23.8 % of the repo figure. Unsurprisingly, with stock borrowing and lending,the percentage of transactions involving equity shares has increased by 11.4 %.
During the period of the repo transaction, the legal title of the securities has been transferred,but the market risk and economic benefits of owning them remains with the seller of thesecurities. For example, if the value of the collateral provided drops considerably during thelife of the repo then the cash provider can often demand that the seller provides more collateral.This is called ‘variation margin’. Similarly, the original seller is still entitled to any interestthat accrues or is paid out during the repo period.
6.1 CLASSIC REPOS
Classic repo transactions are conducted according to a repo contract that has been signed inadvance by both parties. A repo legal contract was drafted initially in the international arena bythe US Bond Market Association (TBMA) and the International Securities Association (ISMA)in 1992. This contract, the Global Master Repo Agreement (GMRA) has been modified overthe years to allow for market developments, and various annexes have been added to it sothat it is now acceptable in a number of countries. For example, the GMRA was extended, inAnnex 1, to allow for gilt repo transactions. The Bank of England is keen for participants toabide by the agreement.
The GMRA provides for the following:� Absolute transfer of the title of securities.� Daily marking-to-market. In other words, the securities used as collateral are valued eachday to see if there has been a material change in their value. If this occurs the lender of themoney can demand extra collateral.� The possible provision of an initial margin and the maintenance of a variation marginthroughout the life of the repo transaction, if the mark-to-market value of the collateralchanges significantly.� Defines the rights and obligations of the parties in the event of a default.� If a default occurs, there is a full set-off of claims between the counterparties.
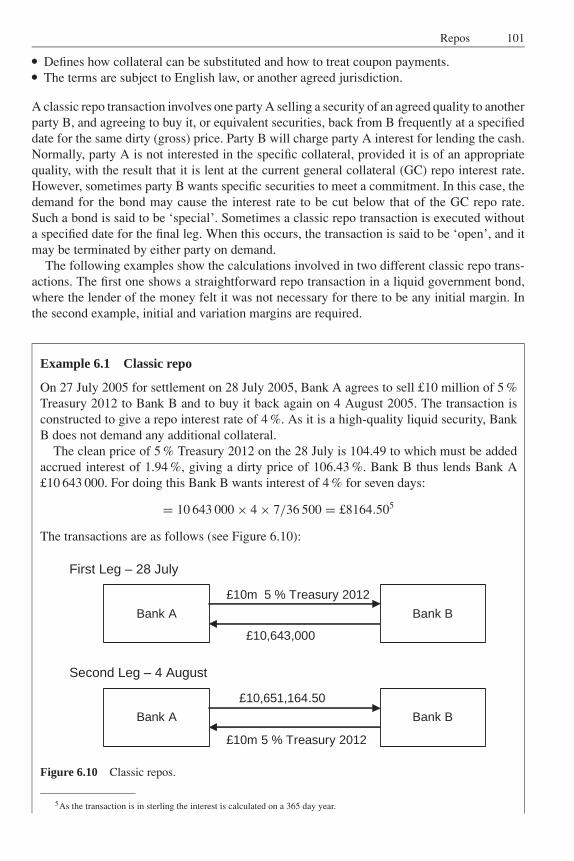
JWBK090-06 JWBK090/Brown March 4, 2006 1:45 Char Count= 0
Repos 101� Defines how collateral can be substituted and how to treat coupon payments.� The terms are subject to English law, or another agreed jurisdiction.
A classic repo transaction involves one party A selling a security of an agreed quality to anotherparty B, and agreeing to buy it, or equivalent securities, back from B frequently at a specifieddate for the same dirty (gross) price. Party B will charge party A interest for lending the cash.Normally, party A is not interested in the specific collateral, provided it is of an appropriatequality, with the result that it is lent at the current general collateral (GC) repo interest rate.However, sometimes party B wants specific securities to meet a commitment. In this case, thedemand for the bond may cause the interest rate to be cut below that of the GC repo rate.Such a bond is said to be ‘special’. Sometimes a classic repo transaction is executed withouta specified date for the final leg. When this occurs, the transaction is said to be ‘open’, and itmay be terminated by either party on demand.
The following examples show the calculations involved in two different classic repo trans-actions. The first one shows a straightforward repo transaction in a liquid government bond,where the lender of the money felt it was not necessary for there to be any initial margin. Inthe second example, initial and variation margins are required.
Example 6.1 Classic repo
On 27 July 2005 for settlement on 28 July 2005, Bank A agrees to sell £10 million of 5 %Treasury 2012 to Bank B and to buy it back again on 4 August 2005. The transaction isconstructed to give a repo interest rate of 4 %. As it is a high-quality liquid security, BankB does not demand any additional collateral.
The clean price of 5 % Treasury 2012 on the 28 July is 104.49 to which must be addedaccrued interest of 1.94 %, giving a dirty price of 106.43 %. Bank B thus lends Bank A£10 643 000. For doing this Bank B wants interest of 4 % for seven days:
= 10 643 000 × 4 × 7/36 500 = £8164.505
The transactions are as follows (see Figure 6.10):
First Leg – 28 July
Bank A Bank B
£10m 5 % Treasury 2012
£10,643,000
Second Leg – 4 August
Bank A Bank B
£10,651,164.50
£10m 5 % Treasury 2012
Figure 6.10 Classic repos.
5As the transaction is in sterling the interest is calculated on a 365 day year.
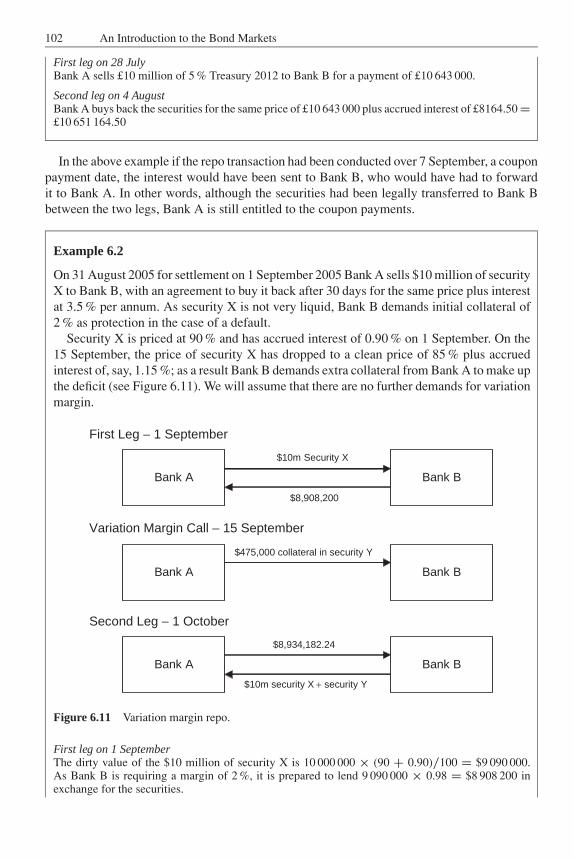
JWBK090-06 JWBK090/Brown March 4, 2006 1:45 Char Count= 0
102 An Introduction to the Bond Markets
First leg on 28 JulyBank A sells £10 million of 5 % Treasury 2012 to Bank B for a payment of £10 643 000.
Second leg on 4 AugustBank A buys back the securities for the same price of £10 643 000 plus accrued interest of £8164.50 =£10 651 164.50
In the above example if the repo transaction had been conducted over 7 September, a couponpayment date, the interest would have been sent to Bank B, who would have had to forwardit to Bank A. In other words, although the securities had been legally transferred to Bank Bbetween the two legs, Bank A is still entitled to the coupon payments.
Example 6.2
On 31 August 2005 for settlement on 1 September 2005 Bank A sells $10 million of securityX to Bank B, with an agreement to buy it back after 30 days for the same price plus interestat 3.5 % per annum. As security X is not very liquid, Bank B demands initial collateral of2 % as protection in the case of a default.
Security X is priced at 90 % and has accrued interest of 0.90 % on 1 September. On the15 September, the price of security X has dropped to a clean price of 85 % plus accruedinterest of, say, 1.15 %; as a result Bank B demands extra collateral from Bank A to make upthe deficit (see Figure 6.11). We will assume that there are no further demands for variationmargin.
First Leg − 1 September
Bank A Bank B
$10m Security X
$8,908,200
Variation Margin Call – 15 September
Bank A Bank B
$475,000 collateral in security Y
Second Leg − 1 October
Bank A Bank B
$8,934,182.24
$10m security X + security Y
Figure 6.11 Variation margin repo.
First leg on 1 SeptemberThe dirty value of the $10 million of security X is 10 000 000 × (90 + 0.90)/100 = $9 090 000.As Bank B is requiring a margin of 2 %, it is prepared to lend 9 090 000 × 0.98 = $8 908 200 inexchange for the securities.
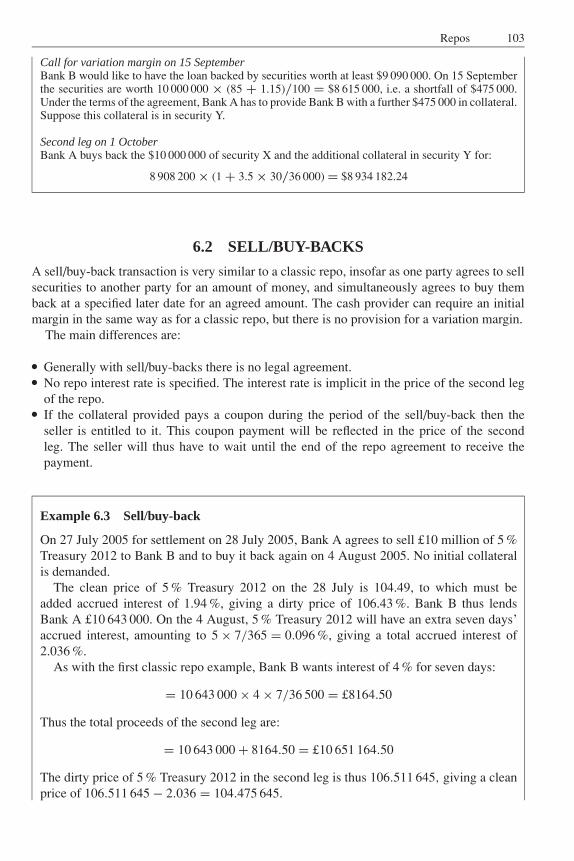
JWBK090-06 JWBK090/Brown March 4, 2006 1:45 Char Count= 0
Repos 103
Call for variation margin on 15 SeptemberBank B would like to have the loan backed by securities worth at least $9 090 000. On 15 Septemberthe securities are worth 10 000 000 × (85 + 1.15)/100 = $8 615 000, i.e. a shortfall of $475 000.Under the terms of the agreement, Bank A has to provide Bank B with a further $475 000 in collateral.Suppose this collateral is in security Y.
Second leg on 1 OctoberBank A buys back the $10 000 000 of security X and the additional collateral in security Y for:
8 908 200 × (1 + 3.5 × 30/36 000) = $8 934 182.24
6.2 SELL/BUY-BACKS
A sell/buy-back transaction is very similar to a classic repo, insofar as one party agrees to sellsecurities to another party for an amount of money, and simultaneously agrees to buy themback at a specified later date for an agreed amount. The cash provider can require an initialmargin in the same way as for a classic repo, but there is no provision for a variation margin.
The main differences are:� Generally with sell/buy-backs there is no legal agreement.� No repo interest rate is specified. The interest rate is implicit in the price of the second legof the repo.� If the collateral provided pays a coupon during the period of the sell/buy-back then theseller is entitled to it. This coupon payment will be reflected in the price of the secondleg. The seller will thus have to wait until the end of the repo agreement to receive thepayment.
Example 6.3 Sell/buy-back
On 27 July 2005 for settlement on 28 July 2005, Bank A agrees to sell £10 million of 5 %Treasury 2012 to Bank B and to buy it back again on 4 August 2005. No initial collateralis demanded.
The clean price of 5 % Treasury 2012 on the 28 July is 104.49, to which must beadded accrued interest of 1.94 %, giving a dirty price of 106.43 %. Bank B thus lendsBank A £10 643 000. On the 4 August, 5 % Treasury 2012 will have an extra seven days’accrued interest, amounting to 5 × 7/365 = 0.096 %, giving a total accrued interest of2.036 %.
As with the first classic repo example, Bank B wants interest of 4 % for seven days:
= 10 643 000 × 4 × 7/36 500 = £8164.50
Thus the total proceeds of the second leg are:
= 10 643 000 + 8164.50 = £10 651 164.50
The dirty price of 5 % Treasury 2012 in the second leg is thus 106.511 645, giving a cleanprice of 106.511 645 − 2.036 = 104.475 645.
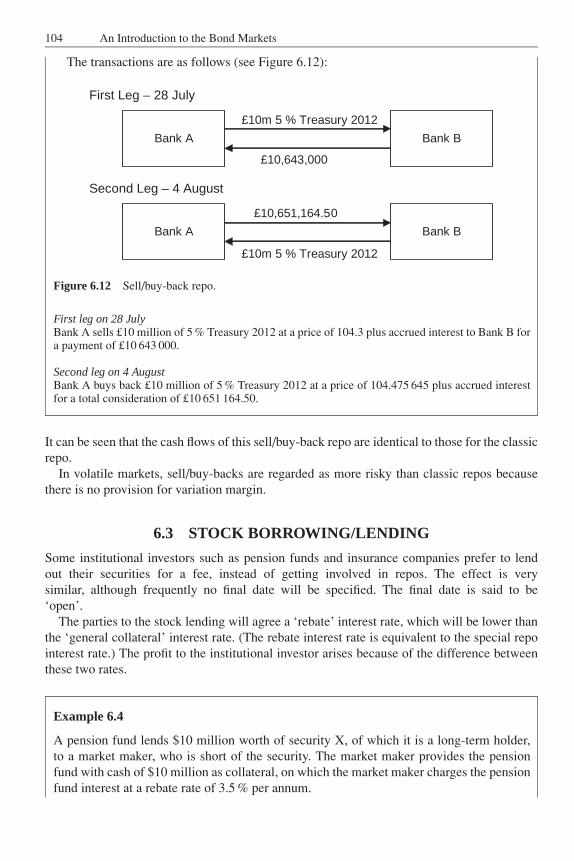
JWBK090-06 JWBK090/Brown March 4, 2006 1:45 Char Count= 0
104 An Introduction to the Bond Markets
The transactions are as follows (see Figure 6.12):
First Leg – 28 July
Bank A Bank B
£10m 5 % Treasury 2012
£10,643,000
Second Leg – 4 August
Bank A Bank B
£10,651,164.50
£10m 5 % Treasury 2012
Figure 6.12 Sell/buy-back repo.
First leg on 28 JulyBank A sells £10 million of 5 % Treasury 2012 at a price of 104.3 plus accrued interest to Bank B fora payment of £10 643 000.
Second leg on 4 AugustBank A buys back £10 million of 5 % Treasury 2012 at a price of 104.475 645 plus accrued interestfor a total consideration of £10 651 164.50.
It can be seen that the cash flows of this sell/buy-back repo are identical to those for the classicrepo.
In volatile markets, sell/buy-backs are regarded as more risky than classic repos becausethere is no provision for variation margin.
6.3 STOCK BORROWING/LENDING
Some institutional investors such as pension funds and insurance companies prefer to lendout their securities for a fee, instead of getting involved in repos. The effect is verysimilar, although frequently no final date will be specified. The final date is said to be‘open’.
The parties to the stock lending will agree a ‘rebate’ interest rate, which will be lower thanthe ‘general collateral’ interest rate. (The rebate interest rate is equivalent to the special repointerest rate.) The profit to the institutional investor arises because of the difference betweenthese two rates.
Example 6.4
A pension fund lends $10 million worth of security X, of which it is a long-term holder,to a market maker, who is short of the security. The market maker provides the pensionfund with cash of $10 million as collateral, on which the market maker charges the pensionfund interest at a rebate rate of 3.5 % per annum.
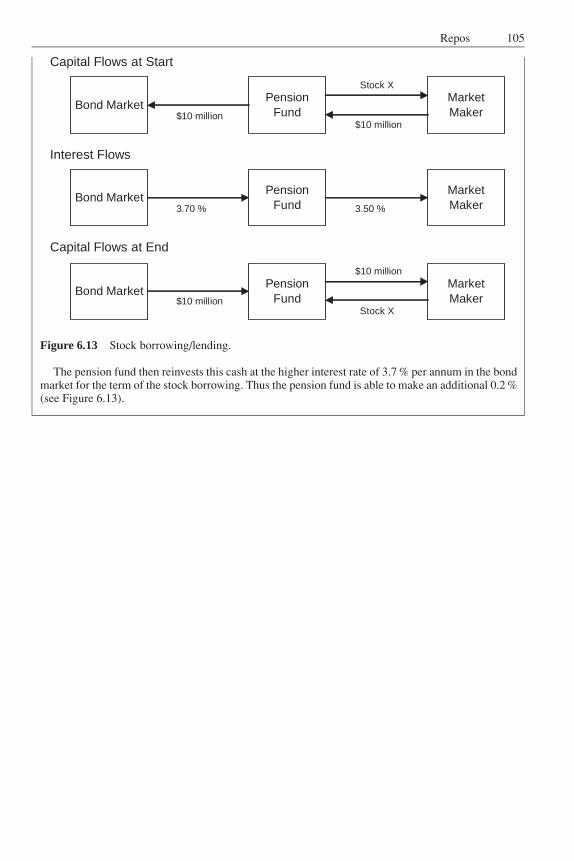
JWBK090-06 JWBK090/Brown March 4, 2006 1:45 Char Count= 0
Repos 105
Capital Flows at Start
Bond MarketPension
FundMarketMaker
Stock X
$10 million$10 million
Interest Flows
Bond MarketPension
FundMarketMaker3.50 %3.70 %
Capital Flows at End
Bond MarketPension
FundMarketMaker
$10 million
Stock X$10 million
Figure 6.13 Stock borrowing/lending.
The pension fund then reinvests this cash at the higher interest rate of 3.7 % per annum in the bondmarket for the term of the stock borrowing. Thus the pension fund is able to make an additional 0.2 %(see Figure 6.13).

JWBK090-06 JWBK090/Brown March 4, 2006 1:45 Char Count= 0
106
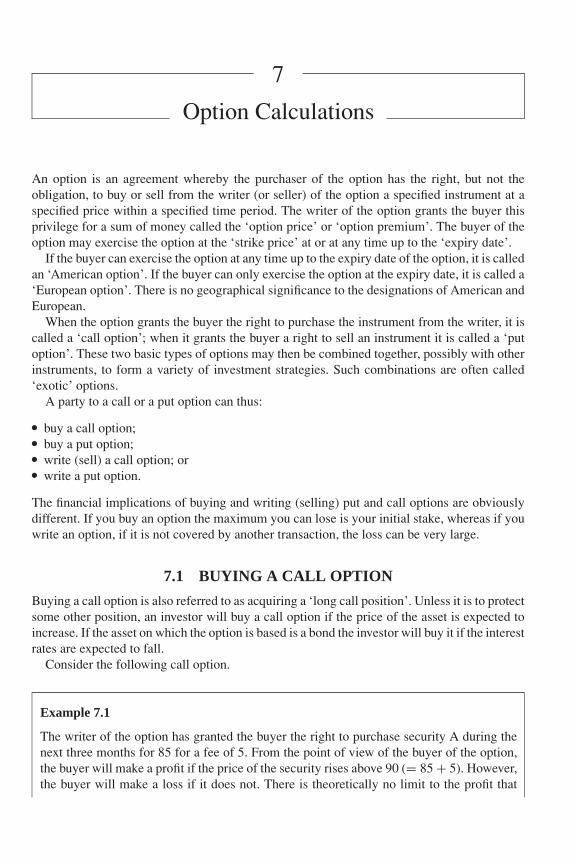
JWBK090-07 JWBK090/Brown March 1, 2006 8:2 Char Count= 0
7
Option Calculations
An option is an agreement whereby the purchaser of the option has the right, but not theobligation, to buy or sell from the writer (or seller) of the option a specified instrument at aspecified price within a specified time period. The writer of the option grants the buyer thisprivilege for a sum of money called the ‘option price’ or ‘option premium’. The buyer of theoption may exercise the option at the ‘strike price’ at or at any time up to the ‘expiry date’.
If the buyer can exercise the option at any time up to the expiry date of the option, it is calledan ‘American option’. If the buyer can only exercise the option at the expiry date, it is called a‘European option’. There is no geographical significance to the designations of American andEuropean.
When the option grants the buyer the right to purchase the instrument from the writer, it iscalled a ‘call option’; when it grants the buyer a right to sell an instrument it is called a ‘putoption’. These two basic types of options may then be combined together, possibly with otherinstruments, to form a variety of investment strategies. Such combinations are often called‘exotic’ options.
A party to a call or a put option can thus:� buy a call option;� buy a put option;� write (sell) a call option; or� write a put option.
The financial implications of buying and writing (selling) put and call options are obviouslydifferent. If you buy an option the maximum you can lose is your initial stake, whereas if youwrite an option, if it is not covered by another transaction, the loss can be very large.
7.1 BUYING A CALL OPTION
Buying a call option is also referred to as acquiring a ‘long call position’. Unless it is to protectsome other position, an investor will buy a call option if the price of the asset is expected toincrease. If the asset on which the option is based is a bond the investor will buy it if the interestrates are expected to fall.
Consider the following call option.
Example 7.1
The writer of the option has granted the buyer the right to purchase security A during thenext three months for 85 for a fee of 5. From the point of view of the buyer of the option,the buyer will make a profit if the price of the security rises above 90 (= 85 + 5). However,the buyer will make a loss if it does not. There is theoretically no limit to the profit that
107
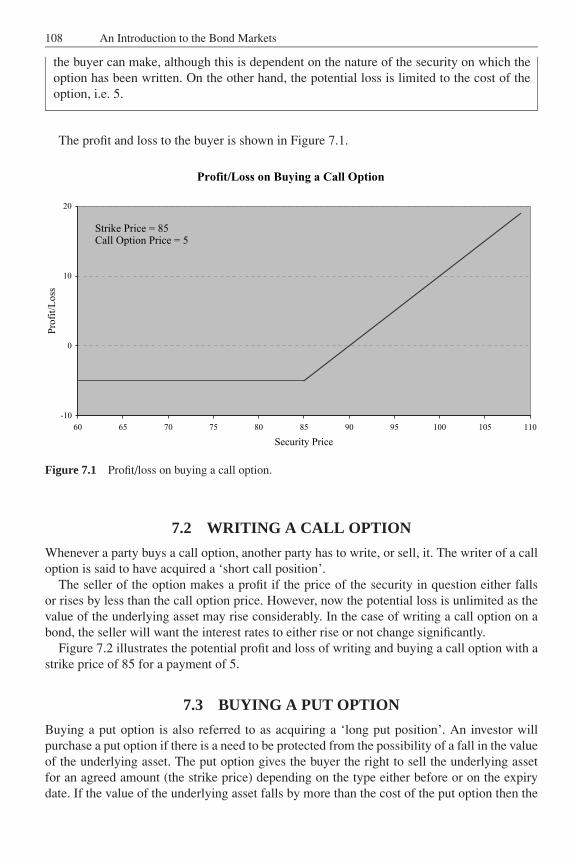
JWBK090-07 JWBK090/Brown March 1, 2006 8:2 Char Count= 0
108 An Introduction to the Bond Markets
the buyer can make, although this is dependent on the nature of the security on which theoption has been written. On the other hand, the potential loss is limited to the cost of theoption, i.e. 5.
The profit and loss to the buyer is shown in Figure 7.1.
Profit/Loss on Buying a Call Option
-10
0
10
20
60 65 70 75 80 85 90 95 100 105 110
Security Price
Pro
fit/
Loss
Strike Price = 85Call Option Price = 5
Figure 7.1 Profit/loss on buying a call option.
7.2 WRITING A CALL OPTION
Whenever a party buys a call option, another party has to write, or sell, it. The writer of a calloption is said to have acquired a ‘short call position’.
The seller of the option makes a profit if the price of the security in question either fallsor rises by less than the call option price. However, now the potential loss is unlimited as thevalue of the underlying asset may rise considerably. In the case of writing a call option on abond, the seller will want the interest rates to either rise or not change significantly.
Figure 7.2 illustrates the potential profit and loss of writing and buying a call option with astrike price of 85 for a payment of 5.
7.3 BUYING A PUT OPTION
Buying a put option is also referred to as acquiring a ‘long put position’. An investor willpurchase a put option if there is a need to be protected from the possibility of a fall in the valueof the underlying asset. The put option gives the buyer the right to sell the underlying assetfor an agreed amount (the strike price) depending on the type either before or on the expirydate. If the value of the underlying asset falls by more than the cost of the put option then the
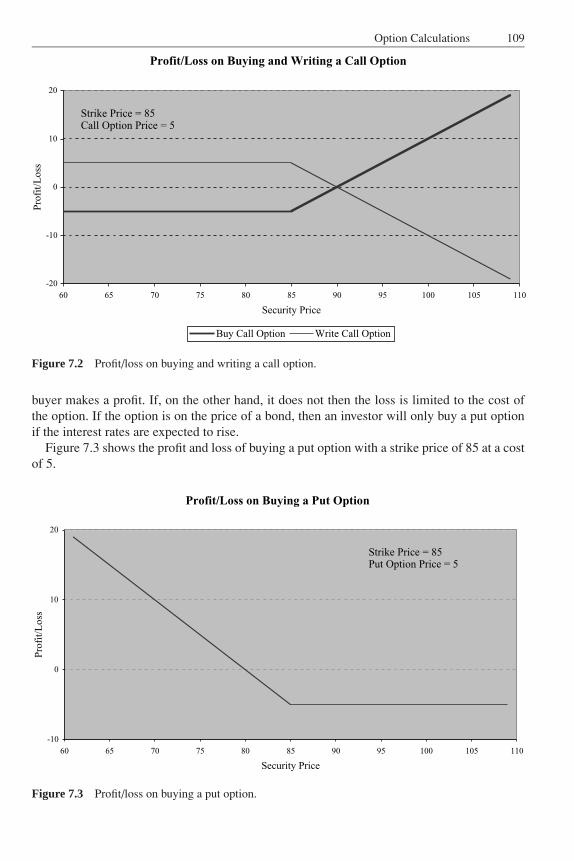
JWBK090-07 JWBK090/Brown March 1, 2006 8:2 Char Count= 0
Option Calculations 109
Profit/Loss on Buying and Writing a Call Option
-20
-10
0
10
20
60 65 70 75 80 85 90 95 100 105 110
Security Price
Pro
fit/
Lo
ss
Buy Call Option Write Call Option
Strike Price = 85Call Option Price = 5
Figure 7.2 Profit/loss on buying and writing a call option.
buyer makes a profit. If, on the other hand, it does not then the loss is limited to the cost ofthe option. If the option is on the price of a bond, then an investor will only buy a put optionif the interest rates are expected to rise.
Figure 7.3 shows the profit and loss of buying a put option with a strike price of 85 at a costof 5.
Profit/Loss on Buying a Put Option
-10
0
10
20
60 65 70 75 80 85 90 95 100 105 110
Security Price
Pro
fit/
Loss
Strike Price = 85Put Option Price = 5
Figure 7.3 Profit/loss on buying a put option.
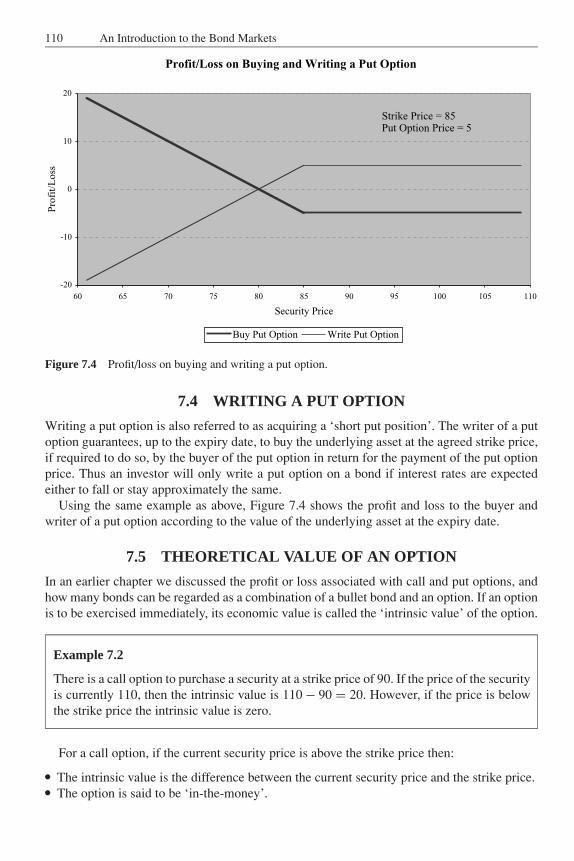
JWBK090-07 JWBK090/Brown March 1, 2006 8:2 Char Count= 0
110 An Introduction to the Bond Markets
Profit/Loss on Buying and Writing a Put Option
-20
-10
0
10
20
60 65 70 75 80 85 90 95 100 105 110
Security Price
Pro
fit/
Loss
Buy Put Option Write Put Option
Strike Price = 85Put Option Price = 5
Figure 7.4 Profit/loss on buying and writing a put option.
7.4 WRITING A PUT OPTION
Writing a put option is also referred to as acquiring a ‘short put position’. The writer of a putoption guarantees, up to the expiry date, to buy the underlying asset at the agreed strike price,if required to do so, by the buyer of the put option in return for the payment of the put optionprice. Thus an investor will only write a put option on a bond if interest rates are expectedeither to fall or stay approximately the same.
Using the same example as above, Figure 7.4 shows the profit and loss to the buyer andwriter of a put option according to the value of the underlying asset at the expiry date.
7.5 THEORETICAL VALUE OF AN OPTION
In an earlier chapter we discussed the profit or loss associated with call and put options, andhow many bonds can be regarded as a combination of a bullet bond and an option. If an optionis to be exercised immediately, its economic value is called the ‘intrinsic value’ of the option.
Example 7.2
There is a call option to purchase a security at a strike price of 90. If the price of the securityis currently 110, then the intrinsic value is 110 − 90 = 20. However, if the price is belowthe strike price the intrinsic value is zero.
For a call option, if the current security price is above the strike price then:� The intrinsic value is the difference between the current security price and the strike price.� The option is said to be ‘in-the-money’.
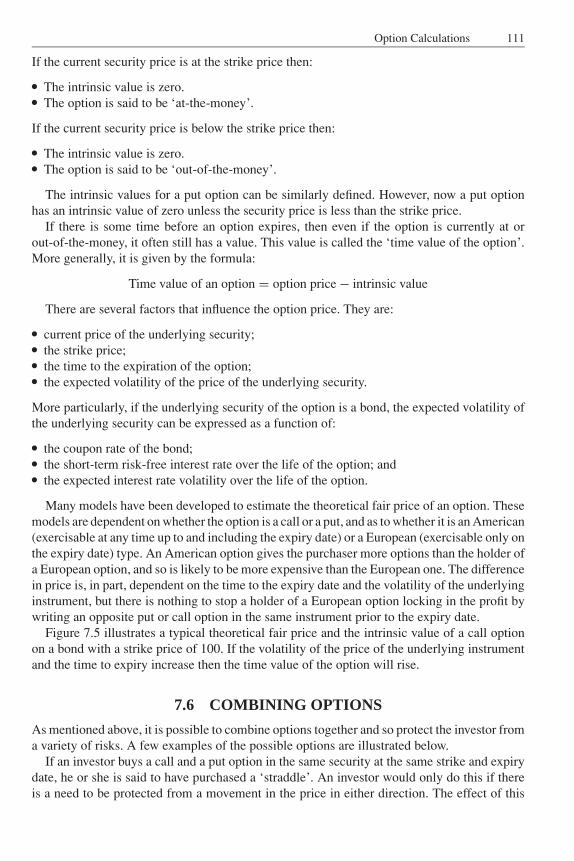
JWBK090-07 JWBK090/Brown March 1, 2006 8:2 Char Count= 0
Option Calculations 111
If the current security price is at the strike price then:� The intrinsic value is zero.� The option is said to be ‘at-the-money’.
If the current security price is below the strike price then:� The intrinsic value is zero.� The option is said to be ‘out-of-the-money’.
The intrinsic values for a put option can be similarly defined. However, now a put optionhas an intrinsic value of zero unless the security price is less than the strike price.
If there is some time before an option expires, then even if the option is currently at orout-of-the-money, it often still has a value. This value is called the ‘time value of the option’.More generally, it is given by the formula:
Time value of an option = option price − intrinsic value
There are several factors that influence the option price. They are:� current price of the underlying security;� the strike price;� the time to the expiration of the option;� the expected volatility of the price of the underlying security.
More particularly, if the underlying security of the option is a bond, the expected volatility ofthe underlying security can be expressed as a function of:� the coupon rate of the bond;� the short-term risk-free interest rate over the life of the option; and� the expected interest rate volatility over the life of the option.
Many models have been developed to estimate the theoretical fair price of an option. Thesemodels are dependent on whether the option is a call or a put, and as to whether it is an American(exercisable at any time up to and including the expiry date) or a European (exercisable only onthe expiry date) type. An American option gives the purchaser more options than the holder ofa European option, and so is likely to be more expensive than the European one. The differencein price is, in part, dependent on the time to the expiry date and the volatility of the underlyinginstrument, but there is nothing to stop a holder of a European option locking in the profit bywriting an opposite put or call option in the same instrument prior to the expiry date.
Figure 7.5 illustrates a typical theoretical fair price and the intrinsic value of a call optionon a bond with a strike price of 100. If the volatility of the price of the underlying instrumentand the time to expiry increase then the time value of the option will rise.
7.6 COMBINING OPTIONS
As mentioned above, it is possible to combine options together and so protect the investor froma variety of risks. A few examples of the possible options are illustrated below.
If an investor buys a call and a put option in the same security at the same strike and expirydate, he or she is said to have purchased a ‘straddle’. An investor would only do this if thereis a need to be protected from a movement in the price in either direction. The effect of this
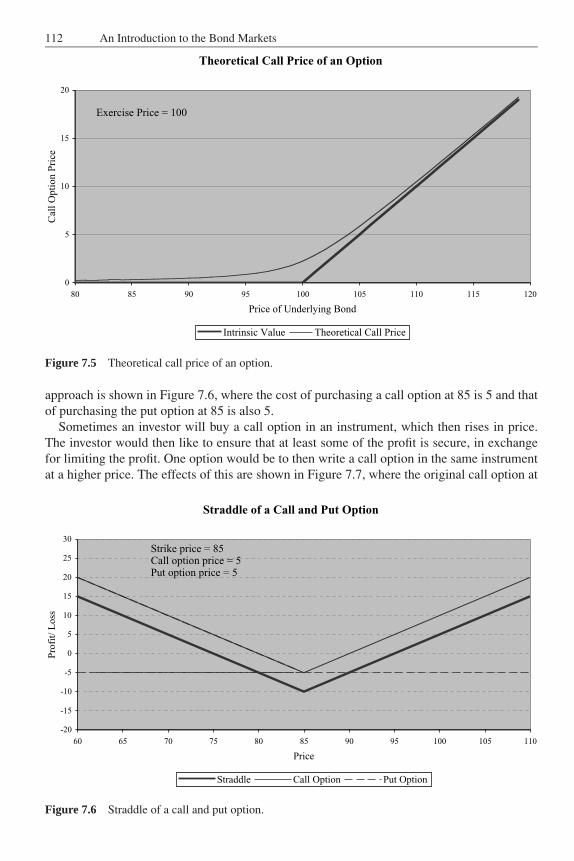
JWBK090-07 JWBK090/Brown March 1, 2006 8:2 Char Count= 0
112 An Introduction to the Bond Markets
Theoretical Call Price of an Option
0
5
10
15
20
80 85 90 95 100 105 110 115 120
Price of Underlying Bond
Cal
l O
pti
on P
rice
Intrinsic Value Theoretical Call Price
Exercise Price = 100
Figure 7.5 Theoretical call price of an option.
approach is shown in Figure 7.6, where the cost of purchasing a call option at 85 is 5 and thatof purchasing the put option at 85 is also 5.
Sometimes an investor will buy a call option in an instrument, which then rises in price.The investor would then like to ensure that at least some of the profit is secure, in exchangefor limiting the profit. One option would be to then write a call option in the same instrumentat a higher price. The effects of this are shown in Figure 7.7, where the original call option at
Straddle of a Call and Put Option
-20
-15
-10
-5
0
5
10
15
20
25
30
60 65 70 75 80 85 90 95 100 105 110
Price
Pro
fit/
Loss
Straddle Call Option Put Option
Strike price = 85Call option price = 5Put option price = 5
Figure 7.6 Straddle of a call and put option.
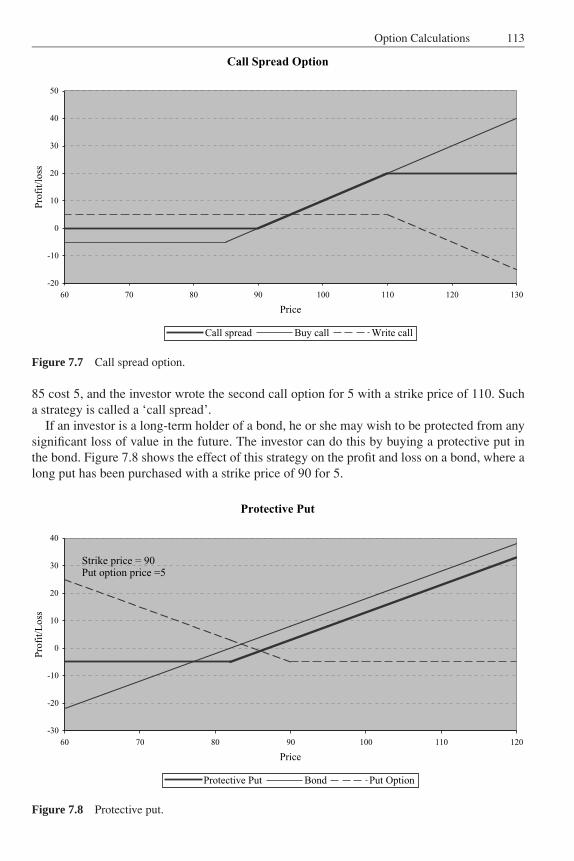
JWBK090-07 JWBK090/Brown March 1, 2006 8:2 Char Count= 0
Option Calculations 113
Call Spread Option
-20
-10
0
10
20
30
40
50
60 70 80 90 100 110 120 130
Price
Pro
fit/
loss
Call spread Buy call Write call
Figure 7.7 Call spread option.
85 cost 5, and the investor wrote the second call option for 5 with a strike price of 110. Sucha strategy is called a ‘call spread’.
If an investor is a long-term holder of a bond, he or she may wish to be protected from anysignificant loss of value in the future. The investor can do this by buying a protective put inthe bond. Figure 7.8 shows the effect of this strategy on the profit and loss on a bond, where along put has been purchased with a strike price of 90 for 5.
Protective Put
-30
-20
-10
0
10
20
30
40
60 70 80 90 100 110 120
Price
Pro
fit/
Loss
Protective Put Bond Put Option
Strike price = 90Put option price =5
Figure 7.8 Protective put.

JWBK090-07 JWBK090/Brown March 1, 2006 8:2 Char Count= 0
114
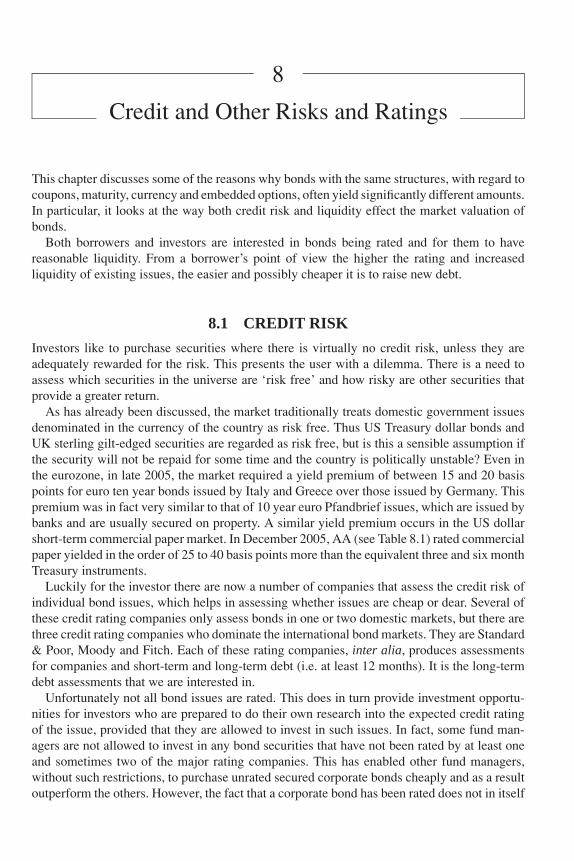
JWBK090-08 JWBK090/Brown March 3, 2006 11:19 Char Count= 0
8
Credit and Other Risks and Ratings
This chapter discusses some of the reasons why bonds with the same structures, with regard tocoupons, maturity, currency and embedded options, often yield significantly different amounts.In particular, it looks at the way both credit risk and liquidity effect the market valuation ofbonds.
Both borrowers and investors are interested in bonds being rated and for them to havereasonable liquidity. From a borrower’s point of view the higher the rating and increasedliquidity of existing issues, the easier and possibly cheaper it is to raise new debt.
8.1 CREDIT RISK
Investors like to purchase securities where there is virtually no credit risk, unless they areadequately rewarded for the risk. This presents the user with a dilemma. There is a need toassess which securities in the universe are ‘risk free’ and how risky are other securities thatprovide a greater return.
As has already been discussed, the market traditionally treats domestic government issuesdenominated in the currency of the country as risk free. Thus US Treasury dollar bonds andUK sterling gilt-edged securities are regarded as risk free, but is this a sensible assumption ifthe security will not be repaid for some time and the country is politically unstable? Even inthe eurozone, in late 2005, the market required a yield premium of between 15 and 20 basispoints for euro ten year bonds issued by Italy and Greece over those issued by Germany. Thispremium was in fact very similar to that of 10 year euro Pfandbrief issues, which are issued bybanks and are usually secured on property. A similar yield premium occurs in the US dollarshort-term commercial paper market. In December 2005, AA (see Table 8.1) rated commercialpaper yielded in the order of 25 to 40 basis points more than the equivalent three and six monthTreasury instruments.
Luckily for the investor there are now a number of companies that assess the credit risk ofindividual bond issues, which helps in assessing whether issues are cheap or dear. Several ofthese credit rating companies only assess bonds in one or two domestic markets, but there arethree credit rating companies who dominate the international bond markets. They are Standard& Poor, Moody and Fitch. Each of these rating companies, inter alia, produces assessmentsfor companies and short-term and long-term debt (i.e. at least 12 months). It is the long-termdebt assessments that we are interested in.
Unfortunately not all bond issues are rated. This does in turn provide investment opportu-nities for investors who are prepared to do their own research into the expected credit ratingof the issue, provided that they are allowed to invest in such issues. In fact, some fund man-agers are not allowed to invest in any bond securities that have not been rated by at least oneand sometimes two of the major rating companies. This has enabled other fund managers,without such restrictions, to purchase unrated secured corporate bonds cheaply and as a resultoutperform the others. However, the fact that a corporate bond has been rated does not in itself
115
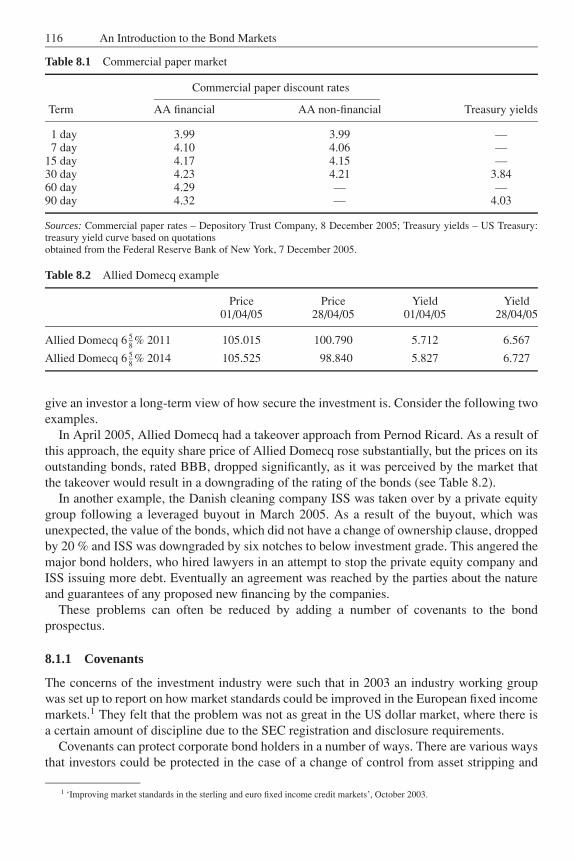
JWBK090-08 JWBK090/Brown March 3, 2006 11:19 Char Count= 0
116 An Introduction to the Bond Markets
Table 8.1 Commercial paper market
Commercial paper discount rates
Term AA financial AA non-financial Treasury yields
1 day 3.99 3.99 —7 day 4.10 4.06 —
15 day 4.17 4.15 —30 day 4.23 4.21 3.8460 day 4.29 — —90 day 4.32 — 4.03
Sources: Commercial paper rates – Depository Trust Company, 8 December 2005; Treasury yields – US Treasury:treasury yield curve based on quotationsobtained from the Federal Reserve Bank of New York, 7 December 2005.
Table 8.2 Allied Domecq example
Price Price Yield Yield01/04/05 28/04/05 01/04/05 28/04/05
Allied Domecq 6 58 % 2011 105.015 100.790 5.712 6.567
Allied Domecq 6 58 % 2014 105.525 98.840 5.827 6.727
give an investor a long-term view of how secure the investment is. Consider the following twoexamples.
In April 2005, Allied Domecq had a takeover approach from Pernod Ricard. As a result ofthis approach, the equity share price of Allied Domecq rose substantially, but the prices on itsoutstanding bonds, rated BBB, dropped significantly, as it was perceived by the market thatthe takeover would result in a downgrading of the rating of the bonds (see Table 8.2).
In another example, the Danish cleaning company ISS was taken over by a private equitygroup following a leveraged buyout in March 2005. As a result of the buyout, which wasunexpected, the value of the bonds, which did not have a change of ownership clause, droppedby 20 % and ISS was downgraded by six notches to below investment grade. This angered themajor bond holders, who hired lawyers in an attempt to stop the private equity company andISS issuing more debt. Eventually an agreement was reached by the parties about the natureand guarantees of any proposed new financing by the companies.
These problems can often be reduced by adding a number of covenants to the bondprospectus.
8.1.1 Covenants
The concerns of the investment industry were such that in 2003 an industry working groupwas set up to report on how market standards could be improved in the European fixed incomemarkets.1 They felt that the problem was not as great in the US dollar market, where there isa certain amount of discipline due to the SEC registration and disclosure requirements.
Covenants can protect corporate bond holders in a number of ways. There are various waysthat investors could be protected in the case of a change of control from asset stripping and
1 ‘Improving market standards in the sterling and euro fixed income credit markets’, October 2003.
JWBK090-08 JWBK090/Brown March 3, 2006 11:19 Char Count= 0
Credit and Other Risks and Ratings 117
give some bite to the often near meaningless negative pledge statement. A change of controlcould, in certain circumstances, give bond holders a put option to demand redemption at, say,the greater of:� par (100) and� a yield that would give the same return as the original reference government bond, or an
appropriate substitute, plus the issue yield spread.
This put option might only be exercisable if the change of control results in a downgradingof, say, at least two notches or from investment grade to speculative grade. Similar change ofownership clauses are now often included in the terms of new corporate bond issues.
Similarly, a borrower should not be allowed to dispose of company assets or restructure thecompany in such a way that is detrimental to the instrument’s integrity. For example, a clausestopping a company from deposing of more than, say, 20 % of the debt of the company inany one year, unless it is used for reinvestment in the company or for repurchasing bonds ofa higher or similar ranking. Failing this, the holder could demand that the bonds are boughtback at par.
Bonds are often issued with a ‘negative pledge’ clause. This basically says that the issuerwill not issue any debt that has a prior claim on assets. Unfortunately, there are a numberof ways such a clause can be circumnavigated. In fact, in the European capital markets suchclauses often exclude bank debt, thus making it virtually meaningless. In addition, the negativepledge clause often does not restrict the company from securitizing assets or entering into saleand leaseback agreements on assets.
Covenants do not have to be all in favour of the investors. For example, in the sterlingmarket bonds sometimes have a ‘Spens clause’ that allows the borrower to redeem the bondsearly at the greater of par and the price that gives a yield that is the same as the currentredemption yield on the reference UK Government gilt-edged issue. A Spens clause, requiringearly redemption, can sometimes even be invoked as a result of a corporate action, whichis deemed to be detrimental to the bond holders. This occurred in 2000 with Stagecoachwhen it sold a subsidiary resulting in a ratings downgrade. As a result, an outstanding sterlingbond with a Spens clause had to be redeemed early, but a shorter bond denominated in euroswithout a Spens clause did not. Redeeming a bond with a Spens clause is very expensivefor the borrower, as the bonds were usually issued and are trading at an appreciable yieldpremium to the relevant gilt. As a result, companies seldom exercise the option, although theymay try to circumvent the bond covenants. A less onerous standard could be fairer to bothparties.
8.1.2 Ratings
As has been discussed above, if bonds have been rated by the rating agencies, the process ofpricing the issues is made easier. Bonds are frequently priced relative to the interest rates ofso-called ‘risk-free debt’2 in the relevant currency and maturity range.
On the other hand, issuers are interested in having their bonds rated, since they hope it willreduce the cost of borrowing. In recent years the majority of large international issues havebeen rated by at least one of the three major credit rating agencies. However, there are a few
2 Domestic debt issued by a government in its own currency is often referred to as a risk-free debt, since at least theoretically itcan always print more money to repay the loan, albeit sometimes in a depreciated currency.
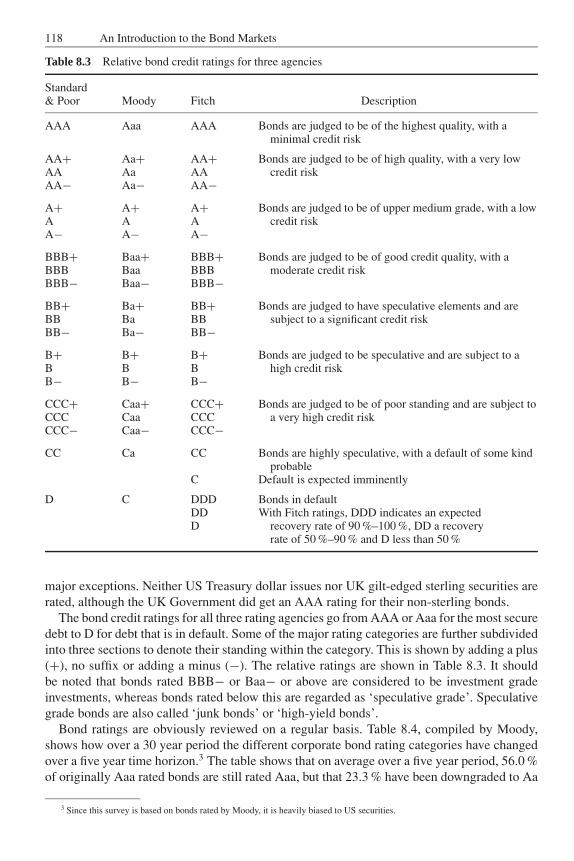
JWBK090-08 JWBK090/Brown March 3, 2006 11:19 Char Count= 0
118 An Introduction to the Bond Markets
Table 8.3 Relative bond credit ratings for three agencies
Standard& Poor Moody Fitch Description
AAA Aaa AAA Bonds are judged to be of the highest quality, with aminimal credit risk
AA+ Aa+ AA+ Bonds are judged to be of high quality, with a very lowAA Aa AA credit riskAA− Aa− AA−A+ A+ A+ Bonds are judged to be of upper medium grade, with a lowA A A credit riskA− A− A−BBB+ Baa+ BBB+ Bonds are judged to be of good credit quality, with aBBB Baa BBB moderate credit riskBBB− Baa− BBB−BB+ Ba+ BB+ Bonds are judged to have speculative elements and areBB Ba BB subject to a significant credit riskBB− Ba− BB−B+ B+ B+ Bonds are judged to be speculative and are subject to aB B B high credit riskB− B− B−CCC+ Caa+ CCC+ Bonds are judged to be of poor standing and are subject toCCC Caa CCC a very high credit riskCCC− Caa− CCC−CC Ca CC Bonds are highly speculative, with a default of some kind
probableC Default is expected imminently
D C DDD Bonds in defaultDD With Fitch ratings, DDD indicates an expectedD recovery rate of 90 %–100 %, DD a recovery
rate of 50 %–90 % and D less than 50 %
major exceptions. Neither US Treasury dollar issues nor UK gilt-edged sterling securities arerated, although the UK Government did get an AAA rating for their non-sterling bonds.
The bond credit ratings for all three rating agencies go from AAA or Aaa for the most securedebt to D for debt that is in default. Some of the major rating categories are further subdividedinto three sections to denote their standing within the category. This is shown by adding a plus(+), no suffix or adding a minus (−). The relative ratings are shown in Table 8.3. It shouldbe noted that bonds rated BBB− or Baa− or above are considered to be investment gradeinvestments, whereas bonds rated below this are regarded as ‘speculative grade’. Speculativegrade bonds are also called ‘junk bonds’ or ‘high-yield bonds’.
Bond ratings are obviously reviewed on a regular basis. Table 8.4, compiled by Moody,shows how over a 30 year period the different corporate bond rating categories have changedover a five year time horizon.3 The table shows that on average over a five year period, 56.0 %of originally Aaa rated bonds are still rated Aaa, but that 23.3 % have been downgraded to Aa
3 Since this survey is based on bonds rated by Moody, it is heavily biased to US securities.
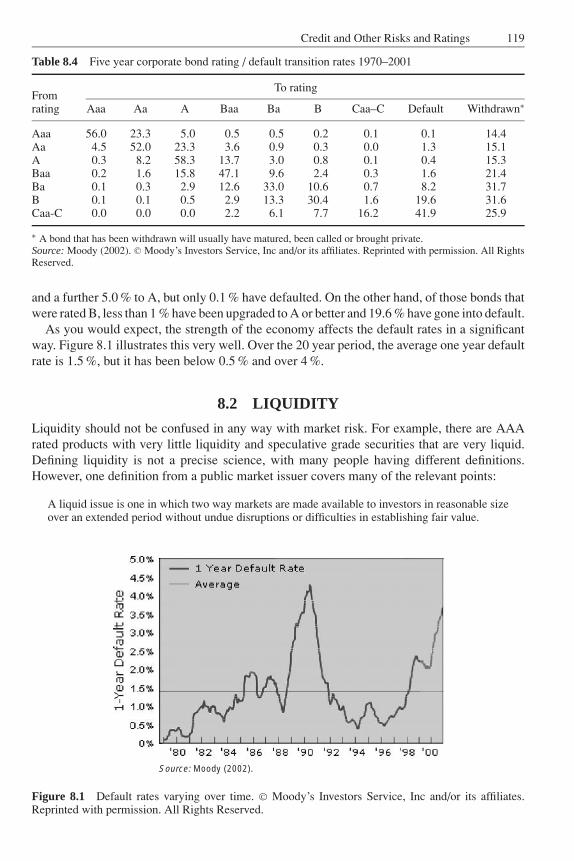
JWBK090-08 JWBK090/Brown March 3, 2006 11:19 Char Count= 0
Credit and Other Risks and Ratings 119
Table 8.4 Five year corporate bond rating / default transition rates 1970–2001
To ratingFromrating Aaa Aa A Baa Ba B Caa–C Default Withdrawn∗
Aaa 56.0 23.3 5.0 0.5 0.5 0.2 0.1 0.1 14.4Aa 4.5 52.0 23.3 3.6 0.9 0.3 0.0 1.3 15.1A 0.3 8.2 58.3 13.7 3.0 0.8 0.1 0.4 15.3Baa 0.2 1.6 15.8 47.1 9.6 2.4 0.3 1.6 21.4Ba 0.1 0.3 2.9 12.6 33.0 10.6 0.7 8.2 31.7B 0.1 0.1 0.5 2.9 13.3 30.4 1.6 19.6 31.6Caa-C 0.0 0.0 0.0 2.2 6.1 7.7 16.2 41.9 25.9
∗ A bond that has been withdrawn will usually have matured, been called or brought private.Source: Moody (2002). C© Moody’s Investors Service, Inc and/or its affiliates. Reprinted with permission. All RightsReserved.
and a further 5.0 % to A, but only 0.1 % have defaulted. On the other hand, of those bonds thatwere rated B, less than 1 % have been upgraded to A or better and 19.6 % have gone into default.
As you would expect, the strength of the economy affects the default rates in a significantway. Figure 8.1 illustrates this very well. Over the 20 year period, the average one year defaultrate is 1.5 %, but it has been below 0.5 % and over 4 %.
8.2 LIQUIDITY
Liquidity should not be confused in any way with market risk. For example, there are AAArated products with very little liquidity and speculative grade securities that are very liquid.Defining liquidity is not a precise science, with many people having different definitions.However, one definition from a public market issuer covers many of the relevant points:
A liquid issue is one in which two way markets are made available to investors in reasonable sizeover an extended period without undue disruptions or difficulties in establishing fair value.
Source: Moody (2002).
Figure 8.1 Default rates varying over time. C© Moody’s Investors Service, Inc and/or its affiliates.Reprinted with permission. All Rights Reserved.
JWBK090-08 JWBK090/Brown March 3, 2006 11:19 Char Count= 0
120 An Introduction to the Bond Markets
This definition obviously has many caveats. However, in principle it should mean that ifinvestors hold liquid bonds then, if they want to sell them before maturity, they can do so ata fair price. As you would expect, investors are prepared to pay for liquidity, because it givesthem an option, which is not available with an illiquid issue.
Let us now consider some of the positive and negative factors that determine liquidity:� Name of issuer.If the issuer is either a well-known company or a government, then the issue is more likely tobe liquid. In a previous chapter, we discussed the type of collateral used for repo transactions.In Europe, the majority of the collateral was provided by central government debt, andpartially as a result, such debt is likely to be among the most liquid.� Size of issue.Usually the larger the issue the more liquid.� Denominations.Some bonds are only issued with denominations of at least €100 000 or equivalent in anothercurrency. Such bonds, where the minimum trading size is the minimum denomination, arenot designed to be liquid. In Europe most domestic government debt is now tradeable inunits of €1.00 or less.� Currency of issue.The holders of a bond issue are no longer just from one country. For example, look at theChinese investment in US Treasury issues. If an investor predicts that the currency of abond issue is likely to depreciate against another currency, then the investor will not want toinvest in it even if it is relatively cheap compared with other bonds denominated in the samecurrency.� Credit rating.Although above it was stressed that liquidity and credit rating are two separate measures,the credit rating of a bond does have an effect on its liquidity, as some fund managers are notallowed to hold bonds that are rated below a certain level. This level is often set at whetherthey are rated as investment grade (at least BBB− or Baa−) or not, but sometimes it is sethigher.� Complexity of structure.If a bond does not include any embedded options, e.g. it is a fixed-rate option-free bulletbond, then as it makes it very easy to value and compare with other similar bonds, it tendsto be more liquid than bonds with embedded options. Similarly, the more complicated theembedded option, the less liquid it is likely to be. In fact, some options are designed forspecific investors, who are expected normally to hold the bond until maturity. Bond investorslike to have certainty about future cash flows when evaluating how much a bond is worth,with the result that even a straightforward call option that is exercisable imminently canreduce its liquidity.� Number of market makers.In the eurobond markets, over a number of years it has been observed that the most liquidsecurities are those with five or more committed market makers. However, this measure maybe regarded as a ‘chicken and egg’ situation – which came first?� Bid/offer price spread.The smaller the market maker’s bid/offer price spread, the more liquid the bond is likelyto be, since the market maker believes that he or she will be able to transact the other sideof the trade at a profit. As a word of caution, except in some regulated mainly domestic
JWBK090-08 JWBK090/Brown March 3, 2006 11:19 Char Count= 0
Credit and Other Risks and Ratings 121
government markets, the market maker can instantaneously drastically increase the quotedspread.� Benchmark status.Bonds that have benchmark status and/or are included in bond market liquid indices arelikely to be more liquid than similar bonds that are not.� Initial number of bond holders.If, when the bond is initially issued, the majority of the bonds are placed with only a handfulof investors, the bond is unlikely to be very liquid. In such cases, the bond may even havebeen constructed to meet their specific needs, and as a result there is a high expectancy thatthey will be long-term holders.� Years since issue.Except in the case of government and similar issues, which are used for stock lending andcollateral and which may be increased in size by new tranche issues, the longer it is sincethe bond was issued the less liquid it is likely to be. This is partly due to the fact that aftera while a significant proportion of the bonds end up in the portfolios of pension funds andinsurance companies, who are long-term holders.

JWBK090-08 JWBK090/Brown March 3, 2006 11:19 Char Count= 0
122
JWBK090-09 JWBK090/Brown March 3, 2006 12:2 Char Count= 0
9
Swaps, Futures and Derivatives
The global capital markets have considerably increased their use of derivatives over the lasttwenty years or so. It is the flexibility of derivative instruments, which can be created to allow foralmost any financial activity or credit risk, that has helped to make them so popular. Derivativescome in many forms: swaps, forward rate agreements, futures, credit default swaps, optionsand many combinations of the above such as swaptions.
9.1 SWAPS
The swap market over recent years has grown considerably, with the result that it is nowvery large and very flexible. According to a survey, conducted by the Bank for InternationalSettlements (BIS),1 of the OTC (over-the-counter) derivatives market activity in the secondhalf of 2004, the notional amounts outstanding at the end of December 2004 of interest ratecontracts amounted to some $187 trillion with a gross market value of $5.3 trillion. Of these,the majority were interest rate swaps (see Figure 9.1).
Interest rate OTC contracts tend to have a much longer life than repos, which frequentlyhave an initial maturity of under one month. Of the outstanding OTC interest rate contracts,over 25 % of them had an outstanding life to maturity of over five years and about two-thirdsover one year (see Figure 9.2). Similarly, the most popular currency is now the euro, wherethe activity represents 8.4 % more of the total activity than the US dollar (see Figure 9.3).
The majority of swaps include synthetic securities that are often constructed in part fromcash market securities and may include currency exchange rates. In addition to ‘interest rateswaps’, which are the most important, there are several other types of swaps, e.g. ‘asset swaps’,‘basis swaps’, ‘cross-currency swaps’ and ‘forward rate agreements’.
9.1.1 Interest rate swap
There are in the main two different types of debt, fixed-rate and floating-rate. The value offixed-rate debt changes if interest rates change, but the interest payments remain unchanged. Ifinterest rates rise then its price drops and vice versa. On the other hand, the value of floating-rate debt normally remains close to par irrespective of the changes in the interest rates, whichare usually reset near the beginning of each coupon period. A holder of a fixed-rate bond mayfeel that interest rates are going to rise over the next few years, or the income from this bondhas to service an obligation where the payments vary with the short-term interest rate. In eithercase the holder would like to switch the income flow from fixed to floating. An interest rateswap enables this to be done.
An interest rate swap between two parties involves one party exchanging a stream of fixed-rate coupon payments, frequently from a cash bond market instrument, for floating-rate coupon
1 The official website of the Bank of International Settlements is www.bis.org.
123
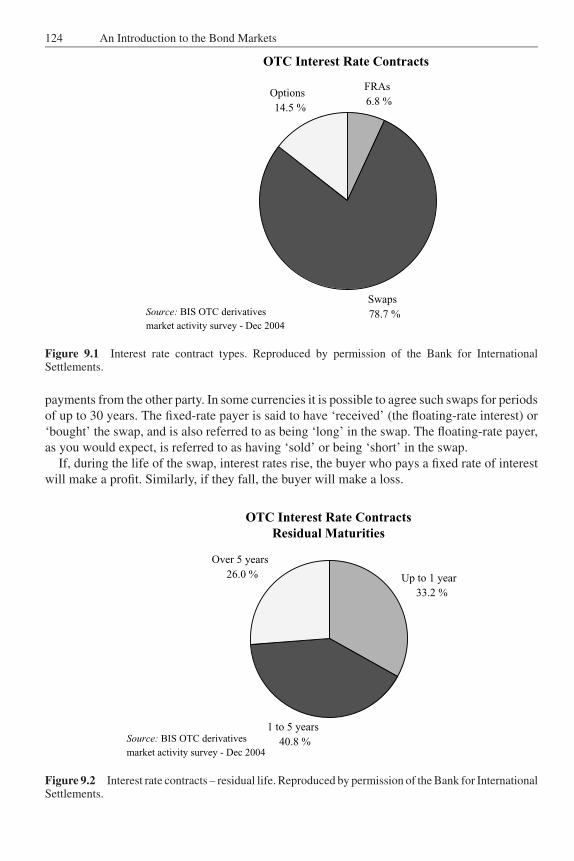
JWBK090-09 JWBK090/Brown March 3, 2006 12:2 Char Count= 0
124 An Introduction to the Bond Markets
OTC Interest Rate Contracts
FRAs
6.8 %
Swaps
78.7 %
Options
14.5 %
Source: BIS OTC derivatives
market activity survey - Dec 2004
Figure 9.1 Interest rate contract types. Reproduced by permission of the Bank for InternationalSettlements.
payments from the other party. In some currencies it is possible to agree such swaps for periodsof up to 30 years. The fixed-rate payer is said to have ‘received’ (the floating-rate interest) or‘bought’ the swap, and is also referred to as being ‘long’ in the swap. The floating-rate payer,as you would expect, is referred to as having ‘sold’ or being ‘short’ in the swap.
If, during the life of the swap, interest rates rise, the buyer who pays a fixed rate of interestwill make a profit. Similarly, if they fall, the buyer will make a loss.
OTC Interest Rate ContractsResidual Maturities
Up to 1 year
33.2 %
1 to 5 years
40.8 %
Over 5 years
26.0 %
Source: BIS OTC derivatives
market activity survey - Dec 2004
Figure 9.2 Interest rate contracts – residual life. Reproduced by permission of the Bank for InternationalSettlements.
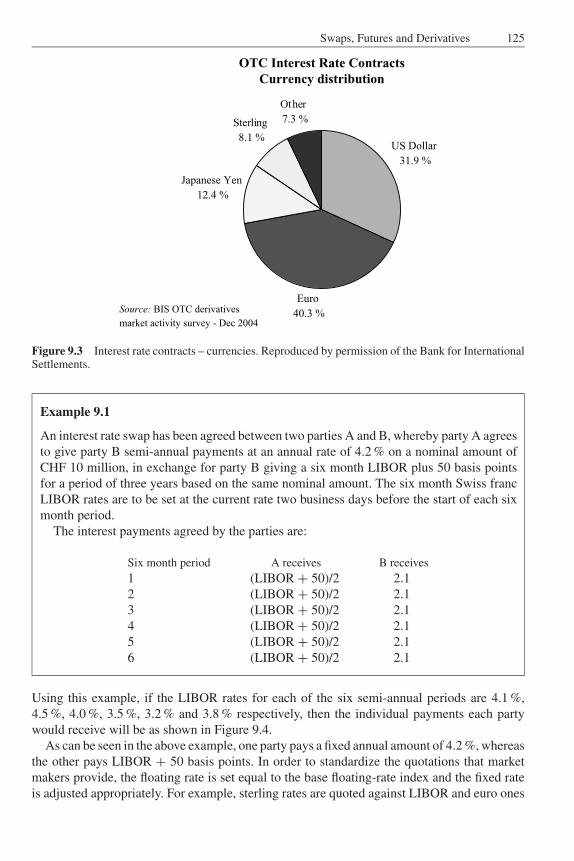
JWBK090-09 JWBK090/Brown March 3, 2006 12:2 Char Count= 0
Swaps, Futures and Derivatives 125
OTC Interest Rate ContractsCurrency distribution
US Dollar
31.9 %
Euro
40.3 %
Japanese Yen
12.4 %
Sterling
8.1 %
Other
7.3 %
Source: BIS OTC derivatives
market activity survey - Dec 2004
Figure 9.3 Interest rate contracts – currencies. Reproduced by permission of the Bank for InternationalSettlements.
Example 9.1
An interest rate swap has been agreed between two parties A and B, whereby party A agreesto give party B semi-annual payments at an annual rate of 4.2 % on a nominal amount ofCHF 10 million, in exchange for party B giving a six month LIBOR plus 50 basis pointsfor a period of three years based on the same nominal amount. The six month Swiss francLIBOR rates are to be set at the current rate two business days before the start of each sixmonth period.
The interest payments agreed by the parties are:
Six month period A receives B receives
1 (LIBOR + 50)/2 2.12 (LIBOR + 50)/2 2.13 (LIBOR + 50)/2 2.14 (LIBOR + 50)/2 2.15 (LIBOR + 50)/2 2.16 (LIBOR + 50)/2 2.1
Using this example, if the LIBOR rates for each of the six semi-annual periods are 4.1 %,4.5 %, 4.0 %, 3.5 %, 3.2 % and 3.8 % respectively, then the individual payments each partywould receive will be as shown in Figure 9.4.
As can be seen in the above example, one party pays a fixed annual amount of 4.2 %, whereasthe other pays LIBOR + 50 basis points. In order to standardize the quotations that marketmakers provide, the floating rate is set equal to the base floating-rate index and the fixed rateis adjusted appropriately. For example, sterling rates are quoted against LIBOR and euro ones
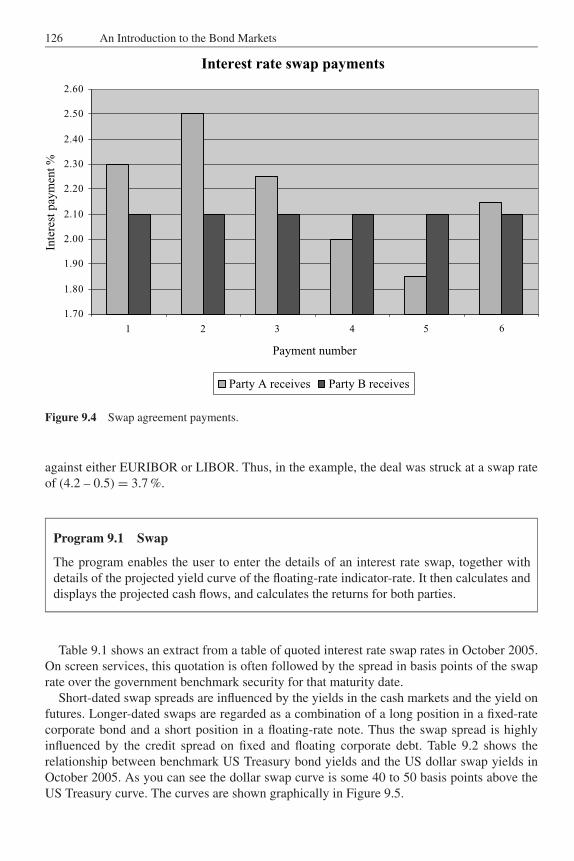
JWBK090-09 JWBK090/Brown March 3, 2006 12:2 Char Count= 0
126 An Introduction to the Bond Markets
Interest rate swap payments
1.70
1.80
1.90
2.00
2.10
2.20
2.30
2.40
2.50
2.60
1 2 3 4 5
Payment number
Inte
rest
pay
men
t %
Party A receives Party B receives
6
Figure 9.4 Swap agreement payments.
against either EURIBOR or LIBOR. Thus, in the example, the deal was struck at a swap rateof (4.2 – 0.5) = 3.7 %.
Program 9.1 Swap
The program enables the user to enter the details of an interest rate swap, together withdetails of the projected yield curve of the floating-rate indicator-rate. It then calculates anddisplays the projected cash flows, and calculates the returns for both parties.
Table 9.1 shows an extract from a table of quoted interest rate swap rates in October 2005.On screen services, this quotation is often followed by the spread in basis points of the swaprate over the government benchmark security for that maturity date.
Short-dated swap spreads are influenced by the yields in the cash markets and the yield onfutures. Longer-dated swaps are regarded as a combination of a long position in a fixed-ratecorporate bond and a short position in a floating-rate note. Thus the swap spread is highlyinfluenced by the credit spread on fixed and floating corporate debt. Table 9.2 shows therelationship between benchmark US Treasury bond yields and the US dollar swap yields inOctober 2005. As you can see the dollar swap curve is some 40 to 50 basis points above theUS Treasury curve. The curves are shown graphically in Figure 9.5.
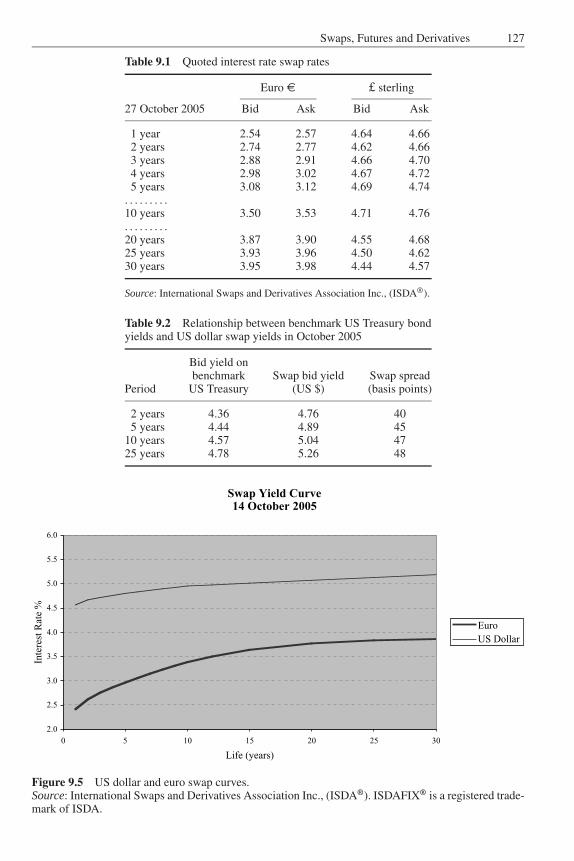
JWBK090-09 JWBK090/Brown March 3, 2006 12:2 Char Count= 0
Swaps, Futures and Derivatives 127
Table 9.1 Quoted interest rate swap rates
Euro € £ sterling
27 October 2005 Bid Ask Bid Ask
1 year 2.54 2.57 4.64 4.662 years 2.74 2.77 4.62 4.663 years 2.88 2.91 4.66 4.704 years 2.98 3.02 4.67 4.725 years 3.08 3.12 4.69 4.74
. . . . . . . . .10 years 3.50 3.53 4.71 4.76. . . . . . . . .20 years 3.87 3.90 4.55 4.6825 years 3.93 3.96 4.50 4.6230 years 3.95 3.98 4.44 4.57
Source: International Swaps and Derivatives Association Inc., (ISDA®).
Table 9.2 Relationship between benchmark US Treasury bondyields and US dollar swap yields in October 2005
Bid yield onbenchmark Swap bid yield Swap spread
Period US Treasury (US $) (basis points)
2 years 4.36 4.76 405 years 4.44 4.89 45
10 years 4.57 5.04 4725 years 4.78 5.26 48
Swap Yield Curve14 October 2005
2.0
2.5
3.0
3.5
4.0
4.5
5.0
5.5
6.0
0 5 10 15 20 25 30
Life (years)
Inte
rest
Rat
e %
Euro
US Dollar
Figure 9.5 US dollar and euro swap curves.Source: International Swaps and Derivatives Association Inc., (ISDA®). ISDAFIX® is a registered trade-mark of ISDA.
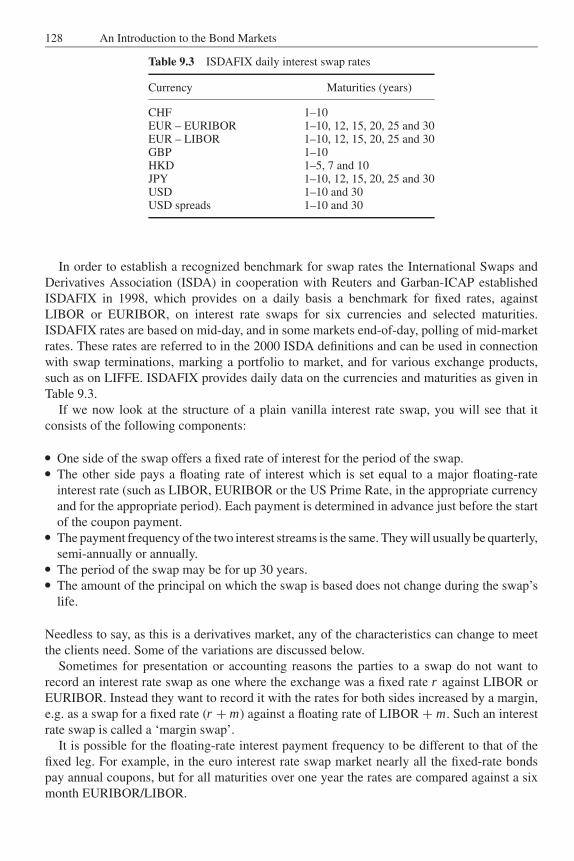
JWBK090-09 JWBK090/Brown March 3, 2006 12:2 Char Count= 0
128 An Introduction to the Bond Markets
Table 9.3 ISDAFIX daily interest swap rates
Currency Maturities (years)
CHF 1–10EUR – EURIBOR 1–10, 12, 15, 20, 25 and 30EUR – LIBOR 1–10, 12, 15, 20, 25 and 30GBP 1–10HKD 1–5, 7 and 10JPY 1–10, 12, 15, 20, 25 and 30USD 1–10 and 30USD spreads 1–10 and 30
In order to establish a recognized benchmark for swap rates the International Swaps andDerivatives Association (ISDA) in cooperation with Reuters and Garban-ICAP establishedISDAFIX in 1998, which provides on a daily basis a benchmark for fixed rates, againstLIBOR or EURIBOR, on interest rate swaps for six currencies and selected maturities.ISDAFIX rates are based on mid-day, and in some markets end-of-day, polling of mid-marketrates. These rates are referred to in the 2000 ISDA definitions and can be used in connectionwith swap terminations, marking a portfolio to market, and for various exchange products,such as on LIFFE. ISDAFIX provides daily data on the currencies and maturities as given inTable 9.3.
If we now look at the structure of a plain vanilla interest rate swap, you will see that itconsists of the following components:� One side of the swap offers a fixed rate of interest for the period of the swap.� The other side pays a floating rate of interest which is set equal to a major floating-rate
interest rate (such as LIBOR, EURIBOR or the US Prime Rate, in the appropriate currencyand for the appropriate period). Each payment is determined in advance just before the startof the coupon payment.� The payment frequency of the two interest streams is the same. They will usually be quarterly,semi-annually or annually.� The period of the swap may be for up 30 years.� The amount of the principal on which the swap is based does not change during the swap’slife.
Needless to say, as this is a derivatives market, any of the characteristics can change to meetthe clients need. Some of the variations are discussed below.
Sometimes for presentation or accounting reasons the parties to a swap do not want torecord an interest rate swap as one where the exchange was a fixed rate r against LIBOR orEURIBOR. Instead they want to record it with the rates for both sides increased by a margin,e.g. as a swap for a fixed rate (r + m) against a floating rate of LIBOR + m. Such an interestrate swap is called a ‘margin swap’.
It is possible for the floating-rate interest payment frequency to be different to that of thefixed leg. For example, in the euro interest rate swap market nearly all the fixed-rate bondspay annual coupons, but for all maturities over one year the rates are compared against a sixmonth EURIBOR/LIBOR.
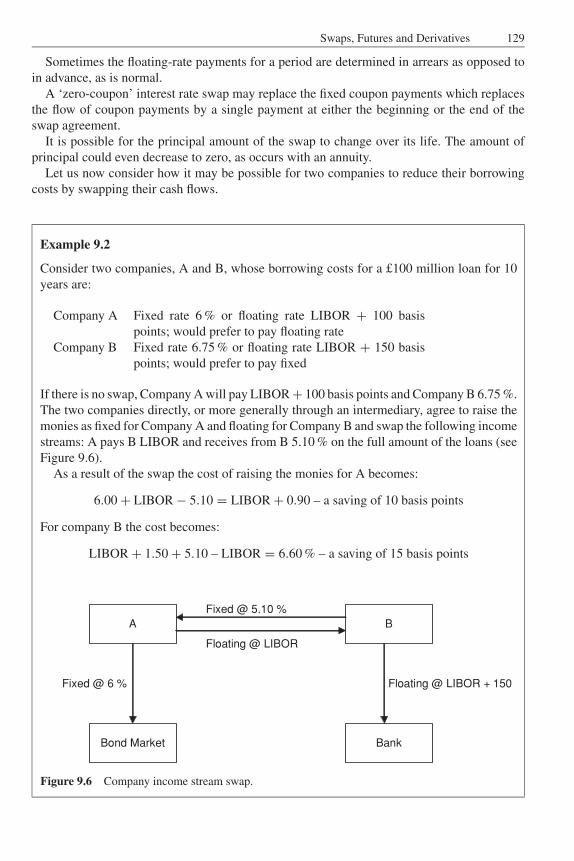
JWBK090-09 JWBK090/Brown March 3, 2006 12:2 Char Count= 0
Swaps, Futures and Derivatives 129
Sometimes the floating-rate payments for a period are determined in arrears as opposed toin advance, as is normal.
A ‘zero-coupon’ interest rate swap may replace the fixed coupon payments which replacesthe flow of coupon payments by a single payment at either the beginning or the end of theswap agreement.
It is possible for the principal amount of the swap to change over its life. The amount ofprincipal could even decrease to zero, as occurs with an annuity.
Let us now consider how it may be possible for two companies to reduce their borrowingcosts by swapping their cash flows.
Example 9.2
Consider two companies, A and B, whose borrowing costs for a £100 million loan for 10years are:
Company A Fixed rate 6 % or floating rate LIBOR + 100 basispoints; would prefer to pay floating rate
Company B Fixed rate 6.75 % or floating rate LIBOR + 150 basispoints; would prefer to pay fixed
If there is no swap, Company A will pay LIBOR + 100 basis points and Company B 6.75 %.The two companies directly, or more generally through an intermediary, agree to raise themonies as fixed for Company A and floating for Company B and swap the following incomestreams: A pays B LIBOR and receives from B 5.10 % on the full amount of the loans (seeFigure 9.6).
As a result of the swap the cost of raising the monies for A becomes:
6.00 + LIBOR − 5.10 = LIBOR + 0.90 – a saving of 10 basis points
For company B the cost becomes:
LIBOR + 1.50 + 5.10 – LIBOR = 6.60 % – a saving of 15 basis points
A B
Bond Market Bank
Fixed @ 6 % Floating @ LIBOR + 150
Fixed @ 5.10 %
Floating @ LIBOR
Figure 9.6 Company income stream swap.
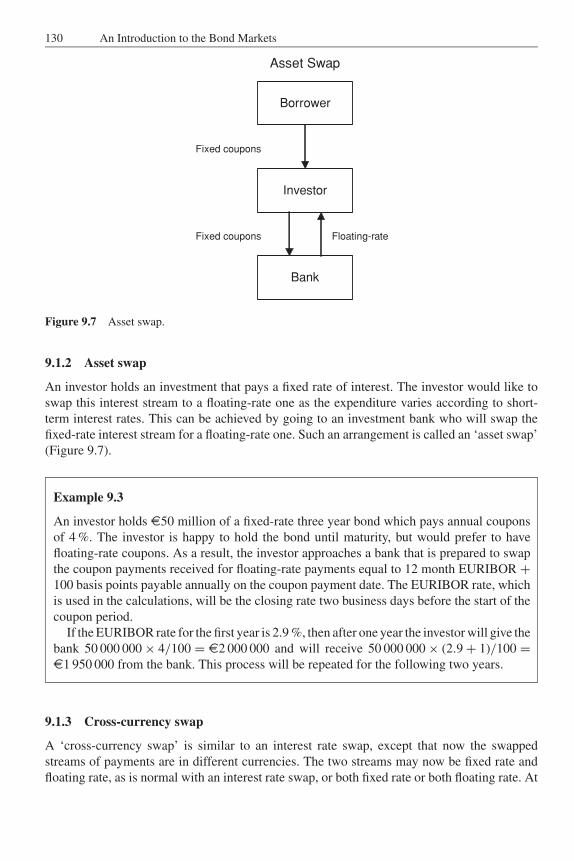
JWBK090-09 JWBK090/Brown March 3, 2006 12:2 Char Count= 0
130 An Introduction to the Bond Markets
Asset Swap
Borrower
Investor
Bank
Fixed coupons
Fixed coupons Floating-rate
Figure 9.7 Asset swap.
9.1.2 Asset swap
An investor holds an investment that pays a fixed rate of interest. The investor would like toswap this interest stream to a floating-rate one as the expenditure varies according to short-term interest rates. This can be achieved by going to an investment bank who will swap thefixed-rate interest stream for a floating-rate one. Such an arrangement is called an ‘asset swap’(Figure 9.7).
Example 9.3
An investor holds €50 million of a fixed-rate three year bond which pays annual couponsof 4 %. The investor is happy to hold the bond until maturity, but would prefer to havefloating-rate coupons. As a result, the investor approaches a bank that is prepared to swapthe coupon payments received for floating-rate payments equal to 12 month EURIBOR +100 basis points payable annually on the coupon payment date. The EURIBOR rate, whichis used in the calculations, will be the closing rate two business days before the start of thecoupon period.
If the EURIBOR rate for the first year is 2.9 %, then after one year the investor will give thebank 50 000 000 × 4/100 = €2 000 000 and will receive 50 000 000 × (2.9 + 1)/100 =€1 950 000 from the bank. This process will be repeated for the following two years.
9.1.3 Cross-currency swap
A ‘cross-currency swap’ is similar to an interest rate swap, except that now the swappedstreams of payments are in different currencies. The two streams may now be fixed rate andfloating rate, as is normal with an interest rate swap, or both fixed rate or both floating rate. At
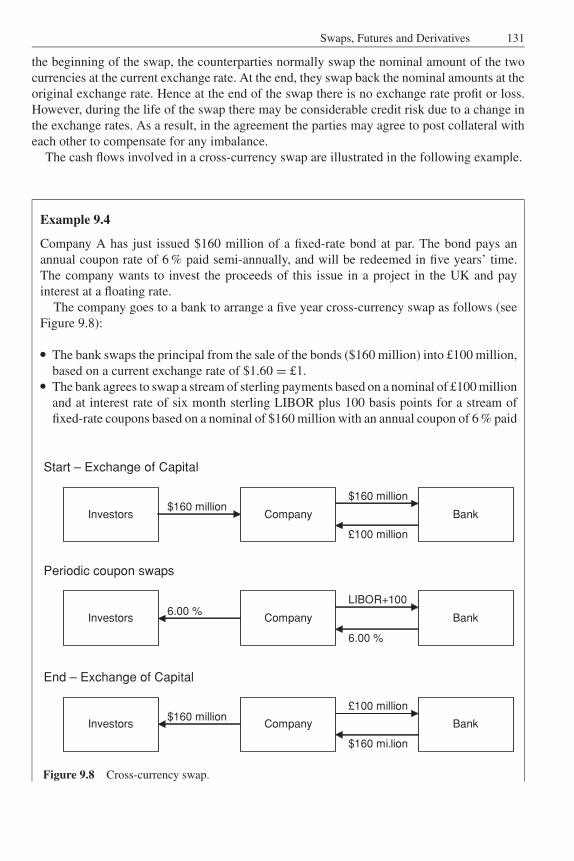
JWBK090-09 JWBK090/Brown March 3, 2006 12:2 Char Count= 0
Swaps, Futures and Derivatives 131
the beginning of the swap, the counterparties normally swap the nominal amount of the twocurrencies at the current exchange rate. At the end, they swap back the nominal amounts at theoriginal exchange rate. Hence at the end of the swap there is no exchange rate profit or loss.However, during the life of the swap there may be considerable credit risk due to a change inthe exchange rates. As a result, in the agreement the parties may agree to post collateral witheach other to compensate for any imbalance.
The cash flows involved in a cross-currency swap are illustrated in the following example.
Example 9.4
Company A has just issued $160 million of a fixed-rate bond at par. The bond pays anannual coupon rate of 6 % paid semi-annually, and will be redeemed in five years’ time.The company wants to invest the proceeds of this issue in a project in the UK and payinterest at a floating rate.
The company goes to a bank to arrange a five year cross-currency swap as follows (seeFigure 9.8):� The bank swaps the principal from the sale of the bonds ($160 million) into £100 million,
based on a current exchange rate of $1.60 = £1.� The bank agrees to swap a stream of sterling payments based on a nominal of £100 millionand at interest rate of six month sterling LIBOR plus 100 basis points for a stream offixed-rate coupons based on a nominal of $160 million with an annual coupon of 6 % paid
Start – Exchange of Capital
Investors Company Bank$160 million
$160 million
£100 million
Periodic coupon swaps
Investors Company Bank6.00 %
LIBOR+100
6.00 %
End – Exchange of Capital
Investors Company Bank$160 million
£100 million
$160 mi.lion
Figure 9.8 Cross-currency swap.
JWBK090-09 JWBK090/Brown March 3, 2006 12:2 Char Count= 0
132 An Introduction to the Bond Markets
semi-annually. In this way the income stream received from the bank is just sufficient to servicethe coupon payments on the bond.� After five years the swap contract and the bond issue mature. The payments stop and the principalsare exchanged back at the original exchange rate. The company now has sufficient dollar funds toredeem the bond issue.
9.1.4 Basis swap
A ‘basis’ swap is very similar to an interest rate swap, except that now both parties to theagreement exchange floating-rate cash flows. There are innumerable varieties of cash flowsthat can be exchanged. Some examples are:� The parties agree to swap interest on a nominal of €100 million. Party A agrees to swap
interest calculated on the basis of the one year euro swap rate plus 20 basis points, in exchangefor interest on the ten year euro swap rate. This swap is in effect a derivative based on theshape of the euro swap yield curve during the life of the contract.� The parties agree to swap interest based on the US prime rate with that of the dollar LIBORin London.� The parties agree to swap interest based on $100 million nominal at a rate of 6 month USdollar LIBOR with an equivalent cash flow stream based on 6 month euro EURIBOR plus200 basis points. Normally at the beginning of the agreement, the two parties also exchangethe principal amounts of the two currencies. At the end of the swap agreement, the currenciesare swapped back at the original exchange rate.
9.1.5 Forward rate agreement
A ‘forward rate agreement’ (FRA) is essentially a special type of interest rate swap. Withan FRA there is a swap of a single fixed-rate payment against a floating-rate payment. Theagreement refers to a single period that starts at a date in the future. The floating-rate interestpayment is normally determined two working days before the start of the period. At this timethe profit or loss on the transaction can be calculated. This difference is now payable at thebeginning instead of at the end of the forward rate agreement period, but to compensate forthis the amount due is discounted by the floating-rate interest rate.
Example 9.5
Consider the following forward rate agreement. In 2005, party A agrees to exchange withparty B the income earned on $10 million nominal at a rate of 5 % per annum with thatearned on a six month US dollar LIBOR, for the six month period between 15 January 2009and 15 July 2009.
On 13 January 2009, two days before the start of the forward rate agreement, the quotedrate for the six month US dollar LIBOR is 4 %. As a result of this FRA,
Party A owes party B 0.05 × 10 000 000/2 = $250 000Party B owes party A 0.04 × 10 000 000/2 = $200 000
JWBK090-09 JWBK090/Brown March 3, 2006 12:2 Char Count= 0
Swaps, Futures and Derivatives 133
Net position:
Party A owes party B = $50 000
The net amount is discounted back to 15 January 2009 at a discount rate of 4 %. Thus, on15 January 2009, party A owes party B:
50 000/(1 + 0.04/2) = $49 019.61
Program 9.2 FRA
This program allows users to enter the terms of a forward rate agreement (FRA). It calculatesthe associated profit/loss for the parties.
9.2 CREDIT RISK IN SWAPS
If a bank makes an unsecured loan of, say, $100 million to a company for three years, then thebank is at risk that the company may go bankrupt during this time and as a result it could losea substantial part of this loan. The credit risk is much less with interest swaps, as it is only theincome streams that have been swapped, but it still exists.
If you consider a 30 year interest rate swap, during its life interest rates can vary considerably,with the result that the amounts payable and receivable on the swap can get very much out ofline. For example, if a swap is taken out when interest rates are 3 % and they rise to 9 %, thenthe floating-rate payer will have to pay three times as much as when the contract started. If thefloating-rate payer defaults with, say, 10 years of the contract still to run, then the fixed-ratepayer would lose out on a very profitable contract. To compensate for this, the swap agreementmight include a clause to evaluate the credit risk (mark-to-market) on a regular basis and forthe losing party to post an appropriate amount of collateral with the winning party.
9.3 SWAPTIONS
A ‘swaption’ is just an option on a swap. The buyer of a swaption has the option but not theobligation to purchase an interest rate swap agreement during the life of the option. The termsof the agreement will specify whether the buyer is a fixed-rate payer or a floating-rate payer.The counterparty to the swaption (the seller or writer) becomes the counterparty to the interestrate swap if the buyer exercises the option.
Swaptions are valued in the same way as other options. Similarly, the profit and loss profilesfor the buyers and the writers are very similar. A buyer of a swaption cannot lose more thanthe initial cost, unless of course the buyer exercises the option.
9.4 FUTURES
A future contract is an agreement between two parties that commits them to exchange somegoods at a specified rate at a specified future date. Futures trading, especially in commodities,has been around for a very long time. Today most of the trading in financial derivative futures
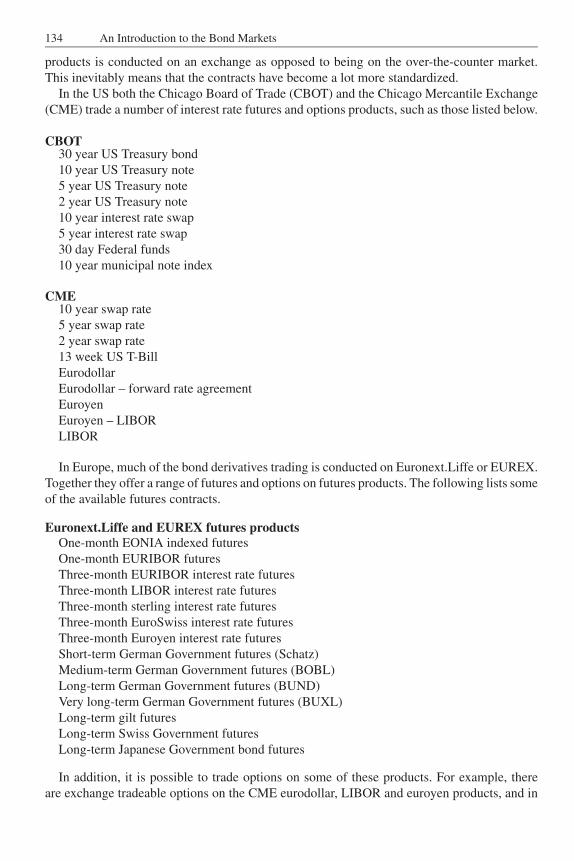
JWBK090-09 JWBK090/Brown March 3, 2006 12:2 Char Count= 0
134 An Introduction to the Bond Markets
products is conducted on an exchange as opposed to being on the over-the-counter market.This inevitably means that the contracts have become a lot more standardized.
In the US both the Chicago Board of Trade (CBOT) and the Chicago Mercantile Exchange(CME) trade a number of interest rate futures and options products, such as those listed below.
CBOT30 year US Treasury bond10 year US Treasury note5 year US Treasury note2 year US Treasury note10 year interest rate swap5 year interest rate swap30 day Federal funds10 year municipal note index
CME10 year swap rate5 year swap rate2 year swap rate13 week US T-BillEurodollarEurodollar – forward rate agreementEuroyenEuroyen – LIBORLIBOR
In Europe, much of the bond derivatives trading is conducted on Euronext.Liffe or EUREX.Together they offer a range of futures and options on futures products. The following lists someof the available futures contracts.
Euronext.Liffe and EUREX futures productsOne-month EONIA indexed futuresOne-month EURIBOR futuresThree-month EURIBOR interest rate futuresThree-month LIBOR interest rate futuresThree-month sterling interest rate futuresThree-month EuroSwiss interest rate futuresThree-month Euroyen interest rate futuresShort-term German Government futures (Schatz)Medium-term German Government futures (BOBL)Long-term German Government futures (BUND)Very long-term German Government futures (BUXL)Long-term gilt futuresLong-term Swiss Government futuresLong-term Japanese Government bond futures
In addition, it is possible to trade options on some of these products. For example, thereare exchange tradeable options on the CME eurodollar, LIBOR and euroyen products, and in
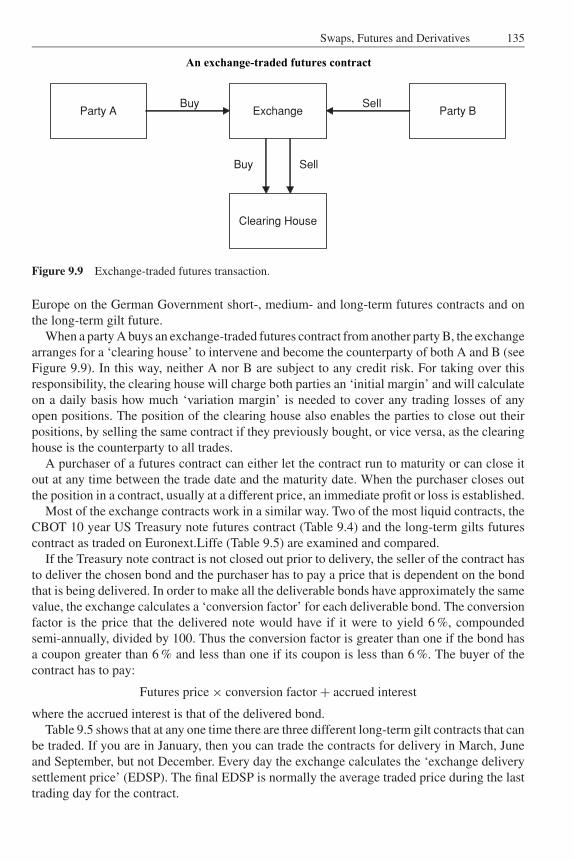
JWBK090-09 JWBK090/Brown March 3, 2006 12:2 Char Count= 0
Swaps, Futures and Derivatives 135
Party A Exchange Party B
Clearing House
Buy Sell
Buy Sell
An exchange-traded futures contract
Figure 9.9 Exchange-traded futures transaction.
Europe on the German Government short-, medium- and long-term futures contracts and onthe long-term gilt future.
When a party A buys an exchange-traded futures contract from another party B, the exchangearranges for a ‘clearing house’ to intervene and become the counterparty of both A and B (seeFigure 9.9). In this way, neither A nor B are subject to any credit risk. For taking over thisresponsibility, the clearing house will charge both parties an ‘initial margin’ and will calculateon a daily basis how much ‘variation margin’ is needed to cover any trading losses of anyopen positions. The position of the clearing house also enables the parties to close out theirpositions, by selling the same contract if they previously bought, or vice versa, as the clearinghouse is the counterparty to all trades.
A purchaser of a futures contract can either let the contract run to maturity or can close itout at any time between the trade date and the maturity date. When the purchaser closes outthe position in a contract, usually at a different price, an immediate profit or loss is established.
Most of the exchange contracts work in a similar way. Two of the most liquid contracts, theCBOT 10 year US Treasury note futures contract (Table 9.4) and the long-term gilts futurescontract as traded on Euronext.Liffe (Table 9.5) are examined and compared.
If the Treasury note contract is not closed out prior to delivery, the seller of the contract hasto deliver the chosen bond and the purchaser has to pay a price that is dependent on the bondthat is being delivered. In order to make all the deliverable bonds have approximately the samevalue, the exchange calculates a ‘conversion factor’ for each deliverable bond. The conversionfactor is the price that the delivered note would have if it were to yield 6 %, compoundedsemi-annually, divided by 100. Thus the conversion factor is greater than one if the bond hasa coupon greater than 6 % and less than one if its coupon is less than 6 %. The buyer of thecontract has to pay:
Futures price × conversion factor + accrued interest
where the accrued interest is that of the delivered bond.Table 9.5 shows that at any one time there are three different long-term gilt contracts that can
be traded. If you are in January, then you can trade the contracts for delivery in March, Juneand September, but not December. Every day the exchange calculates the ‘exchange deliverysettlement price’ (EDSP). The final EDSP is normally the average traded price during the lasttrading day for the contract.
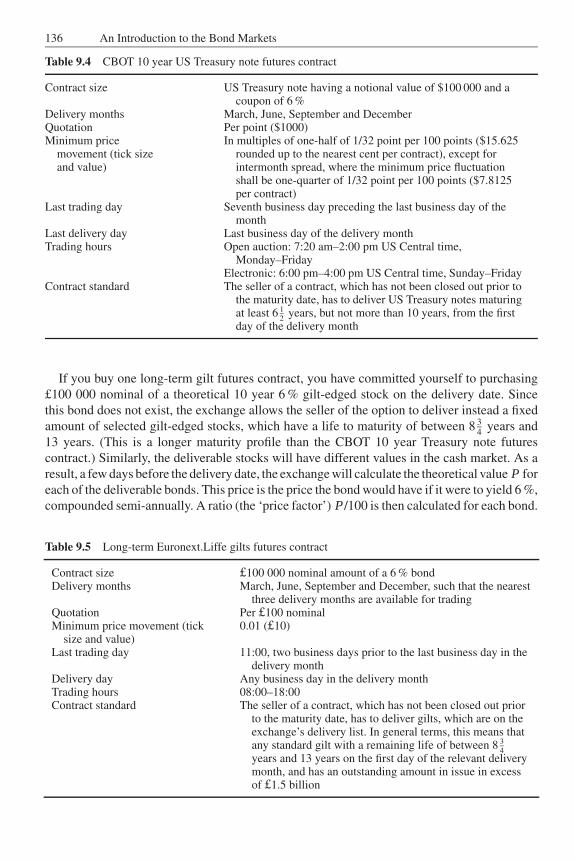
JWBK090-09 JWBK090/Brown March 3, 2006 12:2 Char Count= 0
136 An Introduction to the Bond Markets
Table 9.4 CBOT 10 year US Treasury note futures contract
Contract size US Treasury note having a notional value of $100 000 and acoupon of 6 %
Delivery months March, June, September and DecemberQuotation Per point ($1000)Minimum price
movement (tick sizeand value)
In multiples of one-half of 1/32 point per 100 points ($15.625rounded up to the nearest cent per contract), except forintermonth spread, where the minimum price fluctuationshall be one-quarter of 1/32 point per 100 points ($7.8125per contract)
Last trading day Seventh business day preceding the last business day of themonth
Last delivery day Last business day of the delivery monthTrading hours Open auction: 7:20 am–2:00 pm US Central time,
Monday–FridayElectronic: 6:00 pm–4:00 pm US Central time, Sunday–Friday
Contract standard The seller of a contract, which has not been closed out prior tothe maturity date, has to deliver US Treasury notes maturingat least 6 1
2years, but not more than 10 years, from the first
day of the delivery month
If you buy one long-term gilt futures contract, you have committed yourself to purchasing£100 000 nominal of a theoretical 10 year 6 % gilt-edged stock on the delivery date. Sincethis bond does not exist, the exchange allows the seller of the option to deliver instead a fixedamount of selected gilt-edged stocks, which have a life to maturity of between 8 3
4years and
13 years. (This is a longer maturity profile than the CBOT 10 year Treasury note futurescontract.) Similarly, the deliverable stocks will have different values in the cash market. As aresult, a few days before the delivery date, the exchange will calculate the theoretical value P foreach of the deliverable bonds. This price is the price the bond would have if it were to yield 6 %,compounded semi-annually. A ratio (the ‘price factor’) P/100 is then calculated for each bond.
Table 9.5 Long-term Euronext.Liffe gilts futures contract
Contract size £100 000 nominal amount of a 6 % bondDelivery months March, June, September and December, such that the nearest
three delivery months are available for tradingQuotation Per £100 nominalMinimum price movement (tick
size and value)0.01 (£10)
Last trading day 11:00, two business days prior to the last business day in thedelivery month
Delivery day Any business day in the delivery monthTrading hours 08:00–18:00Contract standard The seller of a contract, which has not been closed out prior
to the maturity date, has to deliver gilts, which are on theexchange’s delivery list. In general terms, this means thatany standard gilt with a remaining life of between 8 3
4years and 13 years on the first day of the relevant deliverymonth, and has an outstanding amount in issue in excessof £1.5 billion
JWBK090-09 JWBK090/Brown March 3, 2006 12:2 Char Count= 0
Swaps, Futures and Derivatives 137
If the buyer of a contract has not closed out the position the buyer has to pay an amount foreach contract equal to:
1000 × EDSP × price factor + accrued interest
where:
EDSP exchange delivery settlement price for the notice dayAccrued interest interest calculated to the settlement day
The seller of a contract, who has not closed out the position prior to the delivery date, has todeliver £100 000 of nominal of his or her chosen deliverable bond.
It can be seen that the terms of the two contracts are very similar. The method of calculatingthe conversion or price factor in the above contracts means that some bonds are cheaper todeliver than others. The market players always calculate which bond is likely to be the ‘cheapestto deliver’ in the few days before the contract matures. This, in turn, can increase the price ofthis bond relative to its peer group.
In addition, in the US market, it is possible by buying and selling the 2 year, 5 year, 10 yearand 30 year Treasury note and bond futures to protect oneself from a major change in the shapeof the US Treasury yield curve, as any change is likely to change the spread between the pricesof at least two of the futures contracts.
9.5 CREDIT DEFAULT SWAPS
A ‘credit default swap’ (CDS) is basically an insurance policy against a specified credit risk.A credit default swap most frequently consists of a corporate bond investor buying protectionagainst a default by the issuer of the bond. However, these investments can also be used toprotect the investor from other types of corporate credit risk. For example, credit default swapscan be created to protect the buyer from:� a corporate bankruptcy;� failure of the issuer to pay interest or a repayment of the principal;� debt restructuring in a way that is unfavourable to the debt holders;� debt obligations becoming due before the original scheduled redemption date;� the bond being downgraded to an unacceptable rating.
A CDS contract can allow the owner of a bond to remove the relevant credit risk from itsportfolio by transferring the specified risk to another party without transferring the title to theunderlying bond. Prior to the emergence of credit default swaps there was no readily availablevehicle that enabled this to be done. This has proved enormously popular and credit defaultswaps now represent a very significant proportion of the global credit derivatives market.
In a credit default swap (see Figure 9.10), one party ‘sells’ risk and the other counterparty‘buys’ that risk. The ‘seller’, usually the holder of the bond or other instrument, of the creditrisk pays a periodic fee to the risk ‘buyer’. In return, the risk buyer agrees to pay the seller ifthere is a default.
The settlement terms of the CDS are determined when the contract is written. If the defaultevent occurs, then this often involves exchanging the bonds at their par value, although alter-natively there may be a cash settlement, where the buyer of the risk pays the seller an amountequal to the difference between the current market price and par.
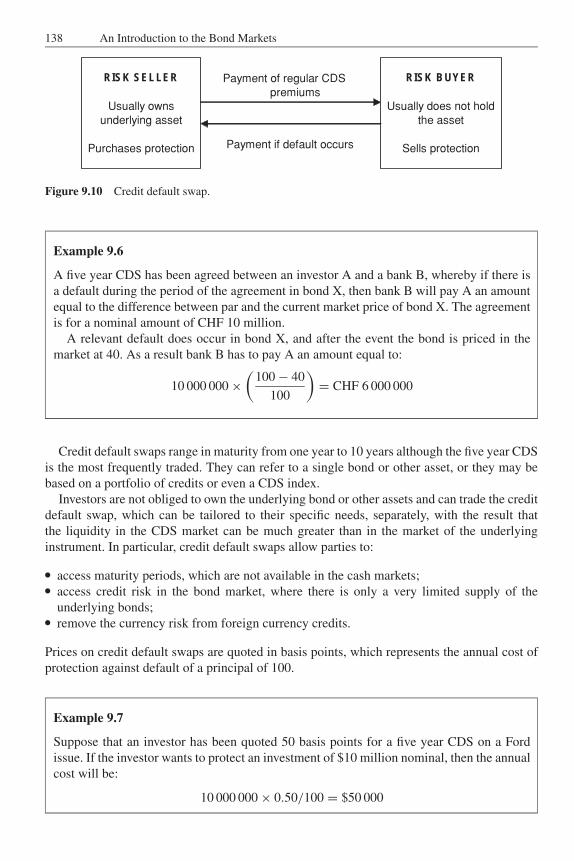
JWBK090-09 JWBK090/Brown March 3, 2006 12:2 Char Count= 0
138 An Introduction to the Bond Markets
RISK SELLER
Usually ownsunderlying asset
Purchases protection
RISK BUYER
Usually does not hold the asset
Sells protection
Payment of regular CDSpremiums
Payment if default occurs
Figure 9.10 Credit default swap.
Example 9.6
A five year CDS has been agreed between an investor A and a bank B, whereby if there isa default during the period of the agreement in bond X, then bank B will pay A an amountequal to the difference between par and the current market price of bond X. The agreementis for a nominal amount of CHF 10 million.
A relevant default does occur in bond X, and after the event the bond is priced in themarket at 40. As a result bank B has to pay A an amount equal to:
10 000 000 ×(
100 − 40
100
)= CHF 6 000 000
Credit default swaps range in maturity from one year to 10 years although the five year CDSis the most frequently traded. They can refer to a single bond or other asset, or they may bebased on a portfolio of credits or even a CDS index.
Investors are not obliged to own the underlying bond or other assets and can trade the creditdefault swap, which can be tailored to their specific needs, separately, with the result thatthe liquidity in the CDS market can be much greater than in the market of the underlyinginstrument. In particular, credit default swaps allow parties to:� access maturity periods, which are not available in the cash markets;� access credit risk in the bond market, where there is only a very limited supply of the
underlying bonds;� remove the currency risk from foreign currency credits.
Prices on credit default swaps are quoted in basis points, which represents the annual cost ofprotection against default of a principal of 100.
Example 9.7
Suppose that an investor has been quoted 50 basis points for a five year CDS on a Fordissue. If the investor wants to protect an investment of $10 million nominal, then the annualcost will be:
10 000 000 × 0.50/100 = $50 000
JWBK090-09 JWBK090/Brown March 3, 2006 12:2 Char Count= 0
Swaps, Futures and Derivatives 139
As you can imagine, the cost of a CDS can change extremely rapidly. The cost of CDScontracts can also vary considerably within an overall group structure. In the case of GeneralMotors, for most of 2005 the cost of CDS protection for its bond issues was somewhat morethan that for the bonds of its profitable financing arm subsidiary GMAC. The gap increasedconsiderably following its announcement in October 2005 of its intention to sell a significantstake in GMAC, thus decoupling the CDS ratings.

JWBK090-09 JWBK090/Brown March 3, 2006 12:2 Char Count= 0
140
JWBK090-10 JWBK090/Brown March 3, 2006 11:12 Char Count= 0
10
Portfolio and Other Considerations
10.1 HOLDING PERIOD RETURNS
A portfolio manager, or for that matter any investor, may want to liquidate a portfolio of bondsat a specified date, the horizon date, in the future. Needless to say, the portfolio manager wouldlike to have a certain amount of confidence in the amount of money that would be received atthis date. In achieving this objective, the portfolio manager is presented with several challenges:� Would any coupons received before the horizon date be able to be reinvested at a satisfactory
rate?� Would the proceeds of any redemption amounts received before the horizon date be able tobe reinvested at a satisfactory rate?� What will be the value of the bond portfolio at the horizon date?� Would it be possible to redeem any outstanding bonds at a ‘fair’ value? This can sometimesbe a problem as the market makers may widen the spreads considerably for all but the mostliquid bonds.
The portfolio manager can solve this problem if he or she can find and invest in either zero-coupon bonds or bond strips of suitable quality that yield an appropriate amount and mature onthe horizon date. This is because there are no coupons or redemption proceeds to reinvest and,irrespective of movements in interest rates, the value of the portfolio at the horizon date willequal its redemption amounts. Unfortunately, such a satisfactory solution very rarely exists.
Let us now consider the performance of a single bond from now until a horizon date in fiveyears’ time. The bond, which has been trading at a price of around 100, pays an annual couponof 5 % and will be redeemed in 20 years’ time at par (100).
Such a bond has a yield of 5 %. If in five years’ time the bond is still yielding 5 %, it willstill be priced at 100. However, if the yield on the bond at the horizon date has increased to6 %, its capital value will have decreased. Conversely, if it is then yielding 4 %, its capitalvalue will have increased. The possible price movements for such a bond against changes inyields are illustrated in Figure 10.1. However, as has already been demonstrated, if the life ofthe bond is decreased, the volatility of its price (modified duration) also decreases.
The total return on this bond from now to the horizon date in five years’ time comprises acapital gain or loss plus a return from the coupons received, which will have been reinvested.The capital return per annum over the five years to the horizon date is shown for this bond fora range of yield assumptions in Figure 10.2.
So far we have not considered the effect of reinvesting the coupons. The standard redemptionyield calculation assumes that all coupons are reinvested in the original bond as soon as theyare received at the original redemption yield without any cost to the holder. In practice this isusually an impossible goal. There is obviously no possible guaranteed reinvestment rate forthe coupons, so calculations have been performed assuming they have been reinvested usingthe original yield and the horizon yield in Figure 10.3. Frequently the average reinvestmentrate should be between these two values. It can be seen that the assumption made about the
141
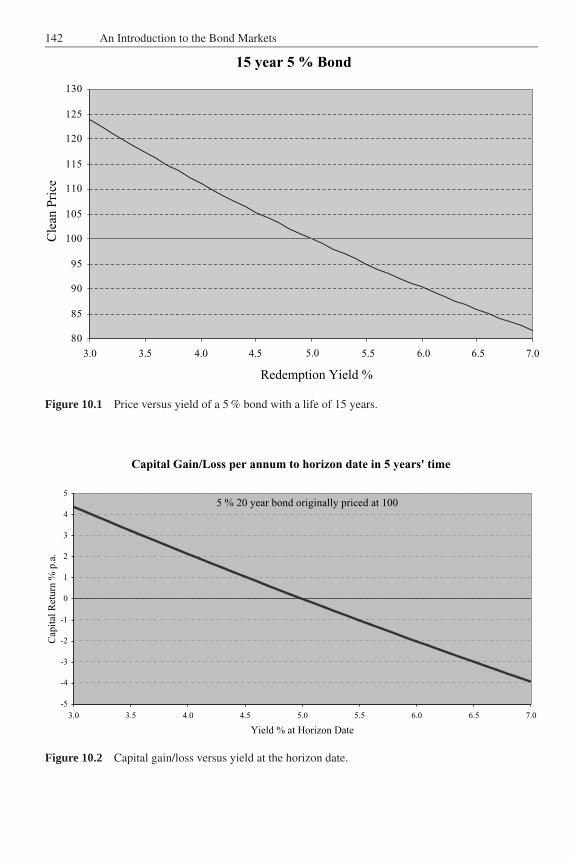
JWBK090-10 JWBK090/Brown March 3, 2006 11:12 Char Count= 0
142 An Introduction to the Bond Markets
15 year 5 % Bond
80
85
90
95
100
105
110
115
120
125
130
3.0 3.5 4.0 4.5 5.0 5.5 6.0 6.5 7.0
Redemption Yield %
Cle
an P
rice
Figure 10.1 Price versus yield of a 5 % bond with a life of 15 years.
Capital Gain/Loss per annum to horizon date in 5 years' time
-5
-4
-3
-2
-1
0
1
2
3
4
5
3.0 3.5 4.0 4.5 5.0 5.5 6.0 6.5 7.0
Yield % at Horizon Date
Cap
ital
Ret
urn
% p
.a.
5 % 20 year bond originally priced at 100
Figure 10.2 Capital gain/loss versus yield at the horizon date.
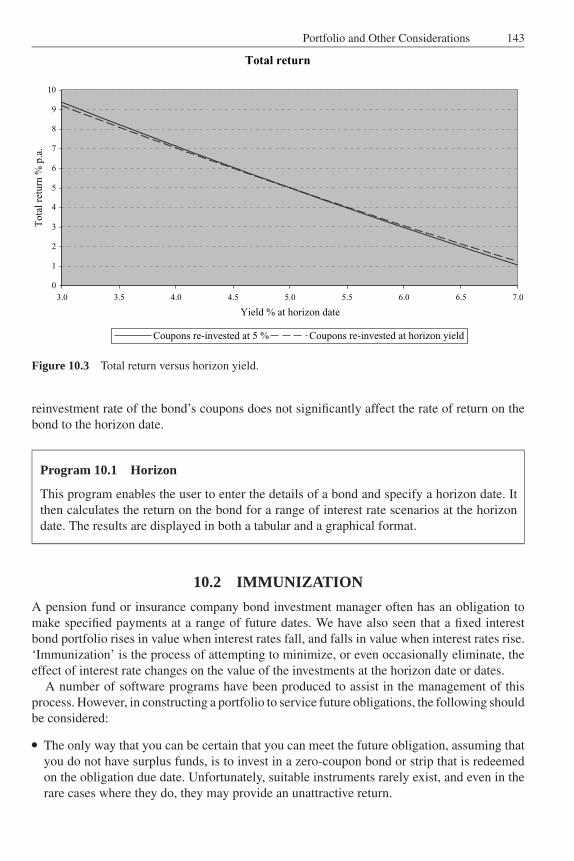
JWBK090-10 JWBK090/Brown March 3, 2006 11:12 Char Count= 0
Portfolio and Other Considerations 143
Total return
0
1
2
3
4
5
6
7
8
9
10
3.0 3.5 4.0 4.5 5.0 5.5 6.0 6.5 7.0
Yield % at horizon date
To
tal
retu
rn %
p.a
.
Coupons re-invested at 5 % Coupons re-invested at horizon yield
Figure 10.3 Total return versus horizon yield.
reinvestment rate of the bond’s coupons does not significantly affect the rate of return on thebond to the horizon date.
Program 10.1 Horizon
This program enables the user to enter the details of a bond and specify a horizon date. Itthen calculates the return on the bond for a range of interest rate scenarios at the horizondate. The results are displayed in both a tabular and a graphical format.
10.2 IMMUNIZATION
A pension fund or insurance company bond investment manager often has an obligation tomake specified payments at a range of future dates. We have also seen that a fixed interestbond portfolio rises in value when interest rates fall, and falls in value when interest rates rise.‘Immunization’ is the process of attempting to minimize, or even occasionally eliminate, theeffect of interest rate changes on the value of the investments at the horizon date or dates.
A number of software programs have been produced to assist in the management of thisprocess. However, in constructing a portfolio to service future obligations, the following shouldbe considered:� The only way that you can be certain that you can meet the future obligation, assuming that
you do not have surplus funds, is to invest in a zero-coupon bond or strip that is redeemedon the obligation due date. Unfortunately, suitable instruments rarely exist, and even in therare cases where they do, they may provide an unattractive return.
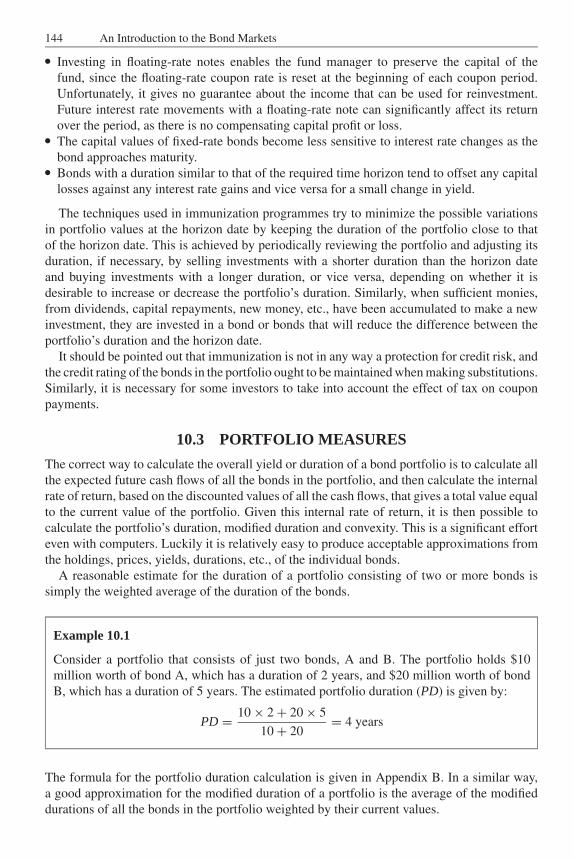
JWBK090-10 JWBK090/Brown March 3, 2006 11:12 Char Count= 0
144 An Introduction to the Bond Markets� Investing in floating-rate notes enables the fund manager to preserve the capital of thefund, since the floating-rate coupon rate is reset at the beginning of each coupon period.Unfortunately, it gives no guarantee about the income that can be used for reinvestment.Future interest rate movements with a floating-rate note can significantly affect its returnover the period, as there is no compensating capital profit or loss.� The capital values of fixed-rate bonds become less sensitive to interest rate changes as thebond approaches maturity.� Bonds with a duration similar to that of the required time horizon tend to offset any capitallosses against any interest rate gains and vice versa for a small change in yield.
The techniques used in immunization programmes try to minimize the possible variationsin portfolio values at the horizon date by keeping the duration of the portfolio close to thatof the horizon date. This is achieved by periodically reviewing the portfolio and adjusting itsduration, if necessary, by selling investments with a shorter duration than the horizon dateand buying investments with a longer duration, or vice versa, depending on whether it isdesirable to increase or decrease the portfolio’s duration. Similarly, when sufficient monies,from dividends, capital repayments, new money, etc., have been accumulated to make a newinvestment, they are invested in a bond or bonds that will reduce the difference between theportfolio’s duration and the horizon date.
It should be pointed out that immunization is not in any way a protection for credit risk, andthe credit rating of the bonds in the portfolio ought to be maintained when making substitutions.Similarly, it is necessary for some investors to take into account the effect of tax on couponpayments.
10.3 PORTFOLIO MEASURES
The correct way to calculate the overall yield or duration of a bond portfolio is to calculate allthe expected future cash flows of all the bonds in the portfolio, and then calculate the internalrate of return, based on the discounted values of all the cash flows, that gives a total value equalto the current value of the portfolio. Given this internal rate of return, it is then possible tocalculate the portfolio’s duration, modified duration and convexity. This is a significant efforteven with computers. Luckily it is relatively easy to produce acceptable approximations fromthe holdings, prices, yields, durations, etc., of the individual bonds.
A reasonable estimate for the duration of a portfolio consisting of two or more bonds issimply the weighted average of the duration of the bonds.
Example 10.1
Consider a portfolio that consists of just two bonds, A and B. The portfolio holds $10million worth of bond A, which has a duration of 2 years, and $20 million worth of bondB, which has a duration of 5 years. The estimated portfolio duration (PD) is given by:
PD = 10 × 2 + 20 × 5
10 + 20= 4 years
The formula for the portfolio duration calculation is given in Appendix B. In a similar way,a good approximation for the modified duration of a portfolio is the average of the modifieddurations of all the bonds in the portfolio weighted by their current values.
JWBK090-10 JWBK090/Brown March 3, 2006 11:12 Char Count= 0
Portfolio and Other Considerations 145
Unfortunately, this approach does not work satisfactorily for calculating the average re-demption yield of a portfolio. This is illustrated in the following example.
Example 10.2
Consider a portfolio that consists of two bonds, A and B. Bond A has a market value of£10 million, a redemption yield of 3 %, a life to maturity of 1 month and a modified durationof 1 month (0.0833 years). Bond B has a market value of £10 million, a redemption yieldof 6 %, a life to maturity of 5 years and a modified duration of 4.2 years.
The weighted average portfolio redemption yield (PRY ) if calculated in the same way asthat for duration, is:
PRY = 10 × 3 + 10 × 6
10 + 10= 4.5 %
However, the yield on bond A is only for one month, when the proceeds of the redemptionbecome available for reinvestment. If the market does not move significantly during themonth, these funds could be reinvested at a higher rate, even possibly in bond B.
The situation could have been reversed in the above example if bond A had yielded morethan bond B, potentially making it impossible for the portfolio to obtain the projected return.The solution, which gives a good approximation, is to weight the holding values by both theredemption yields and their modified durations (i.e. a discounted measure of the average timeof holding the bonds).
Example 10.2 (Continued )
The estimated portfolio redemption yield (PRY ) is now given by:
PRY = 10 × 3 × 0.0833 + 10 × 6 × 4.2
10 × 0.0833 + 10 × 4.2= 5.94 %
A value of 5.94 % for the portfolio’s redemption yield is clearly a better approximation to thetrue portfolio yield than 4.5 %. The portfolio redemption yield formula is given in Appendix B.
Program 10.2 Portfolio
This program allows the user to enter details of the bonds in a small portfolio. It thencalculates for the portfolio its projected cash flow (which is shown in a graphical format),its average yield, and Macaulay and modified durations.
10.4 ALLOWING FOR TAX
The returns on bonds in the hands of an investor are often subject to income and possiblycapital gains tax. The tax on the income is sometimes deducted before the coupon is receivedby the investor. On the other hand, especially with over-the-counter products, any income is
JWBK090-10 JWBK090/Brown March 3, 2006 11:12 Char Count= 0
146 An Introduction to the Bond Markets
received gross and it is up to the holder to declare it to the relevant tax authorities. Althoughin these two cases there is a considerable difference in the timing of the tax payments, whencalculating returns net of tax the timing differences are often ignored, and the tax is assumedto have been paid at the same time as the coupons are received.
To calculate a yield and the related calculations, such as duration and convexity, for a bondinvestment that is subject to an income tax deduction, the bond’s coupon is just netted downby the tax rate.
Example 10.3
An investment in a 5 % bond, where the coupon payments are subject to income tax of 30 %is treated as an identical bond with a 3.5 % coupon which is not subject to tax, as 5 × (1 –30 / 100) = 3.5 %.
If the holder of the bond has to pay capital gains tax on at least part of the difference betweenthe buying and selling price, then it usually suffices to reduce the selling price by the tax liabilityin calculating any returns.
Example 10.4
A holder purchased a bond some time ago for 90 and is now selling it for 100. As a resultof this sale, the holder is subject to a tax liability of 1% on the capital gain. The return onthe investment should now be calculated as if the holder were now selling it for 99 withoutany capital gains tax liability.
JWBK090-11 JWBK090/Brown March 1, 2006 8:33 Char Count= 0
11
Indices
So far we have discussed how individual bonds work together with various options and deriva-tives on specific bonds. The problem we have not discussed is how to measure the performanceof a portfolio of bonds against the average market performance of a similar group of bonds. Inorder to aid us in this comparison, a number of companies calculate a variety of bond indices. Ifyou just consider the domestic and international bond markets for straight bonds there are innu-merable numbers of indices. The list below gives you a flavour of the available types of indices:� Domestic government bond indices (government indices are calculated for nearly all the
OECD countries).� Composite government bond indices, e.g. composite indices are calculated for all the euro-zone countries.� Indices for supranational agencies, such as the World Bank or European Investment Bank.Indices are calculated for the whole category and individual issuers, and are subdividedaccording to the currency of issue.� Indices containing issues by government agencies, regional governments, municipal coun-cils, etc.� Asset-backed security indices. These are often called Pfandbriefe.� Corporate indices. These are often categorized by country of issuer, currency and evenindustry sector. They may also be categorized by the rating of the issue.
11.1 BOND INDEX CLASSIFICATIONS
Bond indices are often classified according to:� the currency of the issues;� the type of issuer, e.g. government, supranational, public sector, corporate, financial andasset-backed issuers;� the maturity band of the issues;� the rating of the bonds.
Unlike equity indices, the industrial sector of a corporate issuer is of secondary importance.Any difference between the prospects of individual industries is often reflected in the rating ofthe bonds.
Most bond calculators split their index calculations into eligible bonds that fall into a numberof maturity subdivisions. The standard maturity subdivisions are:
Bonds with a life to maturity of 1–3 years3–5 years5–7 years
7–10 years10–15 years
Over 15 years
All eligible bonds with an outstanding life of at least one year
147
JWBK090-11 JWBK090/Brown March 1, 2006 8:33 Char Count= 0
148 An Introduction to the Bond Markets
These maturity bands are often combined together to form, for example, a ‘1–5 year’ or an ‘over10 year’ index. As you can see, the number of different available bond indices is multiplyingrapidly.
Bonds are frequently removed from the indices1 when they reach one year to maturity. Thisis partly because they are now regarded as money market instruments and it is often harder totrade in them.
Producing valid and consistent bond indices is not a simple task. In fact, in some ways it ismore difficult than calculating equity indices. With equity indices, their constituent memberstend to change less often than with bonds, as each equity share normally has an indefinite life.The constituents can potentially continue to remain indefinitely in the index, and the reasonsfor its removal are unpredictable, e.g. the company is taken over, it changes its nature with theresult that it is no longer eligible for index or it ceases to exist. Nearly all bonds have a finitelife, although possibly quite a long one.2 Even with bonds that are originally issued with avery long maturity date, during their life, using the standard maturity subdivision classificationabove, they will fall into six different maturity subgroups. This is not something that usuallyhappens to equity shares.
11.2 CHOOSING INDICES
The process of choosing appropriate equity indices against which to measure one’s portfolioperformance is slightly different to that of choosing appropriate bond market indices.
In the case of equity indices, the primary selection criterion is frequently the market wherethe equities are traded and the secondary criterion is the size of the companies in the portfolio.The equity market in turn usually specifies the currency of the indices. For example, even ifcompanies that do not have a US domicile produce their accounts in US dollars, there is often asterling quotation if they are quoted in London, e.g. Standard Chartered Bank. Similarly, someportfolios tend to specialize in smaller or mid-sized companies as opposed to large companiesor not to restrict the company size. In the UK, indices such as the FTSE All-share, FTSE 100,FTSE 250 and FTSE 350 cater for these requirements. In addition, indices are also calculatedfor many industry classifications and for one of the more general indices less the companiesin a specific sector, e.g. all UK shares excluding tobacco companies and companies involvedin the arms trade.
Bond indices, on the other hand, tend to be classified by issuer type and currency. The mostcommon indices reflect the performance of bonds issued by governments in their domesticcurrency. This is mainly because governments have in the past been the largest issuers, withthe result that their bonds tend to remain liquid over time. This is in contrast to corporate issuers,where bonds frequently start their lives being very liquid, but the liquidity rapidly dries up as thebonds are placed in permanent homes with pension funds or insurance companies. However,even when corporate bonds are first issued the bid-offer price spread tends to be greater thanthat of equivalent government securities. It is also unusual to combine bonds denominated indifferent currencies in the same bond index, even if they are all issued by the same issuer. Thisis, at least partly, because the currency variations may, and often do, account for larger changesthan the returns on the underlying bonds in their denominated currency.
1 The FTSE Actuaries fixed-rate UK gilt-edged indices do not normally remove the bonds before redemption, provided they havenot been put on to the Debt Management Office’s rump stock list.
2 In 2005 several issuers, including the French and UK Governments and Telecom Italia, have started to issue bonds with a 50year maturity to satisfy the demands of pension fund managers.
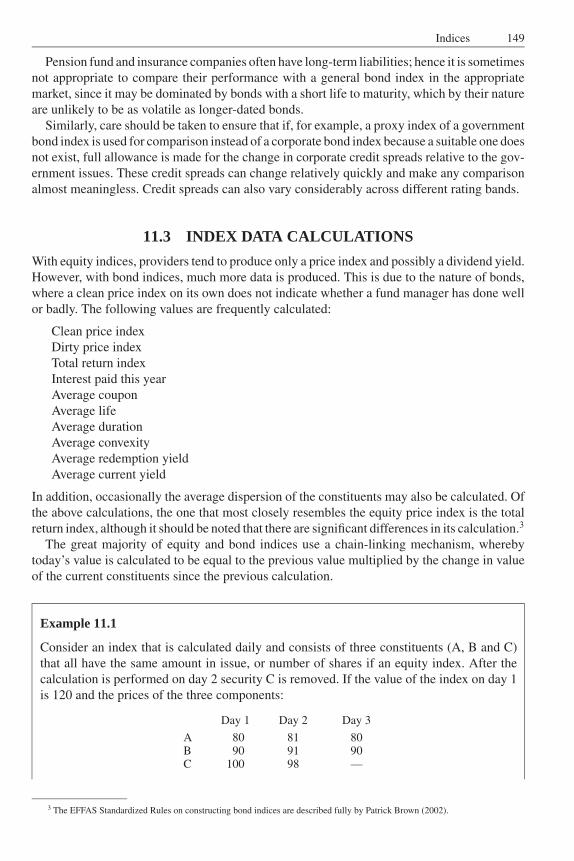
JWBK090-11 JWBK090/Brown March 1, 2006 8:33 Char Count= 0
Indices 149
Pension fund and insurance companies often have long-term liabilities; hence it is sometimesnot appropriate to compare their performance with a general bond index in the appropriatemarket, since it may be dominated by bonds with a short life to maturity, which by their natureare unlikely to be as volatile as longer-dated bonds.
Similarly, care should be taken to ensure that if, for example, a proxy index of a governmentbond index is used for comparison instead of a corporate bond index because a suitable one doesnot exist, full allowance is made for the change in corporate credit spreads relative to the gov-ernment issues. These credit spreads can change relatively quickly and make any comparisonalmost meaningless. Credit spreads can also vary considerably across different rating bands.
11.3 INDEX DATA CALCULATIONS
With equity indices, providers tend to produce only a price index and possibly a dividend yield.However, with bond indices, much more data is produced. This is due to the nature of bonds,where a clean price index on its own does not indicate whether a fund manager has done wellor badly. The following values are frequently calculated:
Clean price indexDirty price indexTotal return indexInterest paid this yearAverage couponAverage lifeAverage durationAverage convexityAverage redemption yieldAverage current yield
In addition, occasionally the average dispersion of the constituents may also be calculated. Ofthe above calculations, the one that most closely resembles the equity price index is the totalreturn index, although it should be noted that there are significant differences in its calculation.3
The great majority of equity and bond indices use a chain-linking mechanism, wherebytoday’s value is calculated to be equal to the previous value multiplied by the change in valueof the current constituents since the previous calculation.
Example 11.1
Consider an index that is calculated daily and consists of three constituents (A, B and C)that all have the same amount in issue, or number of shares if an equity index. After thecalculation is performed on day 2 security C is removed. If the value of the index on day 1is 120 and the prices of the three components:
Day 1 Day 2 Day 3
A 80 81 80B 90 91 90C 100 98 —
3 The EFFAS Standardized Rules on constructing bond indices are described fully by Patrick Brown (2002).
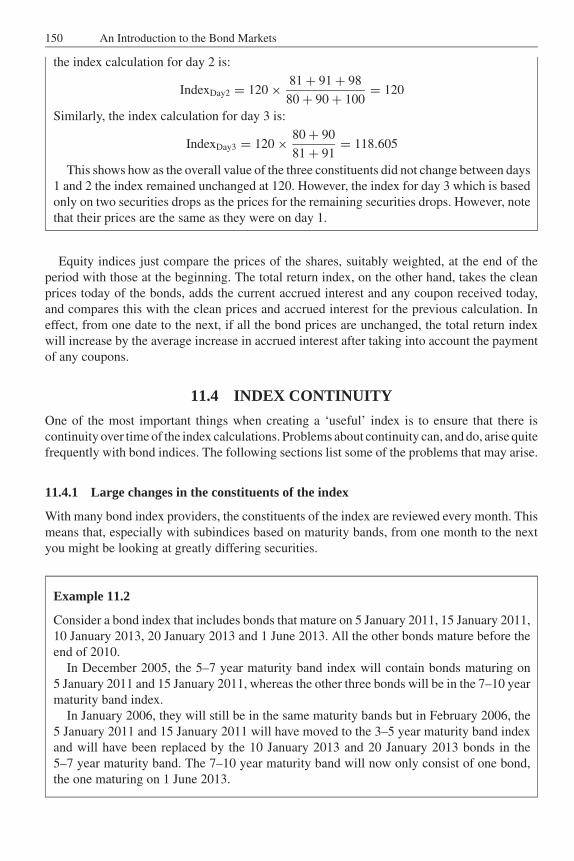
JWBK090-11 JWBK090/Brown March 1, 2006 8:33 Char Count= 0
150 An Introduction to the Bond Markets
the index calculation for day 2 is:
IndexDay2 = 120 × 81 + 91 + 98
80 + 90 + 100= 120
Similarly, the index calculation for day 3 is:
IndexDay3 = 120 × 80 + 90
81 + 91= 118.605
This shows how as the overall value of the three constituents did not change between days1 and 2 the index remained unchanged at 120. However, the index for day 3 which is basedonly on two securities drops as the prices for the remaining securities drops. However, notethat their prices are the same as they were on day 1.
Equity indices just compare the prices of the shares, suitably weighted, at the end of theperiod with those at the beginning. The total return index, on the other hand, takes the cleanprices today of the bonds, adds the current accrued interest and any coupon received today,and compares this with the clean prices and accrued interest for the previous calculation. Ineffect, from one date to the next, if all the bond prices are unchanged, the total return indexwill increase by the average increase in accrued interest after taking into account the paymentof any coupons.
11.4 INDEX CONTINUITY
One of the most important things when creating a ‘useful’ index is to ensure that there iscontinuity over time of the index calculations. Problems about continuity can, and do, arise quitefrequently with bond indices. The following sections list some of the problems that may arise.
11.4.1 Large changes in the constituents of the index
With many bond index providers, the constituents of the index are reviewed every month. Thismeans that, especially with subindices based on maturity bands, from one month to the nextyou might be looking at greatly differing securities.
Example 11.2
Consider a bond index that includes bonds that mature on 5 January 2011, 15 January 2011,10 January 2013, 20 January 2013 and 1 June 2013. All the other bonds mature before theend of 2010.
In December 2005, the 5–7 year maturity band index will contain bonds maturing on5 January 2011 and 15 January 2011, whereas the other three bonds will be in the 7–10 yearmaturity band index.
In January 2006, they will still be in the same maturity bands but in February 2006, the5 January 2011 and 15 January 2011 will have moved to the 3–5 year maturity band indexand will have been replaced by the 10 January 2013 and 20 January 2013 bonds in the5–7 year maturity band. The 7–10 year maturity band will now only consist of one bond,the one maturing on 1 June 2013.
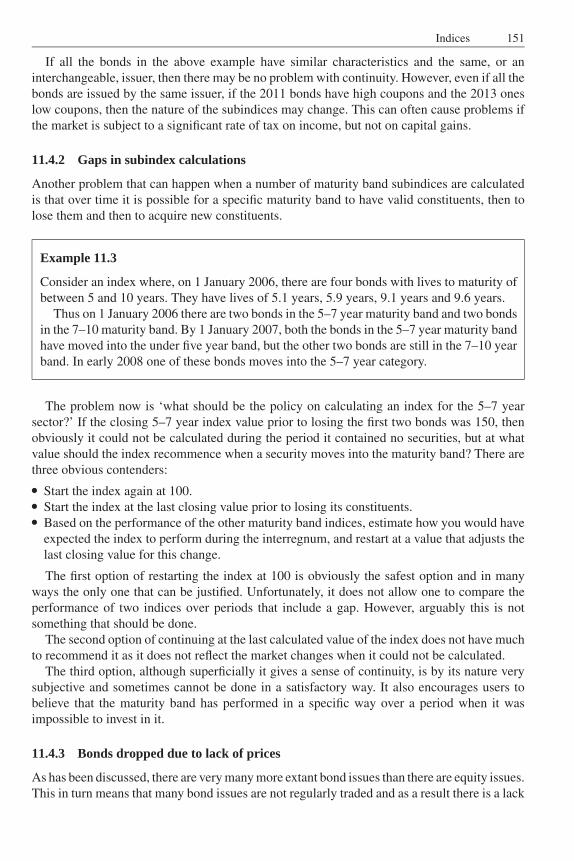
JWBK090-11 JWBK090/Brown March 1, 2006 8:33 Char Count= 0
Indices 151
If all the bonds in the above example have similar characteristics and the same, or aninterchangeable, issuer, then there may be no problem with continuity. However, even if all thebonds are issued by the same issuer, if the 2011 bonds have high coupons and the 2013 oneslow coupons, then the nature of the subindices may change. This can often cause problems ifthe market is subject to a significant rate of tax on income, but not on capital gains.
11.4.2 Gaps in subindex calculations
Another problem that can happen when a number of maturity band subindices are calculatedis that over time it is possible for a specific maturity band to have valid constituents, then tolose them and then to acquire new constituents.
Example 11.3
Consider an index where, on 1 January 2006, there are four bonds with lives to maturity ofbetween 5 and 10 years. They have lives of 5.1 years, 5.9 years, 9.1 years and 9.6 years.
Thus on 1 January 2006 there are two bonds in the 5–7 year maturity band and two bondsin the 7–10 maturity band. By 1 January 2007, both the bonds in the 5–7 year maturity bandhave moved into the under five year band, but the other two bonds are still in the 7–10 yearband. In early 2008 one of these bonds moves into the 5–7 year category.
The problem now is ‘what should be the policy on calculating an index for the 5–7 yearsector?’ If the closing 5–7 year index value prior to losing the first two bonds was 150, thenobviously it could not be calculated during the period it contained no securities, but at whatvalue should the index recommence when a security moves into the maturity band? There arethree obvious contenders:� Start the index again at 100.� Start the index at the last closing value prior to losing its constituents.� Based on the performance of the other maturity band indices, estimate how you would have
expected the index to perform during the interregnum, and restart at a value that adjusts thelast closing value for this change.
The first option of restarting the index at 100 is obviously the safest option and in manyways the only one that can be justified. Unfortunately, it does not allow one to compare theperformance of two indices over periods that include a gap. However, arguably this is notsomething that should be done.
The second option of continuing at the last calculated value of the index does not have muchto recommend it as it does not reflect the market changes when it could not be calculated.
The third option, although superficially it gives a sense of continuity, is by its nature verysubjective and sometimes cannot be done in a satisfactory way. It also encourages users tobelieve that the maturity band has performed in a specific way over a period when it wasimpossible to invest in it.
11.4.3 Bonds dropped due to lack of prices
As has been discussed, there are very many more extant bond issues than there are equity issues.This in turn means that many bond issues are not regularly traded and as a result there is a lack
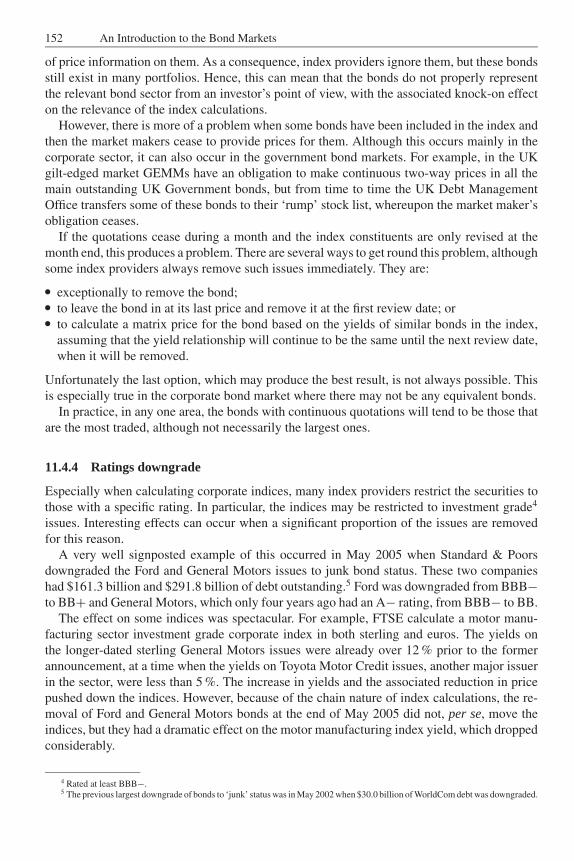
JWBK090-11 JWBK090/Brown March 1, 2006 8:33 Char Count= 0
152 An Introduction to the Bond Markets
of price information on them. As a consequence, index providers ignore them, but these bondsstill exist in many portfolios. Hence, this can mean that the bonds do not properly representthe relevant bond sector from an investor’s point of view, with the associated knock-on effecton the relevance of the index calculations.
However, there is more of a problem when some bonds have been included in the index andthen the market makers cease to provide prices for them. Although this occurs mainly in thecorporate sector, it can also occur in the government bond markets. For example, in the UKgilt-edged market GEMMs have an obligation to make continuous two-way prices in all themain outstanding UK Government bonds, but from time to time the UK Debt ManagementOffice transfers some of these bonds to their ‘rump’ stock list, whereupon the market maker’sobligation ceases.
If the quotations cease during a month and the index constituents are only revised at themonth end, this produces a problem. There are several ways to get round this problem, althoughsome index providers always remove such issues immediately. They are:� exceptionally to remove the bond;� to leave the bond in at its last price and remove it at the first review date; or� to calculate a matrix price for the bond based on the yields of similar bonds in the index,
assuming that the yield relationship will continue to be the same until the next review date,when it will be removed.
Unfortunately the last option, which may produce the best result, is not always possible. Thisis especially true in the corporate bond market where there may not be any equivalent bonds.
In practice, in any one area, the bonds with continuous quotations will tend to be those thatare the most traded, although not necessarily the largest ones.
11.4.4 Ratings downgrade
Especially when calculating corporate indices, many index providers restrict the securities tothose with a specific rating. In particular, the indices may be restricted to investment grade4
issues. Interesting effects can occur when a significant proportion of the issues are removedfor this reason.
A very well signposted example of this occurred in May 2005 when Standard & Poorsdowngraded the Ford and General Motors issues to junk bond status. These two companieshad $161.3 billion and $291.8 billion of debt outstanding.5 Ford was downgraded from BBB−to BB+ and General Motors, which only four years ago had an A− rating, from BBB− to BB.
The effect on some indices was spectacular. For example, FTSE calculate a motor manu-facturing sector investment grade corporate index in both sterling and euros. The yields onthe longer-dated sterling General Motors issues were already over 12 % prior to the formerannouncement, at a time when the yields on Toyota Motor Credit issues, another major issuerin the sector, were less than 5 %. The increase in yields and the associated reduction in pricepushed down the indices. However, because of the chain nature of index calculations, the re-moval of Ford and General Motors bonds at the end of May 2005 did not, per se, move theindices, but they had a dramatic effect on the motor manufacturing index yield, which droppedconsiderably.
4 Rated at least BBB−.5 The previous largest downgrade of bonds to ‘junk’ status was in May 2002 when $30.0 billion of WorldCom debt was downgraded.
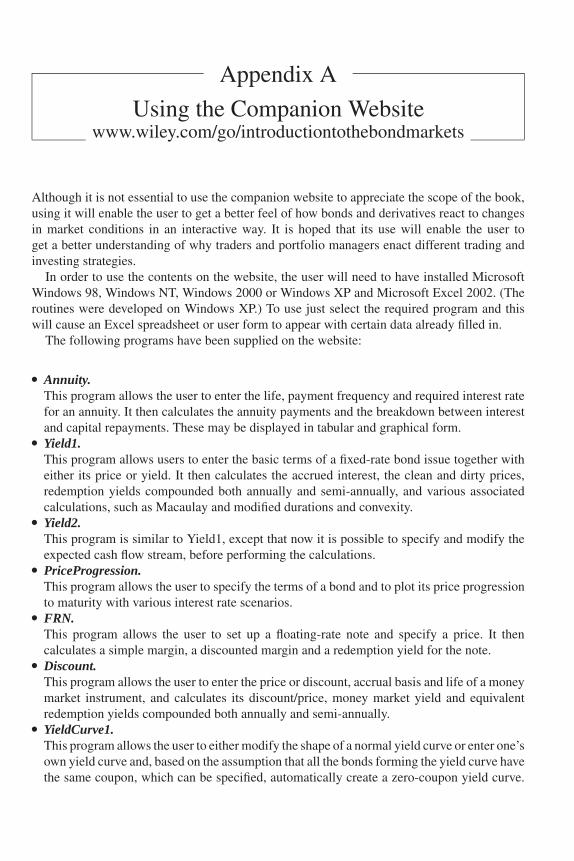
JWBK090-APPA JWBK090/Brown March 4, 2006 1:40 Char Count= 0
Appendix A
Using the Companion Websitewww.wiley.com/go/introductiontothebondmarkets
Although it is not essential to use the companion website to appreciate the scope of the book,using it will enable the user to get a better feel of how bonds and derivatives react to changesin market conditions in an interactive way. It is hoped that its use will enable the user toget a better understanding of why traders and portfolio managers enact different trading andinvesting strategies.
In order to use the contents on the website, the user will need to have installed MicrosoftWindows 98, Windows NT, Windows 2000 or Windows XP and Microsoft Excel 2002. (Theroutines were developed on Windows XP.) To use just select the required program and thiswill cause an Excel spreadsheet or user form to appear with certain data already filled in.
The following programs have been supplied on the website:� Annuity.This program allows the user to enter the life, payment frequency and required interest ratefor an annuity. It then calculates the annuity payments and the breakdown between interestand capital repayments. These may be displayed in tabular and graphical form.� Yield1.This program allows users to enter the basic terms of a fixed-rate bond issue together witheither its price or yield. It then calculates the accrued interest, the clean and dirty prices,redemption yields compounded both annually and semi-annually, and various associatedcalculations, such as Macaulay and modified durations and convexity.� Yield2.This program is similar to Yield1, except that now it is possible to specify and modify theexpected cash flow stream, before performing the calculations.� PriceProgression.This program allows the user to specify the terms of a bond and to plot its price progressionto maturity with various interest rate scenarios.� FRN.This program allows the user to set up a floating-rate note and specify a price. It thencalculates a simple margin, a discounted margin and a redemption yield for the note.� Discount.This program allows the user to enter the price or discount, accrual basis and life of a moneymarket instrument, and calculates its discount/price, money market yield and equivalentredemption yields compounded both annually and semi-annually.� YieldCurve1.This program allows the user to either modify the shape of a normal yield curve or enter one’sown yield curve and, based on the assumption that all the bonds forming the yield curve havethe same coupon, which can be specified, automatically create a zero-coupon yield curve.
153
JWBK090-APPA JWBK090/Brown March 4, 2006 1:40 Char Count= 0
154 An Introduction to the Bond Markets
It will be noticed that sharp changes in yield over time can make dramatic changes to thezero-coupon curve.� YieldCurve2.This program allows the user to specify the annual spot rates, and calculate the resulting parand one, two and three year forward yield curves. The results are shown in both tabular andgraphical form.� YieldCurve3.This program allows the user to enter the current yield curve in the market, make assumptionsabout its change in shape, or enter a projected yield curve at a specified date in the future. Itthen displays the two yield curves and, for a specified coupon rate and payment frequency,the expected change in prices.� Swap.This program enables the user to enter the details of an interest rate swap, together withdetails of the projected yield curve of the floating-rate indicator rate. It then calculates anddisplays the projected cash flows, and calculates the returns for both parties.� FRA.This program allows users to enter the terms of a forward rate agreement (FRA). It calculatesthe associated profit/loss for the parties.� Horizon.This program enables the user to enter the details of a bond and specify a horizon date. Itthen calculates the return on the bond for a range of interest rate scenarios at the horizondate. The results are displayed in both a tabular and a graphical format.� Portfolio.This program allows the user to enter details of the bonds in a small portfolio. It thencalculates for the portfolio its projected cash flow (which is shown in a graphical format),its average yield, and Macaulay and modified durations.
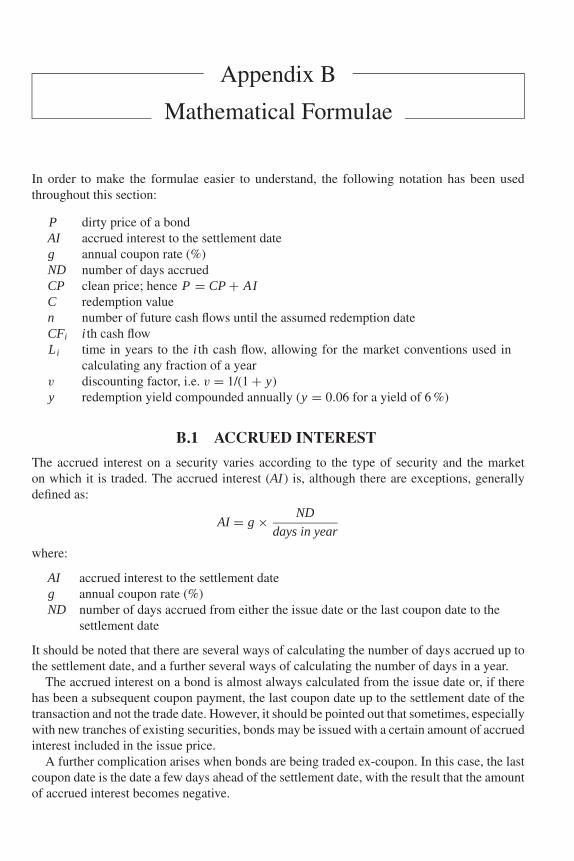
JWBK090-App-B JWBK090/Brown March 1, 2006 8:34 Char Count= 0
Appendix B
Mathematical Formulae
In order to make the formulae easier to understand, the following notation has been usedthroughout this section:
P dirty price of a bondAI accrued interest to the settlement dateg annual coupon rate (%)ND number of days accruedCP clean price; hence P = CP + AIC redemption valuen number of future cash flows until the assumed redemption dateCFi i th cash flowLi time in years to the i th cash flow, allowing for the market conventions used in
calculating any fraction of a yearv discounting factor, i.e. v = 1/(1 + y)y redemption yield compounded annually (y = 0.06 for a yield of 6 %)
B.1 ACCRUED INTEREST
The accrued interest on a security varies according to the type of security and the marketon which it is traded. The accrued interest (AI ) is, although there are exceptions, generallydefined as:
AI = g × ND
days in year
where:
AI accrued interest to the settlement dateg annual coupon rate (%)ND number of days accrued from either the issue date or the last coupon date to the
settlement date
It should be noted that there are several ways of calculating the number of days accrued up tothe settlement date, and a further several ways of calculating the number of days in a year.
The accrued interest on a bond is almost always calculated from the issue date or, if therehas been a subsequent coupon payment, the last coupon date up to the settlement date of thetransaction and not the trade date. However, it should be pointed out that sometimes, especiallywith new tranches of existing securities, bonds may be issued with a certain amount of accruedinterest included in the issue price.
A further complication arises when bonds are being traded ex-coupon. In this case, the lastcoupon date is the date a few days ahead of the settlement date, with the result that the amountof accrued interest becomes negative.
155
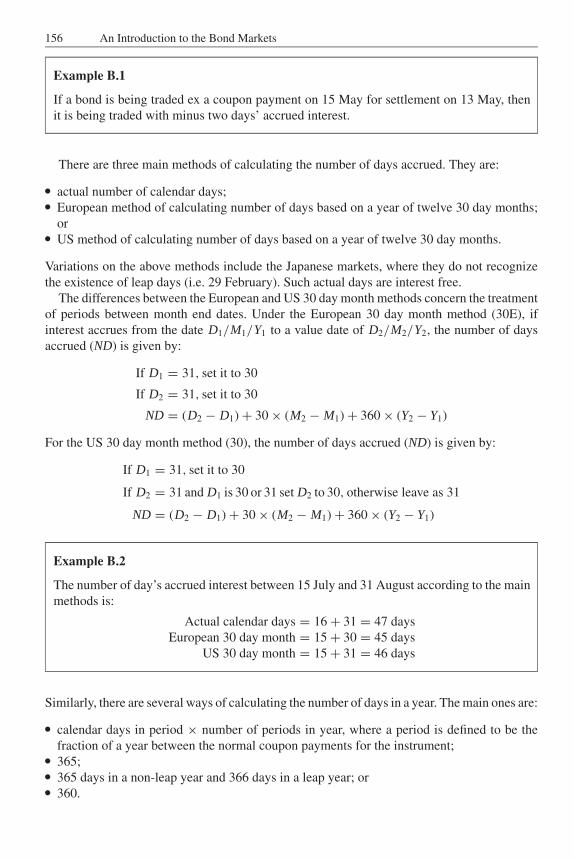
JWBK090-App-B JWBK090/Brown March 1, 2006 8:34 Char Count= 0
156 An Introduction to the Bond Markets
Example B.1
If a bond is being traded ex a coupon payment on 15 May for settlement on 13 May, thenit is being traded with minus two days’ accrued interest.
There are three main methods of calculating the number of days accrued. They are:� actual number of calendar days;� European method of calculating number of days based on a year of twelve 30 day months;or� US method of calculating number of days based on a year of twelve 30 day months.
Variations on the above methods include the Japanese markets, where they do not recognizethe existence of leap days (i.e. 29 February). Such actual days are interest free.
The differences between the European and US 30 day month methods concern the treatmentof periods between month end dates. Under the European 30 day month method (30E), ifinterest accrues from the date D1/M1/Y1 to a value date of D2/M2/Y2, the number of daysaccrued (ND) is given by:
If D1 = 31, set it to 30
If D2 = 31, set it to 30
ND = (D2 − D1) + 30 × (M2 − M1) + 360 × (Y2 − Y1)
For the US 30 day month method (30), the number of days accrued (ND) is given by:
If D1 = 31, set it to 30
If D2 = 31 and D1 is 30 or 31 set D2 to 30, otherwise leave as 31
ND = (D2 − D1) + 30 × (M2 − M1) + 360 × (Y2 − Y1)
Example B.2
The number of day’s accrued interest between 15 July and 31 August according to the mainmethods is:
Actual calendar days = 16 + 31 = 47 daysEuropean 30 day month = 15 + 30 = 45 days
US 30 day month = 15 + 31 = 46 days
Similarly, there are several ways of calculating the number of days in a year. The main ones are:� calendar days in period × number of periods in year, where a period is defined to be thefraction of a year between the normal coupon payments for the instrument;� 365;� 365 days in a non-leap year and 366 days in a leap year; or� 360.
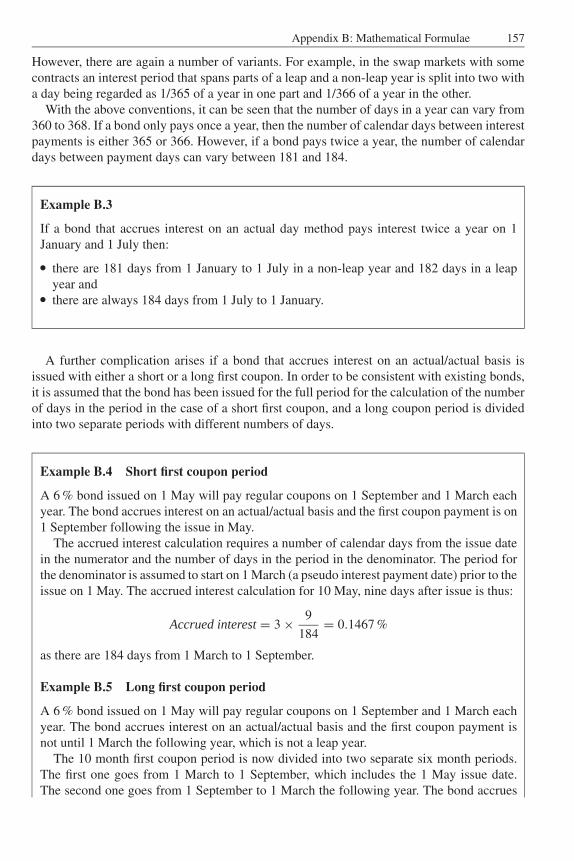
JWBK090-App-B JWBK090/Brown March 1, 2006 8:34 Char Count= 0
Appendix B: Mathematical Formulae 157
However, there are again a number of variants. For example, in the swap markets with somecontracts an interest period that spans parts of a leap and a non-leap year is split into two witha day being regarded as 1/365 of a year in one part and 1/366 of a year in the other.
With the above conventions, it can be seen that the number of days in a year can vary from360 to 368. If a bond only pays once a year, then the number of calendar days between interestpayments is either 365 or 366. However, if a bond pays twice a year, the number of calendardays between payment days can vary between 181 and 184.
Example B.3
If a bond that accrues interest on an actual day method pays interest twice a year on 1January and 1 July then:� there are 181 days from 1 January to 1 July in a non-leap year and 182 days in a leap
year and� there are always 184 days from 1 July to 1 January.
A further complication arises if a bond that accrues interest on an actual/actual basis isissued with either a short or a long first coupon. In order to be consistent with existing bonds,it is assumed that the bond has been issued for the full period for the calculation of the numberof days in the period in the case of a short first coupon, and a long coupon period is dividedinto two separate periods with different numbers of days.
Example B.4 Short first coupon period
A 6 % bond issued on 1 May will pay regular coupons on 1 September and 1 March eachyear. The bond accrues interest on an actual/actual basis and the first coupon payment is on1 September following the issue in May.
The accrued interest calculation requires a number of calendar days from the issue datein the numerator and the number of days in the period in the denominator. The period forthe denominator is assumed to start on 1 March (a pseudo interest payment date) prior to theissue on 1 May. The accrued interest calculation for 10 May, nine days after issue is thus:
Accrued interest = 3 × 9
184= 0.1467 %
as there are 184 days from 1 March to 1 September.
Example B.5 Long first coupon period
A 6 % bond issued on 1 May will pay regular coupons on 1 September and 1 March eachyear. The bond accrues interest on an actual/actual basis and the first coupon payment isnot until 1 March the following year, which is not a leap year.
The 10 month first coupon period is now divided into two separate six month periods.The first one goes from 1 March to 1 September, which includes the 1 May issue date.The second one goes from 1 September to 1 March the following year. The bond accrues
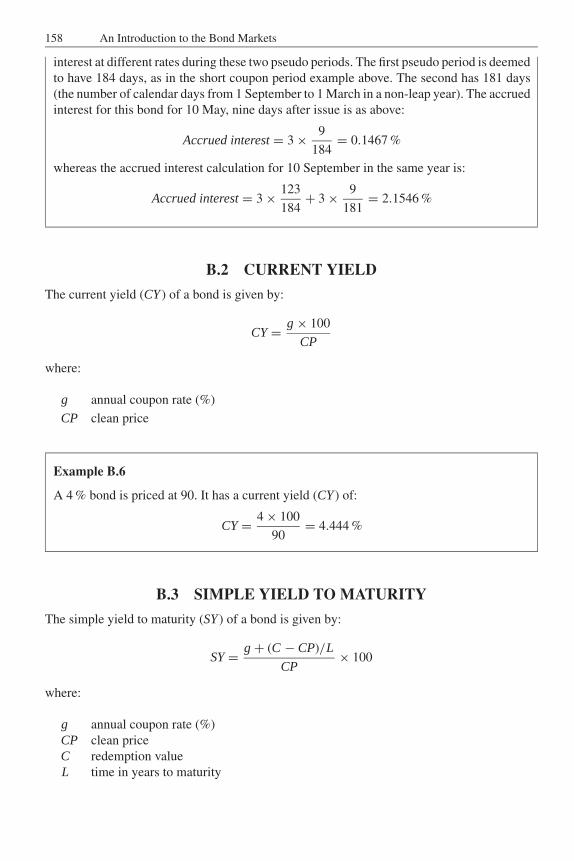
JWBK090-App-B JWBK090/Brown March 1, 2006 8:34 Char Count= 0
158 An Introduction to the Bond Markets
interest at different rates during these two pseudo periods. The first pseudo period is deemedto have 184 days, as in the short coupon period example above. The second has 181 days(the number of calendar days from 1 September to 1 March in a non-leap year). The accruedinterest for this bond for 10 May, nine days after issue is as above:
Accrued interest = 3 × 9
184= 0.1467 %
whereas the accrued interest calculation for 10 September in the same year is:
Accrued interest = 3 × 123
184+ 3 × 9
181= 2.1546 %
B.2 CURRENT YIELD
The current yield (CY ) of a bond is given by:
CY = g × 100
CP
where:
g annual coupon rate (%)
CP clean price
Example B.6
A 4 % bond is priced at 90. It has a current yield (CY ) of:
CY = 4 × 100
90= 4.444 %
B.3 SIMPLE YIELD TO MATURITY
The simple yield to maturity (SY ) of a bond is given by:
SY = g + (C − CP)/L
CP× 100
where:
g annual coupon rate (%)CP clean priceC redemption valueL time in years to maturity
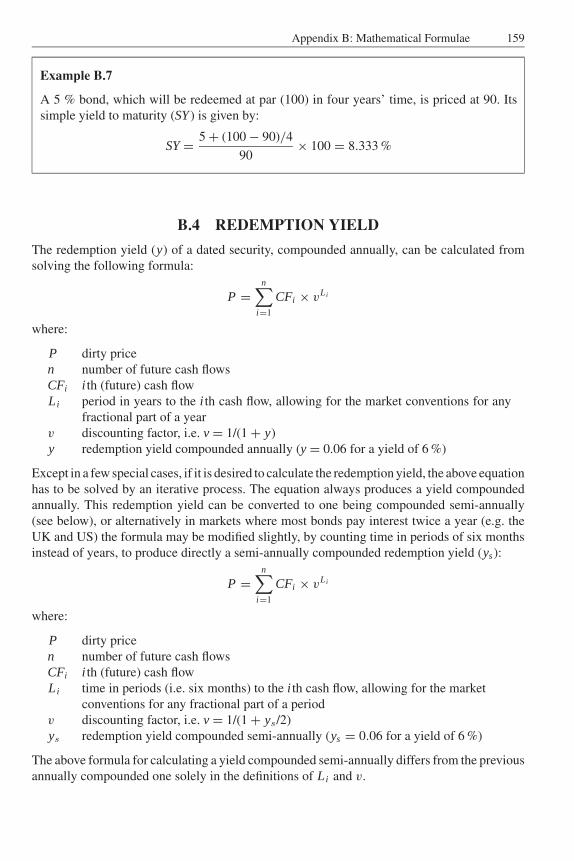
JWBK090-App-B JWBK090/Brown March 1, 2006 8:34 Char Count= 0
Appendix B: Mathematical Formulae 159
Example B.7
A 5 % bond, which will be redeemed at par (100) in four years’ time, is priced at 90. Itssimple yield to maturity (SY ) is given by:
SY = 5 + (100 − 90)/4
90× 100 = 8.333 %
B.4 REDEMPTION YIELD
The redemption yield (y) of a dated security, compounded annually, can be calculated fromsolving the following formula:
P =n∑
i=1
CFi × vLi
where:
P dirty pricen number of future cash flowsCFi i th (future) cash flowLi period in years to the i th cash flow, allowing for the market conventions for any
fractional part of a yearv discounting factor, i.e. v = 1/(1 + y)y redemption yield compounded annually (y = 0.06 for a yield of 6 %)
Except in a few special cases, if it is desired to calculate the redemption yield, the above equationhas to be solved by an iterative process. The equation always produces a yield compoundedannually. This redemption yield can be converted to one being compounded semi-annually(see below), or alternatively in markets where most bonds pay interest twice a year (e.g. theUK and US) the formula may be modified slightly, by counting time in periods of six monthsinstead of years, to produce directly a semi-annually compounded redemption yield (ys):
P =n∑
i=1
CFi × vLi
where:
P dirty pricen number of future cash flowsCFi i th (future) cash flowLi time in periods (i.e. six months) to the i th cash flow, allowing for the market
conventions for any fractional part of a periodv discounting factor, i.e. v = 1/(1 + ys /2)ys redemption yield compounded semi-annually (ys = 0.06 for a yield of 6 %)
The above formula for calculating a yield compounded semi-annually differs from the previousannually compounded one solely in the definitions of Li and v.
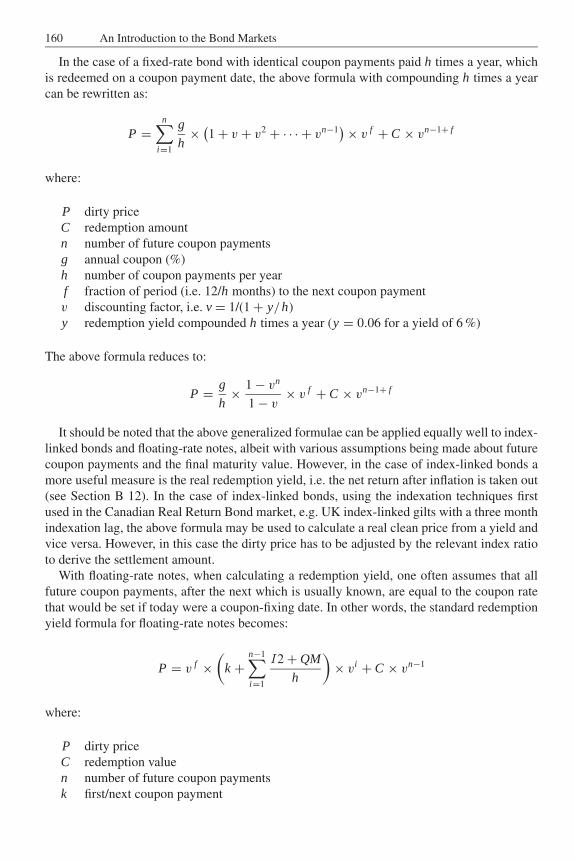
JWBK090-App-B JWBK090/Brown March 1, 2006 8:34 Char Count= 0
160 An Introduction to the Bond Markets
In the case of a fixed-rate bond with identical coupon payments paid h times a year, whichis redeemed on a coupon payment date, the above formula with compounding h times a yearcan be rewritten as:
P =n∑
i=1
g
h× (
1 + v + v2 + · · · + vn−1) × v f + C × vn−1+ f
where:
P dirty priceC redemption amountn number of future coupon paymentsg annual coupon (%)h number of coupon payments per yearf fraction of period (i.e. 12/h months) to the next coupon paymentv discounting factor, i.e. v = 1/(1 + y/h)y redemption yield compounded h times a year (y = 0.06 for a yield of 6 %)
The above formula reduces to:
P = g
h× 1 − vn
1 − v× v f + C × vn−1+ f
It should be noted that the above generalized formulae can be applied equally well to index-linked bonds and floating-rate notes, albeit with various assumptions being made about futurecoupon payments and the final maturity value. However, in the case of index-linked bonds amore useful measure is the real redemption yield, i.e. the net return after inflation is taken out(see Section B 12). In the case of index-linked bonds, using the indexation techniques firstused in the Canadian Real Return Bond market, e.g. UK index-linked gilts with a three monthindexation lag, the above formula may be used to calculate a real clean price from a yield andvice versa. However, in this case the dirty price has to be adjusted by the relevant index ratioto derive the settlement amount.
With floating-rate notes, when calculating a redemption yield, one often assumes that allfuture coupon payments, after the next which is usually known, are equal to the coupon ratethat would be set if today were a coupon-fixing date. In other words, the standard redemptionyield formula for floating-rate notes becomes:
P = v f ×(
k +n−1∑i=1
I 2 + QM
h
)× vi + C × vn−1
where:
P dirty priceC redemption valuen number of future coupon paymentsk first/next coupon payment
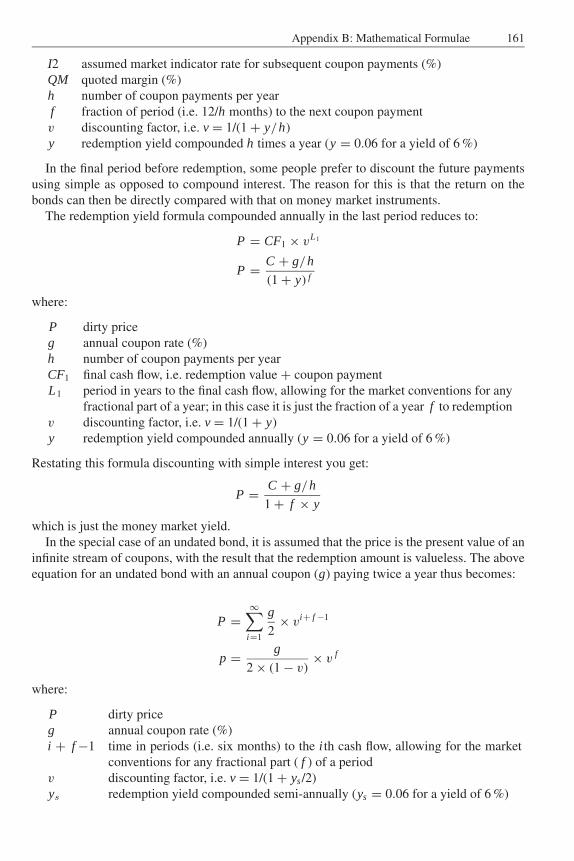
JWBK090-App-B JWBK090/Brown March 1, 2006 8:34 Char Count= 0
Appendix B: Mathematical Formulae 161
I2 assumed market indicator rate for subsequent coupon payments (%)QM quoted margin (%)h number of coupon payments per yearf fraction of period (i.e. 12/h months) to the next coupon paymentv discounting factor, i.e. v = 1/(1 + y/h)y redemption yield compounded h times a year (y = 0.06 for a yield of 6 %)
In the final period before redemption, some people prefer to discount the future paymentsusing simple as opposed to compound interest. The reason for this is that the return on thebonds can then be directly compared with that on money market instruments.
The redemption yield formula compounded annually in the last period reduces to:
P = CF1 × vL1
P = C + g/h
(1 + y) f
where:
P dirty priceg annual coupon rate (%)h number of coupon payments per yearCF1 final cash flow, i.e. redemption value + coupon paymentL1 period in years to the final cash flow, allowing for the market conventions for any
fractional part of a year; in this case it is just the fraction of a year f to redemptionv discounting factor, i.e. v = 1/(1 + y)y redemption yield compounded annually (y = 0.06 for a yield of 6 %)
Restating this formula discounting with simple interest you get:
P = C + g/h
1 + f × y
which is just the money market yield.In the special case of an undated bond, it is assumed that the price is the present value of an
infinite stream of coupons, with the result that the redemption amount is valueless. The aboveequation for an undated bond with an annual coupon (g) paying twice a year thus becomes:
P =∞∑
i=1
g
2× vi+ f −1
p = g
2 × (1 − v)× v f
where:
P dirty priceg annual coupon rate (%)i + f −1 time in periods (i.e. six months) to the i th cash flow, allowing for the market
conventions for any fractional part ( f ) of a periodv discounting factor, i.e. v = 1/(1 + ys /2)ys redemption yield compounded semi-annually (ys = 0.06 for a yield of 6 %)
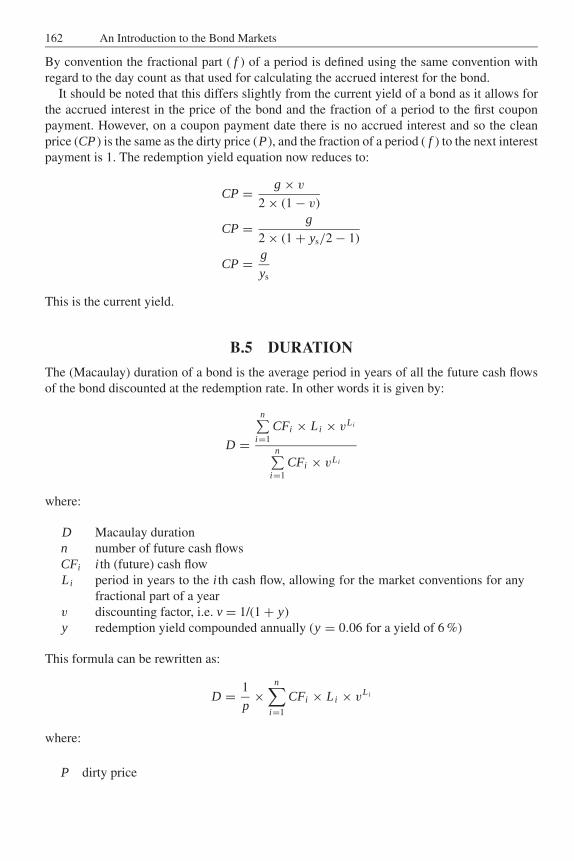
JWBK090-App-B JWBK090/Brown March 1, 2006 8:34 Char Count= 0
162 An Introduction to the Bond Markets
By convention the fractional part ( f ) of a period is defined using the same convention withregard to the day count as that used for calculating the accrued interest for the bond.
It should be noted that this differs slightly from the current yield of a bond as it allows forthe accrued interest in the price of the bond and the fraction of a period to the first couponpayment. However, on a coupon payment date there is no accrued interest and so the cleanprice (CP ) is the same as the dirty price (P), and the fraction of a period ( f ) to the next interestpayment is 1. The redemption yield equation now reduces to:
CP = g × v
2 × (1 − v)
CP = g
2 × (1 + ys/2 − 1)
CP = g
ys
This is the current yield.
B.5 DURATION
The (Macaulay) duration of a bond is the average period in years of all the future cash flowsof the bond discounted at the redemption rate. In other words it is given by:
D =
n∑i=1
CFi × Li × vLi
n∑i=1
CFi × vLi
where:
D Macaulay durationn number of future cash flowsCFi i th (future) cash flowLi period in years to the i th cash flow, allowing for the market conventions for any
fractional part of a yearv discounting factor, i.e. v = 1/(1 + y)y redemption yield compounded annually (y = 0.06 for a yield of 6 %)
This formula can be rewritten as:
D = 1
p×
n∑i=1
CFi × Li × vLi
where:
P dirty price
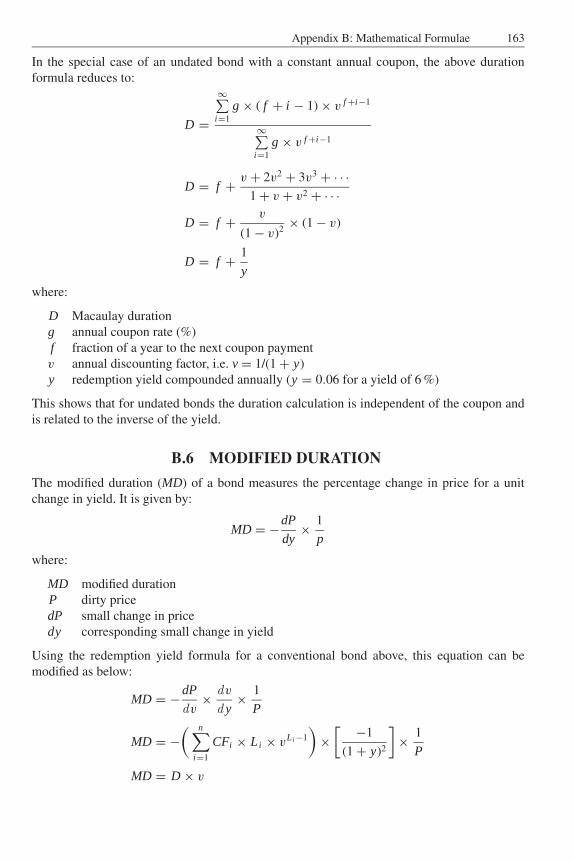
JWBK090-App-B JWBK090/Brown March 1, 2006 8:34 Char Count= 0
Appendix B: Mathematical Formulae 163
In the special case of an undated bond with a constant annual coupon, the above durationformula reduces to:
D =
∞∑i=1
g × ( f + i − 1) × v f +i−1
∞∑i=1
g × v f +i−1
D = f + v + 2v2 + 3v3 + · · ·1 + v + v2 + · · ·
D = f + v
(1 − v)2× (1 − v)
D = f + 1
y
where:
D Macaulay durationg annual coupon rate (%)f fraction of a year to the next coupon paymentv annual discounting factor, i.e. v = 1/(1 + y)y redemption yield compounded annually (y = 0.06 for a yield of 6 %)
This shows that for undated bonds the duration calculation is independent of the coupon andis related to the inverse of the yield.
B.6 MODIFIED DURATION
The modified duration (MD) of a bond measures the percentage change in price for a unitchange in yield. It is given by:
MD = −dP
dy× 1
p
where:
MD modified durationP dirty pricedP small change in pricedy corresponding small change in yield
Using the redemption yield formula for a conventional bond above, this equation can bemodified as below:
MD = −dP
dv× dv
d y× 1
P
MD = −( n∑
i=1
CFi × Li × vLi −1
)×
[ −1
(1 + y)2
]× 1
P
MD = D × v
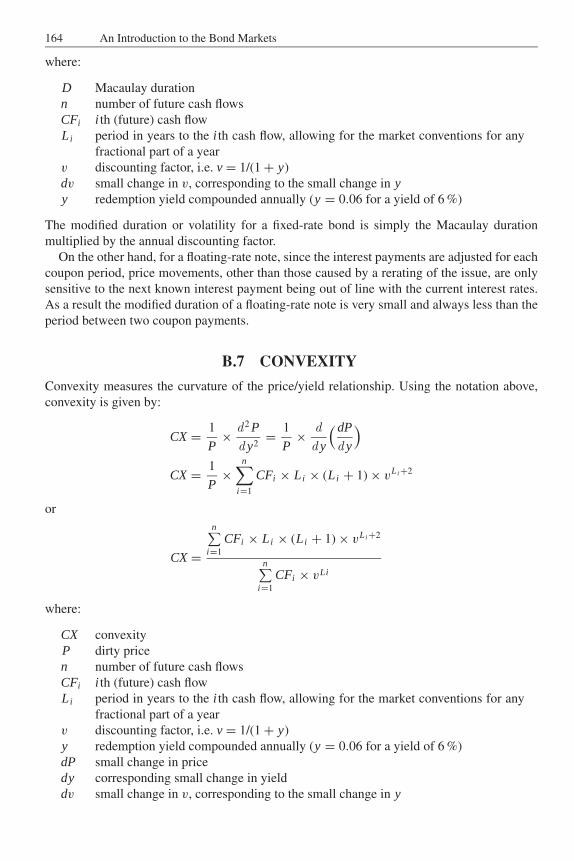
JWBK090-App-B JWBK090/Brown March 1, 2006 8:34 Char Count= 0
164 An Introduction to the Bond Markets
where:
D Macaulay durationn number of future cash flowsCFi i th (future) cash flowLi period in years to the i th cash flow, allowing for the market conventions for any
fractional part of a yearv discounting factor, i.e. v = 1/(1 + y)dv small change in v, corresponding to the small change in yy redemption yield compounded annually (y = 0.06 for a yield of 6 %)
The modified duration or volatility for a fixed-rate bond is simply the Macaulay durationmultiplied by the annual discounting factor.
On the other hand, for a floating-rate note, since the interest payments are adjusted for eachcoupon period, price movements, other than those caused by a rerating of the issue, are onlysensitive to the next known interest payment being out of line with the current interest rates.As a result the modified duration of a floating-rate note is very small and always less than theperiod between two coupon payments.
B.7 CONVEXITY
Convexity measures the curvature of the price/yield relationship. Using the notation above,convexity is given by:
CX = 1
P× d2 P
d y2= 1
P× d
d y
( dP
d y
)CX = 1
P×
n∑i=1
CFi × Li × (Li + 1) × vLi +2
or
CX =
n∑i=1
CFi × Li × (Li + 1) × vLi +2
n∑i=1
CFi × vLi
where:
CX convexityP dirty pricen number of future cash flowsCFi i th (future) cash flowLi period in years to the i th cash flow, allowing for the market conventions for any
fractional part of a yearv discounting factor, i.e. v = 1/(1 + y)y redemption yield compounded annually (y = 0.06 for a yield of 6 %)dP small change in pricedy corresponding small change in yielddv small change in v, corresponding to the small change in y
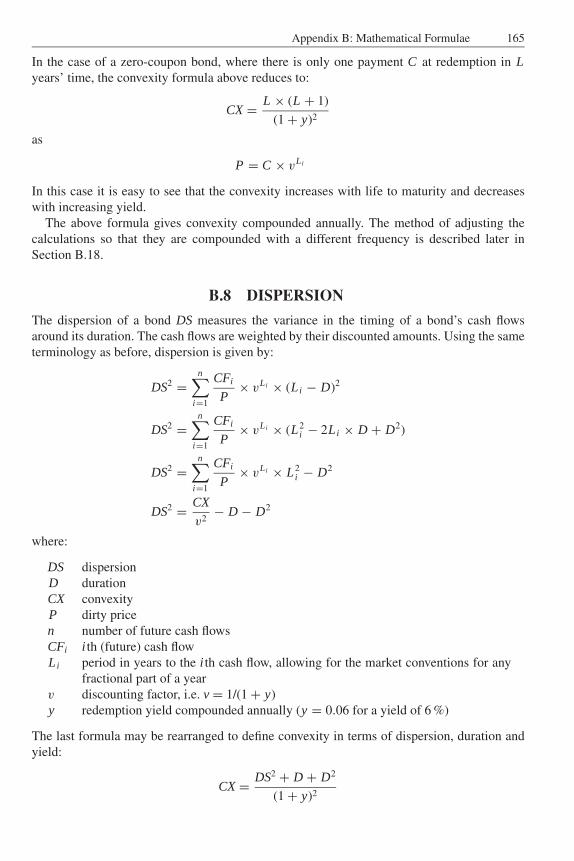
JWBK090-App-B JWBK090/Brown March 1, 2006 8:34 Char Count= 0
Appendix B: Mathematical Formulae 165
In the case of a zero-coupon bond, where there is only one payment C at redemption in Lyears’ time, the convexity formula above reduces to:
CX = L × (L + 1)
(1 + y)2
as
P = C × vLi
In this case it is easy to see that the convexity increases with life to maturity and decreaseswith increasing yield.
The above formula gives convexity compounded annually. The method of adjusting thecalculations so that they are compounded with a different frequency is described later inSection B.18.
B.8 DISPERSION
The dispersion of a bond DS measures the variance in the timing of a bond’s cash flowsaround its duration. The cash flows are weighted by their discounted amounts. Using the sameterminology as before, dispersion is given by:
DS2 =n∑
i=1
CFi
P× vLi × (Li − D)2
DS2 =n∑
i=1
CFi
P× vLi × (L2
i − 2Li × D + D2)
DS2 =n∑
i=1
CFi
P× vLi × L2
i − D2
DS2 = CX
v2− D − D2
where:
DS dispersionD durationCX convexityP dirty pricen number of future cash flowsCFi i th (future) cash flowLi period in years to the i th cash flow, allowing for the market conventions for any
fractional part of a yearv discounting factor, i.e. v = 1/(1 + y)y redemption yield compounded annually (y = 0.06 for a yield of 6 %)
The last formula may be rearranged to define convexity in terms of dispersion, duration andyield:
CX = DS2 + D + D2
(1 + y)2
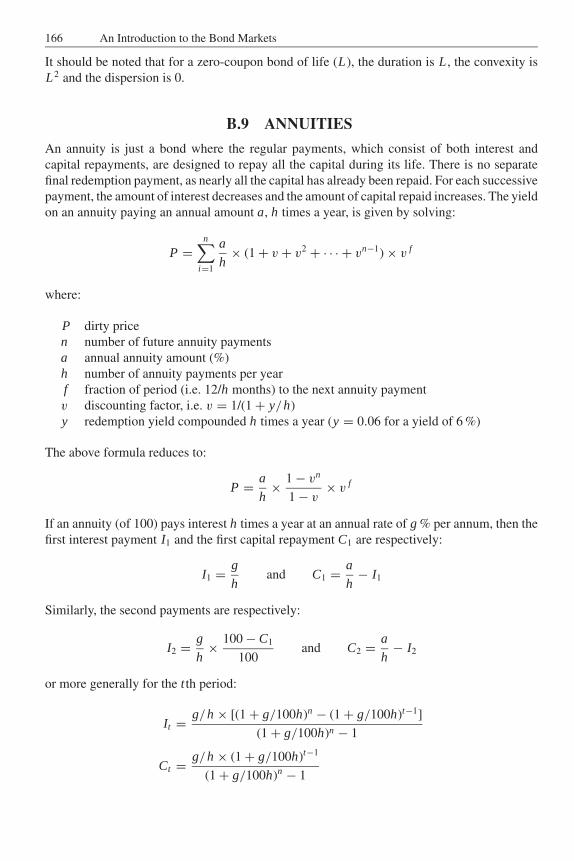
JWBK090-App-B JWBK090/Brown March 1, 2006 8:34 Char Count= 0
166 An Introduction to the Bond Markets
It should be noted that for a zero-coupon bond of life (L), the duration is L , the convexity isL2 and the dispersion is 0.
B.9 ANNUITIES
An annuity is just a bond where the regular payments, which consist of both interest andcapital repayments, are designed to repay all the capital during its life. There is no separatefinal redemption payment, as nearly all the capital has already been repaid. For each successivepayment, the amount of interest decreases and the amount of capital repaid increases. The yieldon an annuity paying an annual amount a, h times a year, is given by solving:
P =n∑
i=1
a
h× (1 + v + v2 + · · · + vn−1) × v f
where:
P dirty pricen number of future annuity paymentsa annual annuity amount (%)h number of annuity payments per yearf fraction of period (i.e. 12/h months) to the next annuity paymentv discounting factor, i.e. v = 1/(1 + y/h)y redemption yield compounded h times a year (y = 0.06 for a yield of 6 %)
The above formula reduces to:
P = a
h× 1 − vn
1 − v× v f
If an annuity (of 100) pays interest h times a year at an annual rate of g % per annum, then thefirst interest payment I1 and the first capital repayment C1 are respectively:
I1 = g
hand C1 = a
h− I1
Similarly, the second payments are respectively:
I2 = g
h× 100 − C1
100and C2 = a
h− I2
or more generally for the t th period:
It = g/h × [(1 + g/100h)n − (1 + g/100h)t−1]
(1 + g/100h)n − 1
Ct = g/h × (1 + g/100h)t−1
(1 + g/100h)n − 1
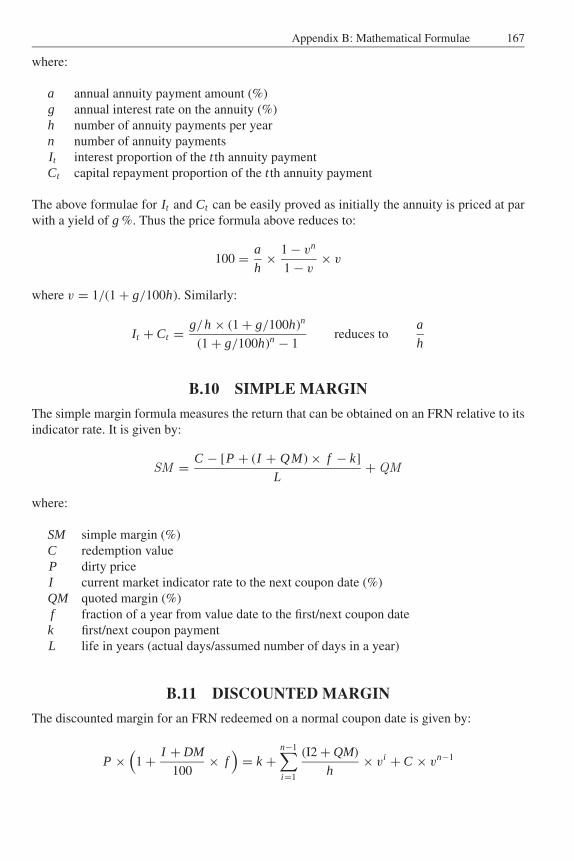
JWBK090-App-B JWBK090/Brown March 1, 2006 8:34 Char Count= 0
Appendix B: Mathematical Formulae 167
where:
a annual annuity payment amount (%)g annual interest rate on the annuity (%)h number of annuity payments per yearn number of annuity paymentsIt interest proportion of the t th annuity paymentCt capital repayment proportion of the t th annuity payment
The above formulae for It and Ct can be easily proved as initially the annuity is priced at parwith a yield of g %. Thus the price formula above reduces to:
100 = a
h× 1 − vn
1 − v× v
where v = 1/(1 + g/100h). Similarly:
It + Ct = g/h × (1 + g/100h)n
(1 + g/100h)n − 1reduces to
a
h
B.10 SIMPLE MARGIN
The simple margin formula measures the return that can be obtained on an FRN relative to itsindicator rate. It is given by:
SM = C − [P + (I + QM) × f − k]
L+ QM
where:
SM simple margin (%)C redemption valueP dirty priceI current market indicator rate to the next coupon date (%)QM quoted margin (%)f fraction of a year from value date to the first/next coupon datek first/next coupon paymentL life in years (actual days/assumed number of days in a year)
B.11 DISCOUNTED MARGIN
The discounted margin for an FRN redeemed on a normal coupon date is given by:
P ×(
1 + I + DM
100× f
)= k +
n−1∑i=1
(I2 + QM)
h× vi + C × vn−1
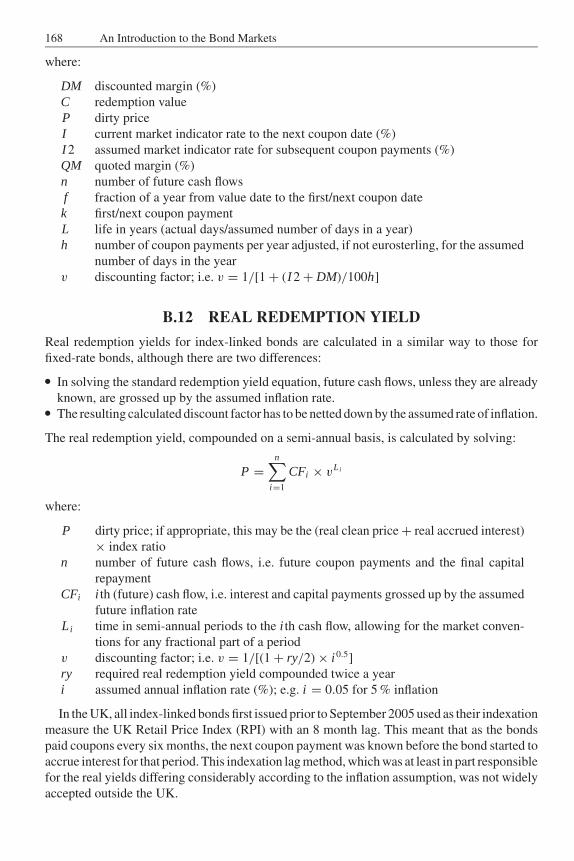
JWBK090-App-B JWBK090/Brown March 1, 2006 8:34 Char Count= 0
168 An Introduction to the Bond Markets
where:
DM discounted margin (%)C redemption valueP dirty priceI current market indicator rate to the next coupon date (%)I 2 assumed market indicator rate for subsequent coupon payments (%)QM quoted margin (%)n number of future cash flowsf fraction of a year from value date to the first/next coupon datek first/next coupon paymentL life in years (actual days/assumed number of days in a year)h number of coupon payments per year adjusted, if not eurosterling, for the assumed
number of days in the yearv discounting factor; i.e. v = 1/[1 + (I 2 + DM)/100h]
B.12 REAL REDEMPTION YIELD
Real redemption yields for index-linked bonds are calculated in a similar way to those forfixed-rate bonds, although there are two differences:� In solving the standard redemption yield equation, future cash flows, unless they are already
known, are grossed up by the assumed inflation rate.� The resulting calculated discount factor has to be netted down by the assumed rate of inflation.
The real redemption yield, compounded on a semi-annual basis, is calculated by solving:
P =n∑
i=1
CFi × vLi
where:
P dirty price; if appropriate, this may be the (real clean price + real accrued interest)× index ratio
n number of future cash flows, i.e. future coupon payments and the final capitalrepayment
CFi i th (future) cash flow, i.e. interest and capital payments grossed up by the assumedfuture inflation rate
Li time in semi-annual periods to the i th cash flow, allowing for the market conven-tions for any fractional part of a period
v discounting factor; i.e. v = 1/[(1 + ry/2) × i0.5]ry required real redemption yield compounded twice a yeari assumed annual inflation rate (%); e.g. i = 0.05 for 5 % inflation
In the UK, all index-linked bonds first issued prior to September 2005 used as their indexationmeasure the UK Retail Price Index (RPI) with an 8 month lag. This meant that as the bondspaid coupons every six months, the next coupon payment was known before the bond started toaccrue interest for that period. This indexation lag method, which was at least in part responsiblefor the real yields differing considerably according to the inflation assumption, was not widelyaccepted outside the UK.
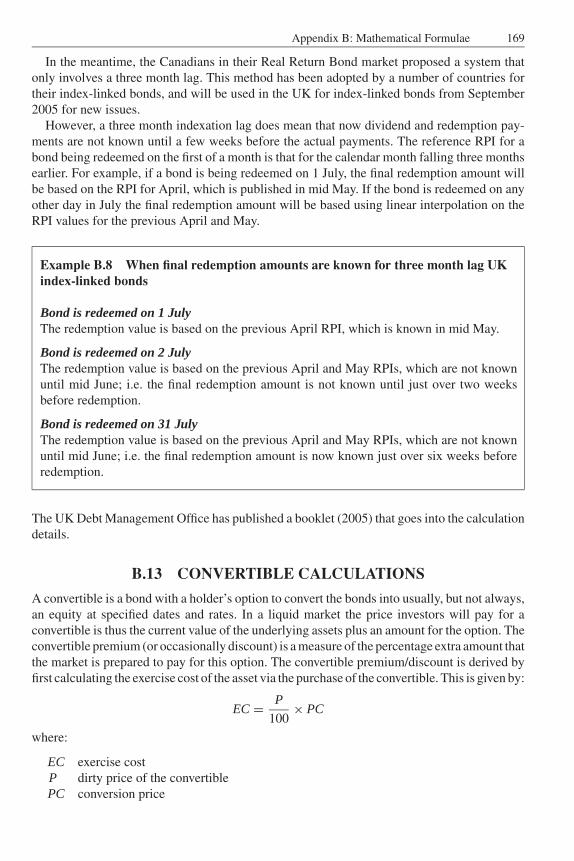
JWBK090-App-B JWBK090/Brown March 1, 2006 8:34 Char Count= 0
Appendix B: Mathematical Formulae 169
In the meantime, the Canadians in their Real Return Bond market proposed a system thatonly involves a three month lag. This method has been adopted by a number of countries fortheir index-linked bonds, and will be used in the UK for index-linked bonds from September2005 for new issues.
However, a three month indexation lag does mean that now dividend and redemption pay-ments are not known until a few weeks before the actual payments. The reference RPI for abond being redeemed on the first of a month is that for the calendar month falling three monthsearlier. For example, if a bond is being redeemed on 1 July, the final redemption amount willbe based on the RPI for April, which is published in mid May. If the bond is redeemed on anyother day in July the final redemption amount will be based using linear interpolation on theRPI values for the previous April and May.
Example B.8 When final redemption amounts are known for three month lag UKindex-linked bonds
Bond is redeemed on 1 JulyThe redemption value is based on the previous April RPI, which is known in mid May.
Bond is redeemed on 2 JulyThe redemption value is based on the previous April and May RPIs, which are not knownuntil mid June; i.e. the final redemption amount is not known until just over two weeksbefore redemption.
Bond is redeemed on 31 JulyThe redemption value is based on the previous April and May RPIs, which are not knownuntil mid June; i.e. the final redemption amount is now known just over six weeks beforeredemption.
The UK Debt Management Office has published a booklet (2005) that goes into the calculationdetails.
B.13 CONVERTIBLE CALCULATIONS
A convertible is a bond with a holder’s option to convert the bonds into usually, but not always,an equity at specified dates and rates. In a liquid market the price investors will pay for aconvertible is thus the current value of the underlying assets plus an amount for the option. Theconvertible premium (or occasionally discount) is a measure of the percentage extra amount thatthe market is prepared to pay for this option. The convertible premium/discount is derived byfirst calculating the exercise cost of the asset via the purchase of the convertible. This is given by:
EC = P
100× PC
where:
EC exercise costP dirty price of the convertiblePC conversion price
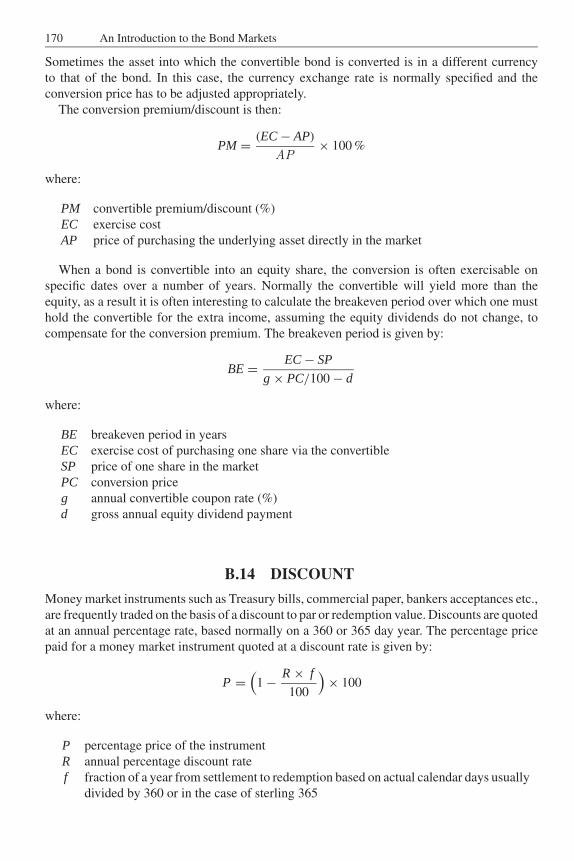
JWBK090-App-B JWBK090/Brown March 1, 2006 8:34 Char Count= 0
170 An Introduction to the Bond Markets
Sometimes the asset into which the convertible bond is converted is in a different currencyto that of the bond. In this case, the currency exchange rate is normally specified and theconversion price has to be adjusted appropriately.
The conversion premium/discount is then:
PM = (EC − AP)
AP× 100 %
where:
PM convertible premium/discount (%)EC exercise costAP price of purchasing the underlying asset directly in the market
When a bond is convertible into an equity share, the conversion is often exercisable onspecific dates over a number of years. Normally the convertible will yield more than theequity, as a result it is often interesting to calculate the breakeven period over which one musthold the convertible for the extra income, assuming the equity dividends do not change, tocompensate for the conversion premium. The breakeven period is given by:
BE = EC − SP
g × PC/100 − d
where:
BE breakeven period in yearsEC exercise cost of purchasing one share via the convertibleSP price of one share in the marketPC conversion priceg annual convertible coupon rate (%)d gross annual equity dividend payment
B.14 DISCOUNT
Money market instruments such as Treasury bills, commercial paper, bankers acceptances etc.,are frequently traded on the basis of a discount to par or redemption value. Discounts are quotedat an annual percentage rate, based normally on a 360 or 365 day year. The percentage pricepaid for a money market instrument quoted at a discount rate is given by:
P =(
1 − R × f
100
)× 100
where:
P percentage price of the instrumentR annual percentage discount ratef fraction of a year from settlement to redemption based on actual calendar days usually
divided by 360 or in the case of sterling 365
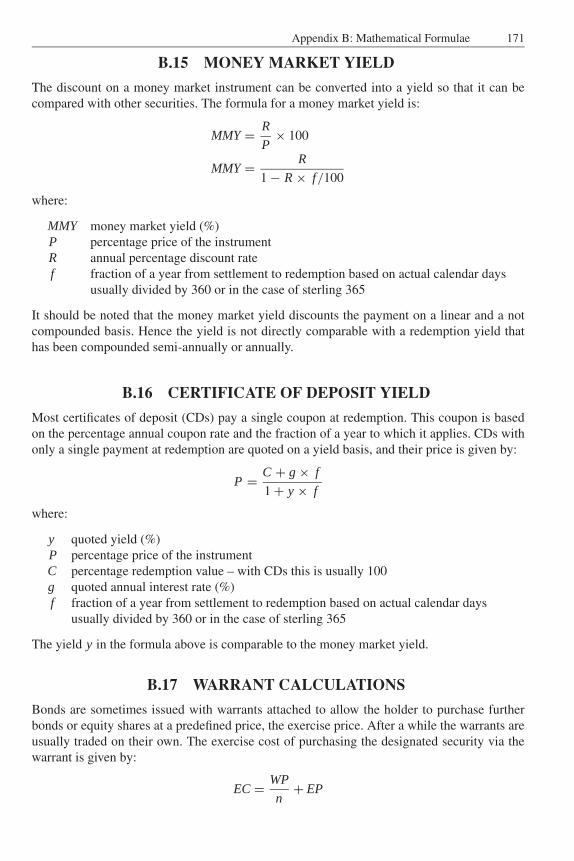
JWBK090-App-B JWBK090/Brown March 1, 2006 8:34 Char Count= 0
Appendix B: Mathematical Formulae 171
B.15 MONEY MARKET YIELD
The discount on a money market instrument can be converted into a yield so that it can becompared with other securities. The formula for a money market yield is:
MMY = R
P× 100
MMY = R
1 − R × f/100
where:
MMY money market yield (%)P percentage price of the instrumentR annual percentage discount ratef fraction of a year from settlement to redemption based on actual calendar days
usually divided by 360 or in the case of sterling 365
It should be noted that the money market yield discounts the payment on a linear and a notcompounded basis. Hence the yield is not directly comparable with a redemption yield thathas been compounded semi-annually or annually.
B.16 CERTIFICATE OF DEPOSIT YIELD
Most certificates of deposit (CDs) pay a single coupon at redemption. This coupon is basedon the percentage annual coupon rate and the fraction of a year to which it applies. CDs withonly a single payment at redemption are quoted on a yield basis, and their price is given by:
P = C + g × f
1 + y × f
where:
y quoted yield (%)P percentage price of the instrumentC percentage redemption value – with CDs this is usually 100g quoted annual interest rate (%)f fraction of a year from settlement to redemption based on actual calendar days
usually divided by 360 or in the case of sterling 365
The yield y in the formula above is comparable to the money market yield.
B.17 WARRANT CALCULATIONS
Bonds are sometimes issued with warrants attached to allow the holder to purchase furtherbonds or equity shares at a predefined price, the exercise price. After a while the warrants areusually traded on their own. The exercise cost of purchasing the designated security via thewarrant is given by:
EC = WP
n+ EP
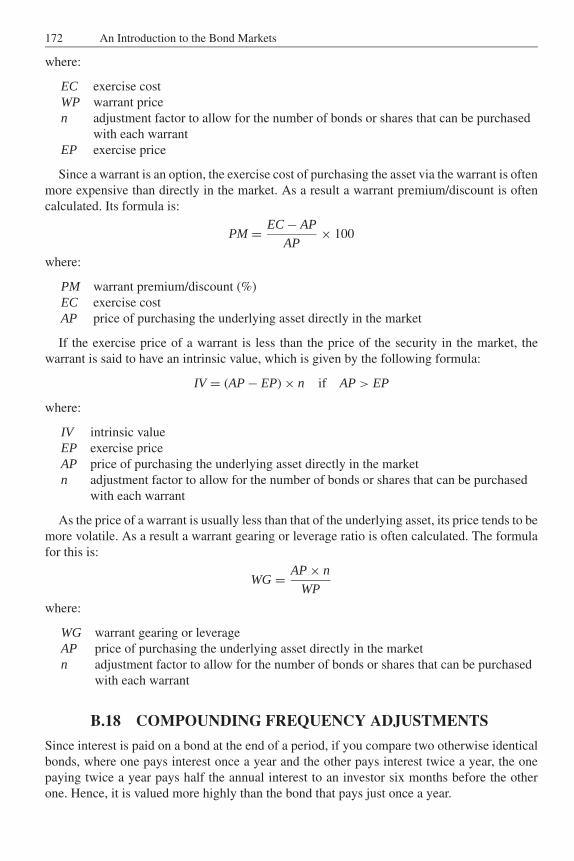
JWBK090-App-B JWBK090/Brown March 1, 2006 8:34 Char Count= 0
172 An Introduction to the Bond Markets
where:
EC exercise costWP warrant pricen adjustment factor to allow for the number of bonds or shares that can be purchased
with each warrantEP exercise price
Since a warrant is an option, the exercise cost of purchasing the asset via the warrant is oftenmore expensive than directly in the market. As a result a warrant premium/discount is oftencalculated. Its formula is:
PM = EC − AP
AP× 100
where:
PM warrant premium/discount (%)EC exercise costAP price of purchasing the underlying asset directly in the market
If the exercise price of a warrant is less than the price of the security in the market, thewarrant is said to have an intrinsic value, which is given by the following formula:
IV = (AP − EP) × n if AP > EP
where:
IV intrinsic valueEP exercise priceAP price of purchasing the underlying asset directly in the marketn adjustment factor to allow for the number of bonds or shares that can be purchased
with each warrant
As the price of a warrant is usually less than that of the underlying asset, its price tends to bemore volatile. As a result a warrant gearing or leverage ratio is often calculated. The formulafor this is:
WG = AP × n
WP
where:
WG warrant gearing or leverageAP price of purchasing the underlying asset directly in the marketn adjustment factor to allow for the number of bonds or shares that can be purchased
with each warrant
B.18 COMPOUNDING FREQUENCY ADJUSTMENTS
Since interest is paid on a bond at the end of a period, if you compare two otherwise identicalbonds, where one pays interest once a year and the other pays interest twice a year, the onepaying twice a year pays half the annual interest to an investor six months before the otherone. Hence, it is valued more highly than the bond that pays just once a year.
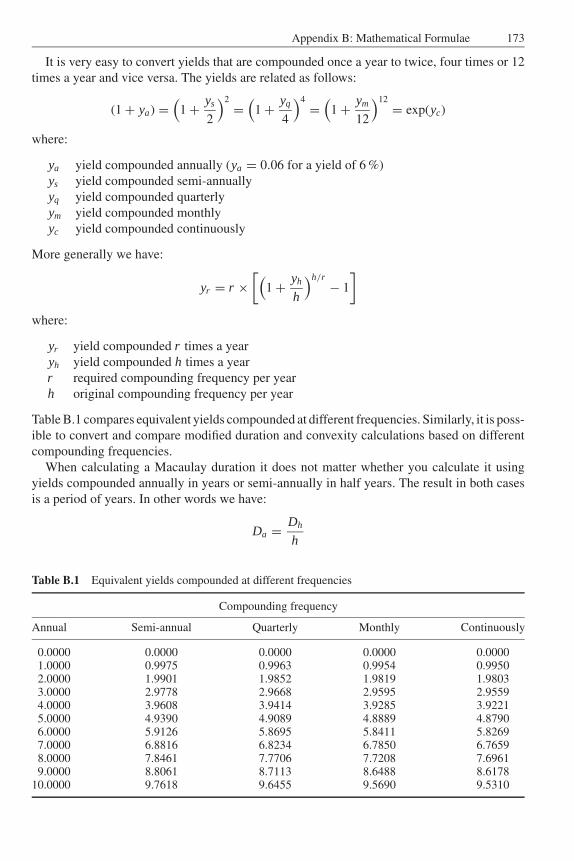
JWBK090-App-B JWBK090/Brown March 1, 2006 8:34 Char Count= 0
Appendix B: Mathematical Formulae 173
It is very easy to convert yields that are compounded once a year to twice, four times or 12times a year and vice versa. The yields are related as follows:
(1 + ya) =(
1 + ys
2
)2
=(
1 + yq
4
)4
=(
1 + ym
12
)12
= exp(yc)
where:
ya yield compounded annually (ya = 0.06 for a yield of 6 %)ys yield compounded semi-annuallyyq yield compounded quarterlyym yield compounded monthlyyc yield compounded continuously
More generally we have:
yr = r ×[(
1 + yh
h
)h/r− 1
]where:
yr yield compounded r times a yearyh yield compounded h times a yearr required compounding frequency per yearh original compounding frequency per year
Table B.1 compares equivalent yields compounded at different frequencies. Similarly, it is poss-ible to convert and compare modified duration and convexity calculations based on differentcompounding frequencies.
When calculating a Macaulay duration it does not matter whether you calculate it usingyields compounded annually in years or semi-annually in half years. The result in both casesis a period of years. In other words we have:
Da = Dh
h
Table B.1 Equivalent yields compounded at different frequencies
Compounding frequency
Annual Semi-annual Quarterly Monthly Continuously
0.0000 0.0000 0.0000 0.0000 0.00001.0000 0.9975 0.9963 0.9954 0.99502.0000 1.9901 1.9852 1.9819 1.98033.0000 2.9778 2.9668 2.9595 2.95594.0000 3.9608 3.9414 3.9285 3.92215.0000 4.9390 4.9089 4.8889 4.87906.0000 5.9126 5.8695 5.8411 5.82697.0000 6.8816 6.8234 6.7850 6.76598.0000 7.8461 7.7706 7.7208 7.69619.0000 8.8061 8.7113 8.6488 8.6178
10.0000 9.7618 9.6455 9.5690 9.5310
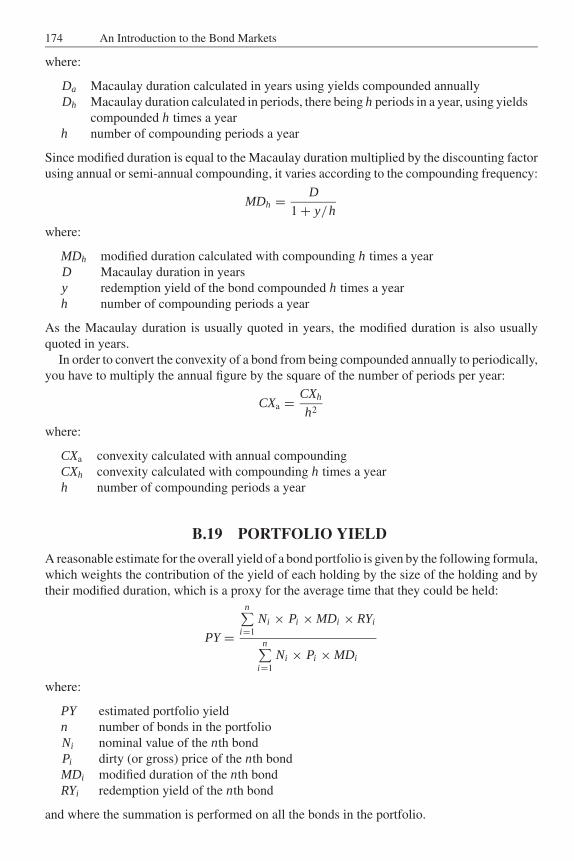
JWBK090-App-B JWBK090/Brown March 1, 2006 8:34 Char Count= 0
174 An Introduction to the Bond Markets
where:
Da Macaulay duration calculated in years using yields compounded annuallyDh Macaulay duration calculated in periods, there being h periods in a year, using yields
compounded h times a yearh number of compounding periods a year
Since modified duration is equal to the Macaulay duration multiplied by the discounting factorusing annual or semi-annual compounding, it varies according to the compounding frequency:
MDh = D
1 + y/h
where:
MDh modified duration calculated with compounding h times a yearD Macaulay duration in yearsy redemption yield of the bond compounded h times a yearh number of compounding periods a year
As the Macaulay duration is usually quoted in years, the modified duration is also usuallyquoted in years.
In order to convert the convexity of a bond from being compounded annually to periodically,you have to multiply the annual figure by the square of the number of periods per year:
CXa = CXh
h2
where:
CXa convexity calculated with annual compoundingCXh convexity calculated with compounding h times a yearh number of compounding periods a year
B.19 PORTFOLIO YIELD
A reasonable estimate for the overall yield of a bond portfolio is given by the following formula,which weights the contribution of the yield of each holding by the size of the holding and bytheir modified duration, which is a proxy for the average time that they could be held:
PY =
n∑i=1
Ni × Pi × MDi × RYi
n∑i=1
Ni × Pi × MDi
where:
PY estimated portfolio yieldn number of bonds in the portfolioNi nominal value of the nth bondPi dirty (or gross) price of the nth bondMDi modified duration of the nth bondRYi redemption yield of the nth bond
and where the summation is performed on all the bonds in the portfolio.
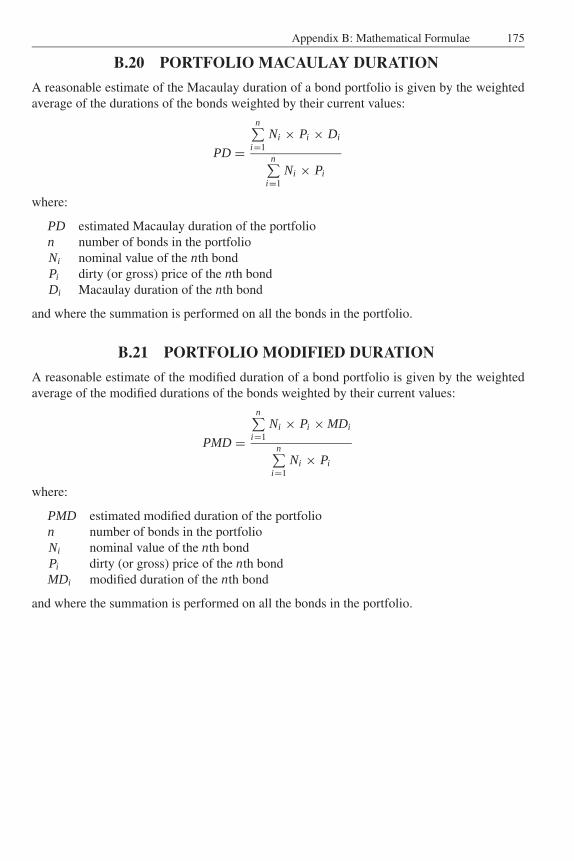
JWBK090-App-B JWBK090/Brown March 1, 2006 8:34 Char Count= 0
Appendix B: Mathematical Formulae 175
B.20 PORTFOLIO MACAULAY DURATION
A reasonable estimate of the Macaulay duration of a bond portfolio is given by the weightedaverage of the durations of the bonds weighted by their current values:
PD =
n∑i=1
Ni × Pi × Di
n∑i=1
Ni × Pi
where:
PD estimated Macaulay duration of the portfolion number of bonds in the portfolioNi nominal value of the nth bondPi dirty (or gross) price of the nth bondDi Macaulay duration of the nth bond
and where the summation is performed on all the bonds in the portfolio.
B.21 PORTFOLIO MODIFIED DURATION
A reasonable estimate of the modified duration of a bond portfolio is given by the weightedaverage of the modified durations of the bonds weighted by their current values:
PMD =
n∑i=1
Ni × Pi × MDi
n∑i=1
Ni × Pi
where:
PMD estimated modified duration of the portfolion number of bonds in the portfolioNi nominal value of the nth bondPi dirty (or gross) price of the nth bondMDi modified duration of the nth bond
and where the summation is performed on all the bonds in the portfolio.

JWBK090-App-B JWBK090/Brown March 1, 2006 8:34 Char Count= 0
176
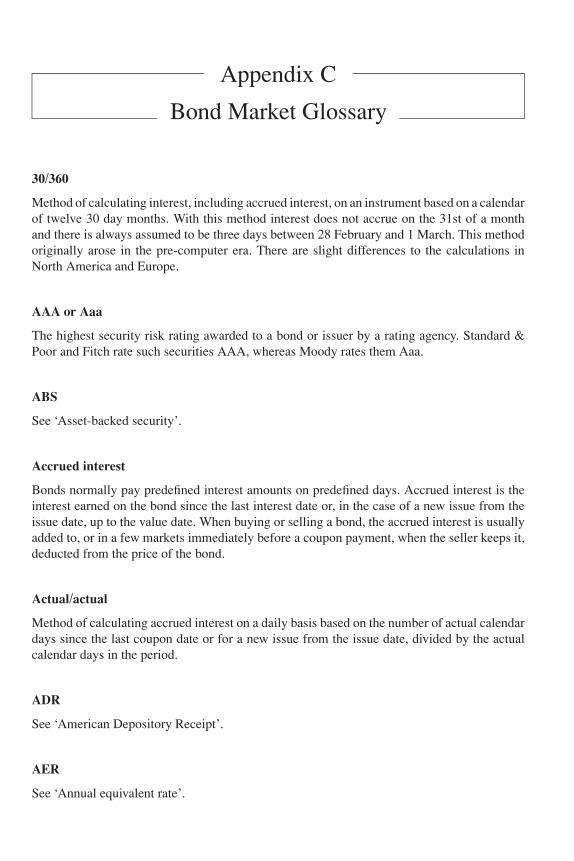
JWBK090-APPC JWBK090/Brown March 1, 2006 8:34 Char Count= 0
Appendix C
Bond Market Glossary
30/360
Method of calculating interest, including accrued interest, on an instrument based on a calendarof twelve 30 day months. With this method interest does not accrue on the 31st of a monthand there is always assumed to be three days between 28 February and 1 March. This methodoriginally arose in the pre-computer era. There are slight differences to the calculations inNorth America and Europe.
AAA or Aaa
The highest security risk rating awarded to a bond or issuer by a rating agency. Standard &Poor and Fitch rate such securities AAA, whereas Moody rates them Aaa.
ABS
See ‘Asset-backed security’.
Accrued interest
Bonds normally pay predefined interest amounts on predefined days. Accrued interest is theinterest earned on the bond since the last interest date or, in the case of a new issue from theissue date, up to the value date. When buying or selling a bond, the accrued interest is usuallyadded to, or in a few markets immediately before a coupon payment, when the seller keeps it,deducted from the price of the bond.
Actual/actual
Method of calculating accrued interest on a daily basis based on the number of actual calendardays since the last coupon date or for a new issue from the issue date, divided by the actualcalendar days in the period.
ADR
See ‘American Depository Receipt’.
AER
See ‘Annual equivalent rate’.
177
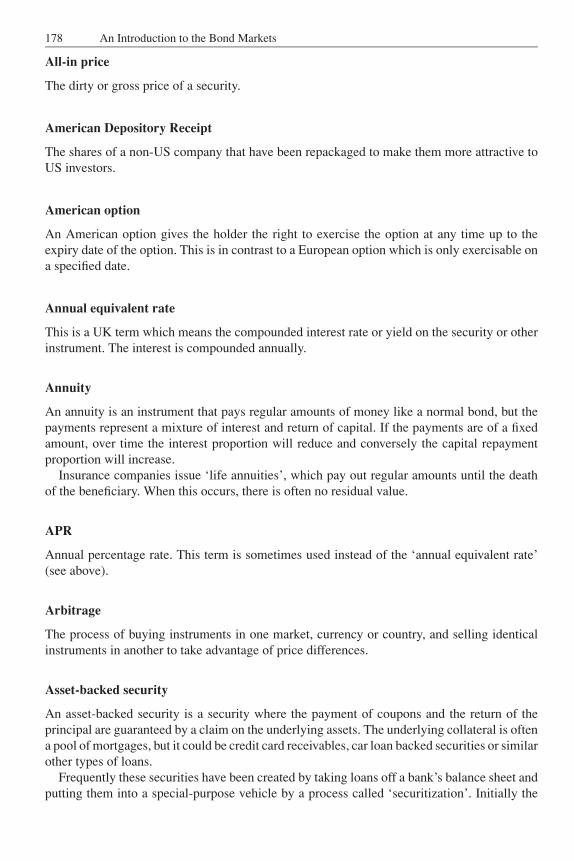
JWBK090-APPC JWBK090/Brown March 1, 2006 8:34 Char Count= 0
178 An Introduction to the Bond Markets
All-in price
The dirty or gross price of a security.
American Depository Receipt
The shares of a non-US company that have been repackaged to make them more attractive toUS investors.
American option
An American option gives the holder the right to exercise the option at any time up to theexpiry date of the option. This is in contrast to a European option which is only exercisable ona specified date.
Annual equivalent rate
This is a UK term which means the compounded interest rate or yield on the security or otherinstrument. The interest is compounded annually.
Annuity
An annuity is an instrument that pays regular amounts of money like a normal bond, but thepayments represent a mixture of interest and return of capital. If the payments are of a fixedamount, over time the interest proportion will reduce and conversely the capital repaymentproportion will increase.
Insurance companies issue ‘life annuities’, which pay out regular amounts until the deathof the beneficiary. When this occurs, there is often no residual value.
APR
Annual percentage rate. This term is sometimes used instead of the ‘annual equivalent rate’(see above).
Arbitrage
The process of buying instruments in one market, currency or country, and selling identicalinstruments in another to take advantage of price differences.
Asset-backed security
An asset-backed security is a security where the payment of coupons and the return of theprincipal are guaranteed by a claim on the underlying assets. The underlying collateral is oftena pool of mortgages, but it could be credit card receivables, car loan backed securities or similarother types of loans.
Frequently these securities have been created by taking loans off a bank’s balance sheet andputting them into a special-purpose vehicle by a process called ‘securitization’. Initially the
JWBK090-APPC JWBK090/Brown March 1, 2006 8:34 Char Count= 0
Appendix C: Bond Market Glossary 179
bonds often have a credit rating of AAA or AA, but this can change over time as the underlyingassets are redeemed, which results in a partial prepayment of the bond.
Ask price
The price at which a market maker will sell the security to an investor. It is also known as the‘offer price’.
At-the-money
For a warrant this means a security where the cost of exercising the option is the same as thecurrent price of the exercisable security.
Auction
A process whereby securities are issued to the market. Investors submit bids for the securitieson a price or yield basis. If there are more bids than securities, the securities are issued to thosepeople with the highest bids. The auction rules vary considerably from market to market.
Average life
If a bond is redeemed in more than one tranche, its average life is the period to the weightedaverage of the redemption dates.
Example C.1
If 40 % of a bond is redeemed on 1 July 2010 and the remaining 60 % is redeemed on 1 July2015, then its weighted average redemption date is 1 July 2013. The bond’s average life isthe period from now up to the weighted average redemption date.
Backwardation
Backwardation means it is possible to buy a security for less than it is possible to simultaneouslysell the same security, thus making a profit. Such occurrences for obvious reasons do not usuallylast for long.
Example C.2
Consider a security where two market makers make quotations. The first market makerquotes 90–91 and the second 92–93 for the security. If this occurs it is theoretically possibleto buy the security from the first market maker for 91 and simultaneously sell the samesecurity to the second market maker for 92.
JWBK090-APPC JWBK090/Brown March 1, 2006 8:34 Char Count= 0
180 An Introduction to the Bond Markets
Bankers’ acceptance
A banker’s acceptance starts as an order by a bank’s customer to a bank to pay an amountof money in the future, usually within six months. Effectively it starts as a postdated cheque.When accepted the bank assumes responsibility for the payment. They are used in foreigntrade where the credit worthiness of one trader is unknown to the trading partner. Acceptancesare traded in the secondary market at a discount to their face value.
Barbell
An investment strategy involves investing in two securities, one with a short maturity/durationand the other with a long maturity/duration, instead of a single security with a medium-termmaturity/duration.
Example C.3
Consider the following three bonds from the same issuer which pay coupons once a year:
Coupon Life to maturity YieldBond rate (years) Price (%) Duration
A 5.0 5.0 100 5.0 4.53B 5.5 10.0 100 5.5 8.06C 6.0 20.0 100 6.0 12.62
An investment of 1 000 000 in bond B would have a duration of 8.06 and yield 5.5 %.On the other hand, an investment of 564 000 in bond A and 436 000 in bond C will have
the same duration of 8.06, but will produce a different yield. Such a strategy is called abarbell or butterfly strategy.
Basis point
A yield or price change of 0.01 %. For example, if the price on a security changes from 98.00to 98.25, then the price is said to have changed by 25 basis points.
Basis risk
Basis risk occurs when one kind of market risk is hedged with an instrument that performs ina similar but not necessary identical way.
Bearer bond
A bond where the physical possession of the certificate implies ownership, e.g. as is thecase with ordinary bank notes. Most international bonds are in fact bearer bonds, but thecertificates are frequently all held centrally by Euroclear or Cedel, with the result that manyof the advantages of registered bonds are achieved.
Benchmark security
A liquid security, relative to which some securities are compared or sometimes quoted andtraded.
JWBK090-APPC JWBK090/Brown March 1, 2006 8:34 Char Count= 0
Appendix C: Bond Market Glossary 181
Beta
Although usually associated with equities and equity-related products, based on historic infor-mation it measures the sensitivity of an instrument to its market.
If a security has a beta of 1 then, based on historic performance, it is expected to increaseor decrease in value by the same amount as the appropriate market. If it has a value of 2 thenhistorically it will move by twice the amount of the market. If a security moves countercyclicallythen its beta will be negative.
Bid-offer spread
The difference between the price that a market maker will sell a security to an investor (offeror ask price) and the price that the market maker is prepared to buy the same security from aninvestor (bid price).
Bid price
The price at which a market maker will buy a security.
Bill
Bills are short-term money market instruments. They are usually issued for a period of notmore than 12 months.
BOBL
Bundesobligationen. German Government bonds issued with a life to maturity of up to fiveyears.
Bond Market Association
A trade organization of over 200 securities firms, banks and other market participants thatunderwrite, trade and sell debt securities and other financial products globally. It has officesin New York, Washington and London. It represents the interest of its members in thesemarkets before regulators and legislators, establishes market practices and standardization ofprocedures and documentation to promote market efficiency and integrity.
BOT
Buoni Ordinari del Tesoro. Italian Government Treasury bills.
bp
See ‘Basis point’.
Brady bonds
Brady bonds represent the restructuring of non-performing bank loans of emerging marketgovernments into marketable securities. An agreement for the restructuring of non-performing
JWBK090-APPC JWBK090/Brown March 1, 2006 8:34 Char Count= 0
182 An Introduction to the Bond Markets
bank loans was first worked out between the United States and Mexico by the then Secretaryof the Treasury Nicholas Brady.
BTAN
Bons du Tresor a Taux Fixe et Interet Annuel. French Government bonds issued with a life tomaturity of less than five years.
BTF
Bons du Tresor a Taux Fixe. French Government bills.
BTP
Buoni del Tesoro Poliennali. Italian Government fixed-rate notes.
Bulldog
A sterling bond issued in the United Kingdom by a non-UK issuer.
Bullet bond
A bond that has been issued without any call or other options, i.e. a bond that should normallybe redeemed on its maturity date irrespective of prevailing interest rates. Bullet bonds are alsocalled ‘option free bonds’.
Bund
Bundesanleihen. A German Government bond issue, which has been issued with an initial lifeof more than five years.
Bundesschatzanweisungen
Short-term German Government bond issues. They usually have an initial life of two years.
Butterfly
See ‘Barbell’.
Buy/Sell Back
A reverse repo. (see Chapter 6 on repos).
Call
For a bond, the ability of the issuer to redeem (i.e. call) the bond early. The bond’s prospectusspecifies the circumstances and the notice period required for a bond to be called. Sometimesa bond can only be called at a premium.
JWBK090-APPC JWBK090/Brown March 1, 2006 8:34 Char Count= 0
Appendix C: Bond Market Glossary 183
CCT
Certificati di Credito del Tesoro. Italian Government floating-rate notes.
CD
See ‘Certificate of deposit’.
CDO
See ‘Collateralized debt obligation’.
CDS
See ‘Credit default swap’.
Cedulas
A Spanish covered bond or Pfandbrief.
Central counterparty
In some markets, in order to reduce counterparty risk, a central counterparty has been created,which is guaranteed by the members of the market (exchange). The central counterparty isthus less likely to default than an individual member.
As soon as a transaction has been agreed between two members, it is replaced by twoseparate transactions with the central counterparty: a sale of the security from the seller to thecentral counterparty, and a purchase of the same security with the same terms from the centralcounterparty by the buyer. This process is called ‘novation’.
In addition, the existence of the central counterparty potentially allows transactions to benetted out, thus further reducing the counterparty risk.
Example C.4
In the morning member A sells 1 000 000 of a security to member B for 950 000. Later thatday member A buys back 1 000 000 of the same security from B for 945 000. If these twotransactions are netted out, the only obligation is for member B to pay A 5000.
Central Securities Depositary
An organization that holds securities in either a dematerialized or immobilized form, thusenabling transactions to be processed by book entry transfer.
JWBK090-APPC JWBK090/Brown March 1, 2006 8:34 Char Count= 0
184 An Introduction to the Bond Markets
Certificate of deposit
A certificate of deposit is a money market instrument that has normally been issued with a lifeto maturity of up to one year, although some have been issued with lives of up to five years.The majority of certificates of deposit pay a single coupon at maturity.
CGO
UK Central Gilts Office.
Classic repo
See Chapter 6, section 6.1.
Clean price
The price of a bond excluding any accumulated accrued interest. This is normally the way thatbonds are quoted.
Closing leg
The second and closing half of a repo transaction.
CMO
See ‘Collateralized mortgage obligation’.
Collateralized debt obligation
Collateralized debt obligations are securities backed by a portfolio of bonds or loans that can bedivided into different slices of risk. This enables the securities to appeal to a range of investors.
Collateralized mortgage obligation
Similar to a collateralized debt obligation, but secured on a pool of mortgage-backed securities.
Commercial paper
Commercial paper is a short-term unsecured promissory note that has been issued by a companyin the open market. Normally, commercial paper is issued with a zero coupon.
Common stock
A term used, especially in the US, for ‘ordinary shares’.
Compounding period
Redemption and holding yield calculations usually assume that any interest and other paymentsare reinvested periodically, i.e. compounded. If the reinvestment period is one year, then the
JWBK090-APPC JWBK090/Brown March 1, 2006 8:34 Char Count= 0
Appendix C: Bond Market Glossary 185
yield is said to be compounded annually. Similarly, if it is reinvested every six months, then itis said to be compounded semi-annually.
Conversion premium/discount (%)
For a convertible the percentage premium or discount that has to be paid for buying theunderlying security (into which the convertible can be converted) via the convertible as opposedto buying the security directly.
Convertible
A convertible is a bond that gives the holder the option on specific dates or during a specificperiod to convert the bond into another security. Although the other security is normally anordinary share, convertibles have been issued with the option to convert into other bonds.
Convexity
The relationship between yield (to maturity) and price for a bond is not linear and varies frombond to bond. This measures the degree of curvature.
Counterparty
The other party in the purchase or sale of a security: i.e. the counterparty of a purchaser of asecurity is the seller and vice versa. For most investors the counterparty is usually the marketmaker.
Coupon
The annual rate of interest of the bond, which may be paid in one or more instalments. Nearlyall interest-paying bonds pay interest annually, semi-annually, quarterly or monthly.
With a bearer bond, the physical coupons are attached to the bearer certificate. For the holderto get a payment the coupons have to be detached by the paying agent.
Coupon frequency
The number of coupon payments for a bond in a year. Bonds usually pay interest one, two, fouror twelve times a year. In the UK and USA for fixed-rate bonds, this is usually two, whereasin most of Continental Europe it is usually one.
Coupon payment
An actual interest payment: not to be confused with the annual coupon rate.
Coupon payment date
The date on which an interest or coupon payment is due. With fixed-rate bonds, but not normallywith floating rate notes, the payment date may be a non-business day (e.g. at a weekend or ona bank holiday). When this occurs the payment will be delayed until the following businessday.
JWBK090-APPC JWBK090/Brown March 1, 2006 8:34 Char Count= 0
186 An Introduction to the Bond Markets
Covered bonds
Covered bonds are bonds issued by banks and are secured on a pool of mortgages or public loanson the bank’s balance sheet. The bonds are considered to be very secure since they are coveredby the issuer and have preferential claim over the cover pool in the event of insolvency. InGermany, the covered bond market, where they are known as Pfandbrief, has been in existencefor over a century. The covered bond market is growing fast in a number of European countries.They are called Obligation Foncieres in France, Lettres de Gage in Luxembourg and CedulasHipotecarias in Spain.
Credit default swap
Credit default swaps (CDS) allow investors to insure the credit risk of their bond and loanholdings. They also allow them to take on risks where they think that the terms are attractive.
An investor who holds a normal bond can buy a credit default swap for the bond. The investormakes regular payments to the market maker, who in turn guarantees payment of the wholeamount of the underlying bond regardless of whether the issuer defaults during the life of theCDS.
CTO
Certificati del Tesoro con Opzione. Italian Government putable fixed-rate notes.
CTZ
Certificati del Tesoro – Zero Coupon. Italian Government two-year zero-coupon bonds.
Cum-dividend
The trading status of a bond where the purchaser is entitled to receive the next interest payment.In some markets it is possible for bonds to have the alternative status of ex-dividend, wherethe seller has the right to receive the next interest payment.
Cumulative preference shares
A preference share issued by a company where the entitlement to dividends continues toaccumulate even if the company cannot afford to pay any dividends.
Example C.5
Consider a company whose share capital consists of 5 % cumulative preference shares andordinary shares. For some years the company makes reasonable profits and as a result itpays out 5 % on the preference shares and a dividend on the ordinary shares. The companythen has two very lean years and as a result it cannot afford to pay either the preference orthe ordinary dividend. In the third year the company starts making profits again. However,before it can pay an ordinary dividend it has to pay the cumulative preference shares adividend of 15 % (5 % for each of the missed years and 5 % for the current year).
JWBK090-APPC JWBK090/Brown March 1, 2006 8:34 Char Count= 0
Appendix C: Bond Market Glossary 187
Current yield
A yield that does not allow for any potential gain or loss, e.g. at redemption. For a bond this isjust the annual coupon divided by the clean price. This is similar to the dividend yield on anequity share. It is also known as a flat, interest or running yield.
Example C.6
For a bond with a 6 % coupon priced at 90 % this is:
6 × 100/90 = 6.67 %
Day count method
Method of calculating accrued interest for a bond. Although there are many variants, there arefive main methods. They are:
Actual days/actual daysActual days/365Actual days/36030/360 (European method)30/360 (US method)
These methods are described in more detail under ‘Accrued interest’ in Appendix B.
Day trading
Buying and selling the same security during the same day.
DBV
See ‘Delivery by value’.
Debenture
A bond frequently issued by a company, which is often secured on a specific asset or a groupof assets, e.g. on a property.
Debt Management Office
The UK Debt Management Office, which was established on 1 April 1998, carries out thefunction of debt management for the UK Government. It is an executive agency within HMTreasury.
Default risk
The credit risk associated with the issuer of a bond failing to pay all the coupons and to repaythe principal in a timely way is called the default risk of a bond. Even if a bond goes into
JWBK090-APPC JWBK090/Brown March 1, 2006 8:34 Char Count= 0
188 An Introduction to the Bond Markets
default, the holder normally recovers a percentage of the investment. This percentage is calledthe ‘recovery rate’.
Delivery by value
A process that enables a UK CGO member to borrow from or lend money to another CGOmember against overnight gilt-edged collateral.
Delivery versus payment
A mechanism that enables the simultaneous exchange of securities and cash. As a result neitherthe purchaser nor the seller of the securities is at risk of default by the other party.
Dematerialized securities
Securities held in a book transfer system with no certificates.
Denomination
The denomination of a bond is usually the smallest amount of the bond that it is possible tohold. This could be on a central register or on the certificate with bearer bonds.
Example C.7
In the UK gilt-edged market, where the holdings are held on a central register, it is possibleto hold £0.01 of a bond – hence the bonds have a denomination of just 1 p. However, in theeurodollar market the bond denominations are usually at least $1000 and in some cases asmuch as $100 000 or even $1 million.
A few bearer bonds have been issued with multiple denominations, e.g. $10 000, $25 000 and$100 000.
Derivative
A generic term for an option and/or a future to buy or sell a security or a combination ofinstruments. The terms may be very complicated.
Dirty price
The price of a bond including any accrued interest. If you purchase a bond, this is the priceyou will have to pay. The ‘dirty’ or ‘gross’ price of a bond is its clean price plus or minus anyaccrued interest.
JWBK090-APPC JWBK090/Brown March 1, 2006 8:34 Char Count= 0
Appendix C: Bond Market Glossary 189
Discount rate
A measure, expressed as an annual rate per cent, of how much the price of a security is lessthan its redemption value. This is usually applied to money market instruments that do nothave a coupon.
Example C.8
If an instrument that will be redeemed at 100 in 3 months’ time is priced at 98, it has adiscount of (100 − 98) × 4/100 = 8 %.
Discounted margin
The discounted margin for a floating-rate note measures the yield premium or discount of thenote relative to its indicator rate. It allows for both the current yield effect on the margin andallows for any capital gain.
Dispersion
A measure of the variance of a bond’s cash flows around the date of its Macaulay duration.
Dividend
Although dividend usually refers to an interest payment for a preferred or ordinary share, it issometimes used to denote a coupon payment on a bond.
Dividend yield
For an equity share this is the estimated current annual dividend divided by the price. Dividendyields are sometimes grossed up to allow for tax that has been paid on the dividends. This issimilar to the current yield on a bond.
DMO
See ‘Debt Management Office’.
Domestic bond
A bond issued in a country in the currency of that country by a domestic issuer.
Example C.9
A bond issued in sterling by the UK Government (i.e. a gilt-edged security). A bond issuedin the US in US dollars by Ford.
JWBK090-APPC JWBK090/Brown March 1, 2006 8:34 Char Count= 0
190 An Introduction to the Bond Markets
Dragon bond
A bond issued in Asia but denominated in US dollars.
Dual currency bonds
Bonds that pay interest in one currency but repay the capital in another are referred to as dualcurrency bonds. There is a variety of different models of dual currency bonds. Some fix theexchange rate between the currencies at the issue date, whereas others use the exchange rate atthe time of the cash flow payment, and others even offer the investor the choice of the paymentcurrency.
Duration
The average life of all the anticipated future cash flows of a bond discounted at the redemptionyield rate. This is the average time your investment in the bond will be outstanding assumingyou hold the bond until maturity allowing for the cost of money.
DV01
Dollar value of an oh one. It measures the sensitivity of the price to a change in yield of 0.01(i.e. one basis point). DV01 is similar to ‘modified duration’, but instead of measuring thepercentage change in price as modified duration does, it measures the actual change.
Example C.10
Consider a bond with a modified duration of 5.0.
If the bond has a dirty price of 120, then its DV01 will be 1.2 × 5 = 6.
If the bond has a dirty price of 100, then its DV01 will be 1.0 × 5 = 5.
If the bond has a dirty price of 80, then its DV01 will be 0.8 × 5 = 4.
DVP
See ‘Delivery versus payment’.
ECP
See ‘Euro commercial paper’.
EONIA
‘Euro OverNight Index Average’. It is the effective overnight rate calculated as a weightedaverage of overnight unsecured lending transactions in the interbank market, initiated withinthe euro area by the panel banks.
JWBK090-APPC JWBK090/Brown March 1, 2006 8:34 Char Count= 0
Appendix C: Bond Market Glossary 191
Equity shares
See ‘Ordinary shares’.
EURIBOR
Euro interbank offer rate. The rate of interest at which prime quality banks can borrow euros.EURIBOR rates are quoted for periods of 1 week up to 12 months.
Eurobond
An international bond issued in Europe. They are often listed on the Luxembourg or LondonStock Exchanges. It may be issued in many different currencies, not just euros.
Euro commercial paper
A money market loan created on demand as part of a euro commercial paper (ECP) issueprogram. The paper is usually issued for a period of less than a year at a discount and does notpay a coupon.
Eurodollar bond
An international bond issued in Europe and denominated in US dollars.
European option
A European option is an option to purchase securities or currency for a defined price at aspecified future date. The option, unlike American options, cannot be exercised prior to thedate.
Exchangeable bond or note
The name sometimes given to a convertible bond where the conversion terms specify that it isconvertible into a security that is not the ordinary share of the bond issuer.
Example C.11 Swiss Life Finance Ltd 1 % Exchangeable Bonds 2005
Although these bonds are guaranteed by Swiss Life Insurance and Pension Fund Company,they are exchangeable for UBS AG registered shares from 20 May 1998 at CHF 3450 each.
Ex-coupon date
The date on which the buyer of a bond or share does not get the next coupon payment. Theseller keeps it, although this is after the seller has sold the shares. International bonds do not goex-coupon until the coupon date. In the UK gilt-edged market securities (other than 3 1
2 % War
JWBK090-APPC JWBK090/Brown March 1, 2006 8:34 Char Count= 0
192 An Introduction to the Bond Markets
Loan) go ex-coupon seven business days before the coupon date. War Loan goes ex-coupon10 business days before the coupon date.
Ex-dividend
A security is said to be traded ex-dividend or ex-coupon if the seller of the security keeps thenext coupon payment instead of the purchaser.
Ex-dividend date
See ‘Ex-coupon date’.
Exercise cost
The cost of purchasing the underlying security via the convertible or warrant. For a warrant,the exercise cost is the exercise price plus the cost of purchasing the warrant after adjustingfor currency and the number of securities associated with the warrant.
Exercise price
For a warrant, this is the cost of exercising the option to purchase the security. It is also calledthe strike price.
Expiration date
The date at which an option or a futures contract expires.
Face value
See ‘Nominal amount/value’.
Fannie Mae
Federal National Mortgage Association. Set up in the 1930s by the US Congress with theresponsibility of creating a liquid secondary market in mortgages.
Flat price
The price of a bond where accrued interest is not added. It is usually applied to bonds wherethe issuer has defaulted and/or the payments are uncertain.
Flat yield
See ‘Current yield’.
Floating-rate note
A debt instrument where the coupon payments are not fixed, but vary according to someexternal rate such as a three month LIBOR or a six month EURIBOR.
JWBK090-APPC JWBK090/Brown March 1, 2006 8:34 Char Count= 0
Appendix C: Bond Market Glossary 193
Example C.12
A floating-rate note might commit to pay quarterly coupons equivalent to one-eighth plusthe three month dollar LIBOR rate two days prior to the beginning of the coupon period.
Foreign bond
A bond issued in a country in the currency of that country by a foreign issuer.
Forward contract
An agreement between two parties to conduct a transaction at a future date on terms that havebeen agreed.
Forward rate
An interest rate that will commence at some time in the future.
Example C.13
If an interest rate of 4.5 % is agreed for a period of, say, one year on a deposit that will bemade in one year’s time, 4.5 % is said to be a forward rate.
Freddie Mac
Federal Home Loan Mortgage Corporation.
FRN
See ‘Floating-rate note’.
Future
An agreement to transact a deal at a future date at a specified price, e.g. an agreement to buy1000 BT shares at 200 p each on 1 January 2008.
GDR
See ‘Global depository receipt’.
GEMM
A UK gilt-edged market maker.
JWBK090-APPC JWBK090/Brown March 1, 2006 8:34 Char Count= 0
194 An Introduction to the Bond Markets
General collateral
Securities that can be used as collateral against cash borrowing in a repo contract.
Gilt-edged securities
Securities issued and guaranteed by the UK Government.
Gilts
See ‘Gilt-edged securities’.
Ginnie Mae
Government National Mortgage Association. Formed in 1968 out of Fannie Mae to supportthe market in US Government insured mortgages.
Global bond
A global bond is one that was issued and is traded in both the eurobond market and the USYankee bond market. The first global bond was issued by the World Bank in 1989.
Global certificate
Some bonds are issued with a single global certificate for the entire issue. Trading in suchbonds is effected by changes in the record of ownership and not by the physical transfer of thesecurities.
Global depository receipt
The shares of a company that have been packaged to make them more attractive to internationalinvestors. For example, Asian company shares repackaged in US dollars.
GMRA
Global Master Repurchase Agreement. The GMRA is a standard master agreement for repotransactions. The first version of the TBMA/ISMA GMRA was published in 1992. The mostrecent version, taking account of market developments, was published in 2005.
Grey market
Trading a security on the ‘grey market’ refers to trading a security after it has been announced,but prior to it being formally issued. Such trades are transacted on a ‘when issued’ basis. Thismeans that if the security is pulled for any reason, the transaction is deemed to be null andvoid.
JWBK090-APPC JWBK090/Brown March 1, 2006 8:34 Char Count= 0
Appendix C: Bond Market Glossary 195
Gross price
See ‘Dirty price’.
Haircut
A term, originating in the USA, referring to the margin on a repo transaction.
Hedge fund
An investment partnership whose prospectus allows for the fund to take both long and shortpositions and use leverage and derivatives.
Hedging
Balancing an investment by buying or selling another instrument that moves in a similar wayto the original investment, with the result that changes in interest rates etc. have very littleimpact on the value of the portfolio.
High-yield bond
A bond rated BB+, Ba1 or less by the rating agencies. They are also called ‘junk bonds’.
ICMA
See ‘International Capital Market Association’.
Immunization
Immunization is the process by which a bond portfolio is created to have an assured return fora specific time horizon, irrespective of changes in interest rates. If interest rates increase, thenthe return from reinvesting the coupons will increase, but the value of the underlying bondswill decrease, and vice versa. Immunization is the process of equalizing these effects.
Index-linked bonds
Bonds issued by a variety of issuers (e.g. the UK and US Governments) which promise toincrease the coupon payments and the redemption amounts in line with some index. In thecase of UK index-linked gilts, these will rise in line with the Retail Price Index, albeit laggedby three or eight months according to the issue.
Initial margin
The amount of additional collateral that has to be put up in a repo or other transaction to giveprotection to the lender of the money.
JWBK090-APPC JWBK090/Brown March 1, 2006 8:34 Char Count= 0
196 An Introduction to the Bond Markets
Instrument
Used to indicate any type of security, e.g. a bond, an equity or a derivative.
Interest
See ‘Coupon’.
Interest payment date
See ‘Coupon payment date’.
Interest yield
See ‘Current yield’.
International bond
A bond that does not fall into the domestic or foreign bond categories. It frequently has aninternational issuing syndicate.
International Capital Market Association
The International Primary Market Association and the International Secondary Market Asso-ciation merged in July 2005 to form the International Capital Market Association (ICMA). Inaddition, the ICMA includes the European activities of the Bond Market Association, whichhas sponsored the establishment of the European Securitization Forum (ESF) and the EuropeanPrimary Dealers Association (EPDA) and provided advocacy on various issues in the globalcapital markets.
International Primary Market Association
The International Primary Market Association is the trade association that represents the in-terests of the international banks and securities firms that underwrite and distribute equity anddebt securities in the primary market.
International Securities Market Association
The International Securities Market Association is the self-regulatory organization and tradeassociation for the international securities market. The international nature of the market meansthat it is not subject to the same controls as the domestic primary and secondary markets. Sinceconception it has, inter alia, played the role of providing a global framework of industry-drivenrules and recommendations that guide and regulate trading and settlement in the internationalsecurities market.
JWBK090-APPC JWBK090/Brown March 1, 2006 8:34 Char Count= 0
Appendix C: Bond Market Glossary 197
International security
A security governed by ISMA’s Rule 2.2, i.e. international bonds and MTNs in most currencies,global bonds, GDRs and international warrants.
International Swaps and Derivatives Association
The International Swaps and Derivatives Association is the global trade association repre-senting participants in the privately negotiated derivatives industry, a business covering swapsand options across all asset classes (including interest rates, currency, commodity and energy,credit and equity).
In-the-money
For a warrant this means a security where the cost of exercising the option is less than thecurrent price of the exercisable security.
Example C.14
A warrant gives the holder the right to buy security A at 100, and security A has acurrent value of 120. The warrant is said to be in-the-money with an intrinsic value of(120 − 100) = 20.
Intrinsic value
The intrinsic value of an option is the difference between the strike price and the currentunderlying asset price. In other words, it is the value of the option if it were to be exercisedimmediately, assuming that this is possible.
Investment grade bond
A bond that has been rated BBB− or better by the rating agencies.
IPMA
See ‘International Primary Market Association’.
Irredeemable bond
Although strictly incorrect, this term is often used to refer to an ‘undated bond’.
ISDA
See ‘International Swaps and Derivatives Association’.
JWBK090-APPC JWBK090/Brown March 1, 2006 8:34 Char Count= 0
198 An Introduction to the Bond Markets
ISIN
International security identification number. ISINs have been issued for securities quoted onmost stock exchanges (China is an exception). The ISIN code is 12 characters long: the firsttwo characters identify the ISIN code issuer (usually a country code or XS in the case ofinternational issues), followed by a nine character issuer code and a check digit. Its definitionconforms with ISO 6166.
Islamic bond
A bond that has been constructed in such a way that it does not conflict with Shariah principles.In particular, it does not pay a fixed rate of interest.
Example C.15
In January 2005, the Pakistan International Sukuk Company issued a five year floating-ratenote based on these principles, which was designed to yield 220 basis points over a sixmonth dollar LIBOR. Instead of interest, investors will receive regular payments on profitsfrom subsequent approved investments.
ISMA
See ‘International Securities Market Association’.
ISMA Rules
Rules governing how international securities should be traded. These are specified in the ISMAStatutes, By-laws, Rules and Recommendations.
ISO
International Standards Organization.
ISO 4217
The ISO standard that specifies three character currency codes for all the currencies in theworld, e.g. ‘USD’ for US dollars and ‘JPY’ for Japanese yen.
Japanese yield
Usually refers to the ‘simple yield to maturity’ calculation.
JGB
A Japanese Government bond.
JWBK090-APPC JWBK090/Brown March 1, 2006 8:34 Char Count= 0
Appendix C: Bond Market Glossary 199
Junk bond
A bond that has been rated BB+, Ba1 or lower by the rating agencies. They are sometimescalled ‘high-yield bonds’.
Keepwell agreement
A contract between a parent company and one of its subsidiaries to maintain solvency andfinancial backing throughout the term of the agreement.
LBO
Leveraged buyout. In a leveraged buyout, a company is taken over by another company (theleveraged buyout) in such a way that the debt burden is increased with the aim of maximizingthe return to the equity shareholders.
LIBID
London interbank bid rate. This is the rate at which a top quality bank will expect to have toborrow money.
LIBOR
London interbank offer rate. This is the rate at which banks will lend money to other top qualitybanks.
LIBOR fixing
The various LIBOR rates are agreed (‘fixed’) by the British Bankers Association at 11:00 amon each business day. LIBOR rates are fixed for a variety of currencies (e.g. sterling, US dollarsand euros) and for a variety of periods up to one year (e.g. one month, three months or sixmonths).
Life
The life of a bond from the calculation date to its expected maturity date.
LIMEAN
London interbank mean rate. This is the average of the London interbank bid rate (LIBID) andthe offer rate (LIBOR).
Liquidity
A term describing the ease with which one can undertake transactions in a particular securityor market. A market where there are always buyers and sellers at competitive prices is regardedas liquid.
JWBK090-APPC JWBK090/Brown March 1, 2006 8:34 Char Count= 0
200 An Introduction to the Bond Markets
Margin
The amount of excess collateral that has to be put up in a repo or other transaction to giveprotection to the lender of the money.
Market maker
A market maker is someone who makes a market in certain securities. With some securitiesthe market maker has an obligation to continuously make two-way prices. The higher ‘offer’price is the price at which the market maker is prepared to sell the security, and the lower ‘bid’price is that at which the market maker is prepared to buy it.
Mark-to-market
Portfolio managers have a regular requirement to value the assets that they hold. Valuing theirassets against the current market price is called ‘marking to market’. Especially with some lessliquid bonds, it is possible to obtain a mark-to-market price, even when it is not possible to geta dealing price.
Matched book
In the repo market, if a trader has transacted repos and reverse repos in the same securities insuch a way that the net position is flat, then the trader is said to have a matched book.
Matilda bond
A bond issued in Australia in Australian dollars by a non-Australian issuer.
Maturity date
The final date when an instrument will be redeemed.
MBO
Management buy out.
MBS
See ‘Mortgage-backed security’.
Medium-term note
A loan issued as a tranche of a pre-announced program. As a result it can be issued at lessexpense than a public bond issue. It is often distributed directly to a small group of investors.Medium-term notes trade in the same way as bonds.
JWBK090-APPC JWBK090/Brown March 1, 2006 8:34 Char Count= 0
Appendix C: Bond Market Glossary 201
Mezzanine debt
Mezzanine debt or finance is subordinated debt that sits between the senior debt of a companyand its equity capital. It is used by companies as a means of raising capital when they areunable to raise more senior debt and do not want to dilute the equity base more than necessary.In order to make the mezzanine debt more attractive, it may have attached equity warrants.
Modified duration
A measure of the price volatility of a bond. It is defined as the percentage change in price fora unit change in yield.
Example C.16
A bond has a price of 90, a yield of 6 % and a modified duration of 4. If the yield changesto 5 %, then the price will change to approximately:
90 + (6 − 5) × 4 = 94
Money market
The money market usually refers to financial instruments (such as Treasury bills) that areissued with an initial period to maturity of between one day and one year.
Money market yield
A yield that measures the increase in value of the security at maturity but does not allow forthe compound effect of time.
Example C.17
If a security that will be redeemed at 100 including any accrued interest in six months’ timeis priced at 98, the money market yield is:
(100 − 98)/98 × 12/6 = 4/98 = 4.08 %
Mortgage debenture
A loan that is secured on property.
Mortgage-backed security
A type of asset-backed security, which is secured on a basket of mortgages on property.
JWBK090-APPC JWBK090/Brown March 1, 2006 8:34 Char Count= 0
202 An Introduction to the Bond Markets
MTN
See ‘Medium-term note’.
Negative pledge
A commitment not to issue other debt instruments with a higher priority to receive interest andcapital in the case of a default.
Nominal amount/value
The face value or amount of a bond, i.e. the amount of capital a holder receives when the bondis redeemed at par.
Nominal amount/value (uplifted)
The face value or amount of an index-linked bond that has been increased (uplifted) by therelevant index since the issue of the bond.
Note
A term that is often interchangeable with bond, e.g. a floating-rate note. Fixed-rate notesfrequently have an original maturity of less than five years; e.g. US Treasury notes are issuedwith an original life of not more than five years, whereas Treasury bonds have a life of morethan five years at issue.
OAT
Obligations Assimilables du Tresor. French Government bonds that have been issued with aninitial life to maturity of more than five years.
Odd lots
An amount of securities that is not a multiple of some minimum amount; i.e. it is not a roundlot.
Offer price
The price at which a market maker will sell a security to an investor. It is also known as an‘ask price’.
OLO
Obligations Lineaires – Lineaire Obligaties. OLOs are medium- or long-term dematerializedlinear bonds issued by the Belgium Government.
JWBK090-APPC JWBK090/Brown March 1, 2006 8:34 Char Count= 0
Appendix C: Bond Market Glossary 203
On-the-run
The most liquid securities in a market; e.g. in the US Treasury market this refers to the latest,and usually most liquid, 1, 2, 3, 5, 10 and 30 year bonds. The opposite of ‘on-the-run’ is‘off-the-run’.
Opening leg
The first half of a repo transaction.
Option
The right to buy securities at a predetermined price at a date in the future.
Option free bond
See ‘Bullet bond’.
Ordinary shares
The ordinary shareholders of a corporation own the assets of the company after all debts andprior commitments have been met. Ordinary shares are also called ‘equity shares’ or ‘commonstock’.
OTC
See ‘Over-the-counter’.
Out-of-the-money
For a warrant, this means a security where the cost of exercising the option is more than thecurrent price of the exercisable security. In other words, the option has no intrinsic value.
Over-the-counter
A trade that is not conducted on a stock exchange; e.g. most international securities are tradedunder ISMA Rules over the telephone and so are traded ‘over-the-counter’.
Par value
The nominal value of a bond or loan. The majority of bonds are redeemed at par (normally100). However, there is often a premium if they are called by the issuer at an earlier date
Permanent interest bearing shares
A type of preference share, issued in sterling by UK building societies. Their advantage is thatthe interest payments are tax deductible for the building society.
JWBK090-APPC JWBK090/Brown March 1, 2006 8:34 Char Count= 0
204 An Introduction to the Bond Markets
Perpetual bond
See ‘Undated bond’.
Pfandbrief
A type of bond originally issued by German mortgage banks that is collateralized by long-termassets. These types of bonds represent the largest segment of the German private debt marketand are considered to be very safe debt instruments. Instruments that are often referred to as‘covered bonds’ and behave very similarly to Pfandbrief have now been issued by companiesin a number of European countries.
The term Jumbo Pfandbrief is used to refer to the larger, more liquid segment of the Pfand-brief market. Such bonds need to have a nominal value of at least €500 million, and at launch atleast three market makers who are committed to providing two-way prices throughout normalmarket hours.
PIBS
See ‘Permanent interest bearing shares’.
Pik loan notes or bonds
Pik (payment-in-kind) loan notes or bonds pay interest in the form of more loans or obligations,instead of actual interest. They tend to be deeply subordinated debt and as a result in the eventof a default lead to large losses. The deals generally have the option for the issuer to redeem thedebt early with typically a reduced rate of interest. Michael Glazer’s takeover of ManchesterUnited is believed to have involved the use of Pik loans.
Preference shares
Shares, issued by companies, that receive dividends and any return of capital after tax, butbefore the ordinary shares.
Preferred shares
Usually the same as ‘preference shares’.
Price spread
The difference between the bid and offered prices for the security.
Primary market
The primary market refers to the issuance and placing of new securities or new tranches ofexisting securities. It does not refer to the trading of securities after issuance.
Principal
The nominal amount or value of a bond.
JWBK090-APPC JWBK090/Brown March 1, 2006 8:34 Char Count= 0
Appendix C: Bond Market Glossary 205
Purchase fund
An issuer of a bond with a purchase fund may use it to repurchase some of the bonds early inthe market place. There is usually a restriction on the price that can be paid to repurchase thebonds. A purchase fund may in certain circumstances enable the issuer to stabilize the priceof the bonds in the market.
Put
The ability of the holder of a bond to ask for early redemption on specific dates.
Rating
A measure of the ability of the issuer to pay the coupons and repay the capital. A numberof companies rate bond issues, of which Moody, Standard & Poor and Fitch are the largestinternational players. The highest rating that a bond can get is AAA or Aaa. This is awardedto bonds issued by issuers such as the French Treasury or the World Bank. The rating agenciesalso rate issuers for short-term money market instruments.
Real yield
The yield on an instrument after allowing for inflation.
Example C.18
If a security has a yield of 5.00 % when inflation is 3.00 % per annum, then it is said to havea real yield of 2.00 %.
Redemption date
The final date at which a bond will be redeemed. If a bond is redeemed in several tranches,this refers to the last date. Note that a bond may often be redeemed prior to the redemptiondate, e.g. if it has a call option.
Redemption value
The amount the issuer will repay when a bond is redeemed. Although in most non-indexedissues this is normally par (the nominal value), bonds are often redeemed at a premium if theyare redeemed early.
Redemption yield
A measure of the return that an investor will get if the security is held to maturity from thecoupons received and any capital gain/loss at redemption.
Registered security
A security where ownership is determined by whose name is on the central register, and notby who holds the certificate. See ‘Bearer bonds’.
JWBK090-APPC JWBK090/Brown March 1, 2006 8:34 Char Count= 0
206 An Introduction to the Bond Markets
Registrar
An organization that keeps and maintains a record of all the holders of the security. By definition,bearer securities do not have a registrar.
Repo
An agreement to sell a security and buy it back at a later date. It is effectively a secured loan.
Retail price index
A UK measure of retail price inflation. UK index-linked gilt-edged securities use this index toadjust the interest and redemption payments.
Reverse repo
An agreement to buy a security and sell it back later, usually at a profit. It is the opposite of arepo.
Risk-free investment
There is no such thing as a totally risk-free investment. However, the term often refers todomestic government issues, denominated in the currency of the country, where the governmenthas the possibility of just printing more, albeit possibly devalued, bonds.
Round lots
A quantity of securities that is a multiple of some minimum amount. In the US equity market,this is considered to be a multiple of 100 shares, whereas in the eurodollar bond market it isconsidered to be a nominal value of $100 000.
RPI
See ‘Retail price index’.
Running yield
See ‘Current yield’.
Samurai bond
A Japanese yen bond issued in Japan by a non-Japanese issuer (e.g. in February 2005 Fordsold JPY 160 billion ($1.5 billion) of three year Samurai bonds to Japanese investors).
Secondary market
The market for trading an instrument after the initial offering. The initial offering is called the‘primary market’.
JWBK090-APPC JWBK090/Brown March 1, 2006 8:34 Char Count= 0
Appendix C: Bond Market Glossary 207
Secured bond
A bond where the interest and capital repayments are secured on a portfolio of assets or a specificasset. If the issuer of the bond defaults in any way, the bond holders can take possession of theassets.
Sell/buy-back
An agreement to sell a security and buy it back at a later date. It is similar to a repo, but usesdifferent legal documentation and involves the ownership of the securities being transferred tothe other party.
Settlement date
The date on which the monies and the securities change hands. It is usually one or morebusiness days after the transaction date.
Shares
See ‘Ordinary shares’.
Simple margin
With a floating-rate note, the simple margin measures the return that can be obtained on thefloating-rate note taking into account both the quoted margin and the capital gain or loss overthe life of the note.
Sinking fund
A sinking fund is an amount of money used by the issuer of a bond to redeem part of theissue before the final redemption date. The bonds to be redeemed may be chosen by lot or aproportion of each holding is redeemed each time. Sometimes the issuer may buy back bondsin the market if it is cheaper than redeeming them.
Example C.19
A 6 % bond which is being redeemed in 10 years’ time has a sinking fund that commits theissuer to redeem 10 % after eight years and a further 10 % after nine years. The selection isperformed equally for all holders by reducing the principal of the bond held by 10 % aftereight years, and then by a further 10 % of the original principal one year later. The bondpays coupons annually and is redeemed at par.
Thus a holder of 1 000 000 of the bond would receive:
After 1 year, interest of 60 000. . . . . . . . . . . . . . . . . . . . . . . . . . . . . . . . .After 7 years, interest of 60 000
JWBK090-APPC JWBK090/Brown March 1, 2006 8:34 Char Count= 0
208 An Introduction to the Bond Markets
After 8 years, interest of 60 000 and a capital repayment of 100 000After 9 years, interest of 54 000 and a capital repayment of 100 000After 10 years, interest of 48 000 and a capital repayment of 800 000
Special collateral
In the repo markets, the cost of borrowing collateral of a certain type is frequently the same.However, if it is required to borrow a specific security that is in demand, the cost may have alower repo rate. Such a bond is said to be ‘tight’ or ‘special’.
Spens clause
A clause used in many sterling corporate bond issues, which defines the terms under whichthe issuer may redeem the issue early. The term allows the borrower to redeem (call) its bondsat a price that gives the same redemption yield as its reference UK gilt-edged issue.
In practice, the Spens-call clause is rarely exercised as it is prohibitively expensive forborrowers, especially for long-dated issues, as the corporate bond would usually trade at ayield premium to the relevant gilt.
Spot rate
An interest rate for an investment from today until the agreed maturity, without any interveningpayments.
Spread
See ‘Price spread’ and ‘Yield spread’.
Spread quotation
When a security is quoted as a spread over the yield of a benchmark security, the yield spreadis usually quoted in basis points. For example, if a security is quoted with a spread of 55 basispoints and the benchmark has a yield of 4.1 %, it will be priced to yield 4.65 %.
Stock
The term ‘stock’, especially in the US, usually refers to the ordinary shares of a company.However, the Bank of England has used ‘stock’ to refer to UK gilt-edged securities, e.g. 3 1
2 %War Stock.
Stock borrowing
Institutional borrowers such as insurance companies and pension funds sometimes prefer tolend out their holdings for a fee instead of becoming involved in a repo agreement. Sucharrangements are called ‘stock borrowing’ or ‘stock lending’.
JWBK090-APPC JWBK090/Brown March 1, 2006 8:34 Char Count= 0
Appendix C: Bond Market Glossary 209
Strike price
The price at which at an option may be exercised.
Strips
Investors would sometimes like to have a zero-coupon bond maturing on a specified date, whichhas been issued and guaranteed by a certain issuer. Unfortunately, government and other issuersdo not tend to issue a range of zero-coupon bonds. To remedy this situation, in some markets,such as the UK gilt-edged market, arrangements have been made to disaggregate all the futurecoupon payments and the final redemption amount of some conventional fixed-rate bonds intoseparate securities. These are called ‘strips’.
Sukuk
An Islamic bond.
T + n
Refers to a transaction being settled n business days after the transaction date (T ).
Example C.20
For example, if a trade is agreed on Wednesday 10 January 2005 for settlement on T + 1,then the settlement date will be Thursday 11 January 2005. On the other hand, if the tradeis agreed on Wednesday 12 January 2005 for settlement on T + 3, then the settlement datewill be Monday 17 January 2005.
Some of the major government bond markets (e.g. US Treasury market and the UK gilt-edgedmarket) usually trade on T + 1, whereas the Eurobond market usually trades on T + 3. It isnormally possible to agree to a different settlement, although there may be a price penalty.
T-Bill
See ‘Treasury bill’.
Tap issue
Another name for a new tranche of an existing security.
TARGET
‘Trans-European Automated Real-time Gross settlement Express Transfer system’.TARGET is the real-time gross payment system for the eurozone. It consists of the national
payment systems and the European Central Bank.
JWBK090-APPC JWBK090/Brown March 1, 2006 8:34 Char Count= 0
210 An Introduction to the Bond Markets
TBMA
See the ‘Bond Market Association’.
Trade date
The date on which a transaction is agreed. This is usually one or more business days beforethe settlement date, when the transaction is concluded.
Tranche
An issuer may issue bonds with the same security and coupon and maturity terms on twoor more dates. The bonds issued on a specific date are referred to as a ‘tranche’. Sometimesnew tranches are immediately fungible (i.e. interchangeable) with previous tranches. However,sometimes a new tranche will have a different first interest payment, and as a result it will notbecome fungible until after this payment.
Treasury bill
A short term money market instrument. Treasury bills have been issued by a number ofgovernments (e.g. United States, Canada, United Kingdom and even Kenya). They are usuallyissued for periods of one month, three months, six months or one year.
It is conventional for bills not to pay a coupon, but be issued at a discount to their redemptionvalue.
Treasury bond
In the US market a government debt security, which was originally issued with a life to maturityof at least 10 years. Other governments also issue ‘Treasury Bonds’, where the original life tomaturity may be different.
Treasury gilt
In the UK market, a UK Government gilt-edged security originally issued on or after 1 April2005. This means that all 8-month lag index-linked bonds are called ‘Treasury Stock’ and all3-month lag index-linked bonds are called ‘Treasury Gilt’.
The first Treasury gilt to be issued was 4 14 % Treasury Gilt 7/12/2055 on 26 May 2005.
Treasury note
In the US market, a US Government debt security that was originally issued with a life tomaturity of less than 10 years.
Treasury stock
In the UK market, all UK Government gilt-edged bonds originally issued before 1 April 2005.
JWBK090-APPC JWBK090/Brown March 1, 2006 8:34 Char Count= 0
Appendix C: Bond Market Glossary 211
Undated bond
A bond without a specified final redemption date. Such bonds usually contain call and/or putoptions, which can be exercised in certain circumstances.
Example C.21
The UK Government has had the right to redeem its 3 12 % War Loan Stock at par at any
time since 1952. However, during this period there have been very few times when it wouldhave made sense for the government to exercise this option, as the bond has normally beenpriced in the market at a significant discount to par. Hence, if the government had redeemedit, it would have cost it more money to refinance the debt.
Undated bonds are also referred to as ‘irredeemable’ or ‘perpetual bonds’.
Unsecured loan stock
A bond that is not secured on any specific asset. In the event of a default it is treated as a normalcreditor.
Value date
The date to which the details of a transaction refer. This is usually the same as the settlementdate.
Vanilla straight bond
A ‘bullet’ or ‘option-free’ bond.
Variation margin
During the life of a repo transaction, if the value of the collateral changes significantly, eitherup or down, then the agreement may specify that the amount of collateral should be changedto equate with the cash part of the transaction. This is called ‘variation margin’.
Volatility
For a bond this is the same as ‘modified duration’. However, it is not as well defined for anequity issue, where it is just an indication of how variable its price movement has been.
Warrant
A right, but not an obligation, to buy or sell an instrument at a predetermined price during aspecified time period.
JWBK090-APPC JWBK090/Brown March 1, 2006 8:34 Char Count= 0
212 An Introduction to the Bond Markets
When-issued trading
See ‘Grey market’.
Withholding tax
A tax on coupon payments, which is deducted at source.
Writer
A party who receives the option premium in exchange for the risk of the option being exercisedagainst him.
XD
See ‘Ex-dividend’.
Yankee bond
A US dollar bond issued in the United States by a non-American issuer.
Yield
A measure of the return an investor will get on a security. The markets use a variety ofcalculations. These include: current yield, dividend yield, money market yield and redemptionyield. For a bond, if the type of yield has not been specified, it normally means the redemptionyield.
Yield compounding frequency
The redemption yield of a bond differs according to its compounding frequency. In the UKGovernment and US markets the compounding frequency is every 6 months, as the majority ofbonds pay coupons every 6 months. Similarly, in the euro market it is paid annually as bondstend to pay just one coupon a year.
It is very easy to convert a yield that has been calculated on an annual basis to a semi-annualbasis and vice versa.
Yield Gap
The difference between the redemption yield on government fixed interest securities and thaton equities. In the sterling market, the average yield on long-term gilt-edged securities is used.Although government securities are regarded as safer investments than equities, the yield gapis usually positive as the market expects the dividends on equity shares to grow.
JWBK090-APPC JWBK090/Brown March 1, 2006 8:34 Char Count= 0
Appendix C: Bond Market Glossary 213
Yield spread
Sometimes the price of a security is quoted as the spread over the yield of a specified benchmarksecurity. The spread is usually quoted in basis points. For example, if a security is quoted witha spread 55 bps and the benchmark has a yield of 4.1 %, it will be priced to yield 4.65 %.
Yield to call
The redemption yield of a bond to its call date. Some bonds are callable on a variety of dates,often with different call values. Hence, there can be more than one yield to call. If not specified,this is usually the yield to the earliest call date.
Yield to maturity
This is the redemption yield of a bond if it is held to maturity (the redemption date). However,it should be noted that the assumption about the expected redemption date can change overtime.
Yield to put
The redemption yield of a bond to the, normally first, putable date, i.e. the first date at whichthe holder can demand that the bond is redeemed.
Yield to worst
The redemption yield of a bond, from the holder’s point of view, to the worst of the calland maturity dates, i.e. the yield that is the lesser of the yields to call and maturity. In somecircumstances this calculation is useful as it is assumed that the issuer will behave in a waythat minimizes costs.
YTM
See ‘Yield to maturity’.
Zero-coupon bond
A bond that only pays out at maturity; i.e. it does not pay any dividends or coupons. In orderto give an investor a return, such bonds are issued at a discount to their redemption value.Sometimes this discount can be very large, especially if the bond is not going to be redeemedfor 20 or more years.

JWBK090-APPC JWBK090/Brown March 1, 2006 8:34 Char Count= 0
214
JWBK090-REF JWBK090/Brown March 1, 2006 8:34 Char Count= 0
References
Braudel, Fernand (1982), Civilization and Capitalism 15th–18th Century, The Wheels of Commerce,William Collins Sons and Company Ltd; translated from French edition, Les Jeux de ’Echange,Libraire Armand Colin, Paris, 1979.
Brown, Patrick (1998), Bond Markets: Structures and Yield Calculations, GDP in association with In-ternational Securities Market Association.
Brown, Patrick (2002), Constructing and Calculating Bond Indices, 2nd edition, GDP.United Kingdom Debt Management Office (2005), Formulae for Calculating Gilt Prices from Yields, 3rd
edition, 16 March 2005.
215

JWBK090-REF JWBK090/Brown March 1, 2006 8:34 Char Count= 0
216
JWBK090-IND JWBK090/Brown March 3, 2006 14:0 Char Count= 0
Index
3G mobile phones 7530/360 day-count convention 32–4, 156–7, 177,
18730E/360 day-count convention 32–4, 156–7, 187
ABSs see asset-backed securitiesaccrued interest
concepts 20–1, 32–65, 135–7, 155–8, 177mathematical formulae 155–8
actual prices 35actual/360 convention 33–4actual/365 convention 33–4actual/actual convention 33–4AER see annual equivalent rateagencies, credit ratings 5–6, 29–30, 65, 75,
115–21, 152agreements, repos 97–8, 100–3Allied Domecq 116–17alpha evaluations 52–3American options 107–13, 178annual equivalent rate (AER) 46–8annual percentage rate (APR) 46–8, 178annuities
website 153–4concepts 15–16, 166–7, 178mathematical formulae 166–7
appendices 153–213APR see annual percentage ratearbitrage 178asset swaps 123, 130asset-backed securities (ABSs)
see also securitizationconcepts 74, 147, 178–9indices 147
at-the-money options 111–12, 179auctions 179Australia 6, 9–10, 35average life 149–50, 179
backwardation 179balance sheets 7Bank of England 1, 97, 100–1Bank for International Settlements (BIS) 123bank loans 1Bank of Scotland 6–7bankers’ acceptances 64–5, 170–1, 180
see also money marketsbanks, repos 95–105, 182, 184barbell 180basis points 138–9, 180basis risk 180basis swaps 123, 132bearer bonds 180benchmarks 120–1, 147–52beta evaluations 52–4, 181bid-offer spreads 36–9, 181BIS see Bank for International SettlementsBMA see Bond Market AssociationBOBL 181Bond Market Association (BMA) 95–6, 100bonds
see also coupon; individual typescomplex structures 120concepts 1–8, 9–26, 27–65, 120–1conditional coupon changes 75–6convertible bonds 4–5, 65, 69–73, 169–70, 185convexity 45, 56–65, 68, 144–6, 149, 164–5,
185currency of issue 2, 24–5, 31, 73, 120–1,
147–52, 193definition 1derivatives 1–2, 3–6, 30, 48–50, 65–78,
107–14, 123–39, 178, 188, 191, 203description 1–7, 147–52embedded options 1–2, 4–6, 9, 27, 30, 42,
48–50, 65–78equity contrasts 1, 7–8, 148–9
217
JWBK090-IND JWBK090/Brown March 3, 2006 14:0 Char Count= 0
218 Index
bonds (Continued )guarantees 5–6indices 63–4, 147–52issuers 1–8, 29–30, 120–1, 147–52Macaulay duration 30, 45, 50–65, 144–5, 149,
162–3, 173–5, 190maturity dates 1–8, 16, 147–8, 200modified duration 45, 53–65, 144–5, 149,
163–4, 174–5, 201parties 1–8, 120–1performance measures 144–52portfolios 31, 52–3, 141–6, 174–5price unavailability 151–2prices 6–7, 29–40, 42–52, 101, 155–8, 188pricing 36–65, 68–9, 115profile examples 6–7quotes 6–7, 29–30, 32–6redemption yield 39–65, 68, 81–94, 117,
141–4, 149–50, 159–62, 168–9, 174–5, 205sinking funds 13–14, 65, 207tax 4, 26, 70, 145–6types 1, 2, 9–26, 30valuations 27–65, 115warrants 5, 78, 171–2, 211yield types 29, 39–65, 212
Brady bonds 181–2break-even prices 70–3bubble (humped) yield curves 79–82, 87–8bullet (straight-coupon) bonds 9–10, 41–2, 49–50,
109–10, 182Bunds 182butterfly see barbellbuy/sell backs 182, 207buying
call options 107–8put options 108–9
call options 3–4, 16–17, 30, 42, 48, 65–9, 107–13,182
see also optionsbuying 107–8concepts 107–13long call positions 107–8short call positions 108–9writing 108–9
call spread options 112–13callable bonds, concepts 5, 65–9Canada 7, 9–10, 20, 79capital depreciation 90capital gains 40–1, 145–6caps, FRNs 18–19car loan debt 74–5cash flows
dispersion 58–65, 165–6future cash flows 27–65, 144–5
CBOT see Chicago Board of Trade
website 153–4CDOs see collateralized debt obligationsCDs see certificates of depositCDSs see credit default swapsCedel 95certificates of deposit (CDs)
concepts 22–3, 171–4, 184yields 22–3, 171
Chicago Board of Trade (CBOT) 134–7Chicago Mercantile Exchange (CME) 134Citigroup 97classic moves, yield curves 93–4classic repos 95–6, 100–5
see also reposclassifications, indices 147–8clean prices 32–4, 35–40, 43–4, 155–8clearing houses, futures 135–7Clearstream 95, 97CME see Chicago Mercantile Exchangecollateral, repos 99–100, 101–4collateralized debt obligations (CDOs) 74–5, 184collateralized mortgage obligations 65, 184combinations, options 112–13commercial paper 23–4, 64–5, 170–1, 184
see also money marketscommodities, futures 133–4common stock
see also equitiesconcepts 1
complex structures, bonds 120compound interest
concepts 27–9, 85–6, 159–62, 172–4, 184–5frequency adjustments 28, 30, 172–4, 212mathematical formulae 159–62, 172–4
continuity needs, indices 150–2conversion factors, futures 135–7convertible bonds
concepts 4–5, 65, 69–73, 169–70, 185mathematical formulae 169–70premiums 4–5, 70–3, 169–70, 185
convexitysee also Macaulay durationconcepts 45, 56–65, 68, 144–6, 149, 164–5, 185mathematical formulae 164–5pricing effects 56–7, 68
corporate bondssee also bondsconcepts 2–8, 29–31, 79, 147–52equity contrasts 7–8, 148–9indices 147
‘corridor’ issues 18–19counterparty risk 183, 185
see also credit riskcoupons
see also bondsaccrued interest 32–65, 155–8
JWBK090-IND JWBK090/Brown March 3, 2006 14:0 Char Count= 0
Index 219
concepts 1–8, 9–65, 75–6, 149–52, 155–8, 185conditional coupon changes 75–6frequency 2–3, 9–10, 28, 30, 42indices 149–52modified duration 55–6step-up bonds 14–15types 30
covenants, concepts 116–17covered bonds 186credit card debt 74–5credit default swaps (CDSs) 123, 137–9, 186
concepts 137–9definition 137parties 137–8pricing 138–9
credit derivatives 123, 137–9, 186credit ratings 5–6, 29–30, 65, 75–6, 115–21,
147–8, 152, 178–9, 205agencies 5–6, 29–30, 65, 75, 115–21, 152concepts 115–21, 147–8, 152downgrades 152indices 152
credit risk 52–3, 100–1, 115–21, 133, 137–9, 183,185, 187–8
concepts 115–21, 133covenants 116–17swaps 133
cross-currency swaps 123, 130–2cum-dividend 186cumulative preference shares 25–6, 186currency of issue 2, 24–5, 31, 73, 120–1, 147–52,
193current yield
concepts 39–43, 158, 187mathematical formulae 158
day-count conventions 32–4, 156–7, 177, 187debentures 4, 187Debt Management Office 22, 152default risk 100–1, 137–9, 187–8
see also credit riskdelivery 188delivery versus payment (DVP) 95demand and supply factors, yield curves 92–3dematerialisation 188Denmark 116denomination 35, 148–9derivatives 1–2, 3–6, 30, 48–50, 65–78, 107–13,
123–9, 178, 188, 191, 203see also futures; options; swapsconcepts 123–9types 123uses 123
description, bonds 1–7, 147–52dirty prices 32–4, 35–9, 42–52, 101, 155–8,
188
discounted marginconcepts 59–63, 167–9, 189mathematical formulae 167–9
discountswebsite 153–4concepts 22–3, 27, 29–65, 170–1, 189mathematical formulae 170–1money markets 64–5
dispersioncash flows 58–65, 165–6concepts 58–65, 165–6, 189mathematical formulae 165–6
dividends 7–8, 25–6, 189yields 189
dropped bonds, index problems 151–2dual currency bonds 73, 190duration see Macaulay durationDVP see delivery versus payment
EDSP see exchange delivery settlement priceelectronic settlement 95–9embedded options 1–2, 4–6, 9, 27, 30, 42, 48–50,
65–78EONIA 97equities 1, 148, 169–70, 185, 203
bond contrasts 1, 7–8, 148–9convertible bonds 4–5, 65, 69–3, 169–70, 185indices 148–9
EUREX 134–7EURIBOR see Euro Interbank Offer RateEuro Interbank Offer Rate (EURIBOR) 16–17,
127–9, 191, 192Eurobonds 31–2, 65–6, 191Euroclear 95, 97Euronext.Liffe 134–5European Currency Unit 2European Investment Bank 6, 29, 76–7, 79, 147European markets 97–100, 117, 134–6, 156–7European options 107–14, 191European repos 97–100euros 125–39ex-coupon bonds (XD) 32–4, 37–9, 155–6, 191–2ex-dividends 192, 212exchange delivery settlement price (EDSP)
135–6exchange-traded transactions 29–30, 134–7exchangeable notes/bonds 72–3
see also convertible bondsexercise, options 107–8, 111–13exercise prices 70–3, 78, 107–13, 192expected life 48–65, 149–50expiry date, options 107–13
falling yield curves 79–82Fannie Mae 192Fitch 115–21
JWBK090-IND JWBK090/Brown March 3, 2006 14:0 Char Count= 0
220 Index
fixed-rate bondssee also bondsconcepts 2–3, 9–16, 30, 33–4, 45, 54–65, 123–4types 9–16, 22
fixed/floating bonds 22flat yield see current yieldflat yield curves 79–82, 87–8floating-rate notes (FRNs)
caps 18–19website 153–4concepts 1–3, 6–7, 10, 16–19, 30, 34, 59–62,
76–7, 123–4, 144, 160–2, 167–8, 192–3examples 17–19floors 18–19margin 59–62, 167payment dates 10, 16–19redemption yield 59–62, 160–2restrictions 18reverse floaters 76–7
floors, FRNs 18–19Ford 152foreign bonds 2, 193forward-forward (forward) yield curves
concepts 84–9zero-coupon yield curves 85–8
forward-rate agreements (FRAs) 123, 132–4, 154website 154concepts 123, 132–4
forwards 193France 6–7, 9–10, 12, 20, 35, 55, 79FRAs see forward-rate agreementsFreddie Mac 193frequency
compound interest adjustments 28, 30, 172–4,212
coupons 2–3, 9–10, 28, 30, 42FRNs see floating-rate notesFTSE 63–4, 148, 152
100 148250 148350 148All-share 148index calculations 152UK Gilts Indices 63–4
fund managers 11, 141–6future cash flows 27–65, 144–5futures 123, 133–7, 188, 193
clearing houses 135–7concepts 133–7definition 133parties 134–6
Garban-ICAP 128GC see general collateralgeneral collateral (GC), repos 101–2General Electric Capital 79
General Motors 152Germany 1, 33–4, 79, 135gilts 11–13, 29–31, 35–9, 63–4, 79–82, 115,
118–21, 136, 152, 194see also government bonds
Ginnie Mae 194global bonds 194Global Master Repo Agreement (GMRA) 97,
100–1glossary 177–213GMAC 139GMRA see Global Master Repo Agreementgovernment bonds 1, 5, 7, 9–22, 29–31, 33–9,
63–4, 67–9, 79–82, 92–4, 99–2, 115–21,136, 147–52
see also bonds; giltsgraduated-rate bonds see step-up bondsGreece 20grey markets 194guarantees 5–6
haircut 195hedging 195high-yield ( junk) bonds 195, 199holding period returns, portfolios 141–3horizon dates
website 154concepts 141–3
hybrid bonds, concepts 22
ICMA see International Capital MarketAssociation
immunization programmes, portfolios 143–4in-the-money options 111–12, 197index-linked bonds
concepts 2, 7, 19–22, 30, 34–6, 39, 62–5,160–2, 168–9, 195
redemption yield 39, 62–5, 160–2, 168–9indexation lags 21–2, 35–6, 168–9indexation techniques 20–2, 160–1, 168–9indices
bonds 63–4, 147–52classifications 147–8concepts 147–52constituent changes 150–2continuity needs 150–2data calculations 149–50dropped bonds 151–2equities 148–9maturity subdivisions 147–8problems 150–2production difficulties 148ratings downgrades 152selection 148–9subindex calculation gaps 151types 147
JWBK090-IND JWBK090/Brown March 3, 2006 14:0 Char Count= 0
Index 221
inflation 19–22, 62–5, 160–1, 168–9initial margin 100–1, 135–7, 195institutional investors 31, 35, 92–4, 104–5, 143–4,
149insurance companies 31, 143–4, 149interbank interest rates 3, 6, 16–19, 60–1, 76–7,
125–39, 191, 192, 199interest payments
see also couponbonds 1–2
interest rate risksee also convexityconcepts 56–65
interest rate swaps, concepts 123–33interest rates
concepts 30, 123–33expectations 30interbank interest rates 3, 6, 16–19, 60–1, 76–7,
125–39, 191, 192, 199interest yield see current yieldinternal rate of return 144–5international bonds 29–30, 196International Capital Market Association (ICMA)
95, 98–9International Securities Association (ISMA) 97,
100–1International Swaps and Derivatives Association
(ISDA) 128intrinsic value 78, 109–12, 197investment strategies, yield curve changes
89–94investment vehicles 2, 7investors, bonds 1–8irredeemable (undated) bonds 3, 11, 19, 52–4ISDA see International Swaps and Derivatives
AssociationISDAFIX 128ISIN 198Islamic bonds 198ISMA see International Securities AssociationISO 198issuers
bonds 1–8, 29–30, 120–21, 147–52types 1, 2, 29–30, 147
Italy 9, 17, 20, 79
Japan 2, 9, 20, 31, 32–3, 40–1, 78, 79, 156, 198Japanese yield see simple yield to maturityJP Morgan Chase 97junk bonds 195, 199
LIBID 199LIBOR see London Interbank Offer Ratelife to maturity, concepts 48–65, 79–82, 149–50LIFFE 128, 134–5liquidations 8
liquidity 31, 115–21, 199concepts 119–21determinants 120–1market risk 119–21
loansbooks 74–5concepts 1–2, 7–8seniority 7–8
local authorities 2, 7London Interbank Offer Rate (LIBOR) 6, 16–19,
60–1, 76–7, 125–39, 192, 199long call positions 107–8long put positions 108–9Luxembourg Stock Exchange 29
Macaulay durationsee also convexitywebsite 154concepts 30, 45, 50–65, 144–5, 149, 162–3,
173–5, 190mathematical formulae 162–3, 173–5portfolios 144–5, 175
margins 59–63, 100–3, 135–7, 167, 200mark-to-market valuations 100–1, 200market makers 36–8, 104–5, 120–1, 200market risk, liquidity 119–20mathematical formulae 155–73maturity dates 1–8, 16, 147–8, 200MBSs see mortgage-backed securitiesmedium-term notes (MTNs) 24–5, 200
concepts 24–5mezzanine debt 8, 201modern portfolio theory 52–3modified duration
website 154concepts 45, 53–65, 144–5, 149, 163–4, 174–5,
201coupon rates 55–6mathematical formulae 163–4, 174–5portfolios 144–5, 175
money marketssee also bankers acceptances; commercial
paper; Treasury billsCDs 22–3, 171–2concepts 9, 22–6, 34–6, 64–5, 148, 170–1, 201discounts 64–5yields 64–5, 171, 201
Moody 75, 115–21mortgage-backed securities (MBSs)
see also securitizationconcepts 7, 48, 73–5, 201
mortgages 1, 5, 7, 48, 73–5, 184, 201MTNs see medium-term notes
National Savings 14–15negative pledge clauses 29–30, 117
JWBK090-IND JWBK090/Brown March 3, 2006 14:0 Char Count= 0
222 Index
Netherlands 65–6New York Stock Exchange (NYSE) 95nominal value
see also principleconcepts 2–8, 34–6, 202redemption amount 3
non-cumulative preference shares 25–6normal yield curves 79–82notes
see also floating-rate notesconcepts 1–2, 16–19, 210
NYSE see New York Stock Exchange
OECD 147offer prices 202options 1–2, 3–6, 30, 48–50, 65–78, 107–13, 178,
188, 191, 203see also call . . . ; put . . .American options 107–13, 178calculations 107–13combinations 112–13concepts 1–6, 9, 27, 30, 42, 65–78, 107–13definition 107embedded options 1–2, 4–6, 9, 27, 30, 42,
48–50, 65–78European options 107–13, 191exercise 107–8, 111–13expiry date 107–13parties 107–13premiums 107–13pricing 109–12straddles 112–13strike prices 107–13, 209time value 111–12types 107–13valuations 109–12warrants 5, 78, 171–2, 211
ordinary shares 1, 7–8, 65, 203see also equities
OTC see over-the-counter transactionsout-of-the-money options 111–12, 203over-the-counter transactions (OTC) 123–5, 134,
203concepts 123–5, 134, 145–6, 203tax 145–6
par value see nominal valuepar yield curves
calculation 86–7concepts 86–9
pension funds 31, 92–4, 104–5, 143–4, 149performance measures, portfolios 144–52permanent interest bearing shares (PIBS) 3, 26,
203concepts 26tax 26
Pernod Ricard 116perpetual bonds 6–7, 9–10, 11, 19
see also undated (irredeemable) bondsPfandbriefe 147, 204PIBS see permanent interest bearing sharesportfolio theory 52–3portfolios
website 154concepts 31, 52–3, 141–6, 174–5duration measures 144–5, 175holding period returns 141–3immunization programmes 143–4Macaulay duration 144–7, 175management considerations 141–6mathematical formulae 174–5measures 144–52modified duration 144–5, 175performance measures 144–52redemption yield (PRY) 145yields 141–6, 174–5
preference shares 7–8, 25–6, 186, 204see also equitiesconcepts 25–6types 25–6
premiumsconvertible bonds 4–5, 70–3, 169–70,
185options 107–13
price progression 46–8price spreads see bid-offer spreadsprice unavailability, index problems 151–2pricing
bonds 36–65, 68–9, 115CDSs 138–9convexity effects 56–7, 68–9options 109–12
primary markets 204principle, bonds 2–8profit and loss accounts 7–8programs, website 153–4prospectuses 29–30protective put options 113proxy indices 149put options 4–5, 49, 65–9, 107–13, 205, 213
see also optionsbuying 108–9concepts 107–13long put positions 108–9writing 109
quarterly coupons 28quotes, bonds 6–7, 29–30, 32–6
real redemption yieldconcepts 39, 62–5, 168–9mathematical formulae 168–9
JWBK090-IND JWBK090/Brown March 3, 2006 14:0 Char Count= 0
Index 223
redemption amountconcepts 2–8, 10, 42–52, 90–1nominal value 3
redemption date 2, 42–52, 205redemption yield
see also yield to maturityconcepts 39–65, 68, 81–94, 117, 141–4,
149–50, 159–62, 168–9, 174–5, 205index-linked bonds 39, 62–5, 160–2, 168–9mathematical formulae 159–62portfolios 145
registered securities 1–2, 205–6registrar 206reinvestment rates 141–2repos 95–105, 123, 182, 184
agreements 97–8, 100–3classic repos 95–6, 100–5collateral 99–100, 101–4concepts 95–105, 123definition 95historical background 95parties 95–7, 101–2sell/buy backs 95, 97, 103–4, 182, 207statistics 95stock borrowing/lending 95–6, 104–5types 95
repurchase agreements see reposRetail Price Index (RPI) 3, 20–2, 62–5, 168–9,
206retained earnings 7–8returns
holding period returns 141–3internal rate of return 144–5performance measures 144–52risk 8
Reuters 128reverse floaters, concepts 76–7reverse repos 182, 206rising yield curves 79–82risk
credit risk 52–3, 100–1, 115–21, 133, 137–9,183, 185, 187–8
returns 8risk-free investments 30–1, 111–12, 117–18,
206RPI see Retail Price Indexrunning yield see current yield
Samurai bonds 206SEC 116secondary markets 206secured debt 29–30securities lending see stock borrowing/lendingsecuritization
see also asset-backed . . . ; mortgage-backed . . .concepts 7, 73–5, 178–9
SegaInterSettle 97sell/buy backs 95, 97, 103–4, 182, 207
see also repossemi-annualized interest rates 3, 9–10, 17–18,
28–9, 38, 43–4, 159–60, 173–4seniority, loans 7–8serial bonds 3settlement
conventions 32–4, 155–8, 177, 187dates 155–60, 177, 187electronic settlement 95–9
short call positions 108–9simple margin
concepts 59–63, 167, 207mathematical formulae 167
simple yield to maturityconcepts 39–43, 158–9mathematical formulae 158–9
sinking funds 13–14, 65, 207South Africa 20‘special’ bonds 101Special Drawing Rights 2special terms 31–2special-purpose vehicles 2, 7, 29specific collateral, repos 101Spens clause 13, 117, 208spot rates 82–6, 208spot yield curves see zero-coupon yield curvesspread 208, 213Stagecoach 117Standard & Poor 75, 115–21, 152step-up bonds, concepts 14–15stock
see also government bondsdefinitions 1–2, 208
stock borrowing/lending 95–6, 104–5see also repos
straddles 112–13straight-coupon (bullet) bonds, concepts 9–10,
41–2, 49–50, 109–10, 182strategies, yield curve investment strategies
89–94strike prices 107–13, 209strippable bonds, concept 11–13, 55–6strips 11–13, 55–6, 141, 209subindex calculation gaps, index problems 151subordinated loans 8, 29–30supply and demand factors, yield curves 92–3supranational organizations 2, 7, 79, 147swaps
asset swaps 123, 130basis swaps 123, 132website 154CDSs 123, 137–9, 186concepts 123–33credit risk 133
JWBK090-IND JWBK090/Brown March 3, 2006 14:0 Char Count= 0
224 Index
swaps (Continued )cross-currency swaps 123, 130–2FRAs 123, 132–4, 154interest rate swaps 123–33statistics 123types 123yield curves 127–8
swaptions 123, 133Sweden 20synthetic securities 123
t + n settlement 209T-bills see Treasury billsTARGET 209tax 4, 26, 70, 145–6TBMA 97, 100time value, options 111–12Toyota Motor Credit 152TRAX 98–9Treasury bills (T-bills) 22–3, 33–4, 64–5, 170–1,
209, 210see also money markets
Treasury notes 30–1, 33–4, 95, 210
UK 1–3, 9–22, 29–31, 33–4, 35–9, 55, 62–3,67–9, 79–82, 92–4, 115–16, 118–21, 148–2,168–9
UK Debt Management Office 22, 152undated (irredeemable) bonds 3, 11, 19, 52–4
see also perpetual bondsUS markets 9–10, 12, 20–2, 30–1, 34, 79, 95,
115, 116–19, 127–39, 156–7
valuationsbonds 27–65, 115mark-to-market valuations 100–1, 200options 109–12
vanilla bonds see straight-coupon (bullet) bondsvariance 58–65, 165–6variation margin 100–3, 135–7, 211volatility 211
warrantsconcepts 5, 78, 171–2, 211mathematical formulae 171–2
World Bank 29, 79, 147
writingcall options 108–9put options 109
XD see ex-coupon bonds
yield curveswebsite 153–4changes 89–94classic moves 93–4concepts 79–94forward-forward yield curves 84–6investment strategies 89–94par yield curves 86–9shapes 79–82, 89–94supply and demand factors 92–3swap yield curve 127–8zero-coupon yield curves 82–6
yield gap 212yield spread 213yield to call 213yield to maturity (YTM)
see also redemption yieldconcepts 39–59, 158–9, 213mathematical formulae 158–9
yield to worst 213yields
website 153–4CDs 22–3, 171concepts 29, 39–65, 212dividends 189Macaulay duration 30, 45, 50–65, 144–5, 149,
154, 162–3, 173–5, 190modified duration 45, 53–65, 144–5, 149, 154,
163–4, 174–5, 201money markets 64–5, 171, 201portfolios 141–6, 174–7types 39–59, 158–9, 213
YTM see yield to maturity
zero-coupon bonds 3–4, 10–12, 50–65, 82–6,141, 213
zero-coupon yield curvesconcepts 82–9construction 83–4forward-forward yield curves 85–8
Index compiled by Terry Halliday