Embed Size (px)
Citation preview
1
AN INTRODUCTION TO THE BARGE INDUSTRY
September 03, 2009
Business of Towing
By Arnie Rothstein
2
Presentation Outline
I Transportation’s Role in the US Economy
II Marine Assets
III Today’s Barge Industry
IV Margin Drivers
3
Transportation’s Role in the US Economy
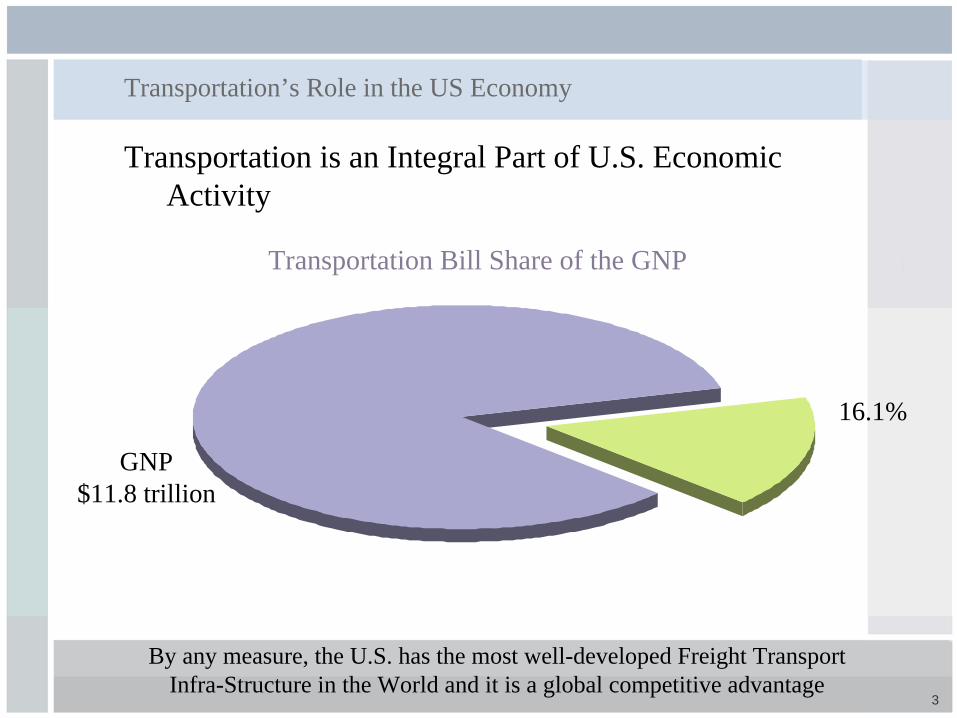
Transportation is an Integral Part of U.S. Economic Activity
Transportation Bill Share of the GNP
By any measure, the U.S. has the most well-developed Freight Transport Infra-Structure in the World and it is a global competitive advantage
GNP$11.8 trillion
16.1%
4
Transportation’s Role in the US Economy
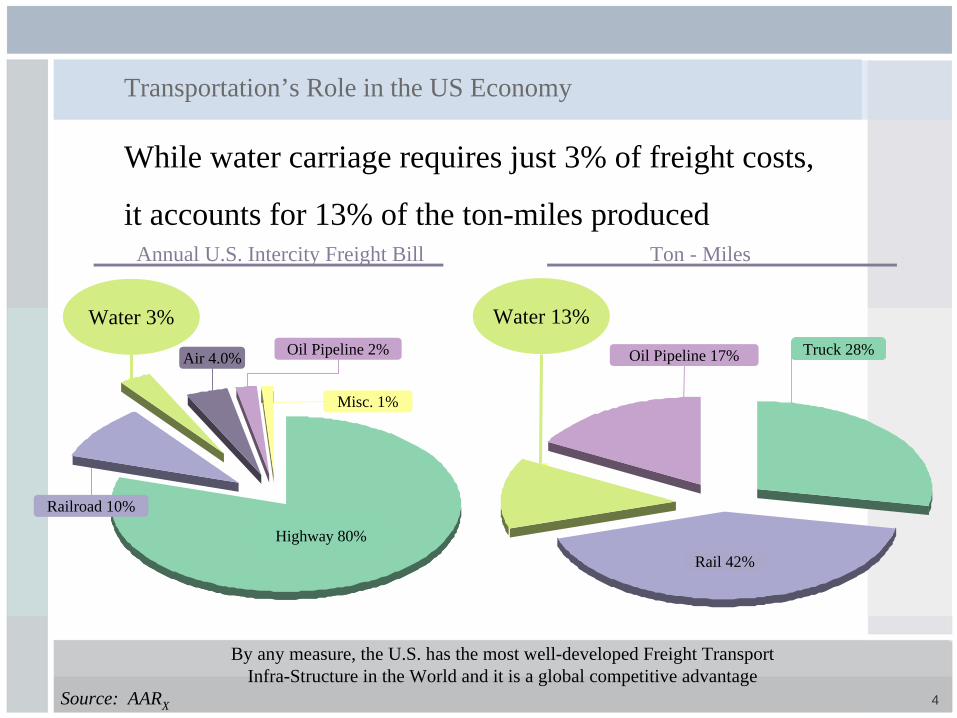
While water carriage requires just 3% of freight costs,
it accounts for 13% of the ton-miles produced
By any measure, the U.S. has the most well-developed Freight Transport Infra-Structure in the World and it is a global competitive advantage
Source: AARX
Annual U.S. Intercity Freight Bill Ton - Miles
Oil Pipeline 2%Air 4.0%
Water 3%
Misc. 1%
Truck 28%Oil Pipeline 17%
Water 13%
Rail 42%Highway 80%
Railroad 10%
5
Transportation’s Role in the US Economy
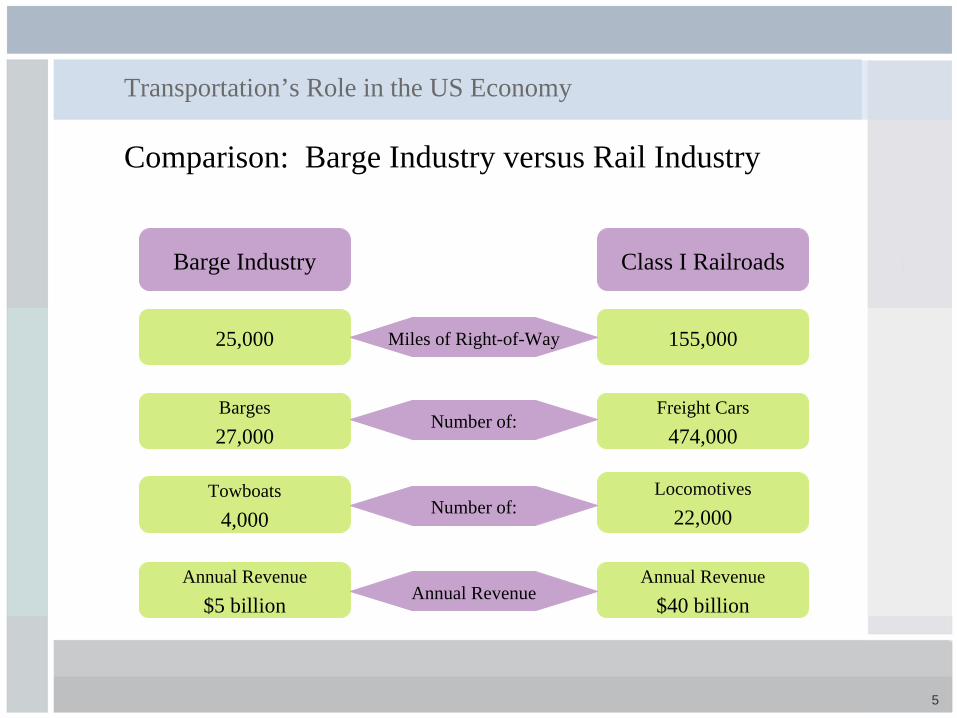
Comparison: Barge Industry versus Rail Industry
25,000 155,000
Barges27,000
Freight Cars474,000
Towboats4,000
Locomotives22,000
Annual Revenue$5 billion
Annual Revenue$40 billion
Barge Industry Class I Railroads
Miles of Right-of-Way
Number of:
Number of:
Annual Revenue
6
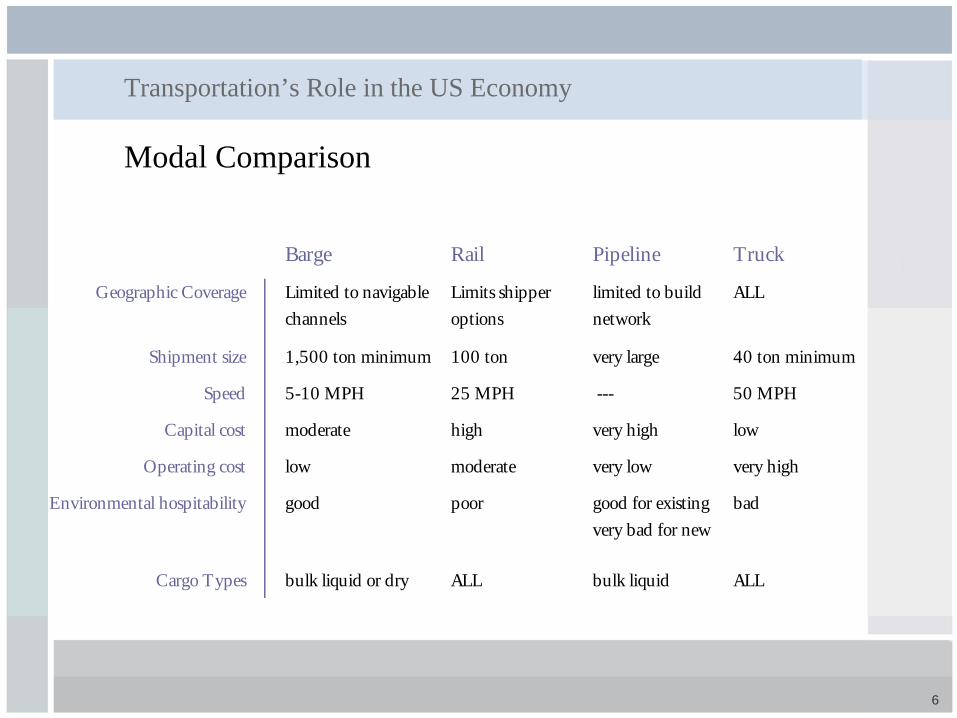
Transportation’s Role in the US Economy
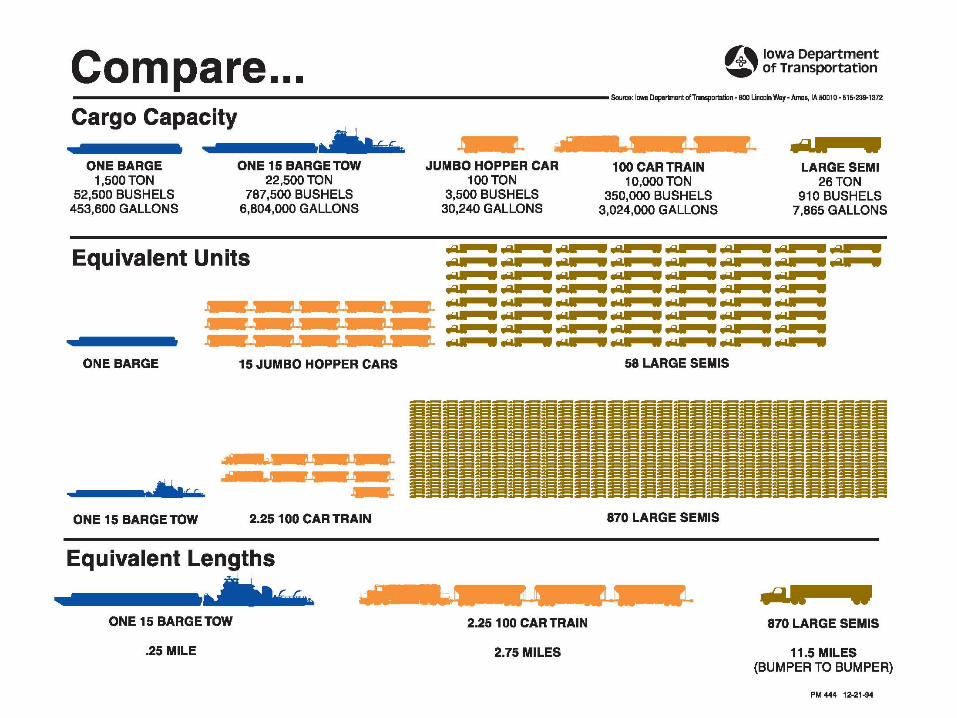
Modal Comparison
Barge Rail Pipeline Truck
Geographic Coverage Limited to navigable channels
Limits shipper options
limited to build network
ALL
Shipment size 1,500 ton minimum 100 ton very large 40 ton minimum
Speed 5-10 MPH 25 MPH --- 50 MPH
Capital cost moderate high very high low
Operating cost low moderate very low very high
Environmental hospitability good poor good for existing very bad for new
bad
Cargo Types bulk liquid or dry ALL bulk liquid ALL

7
Transportation’s Role in the US Economy
8
Presentation Outline
I Transportation’s Role in the US Economy
II Marine Assets
III Today’s Barge Industry
IV Margin Drivers
9
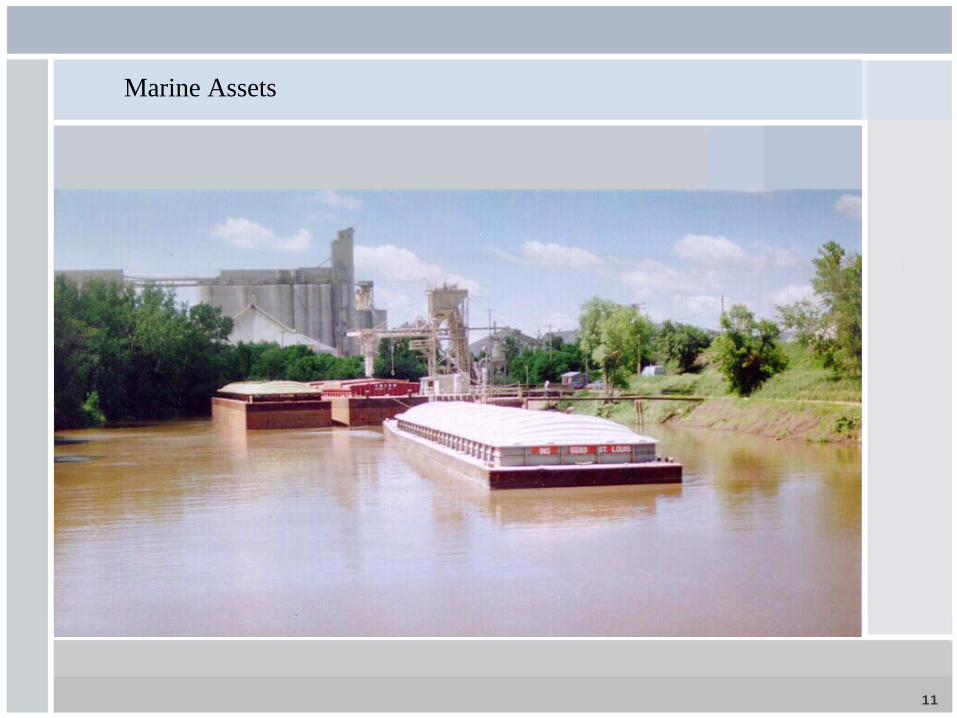
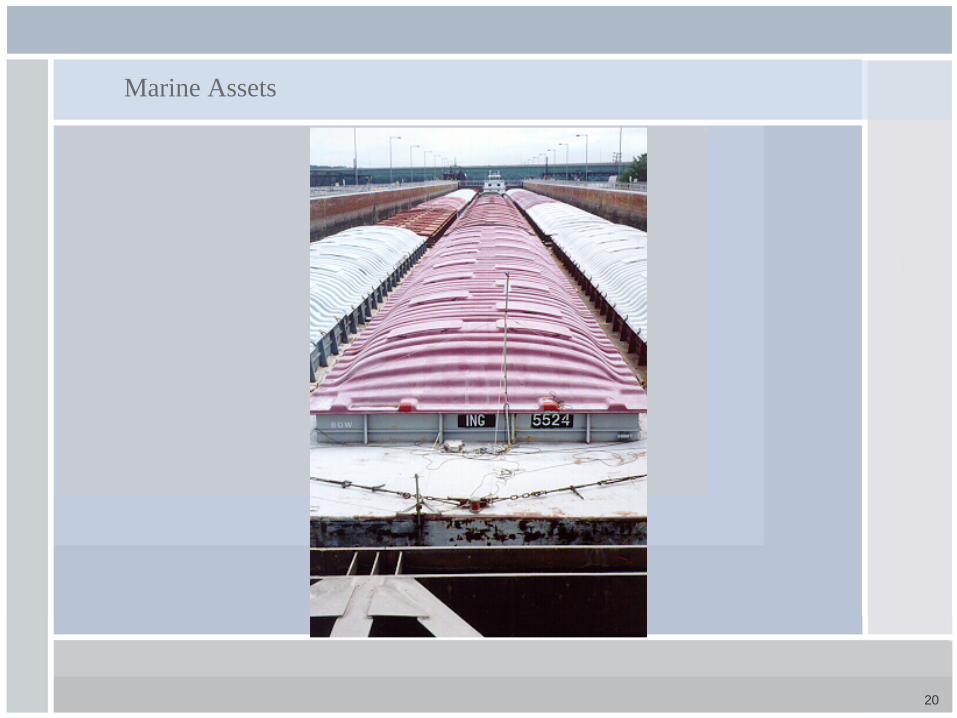
Marine Assets
A BARGE is an unmanned vessel that is loaded with the products we carry
There are two main types:Dry Cargo Hopper Barges
Liquid Tank Barges
10
Marine Assets
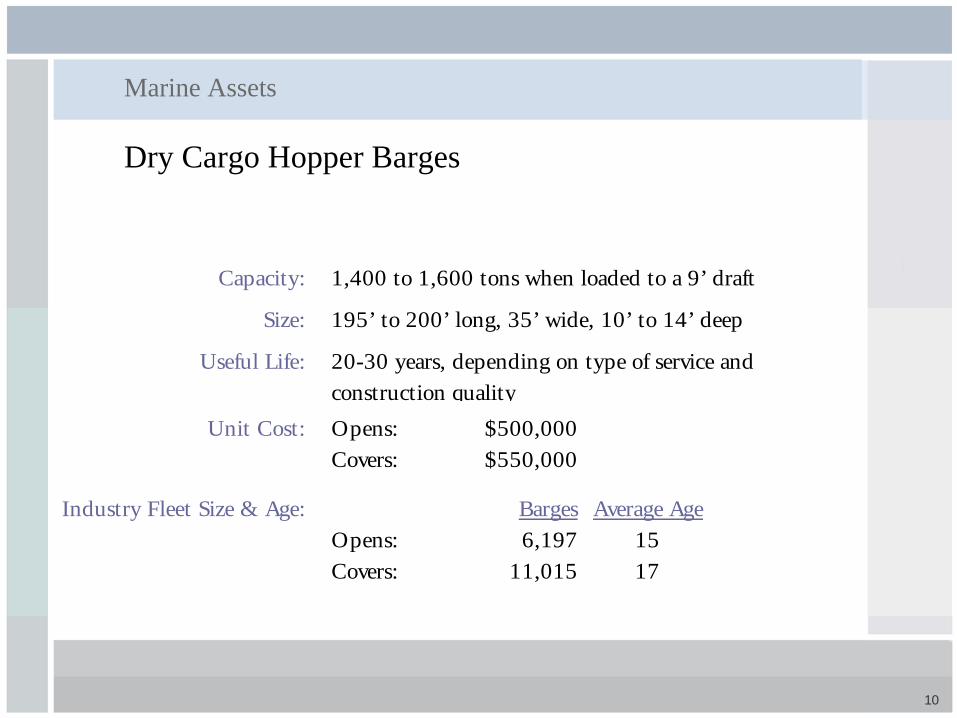
Dry Cargo Hopper Barges
Capacity:
Size:
Useful Life:
Unit Cost: Opens: $500,000 Covers: $550,000
Industry Fleet Size & Age: Barges Average AgeOpens: 6,197 15Covers: 11,015 17
1,400 to 1,600 tons when loaded to a 9’ draft
195’ to 200’ long, 35’ wide, 10’ to 14’ deep
20-30 years, depending on type of service and construction quality
11
Marine Assets
12
Marine Assets
Liquid Tank Barges
More diversity than hoppers, but 2 main types Clean petrochemical linehaul barges
Oversized petrochemical barges
Subject to periodic Coast Guard inspection/certification

13
Marine Assets
Liquid Tank Barges
Capacity:
Size:
Useful Life:
Hull Type:
Cost:
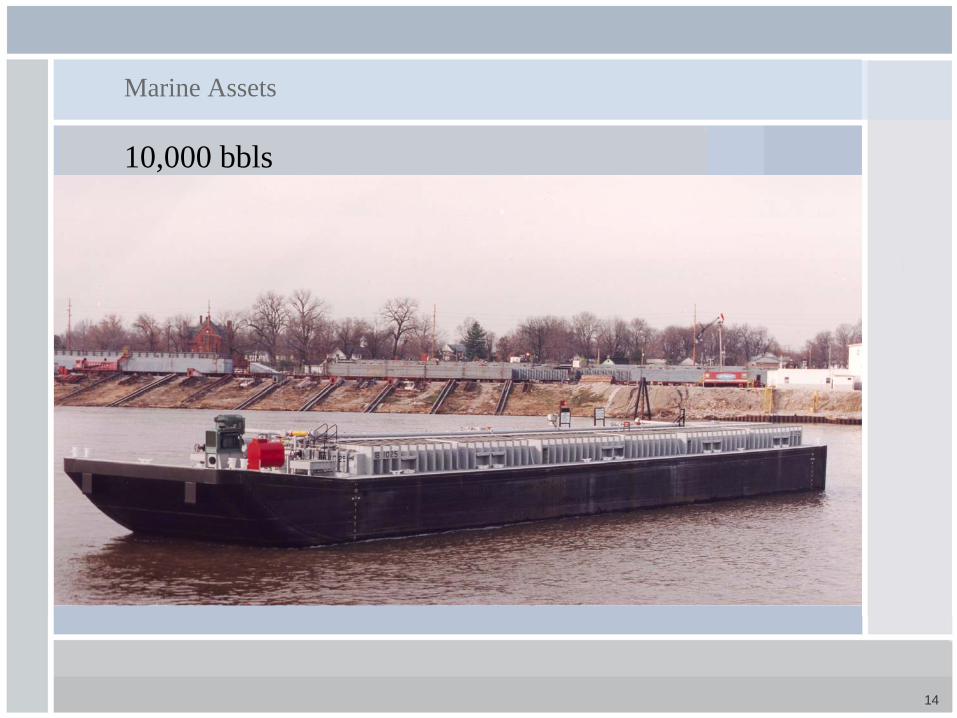
Mix of single hull and double hull
$1,500,000 to $3,000,000 depending on size and
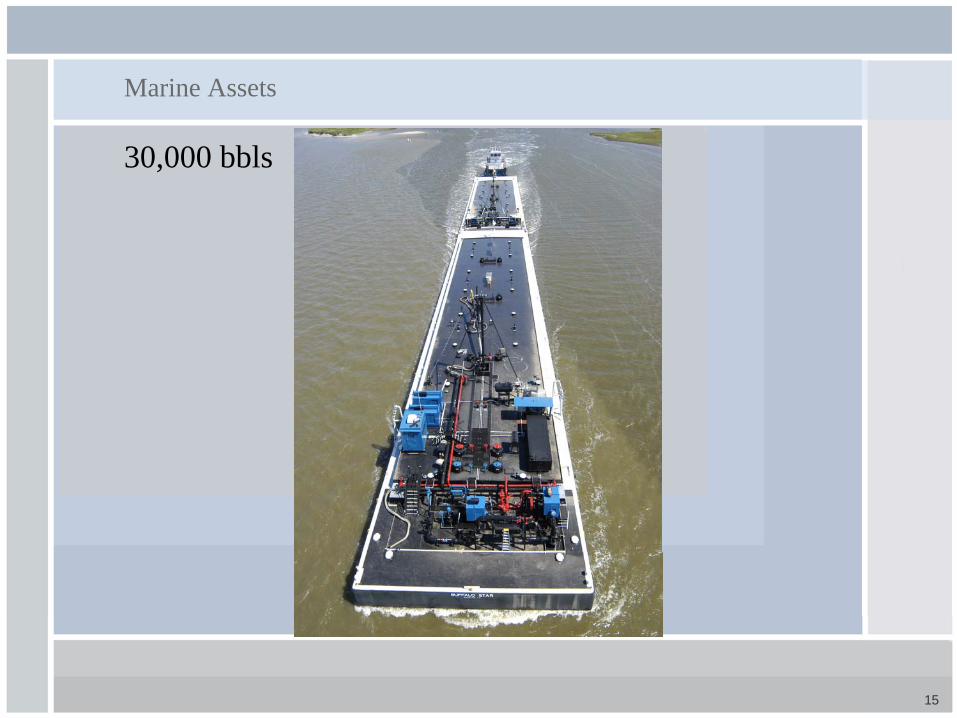
1,500 to 4,000 tons (10,000 bbls to 30,000 bbls) when loaded to a 9' draft150’ to 300’ long, 35’ to 54’ wide, 10’ to 13’ deep
20 - 40 years
14
Marine Assets
10,000 bbls
15
Marine Assets
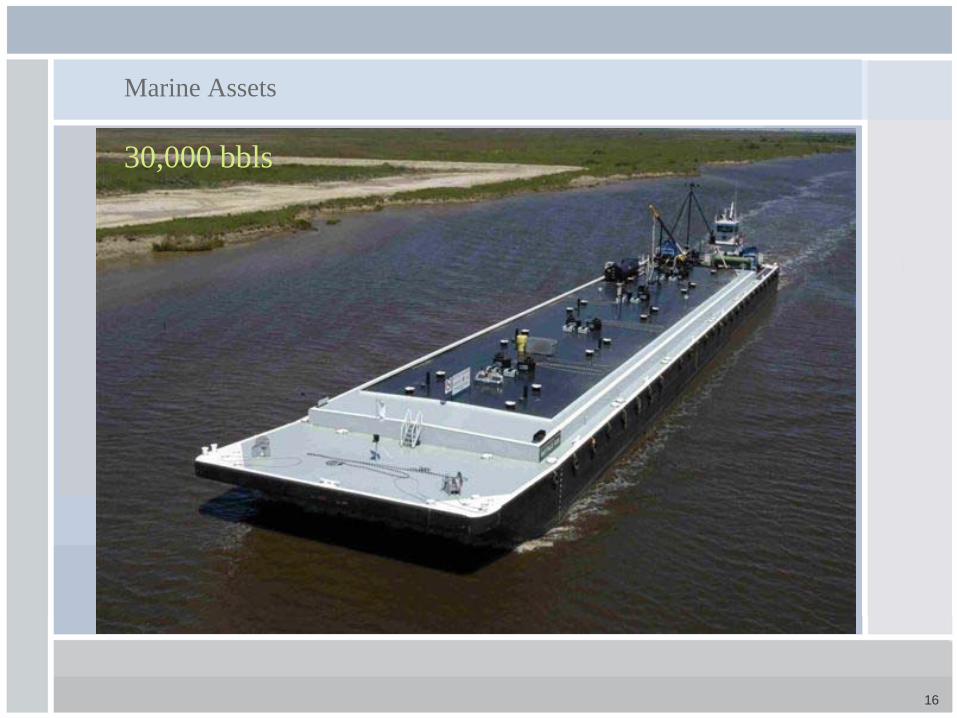
30,000 bbls
16
Marine Assets
30,000 bbls
17
Marine Assets
Barge Size
Question:Why are barges such odd sizes?
Answer:The navigable channel is maintained by the Army Corps of Engineers using Lock and Dam structures.
The standard lock chamber size limits the barge length, width and depth.
18
Marine Assets
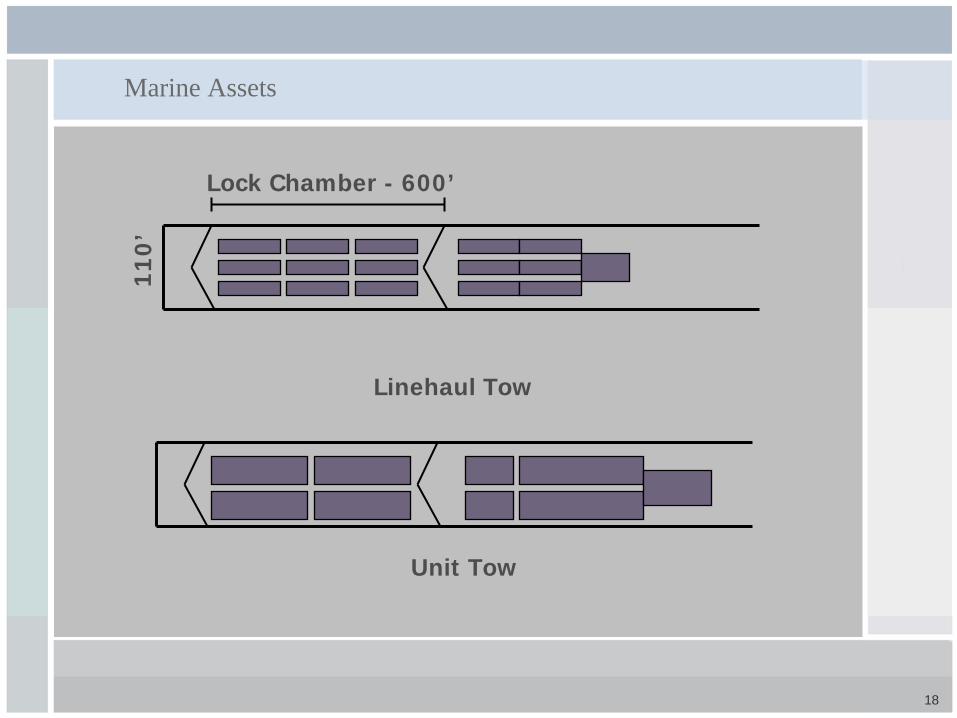
Lock Chamber - 600’
11
0’
Linehaul Tow
Unit Tow
19
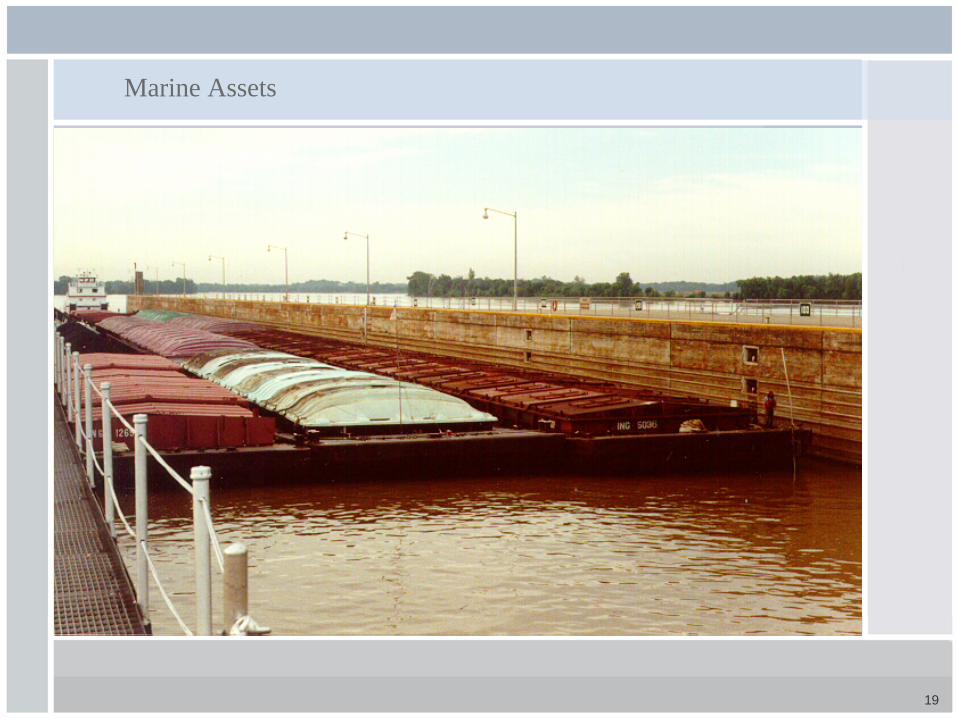
Marine Assets
20
Marine Assets
21
Marine Assets
A TOWBOAT is a manned vessel that transports/pushes barges
There is a large variation in:size power construction, and area of operation
Generally there are 3 main groups of TOWBOATSLinehaulLocking RiverCanal
22
Marine Assets
Linehaul Towboats
Power: 4,000 hp to 11,000 hp
Towing Capacity: Up to 60,000 tons (25 to 40 loaded barges)
Cost: $10,000,000 to $25,000,000 depending on power and configuration
Useful Life: 35 years, extendable to 50 years with major rehab at mid-life
Crew Size: 8 - 10 person
Fuel Consumption: 1 gallon per horsepower per day
Area of Operation: Lower Mississippi and Lower Ohio Rivers
23
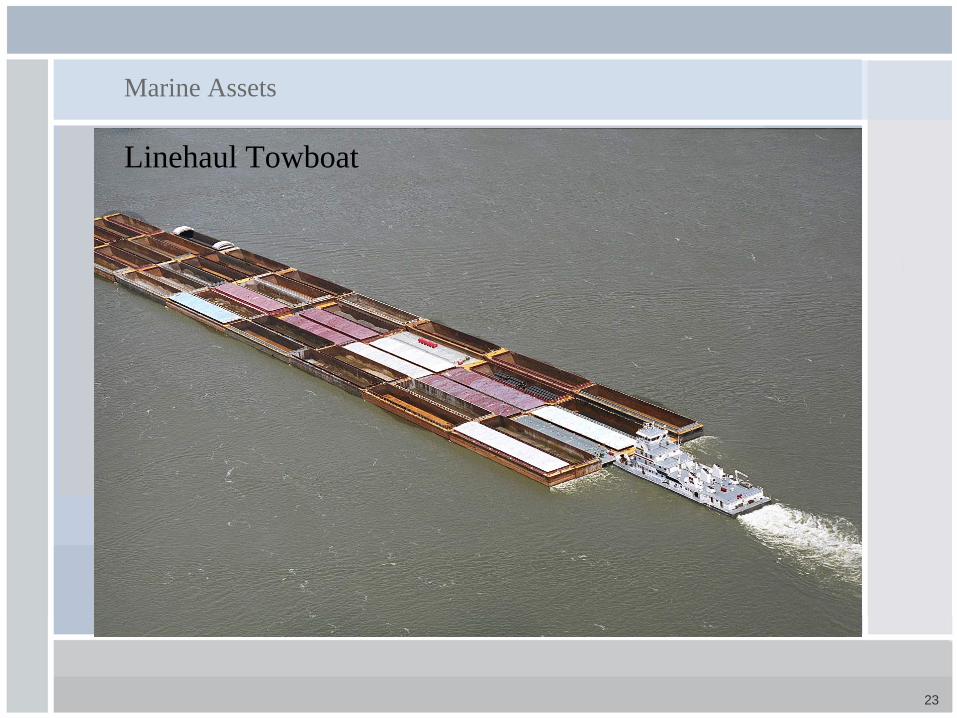
Marine Assets
Linehaul Towboat
24
Marine Assets
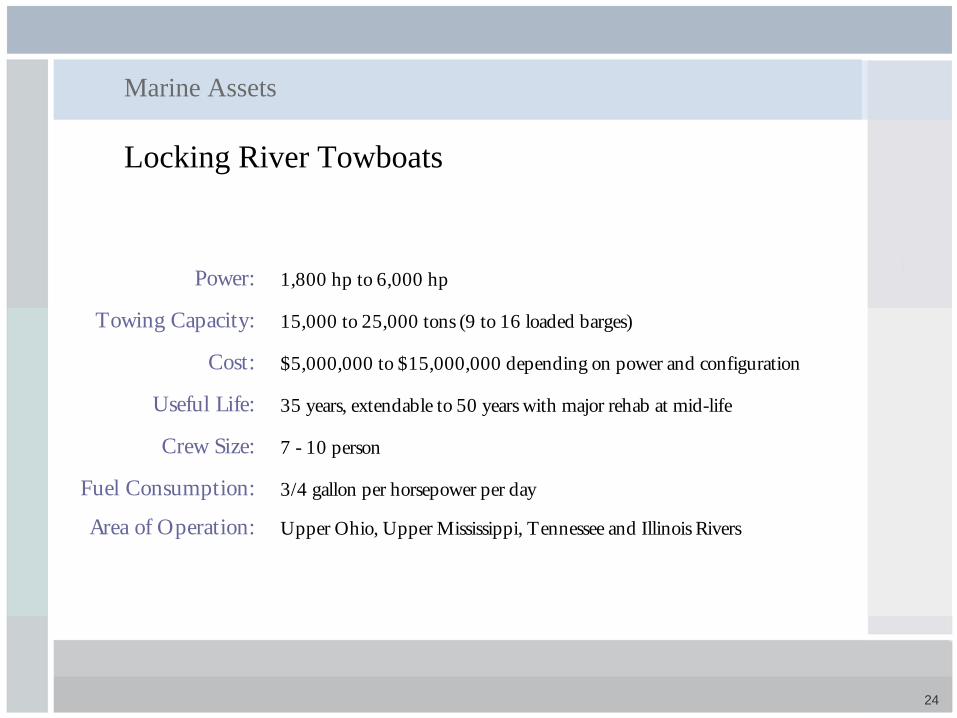
Locking River Towboats
Power: 1,800 hp to 6,000 hp
Towing Capacity: 15,000 to 25,000 tons (9 to 16 loaded barges)
Cost: $5,000,000 to $15,000,000 depending on power and configuration
Useful Life: 35 years, extendable to 50 years with major rehab at mid-life
Crew Size: 7 - 10 person
Fuel Consumption: 3/4 gallon per horsepower per day
Area of Operation: Upper Ohio, Upper Mississippi, Tennessee and Illinois Rivers
25
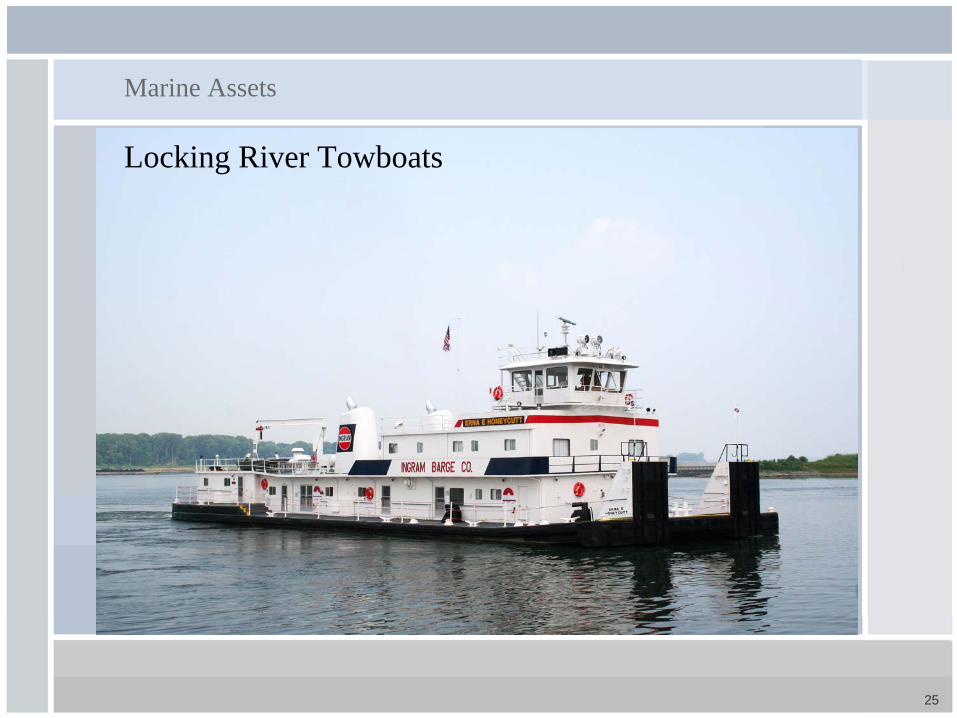
Marine Assets
Locking River Towboats

26
Marine Assets
Locking River Towboats
27
Marine Assets
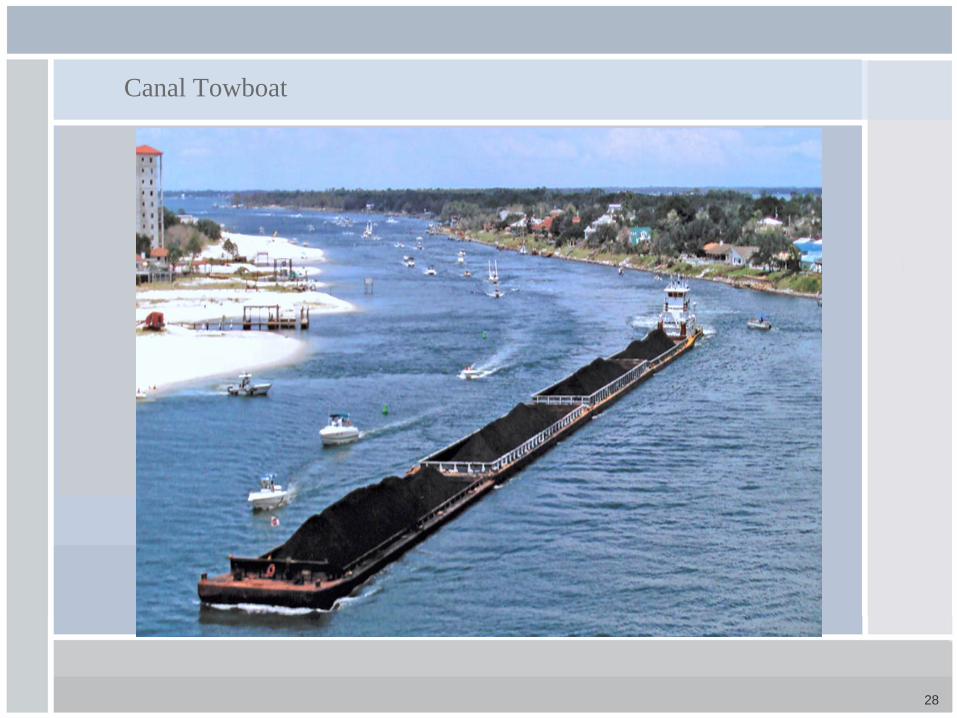
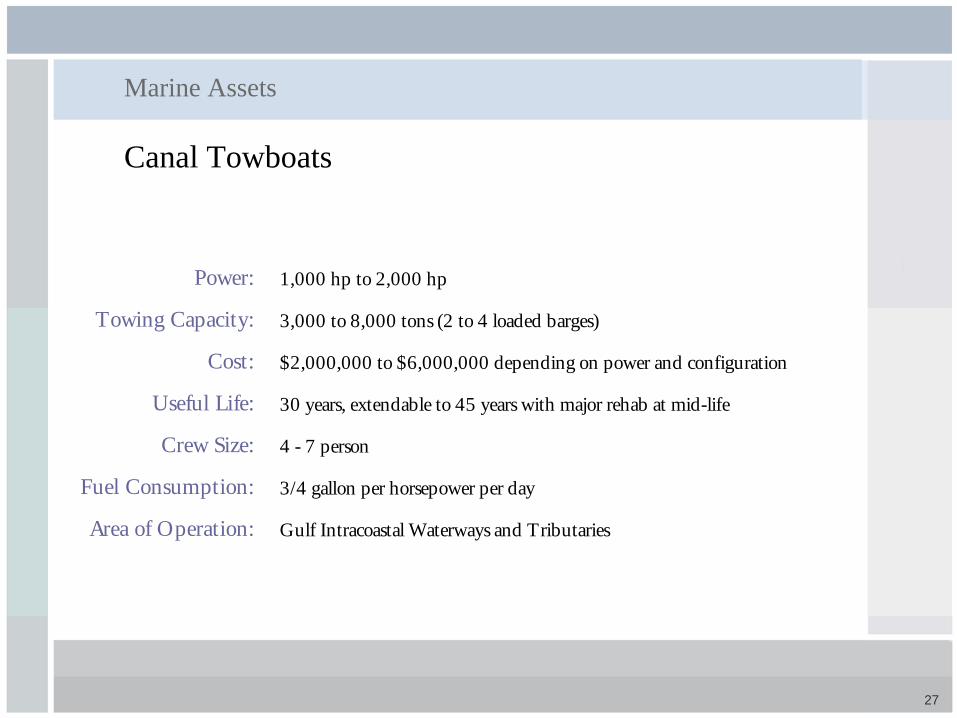
Canal Towboats
Power: 1,000 hp to 2,000 hp
Towing Capacity: 3,000 to 8,000 tons (2 to 4 loaded barges)
Cost: $2,000,000 to $6,000,000 depending on power and configuration
Useful Life: 30 years, extendable to 45 years with major rehab at mid-life
Crew Size: 4 - 7 person
Fuel Consumption: 3/4 gallon per horsepower per day
Area of Operation: Gulf Intracoastal Waterways and Tributaries
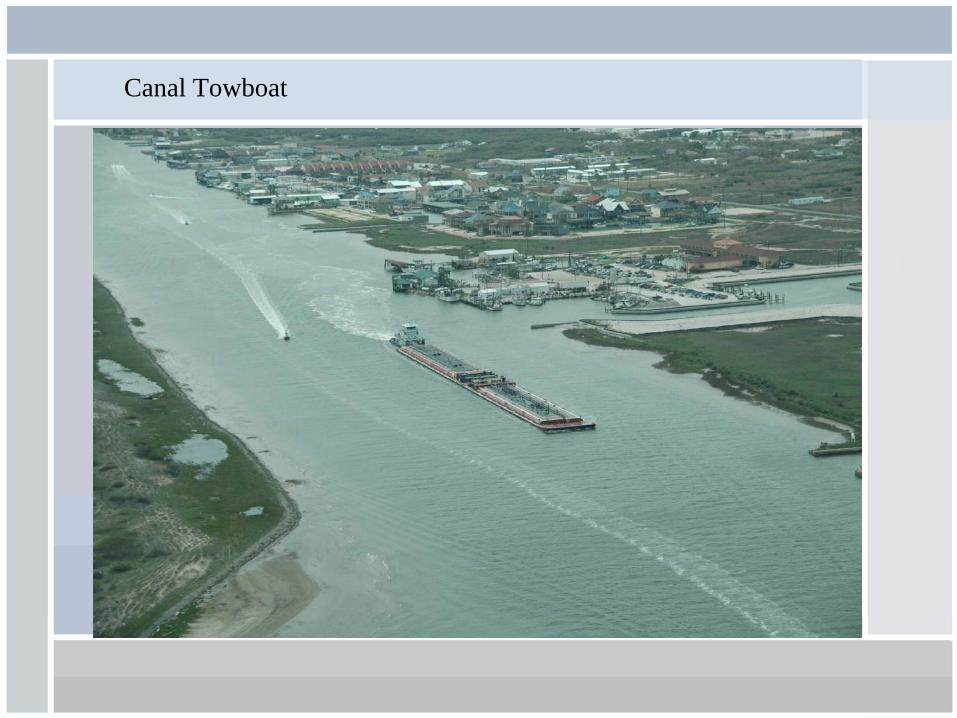
Canal Towboat

31
Water transportation is efficient
One gallon of fuel can move one ton of freight
Truck, 59
Rail, 386
Barge, 514
0 100 200 300 400 500 600 700- Miles -
Fuel Efficiency in Freight Transportation – Samuel Ewer Eastman
32
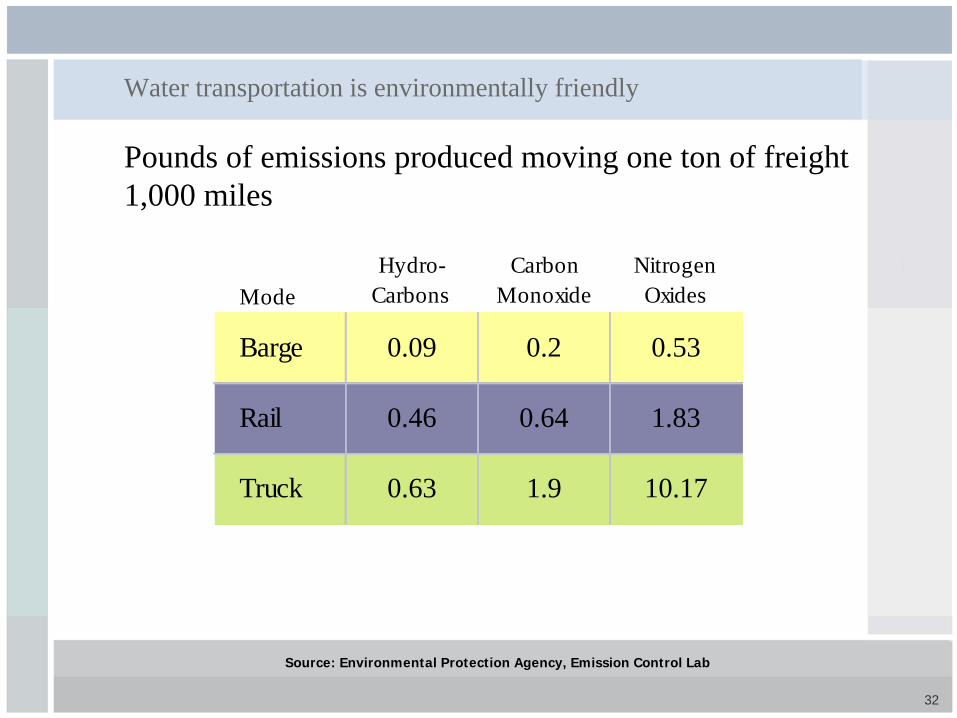
Water transportation is environmentally friendly
Pounds of emissions produced moving one ton of freight 1,000 miles
Source: Environmental Protection Agency, Emission Control Lab
ModeHydro-
CarbonsCarbon
MonoxideNitrogen Oxides
Barge 0.09 0.2 0.53
Rail 0.46 0.64 1.83
Truck 0.63 1.9 10.17
33
Presentation Outline
I Transportation’s Role in the US Economy
II Marine Assets
III Today’s Barge Industry
IV Margin Drivers
34
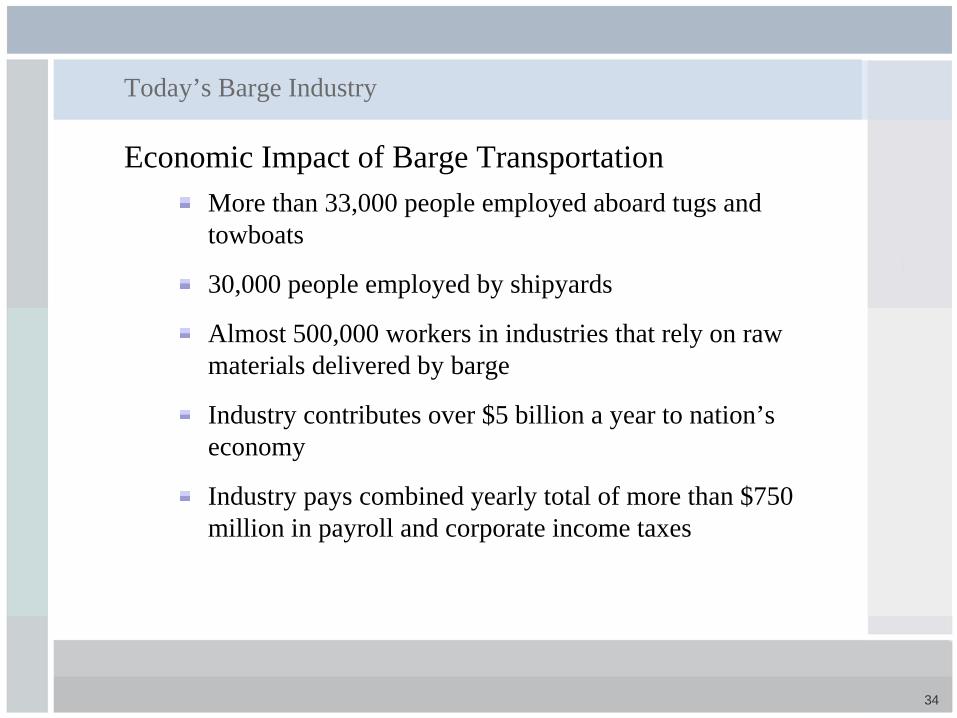
Today’s Barge Industry
Economic Impact of Barge TransportationMore than 33,000 people employed aboard tugs and towboats
30,000 people employed by shipyards
Almost 500,000 workers in industries that rely on raw materials delivered by barge
Industry contributes over $5 billion a year to nation’s economy
Industry pays combined yearly total of more than $750 million in payroll and corporate income taxes
35
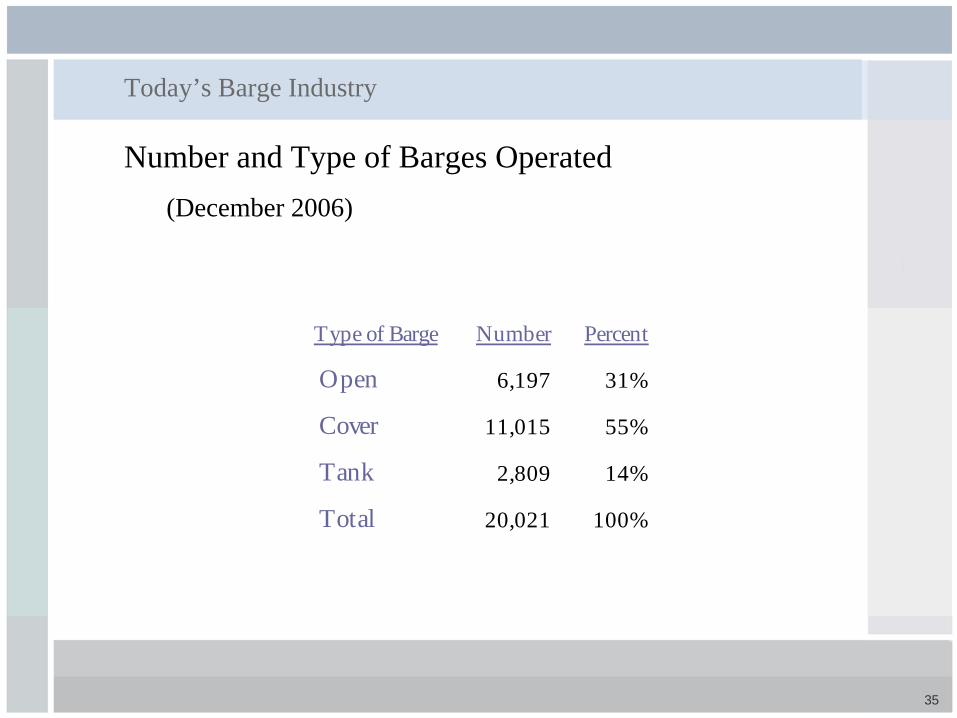
Number and Type of Barges Operated(December 2006)
Type of Barge Number Percent
Open 6,197 31%
Cover 11,015 55%
Tank 2,809 14%
Total 20,021 100%
Today’s Barge Industry
36
Today’s Barge Industry
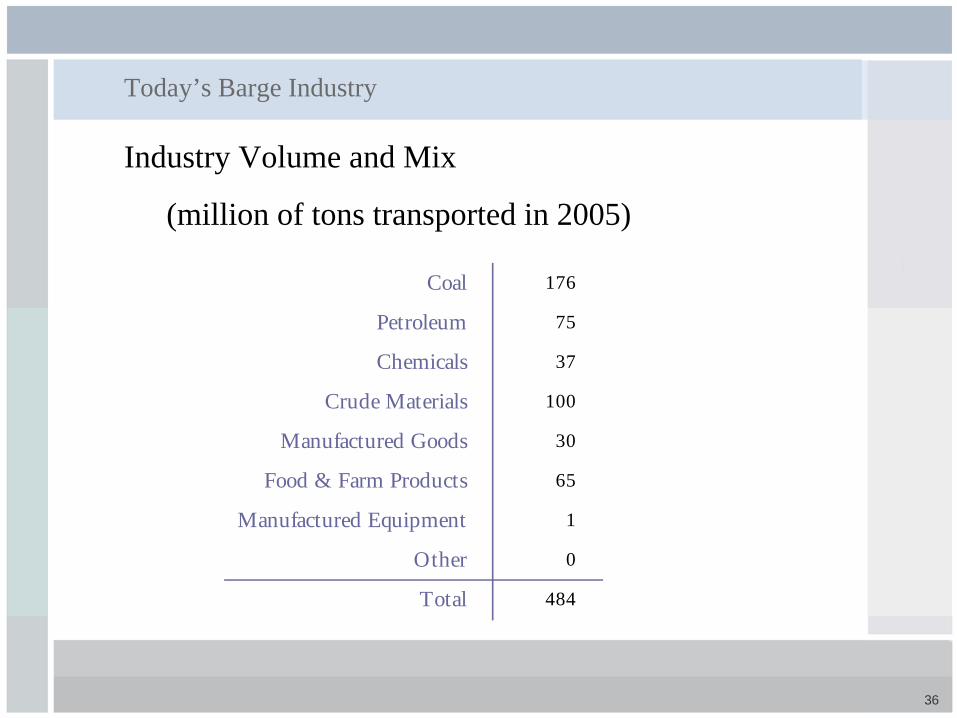
Industry Volume and Mix
(million of tons transported in 2005)
Coal 176
Petroleum 75
Chemicals 37
Crude Materials 100
Manufactured Goods 30
Food & Farm Products 65
Manufactured Equipment 1
Other 0
Total 484

37
Tons Barge Days
Other includes Alumina, Salt, Cement, Fertilizer, Forest Products, etc.
Today’s Barge Industry
Dry Cargo Barge Market
45%
5%
17%
14%
19%
Coal Grain Steel Aggregate Other
38%
7%
12%
13%
30%
Coal Grain Steel Aggregate Other
38
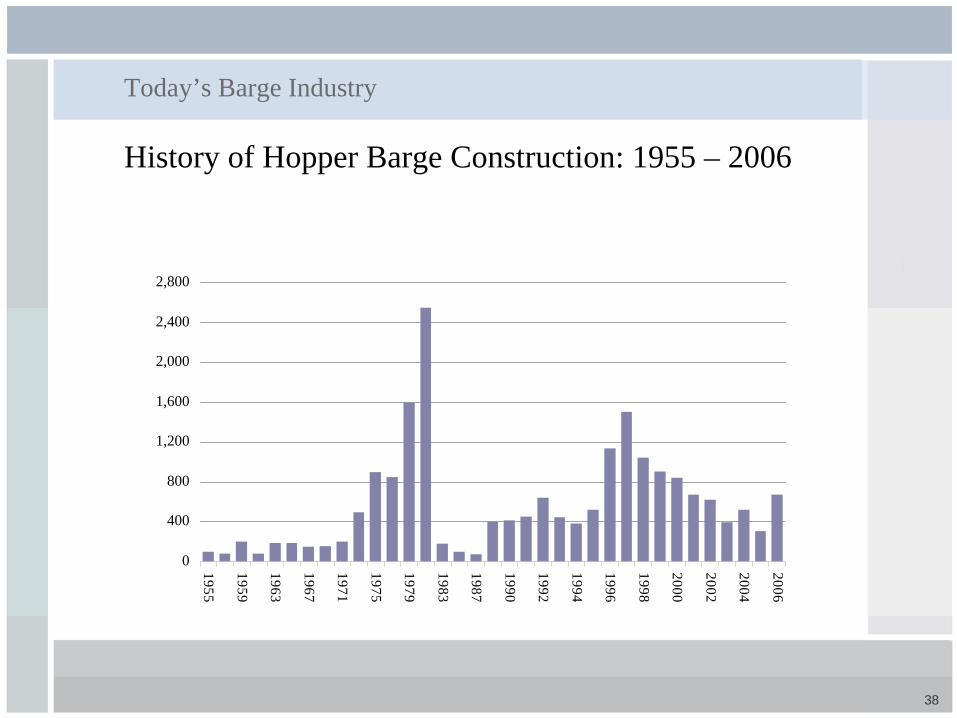
History of Hopper Barge Construction: 1955 – 2006
Today’s Barge Industry
0
400
800
1,200
1,600
2,000
2,400
2,800
1955
1959
1963
1967
1971
1975
1979
1983
1987
1990
1992
1994
1996
1998
2000
2002
2004
2006
Num
ber o
f Bar
ges
39
Today’s Barge Industry
Today’s barge industry is challenged by several issues
Waterways Infrastructure
Regulatory Challenge
Safety and Stewardship
40
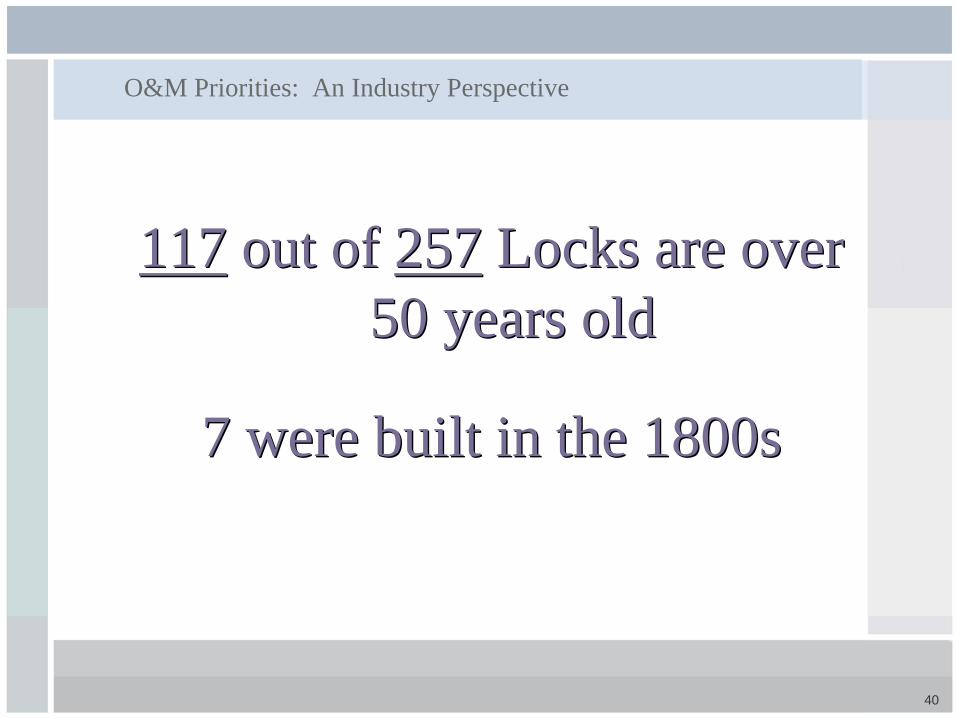
O&M Priorities: An Industry Perspective
117 out of 257 Locks are over 50 years old
7 were built in the 1800s
117 out of 257 Locks are over 50 years old
7 were built in the 1800s
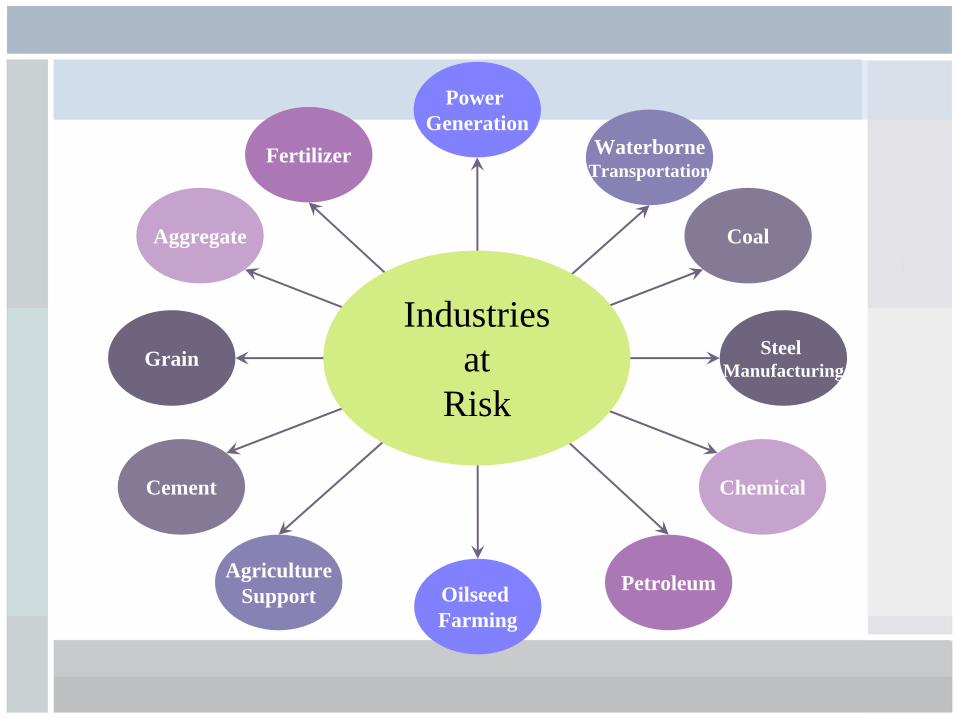
Fertilizer
Aggregate
Grain
Cement
AgricultureSupport Oilseed
Farming
Petroleum
Chemical
Steel Manufacturing
Coal
WaterborneTransportation
Power Generation
Industriesat
Risk
42
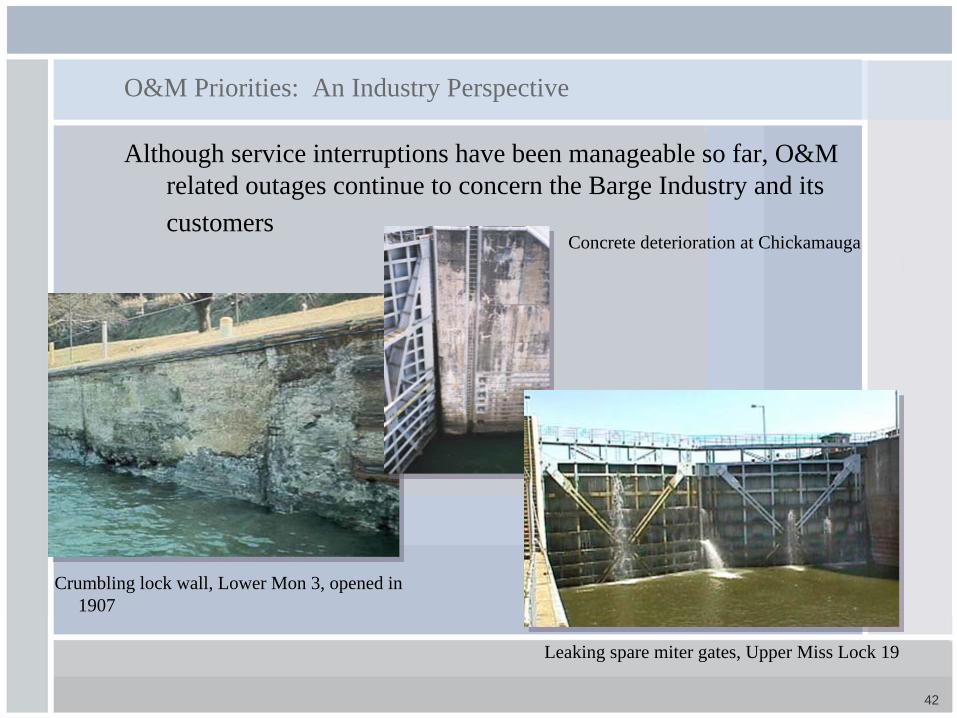
O&M Priorities: An Industry Perspective
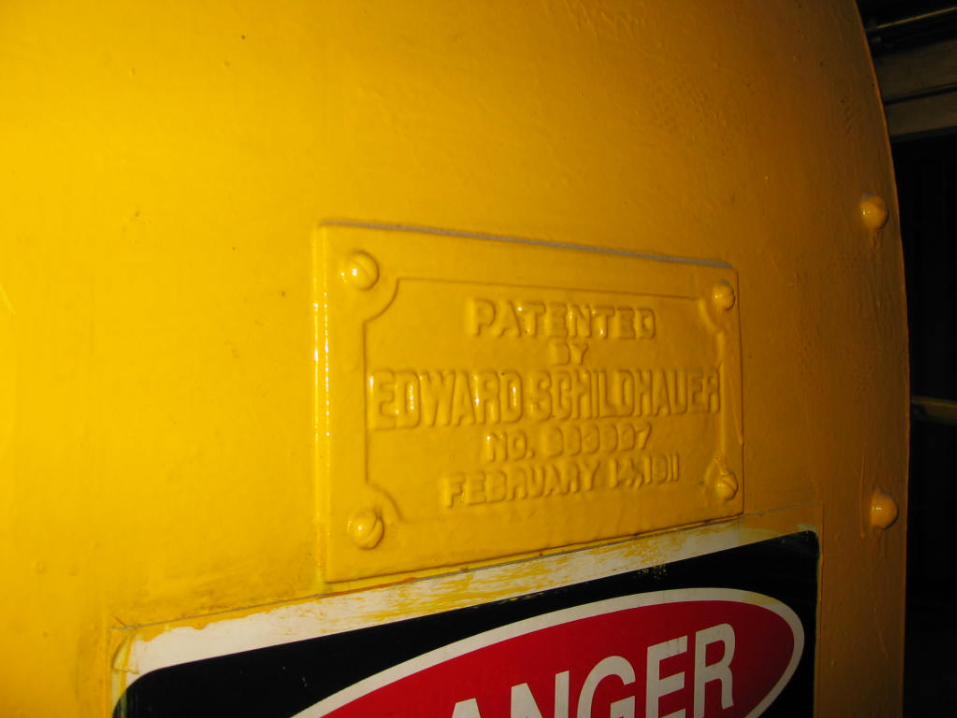
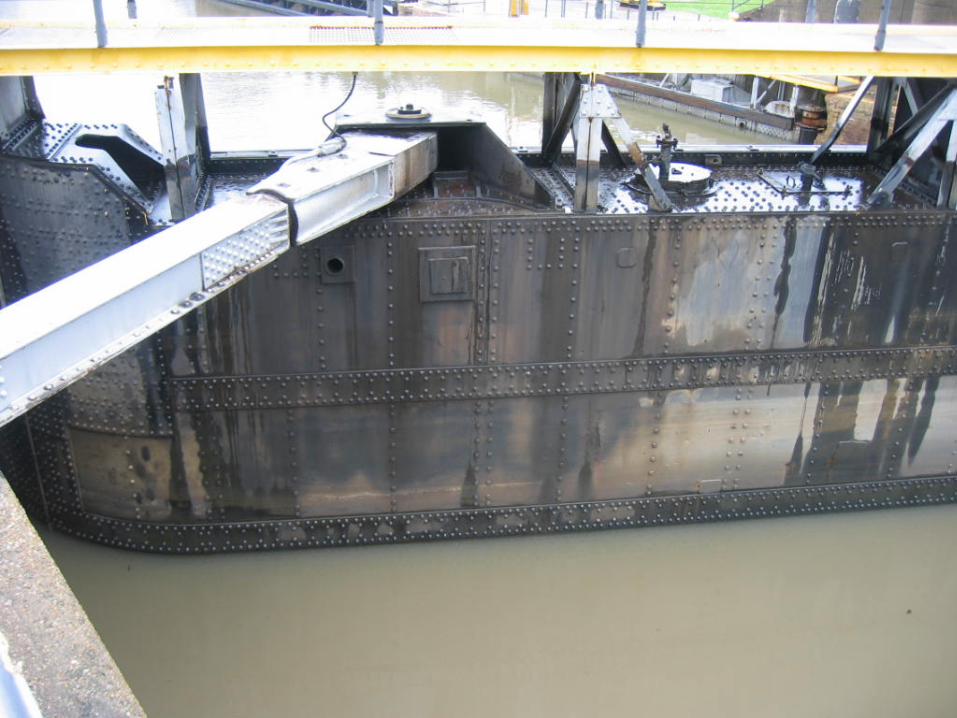
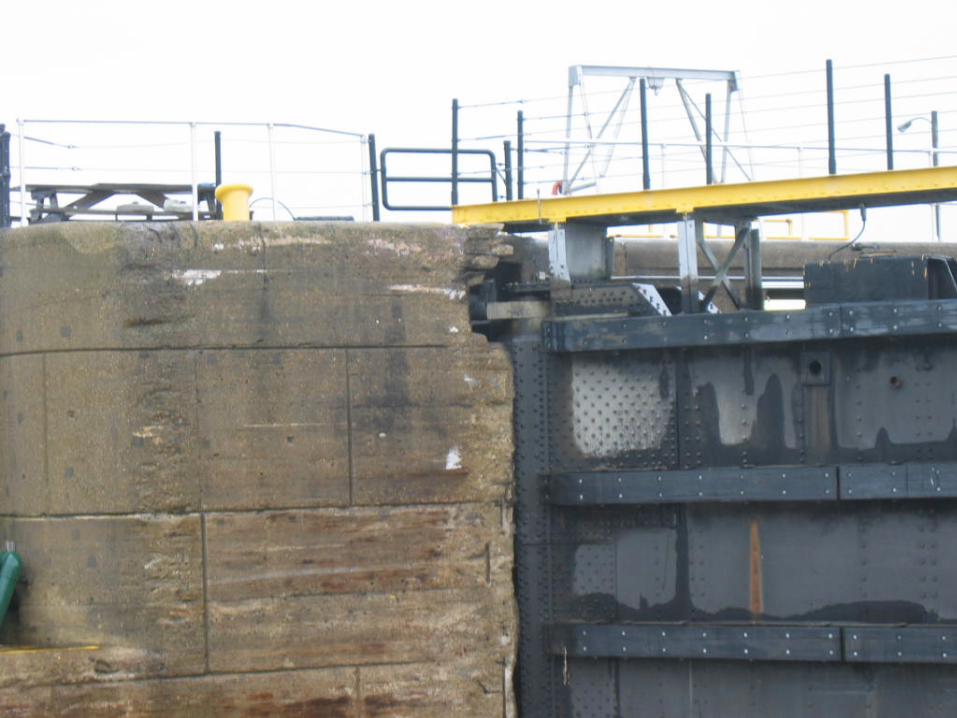
Although service interruptions have been manageable so far, O&M related outages continue to concern the Barge Industry and its customers
Crumbling lock wall, Lower Mon 3, opened in 1907
Concrete deterioration at Chickamauga
Leaking spare miter gates, Upper Miss Lock 19
43
44
45
46

47
O&M Priorities: An Industry Perspective
Unscheduled outages have also become more frequentNavigation Lock Unavailability – 1992 to 2005
Total Hours - Scheduled vs. Unscheduled without ice
0
20,000
40,000
60,000
80,000
100,000
120,000
1992 1993 1994 1995 1996 1997 1998 1999 2000 2001 2002 2003 2004 2005
Hou
rs
Scheduled Unscheduled
48
Regulatory Challenge
Marine Engine Emissions
EPA has issued proposed rules for new and “overhauled” engines
Vessel Discharge Regulations
Last year, federal court (California) vacated existing vessel discharge exclusion of 40 CFR 122.3(a) effective September 30, 2008
Vessel Inspection
The Coast Guard is developing a vessel inspection program for towboats
49
Regulatory Challenge
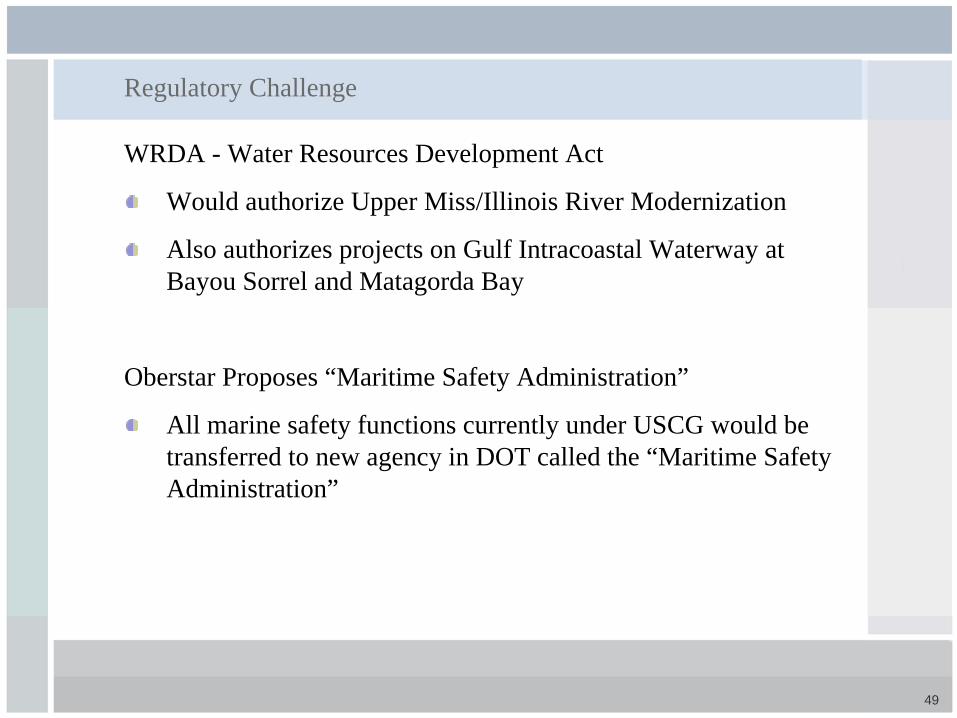
WRDA - Water Resources Development Act
Would authorize Upper Miss/Illinois River Modernization
Also authorizes projects on Gulf Intracoastal Waterway at Bayou Sorrel and Matagorda Bay
Oberstar Proposes “Maritime Safety Administration”
All marine safety functions currently under USCG would be transferred to new agency in DOT called the “Maritime Safety Administration”
50
Regulatory Challenge
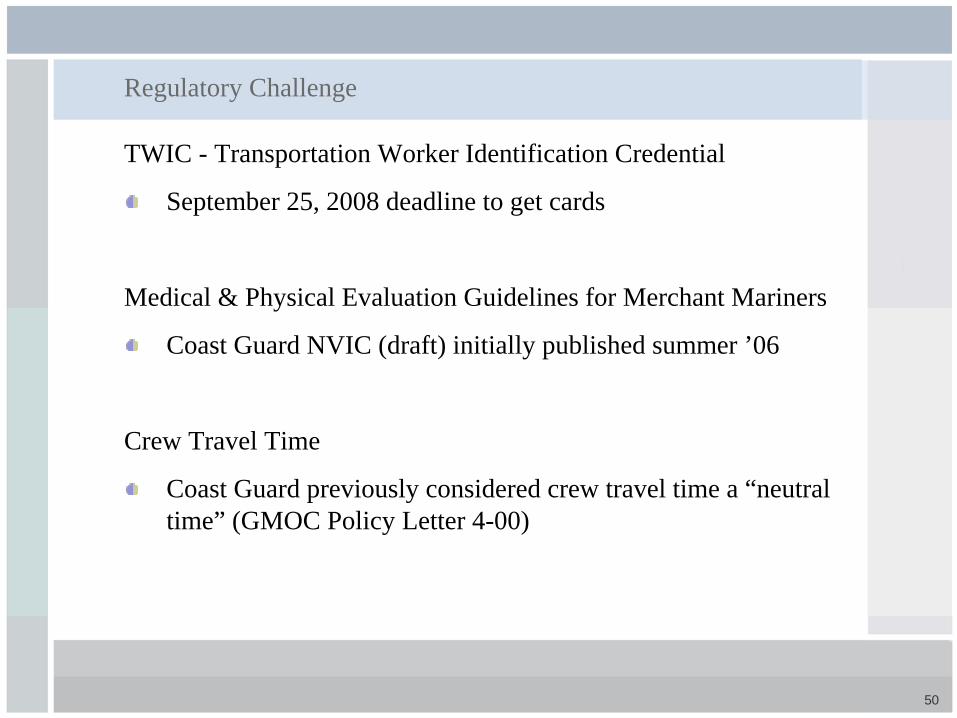
TWIC - Transportation Worker Identification Credential
September 25, 2008 deadline to get cards
Medical & Physical Evaluation Guidelines for Merchant Mariners
Coast Guard NVIC (draft) initially published summer ’06
Crew Travel Time
Coast Guard previously considered crew travel time a “neutral time” (GMOC Policy Letter 4-00)
51
Today’s Barge Industry
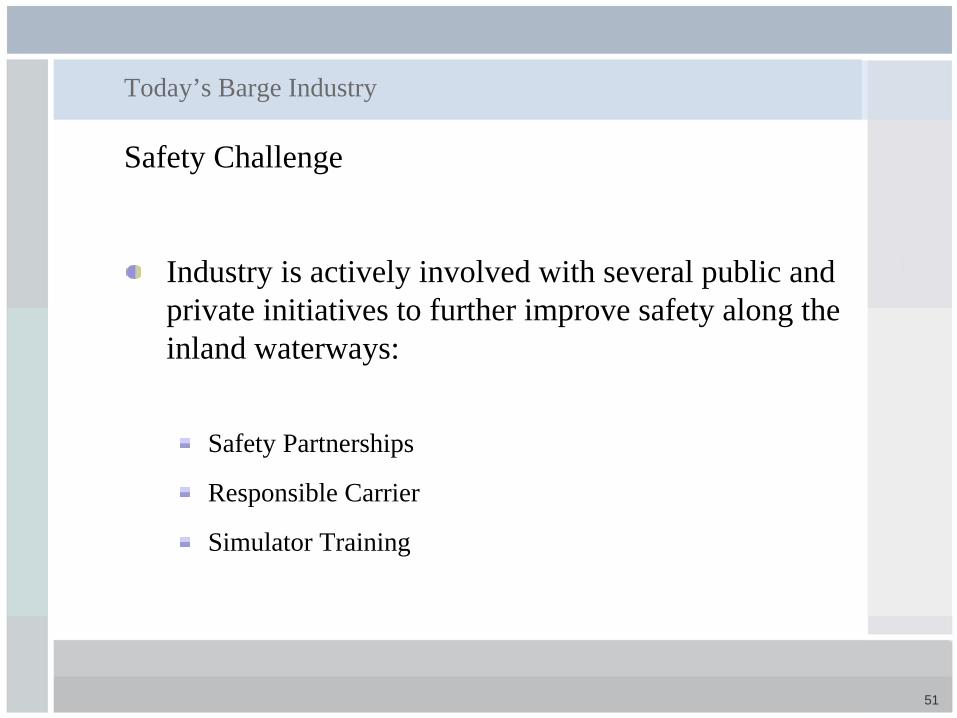
Safety Challenge
Industry is actively involved with several public and private initiatives to further improve safety along the inland waterways:
Safety Partnerships
Responsible Carrier
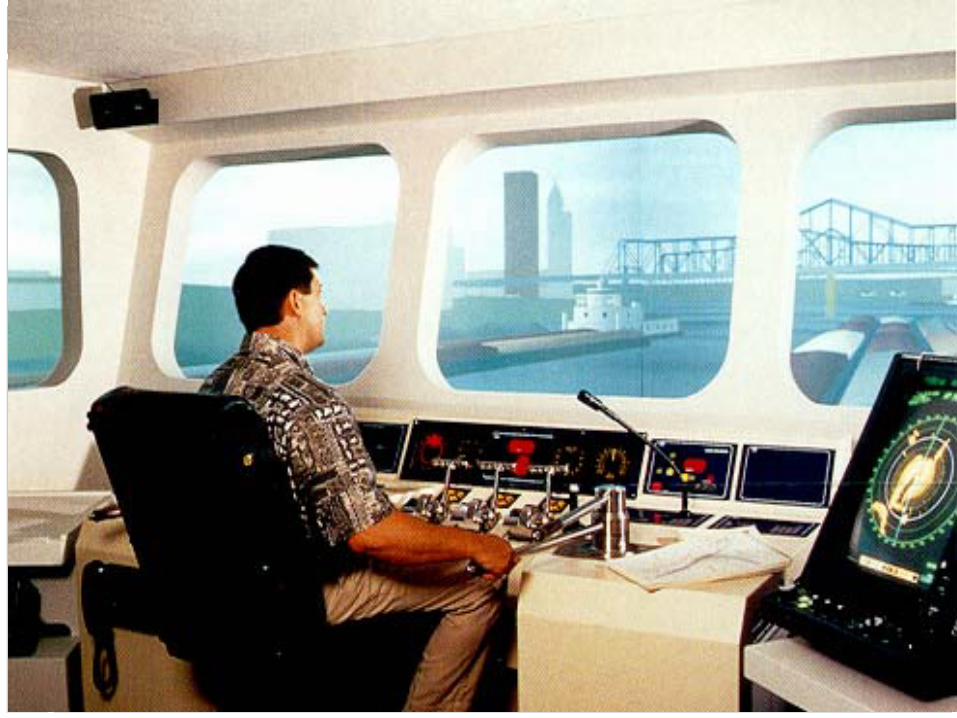
Simulator Training
52

53
Presentation Outline
I Transportation’s Role in the US Economy
II Marine Assets
III Today’s Barge Industry
IV Margin Drivers

54
What are the major variables for direct cost?
Labor
Fuel
External Services (e.g., cleaning, shifting, etc.)
River operating conditions
Ratability of shipments
Equipment utilization level
Margin Drivers
55
How are barge rates calculated?
Most spot rates are market driven with a floor near carrier’s variable operating costs
Long-term contract rates are also market driven, but set at a level which generates a satisfactory return on investment
For both spot and term contract bids, a distinction is made between fronthaul and backhaul movements, to optimize round-trip revenues and earnings
Margin Drivers
56
What are the keys to improved equipment productivity?
1) Faster loadings and unloadings
2) Heavier loads per barge; bigger barges
3) Complete removal of cargo from barge so as to avoid cleaning expense and time
4) Reliable schedules and forecasts
5) Ratable shipments; less seasonality
6) Balanced traffic flows
Margin Drivers