Embed Size (px)
Citation preview
1
An introduction to Systems Dynamics by Corrado lo Storto
2
Main questions:
Why?
What?
How?
3
The project delivery system
Goal-oriented
Open
• has / requires external inputs
Complex
• uncertainty,
• many requirements, technically and from business perspectives
Dynamic
Non-linear cause-effect relationships
Why?
4
The current project delivery system
Starting point with some flaws
• Based on PERT and CPM – from ’40’s
• Critical Path Method – neglects resources
• Risk Management includes risk in all tasks
• Measurement based on Cost vs Throughput
If it didn’t work you weren’t detailed enough
Why?
5
A new project delivery system
Systems Thinking (Systems Dynamics) Jay Forrester “Industrial Dynamics”, 1961 MIT
Perspective of whole and how parts interact
Tools for mapping dynamic complexity
• Causal loop diagrams
• Stock and Flow
What?
6
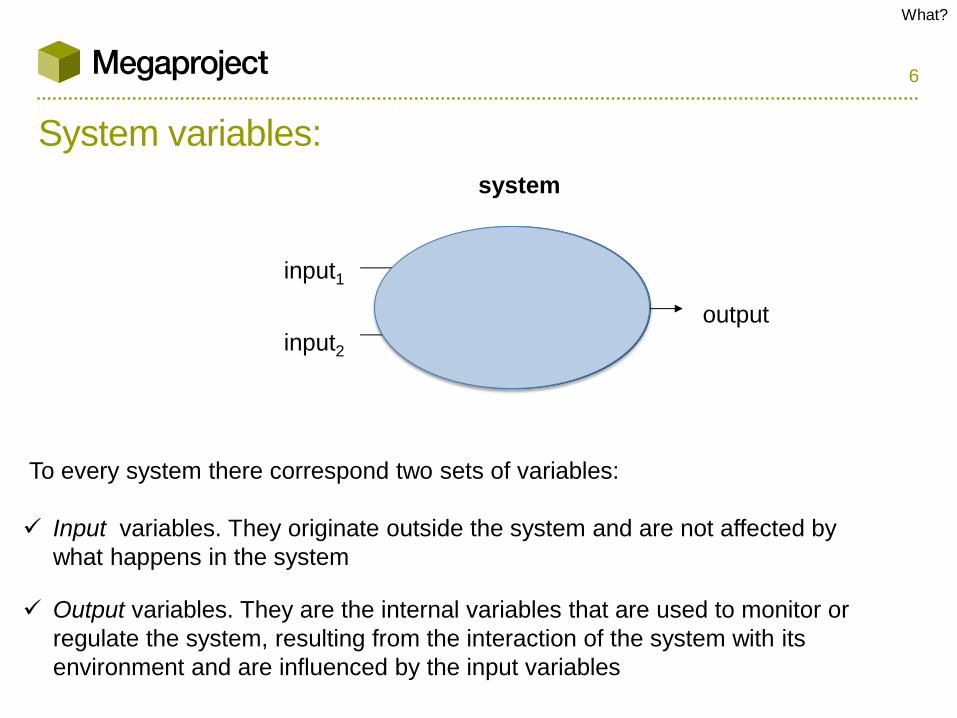
System variables:
To every system there correspond two sets of variables:
Input variables. They originate outside the system and are not affected by
what happens in the system
Output variables. They are the internal variables that are used to monitor or
regulate the system, resulting from the interaction of the system with its
environment and are influenced by the input variables
system
input1
input2 output
What?
7
System Thinking Process
• Specify Issue (dynamic, holistic thinking)
• Construct Hypothesis / model (causal relationship thinking)
• Test Hypothesis / model (scientific thinking)
• Implement Changes
Model reality to understand a system’s behaviour not specific
performance
What?
8
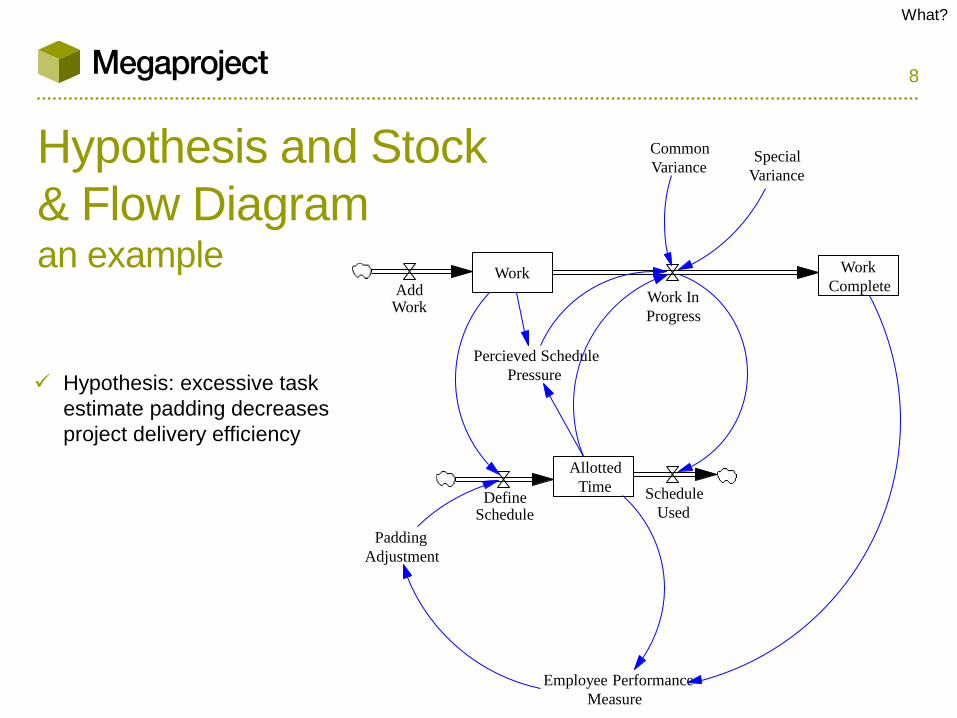
Hypothesis and Stock
& Flow Diagram an example
Allotted
Time Define
Schedule
Work Work
Complete Work In
Progress
Schedule
Used
Add Work
Employee Performance
Measure
Padding
Adjustment
Common
Variance Special
Variance
Percieved Schedule
Pressure Hypothesis: excessive task
estimate padding decreases
project delivery efficiency
What?
9
simulation a very powerful and widely used management science technique to
analyze and study complex systems
a technique that imitates how a real-world system behaves as it
evolves over time
adopts a simulation model., i.e. a model that usually takes the form of a
set of assumptions about the behavior of the system, either expressed
as mathematical or logical relations between the objects of interest in
the system
allows to better understand the expected performance of the real
system and to test the effectiveness of the system design
How?
10
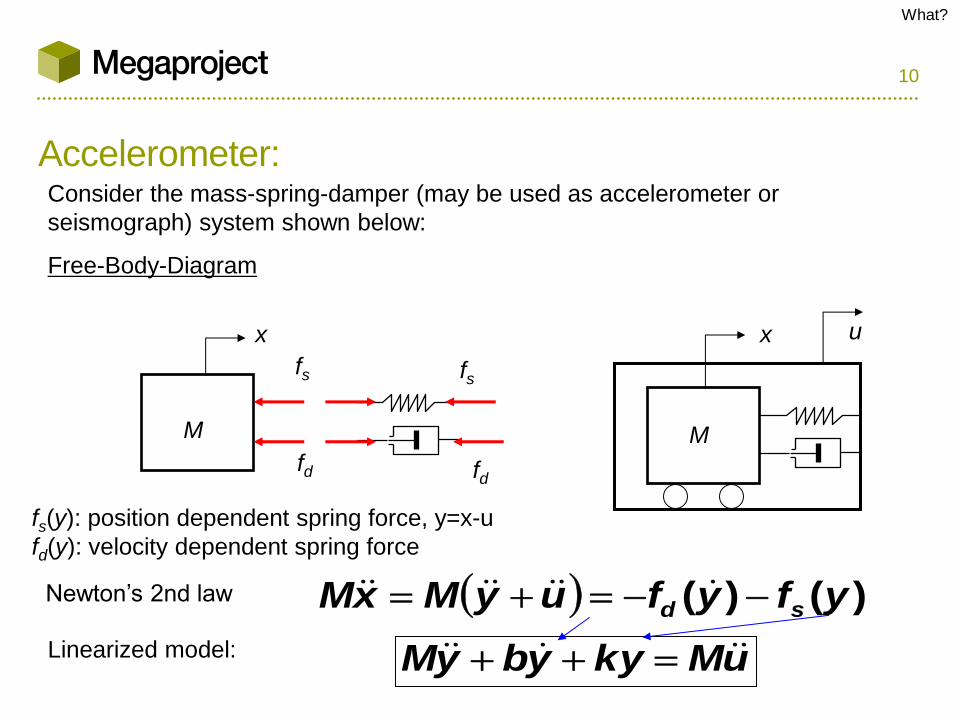
Accelerometer: Consider the mass-spring-damper (may be used as accelerometer or
seismograph) system shown below:
Free-Body-Diagram
M
fs
fd
fs
fd
x
fs(y): position dependent spring force, y=x-u
fd(y): velocity dependent spring force
Newton’s 2nd law )()( yfyfuyMxM sd
Linearized model: uMkyybyM
M
u x
What?
11
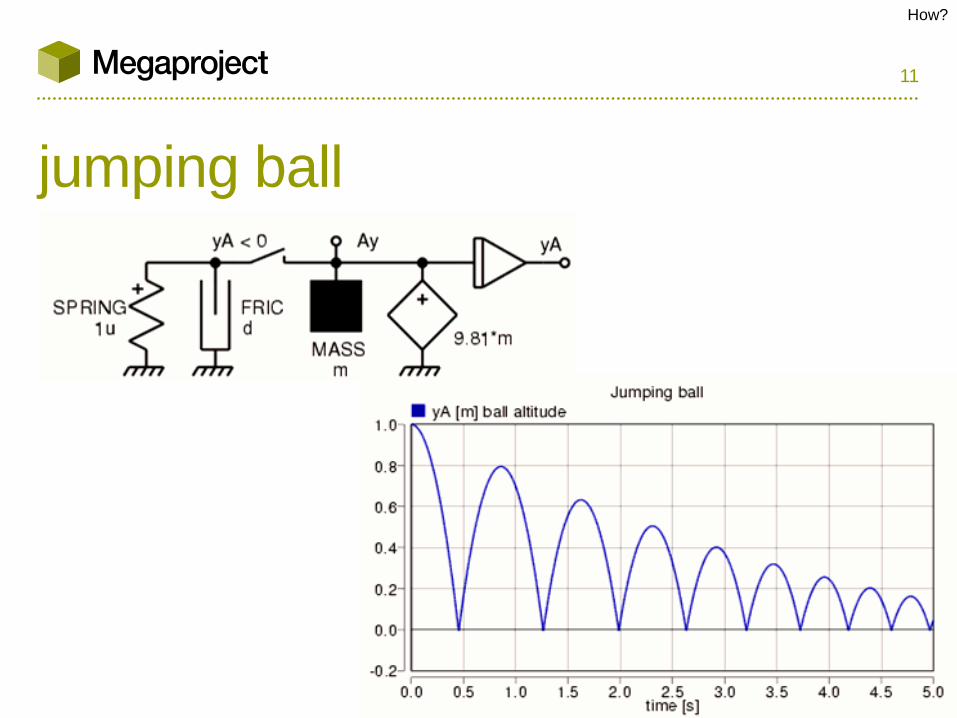
jumping ball
How?
12
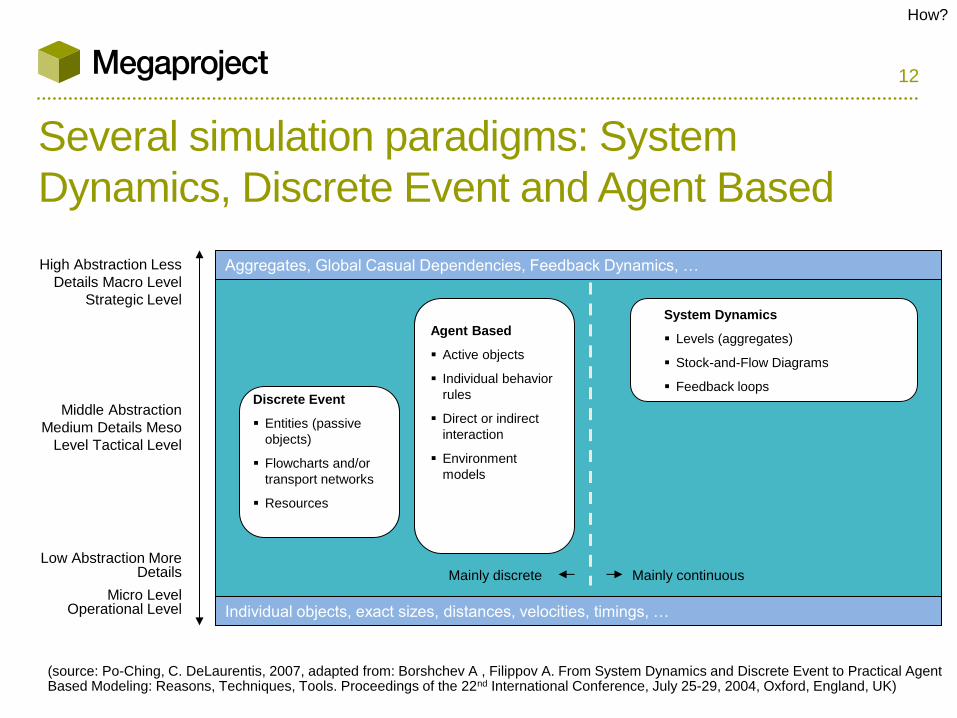
Several simulation paradigms: System
Dynamics, Discrete Event and Agent Based
High Abstraction Less
Details Macro Level
Strategic Level
Middle Abstraction
Medium Details Meso
Level Tactical Level
Low Abstraction More Details
Micro Level Operational Level Individual objects, exact sizes, distances, velocities, timings, …
Agent Based
Active objects
Individual behavior
rules
Direct or indirect
interaction
Environment
models
Discrete Event
Entities (passive
objects)
Flowcharts and/or
transport networks
Resources
Aggregates, Global Casual Dependencies, Feedback Dynamics, …
Mainly discrete
System Dynamics
Levels (aggregates)
Stock-and-Flow Diagrams
Feedback loops
Mainly continuous
(source: Po-Ching, C. DeLaurentis, 2007, adapted from: Borshchev A , Filippov A. From System Dynamics and Discrete Event to Practical Agent Based Modeling: Reasons, Techniques, Tools. Proceedings of the 22nd International Conference, July 25-29, 2004, Oxford, England, UK)
How?
13
systems dynamics a methodology to explore complexity, interconnectedness, and change over time
that provides a framework in which to apply the idea of systems theory to social
and economic problems
developed at MIT in the late 1950s (based cybernetics, industrial dynamics, control
theories)
uses 2 analysis tools
• Causal-loop diagrams (i.e., cause-effect diagrams CLD)
• Stock-flow diagrams (SFD)
the system is modeled as a set of continuous variables
• differential equations
• hydraulic models analogy
availability of several models since1956
easy to model, effective as a communication and sharing tool
limited development time and cost
How?
14
systems dynamics
“The study of information-feedback characteristics of industry activity
to show how organizational structure, amplification (in policies), and
time delays (in decisions and actions) interact to influence the success
of the enterprise” (Jay Forrester 1958 and 1961)
How?
15
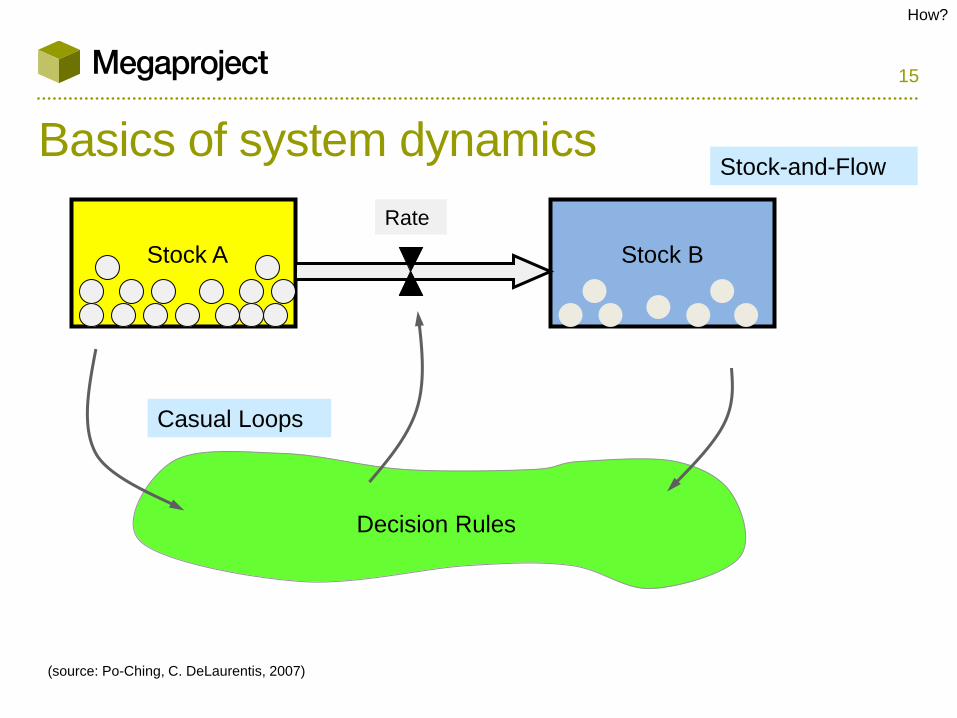
Basics of system dynamics
(source: Po-Ching, C. DeLaurentis, 2007)
Stock A Stock B
Rate
Decision Rules
Stock-and-Flow
Casual Loops
How?
16
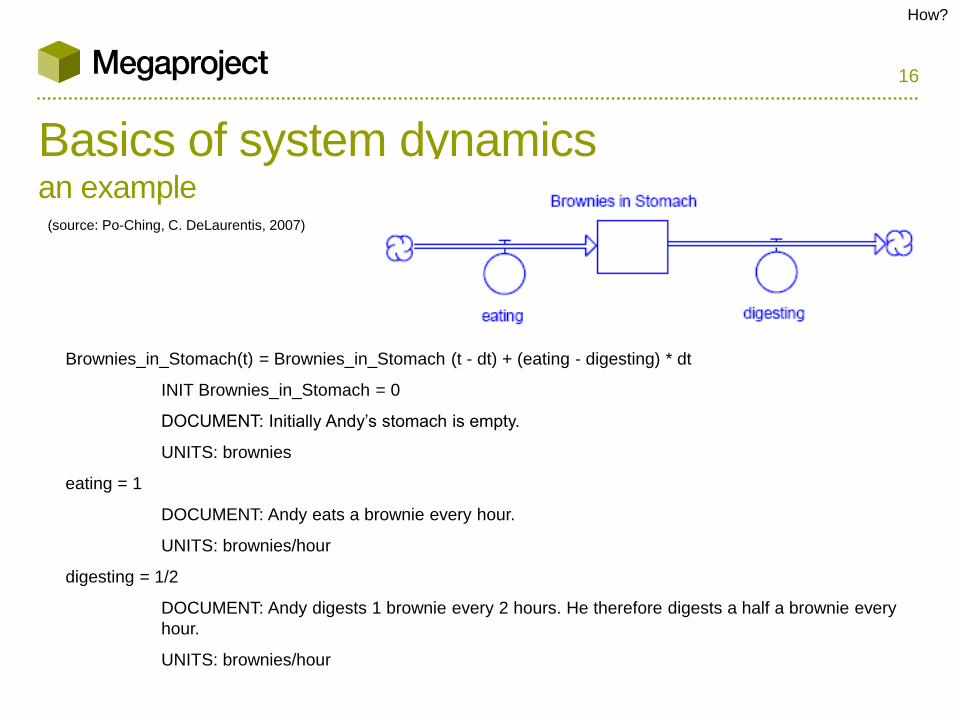
Basics of system dynamics an example
(source: Po-Ching, C. DeLaurentis, 2007)
Brownies_in_Stomach(t) = Brownies_in_Stomach (t - dt) + (eating - digesting) * dt
INIT Brownies_in_Stomach = 0
DOCUMENT: Initially Andy’s stomach is empty.
UNITS: brownies
eating = 1
DOCUMENT: Andy eats a brownie every hour.
UNITS: brownies/hour
digesting = 1/2
DOCUMENT: Andy digests 1 brownie every 2 hours. He therefore digests a half a brownie every
hour.
UNITS: brownies/hour
How?
17
steps in system dynamics modeling
Identify a problem
Develop a dynamic hypothesis explaining the cause of the problem
Create a basic structure of a causal graph
Augment the causal graph with more information
Convert the augmented causal graph to a system dynamics flow graph
Translate the system dynamics flow graph into equations and a SD
software modeling program
Use computer simulation to infer the behavior of the system
How?
18
some critical aspects
Determining the appropriate boundaries to define what should be
included within a system
Thinking in terms of cause-and-effect relationships
Focusing on the feedback linkages among components of a system
How?
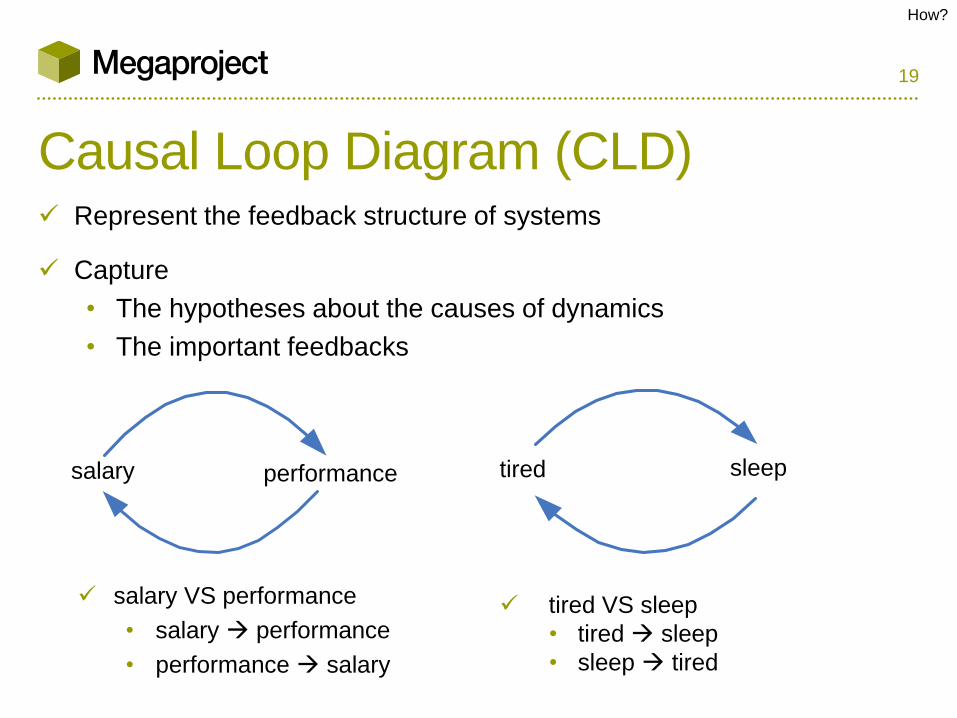
19
Causal Loop Diagram (CLD) Represent the feedback structure of systems
Capture
• The hypotheses about the causes of dynamics
• The important feedbacks
salary VS performance
• salary performance
• performance salary
tired VS sleep
• tired sleep
• sleep tired
salary performance tired sleep
How?
20
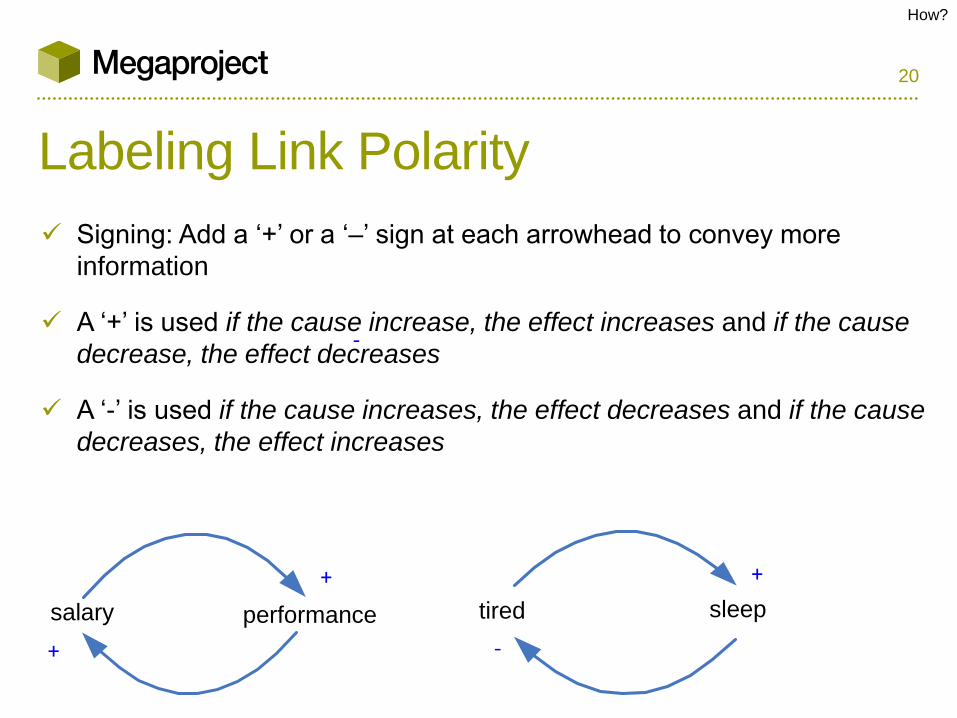
Labeling Link Polarity
salary performance tired sleep
+
+
+
-
-
Signing: Add a ‘+’ or a ‘–’ sign at each arrowhead to convey more
information
A ‘+’ is used if the cause increase, the effect increases and if the cause
decrease, the effect decreases
A ‘-’ is used if the cause increases, the effect decreases and if the cause
decreases, the effect increases
How?
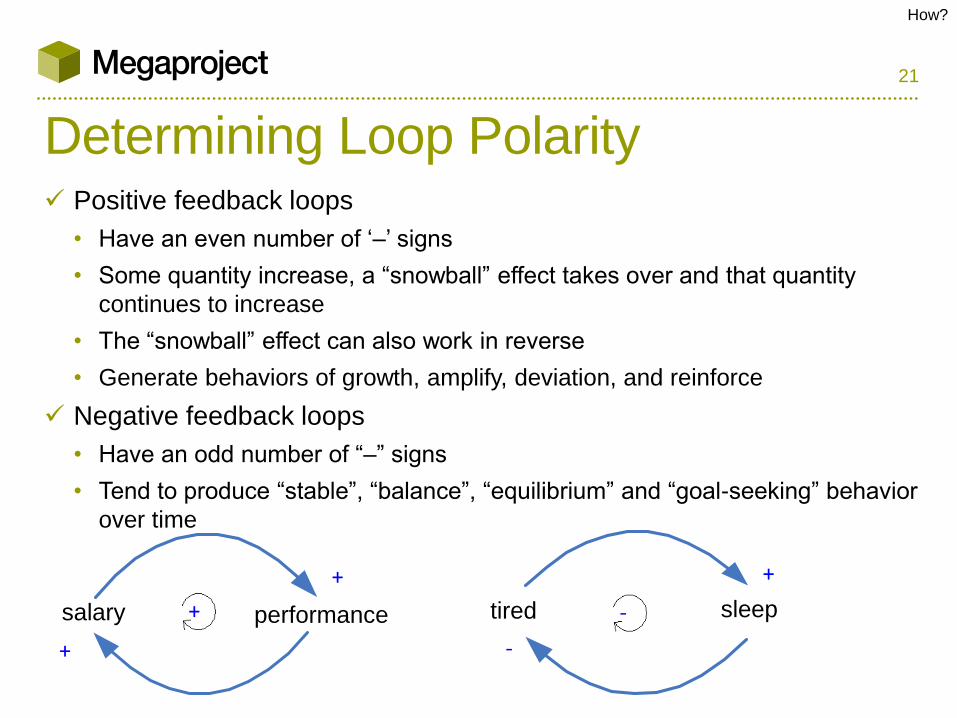
21
Determining Loop Polarity Positive feedback loops
• Have an even number of ‘–’ signs
• Some quantity increase, a “snowball” effect takes over and that quantity
continues to increase
• The “snowball” effect can also work in reverse
• Generate behaviors of growth, amplify, deviation, and reinforce
Negative feedback loops
• Have an odd number of “–” signs
• Tend to produce “stable”, “balance”, “equilibrium” and “goal-seeking” behavior
over time
salary performance tired sleep
+
+
+
-
+ -
How?
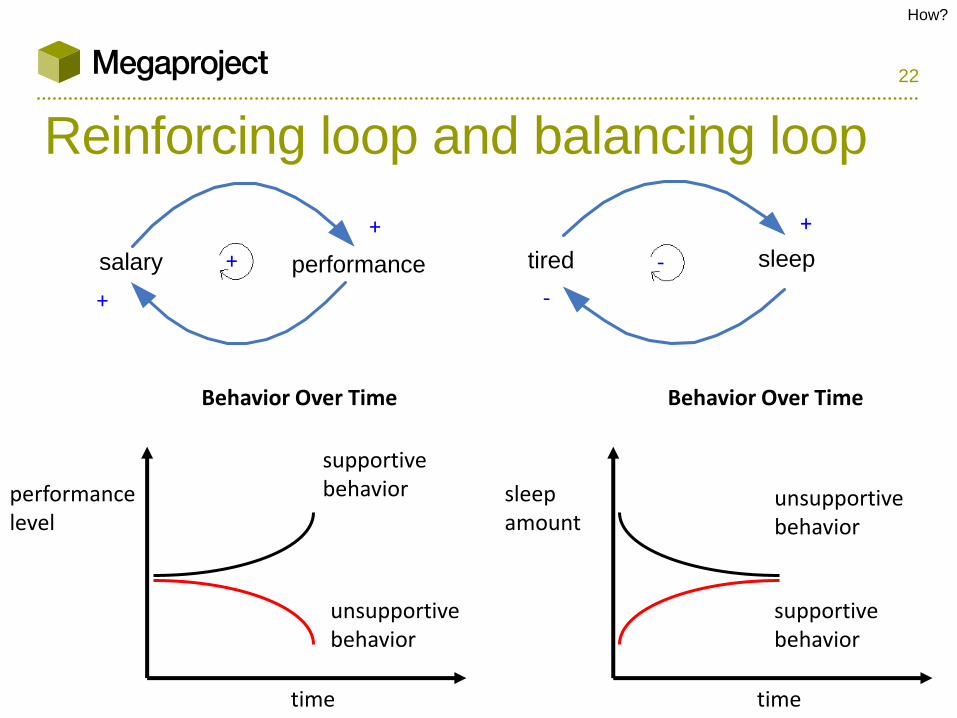
22
Reinforcing loop and balancing loop
salary performance tired sleep
+
+
+
-
+ -
unsupportive behavior
time
Behavior Over Time
supportive behavior performance
level unsupportive behavior
time
Behavior Over Time
supportive behavior
sleep amount
How?
23
Loop Dominance There are systems which have more than one feedback loop within
them
A particular loop in a system of more than one loop is most
responsible for the overall behavior of that system
The dominating loop might shift over time
When a feedback loop is within another, one loop must dominate
Stable conditions will exist when negative loops dominate positive
loops
How?
24
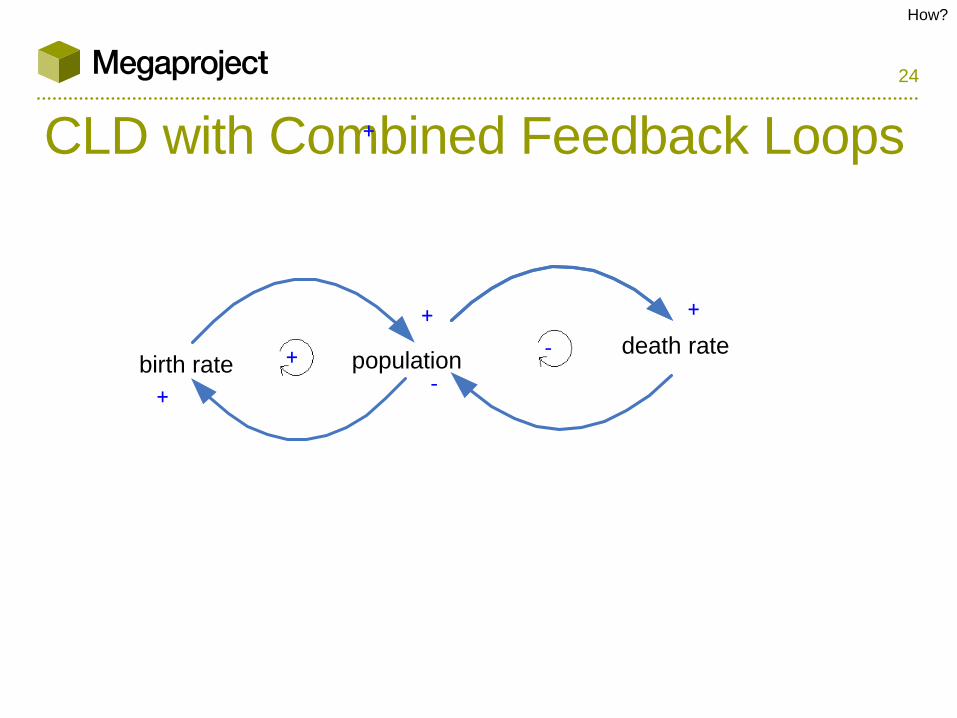
CLD with Combined Feedback Loops +
birth rate population
+
+ death rate
+
-
-
+
How?
25
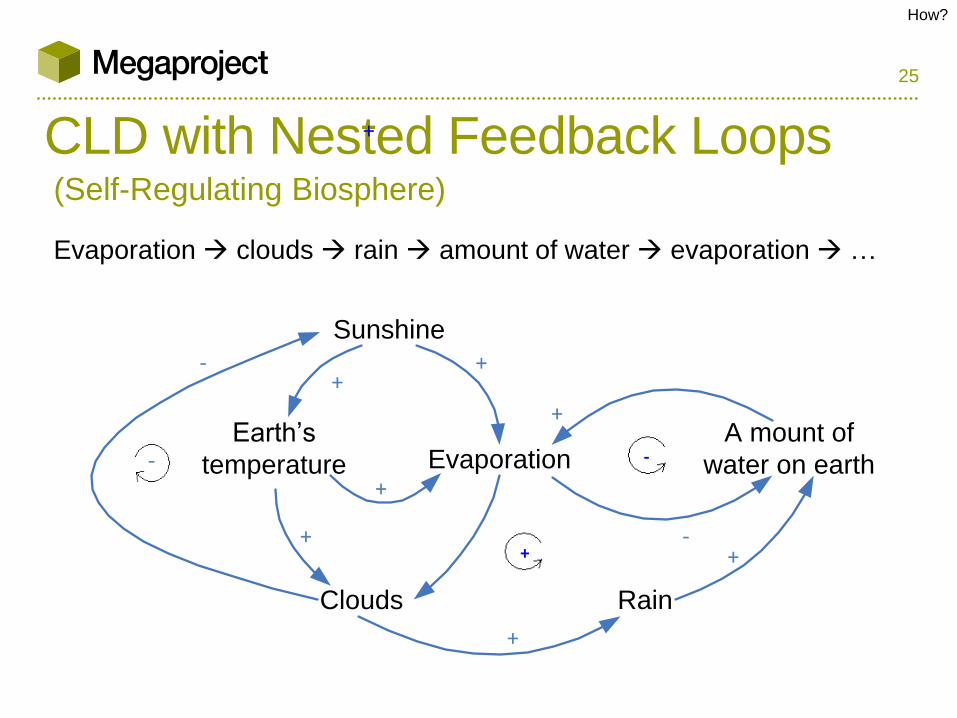
CLD with Nested Feedback Loops +
Evaporation clouds rain amount of water evaporation …
Sunshine
EvaporationA mount of
water on earth
RainClouds
Earth’s
temperature-
+
-
-
-
+
+
+
+
+
+
+
(Self-Regulating Biosphere)
How?
26
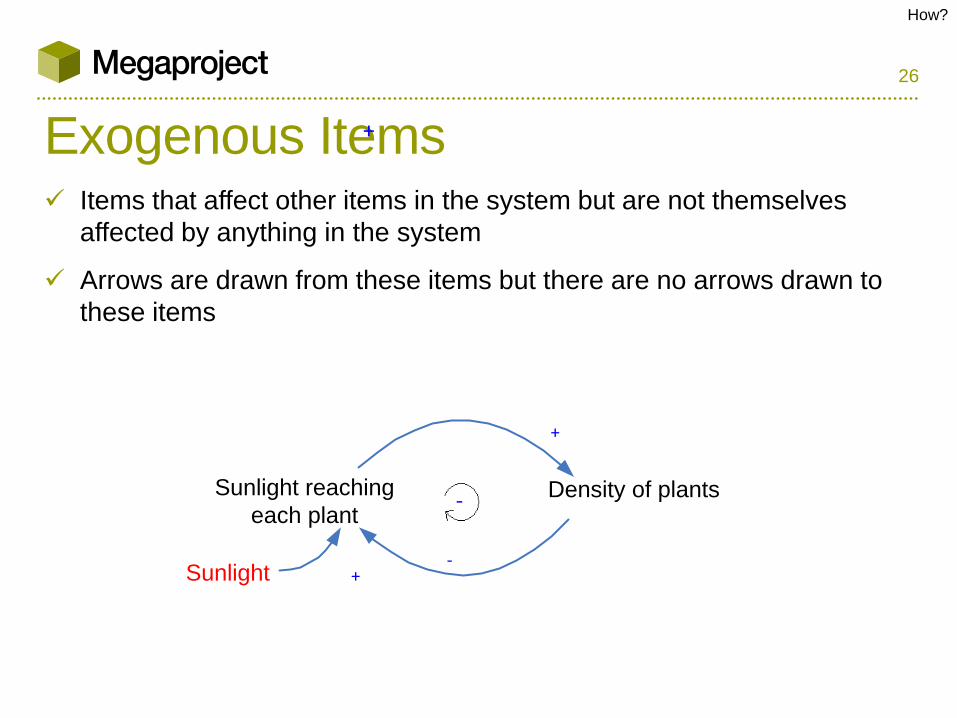
Exogenous Items +
Items that affect other items in the system but are not themselves
affected by anything in the system
Arrows are drawn from these items but there are no arrows drawn to
these items
Sunlight reaching
each plantDensity of plants
Sunlight +
+
-
-
How?
27
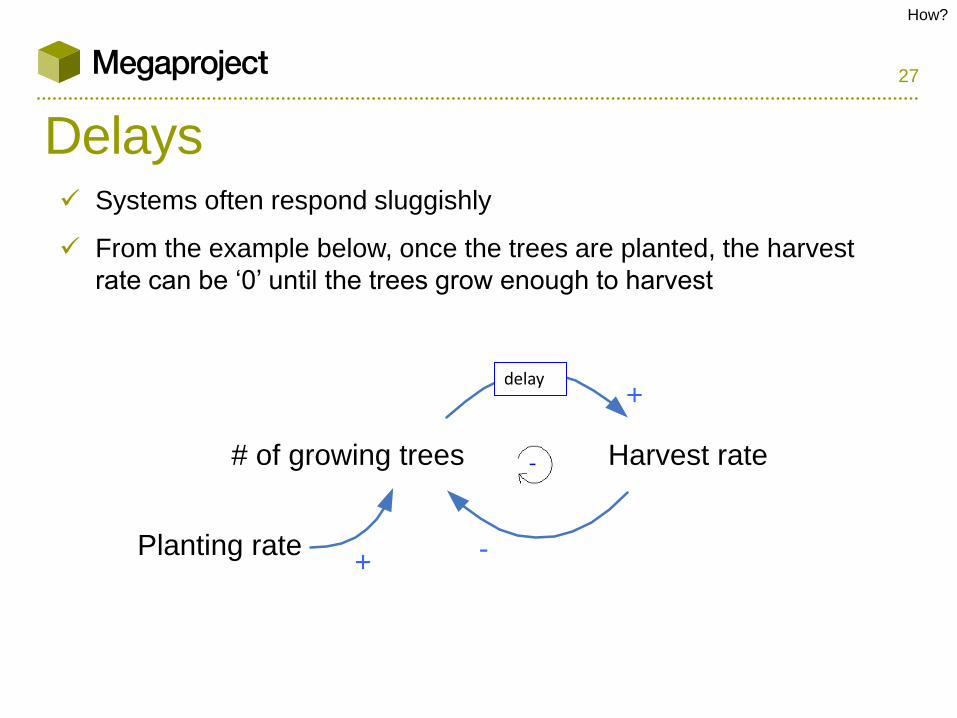
Delays Systems often respond sluggishly
From the example below, once the trees are planted, the harvest
rate can be ‘0’ until the trees grow enough to harvest
# of growing trees Harvest rate
Planting rate+
+
-
-
delay
How?
28
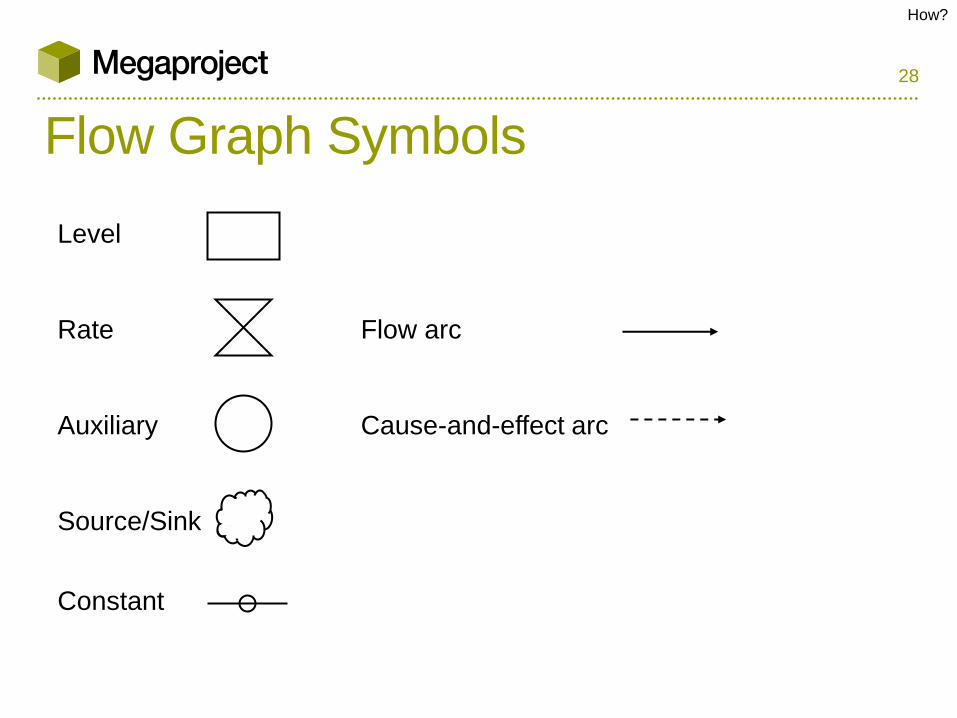
Flow Graph Symbols
Level
Rate
Auxiliary
Source/Sink
Constant
Flow arc
Cause-and-effect arc
How?
29
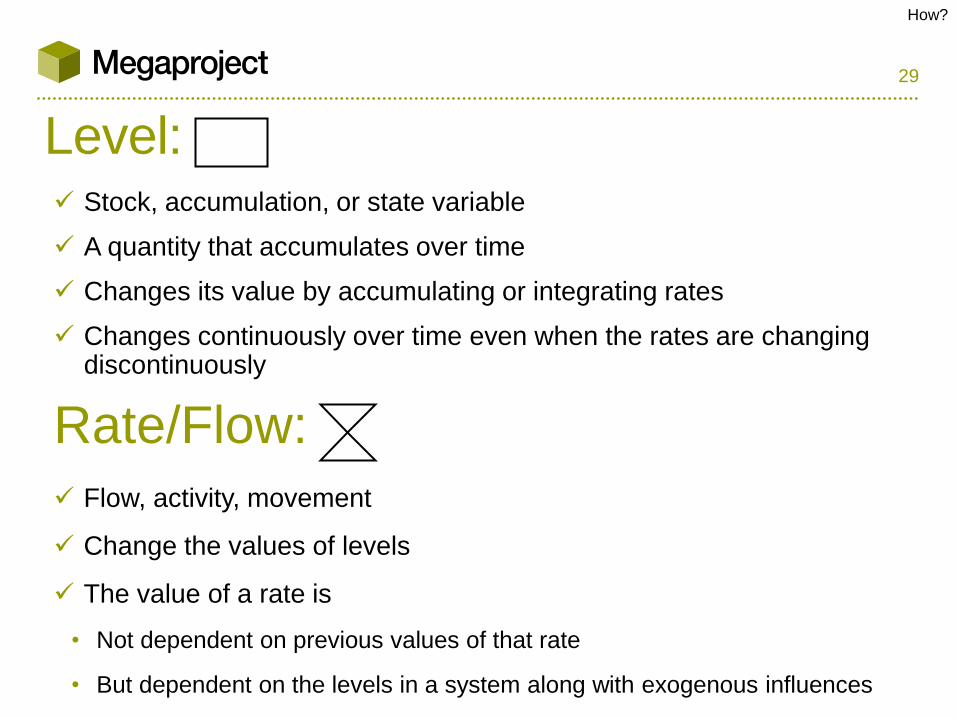
Level: Stock, accumulation, or state variable
A quantity that accumulates over time
Changes its value by accumulating or integrating rates
Changes continuously over time even when the rates are changing discontinuously
Rate/Flow:
Flow, activity, movement
Change the values of levels
The value of a rate is
• Not dependent on previous values of that rate
• But dependent on the levels in a system along with exogenous influences
How?
30
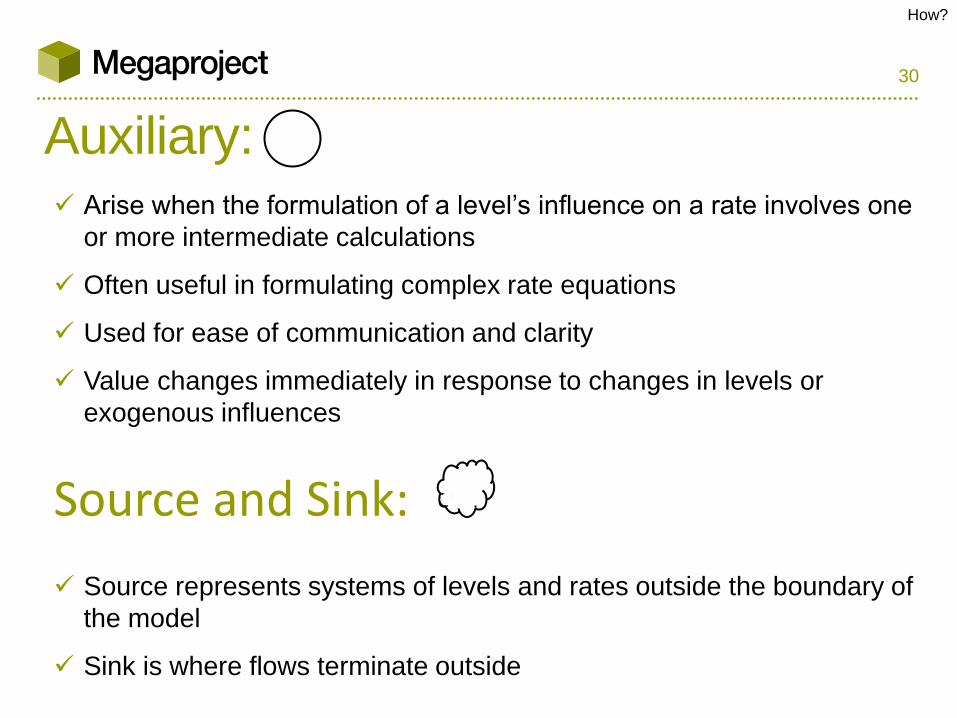
Auxiliary: Arise when the formulation of a level’s influence on a rate involves one
or more intermediate calculations
Often useful in formulating complex rate equations
Used for ease of communication and clarity
Value changes immediately in response to changes in levels or
exogenous influences
Source and Sink:
Source represents systems of levels and rates outside the boundary of
the model
Sink is where flows terminate outside
How?
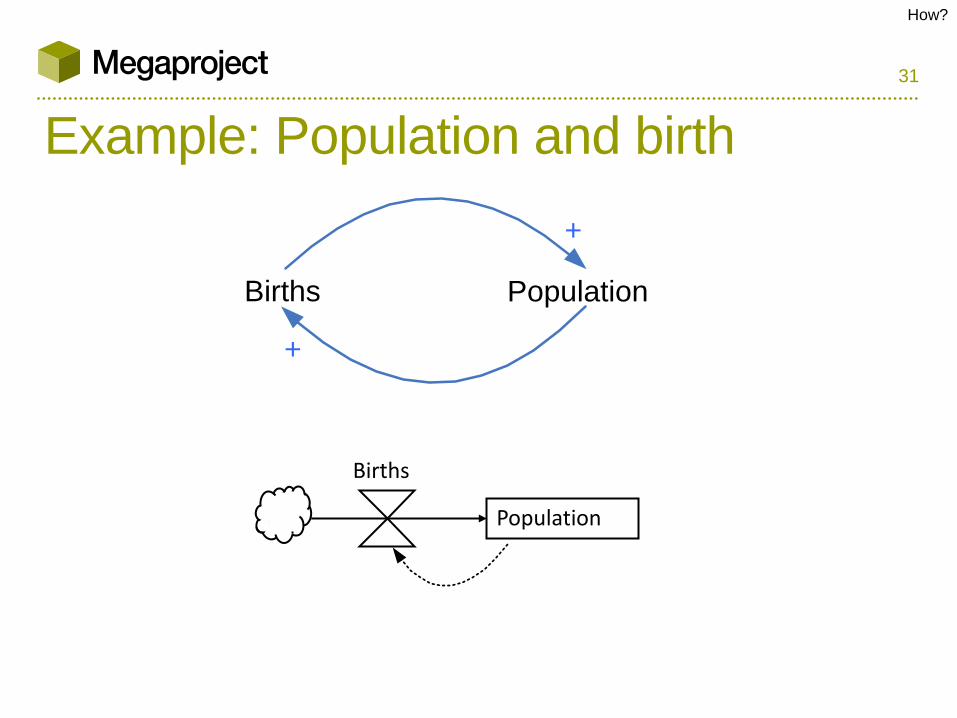
31
Example: Population and birth
+
+
Births Population
Births
Population
How?
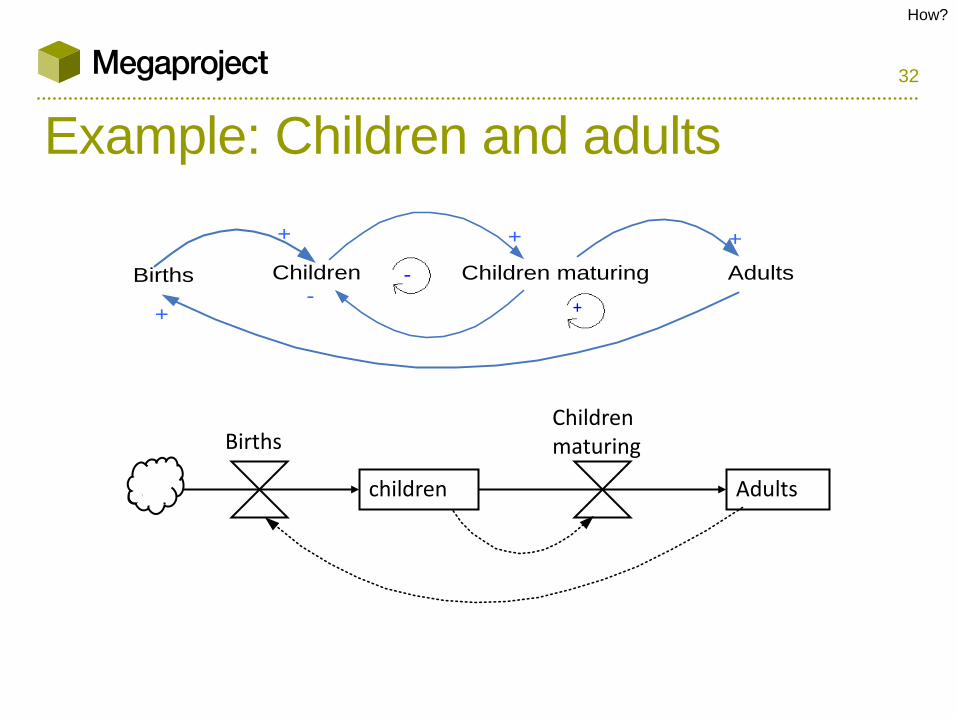
32
Example: Children and adults
Births Children Children maturing Adults
+ + +
+-
+
-
Births
children
Children maturing
Adults
How?
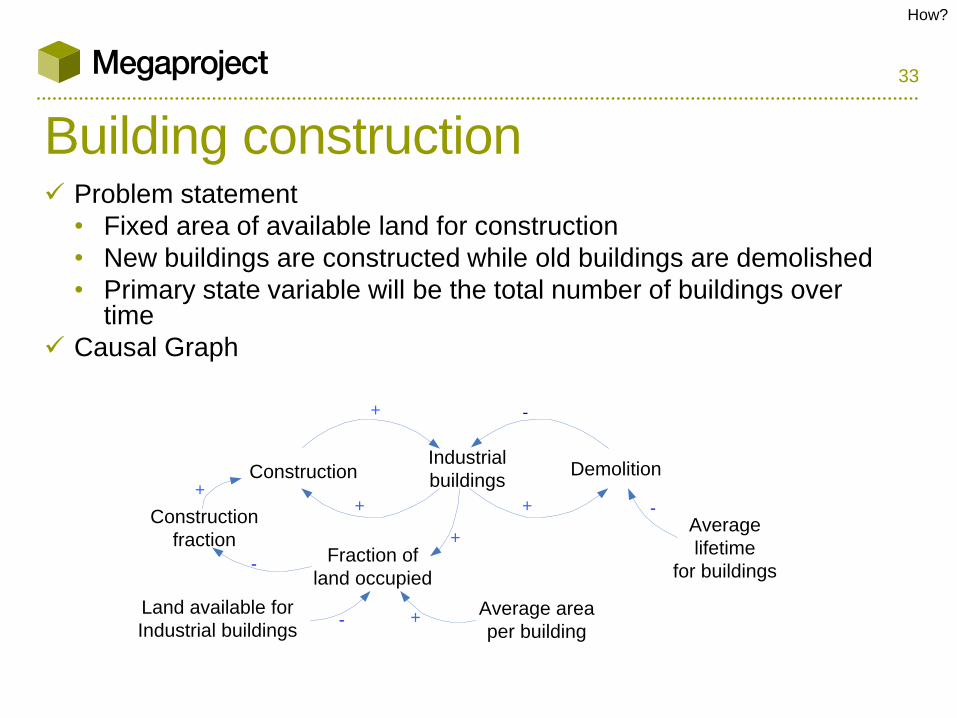
33
Building construction Problem statement
• Fixed area of available land for construction
• New buildings are constructed while old buildings are demolished
• Primary state variable will be the total number of buildings over time
Causal Graph
Industrial
buildingsDemolitionConstruction
Fraction of
land occupied
Construction
fractionAverage
lifetime
for buildings
Average area
per building
Land available for
Industrial buildings
+
+
+
+
++ -
-
-
-
How?
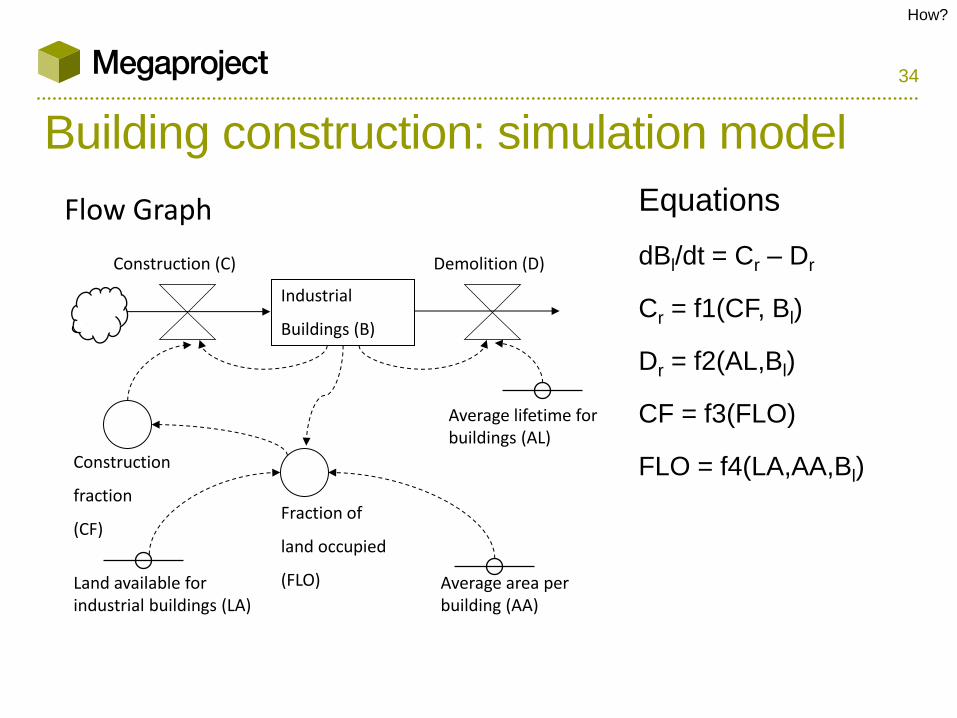
34
Building construction: simulation model
Industrial
Buildings (B)
Construction (C) Demolition (D)
Construction
fraction
(CF) Fraction of
land occupied
(FLO) Land available for industrial buildings (LA)
Average area per building (AA)
Average lifetime for buildings (AL)
Equations
dBl/dt = Cr – Dr
Cr = f1(CF, Bl)
Dr = f2(AL,Bl)
CF = f3(FLO)
FLO = f4(LA,AA,Bl)
Flow Graph
How?
35
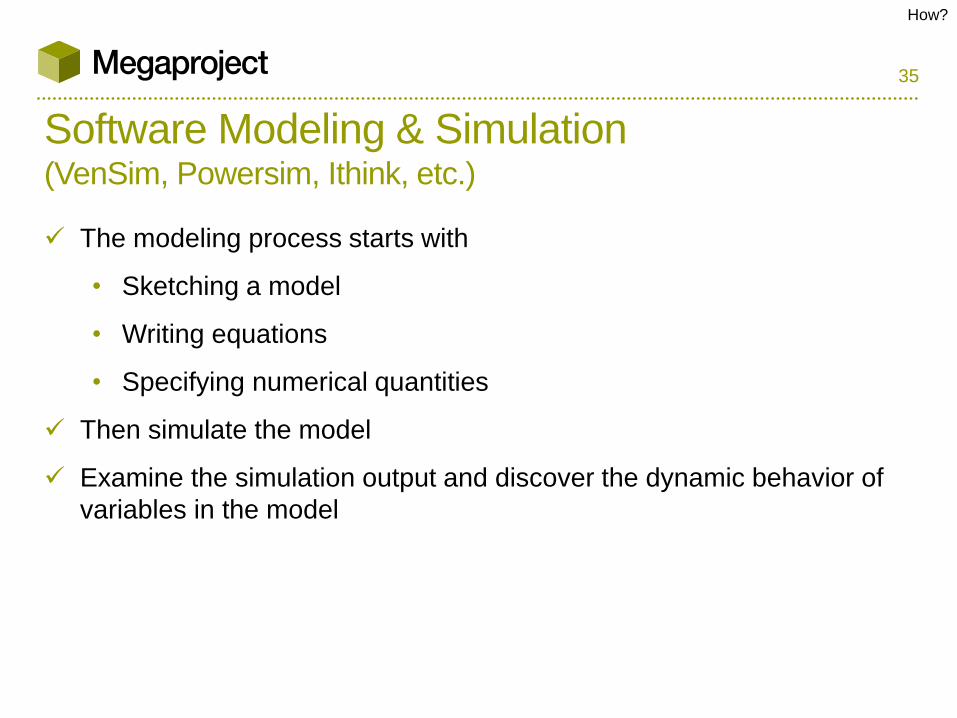
Software Modeling & Simulation (VenSim, Powersim, Ithink, etc.)
The modeling process starts with
• Sketching a model
• Writing equations
• Specifying numerical quantities
Then simulate the model
Examine the simulation output and discover the dynamic behavior of
variables in the model
How?
36
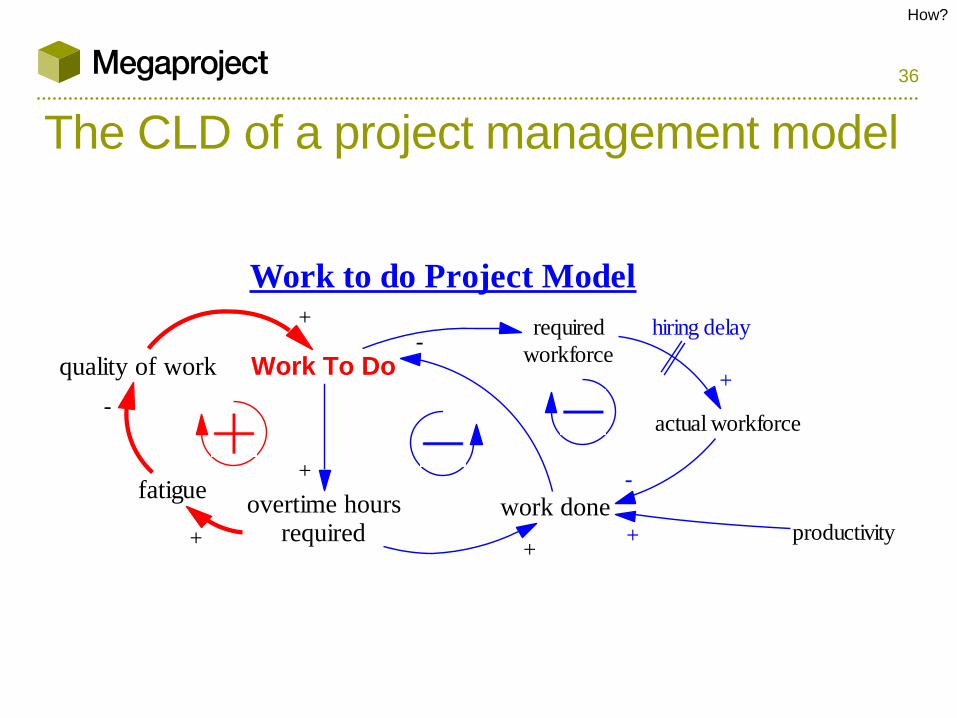
The CLD of a project management model
Work To Do
work doneovertime hoursrequired
quality of work
fatigue
+-
+
++
-
Work to do Project Model
required
workforce
actual workforce
productivity+
-
+
hiring delay
How?
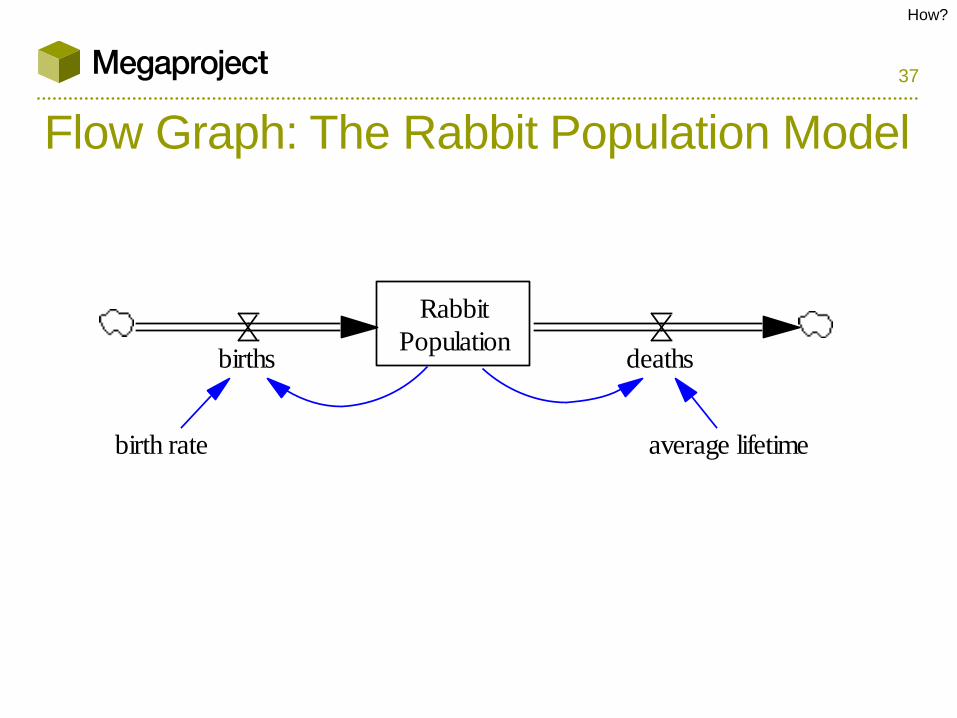
37
Flow Graph: The Rabbit Population Model
Rabbit
Populationbirths deaths
birth rate average lifetime
How?
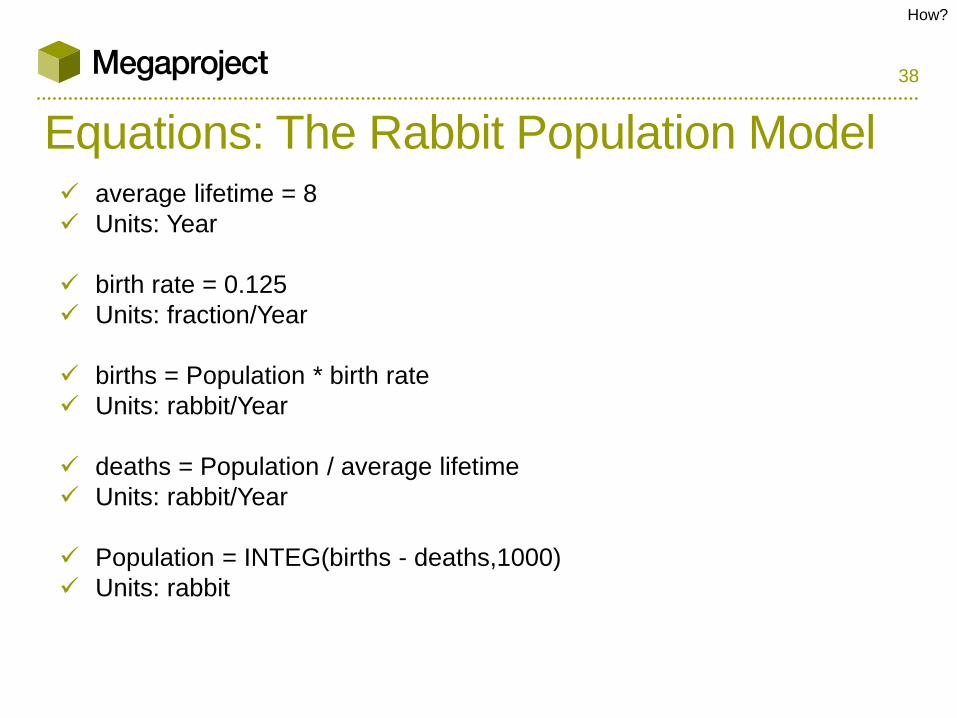
38
Equations: The Rabbit Population Model average lifetime = 8
Units: Year
birth rate = 0.125
Units: fraction/Year
births = Population * birth rate
Units: rabbit/Year
deaths = Population / average lifetime
Units: rabbit/Year
Population = INTEG(births - deaths,1000)
Units: rabbit
How?
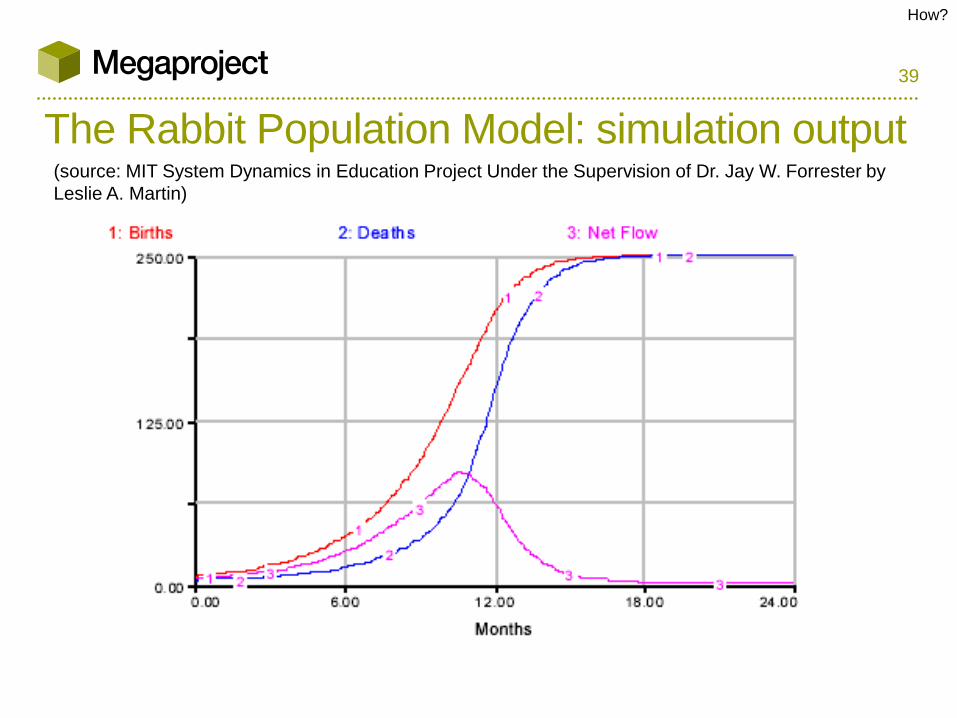
39
The Rabbit Population Model: simulation output (source: MIT System Dynamics in Education Project Under the Supervision of Dr. Jay W. Forrester by
Leslie A. Martin)
How?
40
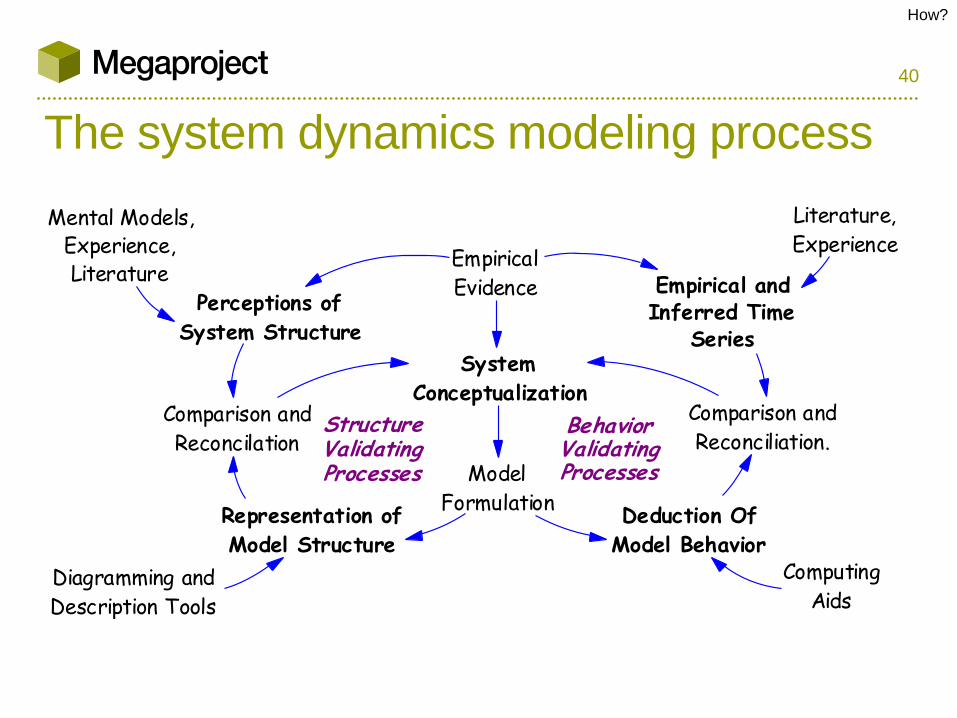
The system dynamics modeling process
Empirical
Evidence
System
Conceptualization
Model
FormulationRepresentation of
Model Structure
Comparison and
Reconcilation
Perceptions of
System Structure
Mental Models,Experience,Literature
Literature,
Experience
Empirical andInferred Time
Series
Comparison and
Reconciliation.
Deduction Of
Model Behavior
Diagramming and
Description Tools
Computing
Aids
StructureValidatingProcesses
BehaviorValidatingProcesses
How?
41
How?

42
Thank you!