Embed Size (px)
Citation preview

THE INVESTMENT PROCESS ■
AN INTRODUCTION TO STRUCTURED STRATEGIES by CataMetrics

Copyright © 2016, 2017 CataMetrics Management, LLC.All rights reserved. No part of this publication may be reproduced, stored in a retrieval system, or transmitted, in any form or by any means, electronic, mechanical, photocopying, recording or otherwise, without the prior written permission of the copyright holder.
Printed in the United States of America.

An Introduction to Structured Strategies by CataMetrics | 3
ContentsIntroduction ........................................................................................................................ 4
The Theory Underpinning Structured Strategies .............................. 5Markowitz’s bullet ........................................................................................................................ 5Tobin and the portfolio separation theorem ......................................................................... 6Sharpe and the market portfolio .............................................................................................. 7
A Good-Enough Model ................................................................................................ 9
The Global Market Portfolio and its Investible Representation .............................................................................................................12The Global Market Portfolio .....................................................................................................13The investible Global Market Portfolio ..................................................................................15The tracking portfolio through time ......................................................................................16
The Structured Strategies ................................................................................... 17The mechanics of the Structured Strategies ........................................................................19
Structured Strategies in a Nutshell ............................................................. 21
Disclosures and Disclaimers .............................................................................. 22

4 | An Introduction to Structured Strategies by CataMetrics
Structured Strategies by CataMetrics give investors access to cost-e�icient investment strategies that aim to reflect the exposures of the Global Market Portfolio and higher-risk portfolios along the investment envelope. Structured
Strategies are low-cost because the investment portfolios are constructed with ETFs that provide some of the lowest expense ratios and tightest bid-o�er spreads available, and the strategies have low turnover.
Structured Strategies are firmly grounded in financial theory and are a transparent, practical rendering of Modern Portfolio Theory.

An Introduction to Structured Strategies by CataMetrics | 5
The Theory Underpinning Structured StrategiesModern Portfolio Theory (MPT) o�ers a systematic and comprehensive methodology for the analysis and construction of investment portfolios. The influence of MPT on investors, and on the very structure of the asset-management industry, can hardly be overestimated—the insights that MPT o�ers form the foundation of principles that govern the advice that investment advisors o�er their clients and informs the management and structure of the trillions of dollars of retirement assets under ERISA.
MPT provides a rich framework, and as such, has had many contributors over several decades.1 The elements of MPT that have direct bearing on our Structured Strategies originated in three early seminal papers: Harry Markowitz in 1952,2 James Tobin in 1958,3 and William Sharpe in 1964.4, 5 Indeed, the cumulative insights of these three papers form the kernel of the Capital Asset Pricing Model (CAPM).
Markowitz’s bulletMarkowitz’s early contribution was the insight that if risky assets can be characterized with their expected returns and volatility, as well as their return correlations to every other risky asset, there exists an investment frontier representing portfolios with the lowest level of risk for a given level of expected return. This frontier, which is expressed as a hyperbola, is sometimes referred to as ‘Markowitz’s bullet’ and is shown as the crimson graph in Diagram 1.
Only the upper part of the frontier—the part of the hyperbola that shows portfolios with expected returns higher than the return for the minimum-volatility portfolio—is meaningful for an investor to contemplate; the lower, dotted part of the hyperbola can be described as the ‘ine�icient frontier’. In Markowitz’s framework, an investor would evaluate the risk and expected return along the upper part of the frontier and then select the point on the frontier that for the investor would represent the optimal trade-o� between risk and expected return.
1 The foundational nature of the contributions to MPT has earned, over the years, distinguished awards for several of its creators: Markowitz, Tobin, and Sharpe have all been awarded the Prize in Economic Sciences in the Memory of Alfred Nobel as well as a host of other honors.
2 Harry Markowitz, “Portfolio Selection,” Journal of Finance 7, no. 1 (1952): 77–91, 1952; also Portfolio Selection: E�icient Diversification of Investments (John Wiley and Sons, 1959, reprinted by Yale University Press, 1970).
3 James Tobin, “Liquidity Preference as Behavior Towards Risk,” Review of Economic Studies 25, no. 2 (1958): 65–86.
4 William F. Sharpe, “Capital Asset Prices: A Theory of Market Equilibrium under Conditions of Risk,” Journal of Finance 19, no. 3 (1964): 425–42.
5 The papers by Markowitz, Tobin, and Sharpe are not the easiest of reads but thankfully there is Mark Rubinstein’s A History of the Theory of Investments: My Annotated Bibliography (John Wiley & Sons, 2006).

6 | An Introduction to Structured Strategies by CataMetrics
■ THE THEORY UNDERPINNING STRUCTURED STRATEGIES
While the crimson bullet makes for a nice, neat diagram, estimating the actual shape and location of the frontier is a trickier matter. It is hard enough for an investor to estimate the risk and the expected return of an asset: Estimating the forward-looking correlation matrix is nigh impossible.
There exists a solution to the estimation problem, but first some more theory.
Tobin and the portfolio separation theoremThe next major step in the development of MPT comes with the addition of a risk-free asset and the recognition that investors can both leverage up by borrowing and de-leverage by allocating some of their assets to the risk-free asset.
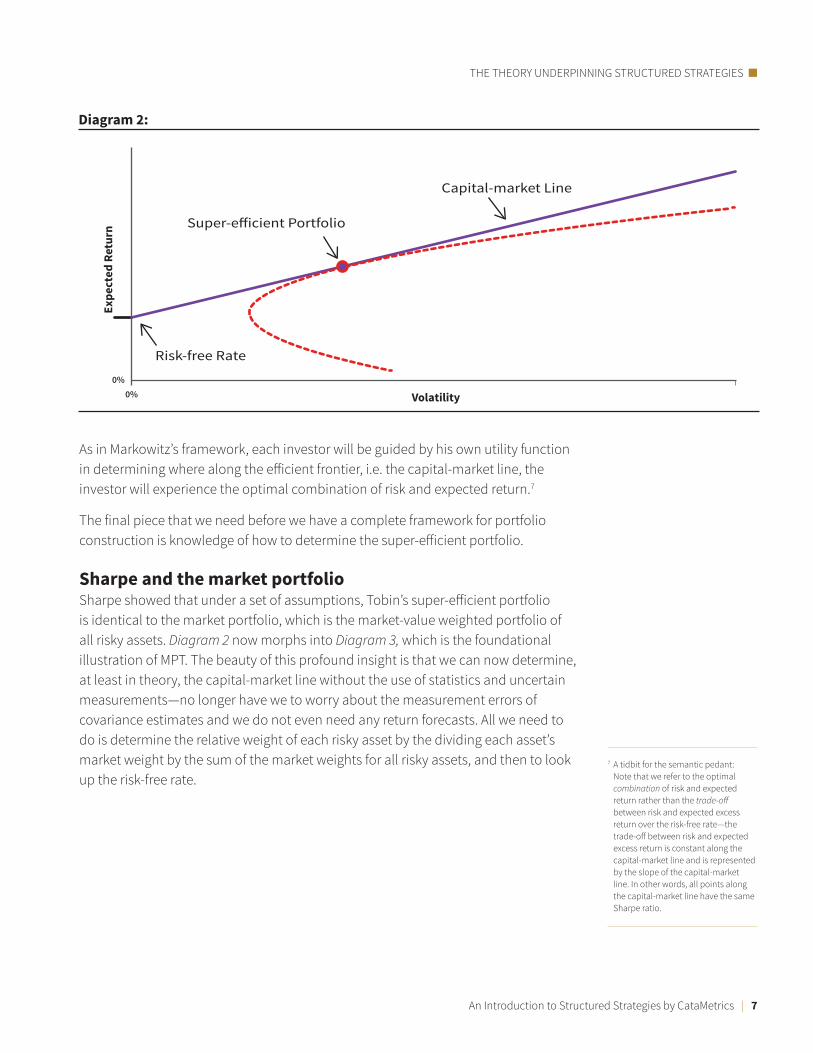
This ability of investors to borrow and to lend (to the government by buying the risk-free asset) expands the e�icient frontier in Diagram 1 by adding a tangential line to Markowitz’s bullet: The new minimum volatility portfolio is the risk-free asset; an investor can now, by choosing to lend to the government or by borrowing, reach any point on the purple line in Diagram 2. This tangential line is known as the capital-market line and it coincides with Markowitz’s bullet at one point only which is the tangency portfolio, a portfolio also known as the ‘super-e�icient portfolio’.6
The meaning of the separation theorem is that since all portfolios lie on the capital-market line, all investors who invest any amount in risky assets will have their risky assets allocated in the same manner as in the super-e�icient portfolio. In other words, the amount of risk that an investor is willing to assume is separate from the composition of the risky portfolio allocation—all investors’ risky portfolios are identical in composition.
6 Interestingly enough, neither the word ‘super’ nor ‘e�icient’ is present in Tobin’s article.
0%0%
Volatility
Expe
cted
Ret
urn
Diagram 1:
E�icient Frontier
Minimum-volatilityPortfolio
Markowitz’s Bullet
Ine�icient Frontier
An Introduction to Structured Strategies by CataMetrics | 7
THE THEORY UNDERPINNING STRUCTURED STRATEGIES ■
As in Markowitz’s framework, each investor will be guided by his own utility function in determining where along the e�icient frontier, i.e. the capital-market line, the investor will experience the optimal combination of risk and expected return.7
The final piece that we need before we have a complete framework for portfolio construction is knowledge of how to determine the super-e�icient portfolio.
Sharpe and the market portfolioSharpe showed that under a set of assumptions, Tobin’s super-e�icient portfolio is identical to the market portfolio, which is the market-value weighted portfolio of all risky assets. Diagram 2 now morphs into Diagram 3, which is the foundational illustration of MPT. The beauty of this profound insight is that we can now determine, at least in theory, the capital-market line without the use of statistics and uncertain measurements—no longer have we to worry about the measurement errors of covariance estimates and we do not even need any return forecasts. All we need to do is determine the relative weight of each risky asset by the dividing each asset’s market weight by the sum of the market weights for all risky assets, and then to look up the risk-free rate.
0%0%
Volatility
Expe
cted
Ret
urn
Diagram 2:
Capital-market Line
Super-e�icient Portfolio
Risk-free Rate
7 A tidbit for the semantic pedant: Note that we refer to the optimal combination of risk and expected return rather than the trade-o� between risk and expected excess return over the risk-free rate—the trade-o� between risk and expected excess return is constant along the capital-market line and is represented by the slope of the capital-market line. In other words, all points along the capital-market line have the same Sharpe ratio.

8 | An Introduction to Structured Strategies by CataMetrics
■ THE THEORY UNDERPINNING STRUCTURED STRATEGIES
0%0%
Volatility
Expe
cted
Ret
urn
Diagram 3:
Capital-market Line
Market Portfolio
Risk-free Rate
This obviates the estimation problem: We can determine the set of optimal investment choices without the use of any statistics.

An Introduction to Structured Strategies by CataMetrics | 9
A Good-Enough ModelThe importance of MPT is that it gives us a framework within which to think about portfolio construction in a systematic and coherent fashion. The price for the insights that MPT o�ers is that the model requires a number of assumptions to hold—and many of these assumptions do not hold up, at least not strictly, in the real world.
Three notable sets of assumptions8 of MPT that deserve some reflection are:
1. The returns of all assets have to be normally distributed or all investors need to have quadratic utility functions.
2. Investors agree on the return assumptions, meaning that all investors agree on the distribution of expected returns as well as the return correlations of the assets in the market portfolio, and base their investment decisions entirely on these shared estimates of return distributions and return correlations.
3. All investors hold risky assets in the same relative proportions.
The reality, of course, is that asset-return distributions are not strictly normal. Many assets experience extended leª-hand tail events, of which we all are so painfully aware.9 Additionally, the alternative assumption of quadratic utility functions is at odds with how investors behave in the real world, in the sense that quadratic utility in the context of MPT implies that an investor becomes more risk averse with increasing wealth and so will allocate less, rather than more, to the market portfolio. Thus, neither assumption holds in the real world.
It is also true that investors do not agree on the expected joint distribution of asset returns, nor are investors guided solely by these joint distributions in making allocation decisions. Watching CNBC for a few hours during periods of market turmoil will illustrate both of these points.10
Finally, we have the fact that most investors hold portfolios that are quite di�erent from the global market portfolio in the sense that US investors tend to over-weight US assets relative to their share of the global market portfolio.11 Since there exists a plethora of investment funds through which US investors can access the international markets, this bias is a function of preferences rather than access; similar home-market biases are common across the globe.12
The market and investors thus behave materially di�erently from the assumptions that underlie MPT and the question therefore must be: Would an investment strategy based on the theoretical postulations of MPT—i.e. investing in a strategy where the allocations to risky assets reflect the composition of the market portfolio—provide the investor with the optimal trade-o� between expected return and risk? That is, in the real world, is the market portfolio close enough to being mean-variance e�icient
8 Some further assumptions of MPT are: Investors are rational in that for a given level of expected return they prefer the portfolio with the lowest level of risk, there are no transactions costs, investors do not di�erentiate between capital gains and dividend income, investors do not consider taxes when investing, and can borrow without restrictions at the risk-free rate.
9 For an empirical overview of equity return distributions, see
“The Time-Variant Risk of Equity Indices by CataMetrics”.
10 Or just tune in to Cramer for a few minutes.
11 For a detailed review of how home biases manifest themselves in some major markets, see Christopher B. Phillips, Francis M. Kinniry, Jr., and Scott J. Donaldson, “The role of home bias in global asset allocation decisions” (Vanguard Research: 2012).
12 One intuitive reason for home-market biases is that investors have future obligations in their home markets and it is reasonable to assume that over the longer term the size of these obligations is linked to the performance of domestic assets. For example, an investor’s future rent payments are a potential obligation that is likely to go up with rising domestic property prices and it is not unreasonable to expect property prices to rise as equity prices rise.

10 | An Introduction to Structured Strategies by CataMetrics
■ A GOOD-ENOUGH MODEL
for it to be a reasonable and worthwhile endeavor to build investment strategies around the market portfolio?
The fact that not all model assumptions hold does not mean that MPT is wrong, only that it does not hold strictly. The problem lies in being able to quantify the impact of the di�erences between the model assumptions and reality, in respect to the ability of the market portfolio to deliver a meaningfully close-to-optimal trade-o� between expected returns and risk.
Empirical testing of whether the market portfolio is mean-variance e�icient is a tricky business, and the first question is what makes up the market portfolio. In a seminal paper commonly referred to as ‘Roll’s Critique’,13 Richard Roll argues that in addition to readily marketable securities, the market portfolio should include all investor assets including unlisted securities, real estate, illiquid assets such as art and baseball card, and even human capital. Because the value and returns of the nonmarketable assets cannot be known, Roll argues, the mean-variance e�iciency of the market portfolio is not testable. However, on a more practical level, most investors would probably be satisfied to know that a market-weighted portfolio of tradable assets is mean-variance e�icient.
Roll also makes the point that testing CAPM, which, as we mentioned above, is a direct manifestation of MPT, is not the same as testing for the mean-variance e�iciency of the market portfolio: A test of CAPM for a market index with a selection of the index’s constituent stocks will only say something about the stocks used in the test sample—and the index they are part of—and has no implications for the market portfolio as a whole. Thus, a test of CAPM set in the US stock market, whether it rejects CAPM or not, does not tell us if a global market portfolio is mean-variance e�icient.
Market structure, including access to and the pricing of investment vehicles that give exposure to market segments both domestic and international, evolves constantly; these changes make it di�icult to interpret clearly empirical tests of the mean-variance e�iciency of various formulations of the market portfolio or of CAPM.14 Also, empirical research on mean-variance e�iciency and CAPM tends to span di�erent volatility regimes, and this variability of the volatility adds great di�iculty to drawing any firm conclusions about the outcomes of the tests.
A large body of tests of CAPM, primarily in the US market because of the availability of data, have indicated that CAPM does not hold and thus that the market indices included in the tests are not mean-variance e�icient.15 While, per Roll, these rejections of CAPM have no implication for the mean-variance e�iciency of the overall market portfolio, these results nevertheless put into question the usefulness of broader market-weighted portfolios as a foundation for investment strategies. Similarly, direct tests of the mean-variance e�iciency of major market benchmarks
13 Richard Roll, “A Critique of the Asset Pricing Theory’s Tests—Part I: On Past and Potential Testability of the Theory,” Journal of Financial Economics 4 (1997): 127–76.
14 For a particularly well-written and thorough overview of the methodological issues relating to the empirical testing of financial theories, see Andrew Ang, William N. Goetzmann, and Stephen M. Schaefer, “The E�icient Market Theory and Evidence: Implications for Active Investment Management,” Foundations and Trends in Finance 5, no. 3 (2011): 157–242.
15 For an authoritative overview of empirical testing of CAPM, see Eugene F. Fama and Kenneth R. French, “The Capital Asset Pricing Model: Theory and Evidence,” Journal of Economic Perspectives 18, no. 3 (2004): 25–46. Fama and French’s work on CAPM led to the development of the Fama-French three-factor model, has served as inspiration in the search for other risk factors, and provides a rationale for the active management of portfolios.
An Introduction to Structured Strategies by CataMetrics | 11
A GOOD-ENOUGH MODEL ■
have not supported the assumption that these benchmarks are mean-variance e�icient.16 Individual market benchmarks do not have to be mean-variance e�icient for a global market portfolio to be mean-variance e�icient, but as is the case with the tests of CAPM, mean-variance e�iciency certainly seems elusive.
We now have an interesting dichotomy: On the one hand, we have an elegant model widely used by the financial industry to construct globally-diversified passive portfolios; on the other hand, we have empirical financial research that does not clearly support the practical implementation of the theory.
The key to resolving this conflict lies in the insights laid out by Levy and Roll,17 who explored the e�ects of measurement errors in the testing of the mean-variance e�iciency of market benchmarks. The essence of Levy and Roll’s argument is that small changes to the parameter estimates in mean-variance e�iciency studies of market benchmarks can make the benchmarks mean-variance e�icient. The important word in the previous sentence is ‘small’ which in this context means that it would only take marginal changes to the parameter estimates—smaller than each parameter’s respective measurement error—to make a market benchmark mean-variance e�icient.
Levy and Roll, and here they clearly refer to Roll’s Critique, stress that the market-e�iciency results for individual market benchmarks are not the same as making a statement about the market-e�iciency of a global market portfolio. However, it follows that if one were to apply Levy and Roll’s approach to a global market portfolio of readily tradeable assets, there is little doubt that the results would carry over.18
All financial models are simplistic attempts to describe reality, and MPT is no exception. The theoretical assumptions of MPT do not hold strictly in the real world, but MPT appears to be robust with respect to these imperfections19 and is able to produce broad-based, cross-market, and cross asset-class market portfolios that o�er investors a risk-return trade-o� reasonably close to being mean-variance e�icient.
In other words, while not perfect, MPT is a good-enough model.20
16 See, for example, Richard C. Grinold, “Are Benchmark Portfolios E�icient?,” The Journal of Portfolio Management 19, no. 1 (1992): 34–40.
17 Moshe Levy and Richard Roll, “The Market Portfolio May Be Mean/Variance E�icient Aªer All,” Review of Financial Studies 23 (2010): 2461–91.
18 On a technical note, in their paper, Levy and Roll demonstrate their results without allowing adjustments to their correlation estimates. Correlation estimates tend to have relatively large measurement errors, so extending the adjustments to the correlation matrix would be powerful, but one would have to be careful not to let the adjustments cause the variance-covariance matrix to lose its positive-definitiveness. A global market portfolio contains more assets than does any standard market benchmark, so one should expect to be able to apply Levy and Roll’s methodology and determine mean-variance e�iciency with only a minimum of adjustments to the individual model parameters.
19 Another model that has proven itself to be very useful despite many of its assumptions being violated in the real world is the Black-Scholes model; see F. Black and M. Scholes, “The Pricing of Options and Corporate Liabilities,” Journal of Political Economy 81, no. 3 (1973): 637–57. It is worth noting that one central assumption of the Black-Scholes model is that the returns of an asset on which options are priced are log-normally distributed, and still, even though in reality log-normality is a tenuous proposition at best, the option-pricing model has proven itself to be robust in respect of this distributional assumption.
20 A ‘good-enough model’ is an analogue to a ‘good enough parent’
—neither modeling nor parenting has to be perfect in order to yield useful and satisfying outcomes; see D. W. Winnicott, The Child, the Family, and the Outside World (London: Pelican Books, 1964).

12 | An Introduction to Structured Strategies by CataMetrics
The Global Market Portfolio and its Investible RepresentationThe description of the market portfolio in the theoretical framework of MPT describes an assumed world in which the asset classes that make up said market portfolio are directly investible. In reality, however, an investor using low-cost ETFs cannot achieve all the granular exposures of a comprehensive theoretical global market portfolio—liquid and low-cost ETFs simply do not exist for all of the market portfolio’s tradeable constituent asset classes.
There exists no standard methodology for defining the market portfolio for the global market: the Global Market Portfolio (GMP). As we have seen, financial theory is primarily concerned with the overall framework within which a market portfolio exists, and o�ers little guidance in regard to which asset classes are meaningful for the investors of a particular strategy. Nor does theory specify how an asset class should be defined and measured and, consequently, no two providers of passive global strategies have the same rationale for which asset classes to include.
A large institutional investor has the means to seek out granular exposures in less liquid asset classes, whereas a GMP-based strategy for retail investors must consider how position minima a�ect the cost-e�ectiveness for a small investor. In addition, because retail investors may have greater needs for liquidity, it is important that a manager determine the investible GMP using highly liquid ETFs with tight spreads. An investor should thus be cognizant of the investment objectives that underpin any investment strategy that aims to track or outperform a GMP.21
A particular, and perhaps surprising, consideration that any investment manager has to address when constructing a GMP is how to define the meaning of ‘cash’. The GMP is made up of risky assets, so the practical question is how to delineate ‘cash’ from ‘bonds’. In the case of Structured Strategies, we estimate the GMP once per year, so implicit in our estimation cycle is that we have an investment horizon of one year. Correspondingly, returns for ‘bond assets’ with a maturity of less than a year are known, whether obligations of the US Treasury or commercial paper,22 and we therefore do not consider these assets to be risky.
It is also important to di�erentiate between what are traditionally called ‘asset classes’, on the one hand, and investment or trading strategies, on the other. An ‘asset class’ consists of assets and securities held long, whereas instruments such as funds of various sorts (be they mutual funds, ETFs, or hedge funds) and derivatives, while risky, are not defined as asset classes for the purpose of the GMP because they do not represent assets that have not already been included in traditionally defined long-only asset classes.23
21 A point of nomenclature: Within the theoretical framework, the market portfolio encompasses whatever risky assets are assumed to exist in the model. When entering reality, we want to make the point that the investors for which the Structured Strategies have been designed, namely US investors, have access to investment vehicles that provide exposure to both domestic and international assets. If we ever were to design strategies for investors who exclusively wanted to invest in US assets, we would refer to the market portfolio as the Domestic Market Portfolio.
22 We ignore the issue of re-investment risk for bonds with maturities of less than one year.
23 US REITs, however, while being funds, are an asset class—or part of the larger asset class ‘real estate/property,’ to the extent that they represent assets that have not been included in broader market indices; the same applies to funds that express exposure to international property/real estate assets.

An Introduction to Structured Strategies by CataMetrics | 13
THE GLOBAL MARKET PORTFOLIO AND ITS INVESTIBLE REPRESENTATION ■
In view of the stated investment objective of Structured Strategies—to provide retail investors with passive, liquid, low-cost, global portfolios—the methodology of Structured Strategies follows a two-step process for determining the GMP and the corresponding investment portfolio seeking to represent the investible GMP. The two steps are somewhat intertwined in that we let the availability of liquid, low-cost ETFs inform our formulation of the GMP, though for the purpose of this overview, we allow ourselves to view these two steps as consecutive.
The Global Market PortfolioOur definition of the GMP for the Structured Strategies aims to strike a balance between comprehensiveness and investibility. To achieve this balance, we make a few simplifying assumptions and represent the illiquid asset classes private equity and real estate with liquid proxies—choices which we show in Table 1, which shows our determination of the GMP for the end of 2015. Note that due to rounding, not all percentage allocations add up to exactly one hundred percent.
We mentioned before that a provider of passive global strategies has flexibility in the construction of the GMP for the purpose of aligning the GMP with constraints that apply to the investors of a particular strategy. These di�erent investment objectives result in di�ering asset-class compositions and weights. Total market capitalizations will also di�er, sometimes significantly so, between investment managers.24
24 Some examples of di�erent estimates for the size of the GMP: Fredric Dodard and Abigail Greenaway, “A Case for Global Diversification: Harnessing the Global Multi-Asset Market Portfolio,” IQ Insights (State Street Global Advisors, n.d.) gives the size of the GMP at the end of 2014 as $105.54 TR; Ronald Q. Doeswijk, Trevin W. Lam, and Laurens Swinkels, “Strategic Asset Allocation: The Global Multi-Asset Market Portfolio 1959-2011” (unpublished manuscript, November, 2012, available at
http://SSRN.com/abstract=2170275), gives the GMP as $83.5 TR at end of 2011. Both of these estimates are similar to the corresponding year-end estimates derived by CataMetrics for the Structured Strategies, though the compositions and weights of the asset classes vary somewhat.
Table 1: Global Market Portfolio end of 2015
EquitiesUS International Global
Large and mid cap 20.6% 13.4% 34.0%
Small capActual index weight 2.2% 1.6% —
Proxy for private equity 2.0% 2.0% —Total 4.1% 3.5% 7.7%
Real estate/propertyNet real estate proxied by REITs/property companies 1.9% 1.7% 3.6%
Emerging markets — 2.8% 2.8%
BondsInvestment-grade governments 7.6% 23.0% 30.6%
Investment-grade non-government credits 9.4% 6.1% 15.5%
Inflation linked 0.9% 1.4% 2.3%
High yield 1.1% 2.4% 3.5%
Totals $49 TR $58 TR $107 TR

14 | An Introduction to Structured Strategies by CataMetrics
■ THE GLOBAL MARKET PORTFOLIO AND ITS INVESTIBLE REPRESENTATION
Some of the particular choices that CataMetrics made in determining the GMP for Structured Strategies are as follows:25
• We sourced the asset-class market caps as of December 31, 2015, with the exception of the estimate for private equity, which is from six month earlier, June 30, 2015. While this introduces some non-synchroneity into the relative allocations, we deem this disadvantage to be small relative to the benefit of capturing allocations to private equity.
The global private equity allocations for June 30, 2015 were $4.16 TR.26 While necessarily ambiguous, we deem it reasonable to use US and developed ex-US small-cap equity indices as proxies for this private-equity allocation.
• Real estate/property is another tricky asset class since it is di�icult to define and measure. CataMetrics made the determination to assume that property as a whole equals five per cent of the total GMP. Knowing the estimates for the other components of the GMP, we backed out the allocations to total investible property for the US and for the world ex-US as $2.66 TR for each geographic segment.27 Other investment managers have estimated the value of readily investible property in di�erent ways. However, our assumption of a five per cent share of the GMP yields a dollar value for global property roughly similar to other estimates.28
Our proxy for the US real estate/property allocation is a US REIT allocation; for international, we use a property company index. We also note that some property allocations have already been captured by the REIT and property company indices as subsets of US and international equities, respectively. To avoid double-counting, we reduce the explicit allocations to the US REITs and international property company indices by the respective market caps of these indices because these assets already are included in the broader market indices.
• We do not treat emerging-market bonds as a separate asset class: The bonds of these markets are included under the international investment-grade government bond, investment-grade non-government credits, inflation linked, and high yield asset classes.
The weights of asset classes change not only because relative prices change, but also because of new equity and bond issuance, de-listings of equities, and maturing of bonds. A more unusual reason for changing weights is reclassifications, as when in 2009, FTSE but not MSCI changed South Korea’s status from an emerging to a developed market.
25 We do not include commodities such as gold in our GMP. Not only is it very di�icult to estimate what the freely available amount of any commodity is, but there is also the obvious risk of double-counting holdings since large amounts of commodities are held by listed companies. It is also expensive to invest in commodities using ETFs because the fees tend to be high: On average, from its launch in 2004 to the end of May 2016, the gold ETF with the ticker GLD underperformed the London gold fix by 0.45% a year; the stated expense ratio for GLD is 0.40%.
26 See the “2016 Preqin Global Private Equity & Venture Capital Report.”
27 The assumption of real estate/property being five per cent of the GMP does not imply that the total value of global real estate is a meager $5.33 TR, but rather that the fraction of the total value of global property available to investors is worth $5.33 TR.
28 The previously mentioned SSGA publication has an estimate for global real estate for the end of 2014 as $6.139 TR, a 5.82% weight, whereas Doeswijk et al. use $3.7 TR, a 4.4% weight, for the end of 2011. In a note by LaSalle Investment Management from September 19, 2014 titled “The Real Estate Investable Universe 2014,” the global institutional public and private ownership of real estate is estimated at $7.6 TR at the end of 2013Q3.
29 For an ETF to fit our definition of ‘low cost’ the ETF’s expense ratio in basis points must be in the single digits. We achieve this goal for the majority of the ETFs, but we have to accept higher expense ratios for developed international small-cap equities SCHC, emerging-market equities SCHE, and international property VNQI. For an overview of ETF and mutual fund expense ratios, see Alex Bryan and Michael Rawson, “The Cost of Owning ETFs and Index Mutual Funds,” Morningstar (2014) for some compelling reading.
30 Expense ratios as stated on schwab.com on November 18, 2016.
31 BBG Barc is our abbreviation for Bloomberg Barclays.

An Introduction to Structured Strategies by CataMetrics | 15
THE GLOBAL MARKET PORTFOLIO AND ITS INVESTIBLE REPRESENTATION ■
The investible Global Market PortfolioTo allocate e�iciently to the defined asset classes for the GMP shown in Table 1, we first establish a universe of investment vehicles. We then determine the weights of these vehicles to provide a good representation of the GMP.
We were guided in our definitions of the equity asset classes of the GMP by the availability of liquid and low-cost ETFs with tight bid-o�er spreads. The equity ETFs listed in Table 2 map conveniently onto the equity asset classes in Table 1; note that both the SCHX and SCHF cover both large- and mid-cap stocks.29, 30
The process for how we choose to represent the GMP’s bond allocations is more complicated because the availability of low-cost bond ETFs is less comprehensive than it is for equities. Indeed, there only exist four US bond ETFs, and no non-US bond ETFs, that we consider ‘low-cost.’ We show the four US-bond ETFs in Table 3 31 below.
Table 2:Name Ticker Underlying Index Expense
Ratio
US EquitiesSchwab U.S. Large-CapSchwab U.S. Small-CapSchwab U.S. REIT
SCHXSCHASCHH
Dow Jones U.S. Large-Cap Total Stock Market IndexDow Jones U.S. Small-Cap Total Stock Market IndexDow Jones U.S. Select REIT Index
0.03%0.06%0.07%
International EquitiesSchwab International EquitySchwab International Small-Cap EquitySchwab Emerging Markets EquityVanguard Global ex-U.S. Real Estate
SCHFSCHCSCHEVNQI
FTSE Developed ex-U.S. IndexFTSE Developed Small Cap ex-US Liquid IndexFTSE Emerging IndexS&P Global ex-U.S. Property
0.07%0.16%0.13%0.18%
Table 3:Name Ticker Underlying Index Expense
Ratio
US BondsSchwab Short-Term U.S. TreasurySchwab Intermediate-Term U.S. TreasurySchwab U.S. TIPS
Schwab U.S. Aggregate Bond
SCHOSCHRSCHP
SCHZ
BBG Barc U.S. Treasury 1–3 Year Treasury Bond IndexBBG Barc U.S. Treasury 3–10 Year Treasury Bond IndexBBG Barc U.S. Treasury Inflation Protected Securities (TIPS) Index (Series-L)BBG Barc U.S. Aggregate Bond Index
0.06%0.06%0.07%
0.03%
16 | An Introduction to Structured Strategies by CataMetrics
■ THE GLOBAL MARKET PORTFOLIO AND ITS INVESTIBLE REPRESENTATION
Since we cannot map directly the bond ETFs onto the bond asset classes of the GMP in a comprehensive manner, we instead construct a tracking basket32 using some or all of these four US bond ETFs. This basket of US bond ETFs aims to mimic the performance of the entire bond segment of the GMP with a reasonable tracking error. Investment-grade bonds in developed markets make up the bulk of the GMP’s total bond exposure, and since the yield curves and credit spreads for these bonds are su�iciently highly correlated, we believe the cost savings a�orded by the very low expense ratios of the bonds in Table 3 will compensate, in the longer run, for the tracking error of this approach.33
Additionally, due its construction, the tracking basket is likely to have a shorter duration than both the US and international bond markets. This introduces a bias into the bond segment of the Structured Strategies. Because of the shorter duration of the tracking basket, we expect the Structured Strategies to have a structural advantage over both the US and the international bond markets as US and international bond yields start to rise. This is a direct consequence of the absence of low-cost international bond ETFs.
The fact that ten of the eleven ETFs in our investment universe are issued by Schwab has no implication other than the finding that these ten ETFs provide investors with good value and liquidity.34 When other providers start o�ering similarly competitively priced ETFs, we will review the composition of our investment universe.
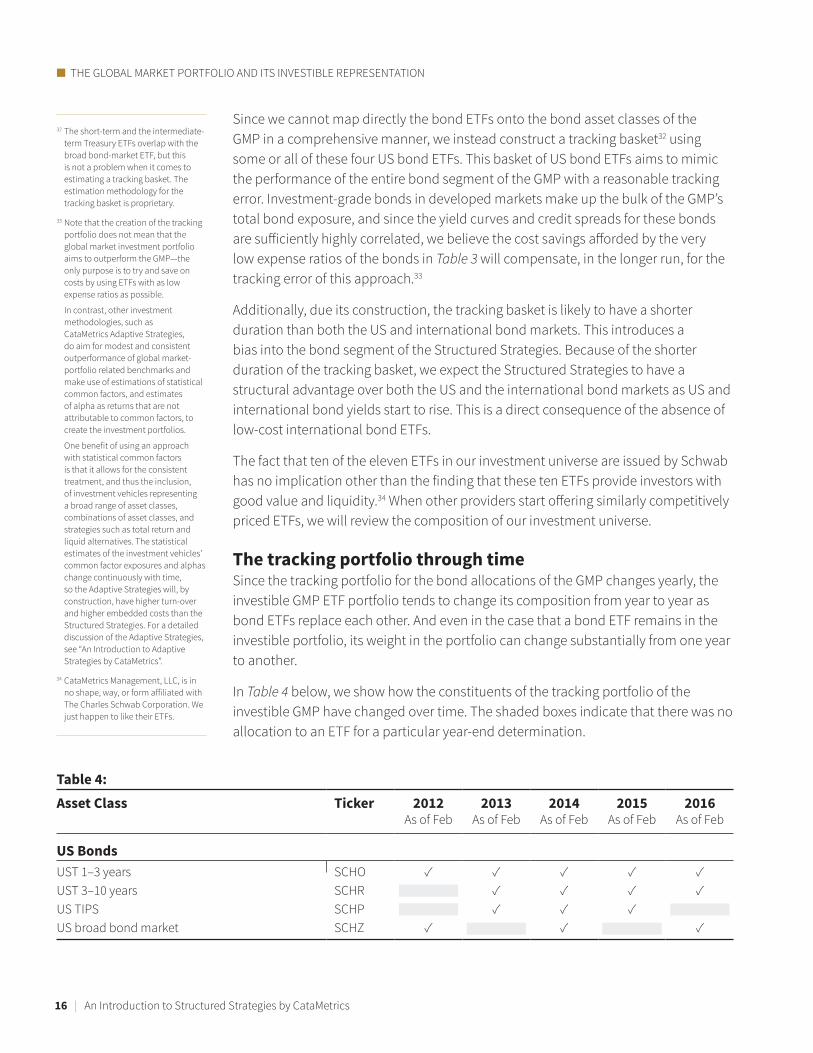
The tracking portfolio through timeSince the tracking portfolio for the bond allocations of the GMP changes yearly, the investible GMP ETF portfolio tends to change its composition from year to year as bond ETFs replace each other. And even in the case that a bond ETF remains in the investible portfolio, its weight in the portfolio can change substantially from one year to another.
In Table 4 below, we show how the constituents of the tracking portfolio of the investible GMP have changed over time. The shaded boxes indicate that there was no allocation to an ETF for a particular year-end determination.
32 The short-term and the intermediate-term Treasury ETFs overlap with the broad bond-market ETF, but this is not a problem when it comes to estimating a tracking basket. The estimation methodology for the tracking basket is proprietary.
33 Note that the creation of the tracking portfolio does not mean that the global market investment portfolio aims to outperform the GMP—the only purpose is to try and save on costs by using ETFs with as low expense ratios as possible.
In contrast, other investment methodologies, such as CataMetrics Adaptive Strategies, do aim for modest and consistent outperformance of global market-portfolio related benchmarks and make use of estimations of statistical common factors, and estimates of alpha as returns that are not attributable to common factors, to create the investment portfolios.
One benefit of using an approach with statistical common factors is that it allows for the consistent treatment, and thus the inclusion, of investment vehicles representing a broad range of asset classes, combinations of asset classes, and strategies such as total return and liquid alternatives. The statistical estimates of the investment vehicles’ common factor exposures and alphas change continuously with time, so the Adaptive Strategies will, by construction, have higher turn-over and higher embedded costs than the Structured Strategies. For a detailed discussion of the Adaptive Strategies, see “An Introduction to Adaptive Strategies by CataMetrics”.
34 CataMetrics Management, LLC, is in no shape, way, or form a�iliated with The Charles Schwab Corporation. We just happen to like their ETFs.
Table 4: Asset Class Ticker 2012
As of Feb2013
As of Feb2014
As of Feb2015
As of Feb2016
As of Feb
US BondsUST 1–3 yearsUST 3–10 yearsUS TIPSUS broad bond market
SCHOSCHRSCHPSCHZ
✓
✓
✓✓✓
✓✓ ✓✓
✓✓✓
✓✓
✓

An Introduction to Structured Strategies by CataMetrics | 17
The Structured StrategiesIt is well known that many US investors reflect biases in their portfolio choices, such as having a home-market preference or a preference for growth.35 Since these biases typically lead to portfolios that are less diversified across asset classes and regions than the GMP, it is reasonable to represent these portfolio choices as having higher risks than the GMP.
The CataMetrics Structured Strategies o�er six portfolios that aim to represent the GMP and five combinations with varying degrees of US and growth bias. As we discussed in the section on the theory behind the GMP, investors can reach higher levels by borrowing and leveraging their allocation to the GMP up along the capital market line beyond the GMP in Diagram 3.
However, investors who cannot employ leverage in order to stay on the capital-market line will find their investment choices on the curved part of the investment envelope in Diagram 4, where the crimson segment is identical to the upper right-hand part of Markowitz’s bullet.
The problem with aiming to define a portfolio on the upper segment of the investment envelope is that we can no longer rely on the GMP to provide us with a leveraged mean-variance e�icient portfolio. Instead, we have to use some other method for determining the composition of non-GMP portfolios.
One method for identifying the points on the upper investment envelope would be to develop forecasts of returns and the covariance matrix of all assets in the investment universe, and then estimating the upper part of the investment envelope. Once that is done, we can pick whatever points on the envelope appear attractive to an investor.
This method, which we call the ‘theoretical approach’, would, in practice, be burdened with significant forecasting errors that, broadly speaking, would be similar in nature to the problems that beset empirical tests of CAPM. Consequently, because of these complications, other than by cosmic coincidence, the portfolios estimated by the theoretical approach would lie below the true but unknowable upper segment of the investment envelop in Diagram 4. Indeed, we would not even know how far below the investment envelope our investment solutions would lie. The (unknowable) vertical distance between a portfolio and the (unknowable) corresponding point on the investment envelope would represent the (unknowable) size of the loss of mean-variance e�iciency due to forecasting errors.
35 In addition to the Vanguard research publication we referred to above (Phillips et al., “Home Bias”), see also the discussion by Christopher B. Philips on home bias in another Vanguard research publication “Global equities: Balancing home bias and diversification” from 2014.

18 | An Introduction to Structured Strategies by CataMetrics
■ THE STRUCTURED STRATEGIES
Instead of exposing our investors to the vagaries of very uncertain portfolio optimization, we construct the Structured Strategies using a transparent approach that preserves parts of the structure and composition of the GMP. Yes, we know that the non-GMP portfolios we construct will to some extent be mean-variance ine�icient, but so, too, by definition, would be any other strategy that aims to capture the upper part of the investment envelope.
The starting point for developing the Structured Strategies is the Global Market Portfolio Strategy. This reflects the GMP as closely as we can by using low-cost ETFs only: Starting with the Global Market Portfolio Strategy, we successively tilt the strategies toward larger equity exposures and larger US exposures.
Diagram 5 provides a stylized overview of how the six strategies relate to one another in terms of varying equity and US exposures.
The six Structured Strategies are defined as follows:
Global Market Portfolio Strategy: The allocations to the ETF investment portfolio closely reflect the weights of the equity asset classes in the GMP, with the bond asset classes being expressed using the bond-tracking portfolio of up to four US-bond ETFs.
The strategy for 2016 has 48% in equity and 52% in bonds, with US equities being slightly more than 55% of the total equity allocation and international equities being slightly less than 45% of the total equity allocation.
0%0%
Volatility
Expe
cted
Ret
urn
Diagram 4:
GMP
Investment Envelope Investment Envelope
Non-attainable part of Capital-market Line

An Introduction to Structured Strategies by CataMetrics | 19
THE STRUCTURED STRATEGIES ■
Global Balanced Strategy: Similar to the Global Market Portfolio Strategy. However, the target for the global equity allocation is increased to 65% with the target for the total bond allocation correspondingly set to 35%. The relative allocations to US and international equities remain essentially the same as in the Global Market Portfolio Strategy.
Global Moderate Growth Strategy: Similar to the Global Balanced Strategy, but the target for the global equity allocation increases to 85% while the target for the total bond allocation is lowered to 15%. The relative allocations to US and international equities remain essentially the same as in the Global Market Portfolio Strategy.
US-focused Balanced Strategy: Similar to the Global Balanced Strategy in that the target for the global equity allocation is 65% with a global bond allocation of 35%. However, the relative weight of US equities is increased to 70% of the global equity allocation while the target for international equities is lowered to 30% of the global equity allocation.
US-focused Moderate Growth Strategy: Similar to the Global Moderate Growth Strategy in that the global equity allocation is 85%. However, similar to the US-focused Balanced Strategy, the target for the relative weight of US equities is 70% of the global equity allocation.
US-focused Equity Growth Strategy: This strategy is 100% allocated to equities and thus has no bond allocation.
As with the US-focused Balanced Strategy and the US-focused Moderate Growth Strategy, the target for the relative weight of US equities is 70% of the overall equity allocation.
The tilting scheme has the benefit of producing intuitively believable portfolios that also reflect the narratives of their strategy names.
The mechanics of the Structured StrategiesThe ETF allocations for each year are determined at the same time as the asset-class allocations of the GMP, which are based on year-end market capitalizations (except for estimate of the Private Equity asset class). Each year, the GMP and the strategy determination are re-estimated during the month of January; the recalibrated allocations are applied as of the close of business on the last day of January. In our parlance, therefore, the strategy formulation for, say, 2016 runs from the end of January, 2016 to the end of January, 2017.

20 | An Introduction to Structured Strategies by CataMetrics
■ THE STRUCTURED STRATEGIES
The strategies are rebalanced back to their annual beginning weights, i.e., to the weights at the start of February, every three months. This means that the weights are adjusted back to their policy weights at the end of April, July, and October. An investment portfolio that matches the GMP’s exposures closely would to a large extent be self-adjusting in the sense that as the relative weights of the asset classes in the GMP change over time with changes in prices, the weights of the funds in the investment portfolio change similarly.
There exist, however, two rationales for the quarterly re-calibrations of the investment portfolios.
First, we are only able to source information on the size of private equity yearly, and since we cannot predict how the total assets of the private-equity asset class may grow or shrink intra-year, we prefer to keep the weights stable for a full year.
Secondly, from a purely practical point of view, the tri-monthly recalibration of weights will narrow the dispersion of allocations, and thus returns, between investors who invest in the strategies at di�erent times during a year. It is inevitable that there will exist some return di�erences for investors who allocate to a strategy at di�erent times during the three-month period between readjustments, but we believe that these di�erences will in most cases be relatively small. Similarly, asset-class return di�erentials may result in significant shiªs in the relative weights of a portfolio’s ETFs and thus expose an investor to a materially di�erent risk/return profile than the investor may have expected at the time of the annual rebalancing at the beginning of February. By recalibrating the portfolio every three months, the portfolio will remain suitable for the investor until the following rebalancing.
Increasing Allocations to US
Incr
easi
ng A
lloca
tions
to E
quiti
es
Diagram 5:
US-focusedModerate Growth
Strategy
US-focusedEquity Growth
Strategy
Global BalancedStrategy
US-focusedBalanced Strategy
Global MarketPortfolio Strategy
Global ModerateGrowth Strategy

An Introduction to Structured Strategies by CataMetrics | 21
Structured Strategies in a NutshellThe benefits of investing in a low-cost, globally-diversified portfolio are well documented. While there are many di�erent ways to construct passive investment strategies, this paper demonstrates that constructing a series of strategies grounded in financial research—strategies that are consistent with the art and science of portfolio construction—is a sophisticated and complex process.
Creating low-cost, easily accessible and investible global strategies necessitates making assumptions and trade-o�s. CataMetrics Management chooses to hew closely to the fundamental insights of MPT by anchoring the Structured Strategies on the global market portfolio.
Structured Strategies follow a passive investing philosophy, but the investment portfolios are not static. As markets and asset-class capitalizations evolve and new low-cost, high-quality investment vehicles emerge, CataMetrics re-evaluates the assumptions and trade-o�s that drive the construction of the six Structured Strategies to continuously provide retail investors with a very cost-e�ective suite of core investment strategies.
We believe that the very low-cost approach of our Structured Strategies is a reasonable and practical implementation of MPT that meets the needs of many investors.

22 | An Introduction to Structured Strategies by CataMetrics
Disclosures and DisclaimersCataMetrics ManagementCataMetrics® Management, LLC, (CMM) is a Registered Investment Adviser which o�ers global, risk-managed, multi-asset class, and index-focused portfolio strategies to the institutional platform marketplace as well as to financial advisors. Please visit our website CataMetricsManagement.com for more information and to review our firm’s Form ADV Part 2A.
This paper is for informational, illustrative and educational purposes only and is not intended as a recommendation of any security, or investment strategy. All investments carry a certain risk, and there is no assurance that an investment will provide positive performance over any period of time. An investor may experience loss of principal. Investment decisions should always be made based on the investor’s specific financial needs and objectives, goals, time horizon, and risk tolerance. The assets and/or investment strategies described may not be suitable for all investors. Investors should consult with an investment adviser to determine the appropriate investment strategy for them.
Information obtained from third-party sources is believed to be reliable but is not guaranteed. CMM makes no representation regarding the accuracy or completeness of information or judgments provided herein. All opinions and views constitute the judgments of CMM as of the date of writing and are subject to change at any time without notice.
The Risks of ETFsExchange-traded funds (ETFs) are subject to risks similar to those of stocks, such as market, interest rate, foreign exchange, and liquidity risks. An investor in ETFs may bear indirect fees and expenses charged by the ETFs in addition to their direct fees and expenses, and is subject to the risk of loss of principal. ETF sponsors may suspend trading in ETFs and may not honor redemption requests. ETFs may trade at a discount or premium to their net asset value and are subject to the market fluctuations of their underlying investments. When considering investing in an ETF, you should consult your financial advisor and accountant on how investing in the fund will a�ect your taxes.
Before investing in an ETF, you should read both its summary prospectus and its full prospectus, which provide detailed information on the ETF’s investment objective, principal investment strategies, risks, costs, and historical performance (if any). The SEC’s EDGAR system, as well as Internet search engines, can help you locate a specific ETF prospectus. You can also find prospectuses on the websites of the financial firms that sponsor a particular ETF, as well as through your broker.
Past performance is no guarantee of future results of any ETF.
CataMetrics® is a registered trademark of CataMetrics Management, LLC.

THE INVESTMENT PROCESS ■

24 | An Introduction to Structured Strategies by CataMetrics
■ THE INVESTMENT PROCESS
55 Greens Farms Road, Suite 200-02, Westport CT, 06880 | 203-680-0330www.CataMetricsManagement.com