Embed Size (px)
Citation preview
An Introduction to SPSS
Workshop Session
conducted by:
Dr. Cyndi Garvan
Grace-Anne Jackman
Topics to be Covered
• Starting and Entering SPSS
• Main Features of SPSS
• Entering and Saving Data in SPSS
• Importing Data from Excel
• Simple Data Manipulations
• Performing Descriptive Statistics
Session 1:
Starting and Entering SPSS
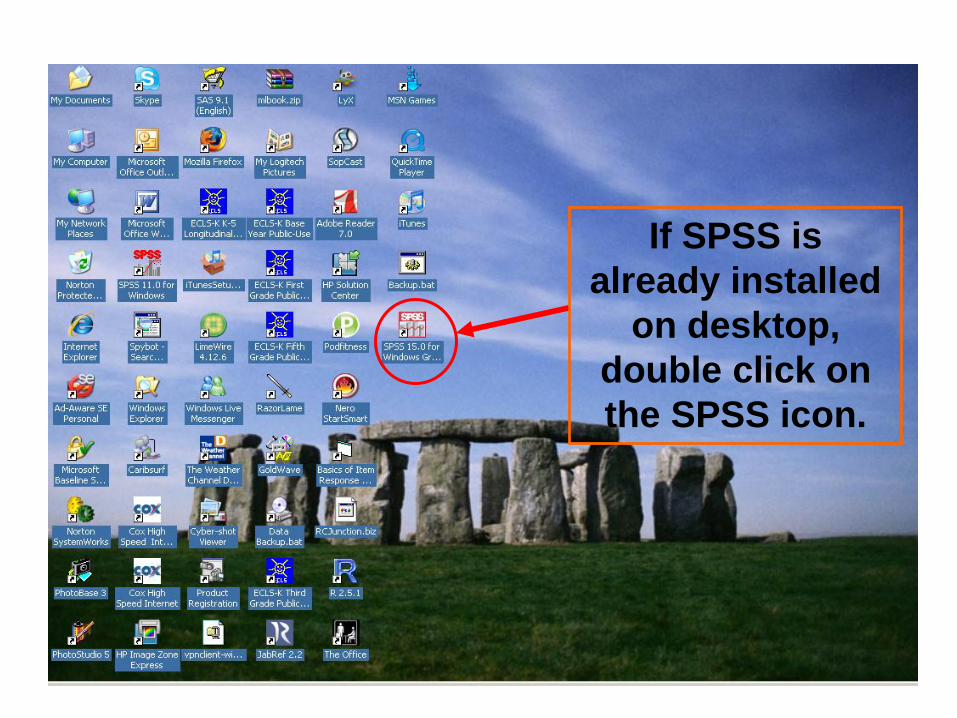
If SPSS is
already installed
on desktop,
double click on
the SPSS icon.
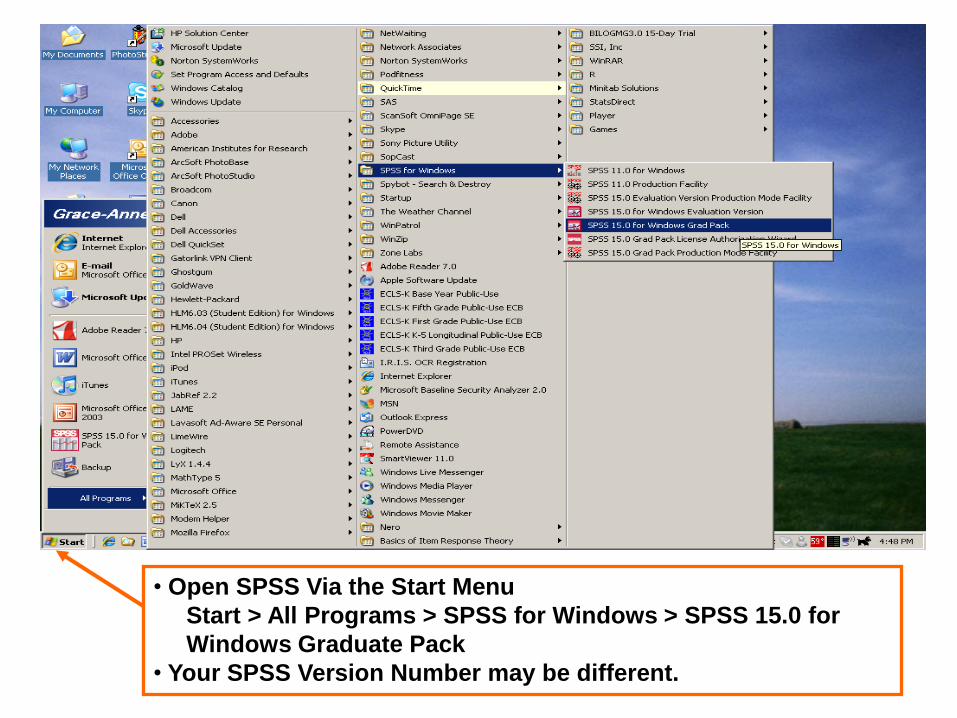
• Open SPSS Via the Start Menu
Start > All Programs > SPSS for Windows > SPSS 15.0 for
Windows Graduate Pack
• Your SPSS Version Number may be different.
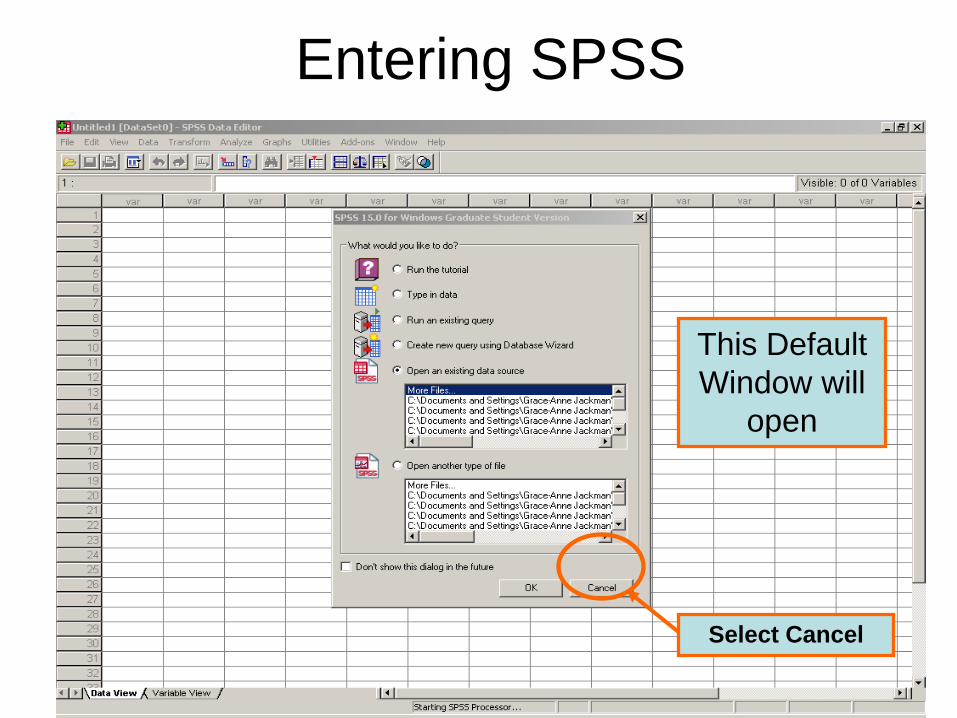
Entering SPSS
This Default
Window will
open
Select Cancel
Session 2:
Overview of Main SPSS
Features
Four Main Bars
1. The Title Bar
2. The Menu Bar
3. The Tool Bar
4. The Status Bar
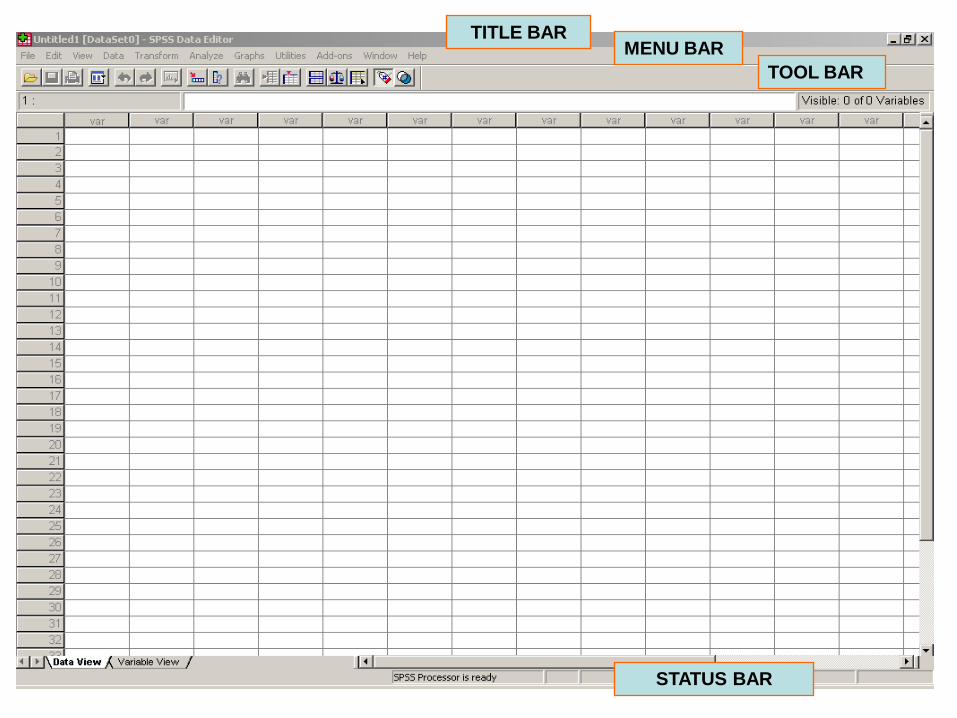
TITLE BARMENU BAR
TOOL BAR
STATUS BAR
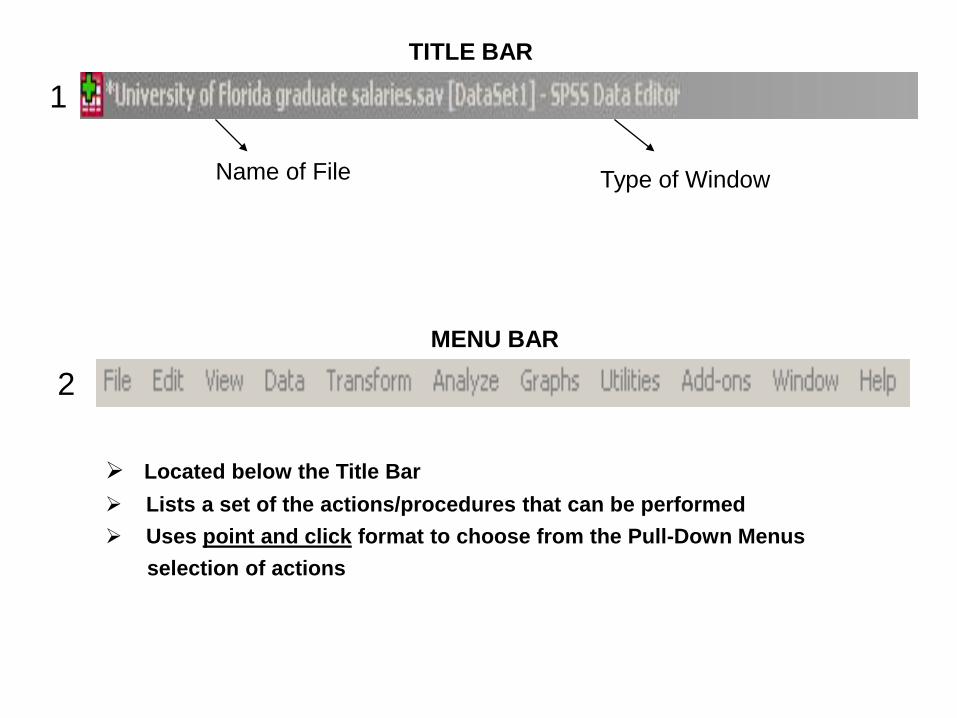
Name of File Type of Window
Located below the Title Bar
Lists a set of the actions/procedures that can be performed
Uses point and click format to choose from the Pull-Down Menus
selection of actions
TITLE BAR
1
MENU BAR
2
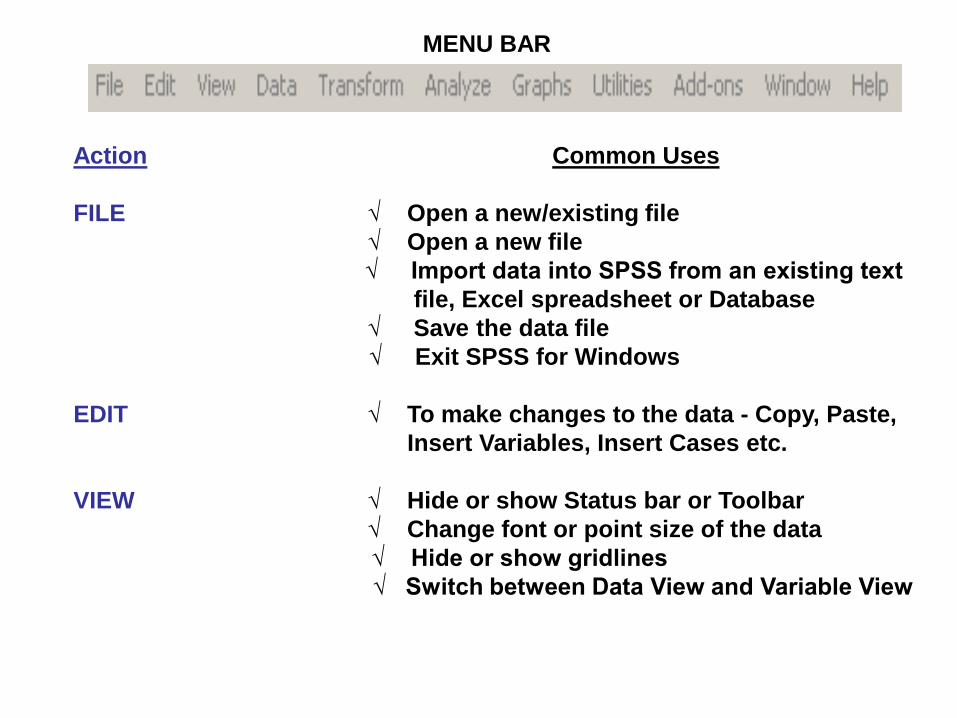
Action Common Uses
FILE √ Open a new/existing file
√ Open a new file
√ Import data into SPSS from an existing text
file, Excel spreadsheet or Database
√ Save the data file
√ Exit SPSS for Windows
EDIT √ To make changes to the data - Copy, Paste,
Insert Variables, Insert Cases etc.
VIEW √ Hide or show Status bar or Toolbar
√ Change font or point size of the data
√ Hide or show gridlines
√ Switch between Data View and Variable View
MENU BAR
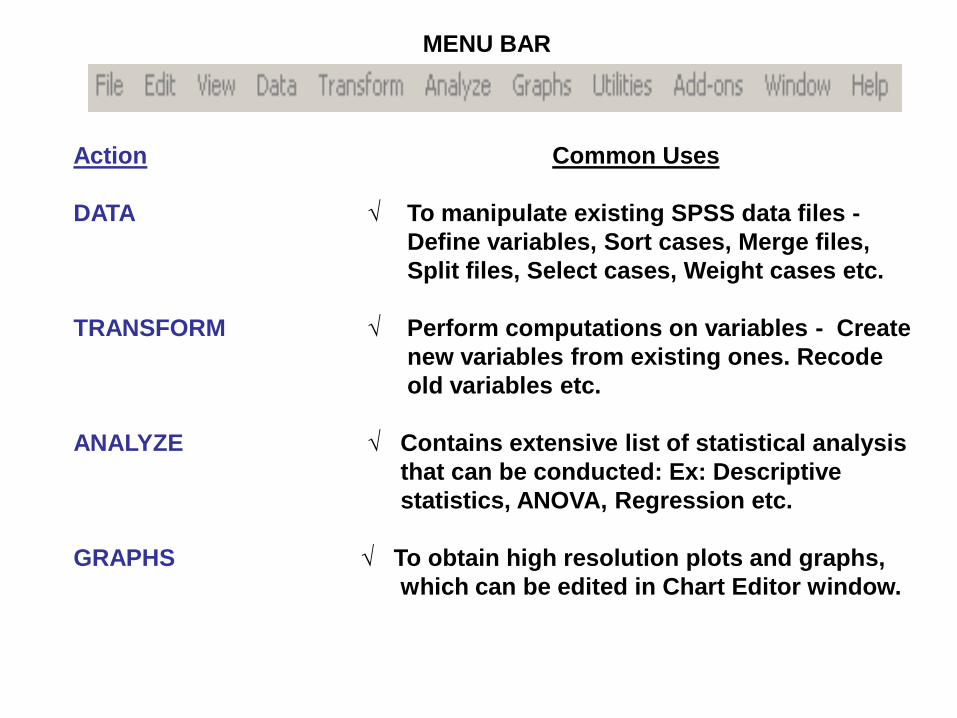
Action Common Uses
DATA √ To manipulate existing SPSS data files -
Define variables, Sort cases, Merge files,
Split files, Select cases, Weight cases etc.
TRANSFORM √ Perform computations on variables - Create
new variables from existing ones. Recode
old variables etc.
ANALYZE √ Contains extensive list of statistical analysis
that can be conducted: Ex: Descriptive
statistics, ANOVA, Regression etc.
GRAPHS √ To obtain high resolution plots and graphs,
which can be edited in Chart Editor window.
MENU BAR
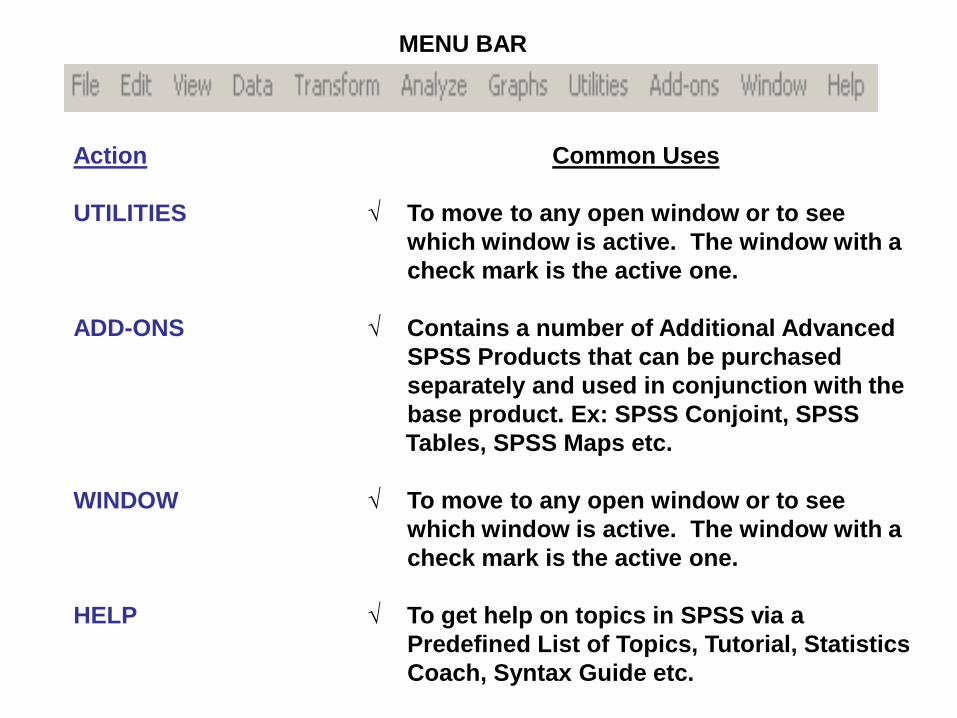
Action Common Uses
UTILITIES √ To move to any open window or to see
which window is active. The window with a
check mark is the active one.
ADD-ONS √ Contains a number of Additional Advanced
SPSS Products that can be purchased
separately and used in conjunction with the
base product. Ex: SPSS Conjoint, SPSS
Tables, SPSS Maps etc.
WINDOW √ To move to any open window or to see
which window is active. The window with a
check mark is the active one.
HELP √ To get help on topics in SPSS via a
Predefined List of Topics, Tutorial, Statistics
Coach, Syntax Guide etc.
MENU BAR
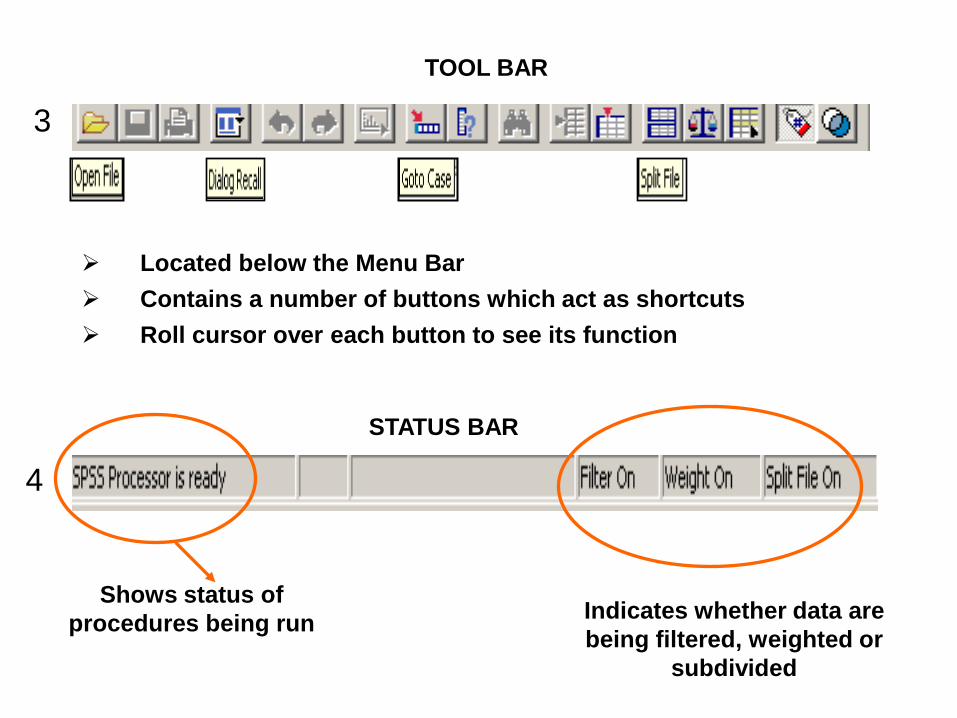
Located below the Menu Bar
Contains a number of buttons which act as shortcuts
Roll cursor over each button to see its function
Shows status of
procedures being run
TOOL BAR
3
STATUS BAR
4
Indicates whether data are
being filtered, weighted or
subdivided
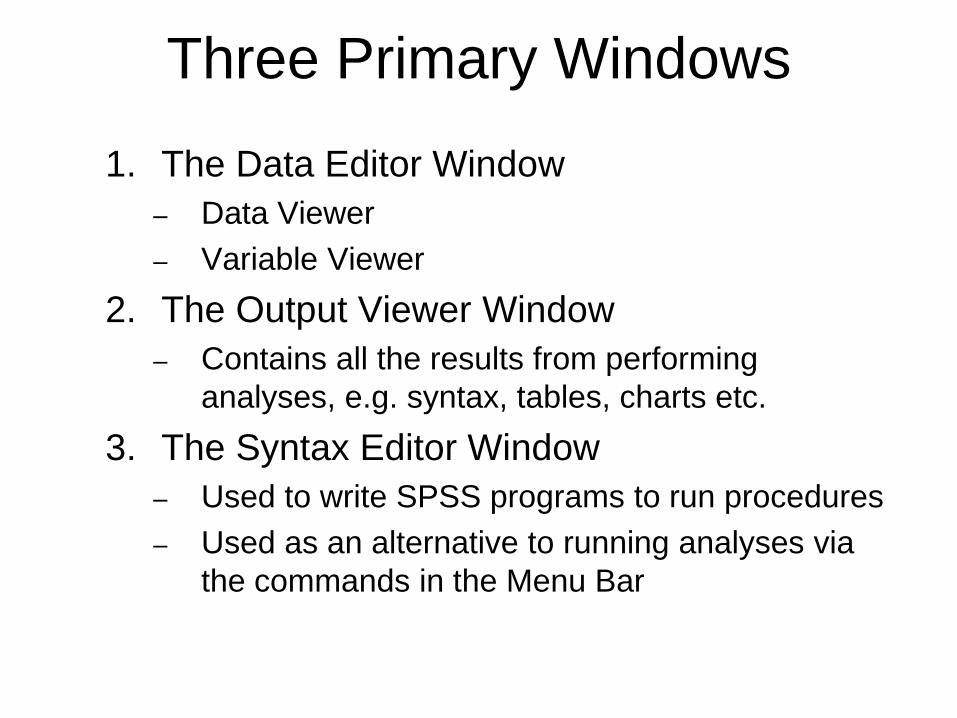
Three Primary Windows
1. The Data Editor Window
– Data Viewer
– Variable Viewer
2. The Output Viewer Window
– Contains all the results from performing
analyses, e.g. syntax, tables, charts etc.
3. The Syntax Editor Window
– Used to write SPSS programs to run procedures
– Used as an alternative to running analyses via
the commands in the Menu Bar
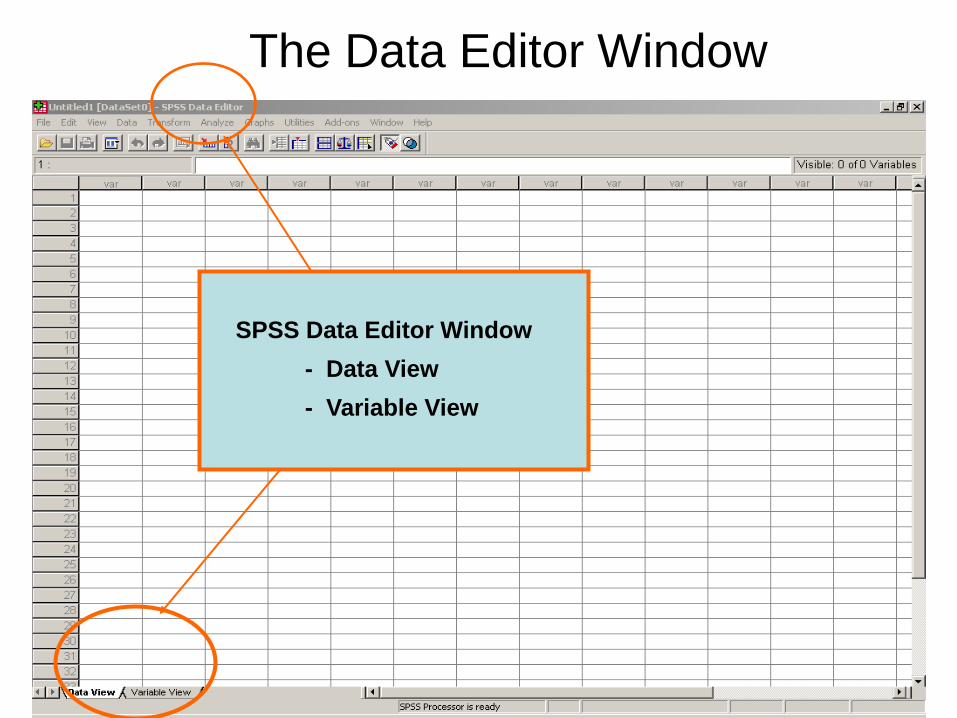
SPSS Data Editor Window
- Data View
- Variable View
The Data Editor Window
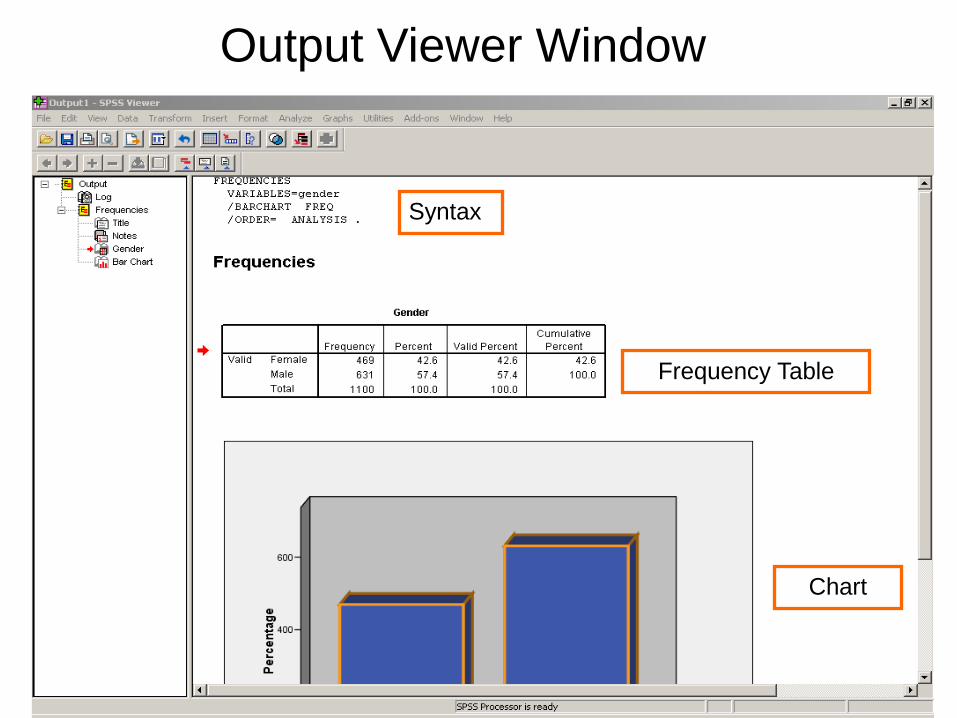
Output Viewer Window
Syntax
Frequency Table
Chart
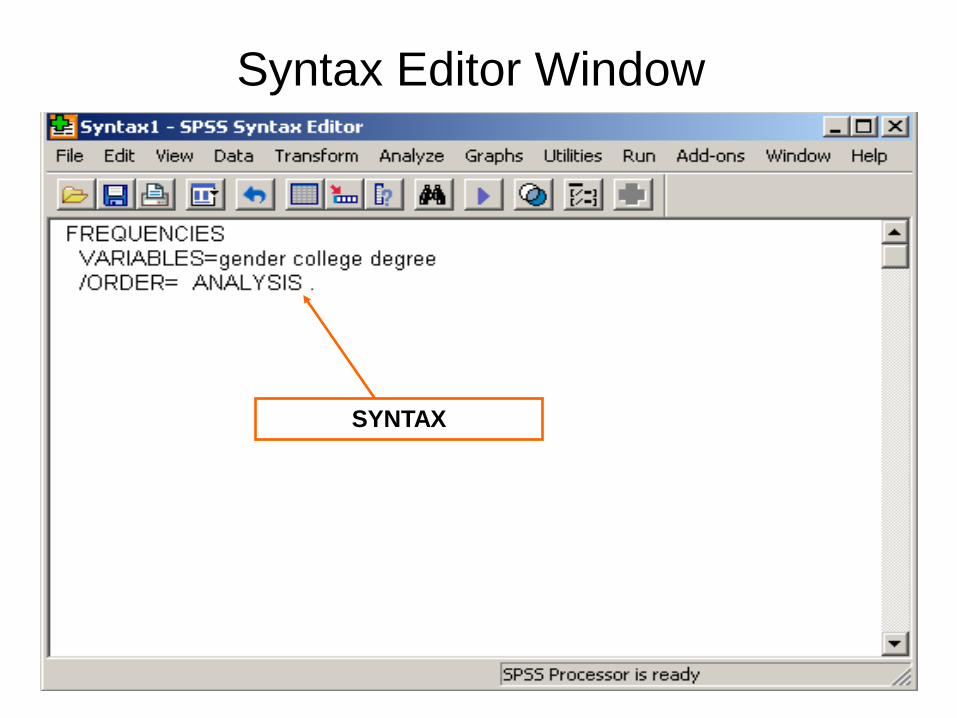
Syntax Editor Window
SYNTAX
Session 3:
Entering Data in SPSS
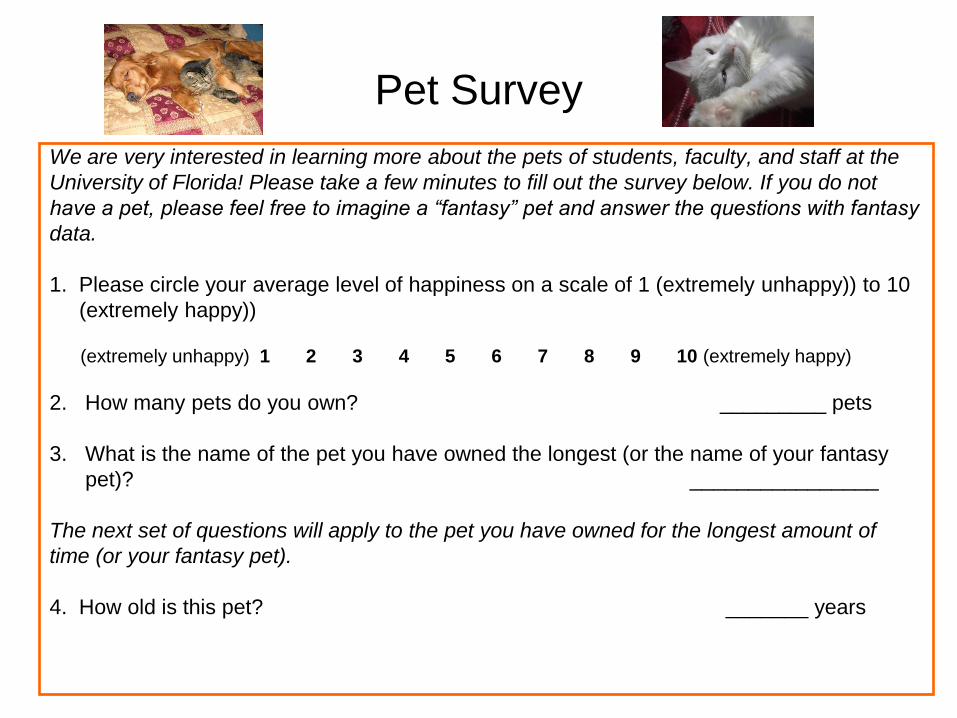
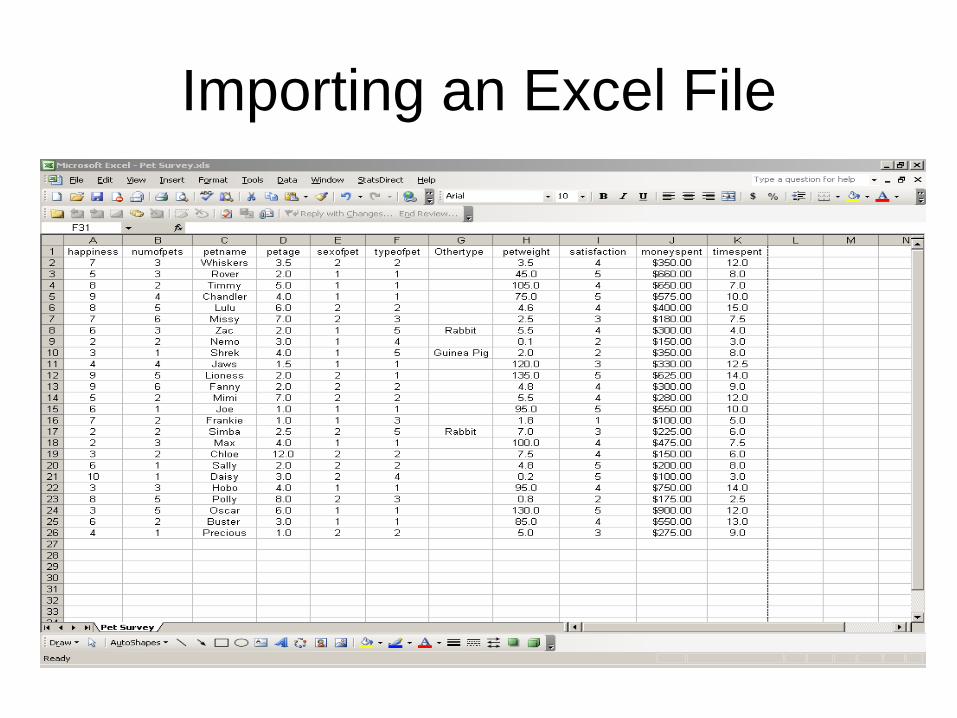
Pet Survey
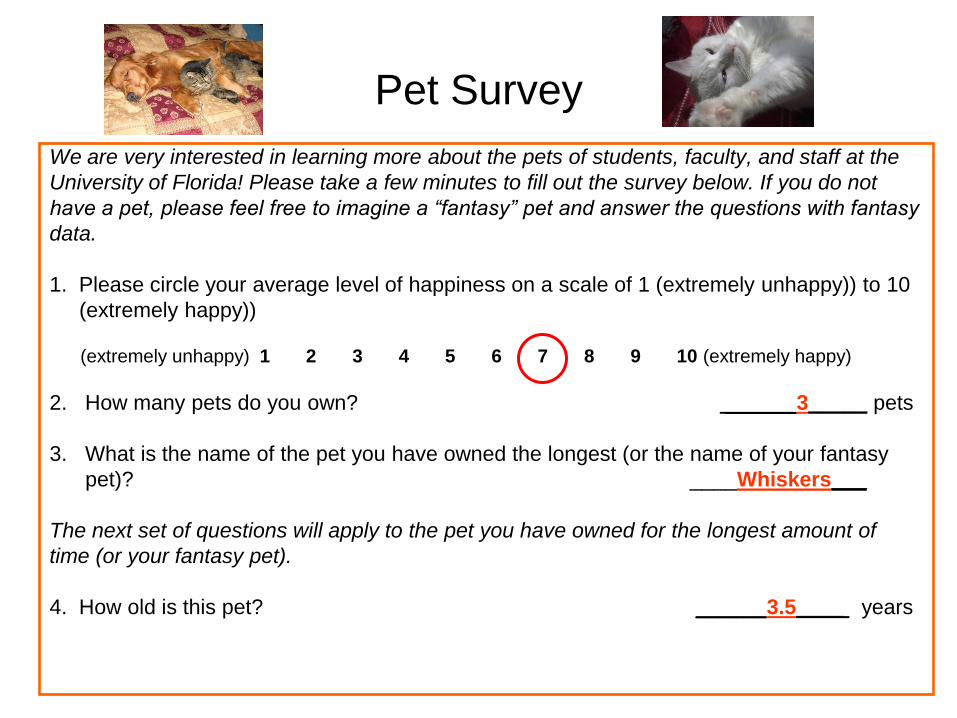
We are very interested in learning more about the pets of students, faculty, and staff at the
University of Florida! Please take a few minutes to fill out the survey below. If you do not
have a pet, please feel free to imagine a “fantasy” pet and answer the questions with fantasy
data.
1. Please circle your average level of happiness on a scale of 1 (extremely unhappy)) to 10
(extremely happy))
(extremely unhappy) 1 2 3 4 5 6 7 8 9 10 (extremely happy)
2. How many pets do you own? _________ pets
3. What is the name of the pet you have owned the longest (or the name of your fantasy
pet)? ________________
The next set of questions will apply to the pet you have owned for the longest amount of
time (or your fantasy pet).
4. How old is this pet? _______ years
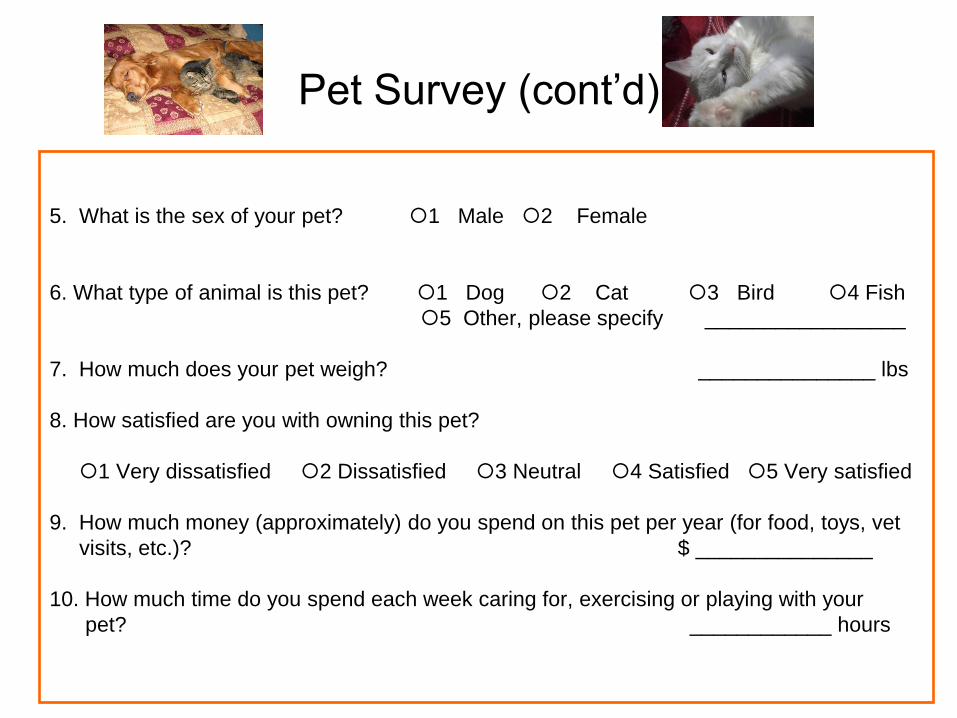
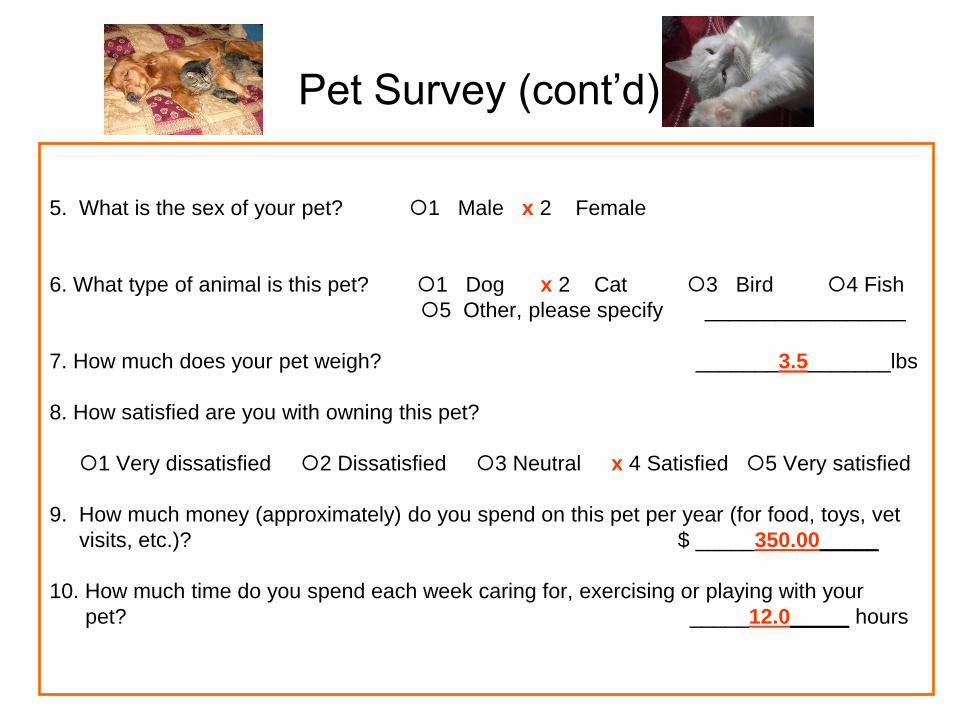
Pet Survey (cont’d)
5. What is the sex of your pet? 1 Male 2 Female
6. What type of animal is this pet? 1 Dog 2 Cat 3 Bird 4 Fish
5 Other, please specify _________________
7. How much does your pet weigh? _______________ lbs
8. How satisfied are you with owning this pet?
1 Very dissatisfied 2 Dissatisfied 3 Neutral 4 Satisfied 5 Very satisfied
9. How much money (approximately) do you spend on this pet per year (for food, toys, vet
visits, etc.)? $ _______________
10. How much time do you spend each week caring for, exercising or playing with your
pet? ____________ hours
Pet Survey
Setting Up the Variables
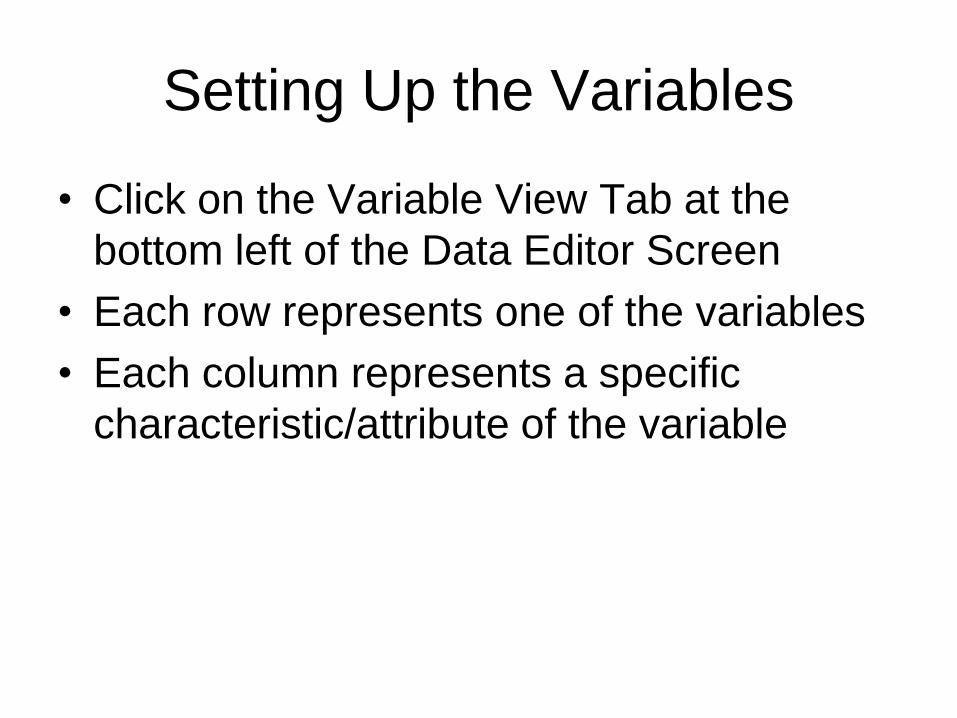
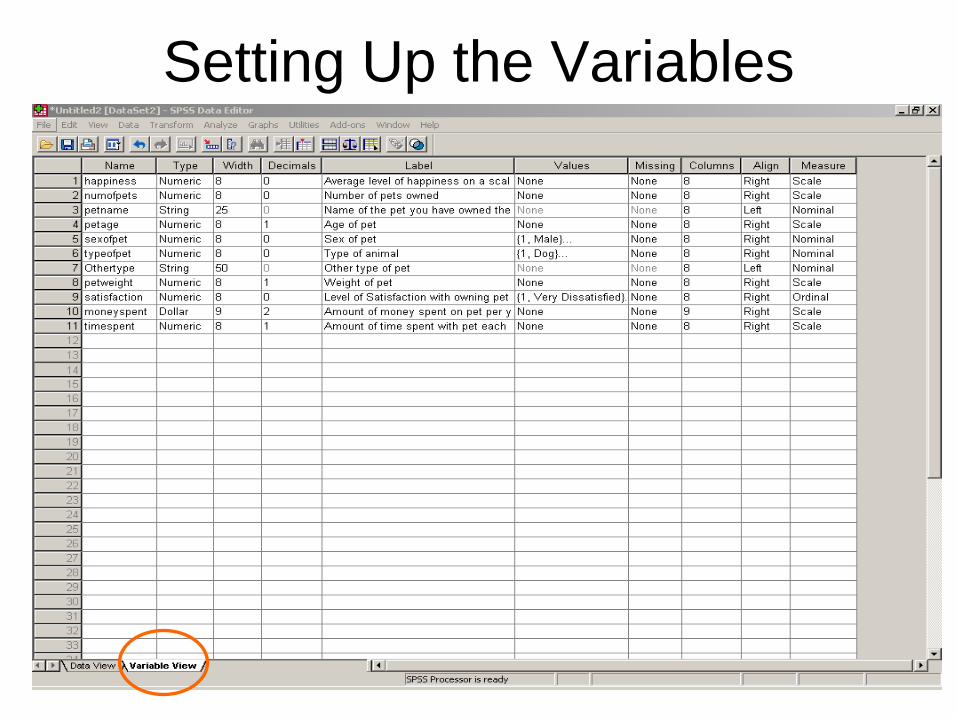
Setting Up the Variables
• Click on the Variable View Tab at the
bottom left of the Data Editor Screen
• Each row represents one of the variables
• Each column represents a specific
characteristic/attribute of the variable
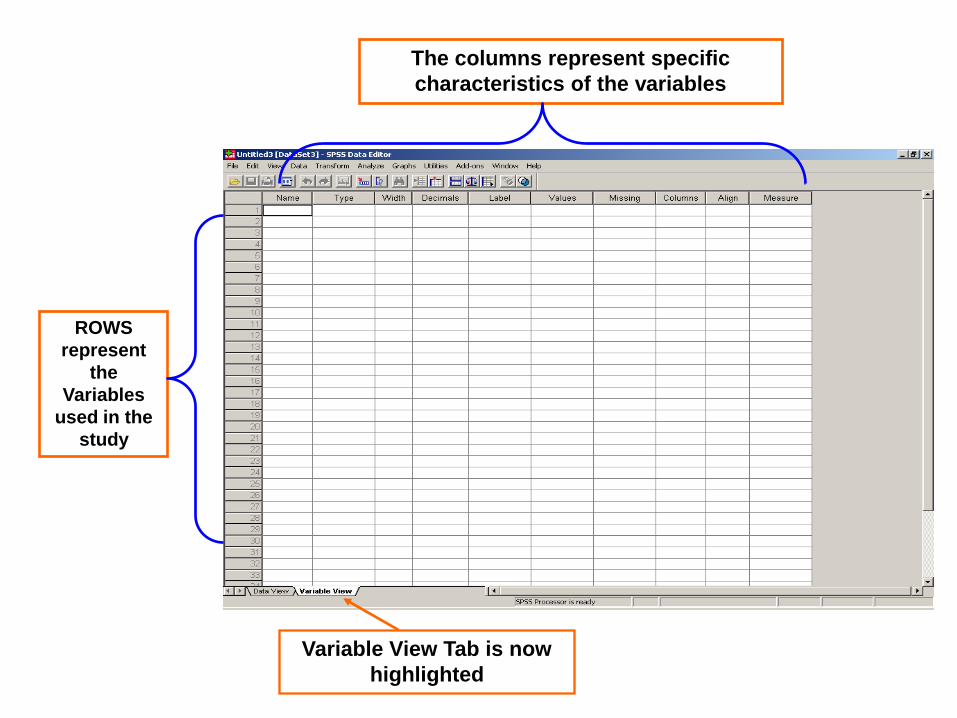
ROWS
represent
the
Variables
used in the
study
Variable View Tab is now
highlighted
The columns represent specific
characteristics of the variables
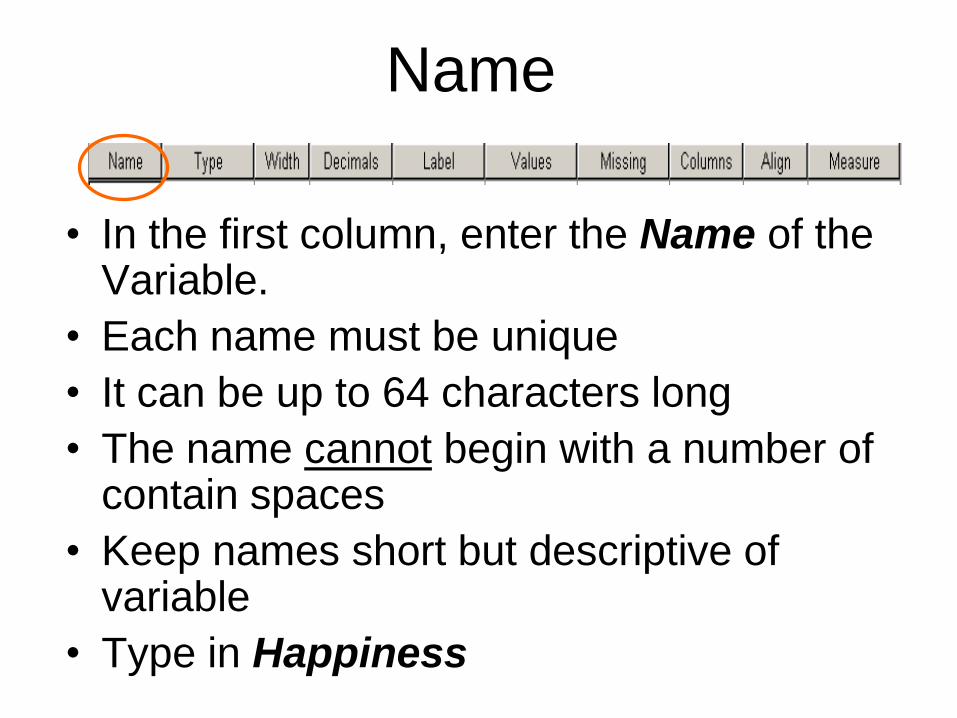
• In the first column, enter the Name of theVariable.
• Each name must be unique
• It can be up to 64 characters long
• The name cannot begin with a number of contain spaces
• Keep names short but descriptive of variable
• Type in Happiness
Name
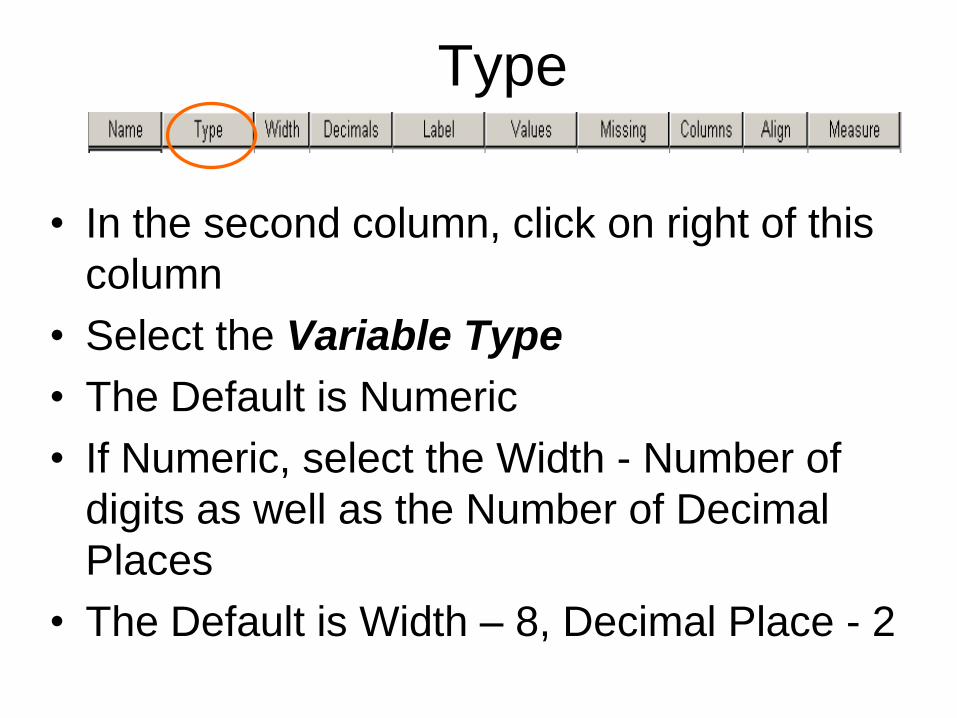
• In the second column, click on right of this
column
• Select the Variable Type
• The Default is Numeric
• If Numeric, select the Width - Number of
digits as well as the Number of Decimal
Places
• The Default is Width – 8, Decimal Place - 2
Type
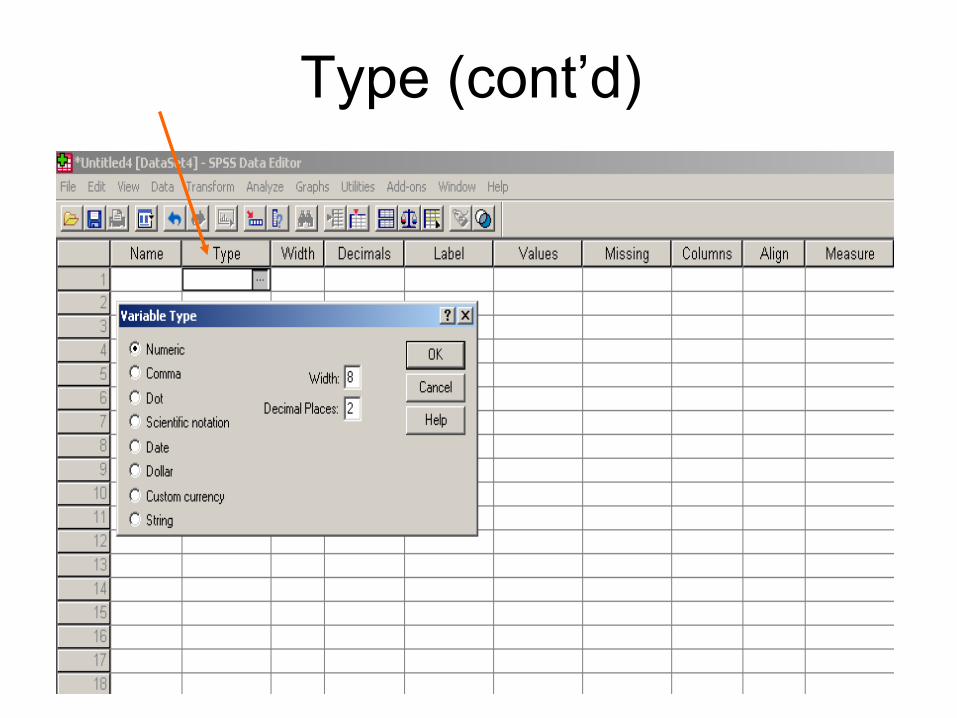
Type (cont’d)
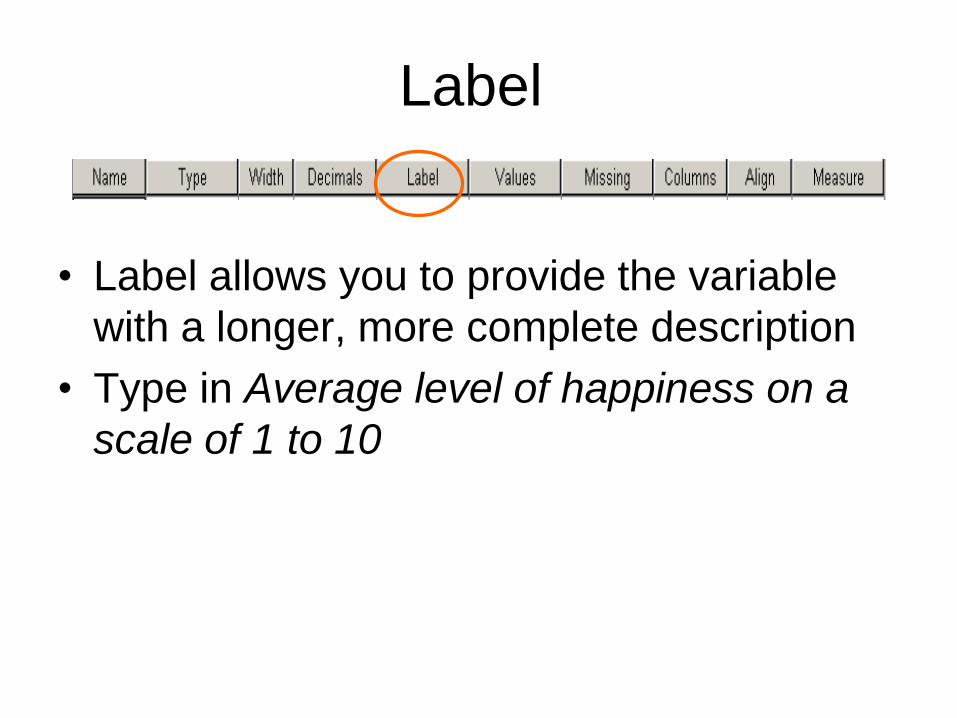
• Label allows you to provide the variable
with a longer, more complete description
• Type in Average level of happiness on a
scale of 1 to 10
Label
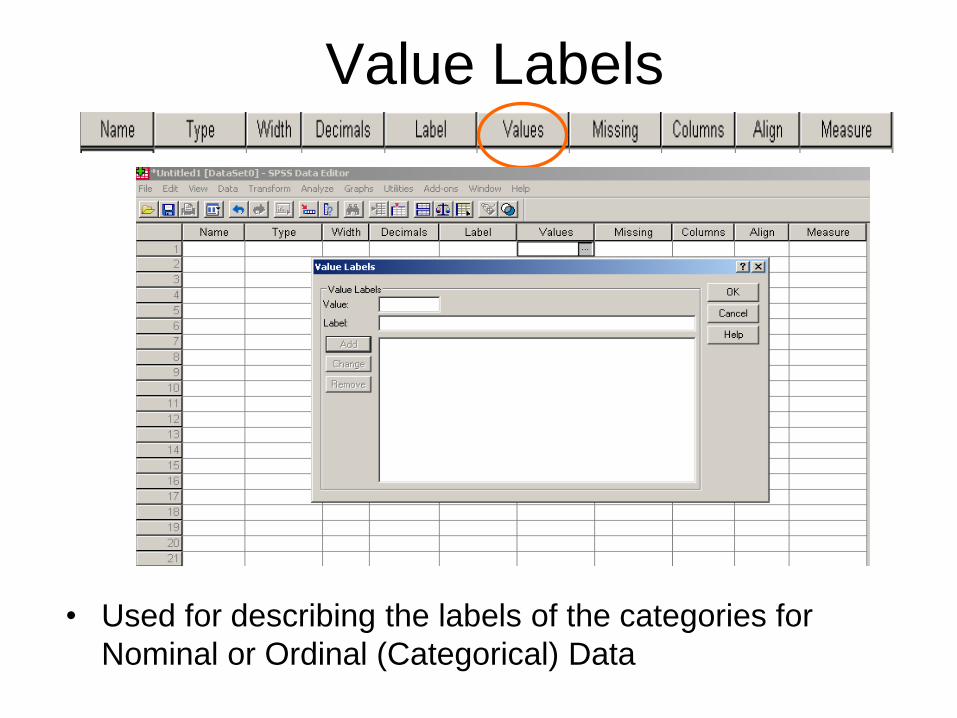
Value Labels
• Used for describing the labels of the categories for
Nominal or Ordinal (Categorical) Data
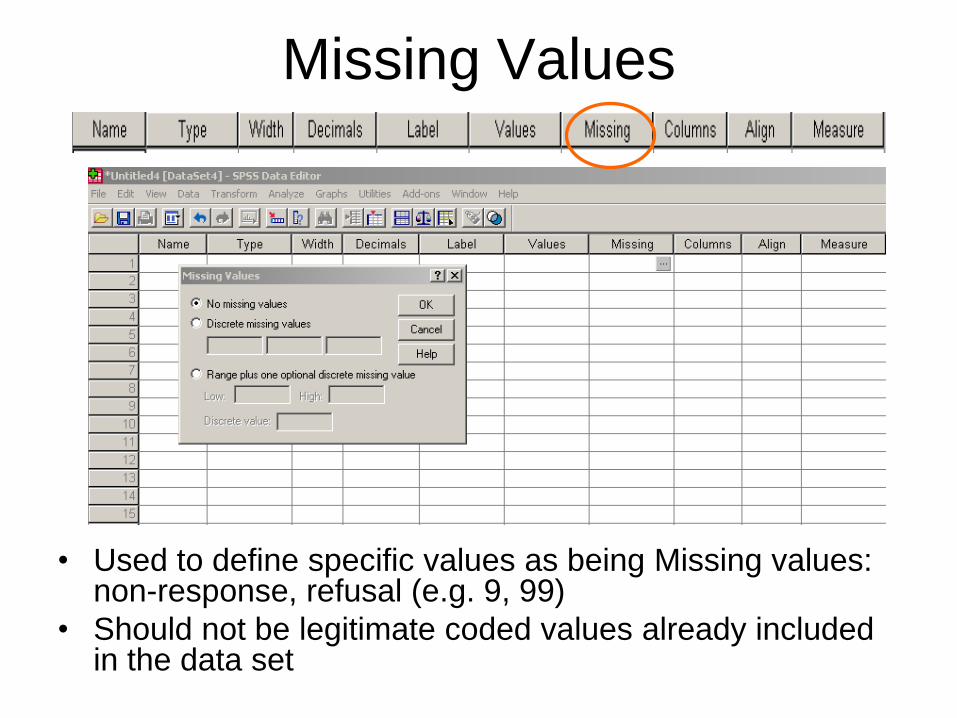
Missing Values
• Used to define specific values as being Missing values: non-response, refusal (e.g. 9, 99)
• Should not be legitimate coded values already included in the data set
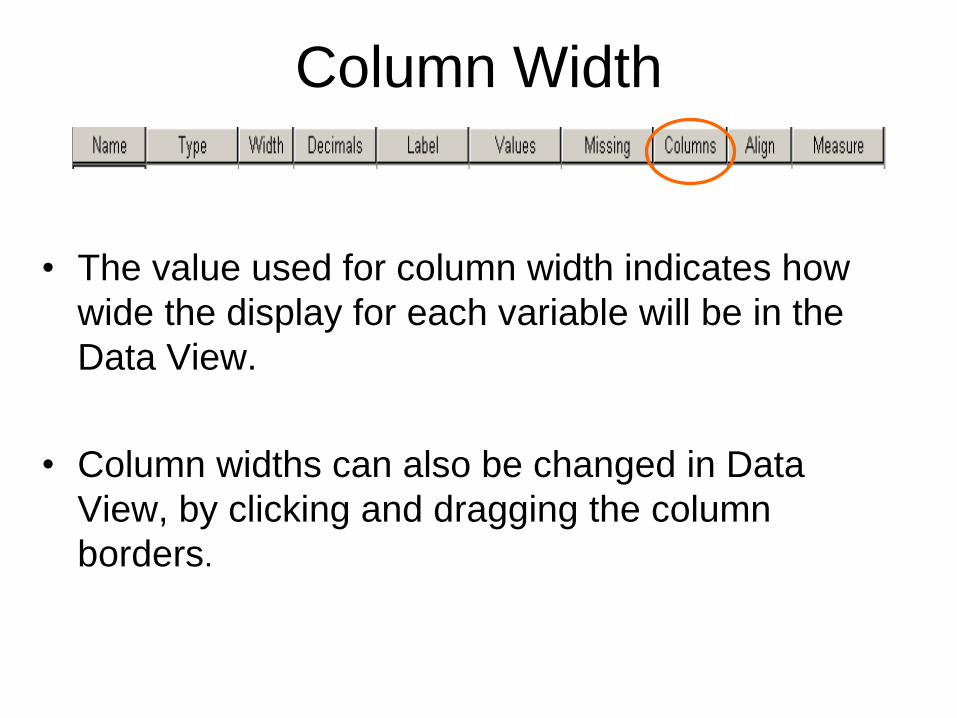
• The value used for column width indicates how
wide the display for each variable will be in the
Data View.
• Column widths can also be changed in Data
View, by clicking and dragging the column
borders.
Column Width
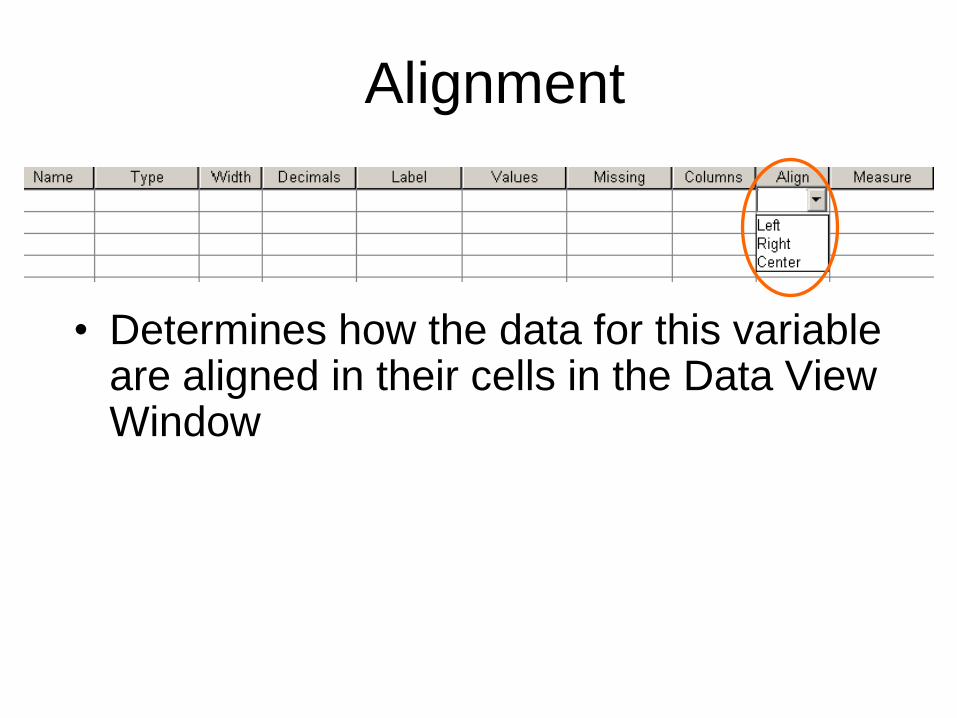
• Determines how the data for this variable are aligned in their cells in the Data View Window
Alignment
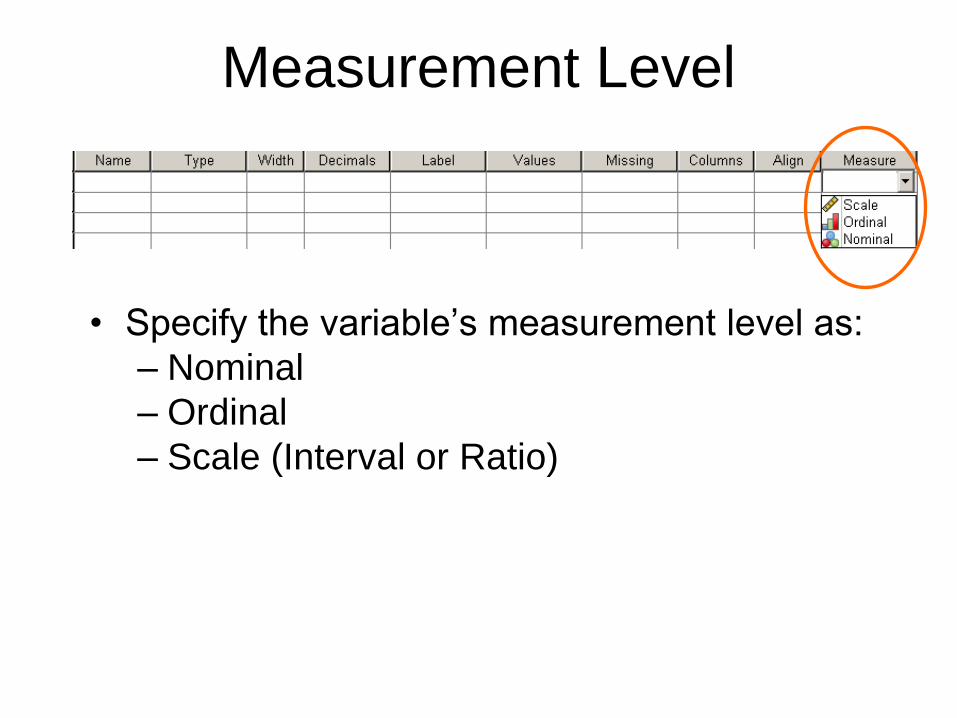
• Specify the variable’s measurement level as:
– Nominal
– Ordinal
– Scale (Interval or Ratio)
Measurement Level
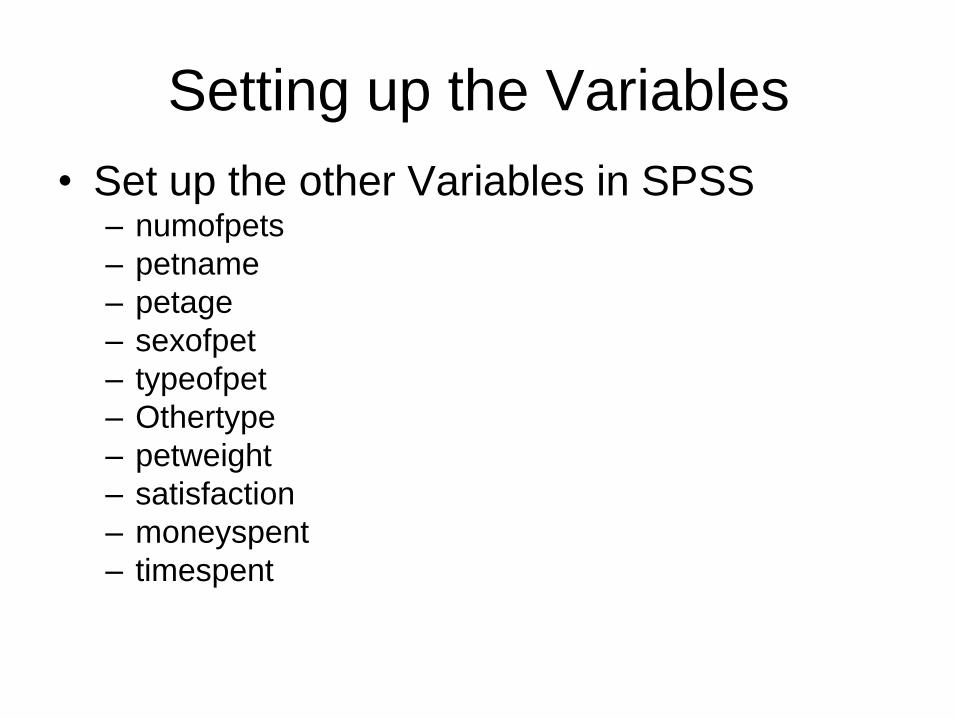
Setting up the Variables
• Set up the other Variables in SPSS– numofpets
– petname
– petage
– sexofpet
– typeofpet
– Othertype
– petweight
– satisfaction
– moneyspent
– timespent
Setting Up the Variables
Setting Up the Variables
Pet Survey
Entering the Data
Pet Survey
We are very interested in learning more about the pets of students, faculty, and staff at the
University of Florida! Please take a few minutes to fill out the survey below. If you do not
have a pet, please feel free to imagine a “fantasy” pet and answer the questions with fantasy
data.
1. Please circle your average level of happiness on a scale of 1 (extremely unhappy)) to 10
(extremely happy))
(extremely unhappy) 1 2 3 4 5 6 7 8 9 10 (extremely happy)
2. How many pets do you own? ______3_____ pets
3. What is the name of the pet you have owned the longest (or the name of your fantasy
pet)? ____Whiskers___
The next set of questions will apply to the pet you have owned for the longest amount of
time (or your fantasy pet).
4. How old is this pet? ______3.5____ years
Pet Survey (cont’d)
5. What is the sex of your pet? 1 Male x 2 Female
6. What type of animal is this pet? 1 Dog x 2 Cat 3 Bird 4 Fish
5 Other, please specify _________________
7. How much does your pet weigh? _______3.5_______lbs
8. How satisfied are you with owning this pet?
1 Very dissatisfied 2 Dissatisfied 3 Neutral x 4 Satisfied 5 Very satisfied
9. How much money (approximately) do you spend on this pet per year (for food, toys, vet
visits, etc.)? $ _____350.00_____
10. How much time do you spend each week caring for, exercising or playing with your
pet? _____12.0_____ hours
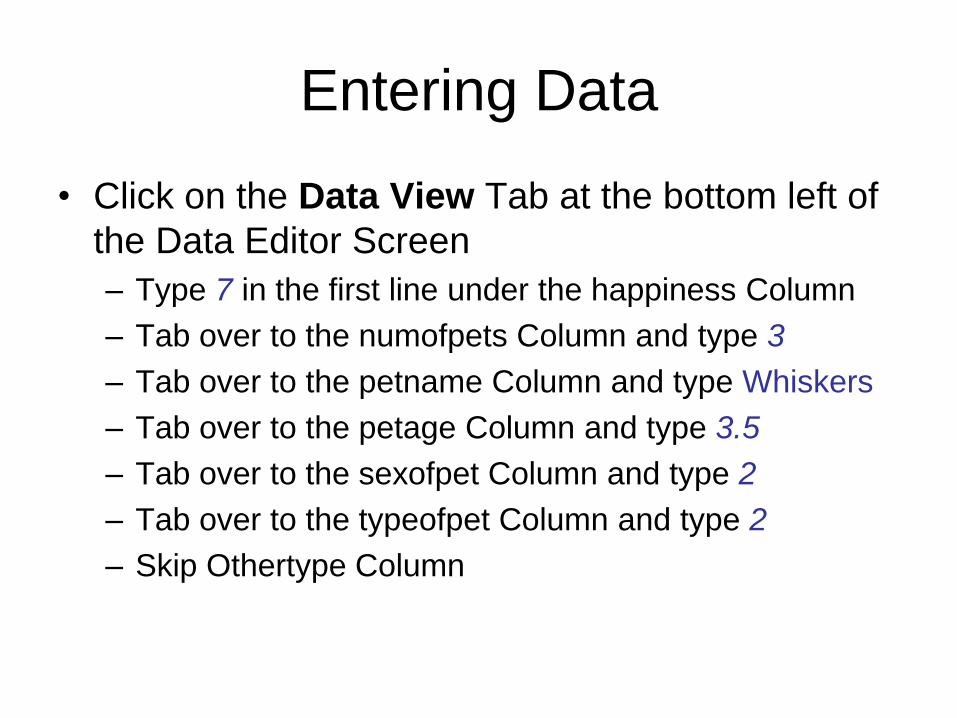
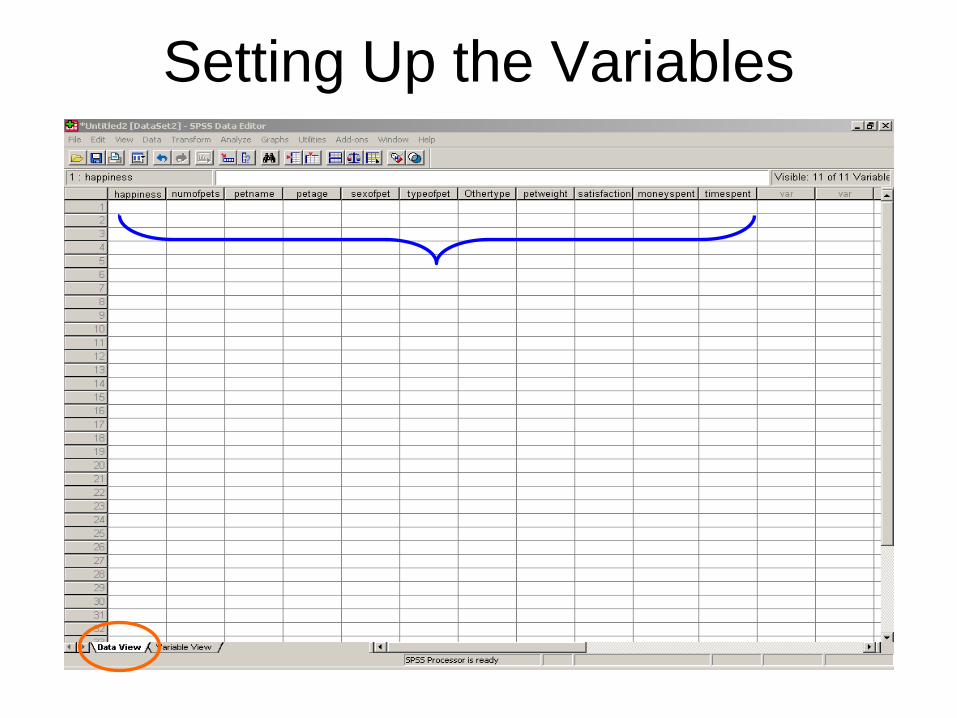
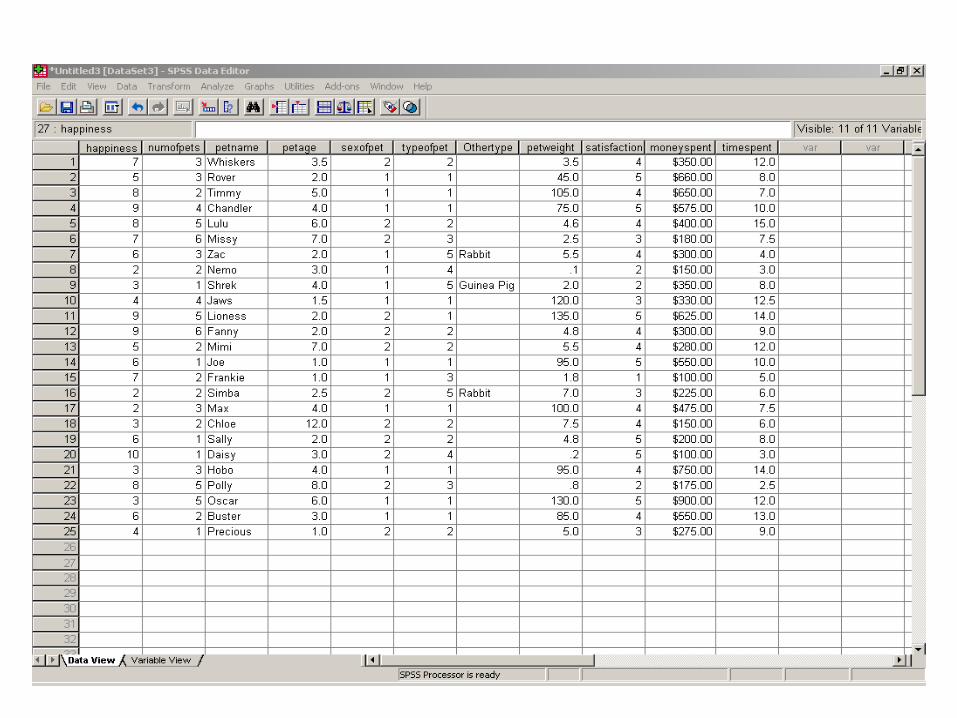
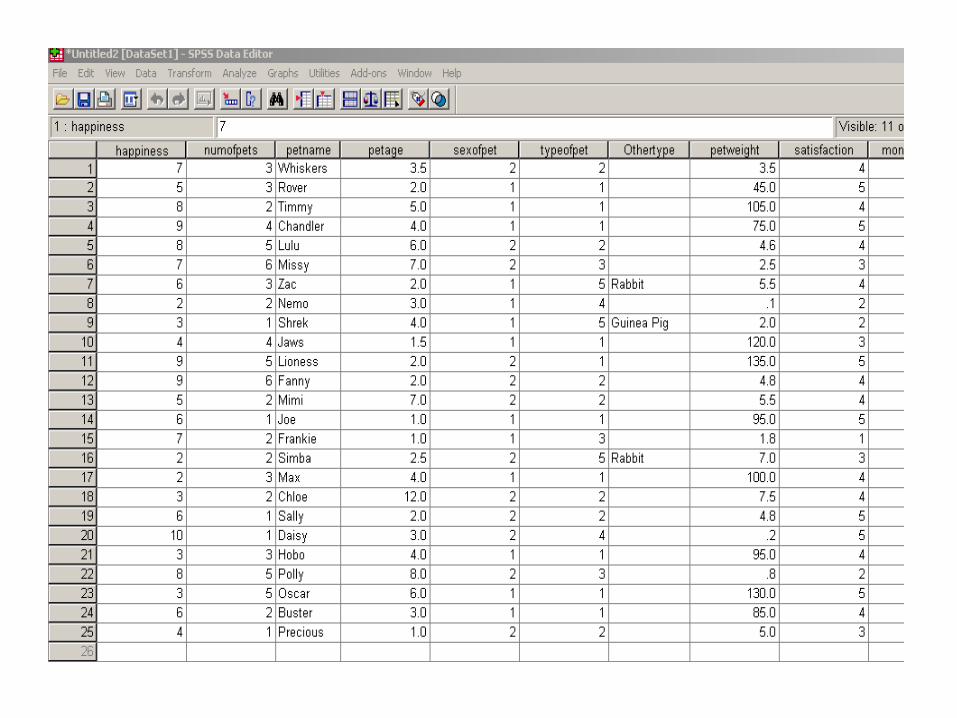
Entering Data
• Click on the Data View Tab at the bottom left of
the Data Editor Screen
– Type 7 in the first line under the happiness Column
– Tab over to the numofpets Column and type 3
– Tab over to the petname Column and type Whiskers
– Tab over to the petage Column and type 3.5
– Tab over to the sexofpet Column and type 2
– Tab over to the typeofpet Column and type 2
– Skip Othertype Column
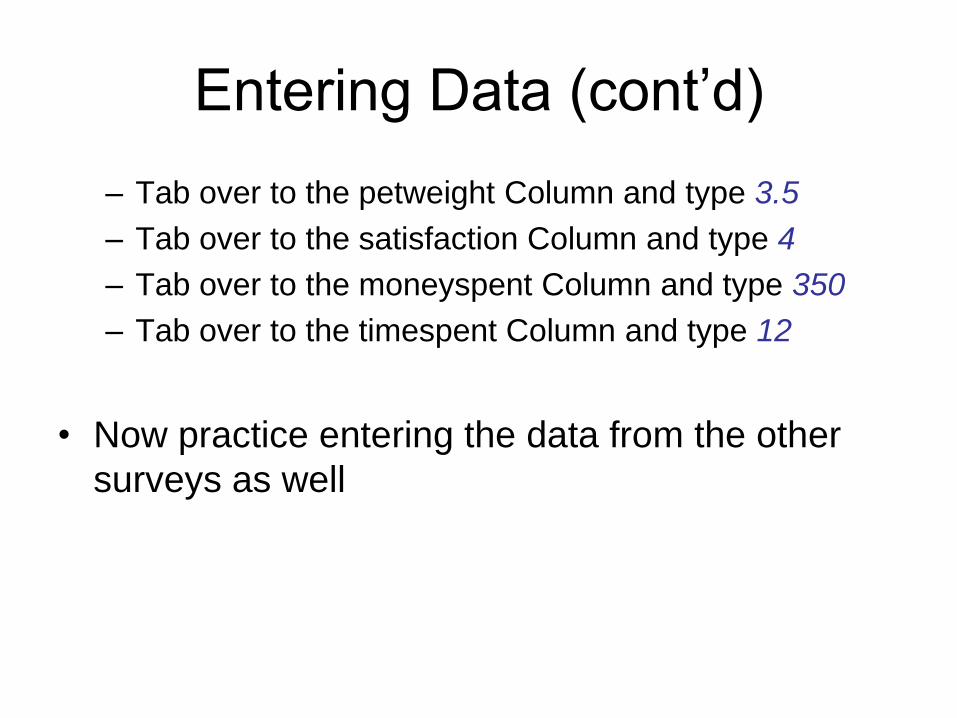
Entering Data (cont’d)
– Tab over to the petweight Column and type 3.5
– Tab over to the satisfaction Column and type 4
– Tab over to the moneyspent Column and type 350
– Tab over to the timespent Column and type 12
• Now practice entering the data from the other
surveys as well
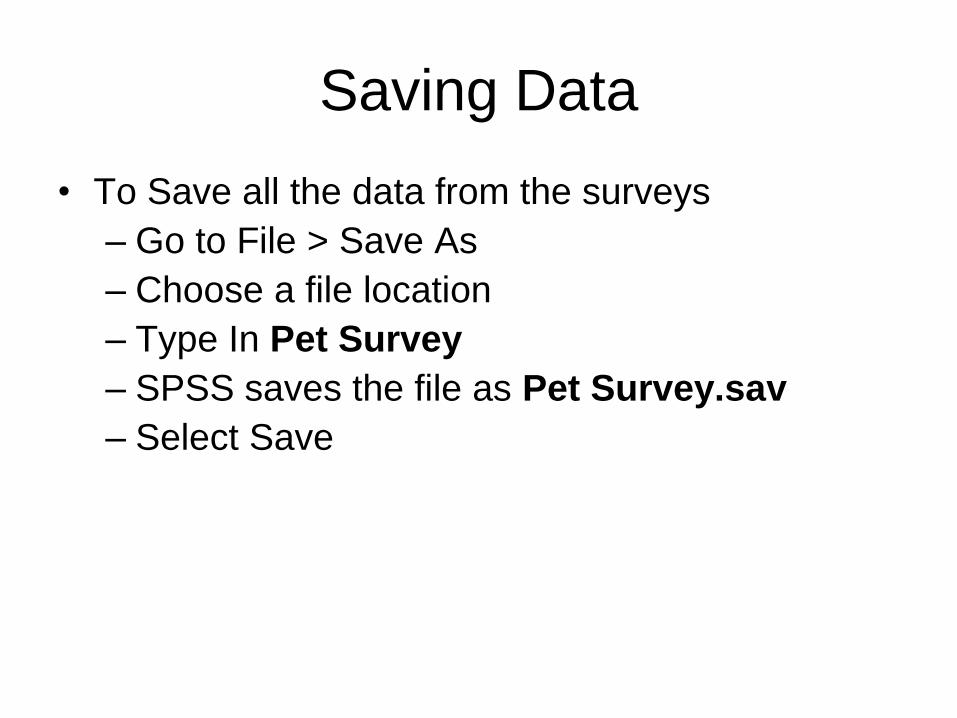
Saving Data
• To Save all the data from the surveys
– Go to File > Save As
– Choose a file location
– Type In Pet Survey
– SPSS saves the file as Pet Survey.sav
– Select Save
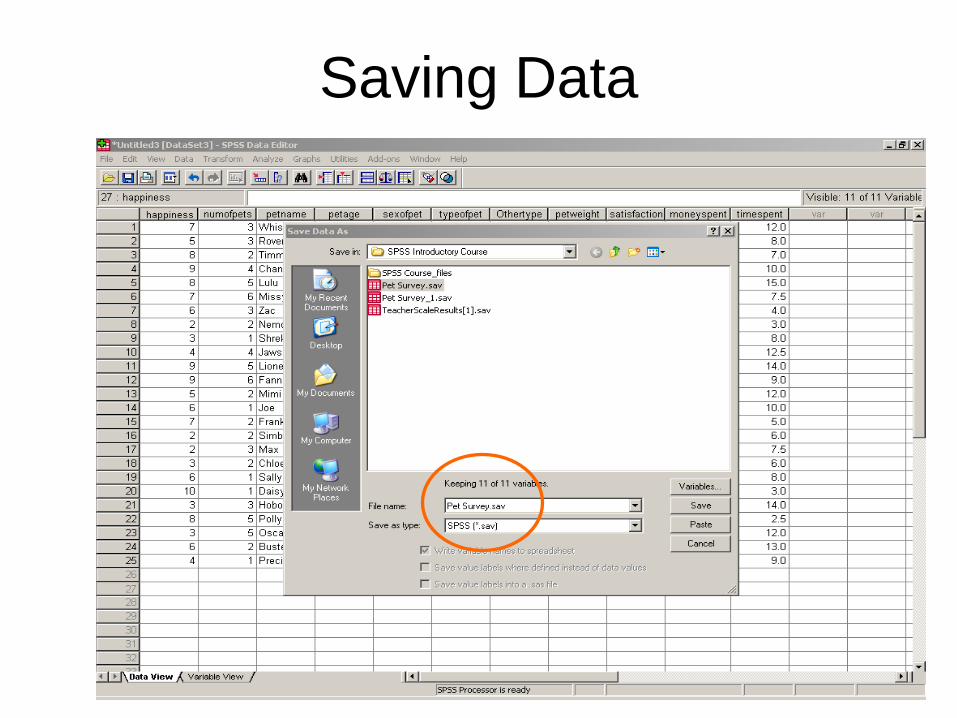
Saving Data
Session 4:
Importing Data into SPSS
Importing an Excel File
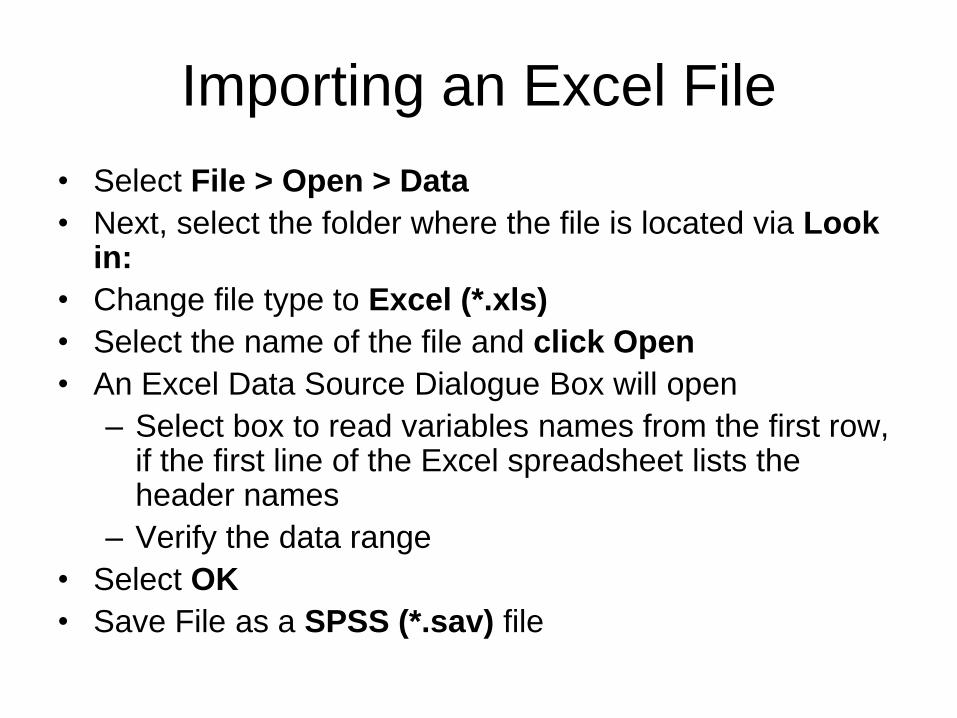
Importing an Excel File
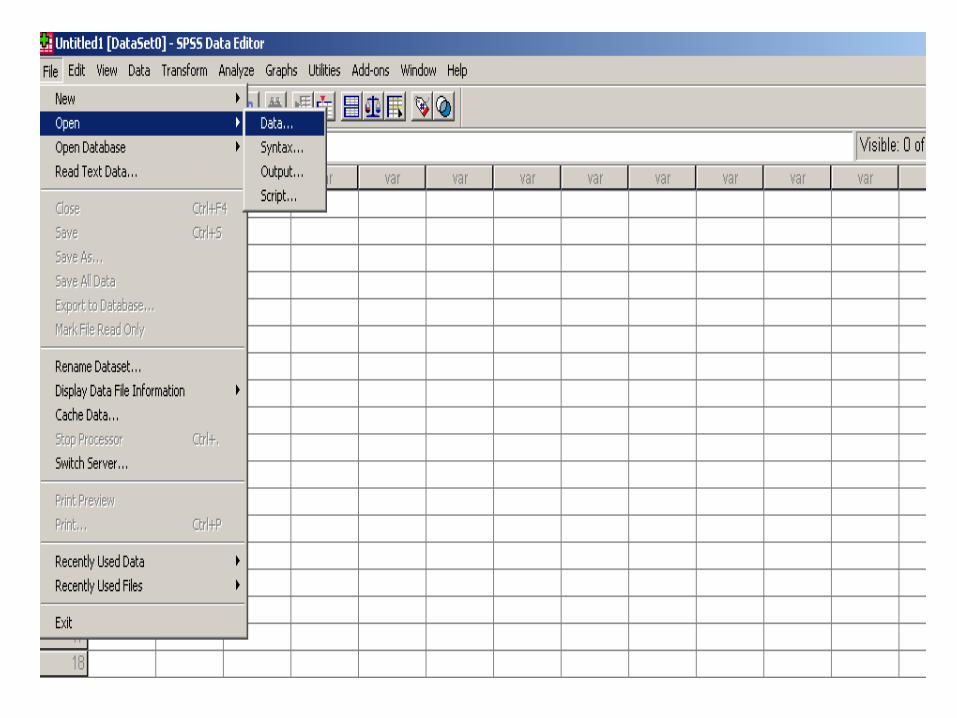
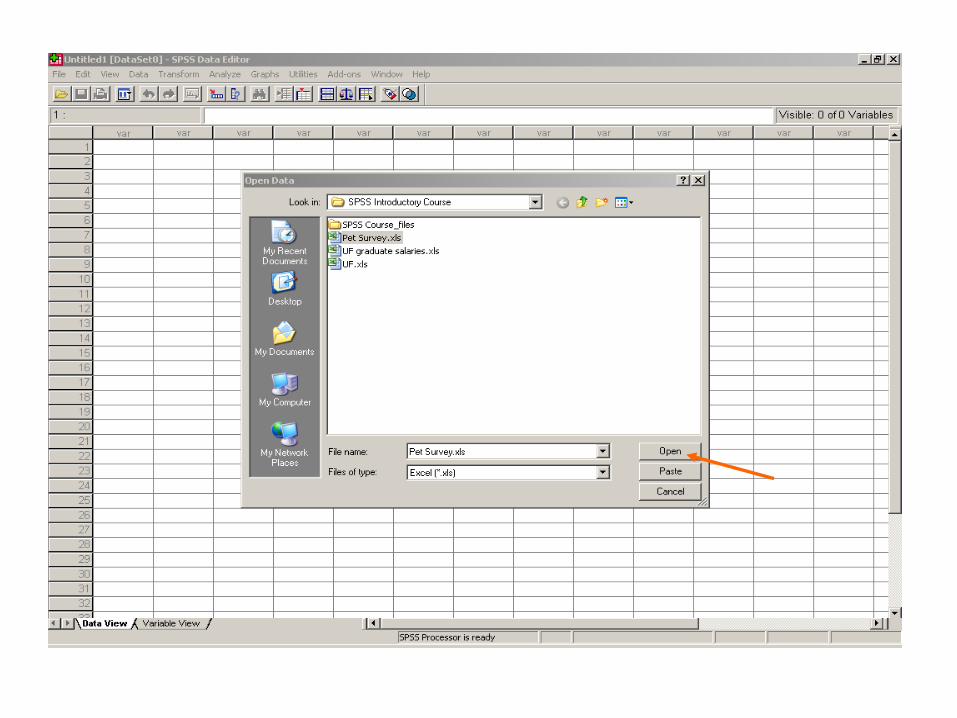
• Select File > Open > Data
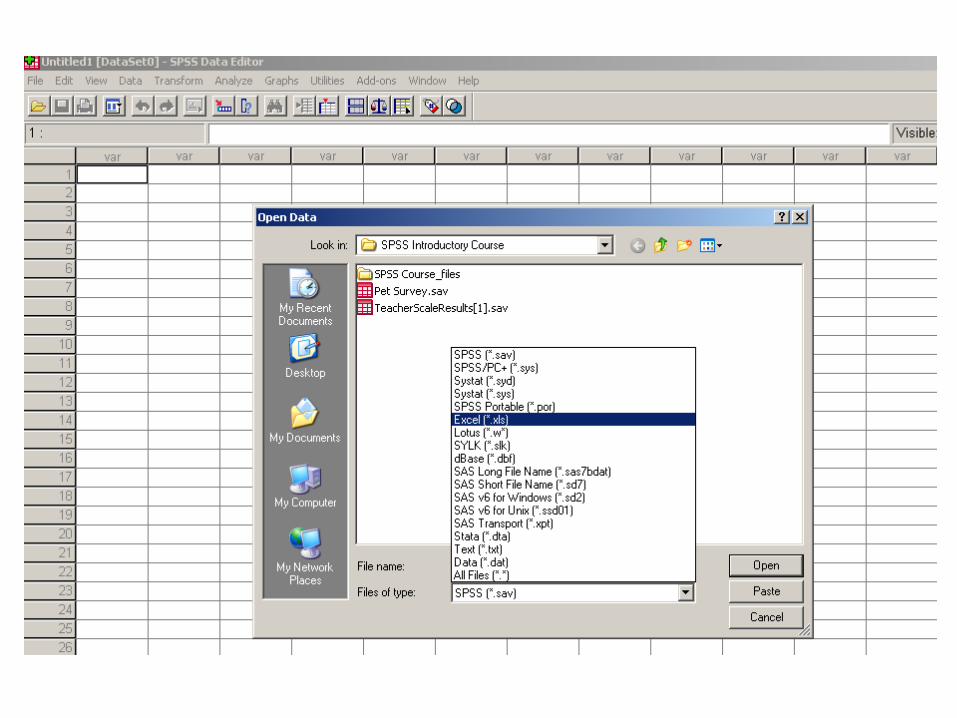
• Next, select the folder where the file is located via Look in:
• Change file type to Excel (*.xls)
• Select the name of the file and click Open
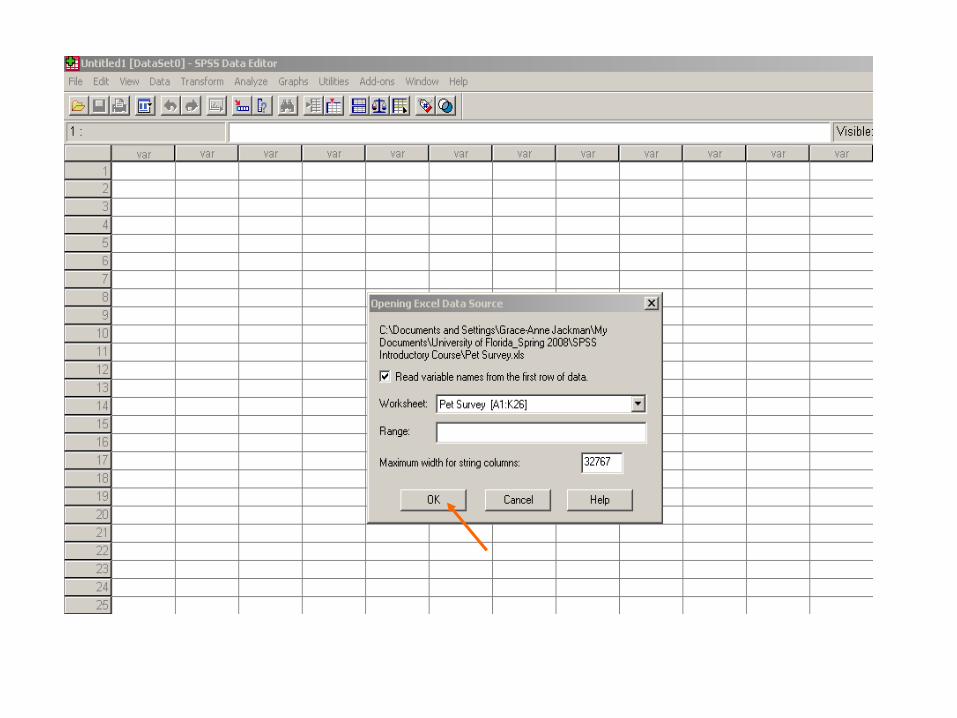
• An Excel Data Source Dialogue Box will open
– Select box to read variables names from the first row, if the first line of the Excel spreadsheet lists the header names
– Verify the data range
• Select OK
• Save File as a SPSS (*.sav) file
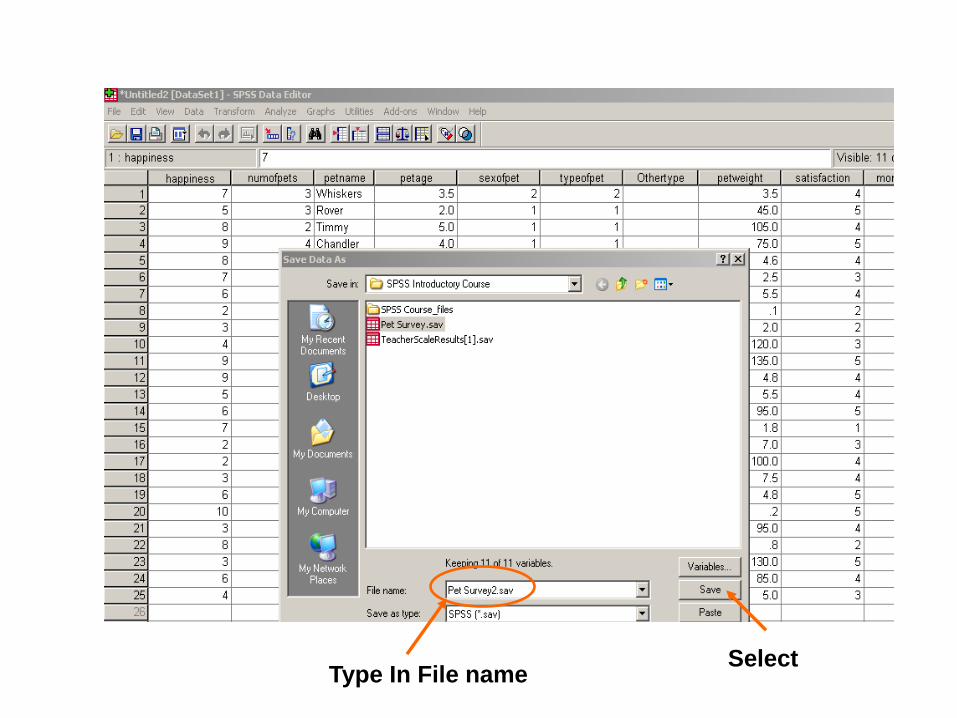
SelectType In File name
Session 5:
Simple Data Manipulations
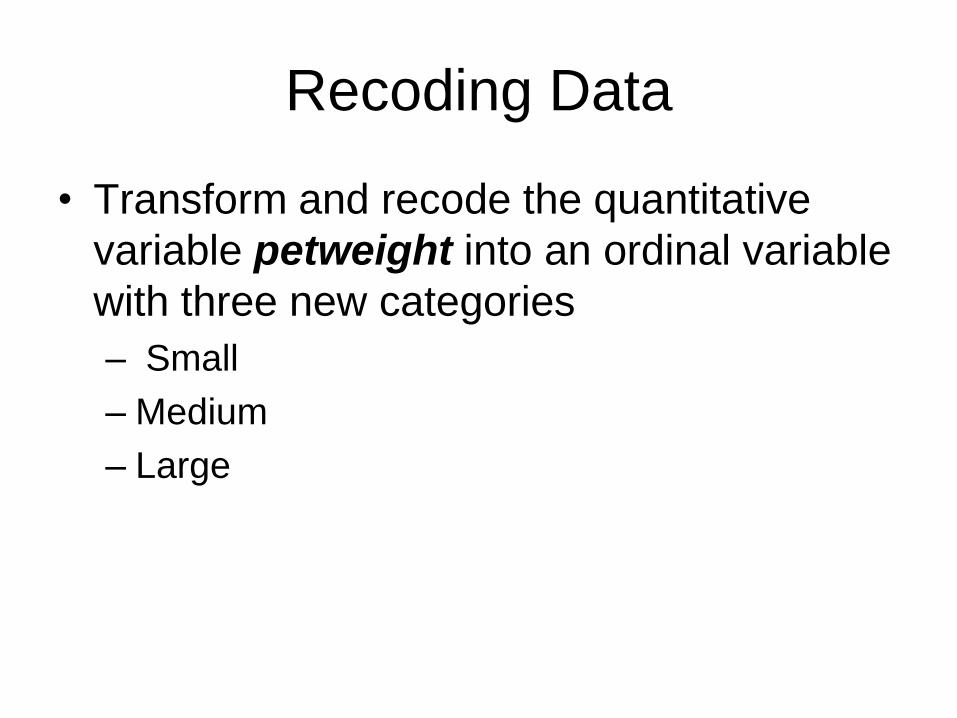
Recoding Data
• Transform and recode the quantitative
variable petweight into an ordinal variable
with three new categories
– Small
– Medium
– Large
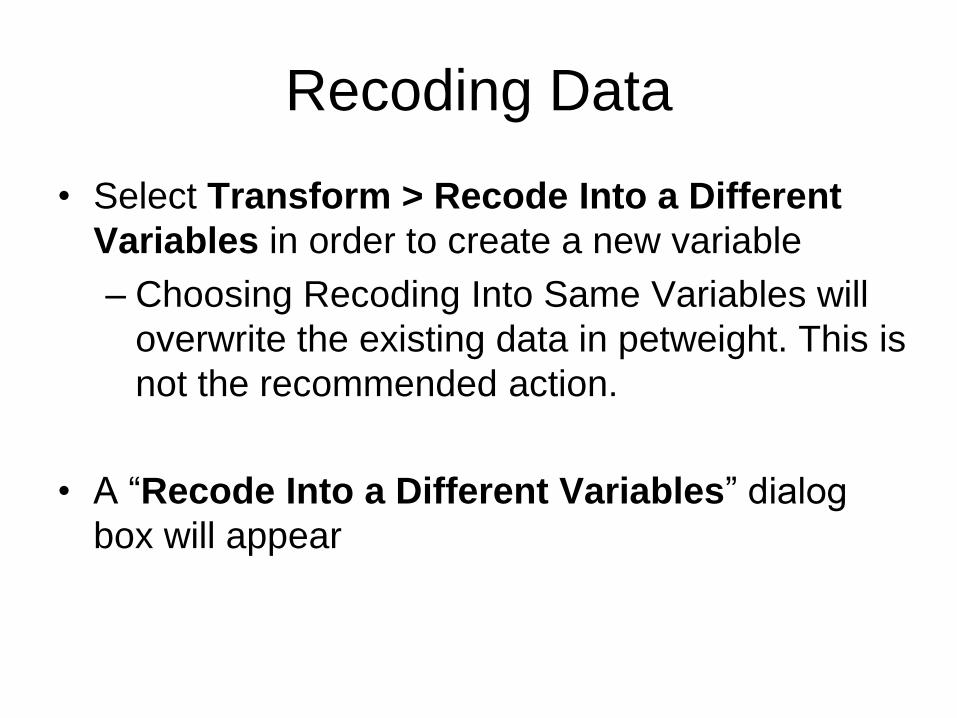
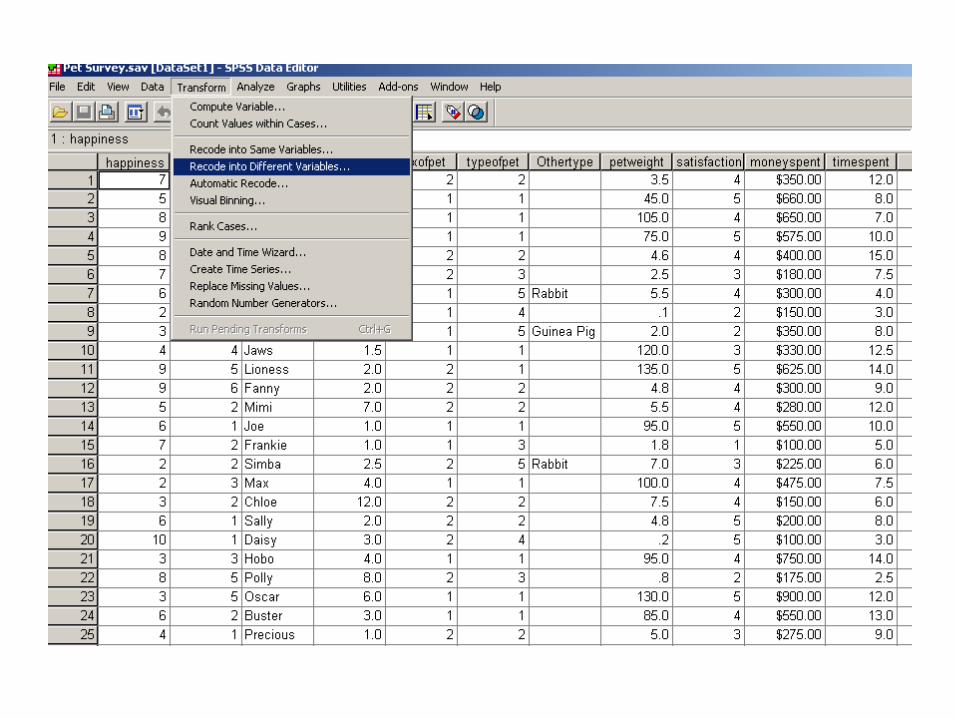
Recoding Data
• Select Transform > Recode Into a Different
Variables in order to create a new variable
– Choosing Recoding Into Same Variables will
overwrite the existing data in petweight. This is
not the recommended action.
• A “Recode Into a Different Variables” dialog
box will appear
Recoding Data
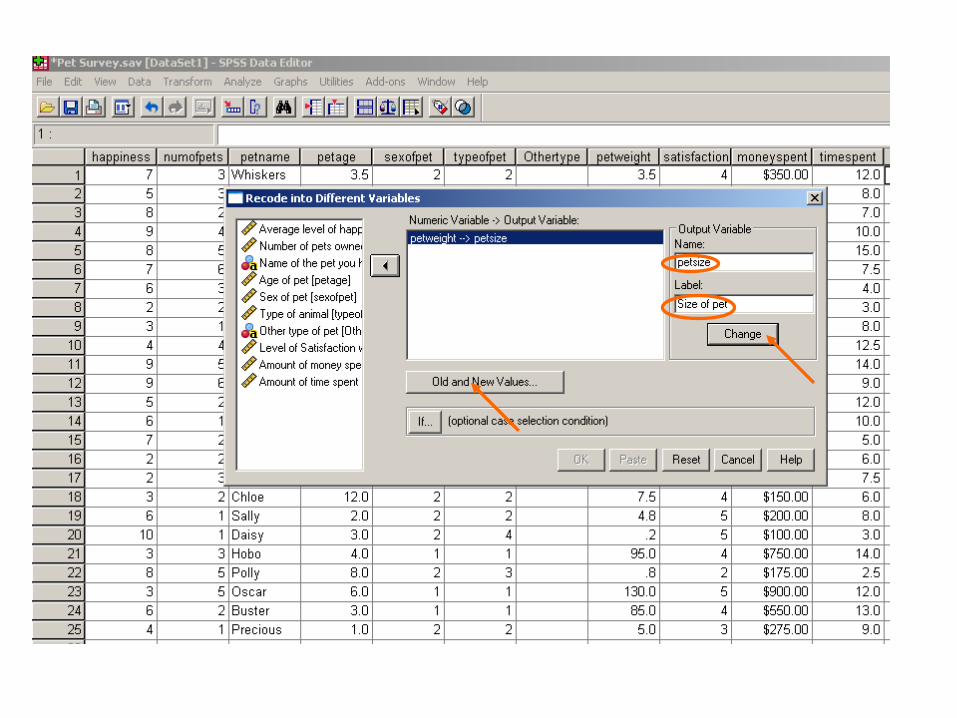
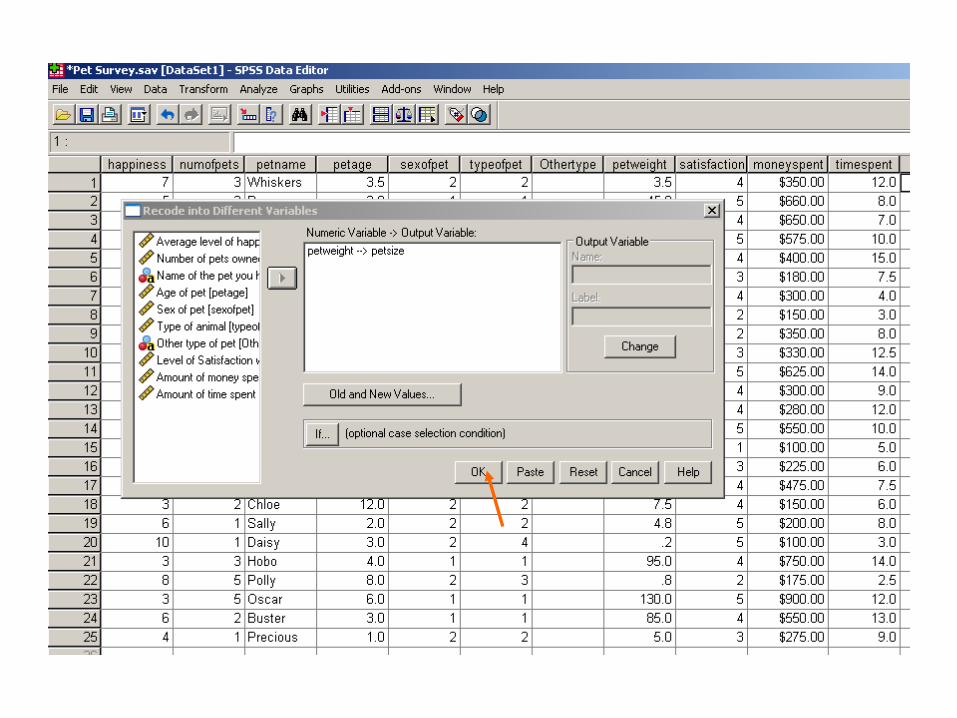
• Highlight the variable petweight and use the arrow to move that variable into the Input Variable Output Variable box.
• In the Name box under the Output Variable section, type the new variable name petsize and type the Variable Label Size of pet, then Click the CHANGE button
• Select the Old and New Values Button. This tell SPSS how to recode the data into our 3 new categories
• Another Dialog window will appear
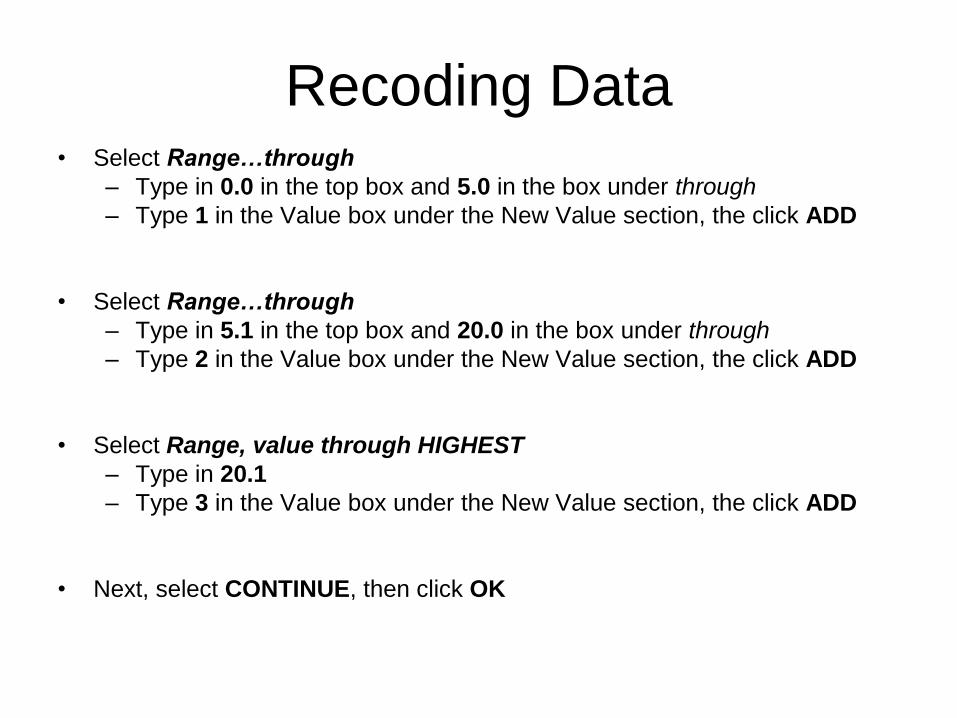
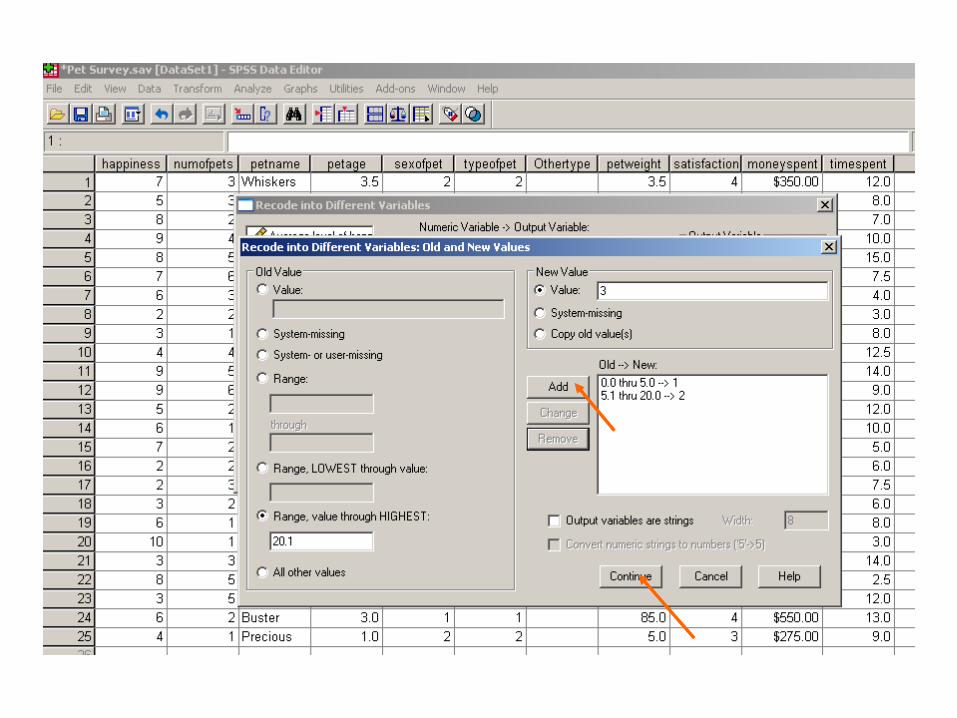
Recoding Data• Select Range…through
– Type in 0.0 in the top box and 5.0 in the box under through
– Type 1 in the Value box under the New Value section, the click ADD
• Select Range…through
– Type in 5.1 in the top box and 20.0 in the box under through
– Type 2 in the Value box under the New Value section, the click ADD
• Select Range, value through HIGHEST
– Type in 20.1
– Type 3 in the Value box under the New Value section, the click ADD
• Next, select CONTINUE, then click OK
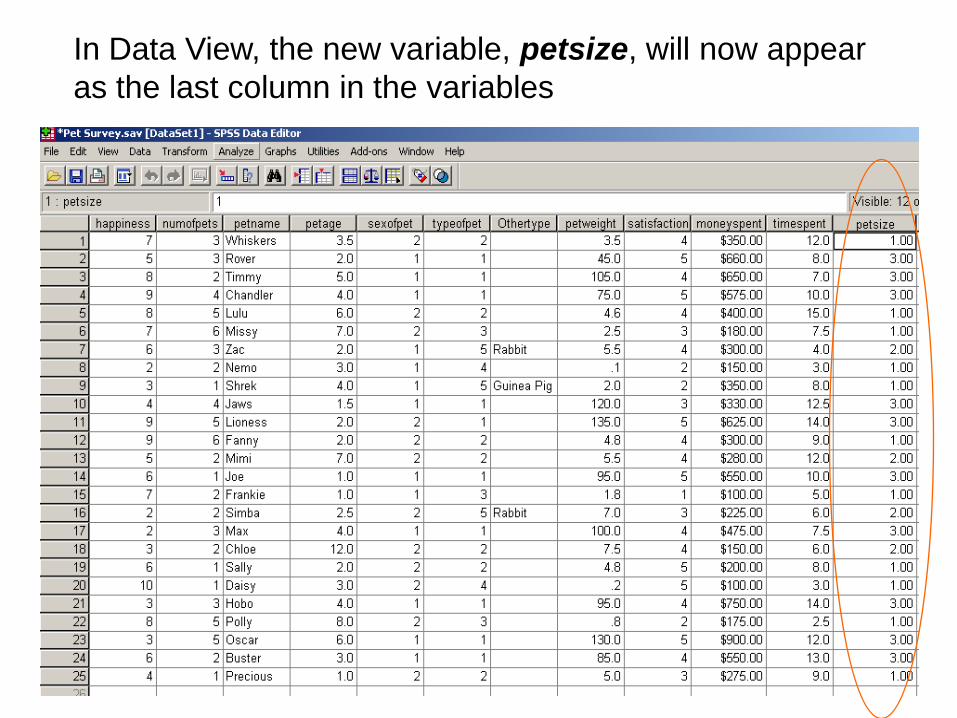
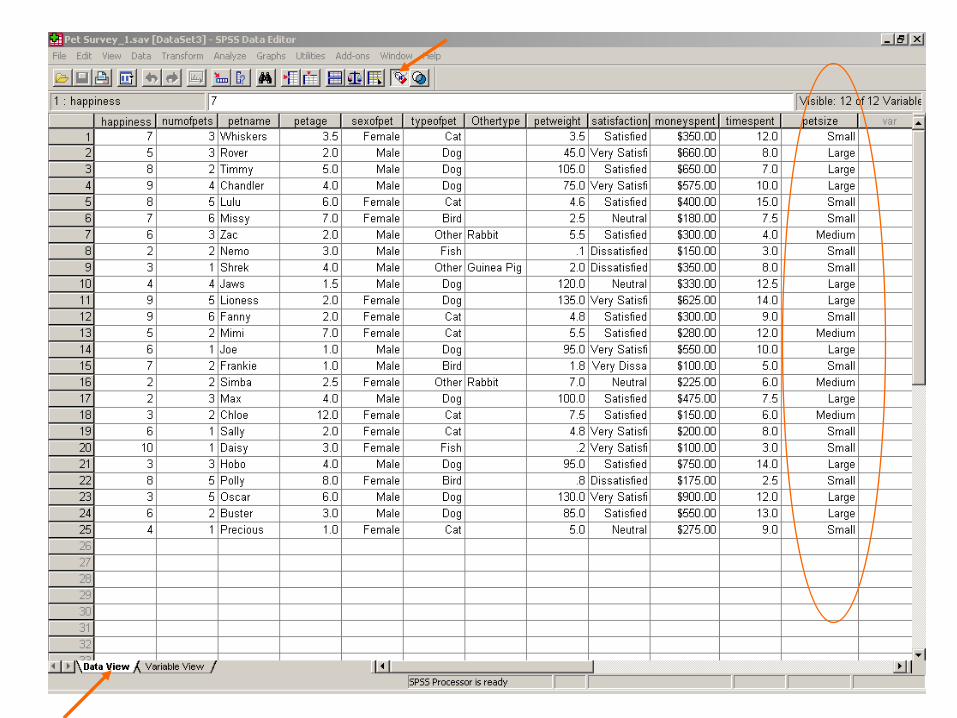
In Data View, the new variable, petsize, will now appear
as the last column in the variables
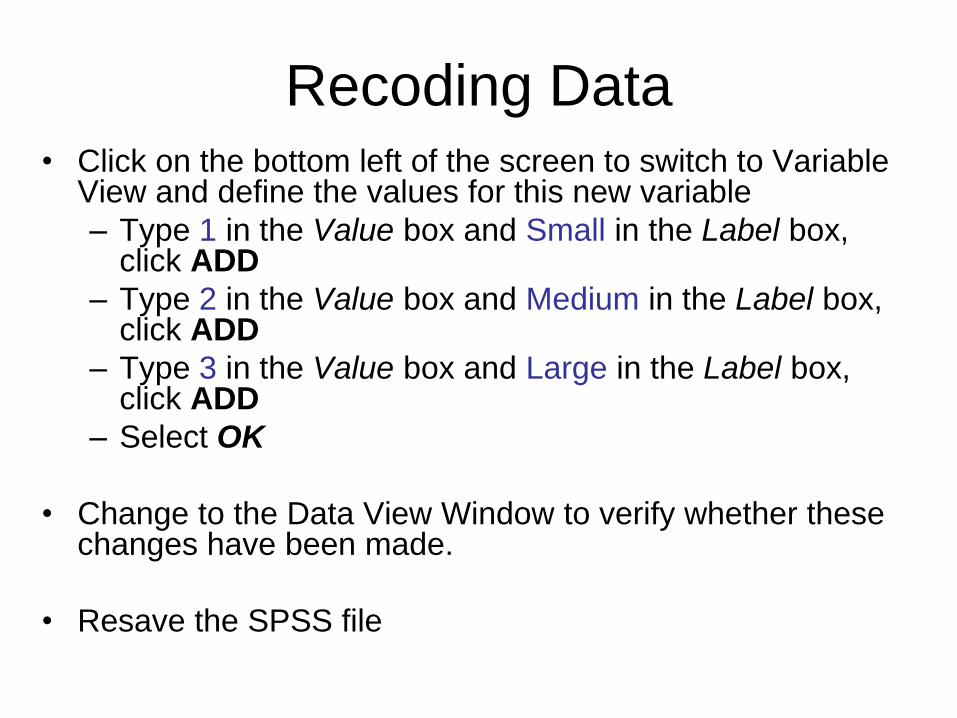
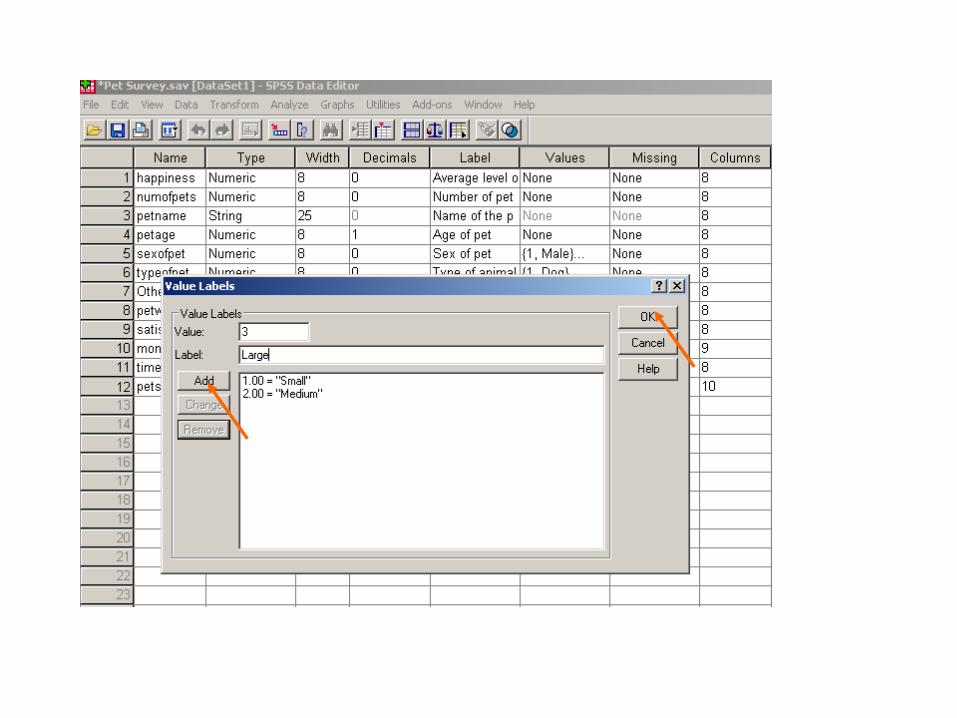
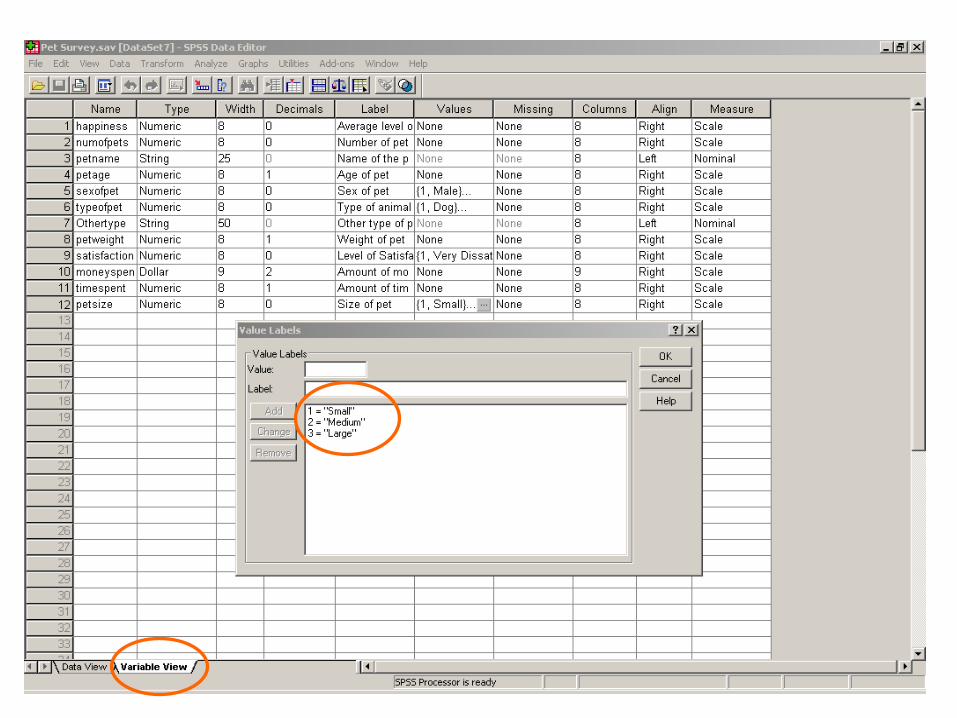
Recoding Data• Click on the bottom left of the screen to switch to Variable
View and define the values for this new variable
– Type 1 in the Value box and Small in the Label box, click ADD
– Type 2 in the Value box and Medium in the Label box, click ADD
– Type 3 in the Value box and Large in the Label box, click ADD
– Select OK
• Change to the Data View Window to verify whether these changes have been made.
• Resave the SPSS file
Session 6:
Performing Simple Descriptive
Statistics
The type of data determines the choice of statistical
analysis
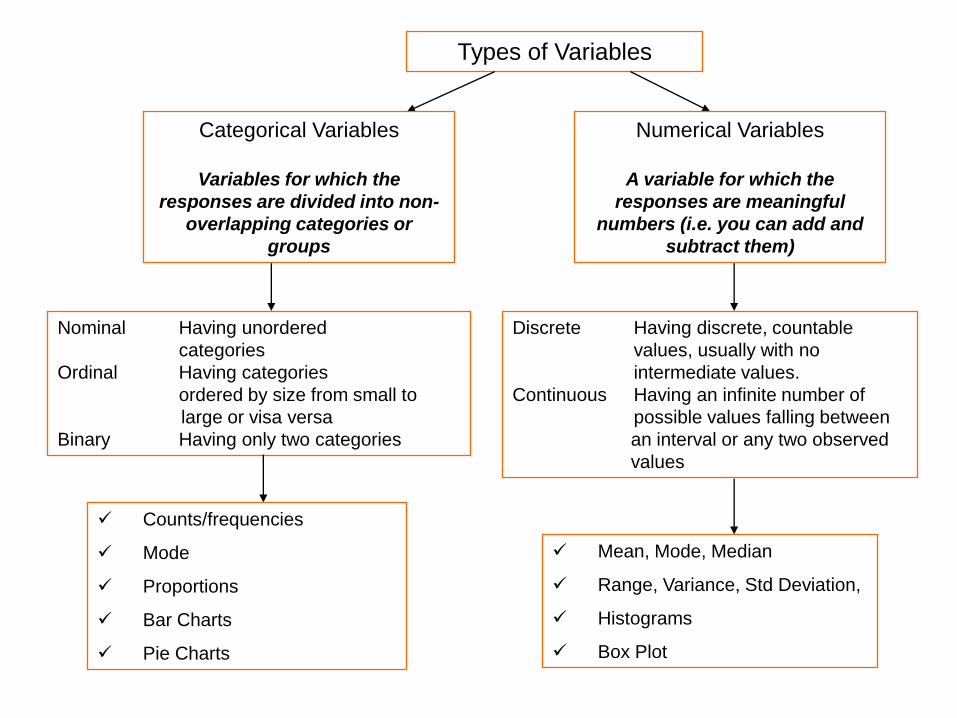
Types of Variables
Categorical Variables
Variables for which the
responses are divided into non-
overlapping categories or
groups
Numerical Variables
A variable for which the
responses are meaningful
numbers (i.e. you can add and
subtract them)
Nominal Having unordered
categories
Ordinal Having categories
ordered by size from small to
large or visa versa
Binary Having only two categories
Discrete Having discrete, countable
values, usually with no
intermediate values.
Continuous Having an infinite number of
possible values falling between
an interval or any two observed
values
Counts/frequencies
Mode
Proportions
Bar Charts
Pie Charts
Mean, Mode, Median
Range, Variance, Std Deviation,
Histograms
Box Plot
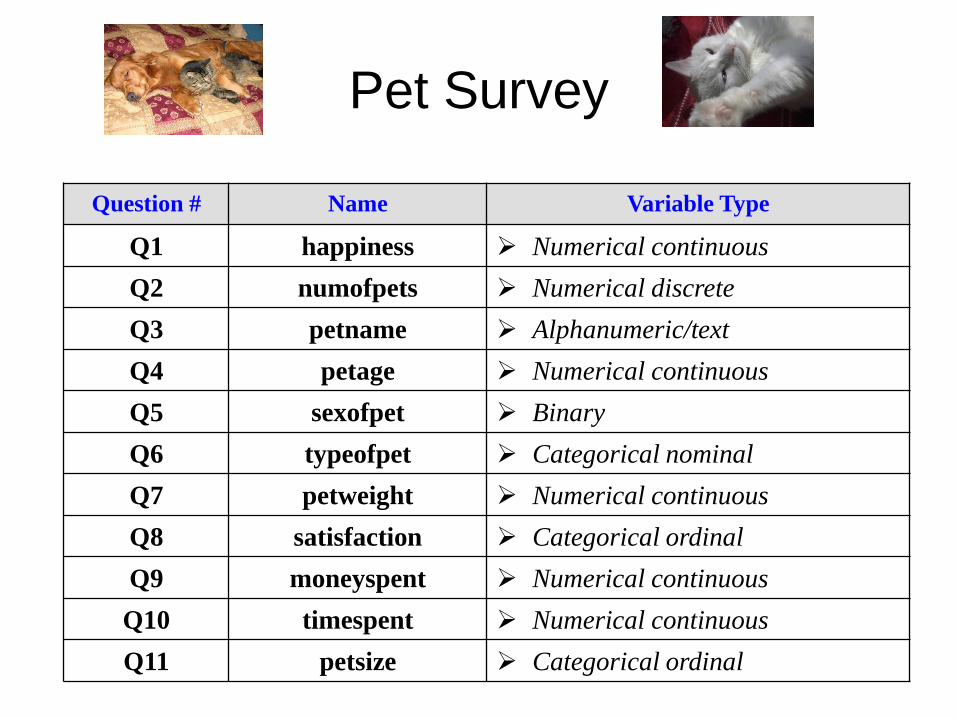
Pet Survey
Question # Name Variable Type
Q1 happiness Numerical continuous
Q2 numofpets Numerical discrete
Q3 petname Alphanumeric/text
Q4 petage Numerical continuous
Q5 sexofpet Binary
Q6 typeofpet Categorical nominal
Q7 petweight Numerical continuous
Q8 satisfaction Categorical ordinal
Q9 moneyspent Numerical continuous
Q10 timespent Numerical continuous
Q11 petsize Categorical ordinal
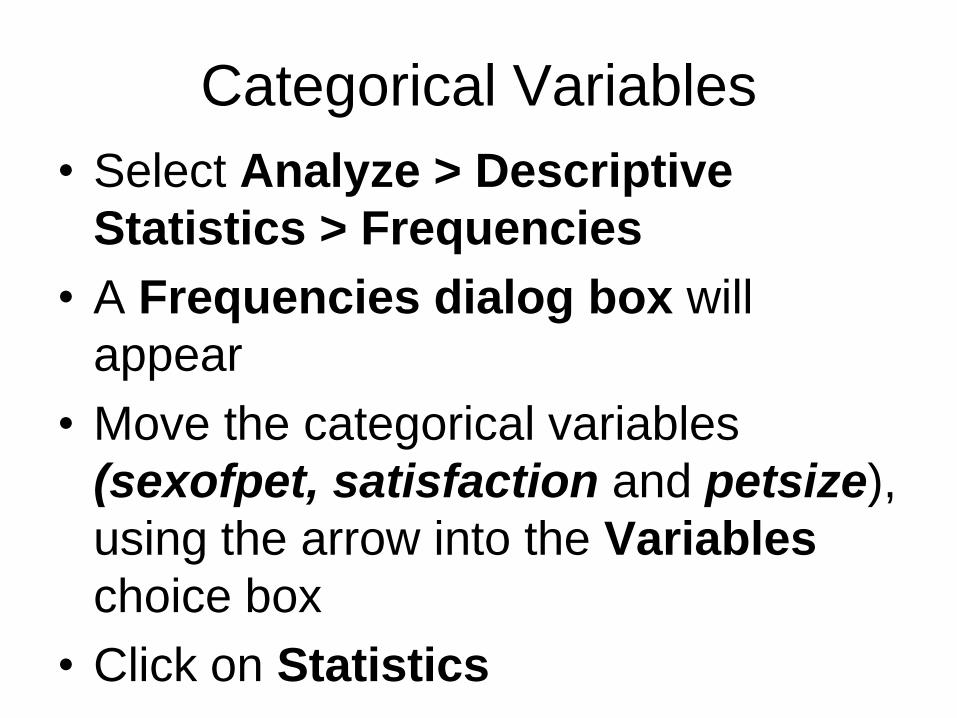
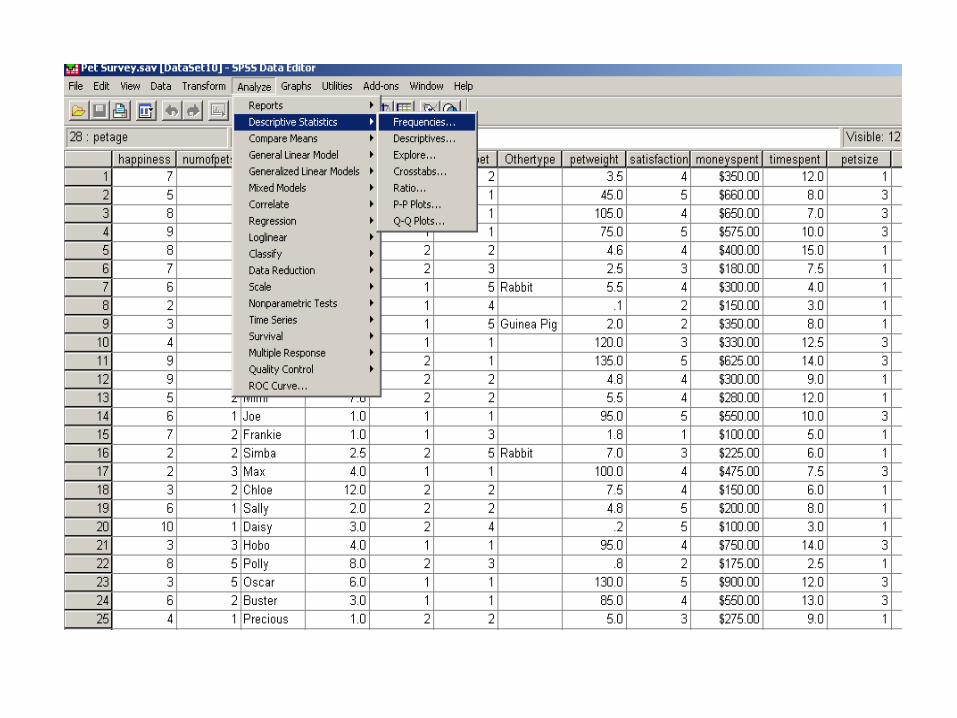
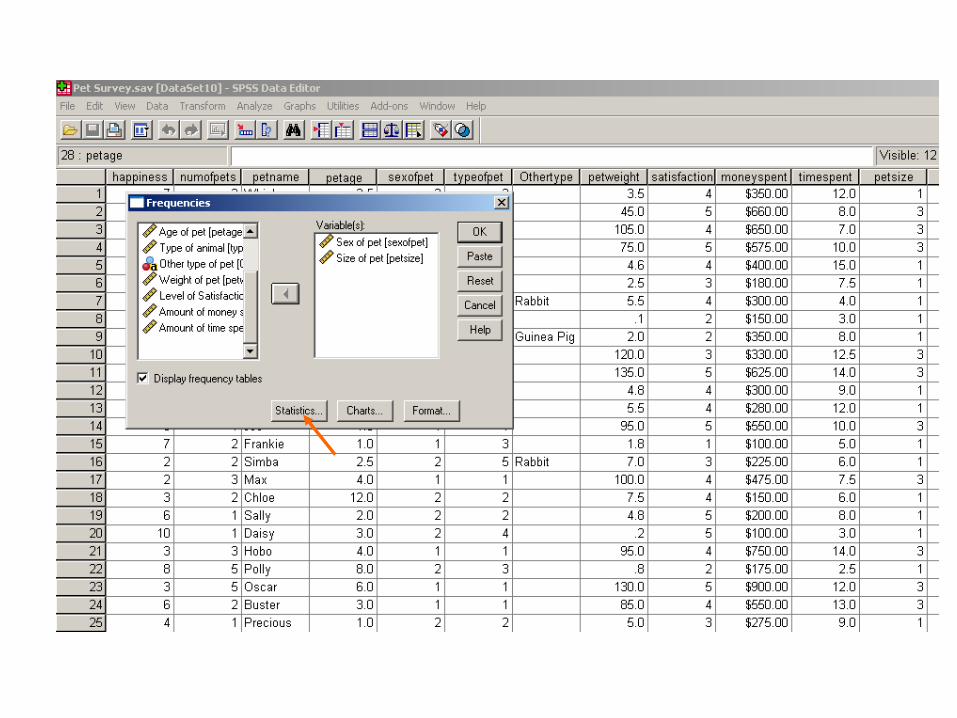
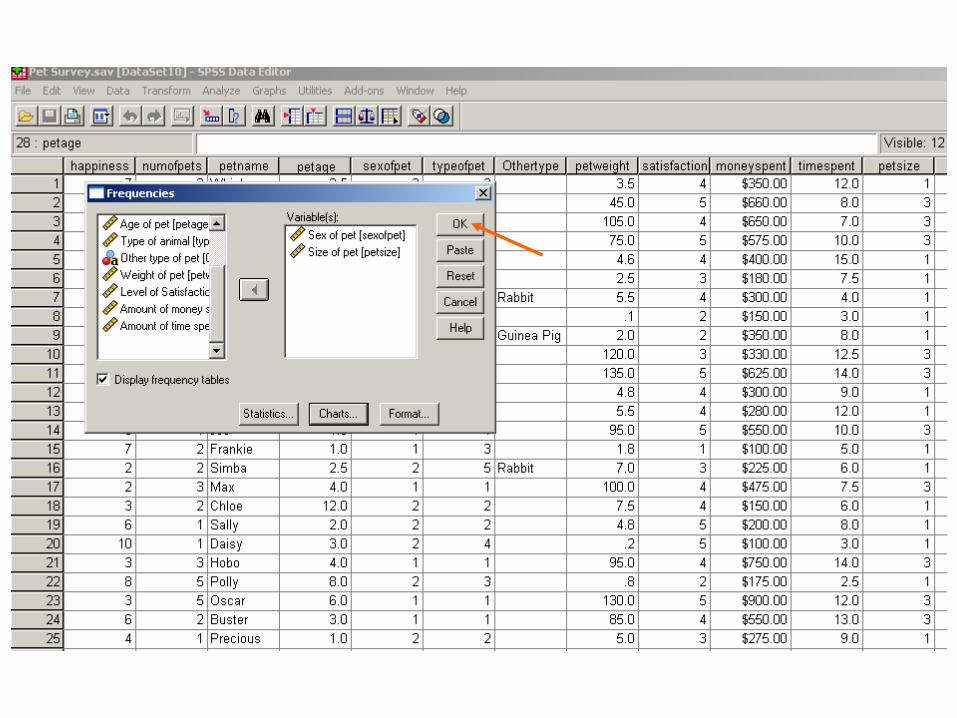
Categorical Variables
• Select Analyze > Descriptive
Statistics > Frequencies
• A Frequencies dialog box will
appear
• Move the categorical variables
(sexofpet, satisfaction and petsize),
using the arrow into the Variables
choice box
• Click on Statistics
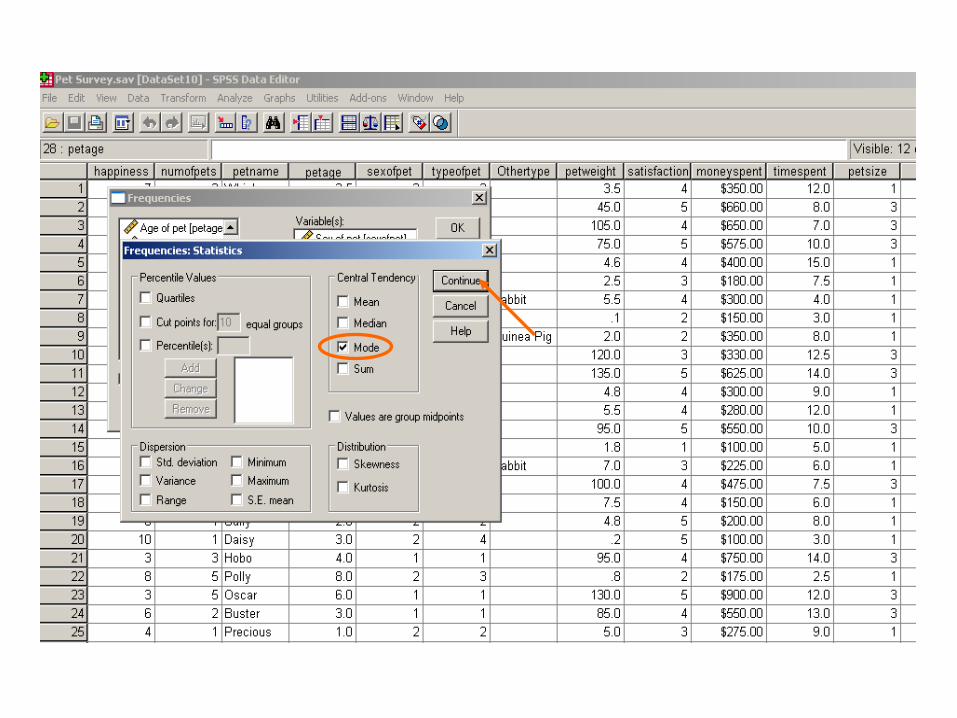
Categorical Variables
• Under Central Tendency, select Mode,
then Select CONTINUE
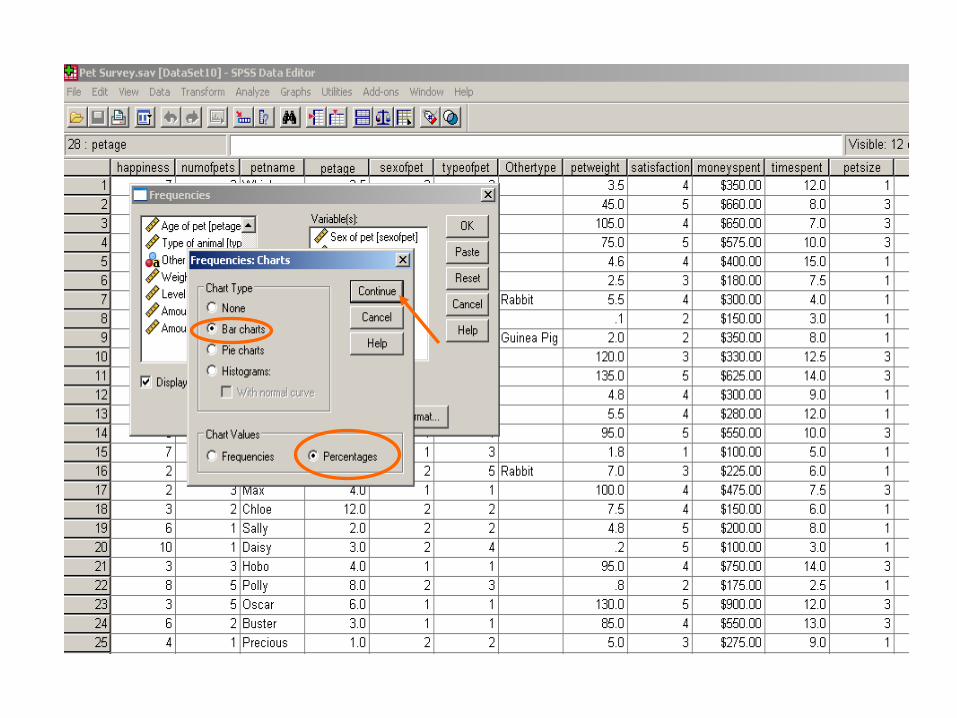
• Select Charts. Under Chart Type, select
Bar Charts. Under Chart Values, select
Percentages
• Select CONTINUE, then OK.
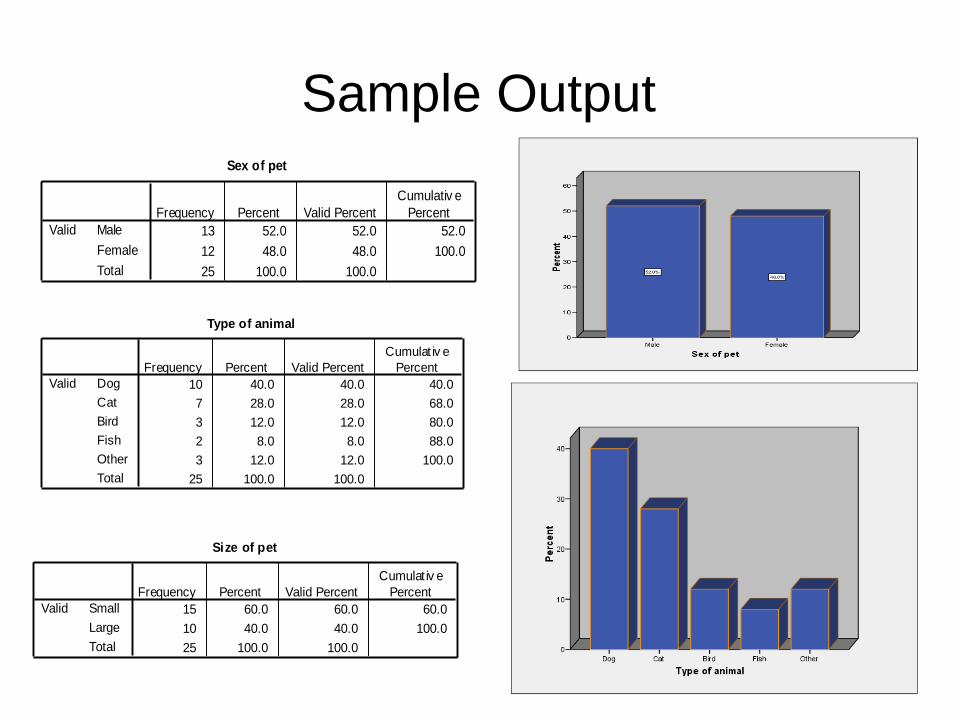
Sex of pet
13 52.0 52.0 52.0
12 48.0 48.0 100.0
25 100.0 100.0
Male
Female
Total
Valid
Frequency Percent Valid Percent
Cumulativ e
Percent
Type of animal
10 40.0 40.0 40.0
7 28.0 28.0 68.0
3 12.0 12.0 80.0
2 8.0 8.0 88.0
3 12.0 12.0 100.0
25 100.0 100.0
Dog
Cat
Bird
Fish
Other
Total
Valid
Frequency Percent Valid Percent
Cumulat iv e
Percent
Size of pet
15 60.0 60.0 60.0
10 40.0 40.0 100.0
25 100.0 100.0
Small
Large
Total
Valid
Frequency Percent Valid Percent
Cumulat iv e
Percent
Sample Output
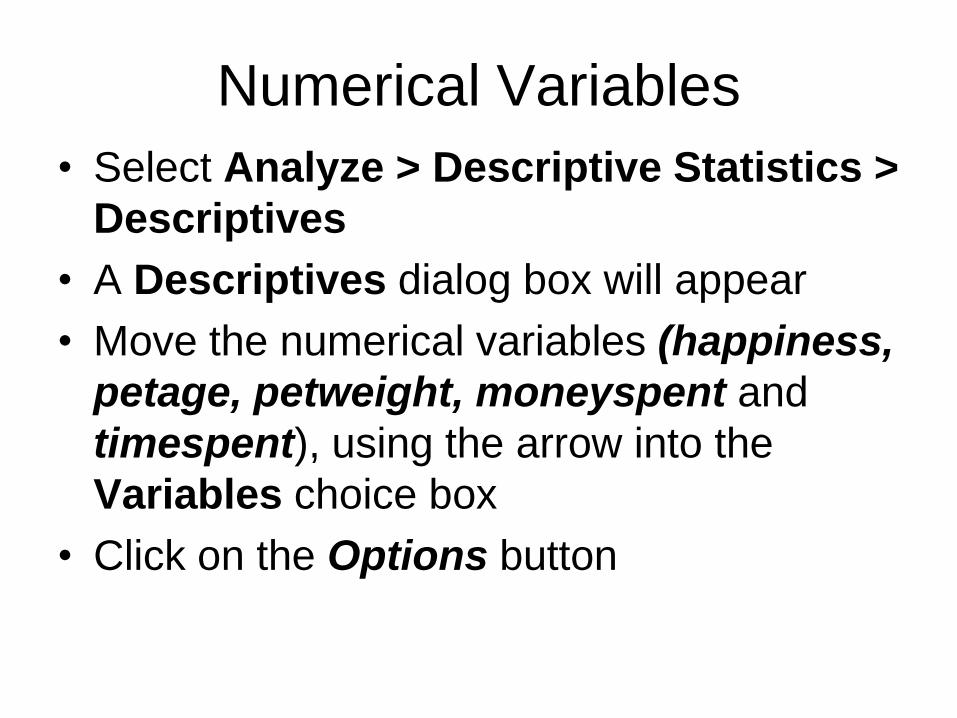
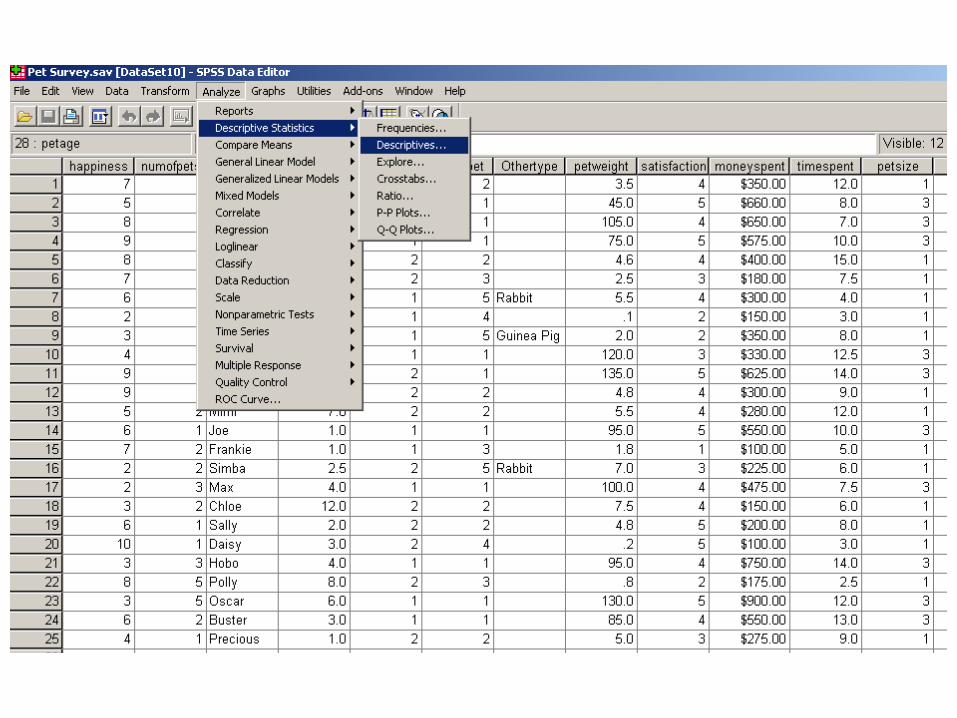
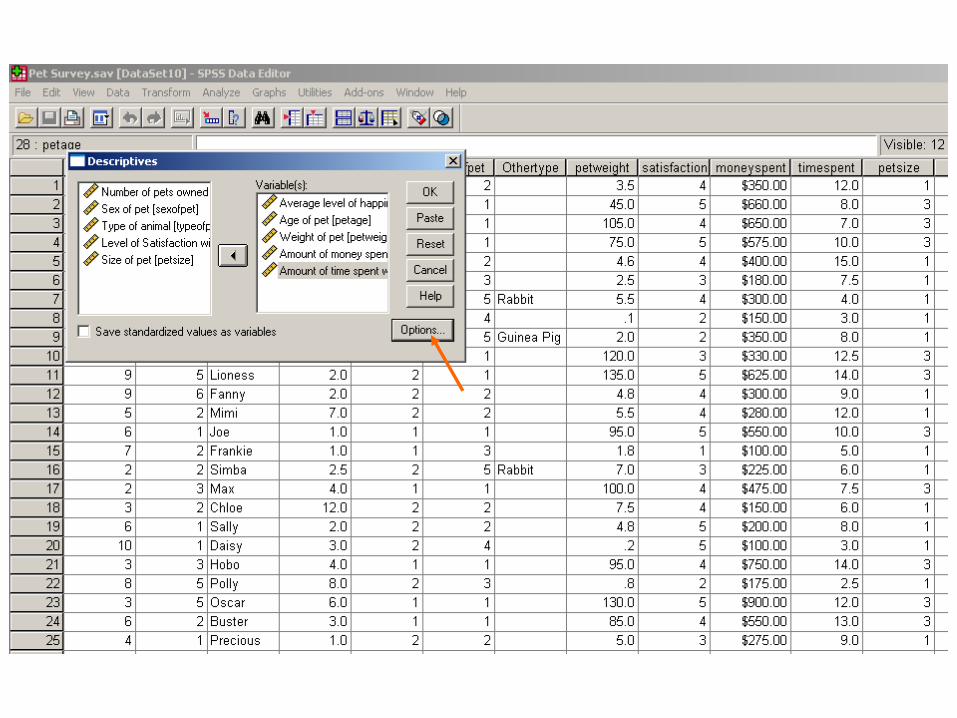
Numerical Variables
• Select Analyze > Descriptive Statistics >
Descriptives
• A Descriptives dialog box will appear
• Move the numerical variables (happiness,
petage, petweight, moneyspent and
timespent), using the arrow into the
Variables choice box
• Click on the Options button
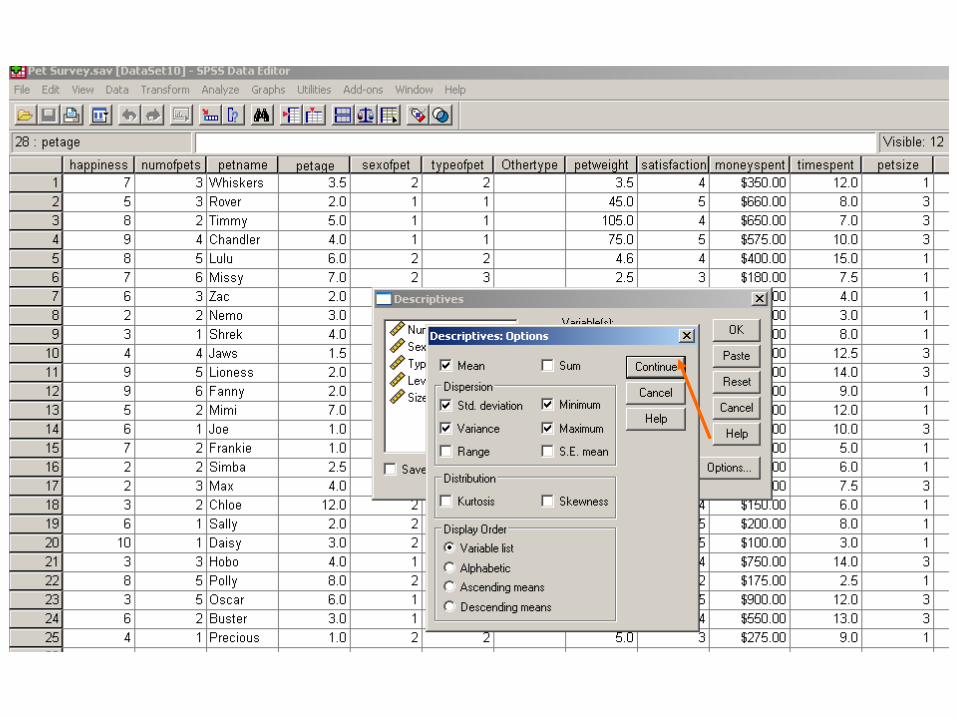
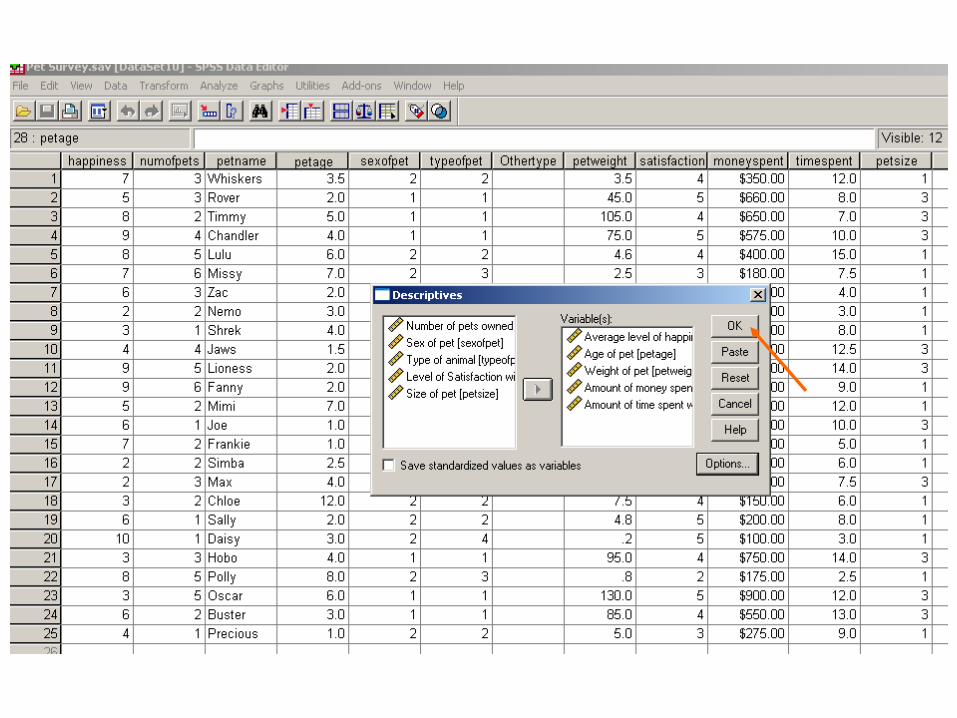
Numerical Variables
• Ensure that the options Mean, Std
Deviation, Minimum and Maximum are
selected
• If you are interested in the Skewness or
Kurtosis of the distribution you can select
those as well
• Select CONTINUE, then OK.
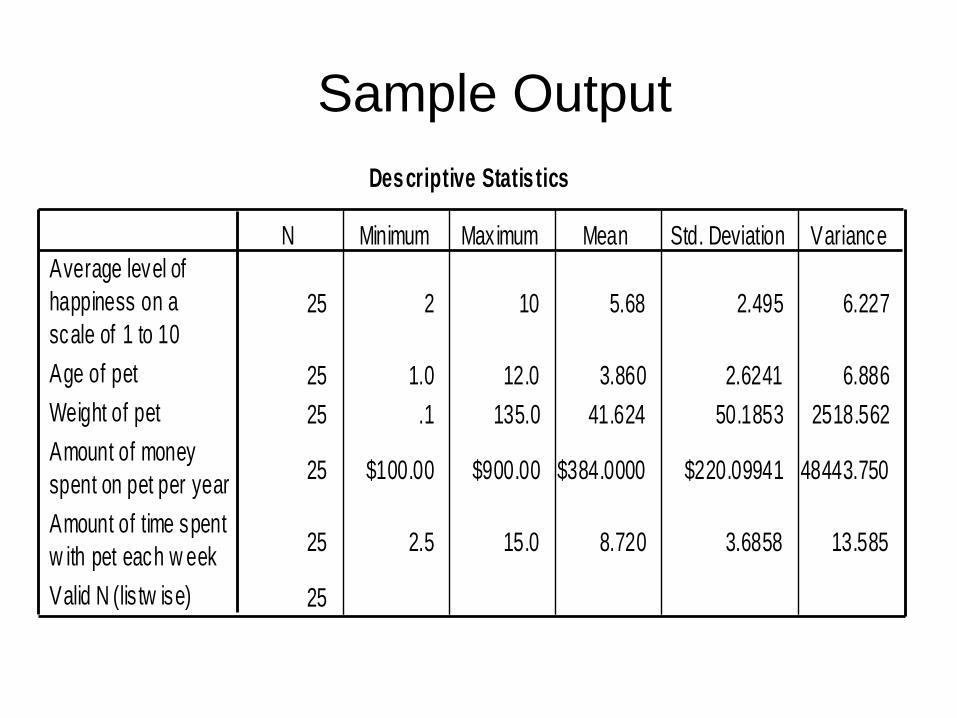
Sample Output
Descriptive Statis tics
25 2 10 5.68 2.495 6.227
25 1.0 12.0 3.860 2.6241 6.886
25 .1 135.0 41.624 50.1853 2518.562
25 $100.00 $900.00 $384.0000 $220.09941 48443.750
25 2.5 15.0 8.720 3.6858 13.585
25
Average level of
happiness on a
scale of 1 to 10
Age of pet
Weight of pet
Amount of money
spent on pet per year
Amount of time spent
w ith pet each w eek
Valid N (lis tw ise)
N Minimum Maximum Mean Std. Deviation Variance
Summary
• You should now be able to:
√ Start up and enter SPSS
√ Enter and Save Data in SPSS
√ Import data from an Excel spreadsheet into
SPSS
√ Recode a variable
√ Conduct simple descriptive statistics in SPSS

Thank You
Any Questions??
If you have any additional questions or
comments, please contact:
Cynthia Wilson Garvan, PhD
Statistics Director, Office of Educational Research
College of Education,University of Florida
E-mail: [email protected]