Embed Size (px)
Citation preview
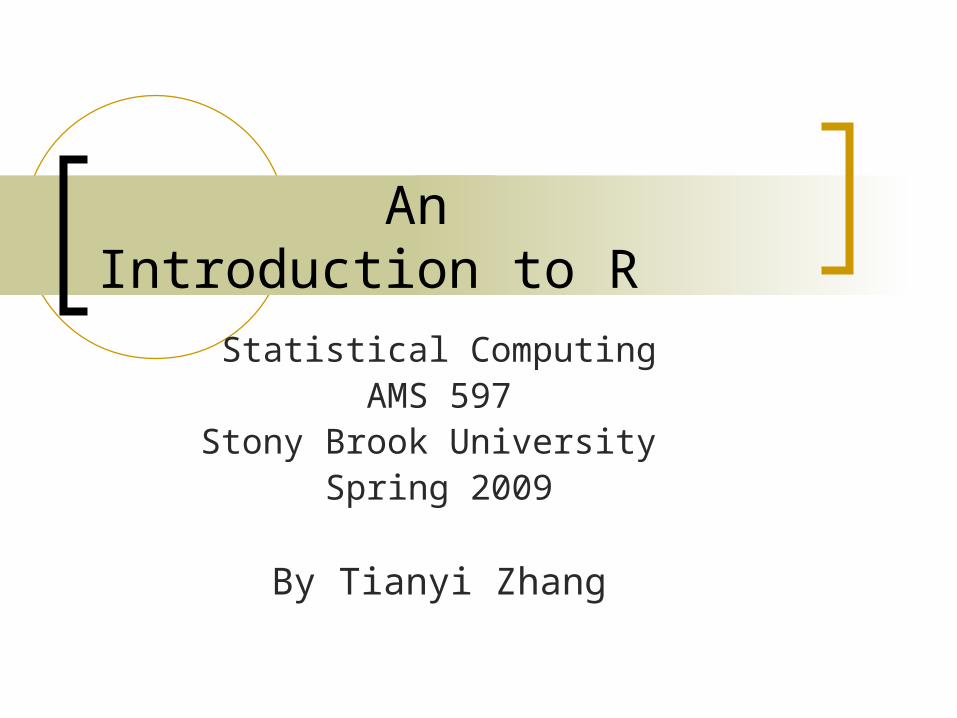
An Introduction to R
Statistical ComputingAMS 597
Stony Brook University Spring 2009
By Tianyi Zhang

Outline
What’s R? R Operating Environment
Help and Manuals Download and install packages
Basic Commands and Functions Import and Export Data Graphic Plot Samples
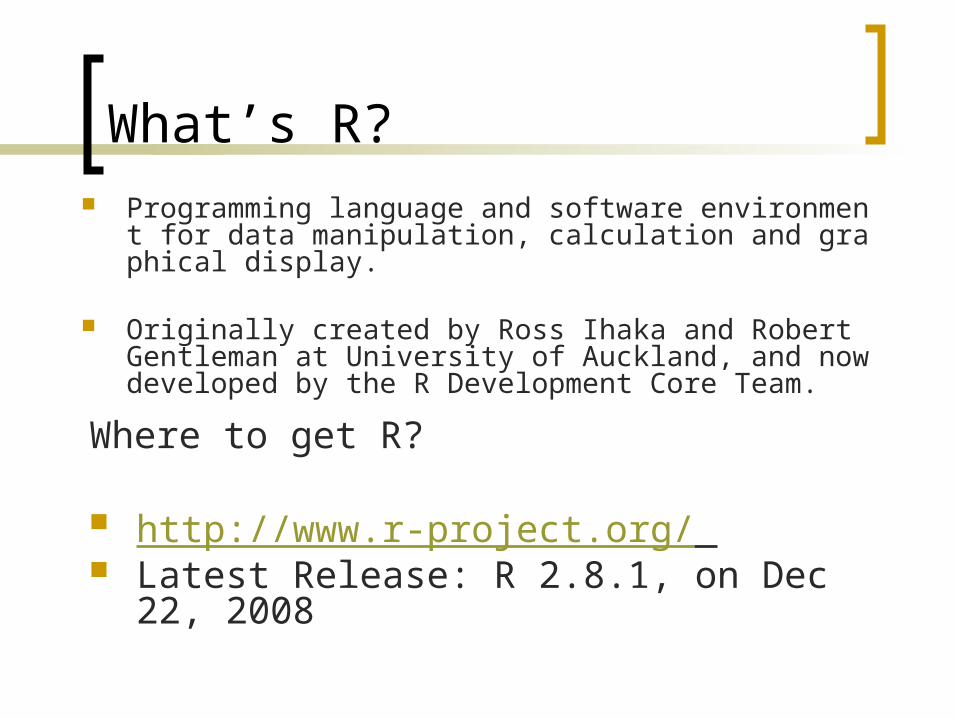
What’s R? Programming language and software environment for
data manipulation, calculation and graphical display.
Originally created by Ross Ihaka and Robert Gentleman at University of Auckland, and now developed by the R Development Core Team.
Where to get R?
http://www.r-project.org/ Latest Release: R 2.8.1, on Dec 22, 2008

Why use R?IT IS FREEPre-compiled binary versions are provided for Microsoft Windows, Mac OS X, and several other Linux/Unix-like operating systemsOpen source code available freely available on GNU General Public LicenseFor computationally-intensive tasks, C, C++ and Fortran code can be linked and called at run timeAn effective data handling and storage facilityA suite of operators for calculations on arrays, in particular matricesA large, coherent, integrated collection of intermediate tools for data analysisGraphical facilities for data analysis and display either directly at the computer or on hardcopy

How to Study R
Help Manual Google!!!

R Operating Environment

R Operating Environment

Start with R
>help. start()>help(function nam
e)>?function nameExample>?lm
>??object>help.search(“title”)Example>help.search(“test”)>??colsum

Download and Install Package
All R functions and datasets are stored in packages. Only when a package is loaded are its contents available. This is down both for efficiency, and to aid package developers.
To see which packages are installed at your site, issue the command
>library(boot)
Users connected to the Internet can use install.packages() and update.packages() to install and update packages.
To see packages currently loaded, use search().
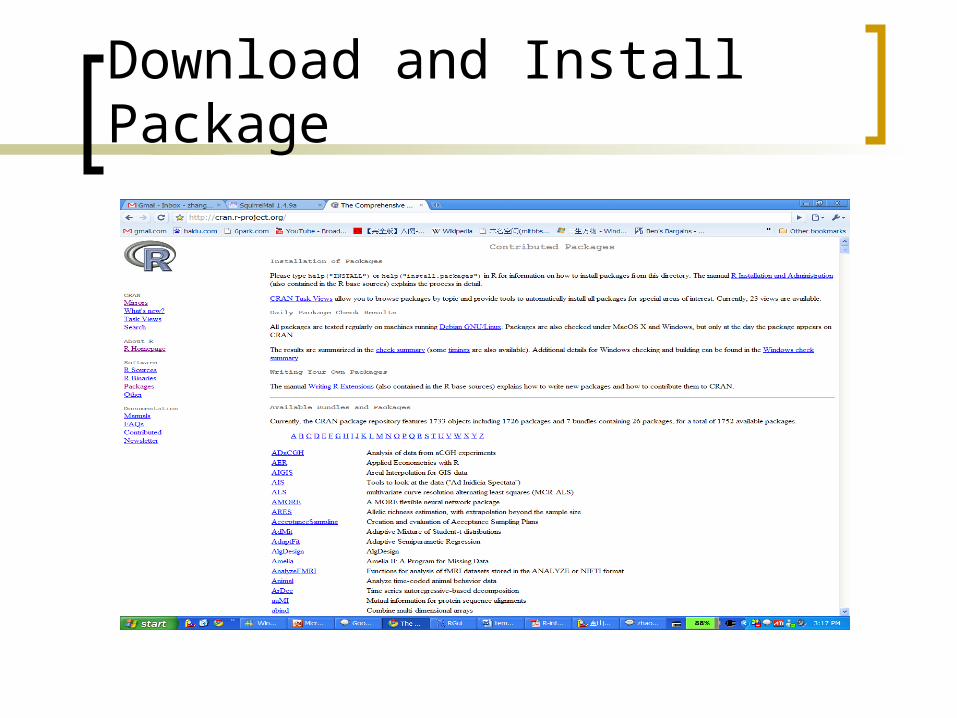
Download and Install Package

Vector and Assignment

Basic Commands

Data Frame

Import and Export Data
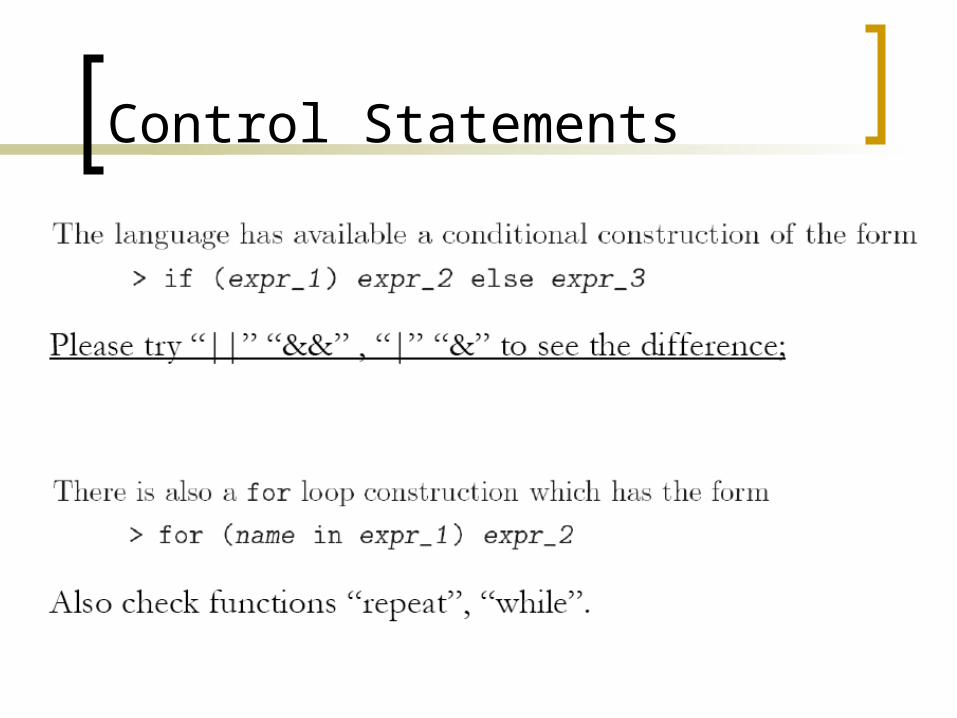
Control Statements
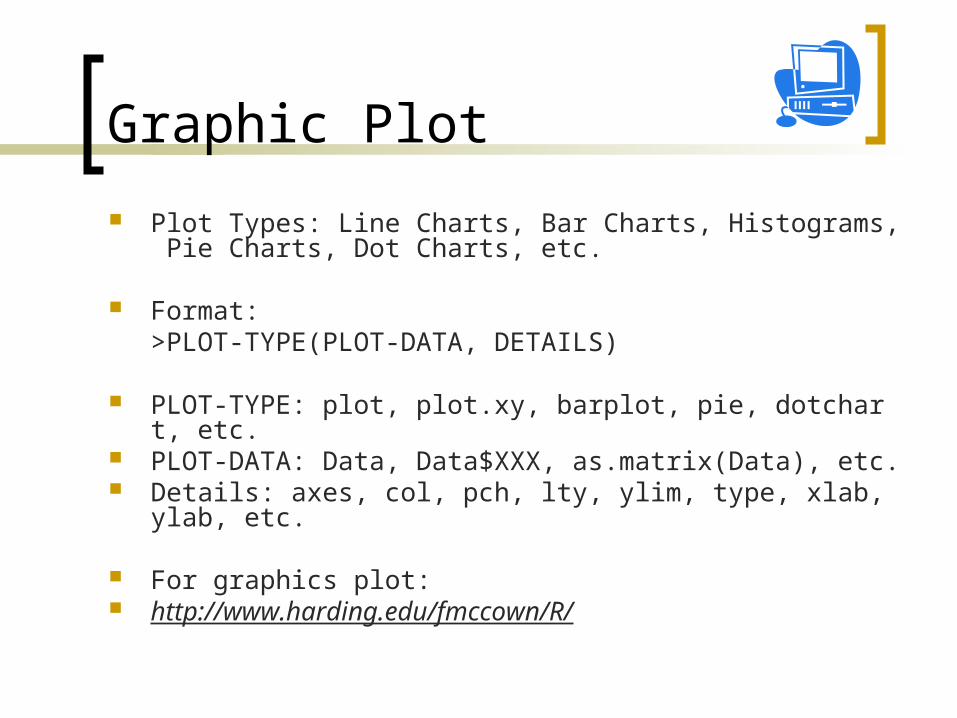
Graphic Plot
Plot Types: Line Charts, Bar Charts, Histograms, Pie Charts, Dot Charts, etc.
Format:>PLOT-TYPE(PLOT-DATA, DETAILS)
PLOT-TYPE: plot, plot.xy, barplot, pie, dotchart, etc. PLOT-DATA: Data, Data$XXX, as.matrix(Data), etc. Details: axes, col, pch, lty, ylim, type, xlab, ylab, etc.
For graphics plot: http://www.harding.edu/fmccown/R/


Sample 1: T-test
Generate two datasets X and Y; Do the Shapiro-Wilk normality test; Do the t-test
Alternative: two sided; less; greater; Paired or not; Confidence interval.

Sample 2: Linear Regression
A comparison of GM monthly returns & SP500 monthly returns. GM and SP500 monthly return data during the period of Jan. 2002 to Jun. 2007 are taken. Plotted in R, they will be analyzed and compared.
Data from: http://www.stanford.edu/~xing/statfinbook/data.html

Sample 2: Linear Regression

Sample 3: Neuron Data Study
Heat diagramHierarchical Clustering

Sample 3: Neuron Data Study
Partial Correlation Network among genes in PKJ and BAS cells
Question?


![[O.P.S]One Piece 597](https://img.pdfslide.us/doc/110x75/568c34361a28ab02358f9887/opsone-piece-597.jpg)