Embed Size (px)
Citation preview

An Introduction to Quality Improvement
Day 1
10th July 2014
Welcome
• Tom Downes
– Clinical Lead for Quality Improvement
• Steve Harrison @stevenbexsheff
– Service Improvement Manager
@sheffielddoc
Aims / Objectives
To teach some of the basics
of Quality Improvement…
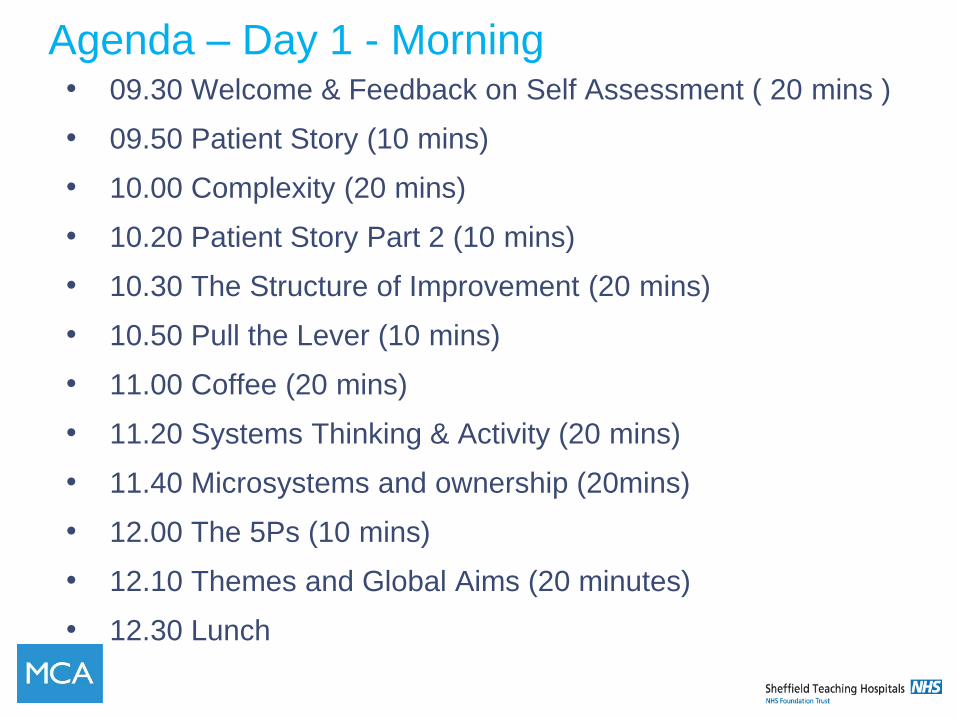
Agenda – Day 1 - Morning • 09.30 Welcome & Feedback on Self Assessment ( 20 mins )
• 09.50 Patient Story (10 mins)
• 10.00 Complexity (20 mins)
• 10.20 Patient Story Part 2 (10 mins)
• 10.30 The Structure of Improvement (20 mins)
• 10.50 Pull the Lever (10 mins)
• 11.00 Coffee (20 mins)
• 11.20 Systems Thinking & Activity (20 mins)
• 11.40 Microsystems and ownership (20mins)
• 12.00 The 5Ps (10 mins)
• 12.10 Themes and Global Aims (20 minutes)
• 12.30 Lunch

Agenda – Day 1 - Afternoon
• 13.10 Process mapping (60 mins)
• 14.10 Theory of Constraints (10 mins)
• 14.20 The Model for Improvement (10 mins )
• 14.30 Specific Aims Activity (10 mins)
• 14.40 Coffee
• 14.50 M & M Challenge (30 mins)
• 15.20 Measurement (10 mins)
• 15.30 Weight Loss Activity (30 mins)
• 16.00 Evaluation
• 16.10 Close
Key Elements Required for Improvement
Will to do what it takes to change to a new system
Ideas on which to base the design of the new system
Execution of the ideas
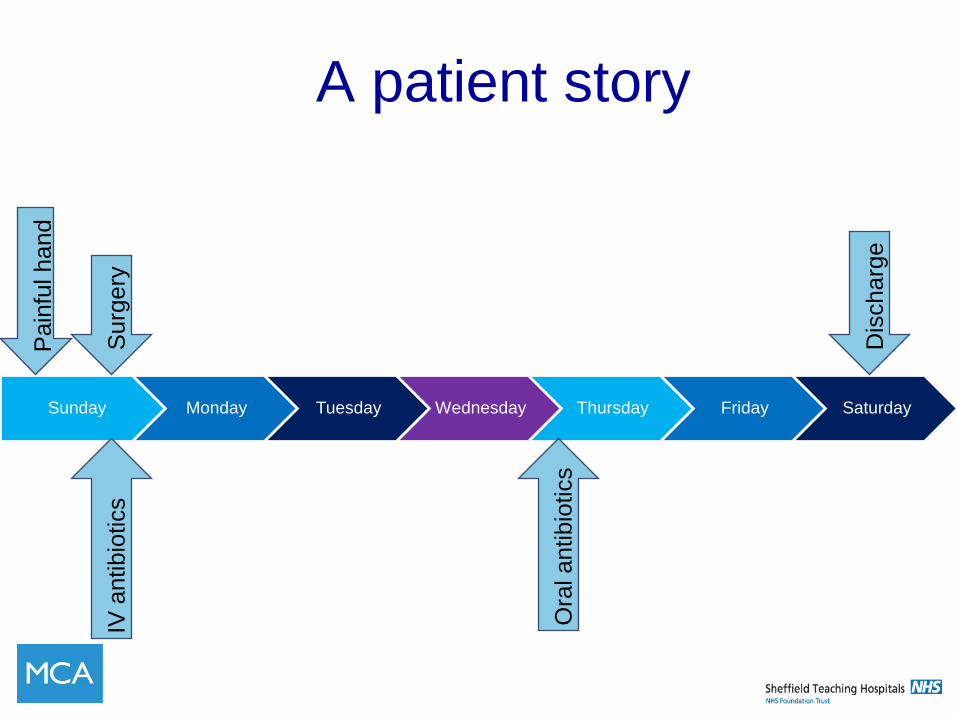
A patient story
Sunday Monday Tuesday Wednesday Thursday Friday Saturday
Surg
ery
IV
an
tibio
tics
Dis
charg
e
Pain
ful hand
Ora
l antibio
tics
COMPLEXITY
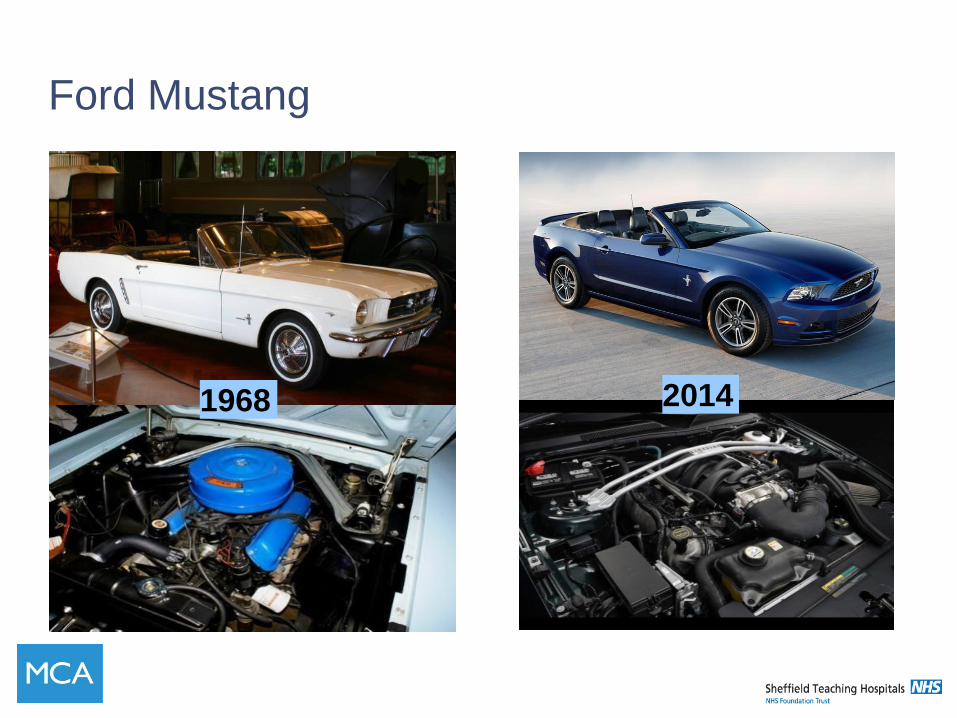
Ford Mustang
1968 2014
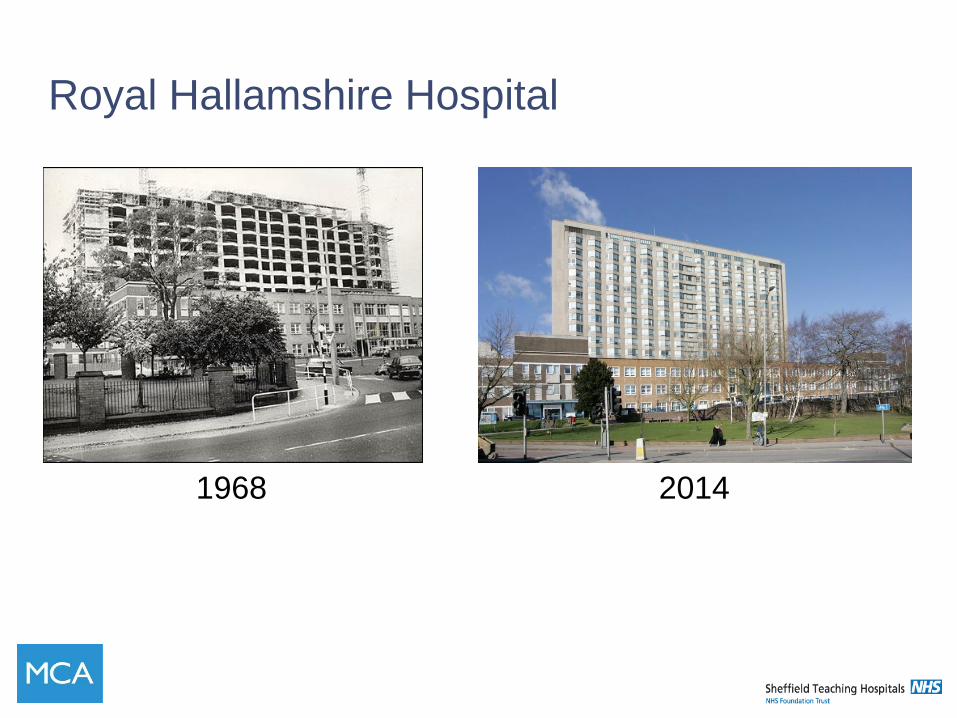
Royal Hallamshire Hospital
1968 2014
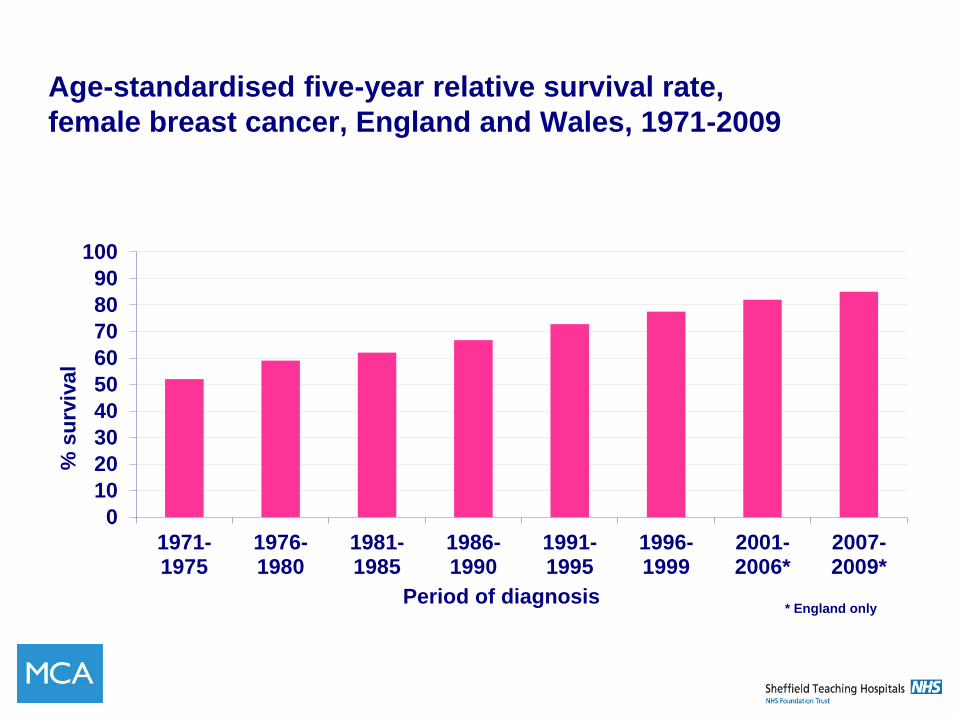
Age-standardised five-year relative survival rate,
female breast cancer, England and Wales, 1971-2009
0
10
20
30
40
50
60
70
80
90
100
1971-1975
1976-1980
1981-1985
1986-1990
1991-1995
1996-1999
2001-2006*
2007-2009*
% s
urv
ival
Period of diagnosis
* England only
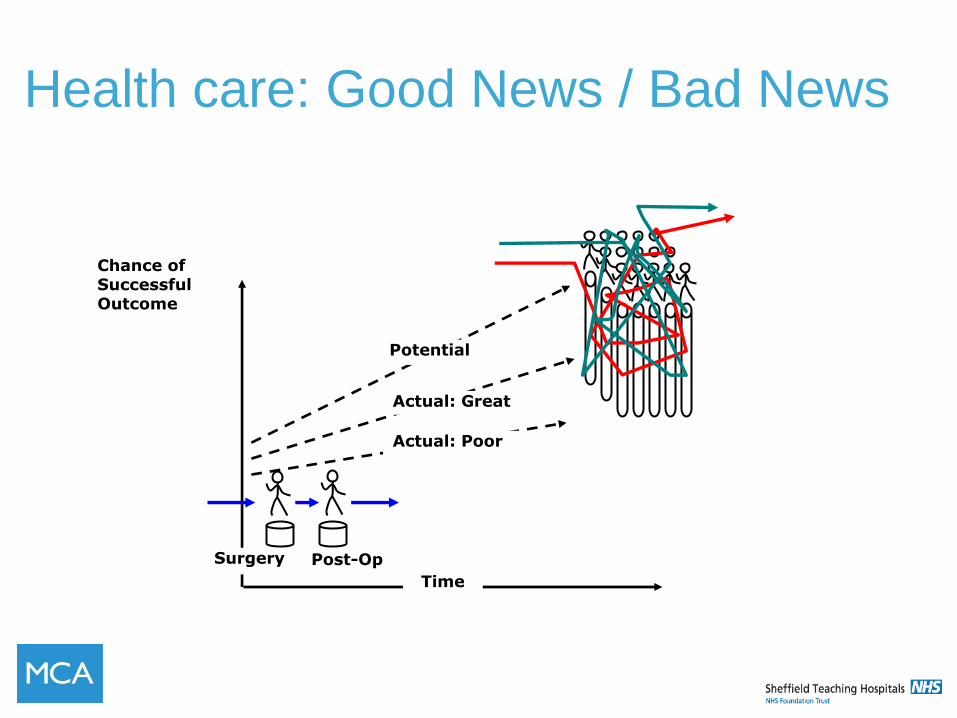
Chance of Successful Outcome
Time
Surgery Post-Op
Potential
Actual: Great
Actual: Poor
Health care: Good News / Bad News
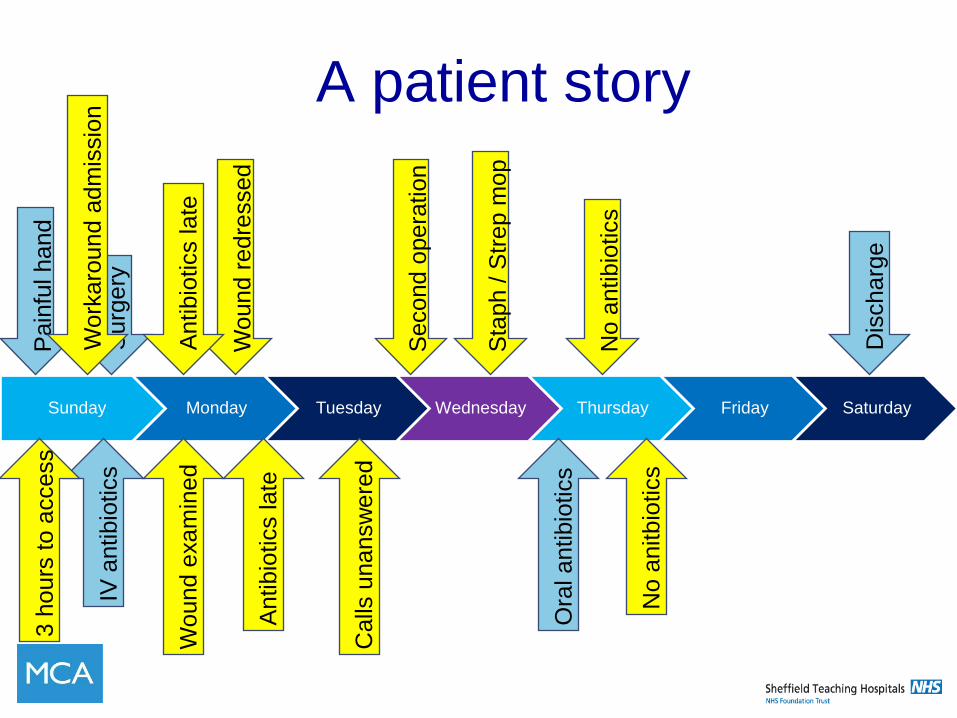
A patient story
Sunday Monday Tuesday Wednesday Thursday Friday Saturday
Surg
ery
IV
antibio
tics
Dis
charg
e
Pain
ful hand
Ora
l antibio
tics
Wo
und e
xam
ined
Wound r
edre
ssed
Antibio
tics late
Antibio
tics late
3 h
ours
to a
ccess
Second o
pera
tion
Sta
ph / S
trep m
op
Calls
unansw
ere
d
No a
ntibio
tics
No a
nitbio
tics
Work
aro
und a
dm
issio
n
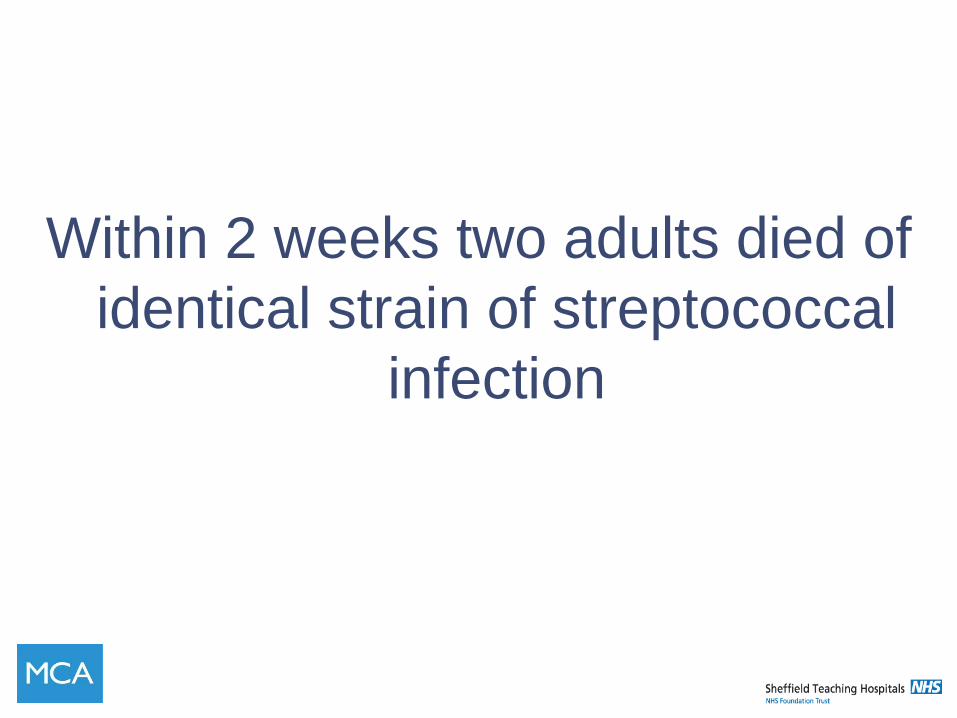
Within 2 weeks two adults died of
identical strain of streptococcal
infection
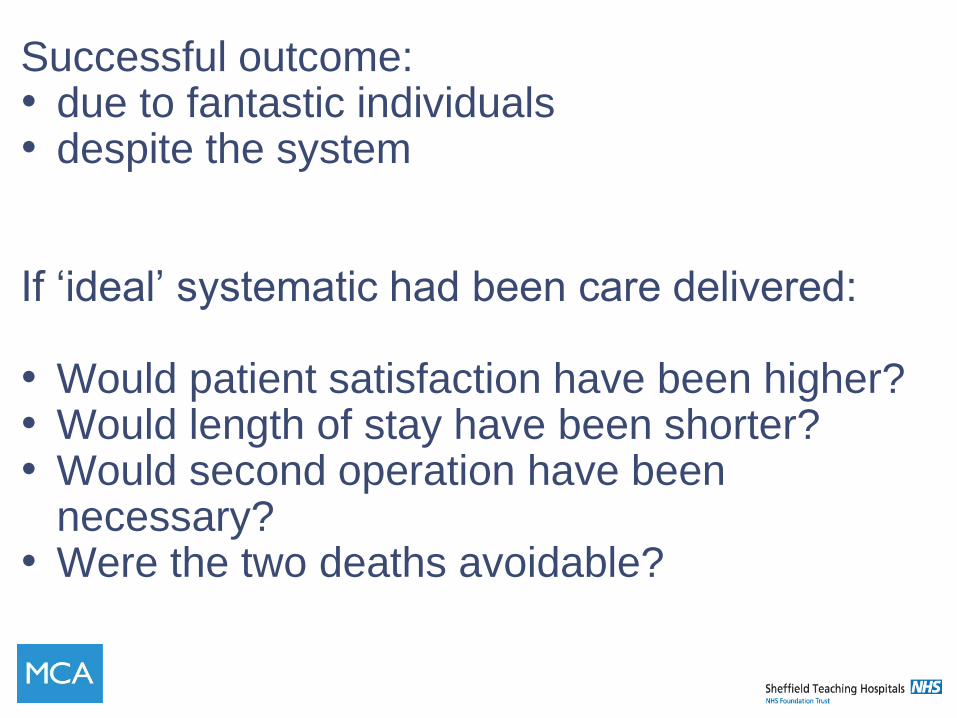
Successful outcome: • due to fantastic individuals • despite the system If ‘ideal’ systematic had been care delivered: • Would patient satisfaction have been higher? • Would length of stay have been shorter? • Would second operation have been
necessary? • Were the two deaths avoidable?
Discussion
• In pairs discuss your own place of work
• Is it complex?
• Can you think of similar issues?
• Prepare an example
QUALITY IMPROVEMENT? What is
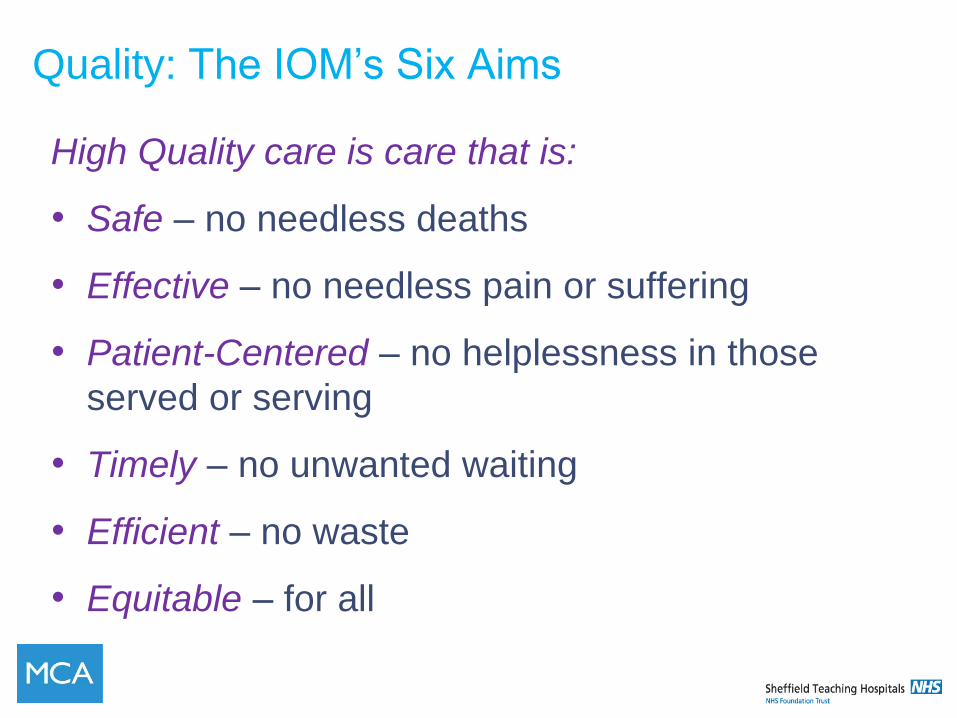
High Quality care is care that is:
• Safe – no needless deaths
• Effective – no needless pain or suffering
• Patient-Centered – no helplessness in those
served or serving
• Timely – no unwanted waiting
• Efficient – no waste
• Equitable – for all
Quality: The IOM’s Six Aims
Improvement
The combination of a ‘change’ (improvement)
combined with a ‘method’ (an approach or
specific tools) to attain a superior outcome
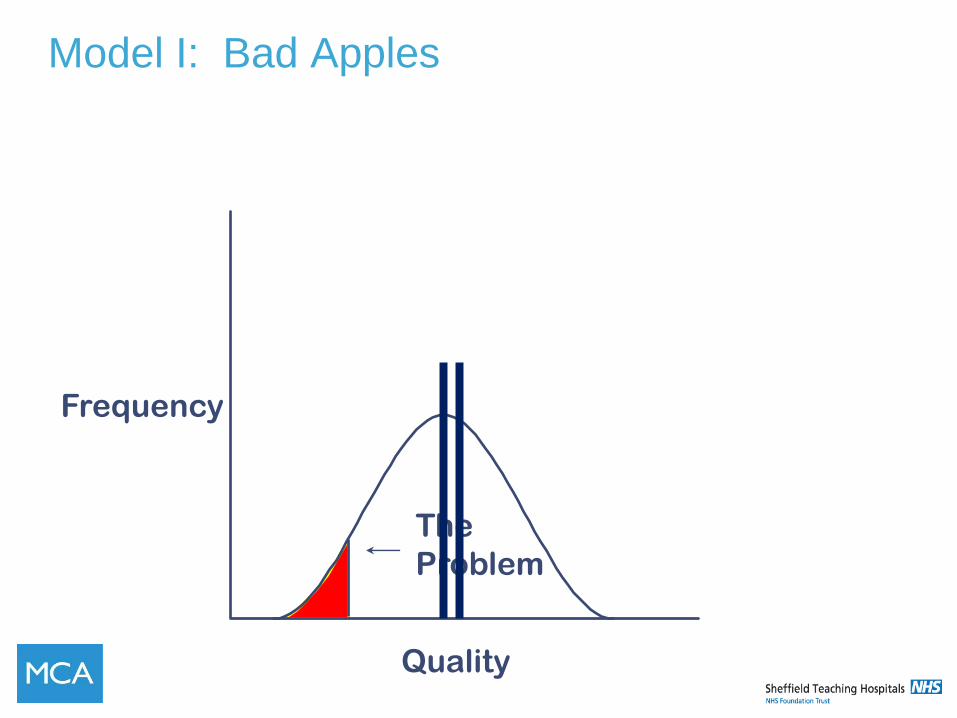
Model I: Bad Apples
The
Problem
Quality
Frequency
The Simple, Wrong Answer
Blame
Somebody
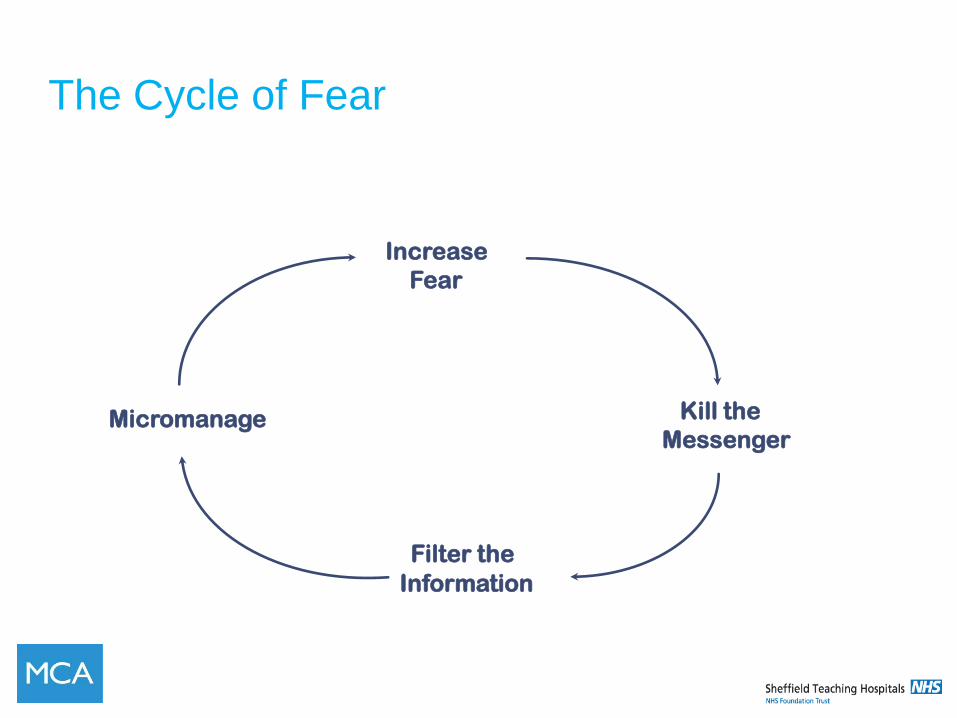
The Cycle of Fear
Increase
Fear
Micromanage Kill the
Messenger
Filter the
Information
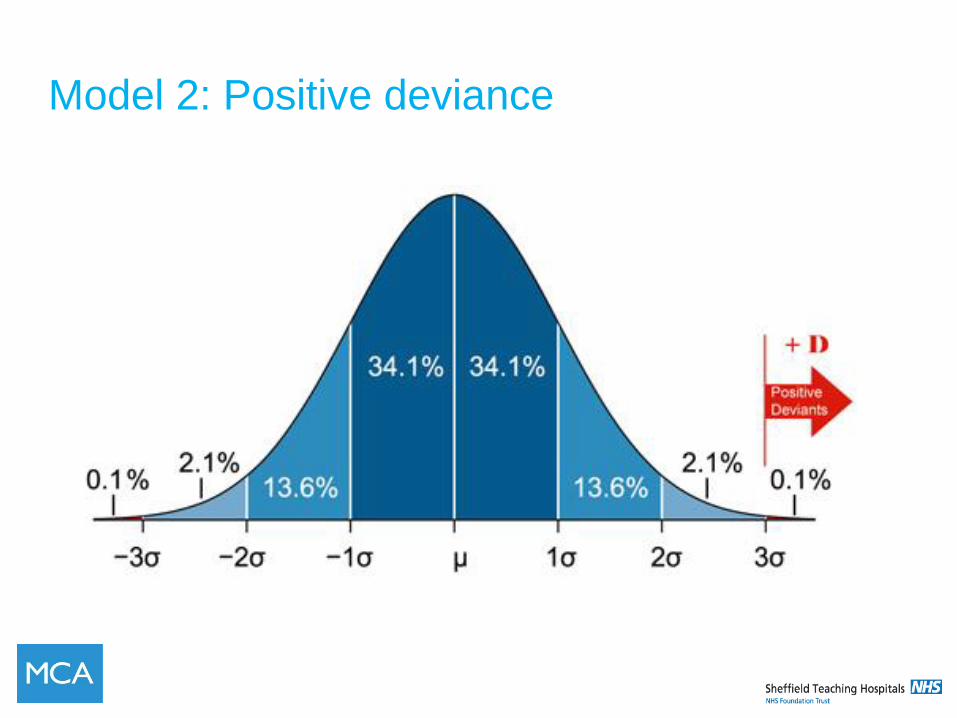
Model 2: Positive deviance
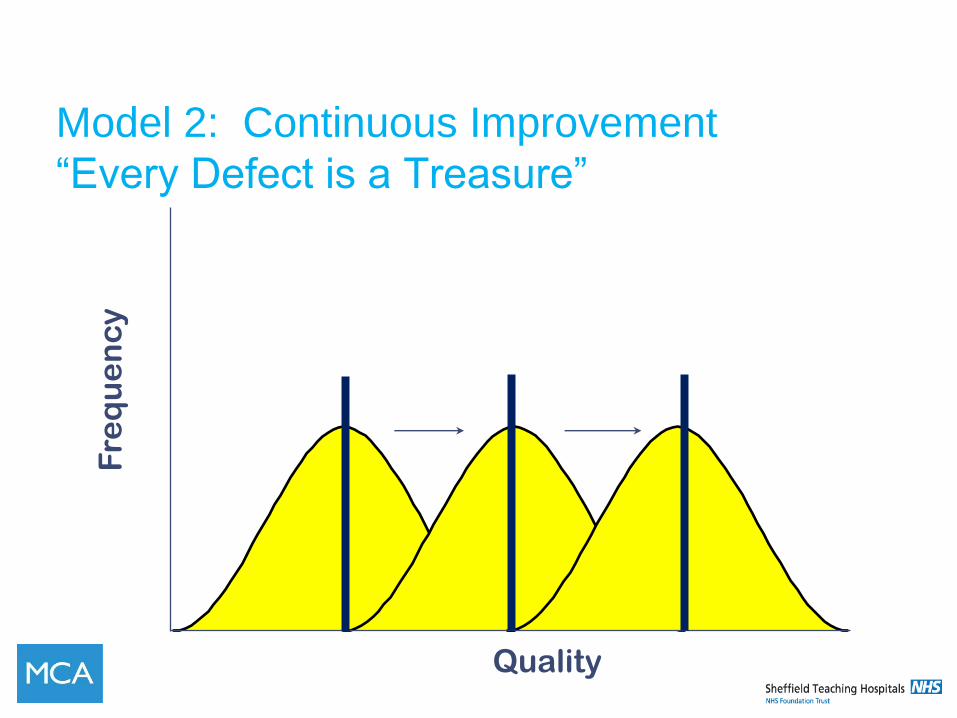
Model 2: Continuous Improvement
“Every Defect is a Treasure”
Quality
F
req
ue
nc
y
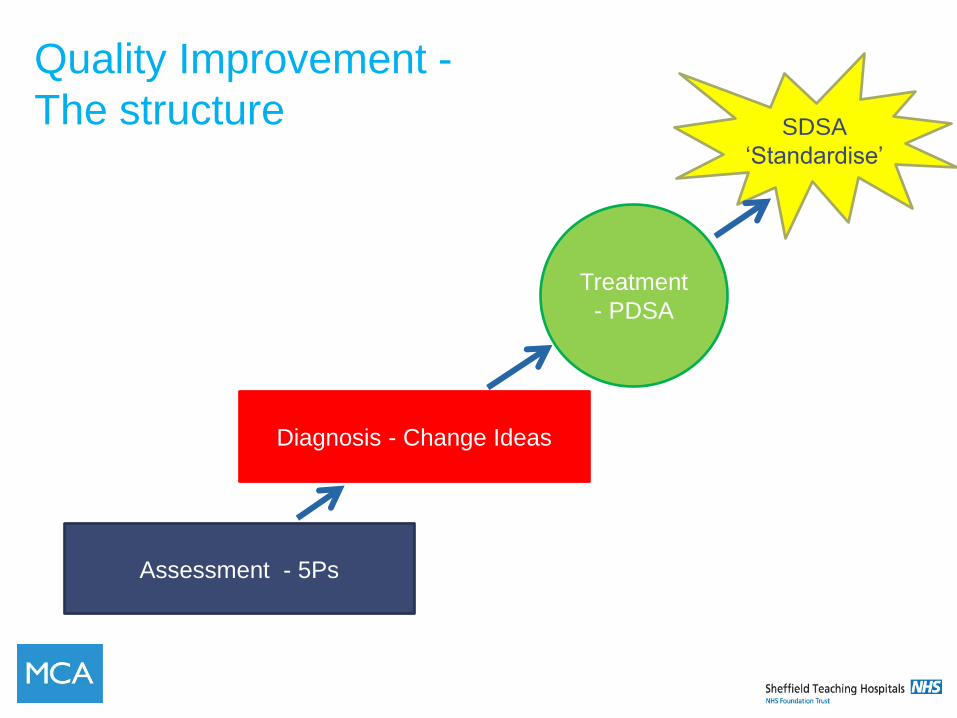
Quality Improvement -
The structure
Assessment - 5Ps
Diagnosis - Change Ideas
Treatment
- PDSA
SDSA
‘Standardise’
But first a bit of Hollywood…..
Video of ‘October Sky’
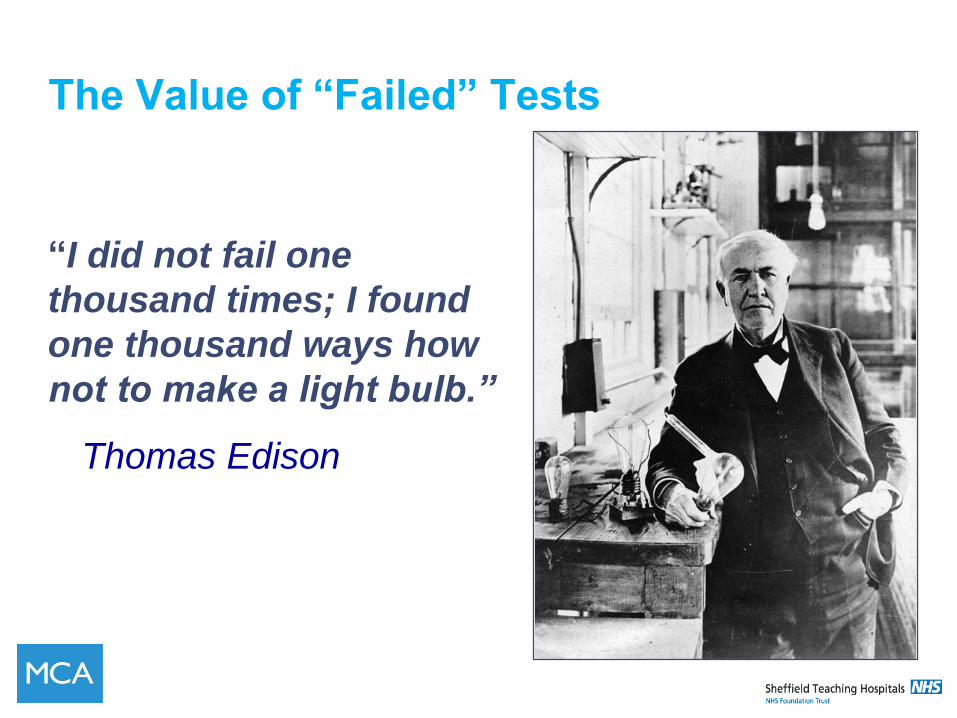
The Value of “Failed” Tests
“I did not fail one
thousand times; I found
one thousand ways how
not to make a light bulb.”
Thomas Edison
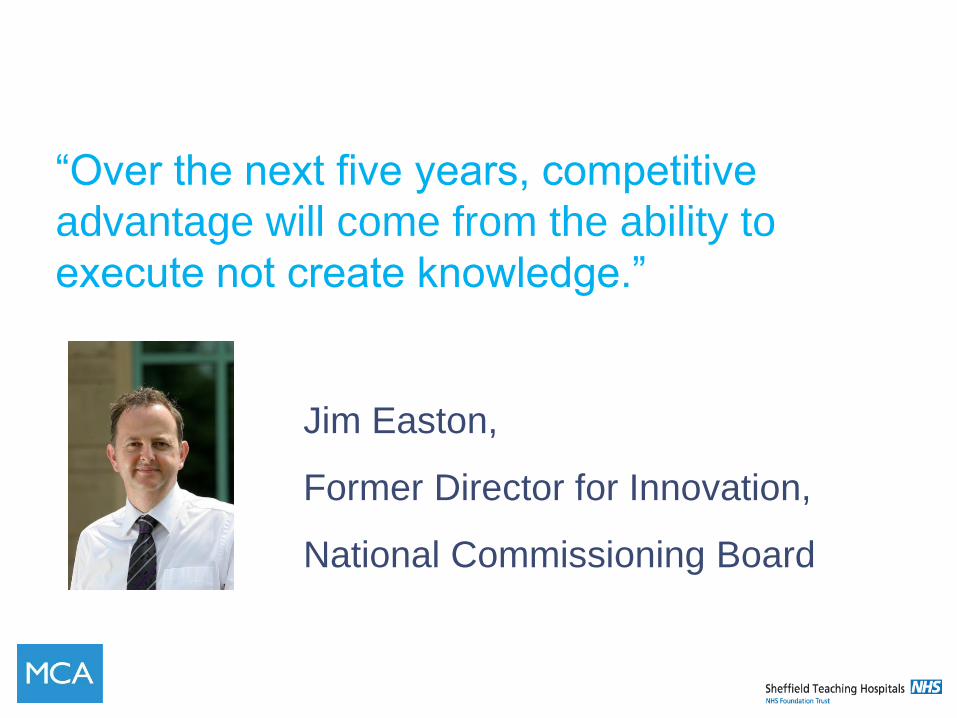
“Over the next five years, competitive
advantage will come from the ability to
execute not create knowledge.”
Jim Easton,
Former Director for Innovation,
National Commissioning Board
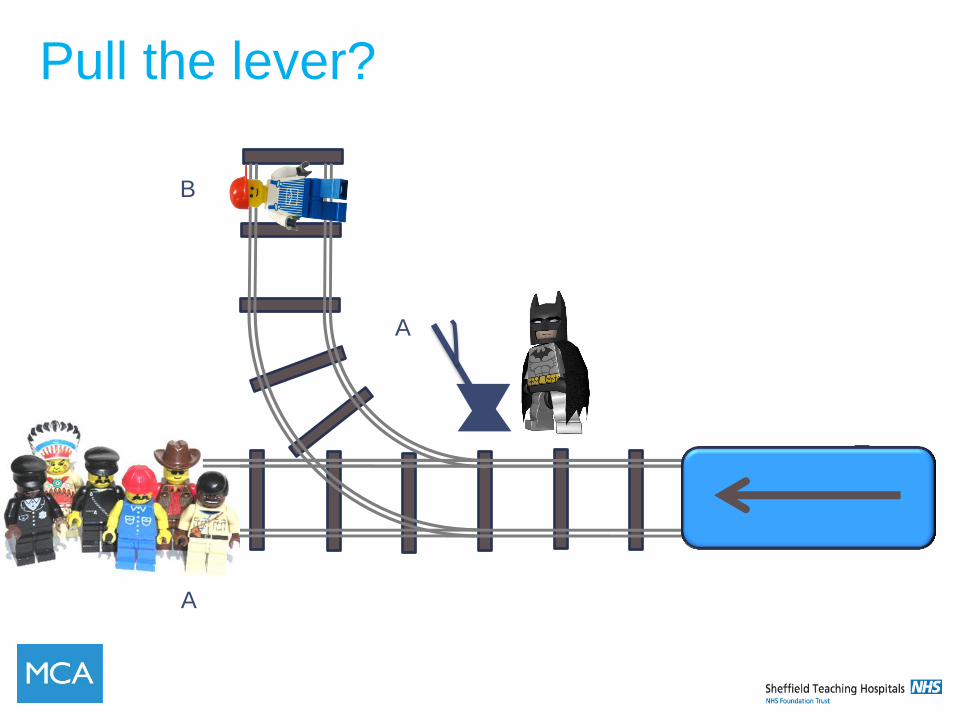
Pull the lever?
A
B
A
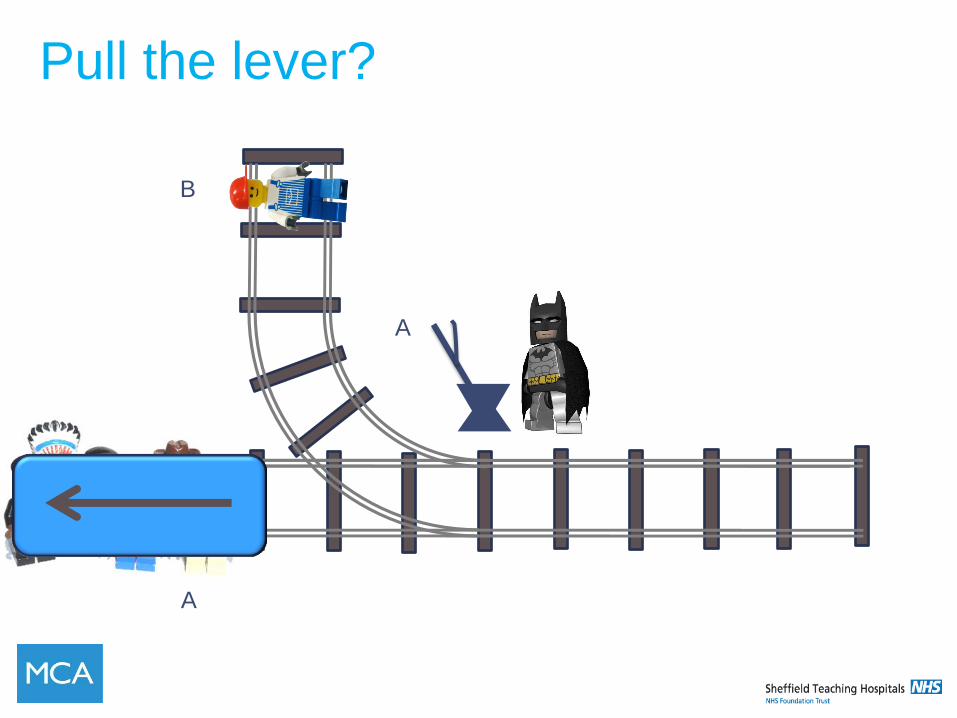
Pull the lever?
A
B
A
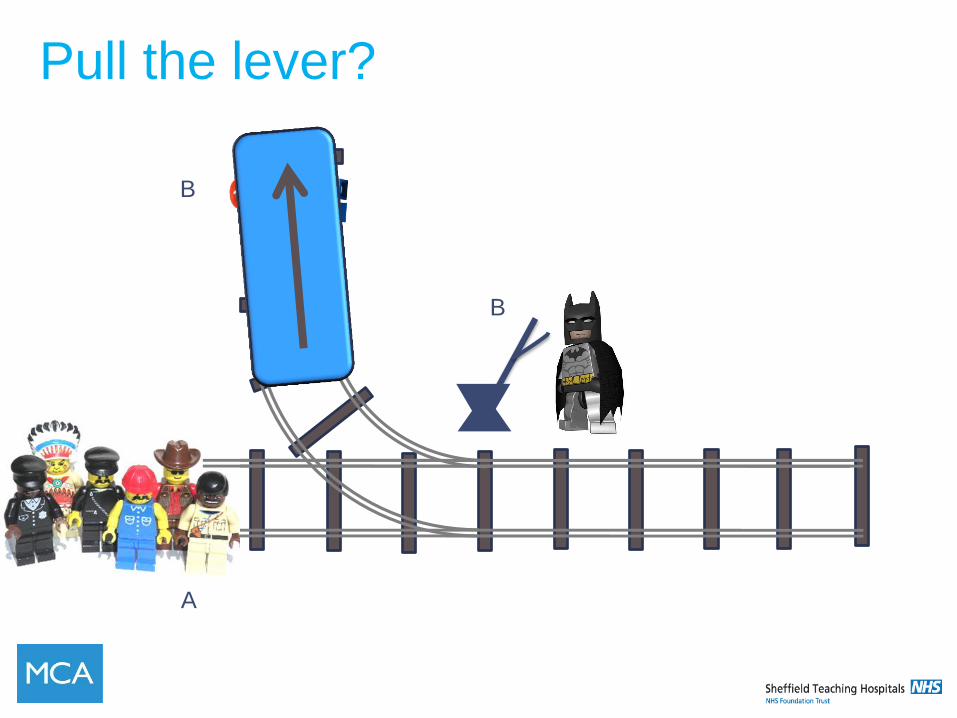
Pull the lever?
A
B
B

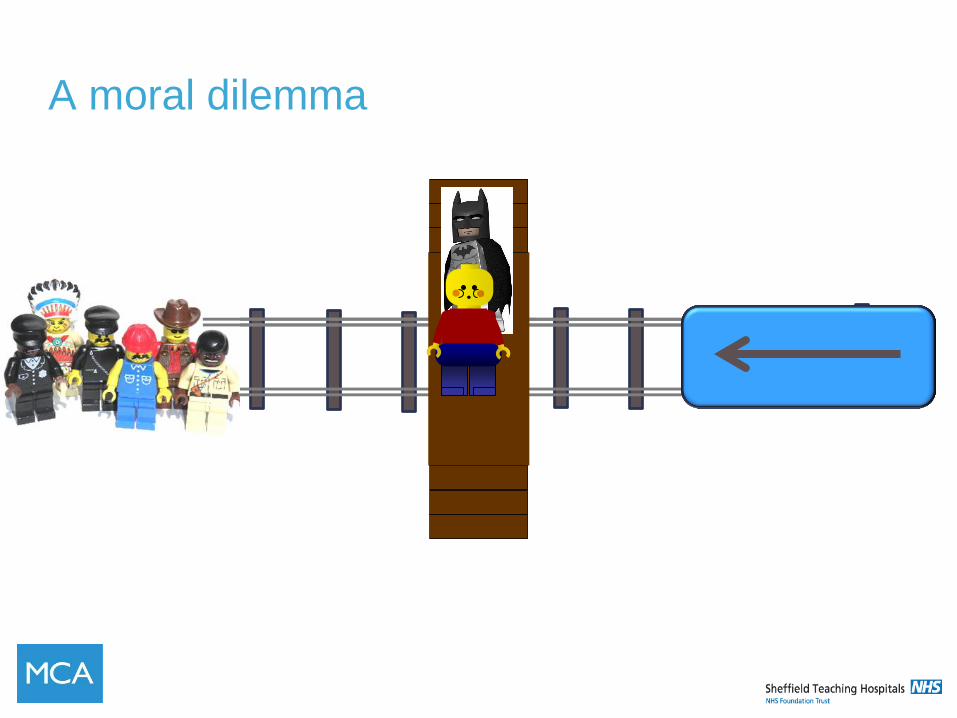
A moral dilemma
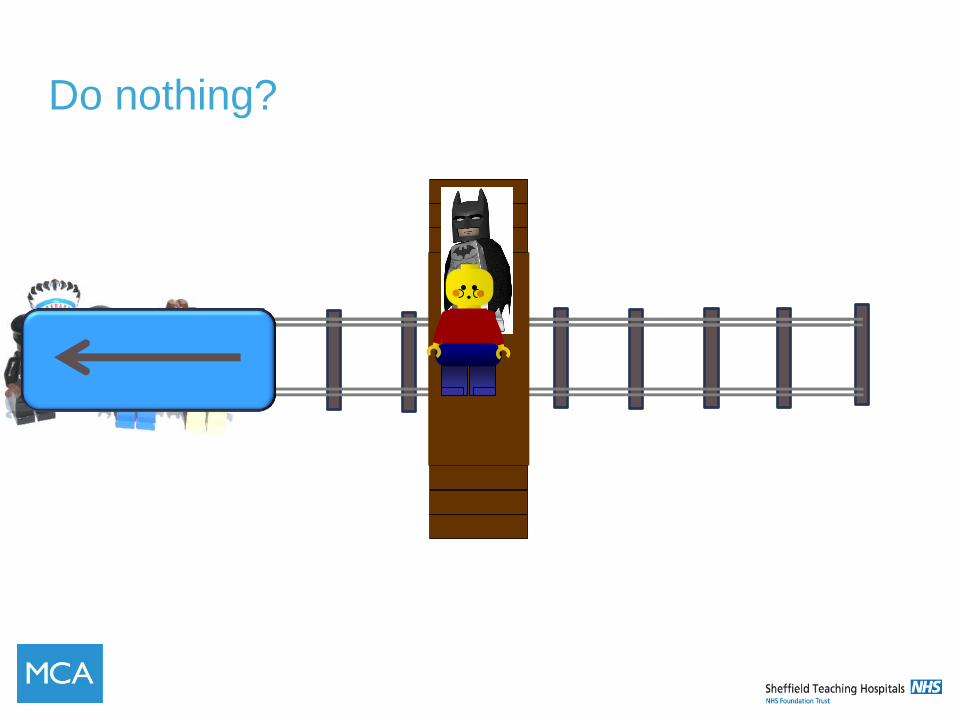
Do nothing?
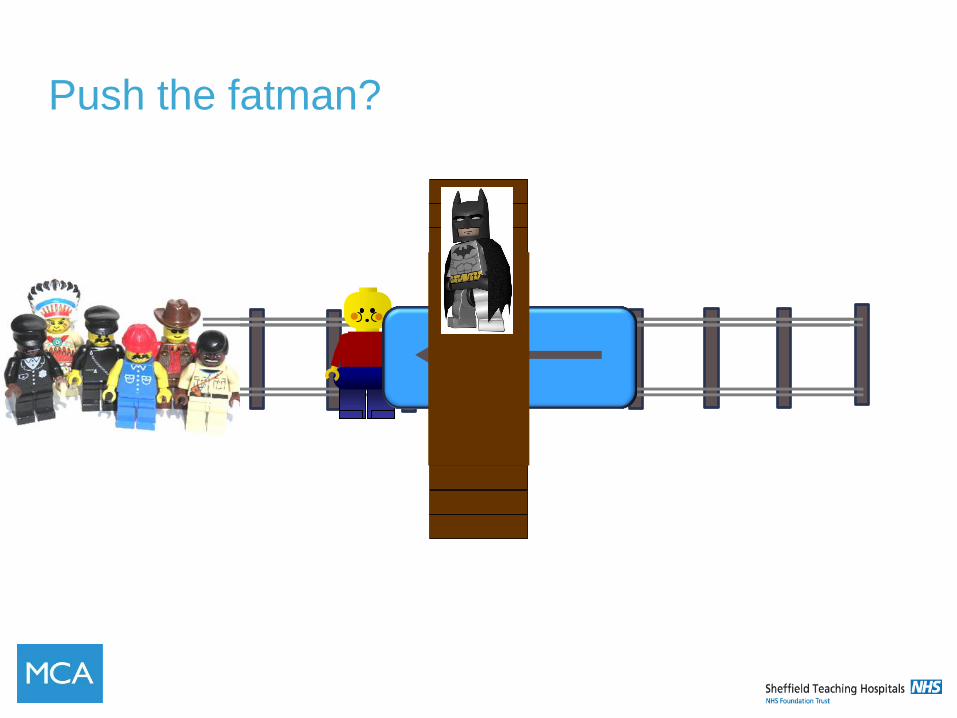
Push the fatman?
SYSTEMS THINKING
• Step 1 – Everyone stand up
• Step 2 – Without speaking; pick two people but
don’t say who they are or point at them (Keep it a
secret)
• Step 3 - Move to be equidistant between both of
the people
Understanding Systems
• What is a “system”?
• How do we define a “system”?
Understanding Systems
• What is a system?
•System = a collection of processes working
together to produ ce a defined output
“Every system is perfectly
designed to achieve
the results it gets” Paul Batalden
Processes?
• How is a process different from a “system”?
• Can we brainstorm a series of processes which
make up the “systems” we might encounter in our
improvement work?
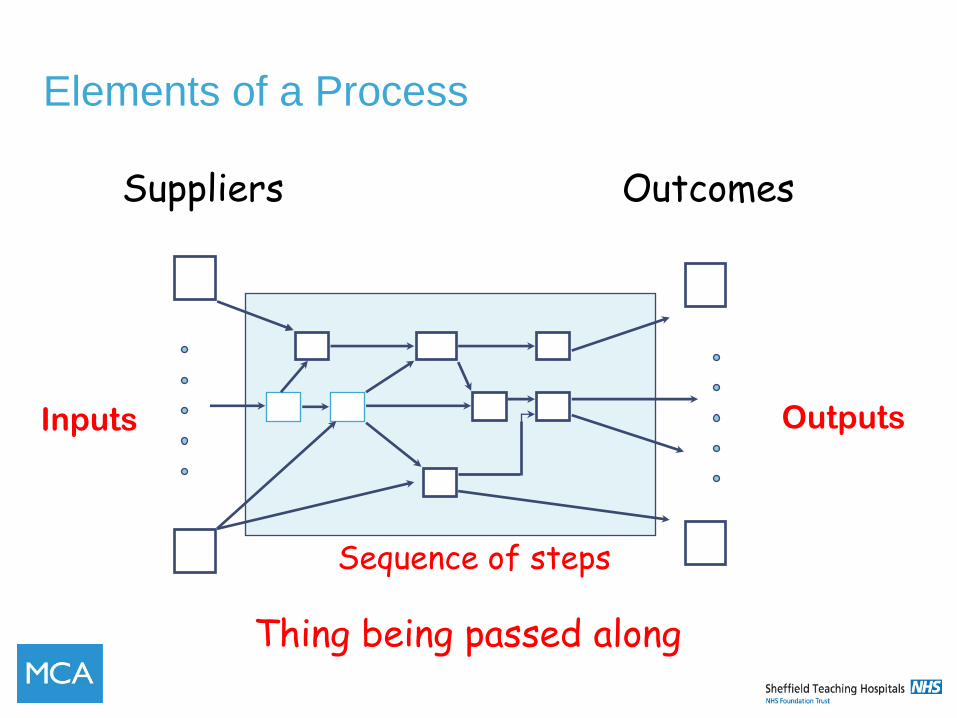
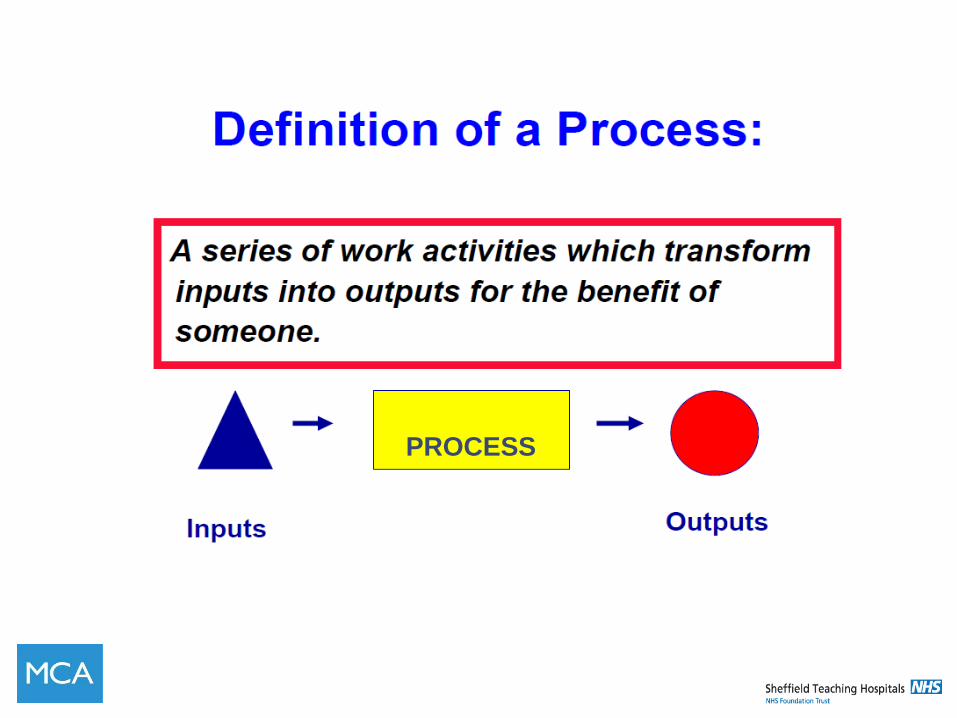
Elements of a Process
46
Suppliers Outcomes
Thing being passed along
Inputs Outputs
Sequence of steps
MICROSYSTEMS: AN OVERVIEW
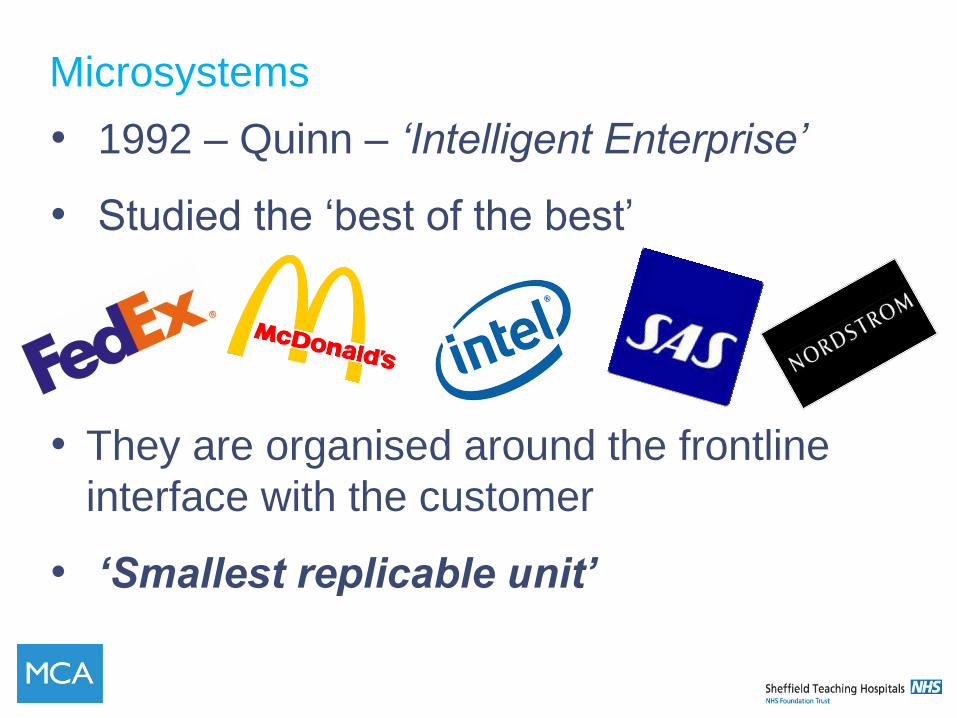
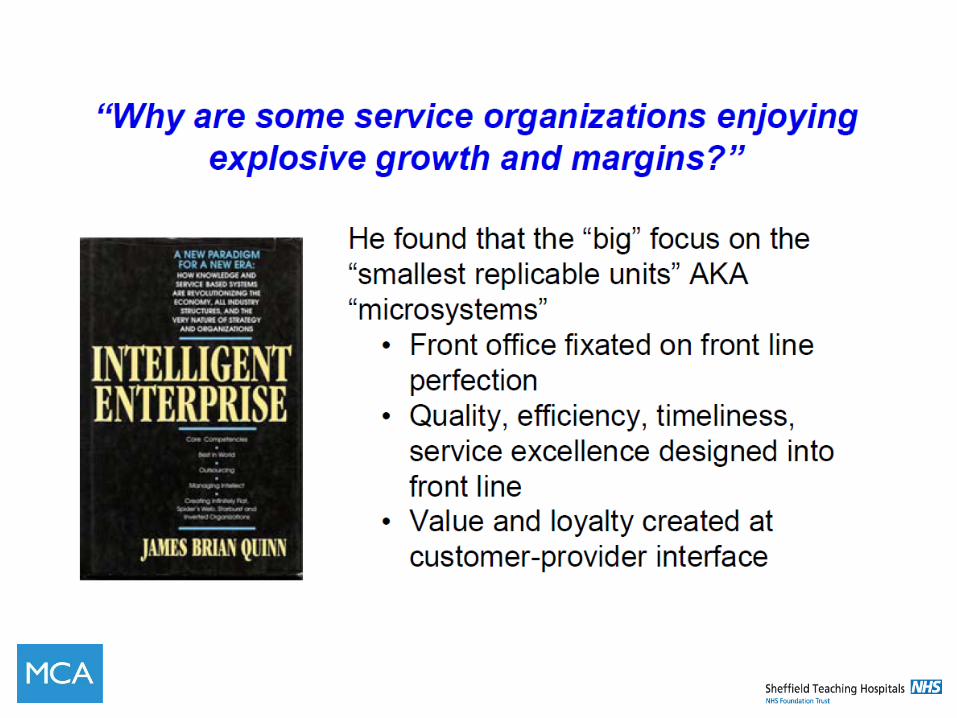
Microsystems
• 1992 – Quinn – ‘Intelligent Enterprise’
• Studied the ‘best of the best’
• They are organised around the frontline
interface with the customer
• ‘Smallest replicable unit’
Microsystems
• Nelson, Batalden, Godfrey 2000 – 2007
• Looked at the characteristics of high
performing clinical microsystems
• Formulated a curriculum to develop high
performing microsystems
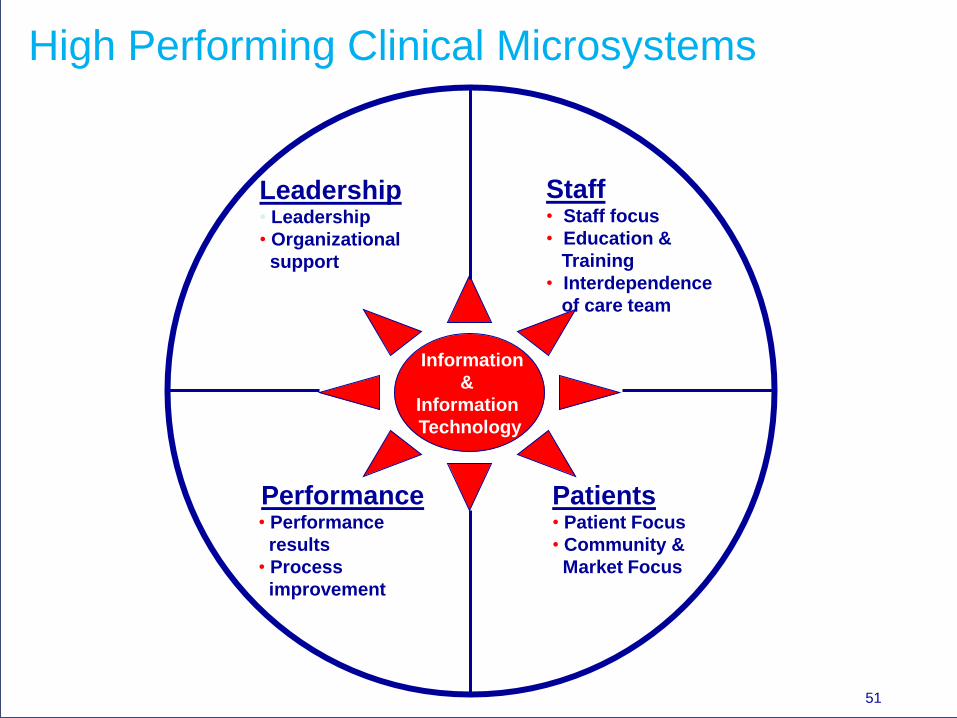
High Performing Clinical Microsystems
Information
&
Information
Technology
Staff • Staff focus
• Education &
Training
• Interdependence
of care team
Patients • Patient Focus
• Community &
Market Focus
Performance • Performance
results
• Process
improvement
Leadership • Leadership
• Organizational
support
51
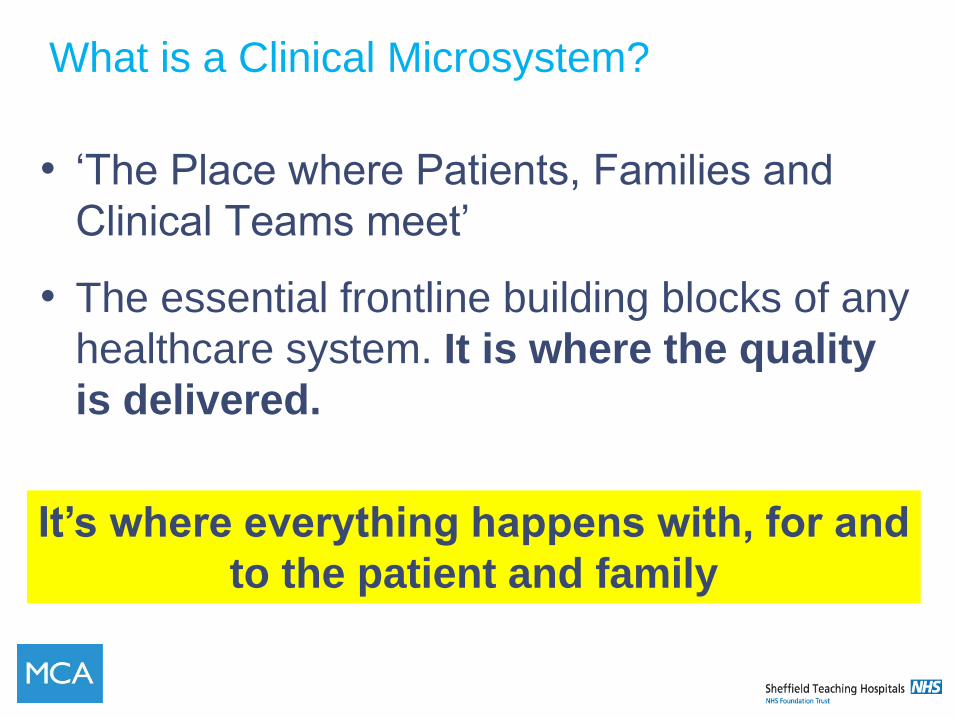
What is a Clinical Microsystem?
• ‘The Place where Patients, Families and
Clinical Teams meet’
• The essential frontline building blocks of any
healthcare system. It is where the quality
is delivered.
It’s where everything happens with, for and
to the patient and family
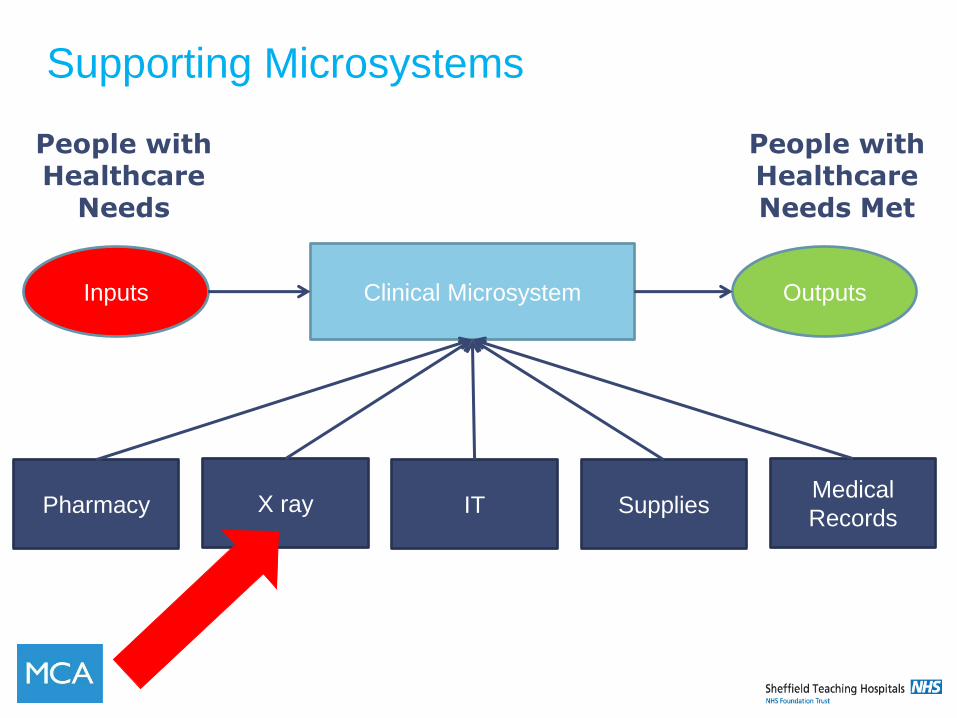
Clinical Microsystem Outputs Inputs
Pharmacy
People with Healthcare Needs Met
People with Healthcare
Needs
X ray IT Supplies Medical
Records
Supporting Microsystems
Supporting Microsystems
Have Many Roles:
Within their own microsystem
and as members of other
microsystems
54
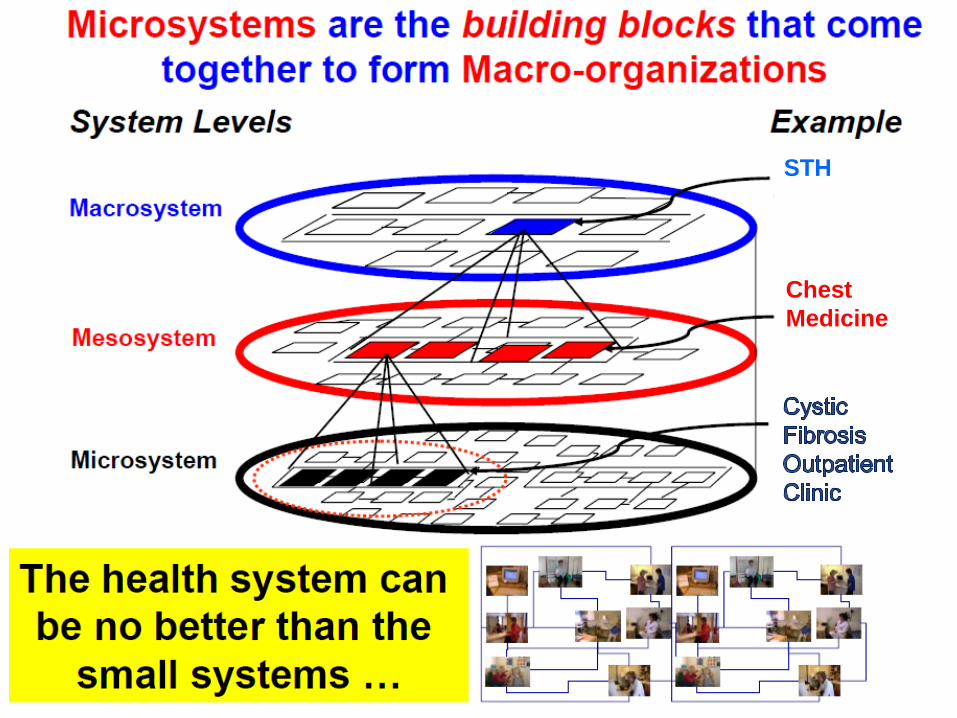
Chest
Medicine
STH
• Some of you have a red card
• Read out in turn
• Is this a Microsystem?
Is this a
Microsystem?
“The principal task of the mesosystem is
to enable the work of the microsystems
for the population(s) of patients served.”
Paul Batalden
THE MICROSYSTEMS
APPROACH TO IMPROVEMENT
- ‘OWNERSHIP’ VS. ‘BUY IN’
These are not the same thing
Why?
‘Ownership’
• Is where you share the ownership of an
idea, a decision, an action plan.
• You have participated in it’s development,
you have chosen it of your own accord and
you endorse it.
• You understand it and believe in it and are
willing to implement it
‘Buy In’
‘Buy – In’ is the opposite
• Someone else has done the development,
the thinking
• They are now telling you or convincing you
to implement their ideas
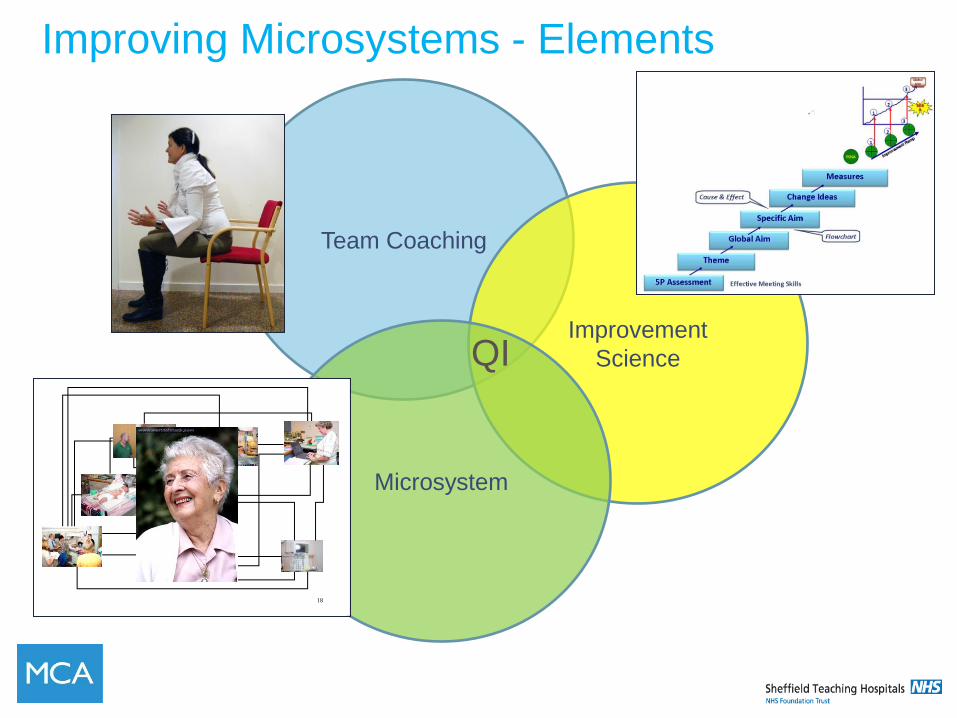
Team Coaching
Improvement
Science
Microsystem
Improving Microsystems - Elements
QI
18
REDESIGN FROM
THE INSIDE - OUT
Microsystems is about
ownership
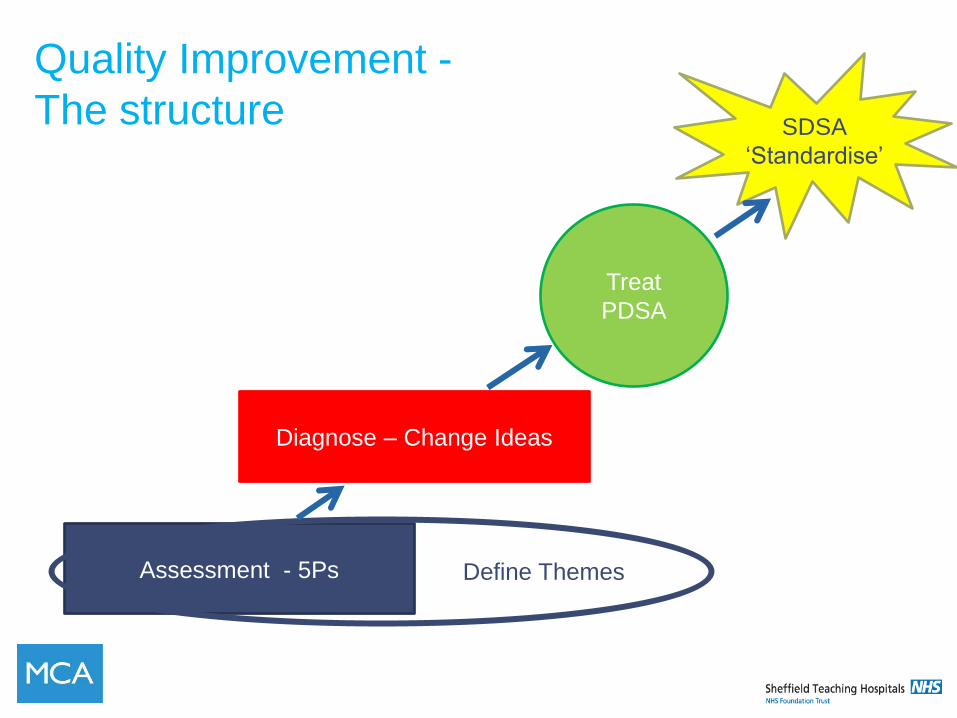
Quality Improvement -
The structure
Assessment - 5Ps
Diagnose – Change Ideas
Treat
PDSA
SDSA
‘Standardise’
Define Themes
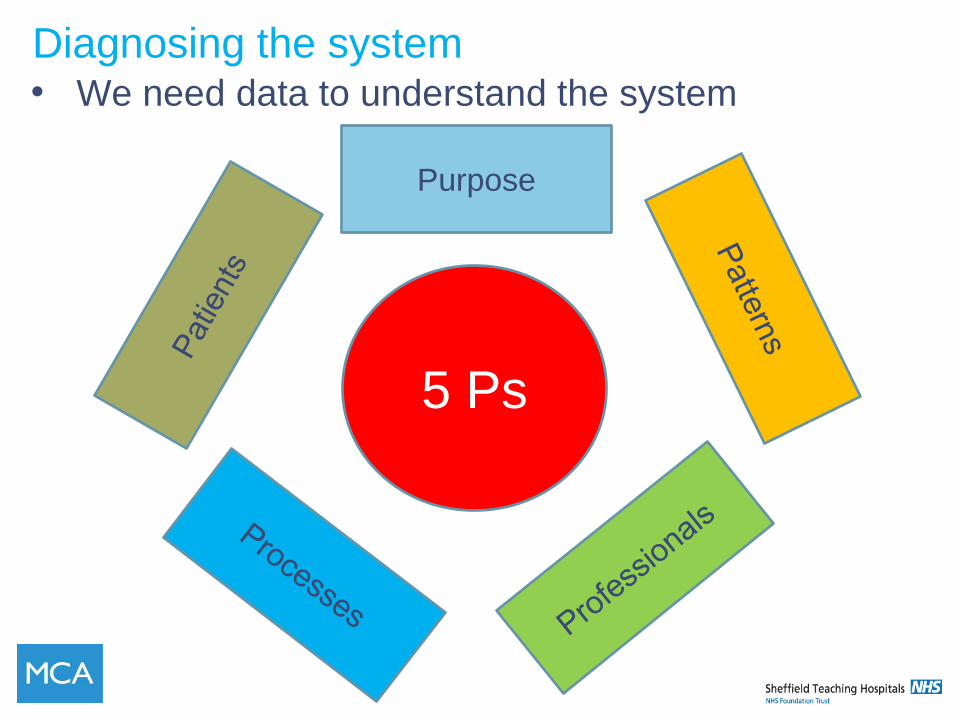
Diagnosing the system • We need data to understand the system
Purpose
5 Ps
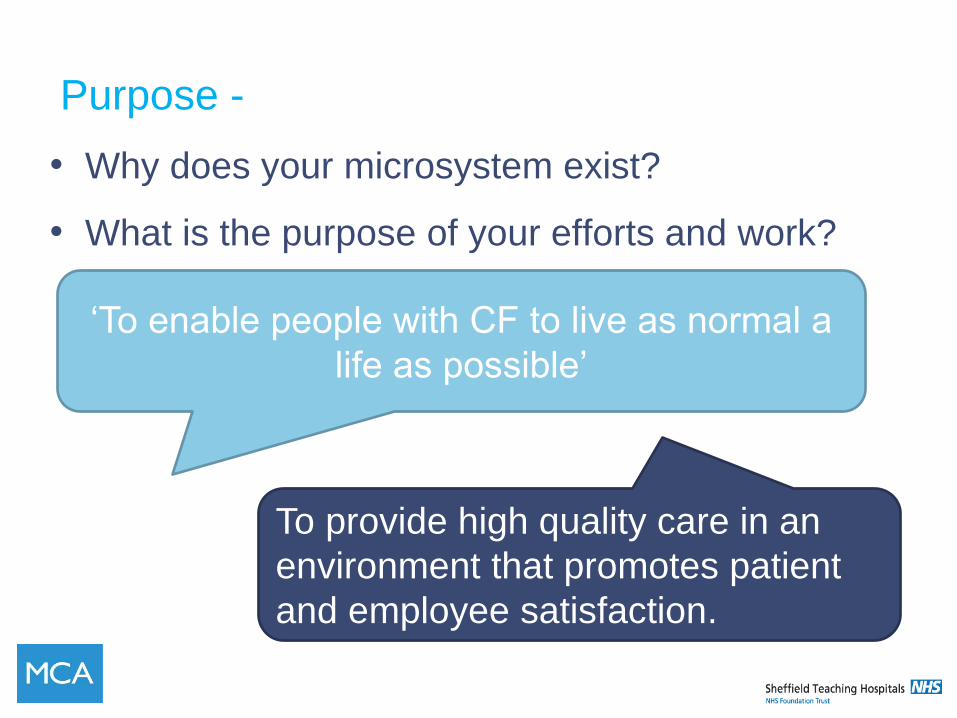
Purpose -
• Why does your microsystem exist?
• What is the purpose of your efforts and work?
‘To enable people with CF to live as normal a
life as possible’
To provide high quality care in an
environment that promotes patient
and employee satisfaction.
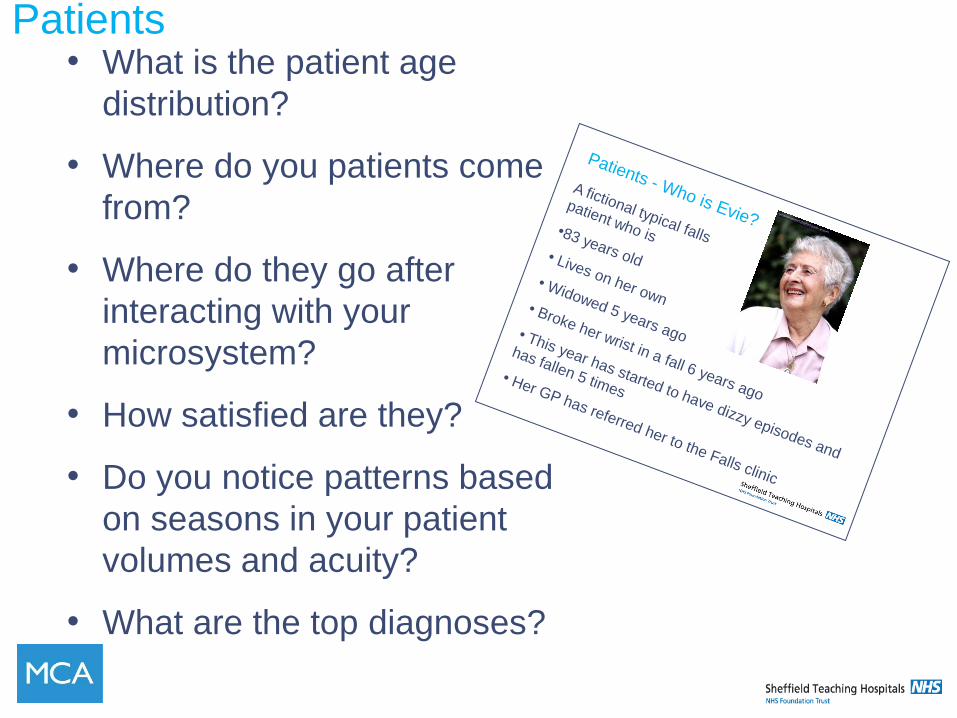
Patients • What is the patient age
distribution?
• Where do you patients come
from?
• Where do they go after
interacting with your
microsystem?
• How satisfied are they?
• Do you notice patterns based
on seasons in your patient
volumes and acuity?
• What are the top diagnoses?
Patients - Who is Evie?
A fictional typical falls
patient who is •83 years old• Lives on her own• Widowed 5 years ago
• Broke her wrist in a fall 6 years ago
• This year has started to have dizzy episodes and
has fallen 5 times• Her GP has referred her to the Falls clinic
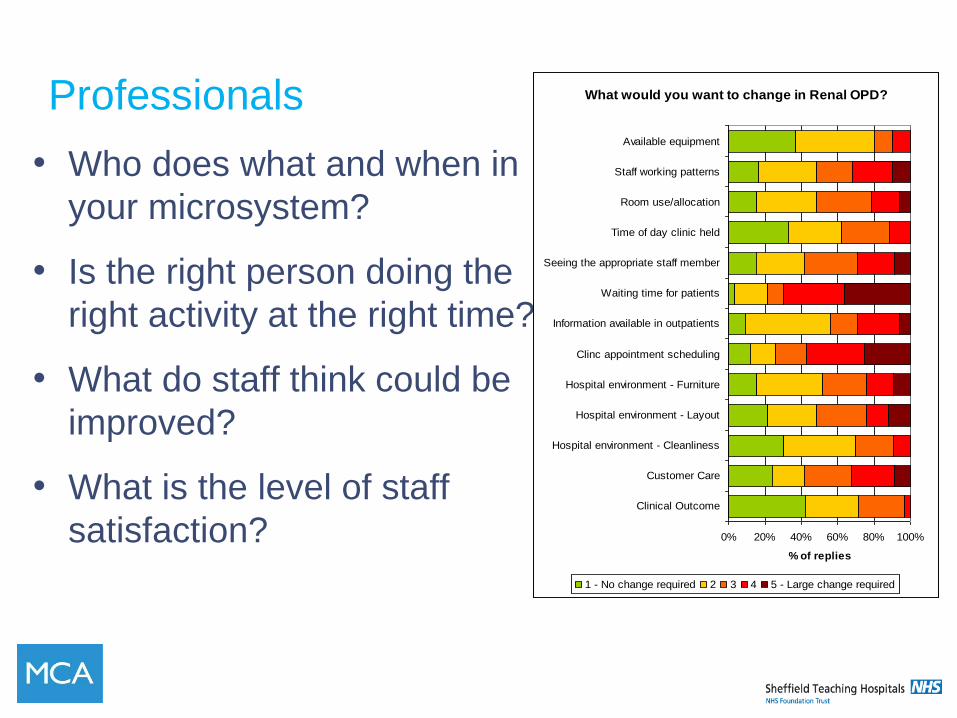
Professionals
• Who does what and when in
your microsystem?
• Is the right person doing the
right activity at the right time?
• What do staff think could be
improved?
• What is the level of staff
satisfaction?
What would you want to change in Renal OPD?
0% 20% 40% 60% 80% 100%
Clinical Outcome
Customer Care
Hospital environment - Cleanliness
Hospital environment - Layout
Hospital environment - Furniture
Clinc appointment scheduling
Information available in outpatients
Waiting time for patients
Seeing the appropriate staff member
Time of day clinic held
Room use/allocation
Staff working patterns
Available equipment
% of replies
1 - No change required 2 3 4 5 - Large change required
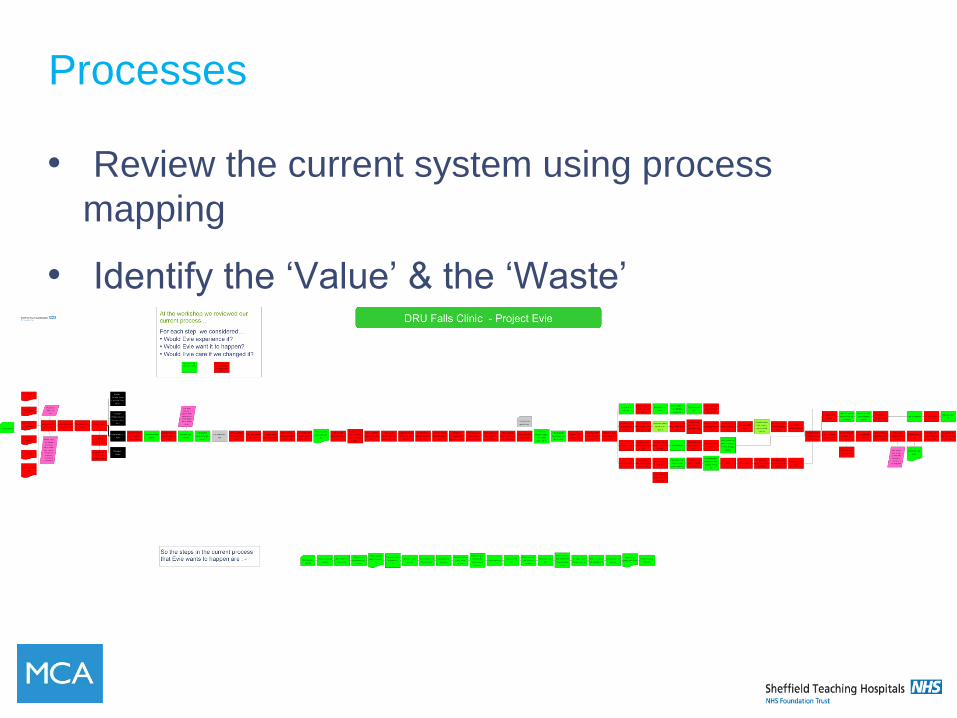
Processes
• Review the current system using process
mapping
• Identify the ‘Value’ & the ‘Waste’
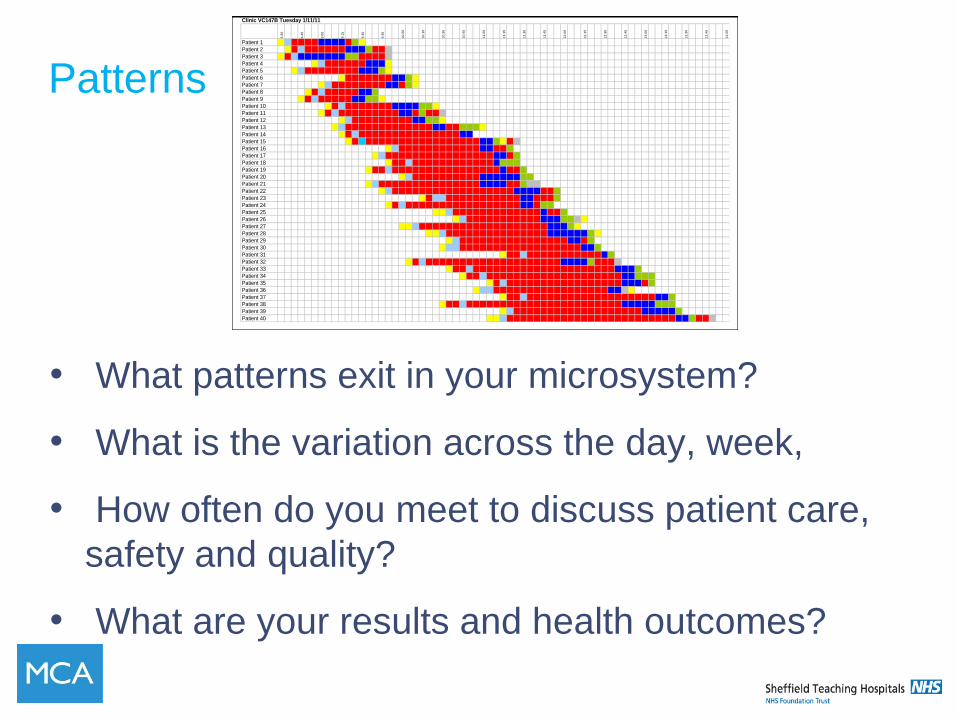
Patterns
• What patterns exit in your microsystem?
• What is the variation across the day, week,
• How often do you meet to discuss patient care,
safety and quality?
• What are your results and health outcomes?
Clinic VC147B Tuesday 1/11/11
8.3
0
8.4
5
9.0
0
9.1
5
9.3
0
9.4
5
10
.00
10
.15
10
.30
10
.45
11
.00
11
.15
11
.30
11
.45
12
.00
12
.15
12
.30
12
.45
13
.00
13
.15
13
.30
13
.45
14
.00
Patient 1
Patient 2
Patient 3
Patient 4
Patient 5
Patient 6
Patient 7
Patient 8
Patient 9
Patient 10
Patient 11
Patient 12
Patient 13
Patient 14
Patient 15
Patient 16
Patient 17
Patient 18
Patient 19
Patient 20
Patient 21
Patient 22
Patient 23
Patient 24
Patient 25
Patient 26
Patient 27
Patient 28
Patient 29
Patient 30
Patient 31
Patient 32
Patient 33
Patient 34
Patient 35
Patient 36
Patient 37
Patient 38
Patient 39
Patient 40
70
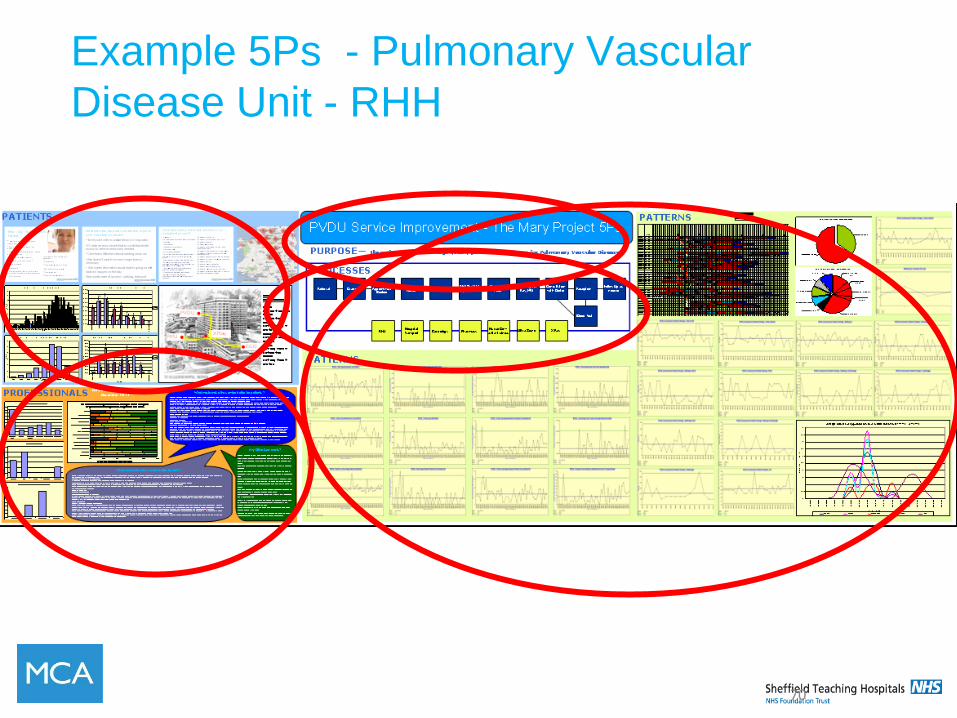
Example 5Ps - Pulmonary Vascular
Disease Unit - RHH
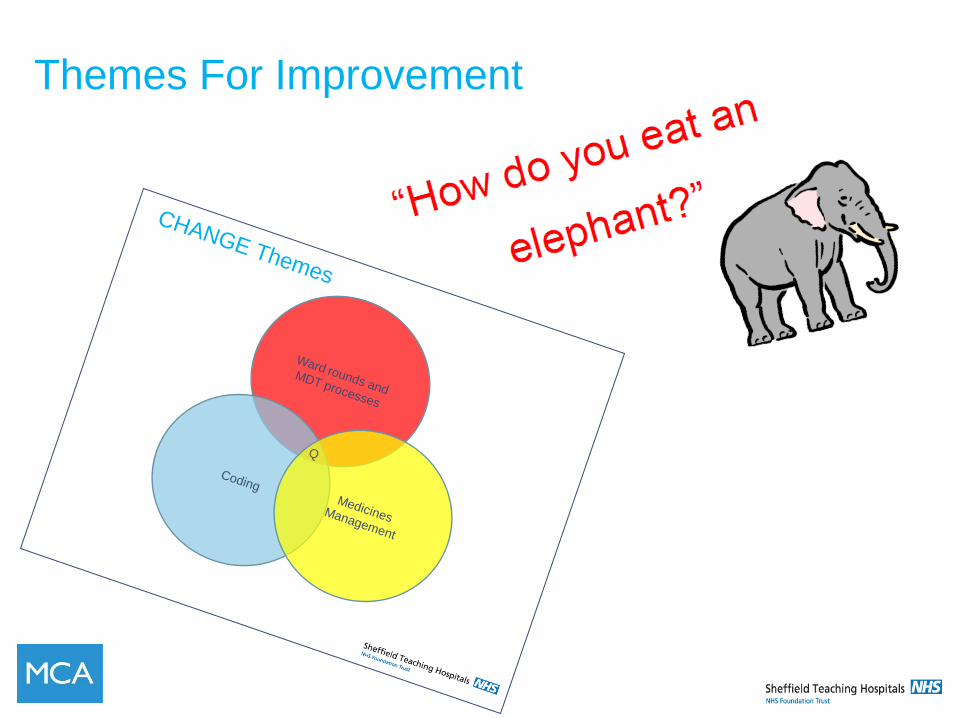
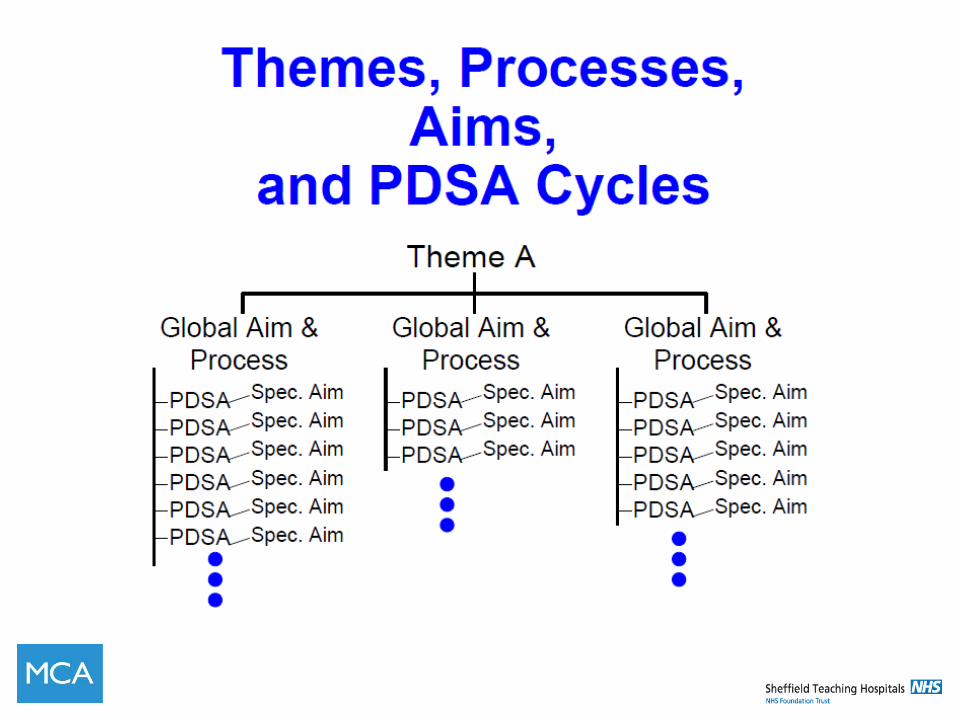
Themes For Improvement
CHANGE Themes
Ward rounds and
MDT processes
Coding
Medicines Management
Q
Global Aim Statement
• Clarifies and connects the improvement theme to
your work
• The starting point
• Sets the scope
• Increasing clarity of focus
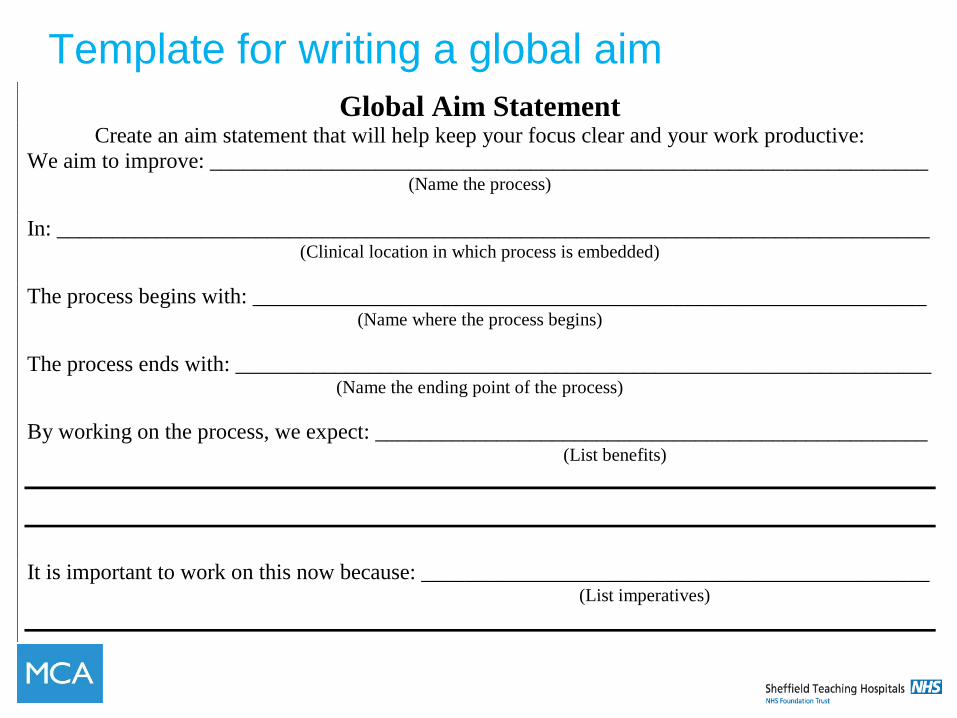
Template for writing a global aim
Write a Theme for Improvement: _________________________________________
Global Aim Statement Create an aim statement that will help keep your focus clear and your work productive:
We aim to improve: _________________________________________________________________ (Name the process)
In: _______________________________________________________________________________ (Clinical location in which process is embedded)
The process begins with: _____________________________________________________________ (Name where the process begins)
The process ends with: _______________________________________________________________ (Name the ending point of the process)
By working on the process, we expect: __________________________________________________ (List benefits)
It is important to work on this now because: ______________________________________________ (List imperatives)
Create Flowchart
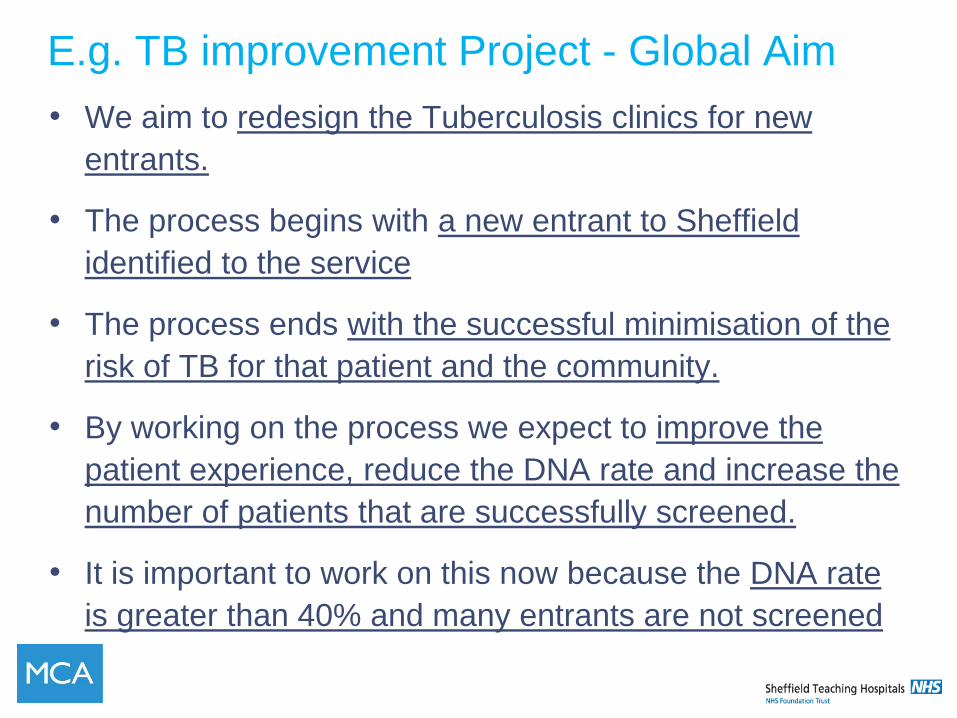
E.g. TB improvement Project - Global Aim
• We aim to redesign the Tuberculosis clinics for new
entrants.
• The process begins with a new entrant to Sheffield
identified to the service
• The process ends with the successful minimisation of the
risk of TB for that patient and the community.
• By working on the process we expect to improve the
patient experience, reduce the DNA rate and increase the
number of patients that are successfully screened.
• It is important to work on this now because the DNA rate
is greater than 40% and many entrants are not screened

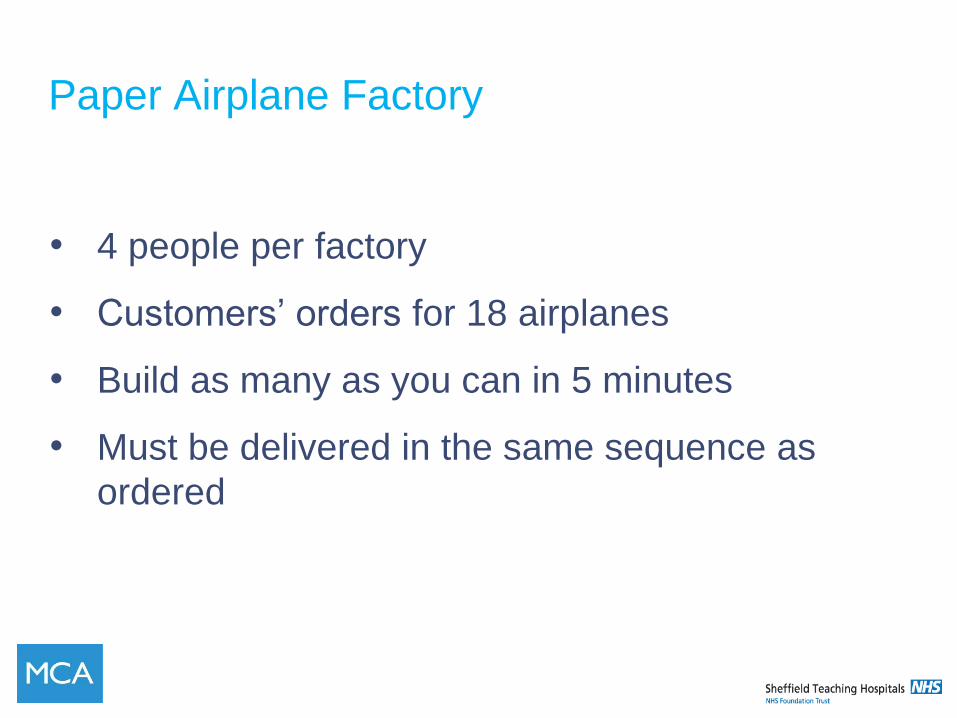
Paper Airplane Factory
• 4 people per factory
• Customers’ orders for 18 airplanes
• Build as many as you can in 5 minutes
• Must be delivered in the same sequence as
ordered

STOP
HOW MANY?
PROCESS MAPPING
PROCESS
Processes
“Every system is perfectly
designed to get
the results it gets”
Paul B. Batalden
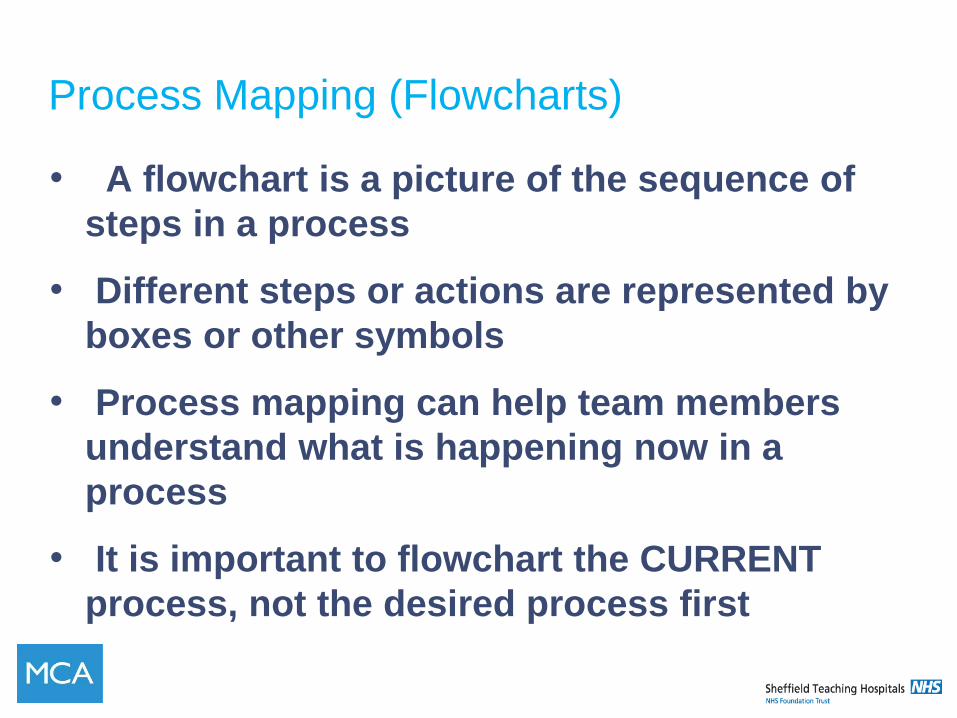
Process Mapping (Flowcharts)
• A flowchart is a picture of the sequence of
steps in a process
• Different steps or actions are represented by
boxes or other symbols
• Process mapping can help team members
understand what is happening now in a
process
• It is important to flowchart the CURRENT
process, not the desired process first
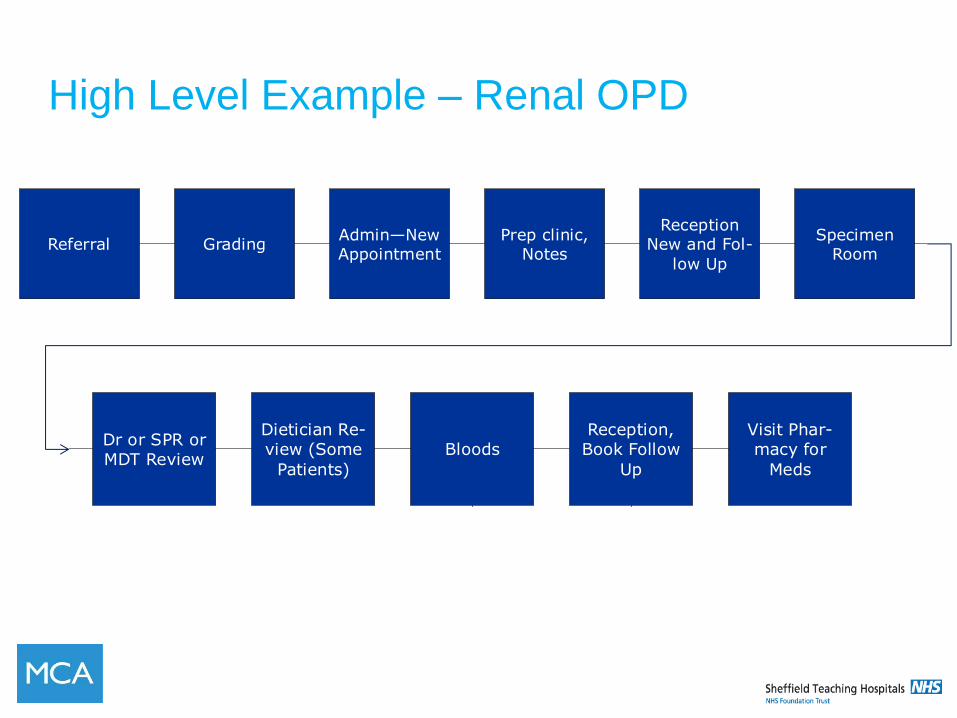
High Level Example – Renal OPD
Referral Grading Admin—New Appointment
Prep clinic, Notes
Reception New and Fol-
low Up
Specimen Room
Dr or SPR or MDT Review
Dietician Re-view (Some
Patients)
Bloods Reception, Book Follow
Up
Visit Phar-macy for
Meds
Iron Clinic
Referral Grading Admin—New Appointment
Prep clinic, Notes
Reception New and Fol-
low Up
Specimen Room
Dr or SPR or MDT Review
Dietician Re-view (Some
Patients)
Bloods Reception, Book Follow
Up
Visit Phar-macy for
Meds
Iron Clinic
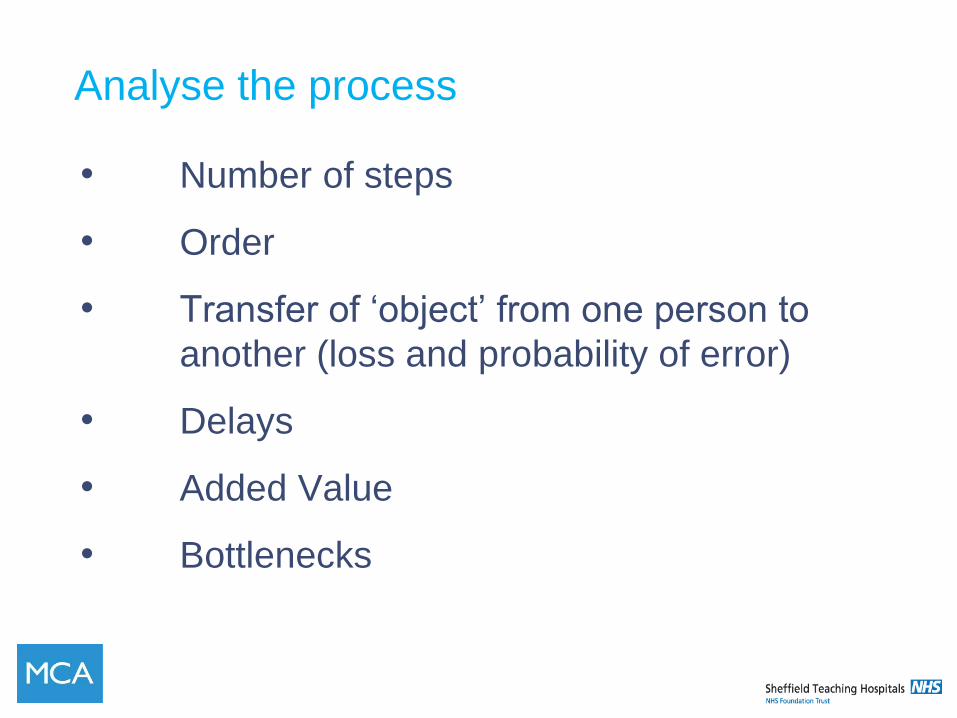
Analyse the process
• Number of steps
• Order
• Transfer of ‘object’ from one person to
another (loss and probability of error)
• Delays
• Added Value
• Bottlenecks
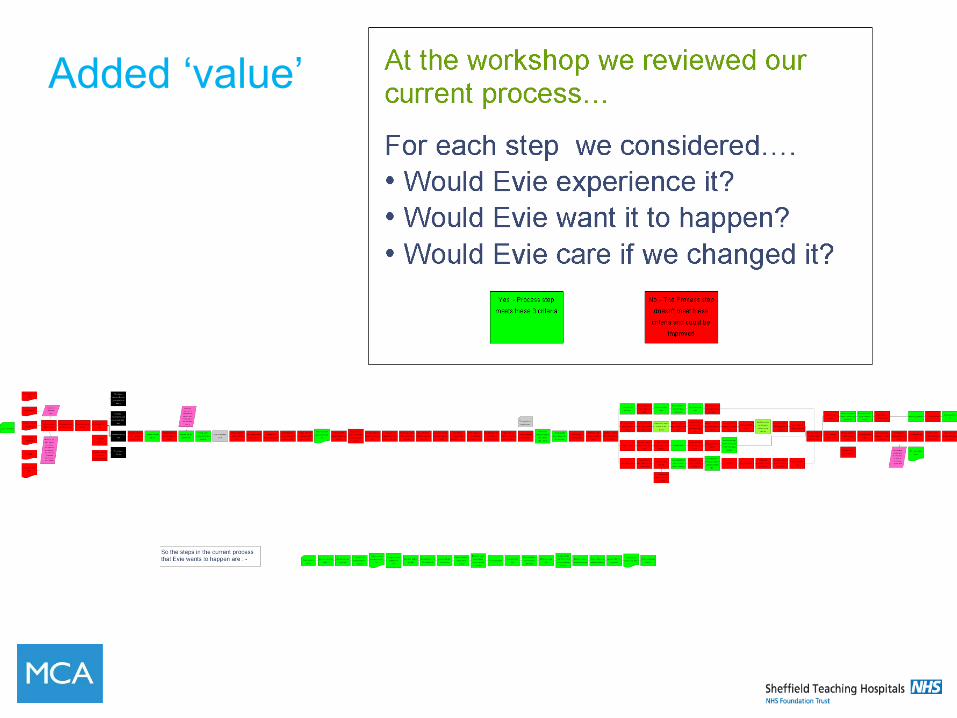
Added ‘value’
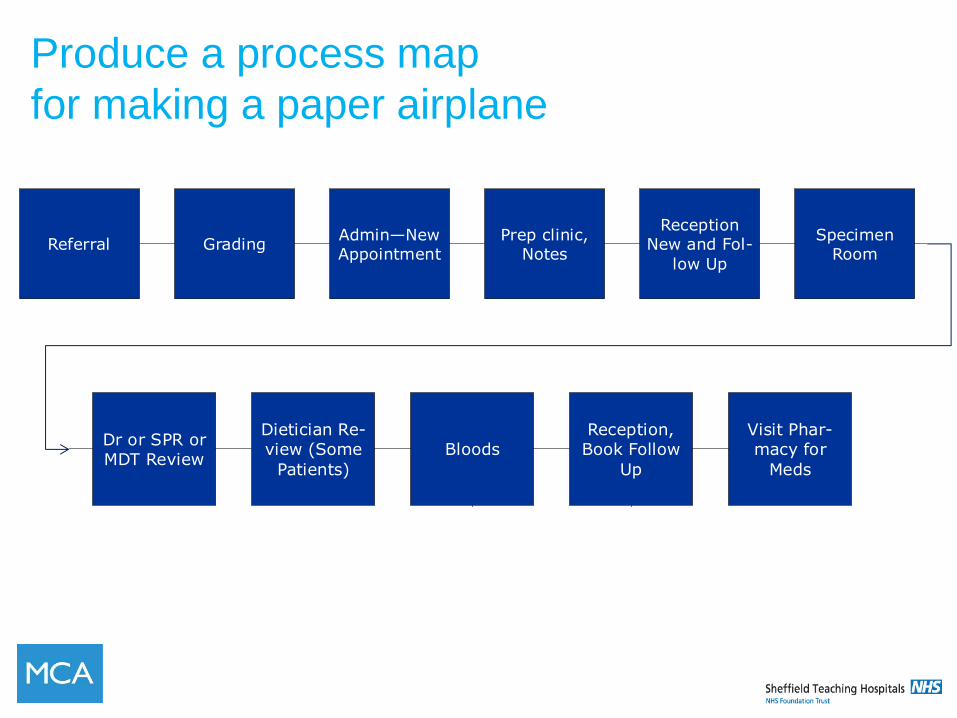
Produce a process map
for making a paper airplane
Referral Grading Admin—New Appointment
Prep clinic, Notes
Reception New and Fol-
low Up
Specimen Room
Dr or SPR or MDT Review
Dietician Re-view (Some
Patients)
Bloods Reception, Book Follow
Up
Visit Phar-macy for
Meds
Iron Clinic
Referral Grading Admin—New Appointment
Prep clinic, Notes
Reception New and Fol-
low Up
Specimen Room
Dr or SPR or MDT Review
Dietician Re-view (Some
Patients)
Bloods Reception, Book Follow
Up
Visit Phar-macy for
Meds
Iron Clinic

Round 2

STOP
HOW MANY?
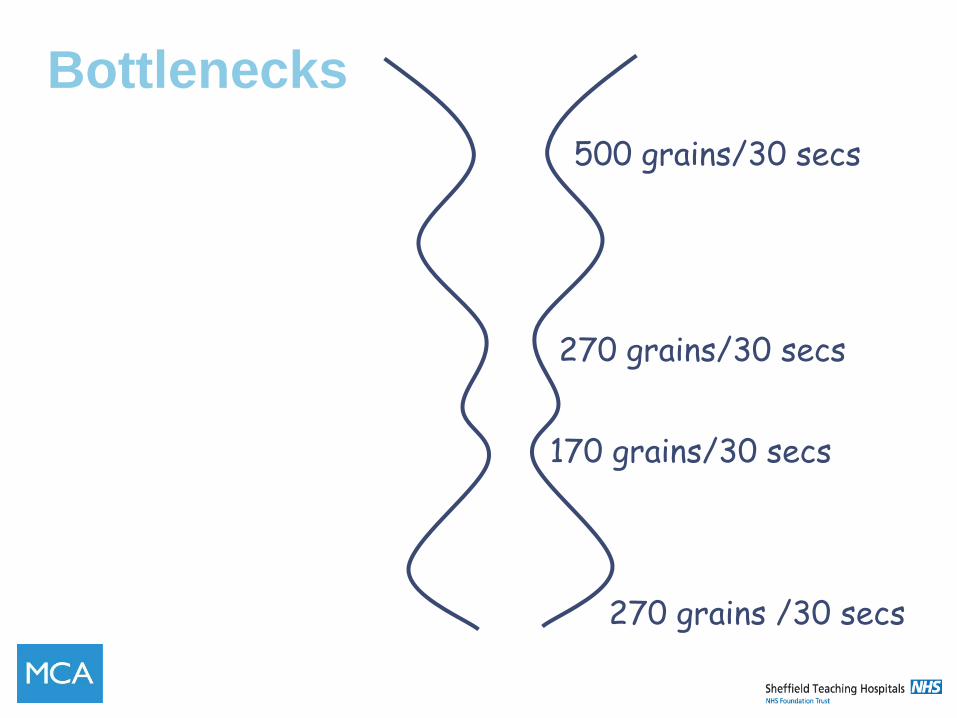
500 grains/30 secs
270 grains/30 secs
170 grains/30 secs
270 grains /30 secs
Bottlenecks
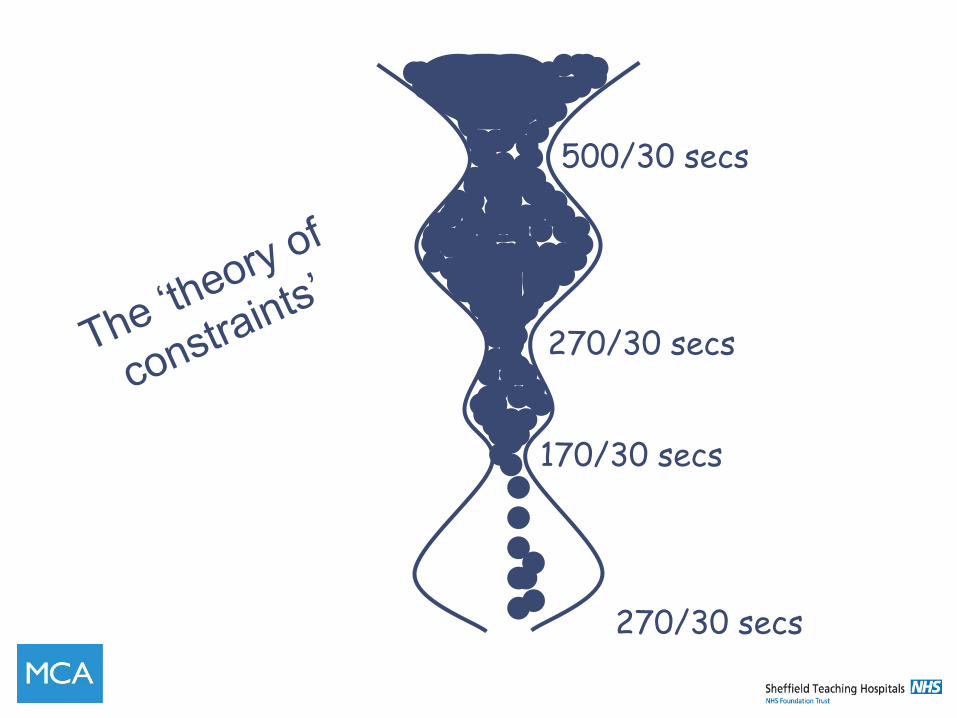
500/30 secs
270/30 secs
170/30 secs
270/30 secs
InputOutput
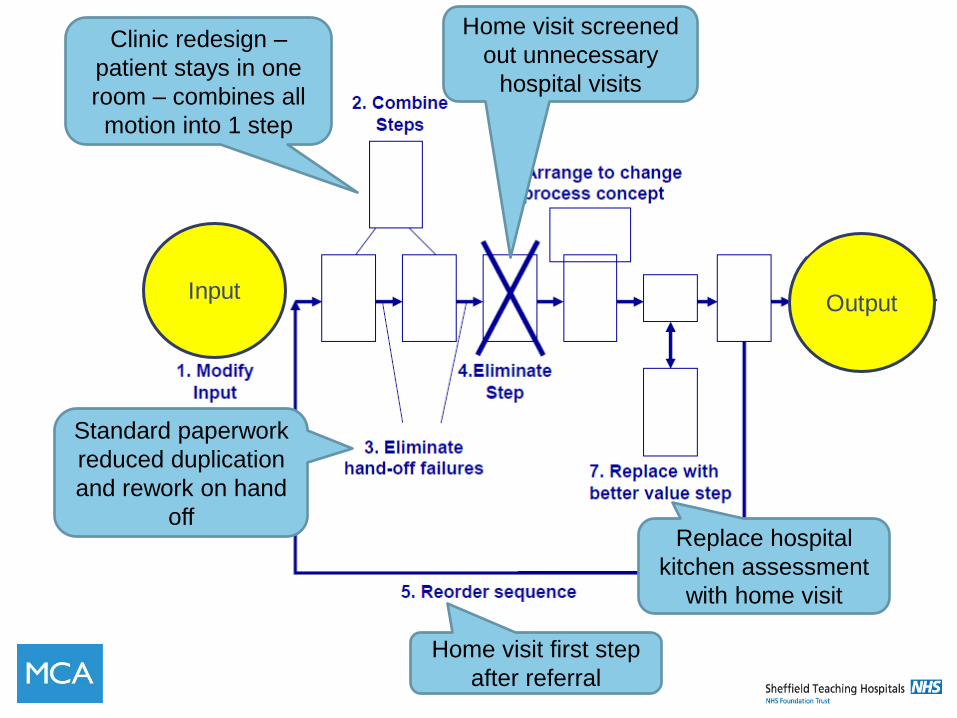
Using Process
Maps to generate
change ideas
Replace hospital
kitchen assessment
with home visit
Home visit first step
after referral
Home visit screened
out unnecessary
hospital visits
Clinic redesign –
patient stays in one
room – combines all
motion into 1 step
Standard paperwork
reduced duplication
and rework on hand
off
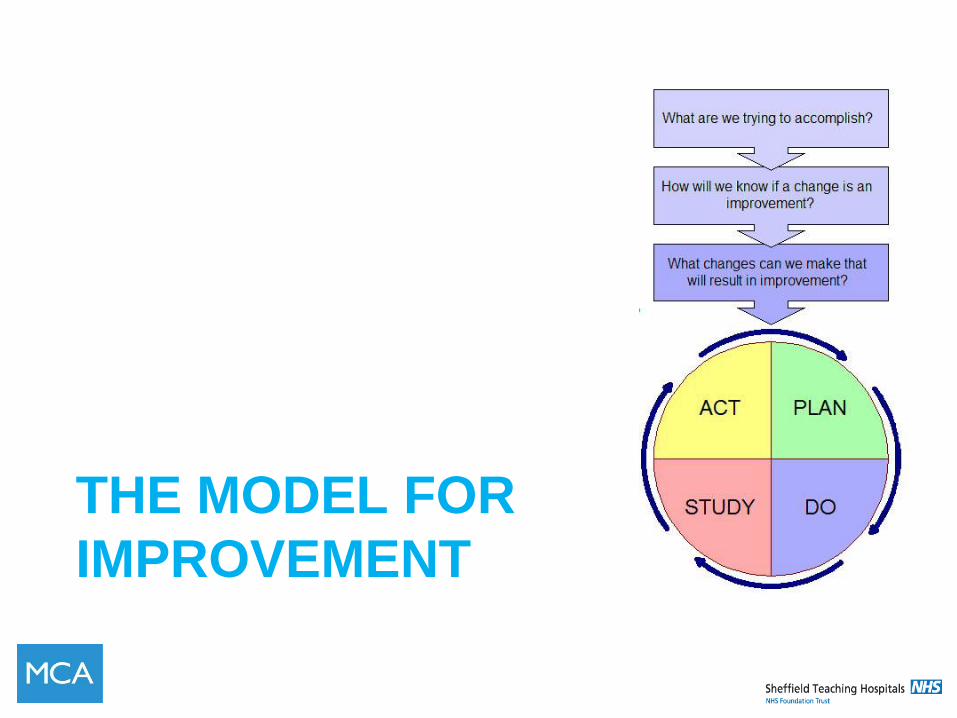
THE MODEL FOR
IMPROVEMENT
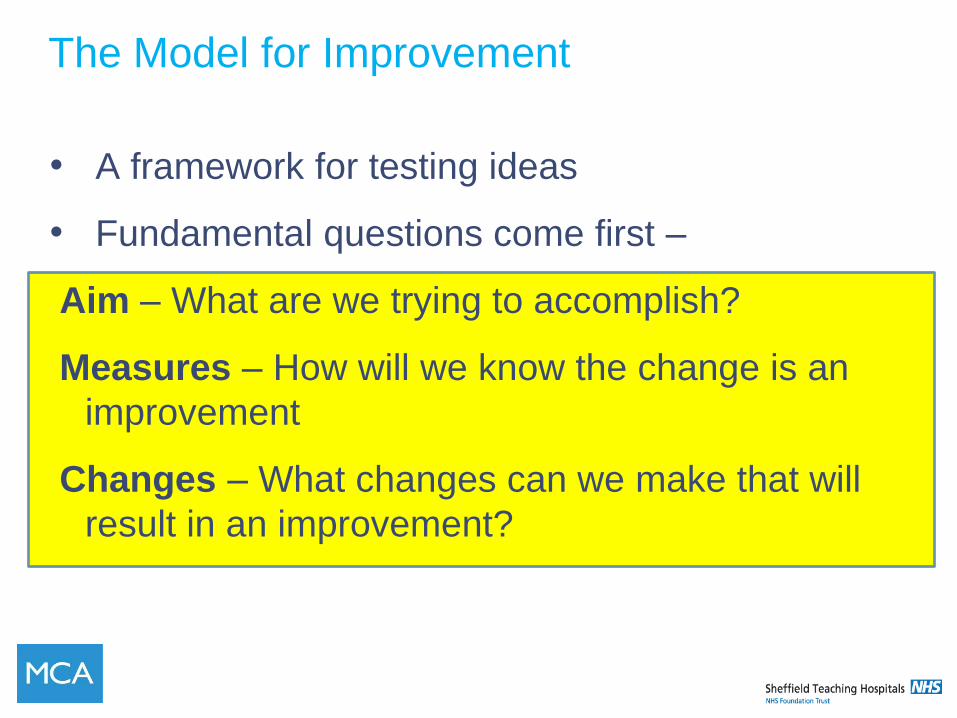
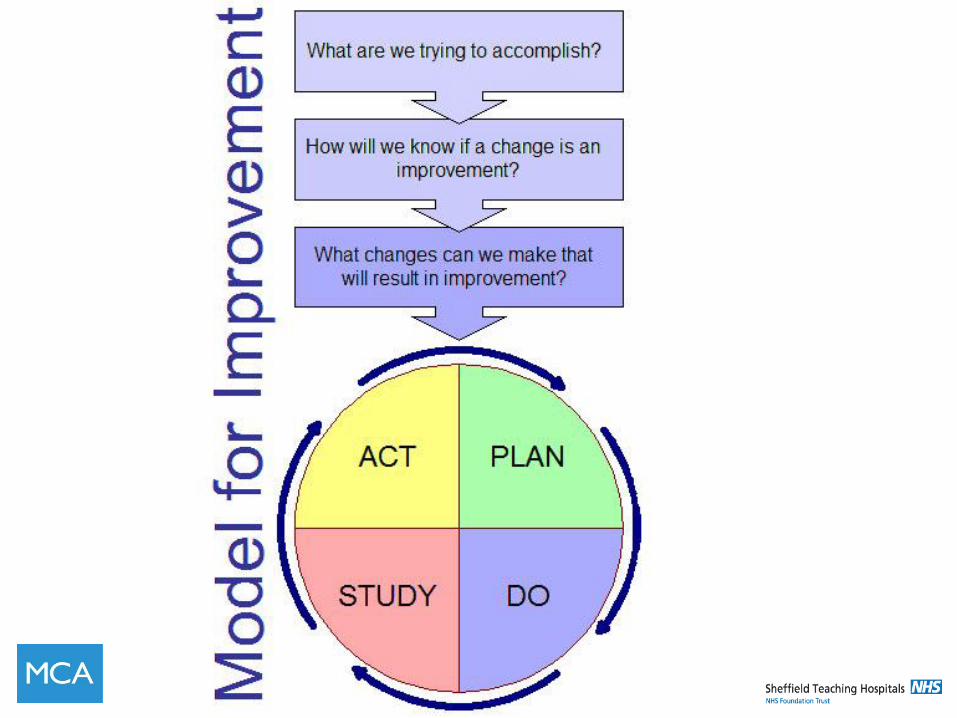
The Model for Improvement
• A framework for testing ideas
• Fundamental questions come first –
Aim – What are we trying to accomplish?
Measures – How will we know the change is an
improvement
Changes – What changes can we make that will
result in an improvement?
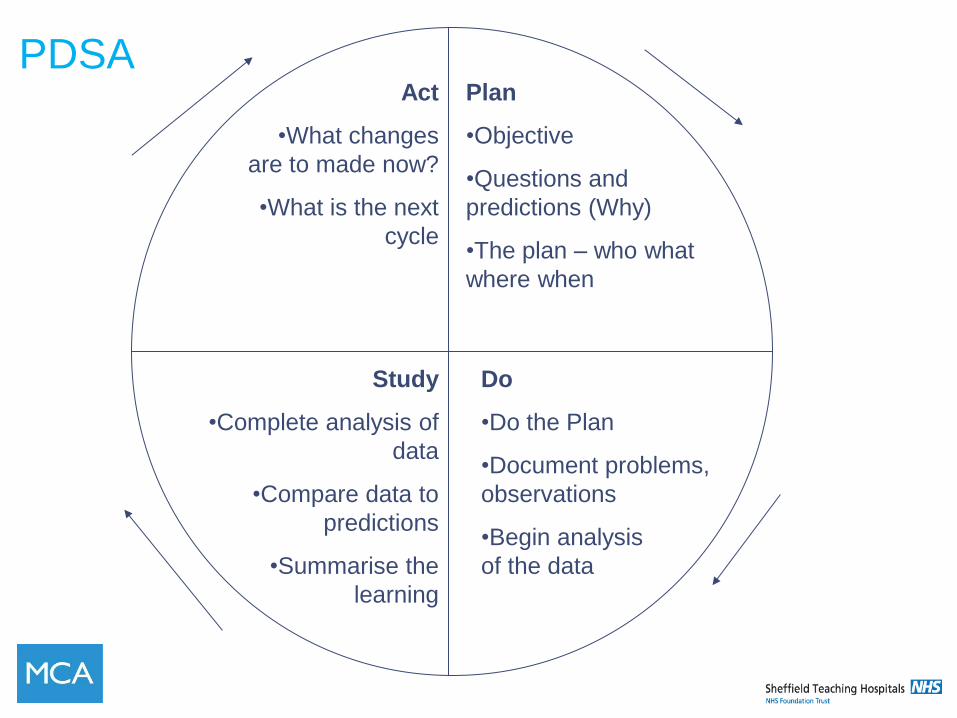
Plan
•Objective
•Questions and
predictions (Why)
•The plan – who what
where when
Do
•Do the Plan
•Document problems,
observations
•Begin analysis
of the data
Study
•Complete analysis of
data
•Compare data to
predictions
•Summarise the
learning
Act
•What changes
are to made now?
•What is the next
cycle
PDSA

PDSA - experimentation • Always start with a specific aim - What are we trying to accomplish?
• How will know if this is an improvement? – Data.
• Small tests of change over a short time
• Debrief frequently
• Communicate results
• Repeated Cycles
• When we meet our aim? –
SDSA = Standardise
SDSA
1
3
2
P
DS
A
P
DS
A
P
DS
A
P
DS
A
P
DS
A
P
DS
A
4
5
6
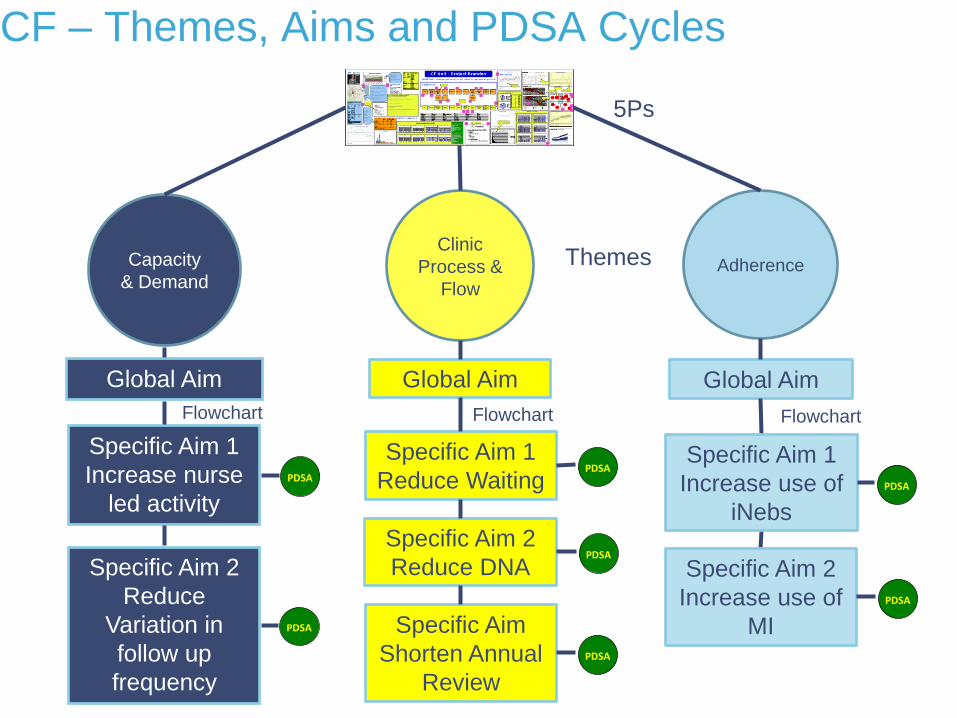
CF – Themes, Aims and PDSA Cycles
Themes Capacity
& Demand Adherence
Clinic
Process &
Flow
5Ps
Global Aim Global Aim Global Aim
Specific Aim 1
Reduce Waiting
Global Aim
1
2
3
SDS
A
P
DS
A
P
DS
A
P
DS
A
PDSA
1
3
2
Specific Aim 2
Reduce DNA
Global Aim
1
2
3
SDS
A
P
DS
A
P
DS
A
P
DS
A
PDSA
1
3
2
Specific Aim 1
Increase nurse
led activity
Global Aim
1
2
3
SDS
A
P
DS
A
P
DS
A
P
DS
A
PDSA
1
3
2
Specific Aim 2
Reduce
Variation in
follow up
frequency
Global Aim
1
2
3
SDS
A
P
DS
A
P
DS
A
P
DS
A
PDSA
1
3
2
Specific Aim
Shorten Annual
Review
Global Aim
1
2
3
SDS
A
P
DS
A
P
DS
A
P
DS
A
PDSA
1
3
2
Specific Aim 1
Increase use of
iNebs
Specific Aim 2
Increase use of
MI
Flowchart Flowchart Flowchart
Global Aim
1
2
3
SDS
A
P
DS
A
P
DS
A
P
DS
A
PDSA
1
3
2
Global Aim
1
2
3
SDS
A
P
DS
A
P
DS
A
P
DS
A
PDSA
1
3
2
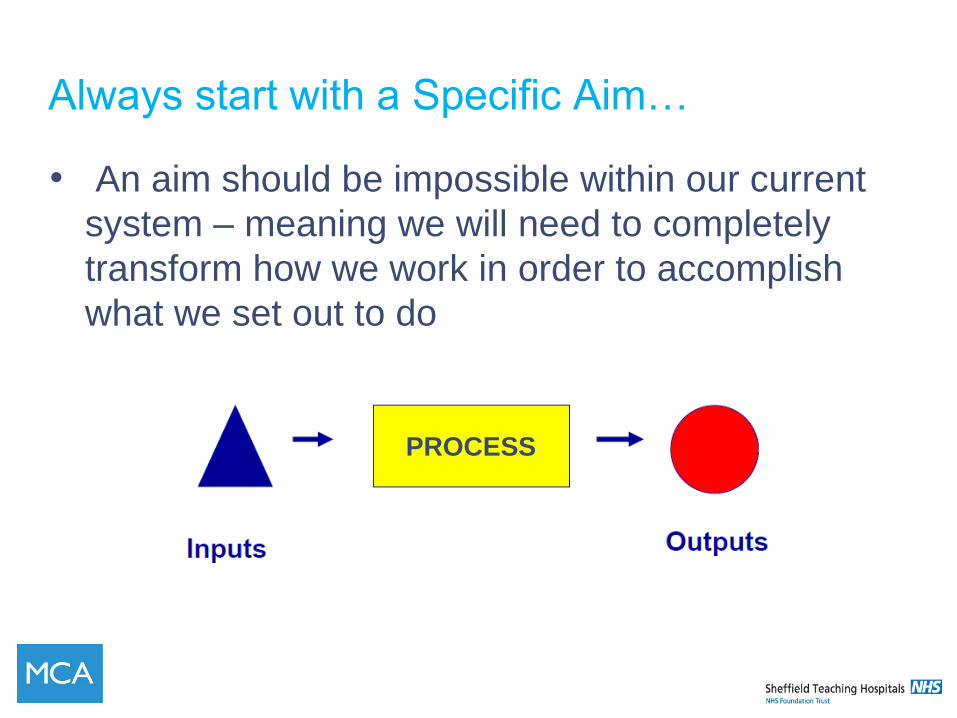
Always start with a Specific Aim…
• An aim should be impossible within our current
system – meaning we will need to completely
transform how we work in order to accomplish
what we set out to do
PROCESS
Key Components of an AIM
• ambitious
• measureable
• operationally specific
• time-limited
Transformative
Setting an Aim
• What are we trying to accomplish?
•Having a clear understanding of your Aim is critical
-Key points:
How Much?
By When?
AIM STATEMENT
• Less is not a number, soon is not a time
• We aim to reduce catheter associated UTIs among patients on Ward A1 by 50% by September 2014
What is a catheter associated UTI?
Example Specific Aims
• We aim to achieve 50% of all daily TTOs are
written, checked and delivered to Pharmacy by
10am from the four Brearley Respiratory wards by
1st September 2012. Our current baseline
measure is 15% by 10am.
• We will decrease waiting times in Clinic DT247J
by 75% compared to our baseline measure by
March 2012
What is a specific aim from your global aim?

THE M&M CHALLENGE
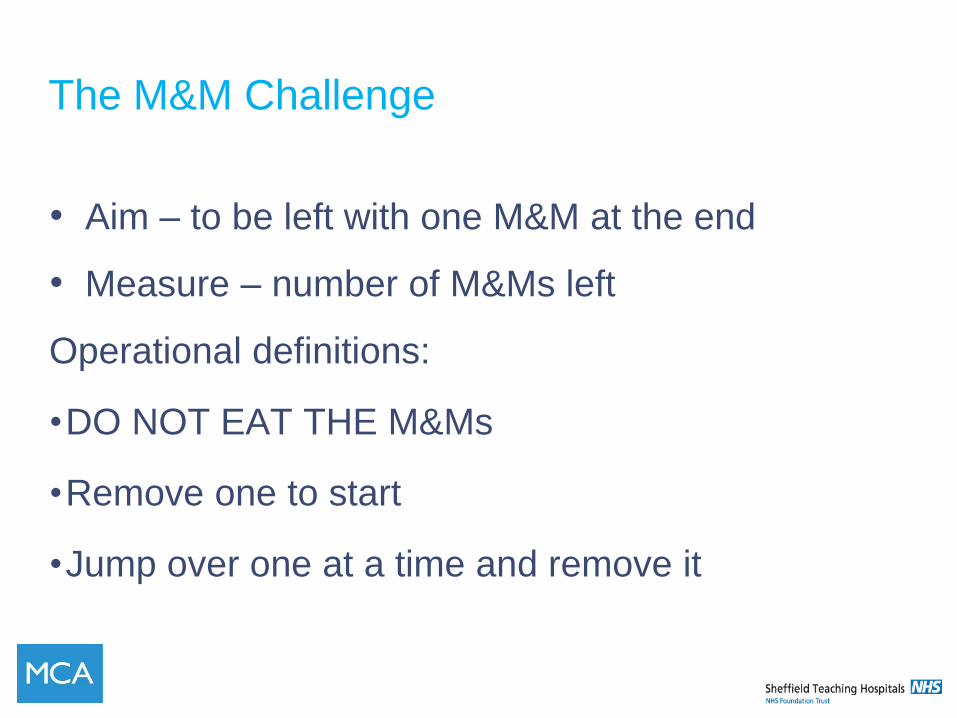
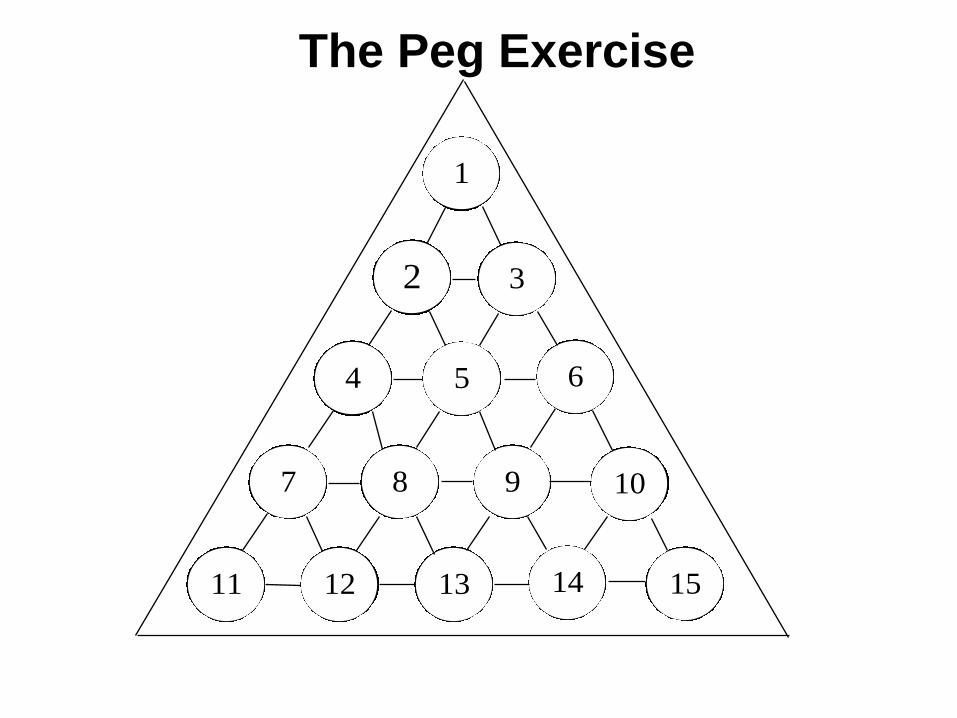
The M&M Challenge
• Aim – to be left with one M&M at the end
• Measure – number of M&Ms left
Operational definitions:
•DO NOT EAT THE M&Ms
•Remove one to start
•Jump over one at a time and remove it
2
1
3
654
10987
1514131211
The Peg Exercise
MEASUREMENT FOR
IMPROVEMENT
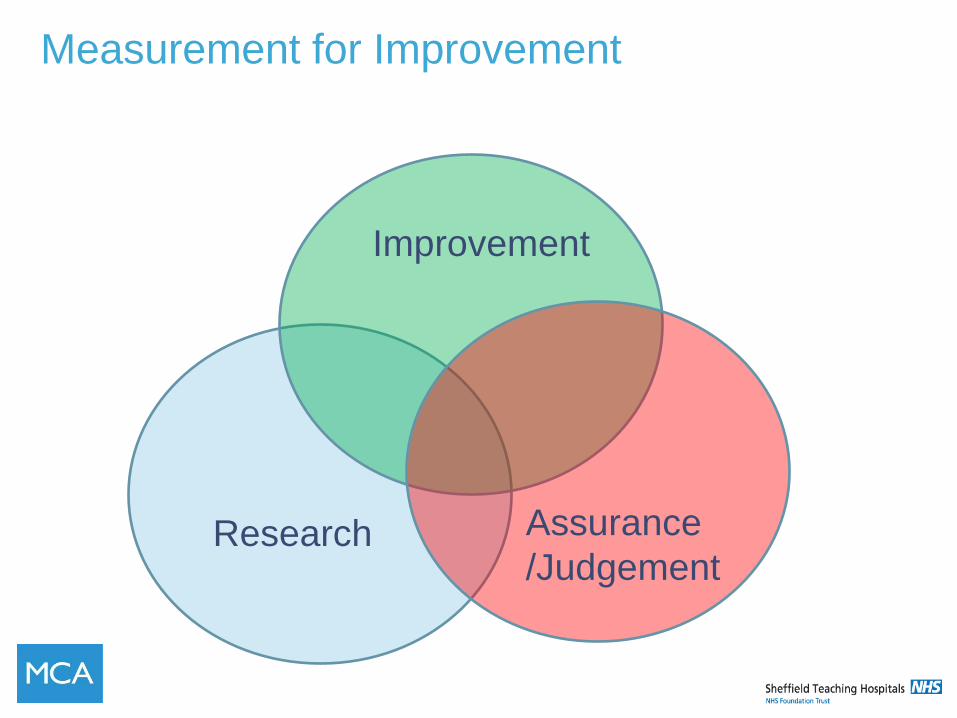
Measurement for Improvement
Improvement
Research Assurance
/Judgement
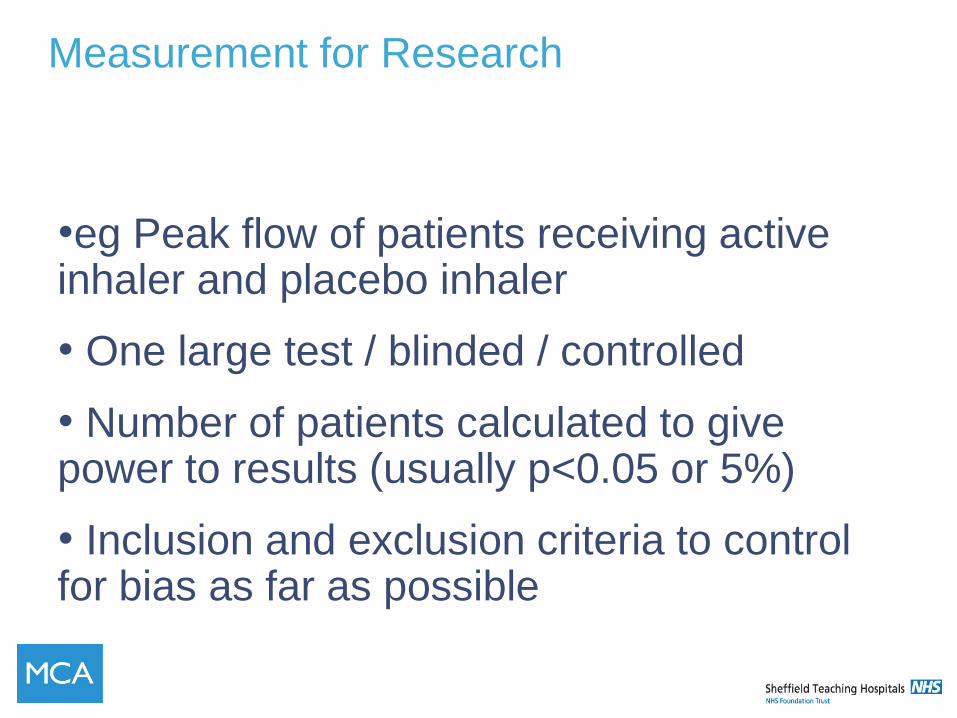
Measurement for Research
•eg Peak flow of patients receiving active inhaler and placebo inhaler
• One large test / blinded / controlled
• Number of patients calculated to give power to results (usually p<0.05 or 5%)
• Inclusion and exclusion criteria to control for bias as far as possible
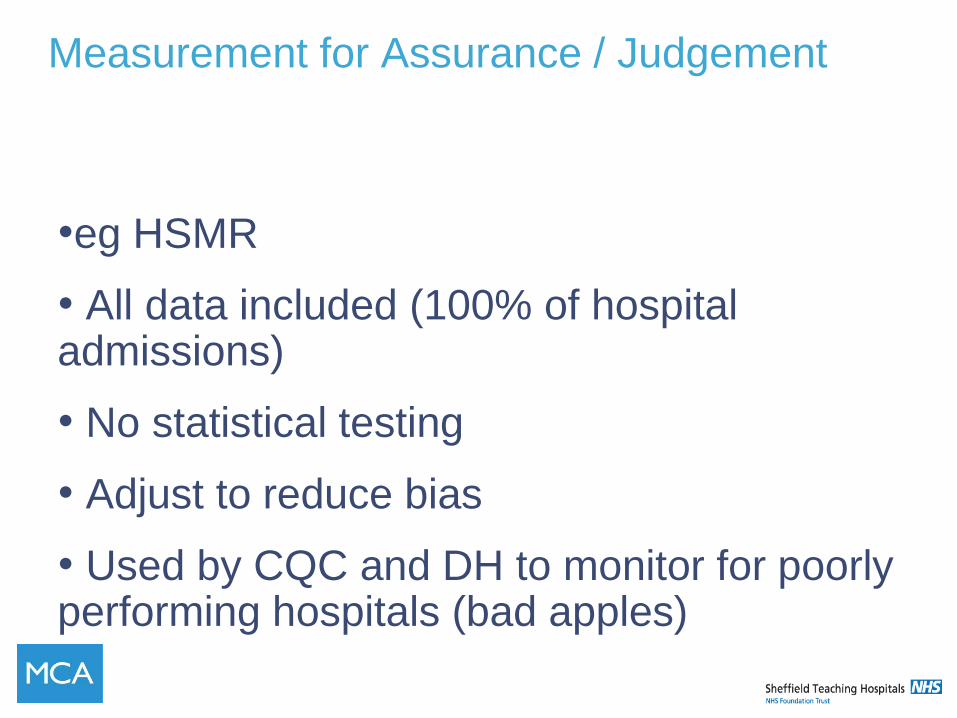
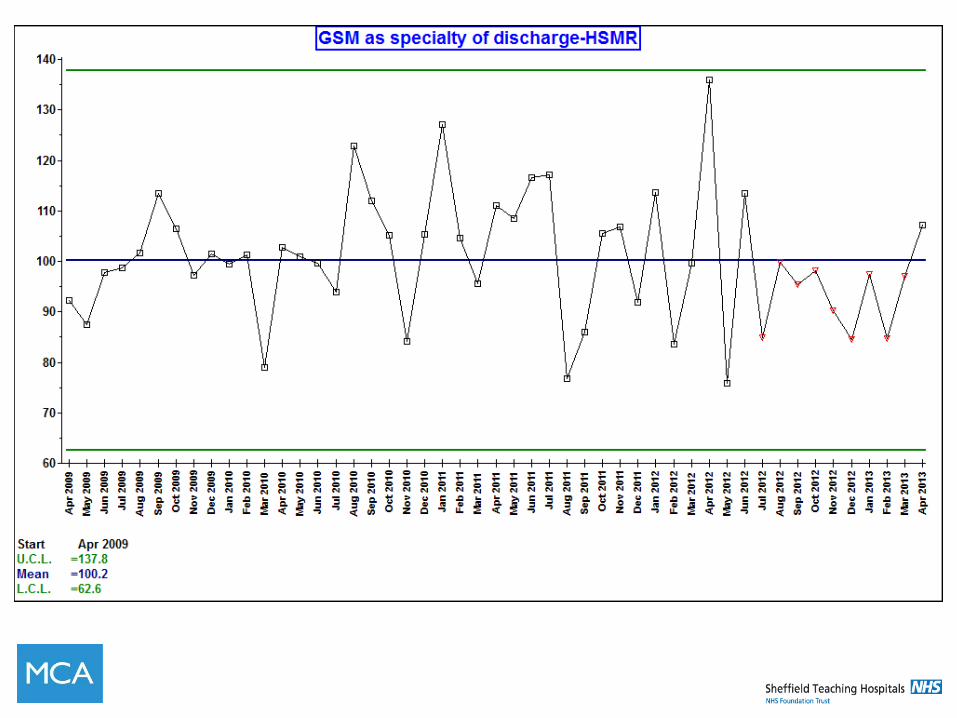
Measurement for Assurance / Judgement
•eg HSMR
• All data included (100% of hospital admissions)
• No statistical testing
• Adjust to reduce bias
• Used by CQC and DH to monitor for poorly performing hospitals (bad apples)
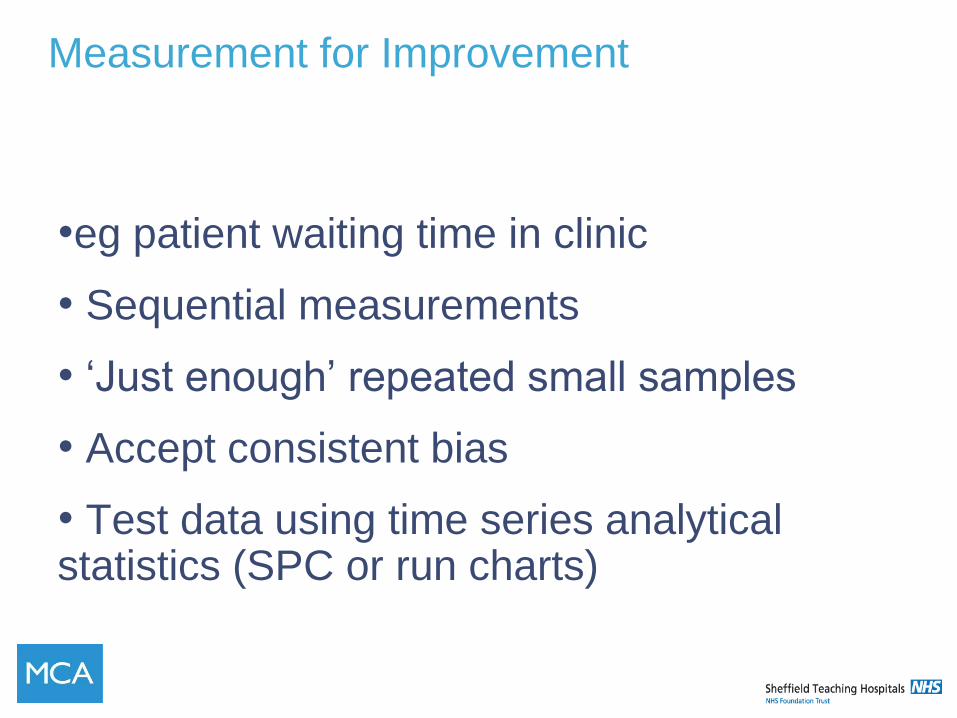
Measurement for Improvement
•eg patient waiting time in clinic
• Sequential measurements
• ‘Just enough’ repeated small samples
• Accept consistent bias
• Test data using time series analytical statistics (SPC or run charts)
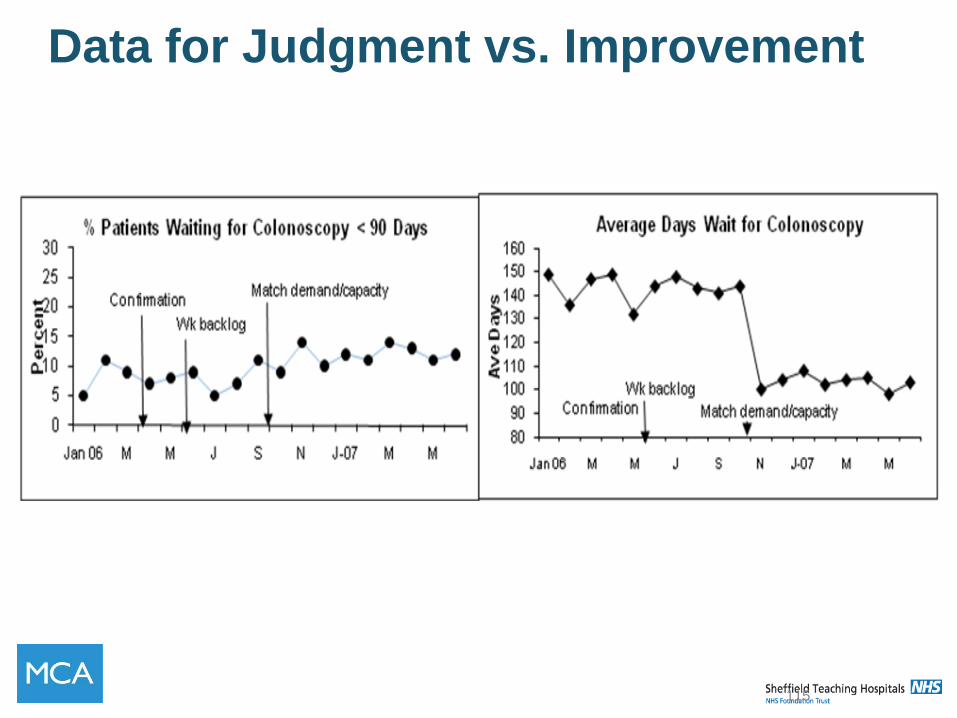
Data for Judgment vs. Improvement
115
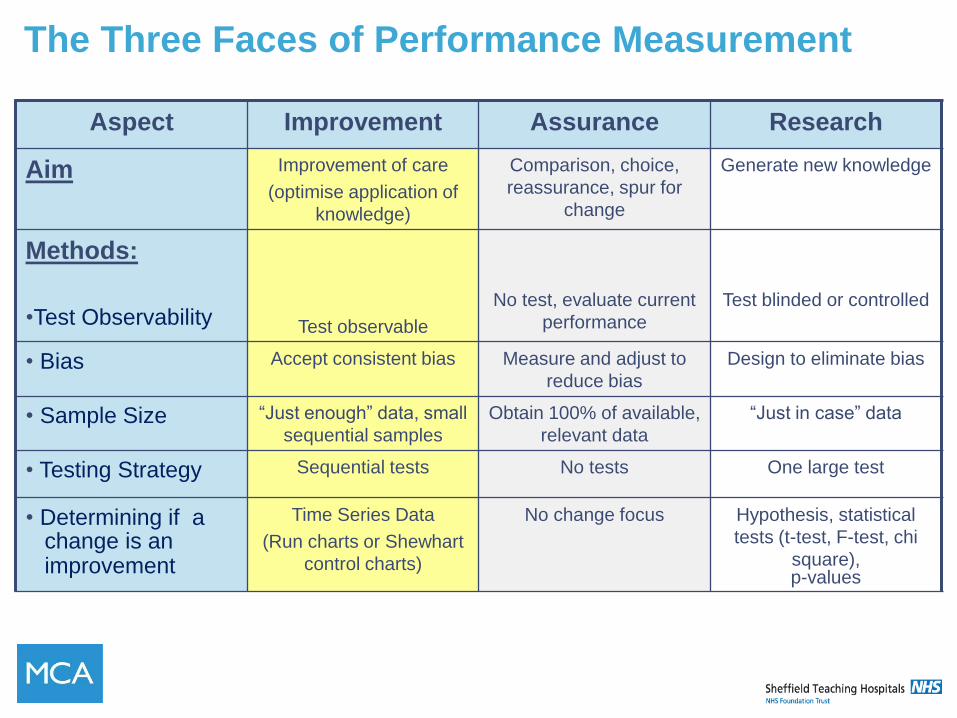
The Three Faces of Performance Measurement
Aspect Improvement Assurance Research
Aim Improvement of care
(optimise application of
knowledge)
Comparison, choice,
reassurance, spur for
change
Generate new knowledge
Methods:
•Test Observability
Test observable
No test, evaluate current
performance
Test blinded or controlled
• Bias Accept consistent bias Measure and adjust to
reduce bias
Design to eliminate bias
• Sample Size “Just enough” data, small
sequential samples
Obtain 100% of available,
relevant data
“Just in case” data
• Testing Strategy Sequential tests No tests One large test
• Determining if a change is an improvement
Time Series Data
(Run charts or Shewhart
control charts)
No change focus Hypothesis, statistical
tests (t-test, F-test, chi
square), p-values
Three Types of Measures for Improvement
• Outcome Measures
• Process Measures
• Balance Measures
Outcome Measures
• Outcome Measures:
• What is the outcome or result?
• How is the overall system performing? (Voice of the customer)
• What might some examples of outcome measures be?
Process Measures
• Process Measures:
• What is the system telling you about how well it is working?
• Are the parts/steps in the system performing as planned? (Voice of the system)
• What might some examples of process measures be?
Balance Measures
• Balance Measures:
• Unrelated Processes which might be affected by the changes we make
• What happened to the system as we improved the outcome and process measures?
• What might some examples of balance measures be?
Weight loss and developing
measures exercise Background: A friend has come to you and asked you to help develop measures for a group she is working with
Aim: The aim of the improvement project is for participants to lose weight. They need regular feedback to keep them on task
Develop a Family of 4 to 6 measures that could be reported each week for the project:
• Outcome Measures – 1-2 measures
• Process Measures – 2 measures
• Balance Measures – 1 or 2 measures
Where do measures come from?
• Data Elements – raw information already (or in
need of) being collected by clinics and hospitals
• Usually found in clinic registers, summary forms
or centralised health information systems
• Can you give some examples of raw data your
process is currently collecting?
Agenda – Day 1 - Morning • 09.30 Welcome & Feedback on Self Assessment ( 20 mins )
• 09.50 Patient Story (10 mins)
• 10.00 Complexity (20 mins)
• 10.20 Patient Story Part 2 (10 mins)
• 10.30 The Structure of Improvement (20 mins)
• 10.50 Pull the Lever (10 mins)
• 11.00 Coffee (20 mins)
• 11.20 Systems Thinking & Activity (20 mins)
• 11.40 Microsystems and ownership (20mins)
• 12.00 The 5Ps (10 mins)
• 12.10 Themes and Global Aims (20 minutes)
• 12.30 Lunch
Agenda – Day 1 - Afternoon
• 13.10 Process mapping (60 mins)
• 14.10 Theory of Constraints (10 mins)
• 14.20 The Model for Improvement (10 mins )
• 14.30 Specific Aims Activity (10 mins)
• 14.40 Coffee
• 14.50 M & M Challenge (30 mins)
• 15.20 Measurement (10 mins)
• 15.30 Weight Loss Activity (30 mins)
• 16.00 Evaluation
• 16.10 Close
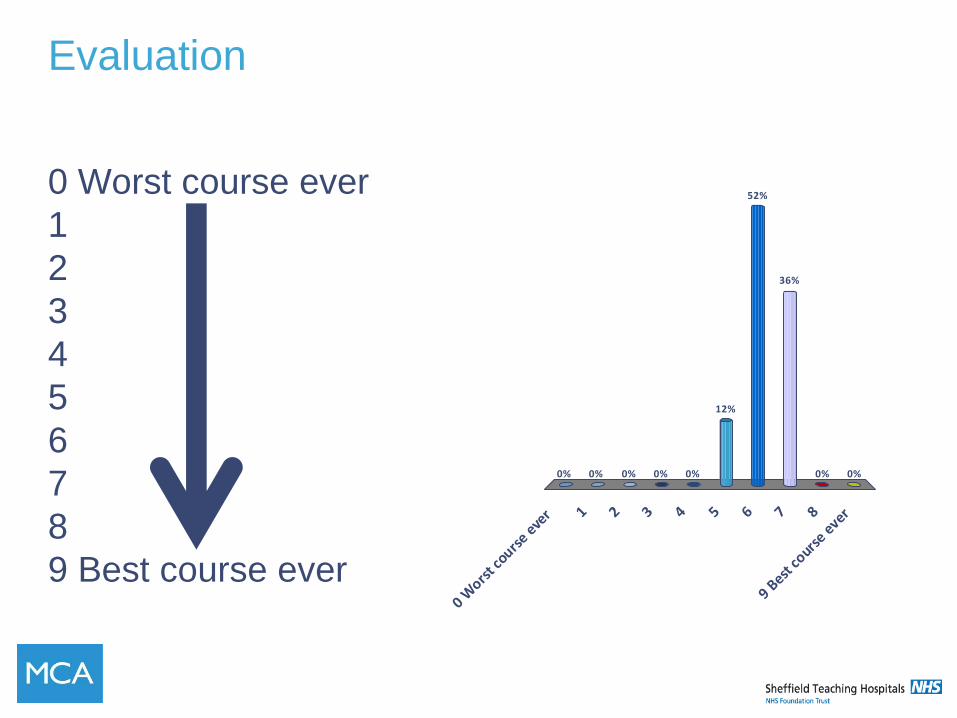
Evaluation
0 Worst course ever
1
2
3
4
5
6
7
8
9 Best course ever 0 W
orst c
ourse e
ver 1 2 3 4 5 6 7 8
9 Best
cours
e ever
0% 0% 0% 0% 0%0%
36%
52%
12%
0%
EVALUATION
What went
well?
What could
be improved?