Embed Size (px)
Citation preview
What is psychometrics? What is R? Where did it come from, why use it? Basic statistics and graphics TOD
An introduction to Psychometric Theory withapplications in R
William Revelle
Department of PsychologyNorthwestern UniversityEvanston, Illinois USA
February, 2013
1 / 71
What is psychometrics? What is R? Where did it come from, why use it? Basic statistics and graphics TOD
Overview
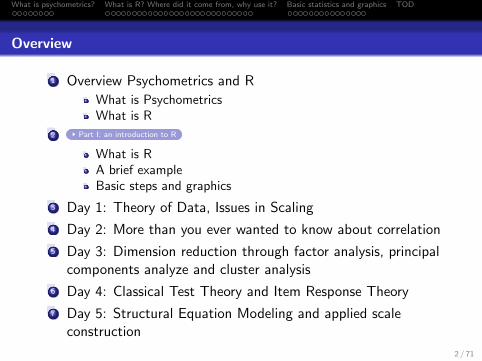
1 Overview Psychometrics and R
What is PsychometricsWhat is R
2 Part I: an introduction to R
What is RA brief exampleBasic steps and graphics
3 Day 1: Theory of Data, Issues in Scaling
4 Day 2: More than you ever wanted to know about correlation
5 Day 3: Dimension reduction through factor analysis, principalcomponents analyze and cluster analysis
6 Day 4: Classical Test Theory and Item Response Theory
7 Day 5: Structural Equation Modeling and applied scaleconstruction
2 / 71
What is psychometrics? What is R? Where did it come from, why use it? Basic statistics and graphics TOD
Outline of Day 1/part 1
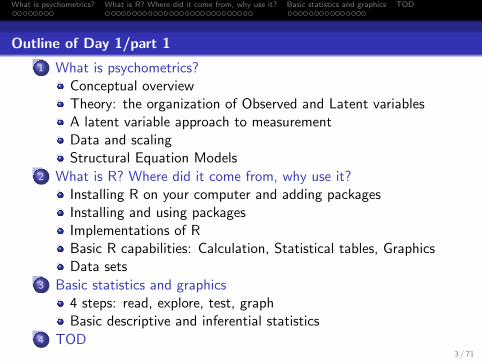
1 What is psychometrics?Conceptual overviewTheory: the organization of Observed and Latent variablesA latent variable approach to measurementData and scalingStructural Equation Models
2 What is R? Where did it come from, why use it?Installing R on your computer and adding packagesInstalling and using packagesImplementations of RBasic R capabilities: Calculation, Statistical tables, GraphicsData sets
3 Basic statistics and graphics4 steps: read, explore, test, graphBasic descriptive and inferential statistics
4 TOD3 / 71
What is psychometrics? What is R? Where did it come from, why use it? Basic statistics and graphics TOD
What is psychometrics?
In physical science a first essential step in the direction oflearning any subject is to find principles of numericalreckoning and methods for practicably measuring somequality connected with it. I often say that when you canmeasure what you are speaking about and express it innumbers you know something about it; but when youcannot measure it, when you cannot express it innumbers, your knowledge is of a meagre andunsatisfactory kind; it may be the beginning ofknowledge, but you have scarcely in your thoughtsadvanced to the stage of science, whatever the mattermay be. (Thomsom, 1891)
Taken from Michell (2003) in his critique of psychometrics: Michell, J. The Quantitative Imperative: Positivism,
NaTve Realism and the Place of Qualitative Methods in Psychology, Theory & Psychology, Vol. 13, No. 1, 5-31
(2003)
4 / 71
What is psychometrics? What is R? Where did it come from, why use it? Basic statistics and graphics TOD
What is psychometrics?
The character which shapes our conduct is a definite anddurable ‘something’, and therefore . . . it is reasonable toattempt to measure it. (Galton, 1884)
The history of science is the history of measurement” (J.M. Cattell, 1893)
Whatever exists at all exists in some amount. To know itthoroughly involves knowing its quantity as well as itsquality (E.L. Thorndike, 1918)
5 / 71
What is psychometrics? What is R? Where did it come from, why use it? Basic statistics and graphics TOD
What is psychometrics?
We hardly recognize a subject as scientific ifmeasurement is not one of its tools (Boring, 1929)
There is yet another [method] so vital that, if lacking it,any study is thought ... not be scientific in the full senseof the word. This further an crucial method is that ofmeasurement. (Spearman, 1937)
One’s knowledge of science begins when he can measurewhat he is speaking about and express in numbers(Eysenck, 1973)
Psychometrics: the assigning of numbers to observed psychologicalphenomena and to unobserved concepts. Evaluation of the fit oftheoretical models to empirical data.
6 / 71
What is psychometrics? What is R? Where did it come from, why use it? Basic statistics and graphics TOD
Conceptual overview
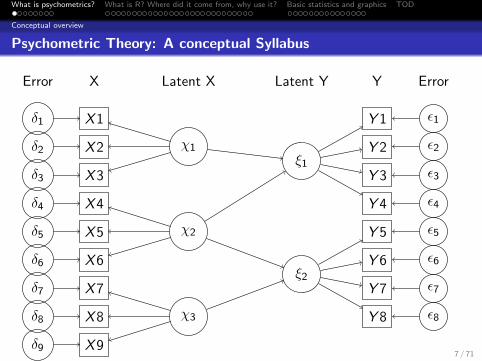
Psychometric Theory: A conceptual Syllabus
X
X 1
X 2
X 3
X 4
X 5
X 6
X 7
X 8
X 9
Error
δ1
δ2
δ3
δ4
δ5
δ6
δ7
δ8
δ9
χ1
χ2
χ3
ξ1
ξ2
Y
Y 1
Y 2
Y 3
Y 4
Y 5
Y 6
Y 7
Y 8
Error
ε1
ε2
ε3
ε4
ε5
ε6
ε7
ε8
Latent X Latent Y
7 / 71
What is psychometrics? What is R? Where did it come from, why use it? Basic statistics and graphics TOD
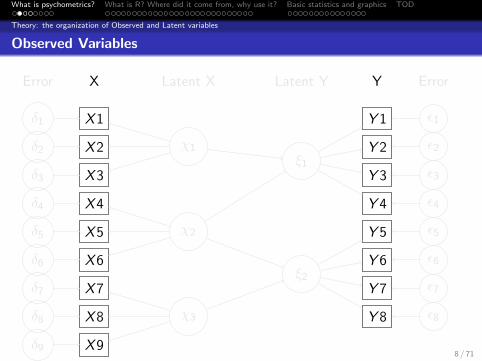
Theory: the organization of Observed and Latent variables
Observed Variables
X
X 1
X 2
X 3
X 4
X 5
X 6
X 7
X 8
X 9
Error
δ1
δ2
δ3
δ4
δ5
δ6
δ7
δ8
δ9
χ1
χ2
χ3
ξ1
ξ2
Y
Y 1
Y 2
Y 3
Y 4
Y 5
Y 6
Y 7
Y 8
Error
ε1
ε2
ε3
ε4
ε5
ε6
ε7
ε8
Latent X Latent Y
8 / 71
What is psychometrics? What is R? Where did it come from, why use it? Basic statistics and graphics TOD
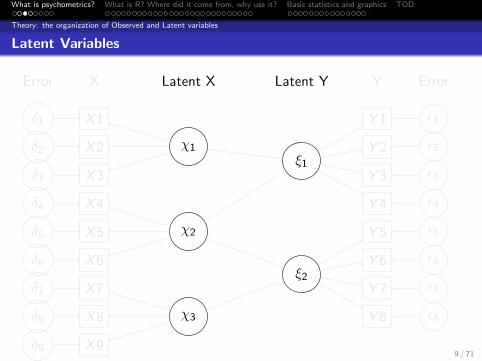
Theory: the organization of Observed and Latent variables
Latent Variables
X
X 1
X 2
X 3
X 4
X 5
X 6
X 7
X 8
X 9
Error
δ1
δ2
δ3
δ4
δ5
δ6
δ7
δ8
δ9
χ1
χ2
χ3
ξ1
ξ2
Y
Y 1
Y 2
Y 3
Y 4
Y 5
Y 6
Y 7
Y 8
Error
ε1
ε2
ε3
ε4
ε5
ε6
ε7
ε8
Latent X Latent Y
9 / 71
What is psychometrics? What is R? Where did it come from, why use it? Basic statistics and graphics TOD
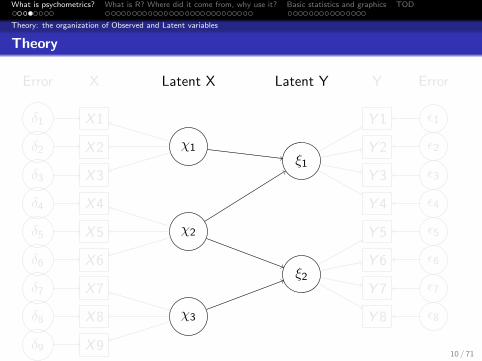
Theory: the organization of Observed and Latent variables
Theory
X
X 1
X 2
X 3
X 4
X 5
X 6
X 7
X 8
X 9
Error
δ1
δ2
δ3
δ4
δ5
δ6
δ7
δ8
δ9
χ1
χ2
χ3
ξ1
ξ2
Y
Y 1
Y 2
Y 3
Y 4
Y 5
Y 6
Y 7
Y 8
Error
ε1
ε2
ε3
ε4
ε5
ε6
ε7
ε8
Latent X Latent Y
10 / 71
What is psychometrics? What is R? Where did it come from, why use it? Basic statistics and graphics TOD
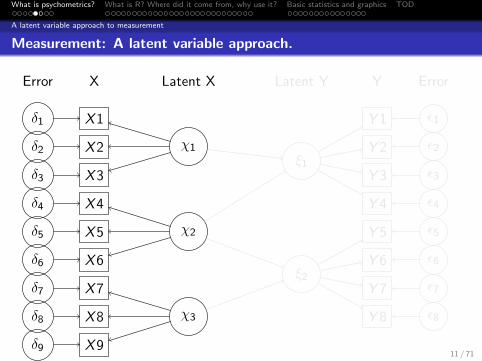
A latent variable approach to measurement
Measurement: A latent variable approach.
X
X 1
X 2
X 3
X 4
X 5
X 6
X 7
X 8
X 9
Error
δ1
δ2
δ3
δ4
δ5
δ6
δ7
δ8
δ9
χ1
χ2
χ3
ξ1
ξ2
Y
Y 1
Y 2
Y 3
Y 4
Y 5
Y 6
Y 7
Y 8
Error
ε1
ε2
ε3
ε4
ε5
ε6
ε7
ε8
Latent X Latent Y
11 / 71
What is psychometrics? What is R? Where did it come from, why use it? Basic statistics and graphics TOD
A latent variable approach to measurement
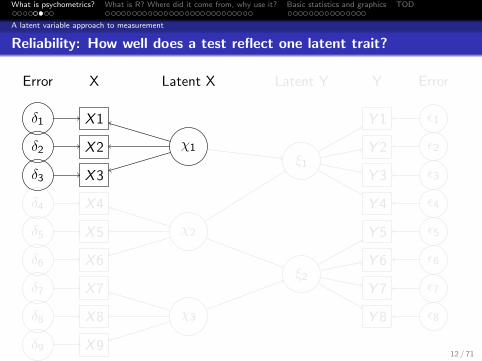
Reliability: How well does a test reflect one latent trait?
X
X 1
X 2
X 3
X 4
X 5
X 6
X 7
X 8
X 9
Error
δ1
δ2
δ3
δ4
δ5
δ6
δ7
δ8
δ9
χ1
χ2
χ3
ξ1
ξ2
Y
Y 1
Y 2
Y 3
Y 4
Y 5
Y 6
Y 7
Y 8
Error
ε1
ε2
ε3
ε4
ε5
ε6
ε7
ε8
Latent X Latent Y
12 / 71
What is psychometrics? What is R? Where did it come from, why use it? Basic statistics and graphics TOD
Data and scaling
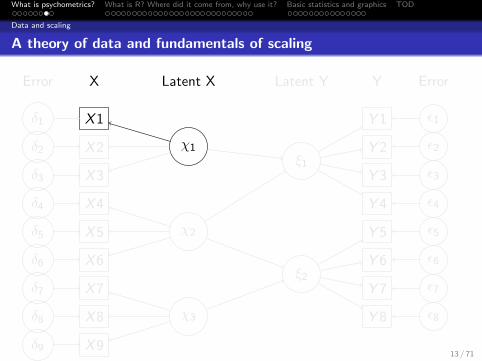
A theory of data and fundamentals of scaling
X
X 1
X 2
X 3
X 4
X 5
X 6
X 7
X 8
X 9
Error
δ1
δ2
δ3
δ4
δ5
δ6
δ7
δ8
δ9
χ1
χ2
χ3
ξ1
ξ2
Y
Y 1
Y 2
Y 3
Y 4
Y 5
Y 6
Y 7
Y 8
Error
ε1
ε2
ε3
ε4
ε5
ε6
ε7
ε8
Latent X Latent Y
13 / 71
What is psychometrics? What is R? Where did it come from, why use it? Basic statistics and graphics TOD
Structural Equation Models
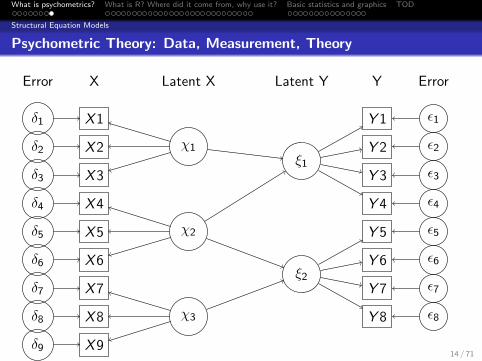
Psychometric Theory: Data, Measurement, Theory
X
X 1
X 2
X 3
X 4
X 5
X 6
X 7
X 8
X 9
Error
δ1
δ2
δ3
δ4
δ5
δ6
δ7
δ8
δ9
χ1
χ2
χ3
ξ1
ξ2
Y
Y 1
Y 2
Y 3
Y 4
Y 5
Y 6
Y 7
Y 8
Error
ε1
ε2
ε3
ε4
ε5
ε6
ε7
ε8
Latent X Latent Y
14 / 71

What is psychometrics? What is R? Where did it come from, why use it? Basic statistics and graphics TOD
Use R
15 / 71
What is psychometrics? What is R? Where did it come from, why use it? Basic statistics and graphics TOD
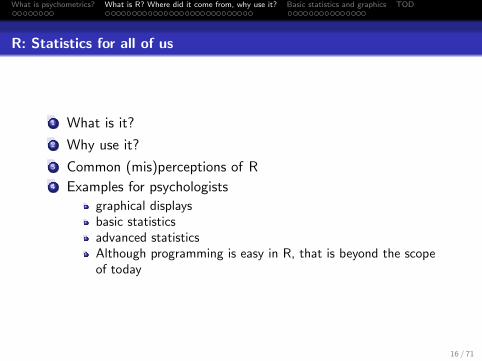
R: Statistics for all of us
1 What is it?
2 Why use it?
3 Common (mis)perceptions of R4 Examples for psychologists
graphical displaysbasic statisticsadvanced statisticsAlthough programming is easy in R, that is beyond the scopeof today
16 / 71
What is psychometrics? What is R? Where did it come from, why use it? Basic statistics and graphics TOD
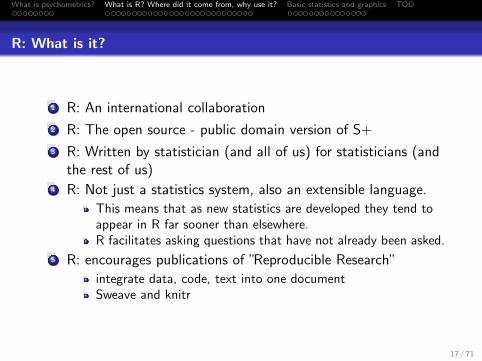
R: What is it?
1 R: An international collaboration
2 R: The open source - public domain version of S+
3 R: Written by statistician (and all of us) for statisticians (andthe rest of us)
4 R: Not just a statistics system, also an extensible language.
This means that as new statistics are developed they tend toappear in R far sooner than elsewhere.R facilitates asking questions that have not already been asked.
5 R: encourages publications of ”Reproducible Research”
integrate data, code, text into one documentSweave and knitr
17 / 71
What is psychometrics? What is R? Where did it come from, why use it? Basic statistics and graphics TOD
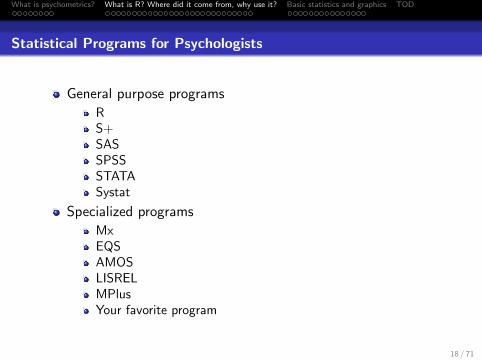
Statistical Programs for Psychologists
General purpose programs
RS+SASSPSSSTATASystat
Specialized programs
MxEQSAMOSLISRELMPlusYour favorite program
18 / 71
What is psychometrics? What is R? Where did it come from, why use it? Basic statistics and graphics TOD
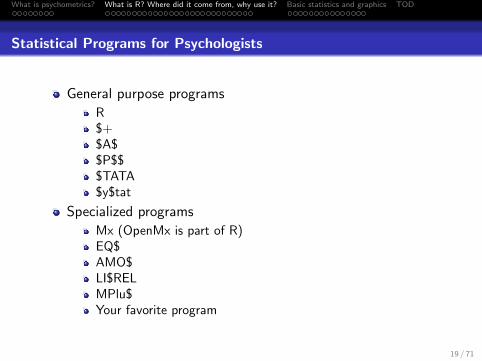
Statistical Programs for Psychologists
General purpose programs
R$+$A$$P$$$TATA$y$tat
Specialized programs
Mx (OpenMx is part of R)EQ$AMO$LI$RELMPlu$Your favorite program
19 / 71
What is psychometrics? What is R? Where did it come from, why use it? Basic statistics and graphics TOD
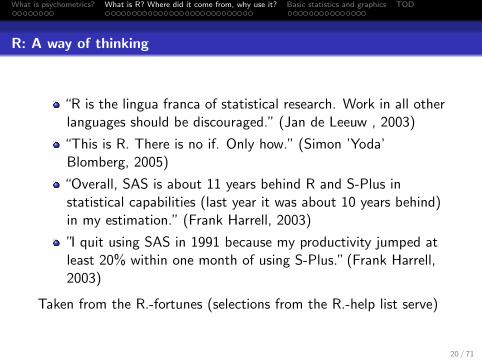
R: A way of thinking
“R is the lingua franca of statistical research. Work in all otherlanguages should be discouraged.” (Jan de Leeuw , 2003)
“This is R. There is no if. Only how.” (Simon ’Yoda’Blomberg, 2005)
“Overall, SAS is about 11 years behind R and S-Plus instatistical capabilities (last year it was about 10 years behind)in my estimation.” (Frank Harrell, 2003)
”I quit using SAS in 1991 because my productivity jumped atleast 20% within one month of using S-Plus.” (Frank Harrell,2003)
Taken from the R.-fortunes (selections from the R.-help list serve)
20 / 71
What is psychometrics? What is R? Where did it come from, why use it? Basic statistics and graphics TOD
More fortunes
“You must realize that R is written by experts in statistics andstatistical computing who, despite popular opinion, do not believethat everything in SAS and SPSS is worth copying. Some thingsdone in such packages, which trace their roots back to the days ofpunched cards and magnetic tape when fitting a single linear modelmay take several days because your first 5 attempts failed due tosyntax errors in the JCL or the SAS code, still reflect the approachof “give me every possible statistic that could be calculated fromthis model, whether or not it makes sense”. The approach taken inR is different. The underlying assumption is that the useR isthinking about the analysis while doing it. ” (Douglas Bates, 2007)
21 / 71
What is psychometrics? What is R? Where did it come from, why use it? Basic statistics and graphics TOD
R is open source, how can you trust it?
Q: “When you use it [R], since it is written by so manyauthors, how do you know that the results are trustable?”
A: “The R engine [...] is pretty well uniformly excellent codebut you have to take my word for that. Actually, you don’t.The whole engine is open source so, if you wish, you can checkevery line of it. If people were out to push dodgy software,this is not the way they’d go about it.” (Bill Venables, 2004
“It’s interesting that SAS Institute feels thatnon-peer-reviewed software with hidden implementations ofanalytic methods that cannot be reproduced by others shouldbe trusted when building aircraft engines.” – Frank Harrell (inresponse to the statement of the SAS director of technologyproduct marketing: ”We have customers who build engines foraircraft. I am happy they are not using freeware when I get ona jet.”) R-help (January 2009)
22 / 71
What is psychometrics? What is R? Where did it come from, why use it? Basic statistics and graphics TOD
What is R?: Technically
R is an open source implementation of S (S-Plus is acommercial implementation)
R is available under GNU Copy-left
The current version of R is 3.02
R is a group project run by a core group of developers (withnew releases ≈ semiannually)
R 3.1.0 is to be released sometime in 2014
(Adapted from Robert Gentleman)
23 / 71
What is psychometrics? What is R? Where did it come from, why use it? Basic statistics and graphics TOD
R: A brief history
1991-93: Ross Dhaka and Robert Gentleman begin work on Rproject at U. Auckland1995: R available by ftp under the GPL96-97: mailing list and R core group are formed2000: John Chambers, designer of S joins the Rcore (wins aprize for best software from ACM for S)2001-2011: Core team continues to improve base packagewith a new release every 6 months.Many others contribute “packages” to supplement thefunctionality for particular problems
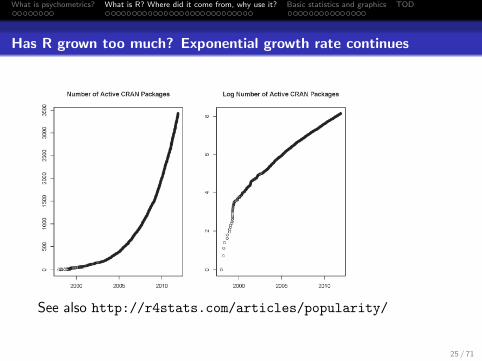
2003-04-01: 250 packages2004-10-01: 500 packages2007-04-12: 1,000 packages2009-10-04: 2,000 packages2011-05-12 3,000 packages2012-08-23 4,000 packages2013-11-08 5,000 packages
24 / 71
What is psychometrics? What is R? Where did it come from, why use it? Basic statistics and graphics TOD
Has R grown too much? Exponential growth rate continues
See also http://r4stats.com/articles/popularity/
25 / 71
What is psychometrics? What is R? Where did it come from, why use it? Basic statistics and graphics TOD
Misconception: R is hard to use
1 R doesn’t have a GUI (Graphical User Interface)Partly true, many use syntaxPartly not true, GUIs exist (e.g., R Commander, R-Studio)Quasi GUIs for Mac and PCs make syntax writing easier
2 R syntax is hard to useNot really, unless you think an iPhone is hard to useEasier to give instructions of 1-4 lines of syntax rather thanpictures of what menu to pull down.Keep a copy of your syntax, modify it for the next analysis.
3 R is not user friendly: A personological description of RR is introverted: it will tell you what you want to know if youask, but not if you don’t ask.R is conscientious: it wants commands to be correct.R is not agreeable: its error messages are at best cryptic.R is stable: it does not break down under stress.R is open: new ideas about statistics are easily developed.
26 / 71
What is psychometrics? What is R? Where did it come from, why use it? Basic statistics and graphics TOD
Misconceptions: R is hard to learn
1 With a brief web based tutorialhttp://personality-project.org/r, 2nd and 3rd yearundergraduates in psychological methods and personalityresearch courses are using R for descriptive and inferentialstatistics and producing publication quality graphics.
2 More and more psychology departments are using it forgraduate and undergraduate instruction.
3 R is easy to learn, hard to masterR-help newsgroup is very supportiveMultiple web based and pdf tutorials see (e.g.,http://www.r-project.org/)Short courses using R for many applications
4 Books and websites for SPSS and SAS users trying to learn R(e.g.,http://oit.utk.edu/scc/RforSAS&SPSSusers.pdfby Bob Muenchen).
27 / 71
What is psychometrics? What is R? Where did it come from, why use it? Basic statistics and graphics TOD
Installing R on your computer and adding packages
Ok, how do I get it: Getting started with R
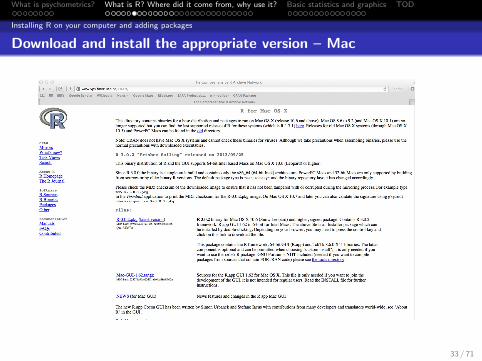
1 Download from R Cran (http://cran.r-project.org/)Choose appropriate operating system and download compiled R
2 Install R (current version is 3.02 ) with 3.1.0 coming thisspring
3 Start R4 Add useful packages (just need to do this once)
install.packages(”ctv”) #this downloads the task view packagelibrary(ctv) #this activates the ctv packageinstall.views(”Psychometrics”) #among othersTake a 5 minute break
5 Activate the package(s) you want to use today (e.g., psych)library(psych) #necessary for most of today’s exampleslibrary(sem) #will be used for a few examples
6 Use R7 (See detailed tutorial at https://personality-project.
org/r/r.guide.html#gettingstarted
28 / 71
What is psychometrics? What is R? Where did it come from, why use it? Basic statistics and graphics TOD
Installing R on your computer and adding packages
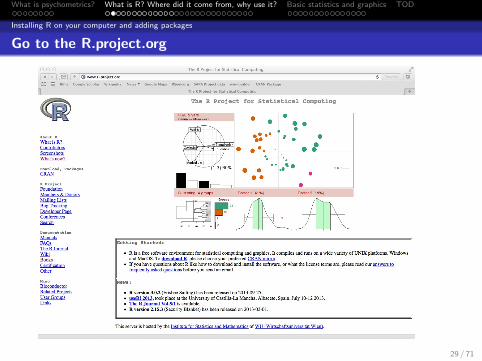
Go to the R.project.org
29 / 71
What is psychometrics? What is R? Where did it come from, why use it? Basic statistics and graphics TOD
Installing R on your computer and adding packages
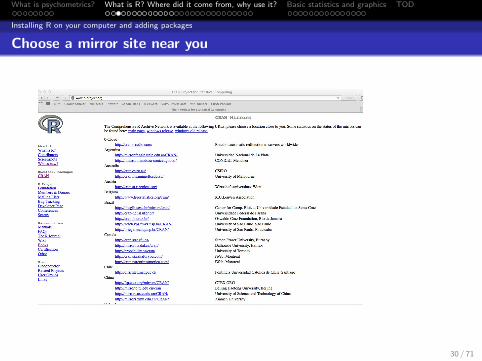
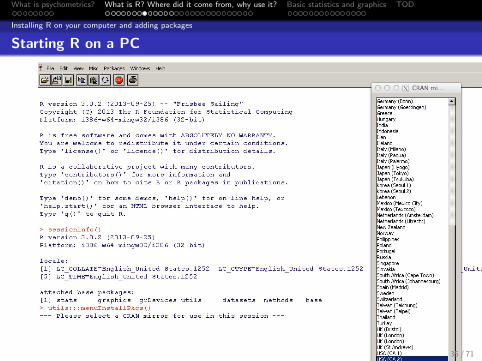
Choose a mirror site near you
30 / 71
What is psychometrics? What is R? Where did it come from, why use it? Basic statistics and graphics TOD
Installing R on your computer and adding packages
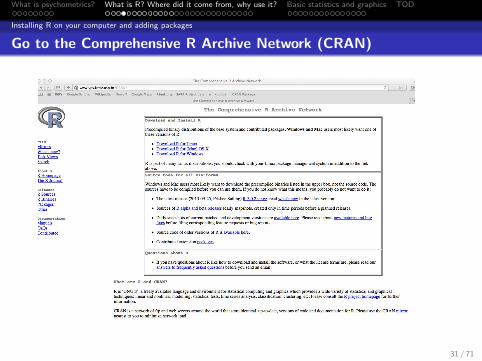
Go to the Comprehensive R Archive Network (CRAN)
31 / 71
What is psychometrics? What is R? Where did it come from, why use it? Basic statistics and graphics TOD
Installing R on your computer and adding packages
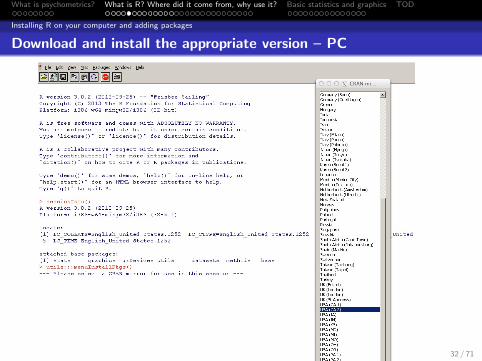
Download and install the appropriate version – PC
32 / 71
What is psychometrics? What is R? Where did it come from, why use it? Basic statistics and graphics TOD
Installing R on your computer and adding packages
Download and install the appropriate version – Mac
33 / 71
What is psychometrics? What is R? Where did it come from, why use it? Basic statistics and graphics TOD
Installing R on your computer and adding packages
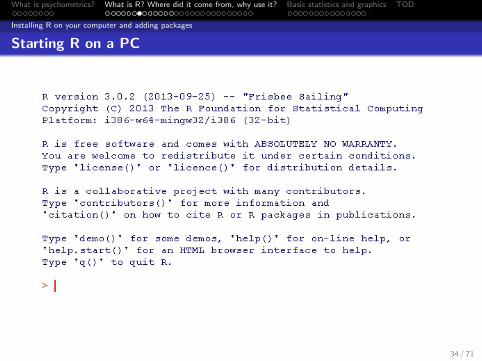
Starting R on a PC
34 / 71
What is psychometrics? What is R? Where did it come from, why use it? Basic statistics and graphics TOD
Installing R on your computer and adding packages
Starting R on a PC
35 / 71
What is psychometrics? What is R? Where did it come from, why use it? Basic statistics and graphics TOD
Installing R on your computer and adding packages
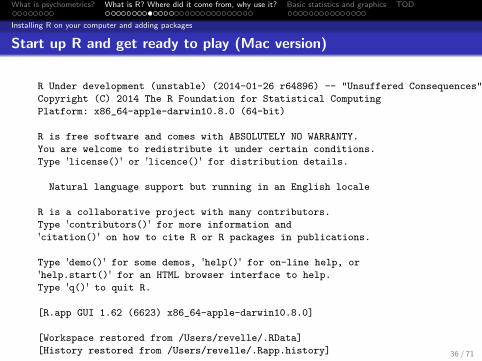
Start up R and get ready to play (Mac version)
R Under development (unstable) (2014-01-26 r64896) -- "Unsuffered Consequences"
Copyright (C) 2014 The R Foundation for Statistical Computing
Platform: x86_64-apple-darwin10.8.0 (64-bit)
R is free software and comes with ABSOLUTELY NO WARRANTY.
You are welcome to redistribute it under certain conditions.
Type 'license()' or 'licence()' for distribution details.
Natural language support but running in an English locale
R is a collaborative project with many contributors.
Type 'contributors()' for more information and
'citation()' on how to cite R or R packages in publications.
Type 'demo()' for some demos, 'help()' for on-line help, or
'help.start()' for an HTML browser interface to help.
Type 'q()' to quit R.
[R.app GUI 1.62 (6623) x86_64-apple-darwin10.8.0]
[Workspace restored from /Users/revelle/.RData]
[History restored from /Users/revelle/.Rapp.history]
>
> # > is the prompt for all commands #is for comments
36 / 71
What is psychometrics? What is R? Where did it come from, why use it? Basic statistics and graphics TOD
Installing R on your computer and adding packages
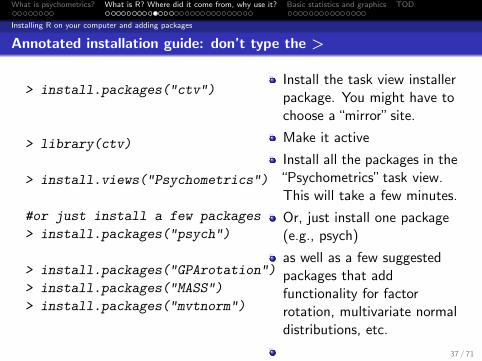
Annotated installation guide: don’t type the >
> install.packages("ctv")
> library(ctv)
> install.views("Psychometrics")
#or just install a few packages
> install.packages("psych")
> install.packages("GPArotation")
> install.packages("MASS")
> install.packages("mvtnorm")
Install the task view installerpackage. You might have tochoose a “mirror” site.
Make it active
Install all the packages in the“Psychometrics” task view.This will take a few minutes.
Or, just install one package(e.g., psych)
as well as a few suggestedpackages that addfunctionality for factorrotation, multivariate normaldistributions, etc.
37 / 71
What is psychometrics? What is R? Where did it come from, why use it? Basic statistics and graphics TOD
Installing R on your computer and adding packages
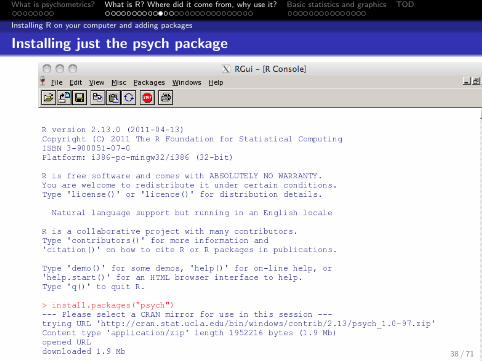
Installing just the psych package
38 / 71
What is psychometrics? What is R? Where did it come from, why use it? Basic statistics and graphics TOD
Installing R on your computer and adding packages
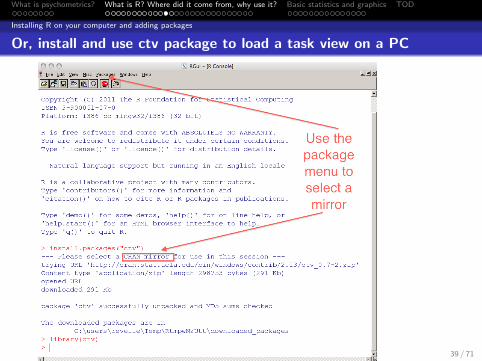
Or, install and use ctv package to load a task view on a PC
39 / 71
What is psychometrics? What is R? Where did it come from, why use it? Basic statistics and graphics TOD
Installing R on your computer and adding packages
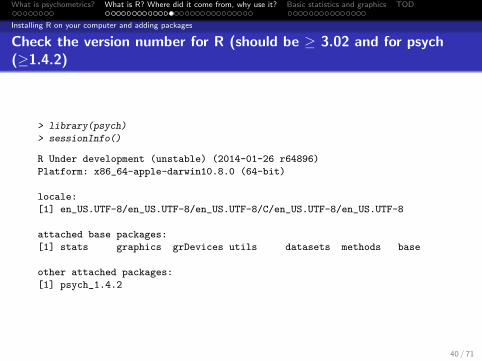
Check the version number for R (should be ≥ 3.02 and for psych(≥1.4.2)
> library(psych)
> sessionInfo()
R Under development (unstable) (2014-01-26 r64896)
Platform: x86_64-apple-darwin10.8.0 (64-bit)
locale:
[1] en_US.UTF-8/en_US.UTF-8/en_US.UTF-8/C/en_US.UTF-8/en_US.UTF-8
attached base packages:
[1] stats graphics grDevices utils datasets methods base
other attached packages:
[1] psych_1.4.2
40 / 71
What is psychometrics? What is R? Where did it come from, why use it? Basic statistics and graphics TOD
Installing and using packages
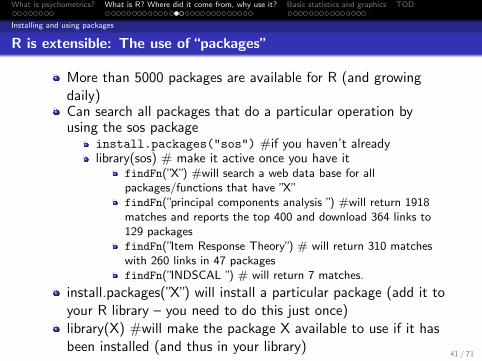
R is extensible: The use of “packages”
More than 5000 packages are available for R (and growingdaily)Can search all packages that do a particular operation byusing the sos package
install.packages("sos") #if you haven’t alreadylibrary(sos) # make it active once you have it
findFn(”X”) #will search a web data base for allpackages/functions that have ”X”findFn(”principal components analysis ”) #will return 1918matches and reports the top 400 and download 364 links to129 packagesfindFn(”Item Response Theory”) # will return 310 matcheswith 260 links in 47 packagesfindFn(”INDSCAL ”) # will return 7 matches.
install.packages(”X”) will install a particular package (add it toyour R library – you need to do this just once)library(X) #will make the package X available to use if it hasbeen installed (and thus in your library)
41 / 71
What is psychometrics? What is R? Where did it come from, why use it? Basic statistics and graphics TOD
Installing and using packages
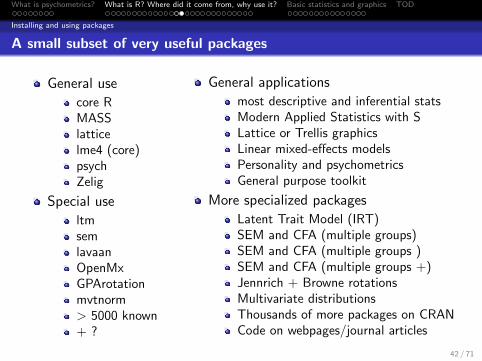
A small subset of very useful packages
General use
core RMASSlatticelme4 (core)psychZelig
Special use
ltmsemlavaanOpenMxGPArotationmvtnorm> 5000 known+ ?
General applications
most descriptive and inferential statsModern Applied Statistics with SLattice or Trellis graphicsLinear mixed-effects modelsPersonality and psychometricsGeneral purpose toolkit
More specialized packages
Latent Trait Model (IRT)SEM and CFA (multiple groups)SEM and CFA (multiple groups )SEM and CFA (multiple groups +)Jennrich + Browne rotationsMultivariate distributionsThousands of more packages on CRANCode on webpages/journal articles
42 / 71
What is psychometrics? What is R? Where did it come from, why use it? Basic statistics and graphics TOD
Implementations of R
Implementations
1 Base R in the Unix/Linux/Mac X11 framework
2 Base R on the Mac/PC
Mac has prompts at bottom of window
3 Graphical User Interfaces
R CommanderR studio as a convenient shell
43 / 71
What is psychometrics? What is R? Where did it come from, why use it? Basic statistics and graphics TOD
Implementations of R
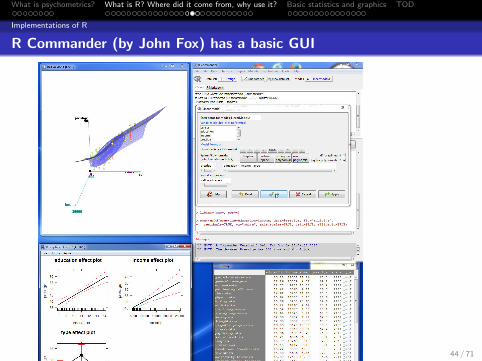
R Commander (by John Fox) has a basic GUI
44 / 71
What is psychometrics? What is R? Where did it come from, why use it? Basic statistics and graphics TOD
Implementations of R
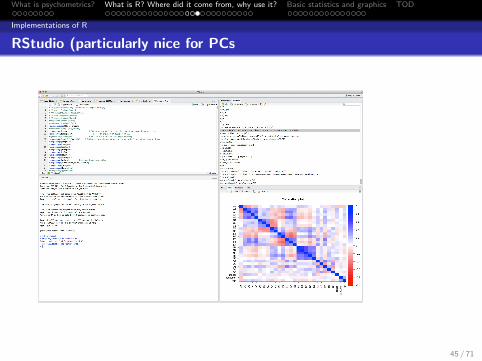
RStudio (particularly nice for PCs
45 / 71
What is psychometrics? What is R? Where did it come from, why use it? Basic statistics and graphics TOD
Basic R capabilities: Calculation, Statistical tables, Graphics
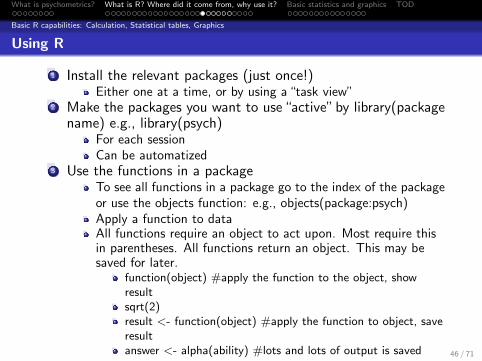
Using R
1 Install the relevant packages (just once!)Either one at a time, or by using a “task view”
2 Make the packages you want to use“active”by library(packagename) e.g., library(psych)
For each sessionCan be automatized
3 Use the functions in a packageTo see all functions in a package go to the index of the packageor use the objects function: e.g., objects(package:psych)Apply a function to dataAll functions require an object to act upon. Most require thisin parentheses. All functions return an object. This may besaved for later.
function(object) #apply the function to the object, showresultsqrt(2)result <- function(object) #apply the function to object, saveresultanswer <- alpha(ability) #lots and lots of output is saved 46 / 71
What is psychometrics? What is R? Where did it come from, why use it? Basic statistics and graphics TOD
Basic R capabilities: Calculation, Statistical tables, Graphics
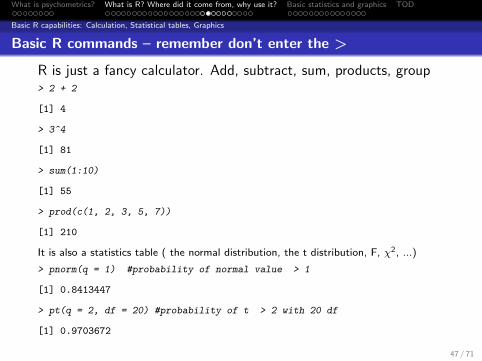
Basic R commands – remember don’t enter the >
R is just a fancy calculator. Add, subtract, sum, products, group> 2 + 2
[1] 4
> 3^4
[1] 81
> sum(1:10)
[1] 55
> prod(c(1, 2, 3, 5, 7))
[1] 210
It is also a statistics table ( the normal distribution, the t distribution, F, χ2, ...)
> pnorm(q = 1) #probability of normal value > 1
[1] 0.8413447
> pt(q = 2, df = 20) #probability of t > 2 with 20 df
[1] 0.9703672
47 / 71
What is psychometrics? What is R? Where did it come from, why use it? Basic statistics and graphics TOD
Basic R capabilities: Calculation, Statistical tables, Graphics
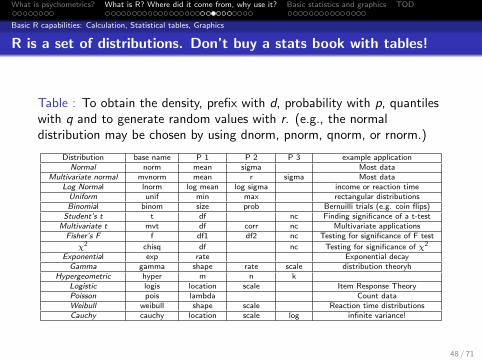
R is a set of distributions. Don’t buy a stats book with tables!
Table : To obtain the density, prefix with d, probability with p, quantileswith q and to generate random values with r. (e.g., the normaldistribution may be chosen by using dnorm, pnorm, qnorm, or rnorm.)
Distribution base name P 1 P 2 P 3 example applicationNormal norm mean sigma Most data
Multivariate normal mvnorm mean r sigma Most dataLog Normal lnorm log mean log sigma income or reaction timeUniform unif min max rectangular distributionsBinomial binom size prob Bernuilli trials (e.g. coin flips)
Student’s t t df nc Finding significance of a t-testMultivariate t mvt df corr nc Multivariate applicationsFisher’s F f df1 df2 nc Testing for significance of F test
χ2 chisq df nc Testing for significance of χ2
Exponential exp rate Exponential decayGamma gamma shape rate scale distribution theoryh
Hypergeometric hyper m n kLogistic logis location scale Item Response TheoryPoisson pois lambda Count dataWeibull weibull shape scale Reaction time distributionsCauchy cauchy location scale log infinite variance!
48 / 71
What is psychometrics? What is R? Where did it come from, why use it? Basic statistics and graphics TOD
Basic R capabilities: Calculation, Statistical tables, Graphics
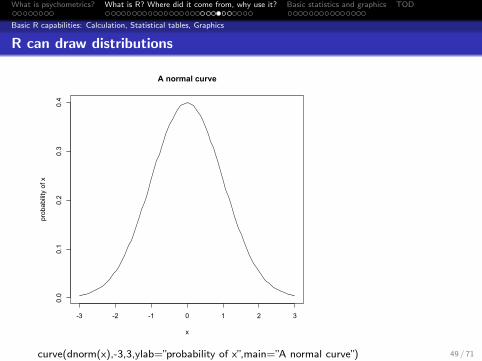
R can draw distributions
-3 -2 -1 0 1 2 3
0.0
0.1
0.2
0.3
0.4
A normal curve
x
prob
abili
ty o
f x
curve(dnorm(x),-3,3,ylab=”probability of x”,main=”A normal curve”) 49 / 71
What is psychometrics? What is R? Where did it come from, why use it? Basic statistics and graphics TOD
Basic R capabilities: Calculation, Statistical tables, Graphics
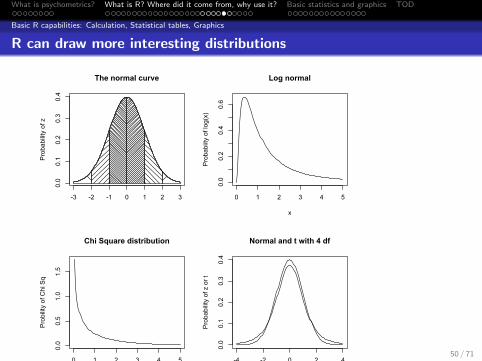
R can draw more interesting distributions
-3 -2 -1 0 1 2 3
0.0
0.1
0.2
0.3
0.4
Pro
babi
lity
of z
The normal curve
0 1 2 3 4 5
0.0
0.2
0.4
0.6
Log normal
xP
roba
biity
of l
og(x
)
0 1 2 3 4 5
0.0
0.5
1.0
1.5
Chi Square distribution
Chi Sq
Pro
bilit
y of
Chi
Sq
-4 -2 0 2 4
0.0
0.1
0.2
0.3
0.4
Normal and t with 4 df
z or t
Pro
babi
lity
of z
or t
50 / 71
What is psychometrics? What is R? Where did it come from, why use it? Basic statistics and graphics TOD
Basic R capabilities: Calculation, Statistical tables, Graphics
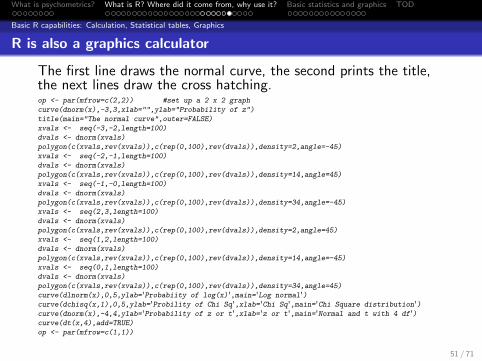
R is also a graphics calculator
The first line draws the normal curve, the second prints the title,the next lines draw the cross hatching.op <- par(mfrow=c(2,2)) #set up a 2 x 2 graph
curve(dnorm(x),-3,3,xlab="",ylab="Probability of z")
title(main="The normal curve",outer=FALSE)
xvals <- seq(-3,-2,length=100)
dvals <- dnorm(xvals)
polygon(c(xvals,rev(xvals)),c(rep(0,100),rev(dvals)),density=2,angle=-45)
xvals <- seq(-2,-1,length=100)
dvals <- dnorm(xvals)
polygon(c(xvals,rev(xvals)),c(rep(0,100),rev(dvals)),density=14,angle=45)
xvals <- seq(-1,-0,length=100)
dvals <- dnorm(xvals)
polygon(c(xvals,rev(xvals)),c(rep(0,100),rev(dvals)),density=34,angle=-45)
xvals <- seq(2,3,length=100)
dvals <- dnorm(xvals)
polygon(c(xvals,rev(xvals)),c(rep(0,100),rev(dvals)),density=2,angle=45)
xvals <- seq(1,2,length=100)
dvals <- dnorm(xvals)
polygon(c(xvals,rev(xvals)),c(rep(0,100),rev(dvals)),density=14,angle=-45)
xvals <- seq(0,1,length=100)
dvals <- dnorm(xvals)
polygon(c(xvals,rev(xvals)),c(rep(0,100),rev(dvals)),density=34,angle=45)
curve(dlnorm(x),0,5,ylab='Probabiity of log(x)',main='Log normal')curve(dchisq(x,1),0,5,ylab='Probility of Chi Sq',xlab='Chi Sq',main='Chi Square distribution')curve(dnorm(x),-4,4,ylab='Probability of z or t',xlab='z or t',main='Normal and t with 4 df')curve(dt(x,4),add=TRUE)
op <- par(mfrow=c(1,1))
51 / 71
What is psychometrics? What is R? Where did it come from, why use it? Basic statistics and graphics TOD
Data sets
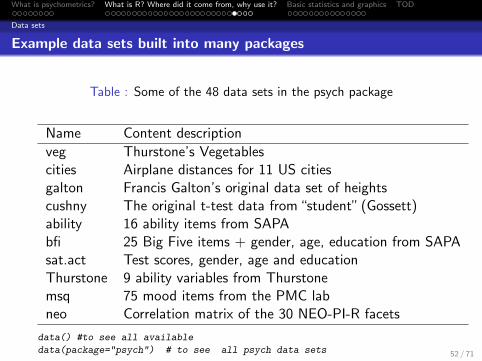
Example data sets built into many packages
Table : Some of the 48 data sets in the psych package
Name Content description
veg Thurstone’s Vegetablescities Airplane distances for 11 US citiesgalton Francis Galton’s original data set of heightscushny The original t-test data from “student” (Gossett)ability 16 ability items from SAPAbfi 25 Big Five items + gender, age, education from SAPAsat.act Test scores, gender, age and educationThurstone 9 ability variables from Thurstonemsq 75 mood items from the PMC labneo Correlation matrix of the 30 NEO-PI-R facets
data() #to see all available
data(package="psych") # to see all psych data sets 52 / 71
What is psychometrics? What is R? Where did it come from, why use it? Basic statistics and graphics TOD
Data sets
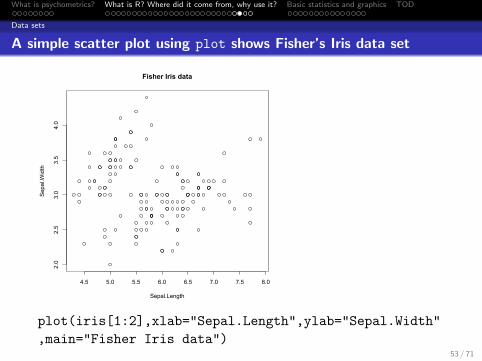
A simple scatter plot using plot shows Fisher’s Iris data set
4.5 5.0 5.5 6.0 6.5 7.0 7.5 8.0
2.0
2.5
3.0
3.5
4.0
Fisher Iris data
Sepal.Length
Sepal.Width
plot(iris[1:2],xlab="Sepal.Length",ylab="Sepal.Width"
,main="Fisher Iris data")53 / 71
What is psychometrics? What is R? Where did it come from, why use it? Basic statistics and graphics TOD
Data sets
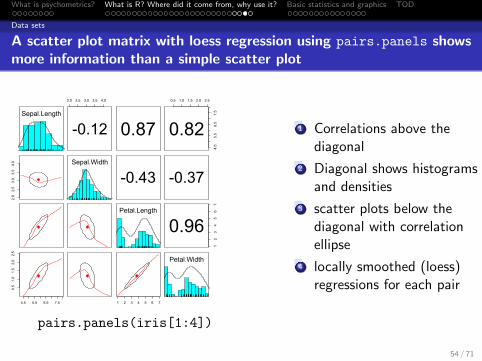
A scatter plot matrix with loess regression using pairs.panels showsmore information than a simple scatter plot
Sepal.Length
2.0 2.5 3.0 3.5 4.0
-0.12 0.87
0.5 1.0 1.5 2.0 2.5
4.5
5.5
6.5
7.5
0.82
2.0
2.5
3.0
3.5
4.0 Sepal.Width
-0.43 -0.37
Petal.Length1
23
45
67
0.96
4.5 5.5 6.5 7.5
0.5
1.0
1.5
2.0
2.5
1 2 3 4 5 6 7
Petal.Width
1 Correlations above thediagonal
2 Diagonal shows histogramsand densities
3 scatter plots below thediagonal with correlationellipse
4 locally smoothed (loess)regressions for each pair
pairs.panels(iris[1:4])
54 / 71
What is psychometrics? What is R? Where did it come from, why use it? Basic statistics and graphics TOD
Data sets
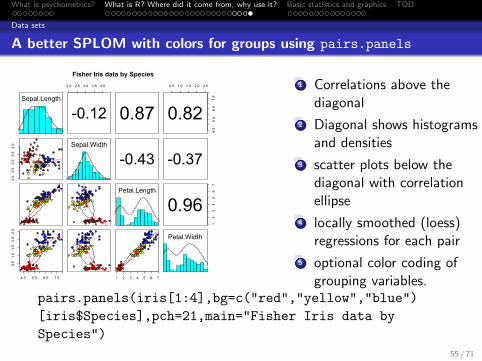
A better SPLOM with colors for groups using pairs.panels
Sepal.Length
2.0 2.5 3.0 3.5 4.0
-0.12 0.87
0.5 1.0 1.5 2.0 2.5
4.5
5.5
6.5
7.5
0.82
2.02.53.03.54.0 Sepal.Width
-0.43 -0.37
Petal.Length
12
34
56
70.96
4.5 5.5 6.5 7.5
0.51.01.52.02.5
1 2 3 4 5 6 7
Petal.Width
Fisher Iris data by Species1 Correlations above the
diagonal
2 Diagonal shows histogramsand densities
3 scatter plots below thediagonal with correlationellipse
4 locally smoothed (loess)regressions for each pair
5 optional color coding ofgrouping variables.
pairs.panels(iris[1:4],bg=c("red","yellow","blue")
[iris$Species],pch=21,main="Fisher Iris data by
Species")
55 / 71
What is psychometrics? What is R? Where did it come from, why use it? Basic statistics and graphics TOD
4 steps: read, explore, test, graph
Using R for psychological statistics: Basic statistics
1 Writing syntaxFor a single line, just type itMistakes can be redone by using the up arrow keyFor longer code, use a text editor (built into some GUIs)
2 Data entryUsing built in data sets for examplesCopying from another program (using the ”clipboard”)Reading a text or csv fileImporting from SPSS or SASSimulate it (using various simulation routines)
3 DescriptivesGraphical displaysDescriptive statisticsCorrelation
4 Inferentialthe t testthe F testthe linear model
56 / 71
What is psychometrics? What is R? Where did it come from, why use it? Basic statistics and graphics TOD
4 steps: read, explore, test, graph
Data entry overview
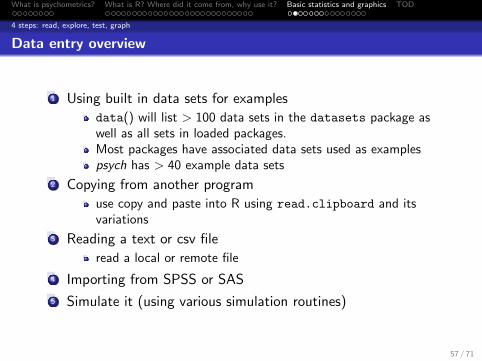
1 Using built in data sets for examples
data() will list > 100 data sets in the datasets package aswell as all sets in loaded packages.Most packages have associated data sets used as examplespsych has > 40 example data sets
2 Copying from another program
use copy and paste into R using read.clipboard and itsvariations
3 Reading a text or csv file
read a local or remote file
4 Importing from SPSS or SAS
5 Simulate it (using various simulation routines)
57 / 71
What is psychometrics? What is R? Where did it come from, why use it? Basic statistics and graphics TOD
4 steps: read, explore, test, graph
Examples of built in data sets from the psych package
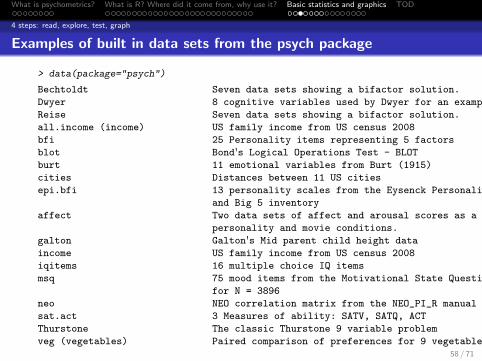
> data(package="psych")
Bechtoldt Seven data sets showing a bifactor solution.
Dwyer 8 cognitive variables used by Dwyer for an example.
Reise Seven data sets showing a bifactor solution.
all.income (income) US family income from US census 2008
bfi 25 Personality items representing 5 factors
blot Bond's Logical Operations Test - BLOT
burt 11 emotional variables from Burt (1915)
cities Distances between 11 US cities
epi.bfi 13 personality scales from the Eysenck Personality Inventory
and Big 5 inventory
affect Two data sets of affect and arousal scores as a function of
personality and movie conditions.
galton Galton's Mid parent child height data
income US family income from US census 2008
iqitems 16 multiple choice IQ items
msq 75 mood items from the Motivational State Questionnaire
for N = 3896
neo NEO correlation matrix from the NEO_PI_R manual
sat.act 3 Measures of ability: SATV, SATQ, ACT
Thurstone The classic Thurstone 9 variable problem
veg (vegetables) Paired comparison of preferences for 9 vegetables58 / 71
What is psychometrics? What is R? Where did it come from, why use it? Basic statistics and graphics TOD
4 steps: read, explore, test, graph
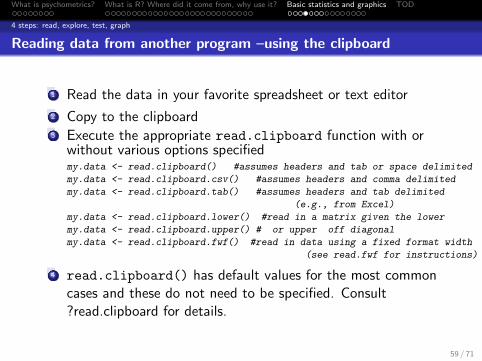
Reading data from another program –using the clipboard
1 Read the data in your favorite spreadsheet or text editor
2 Copy to the clipboard3 Execute the appropriate read.clipboard function with or
without various options specifiedmy.data <- read.clipboard() #assumes headers and tab or space delimited
my.data <- read.clipboard.csv() #assumes headers and comma delimited
my.data <- read.clipboard.tab() #assumes headers and tab delimited
(e.g., from Excel)
my.data <- read.clipboard.lower() #read in a matrix given the lower
my.data <- read.clipboard.upper() # or upper off diagonal
my.data <- read.clipboard.fwf() #read in data using a fixed format width
(see read.fwf for instructions)
4 read.clipboard() has default values for the most commoncases and these do not need to be specified. Consult?read.clipboard for details.
59 / 71
What is psychometrics? What is R? Where did it come from, why use it? Basic statistics and graphics TOD
4 steps: read, explore, test, graph
Reading from a local or remote file
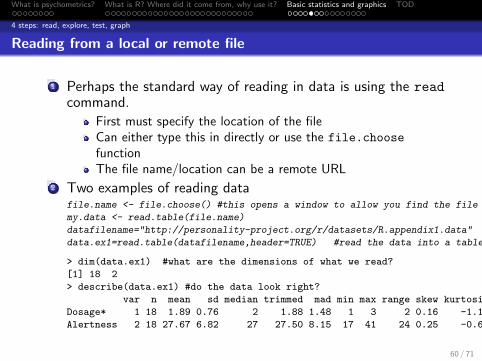
1 Perhaps the standard way of reading in data is using the readcommand.
First must specify the location of the fileCan either type this in directly or use the file.choose
functionThe file name/location can be a remote URL
2 Two examples of reading datafile.name <- file.choose() #this opens a window to allow you find the file
my.data <- read.table(file.name)
datafilename="http://personality-project.org/r/datasets/R.appendix1.data"
data.ex1=read.table(datafilename,header=TRUE) #read the data into a table
> dim(data.ex1) #what are the dimensions of what we read?
[1] 18 2
> describe(data.ex1) #do the data look right?
var n mean sd median trimmed mad min max range skew kurtosis se
Dosage* 1 18 1.89 0.76 2 1.88 1.48 1 3 2 0.16 -1.12 0.18
Alertness 2 18 27.67 6.82 27 27.50 8.15 17 41 24 0.25 -0.68 1.61
60 / 71
What is psychometrics? What is R? Where did it come from, why use it? Basic statistics and graphics TOD
4 steps: read, explore, test, graph
read a “foreign” file e.g., an SPSS sav file
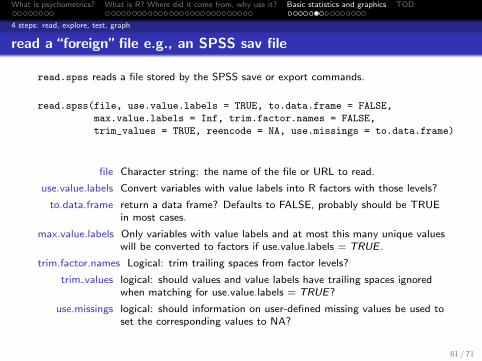
read.spss reads a file stored by the SPSS save or export commands.
read.spss(file, use.value.labels = TRUE, to.data.frame = FALSE,
max.value.labels = Inf, trim.factor.names = FALSE,
trim_values = TRUE, reencode = NA, use.missings = to.data.frame)
file Character string: the name of the file or URL to read.
use.value.labels Convert variables with value labels into R factors with those levels?
to.data.frame return a data frame? Defaults to FALSE, probably should be TRUEin most cases.
max.value.labels Only variables with value labels and at most this many unique valueswill be converted to factors if use.value.labels = TRUE .
trim.factor.names Logical: trim trailing spaces from factor levels?
trim values logical: should values and value labels have trailing spaces ignoredwhen matching for use.value.labels = TRUE?
use.missings logical: should information on user-defined missing values be used toset the corresponding values to NA?
61 / 71
What is psychometrics? What is R? Where did it come from, why use it? Basic statistics and graphics TOD
4 steps: read, explore, test, graph
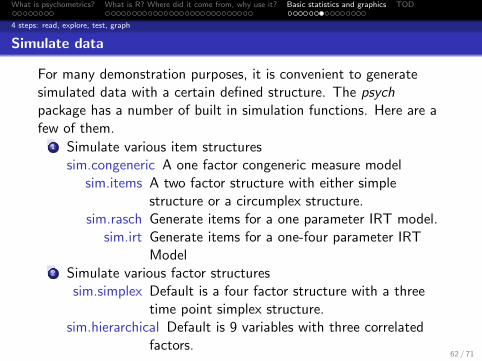
Simulate data
For many demonstration purposes, it is convenient to generatesimulated data with a certain defined structure. The psychpackage has a number of built in simulation functions. Here are afew of them.
1 Simulate various item structuressim.congeneric A one factor congeneric measure model
sim.items A two factor structure with either simplestructure or a circumplex structure.
sim.rasch Generate items for a one parameter IRT model.sim.irt Generate items for a one-four parameter IRT
Model2 Simulate various factor structures
sim.simplex Default is a four factor structure with a threetime point simplex structure.
sim.hierarchical Default is 9 variables with three correlatedfactors.
62 / 71
What is psychometrics? What is R? Where did it come from, why use it? Basic statistics and graphics TOD
Basic descriptive and inferential statistics
Get the data and look at it
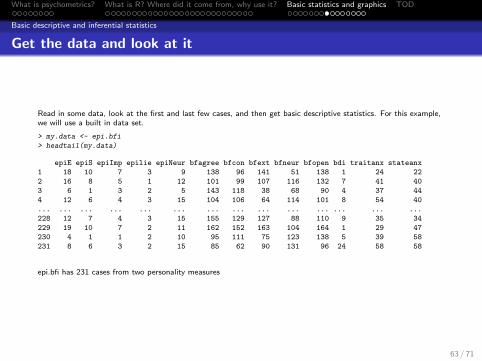
Read in some data, look at the first and last few cases, and then get basic descriptive statistics. For this example,we will use a built in data set.
> my.data <- epi.bfi
> headtail(my.data)
epiE epiS epiImp epilie epiNeur bfagree bfcon bfext bfneur bfopen bdi traitanx stateanx
1 18 10 7 3 9 138 96 141 51 138 1 24 22
2 16 8 5 1 12 101 99 107 116 132 7 41 40
3 6 1 3 2 5 143 118 38 68 90 4 37 44
4 12 6 4 3 15 104 106 64 114 101 8 54 40
... ... ... ... ... ... ... ... ... ... ... ... ... ...
228 12 7 4 3 15 155 129 127 88 110 9 35 34
229 19 10 7 2 11 162 152 163 104 164 1 29 47
230 4 1 1 2 10 95 111 75 123 138 5 39 58
231 8 6 3 2 15 85 62 90 131 96 24 58 58
epi.bfi has 231 cases from two personality measures
63 / 71
What is psychometrics? What is R? Where did it come from, why use it? Basic statistics and graphics TOD
Basic descriptive and inferential statistics
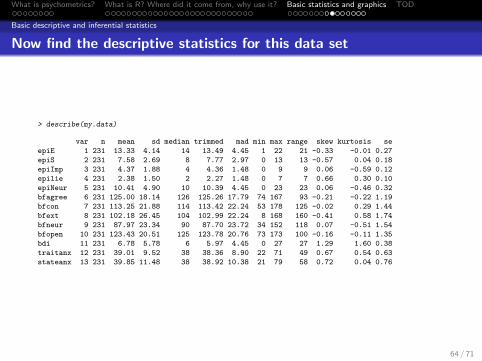
Now find the descriptive statistics for this data set
> describe(my.data)
var n mean sd median trimmed mad min max range skew kurtosis se
epiE 1 231 13.33 4.14 14 13.49 4.45 1 22 21 -0.33 -0.01 0.27
epiS 2 231 7.58 2.69 8 7.77 2.97 0 13 13 -0.57 0.04 0.18
epiImp 3 231 4.37 1.88 4 4.36 1.48 0 9 9 0.06 -0.59 0.12
epilie 4 231 2.38 1.50 2 2.27 1.48 0 7 7 0.66 0.30 0.10
epiNeur 5 231 10.41 4.90 10 10.39 4.45 0 23 23 0.06 -0.46 0.32
bfagree 6 231 125.00 18.14 126 125.26 17.79 74 167 93 -0.21 -0.22 1.19
bfcon 7 231 113.25 21.88 114 113.42 22.24 53 178 125 -0.02 0.29 1.44
bfext 8 231 102.18 26.45 104 102.99 22.24 8 168 160 -0.41 0.58 1.74
bfneur 9 231 87.97 23.34 90 87.70 23.72 34 152 118 0.07 -0.51 1.54
bfopen 10 231 123.43 20.51 125 123.78 20.76 73 173 100 -0.16 -0.11 1.35
bdi 11 231 6.78 5.78 6 5.97 4.45 0 27 27 1.29 1.60 0.38
traitanx 12 231 39.01 9.52 38 38.36 8.90 22 71 49 0.67 0.54 0.63
stateanx 13 231 39.85 11.48 38 38.92 10.38 21 79 58 0.72 0.04 0.76
64 / 71
What is psychometrics? What is R? Where did it come from, why use it? Basic statistics and graphics TOD
Basic descriptive and inferential statistics
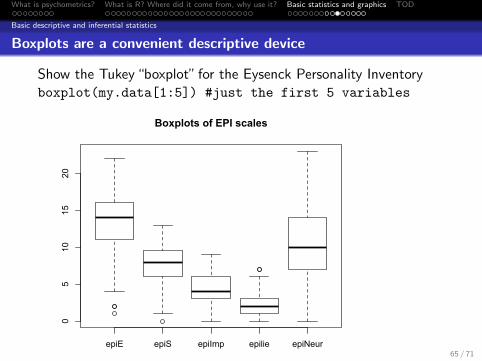
Boxplots are a convenient descriptive device
Show the Tukey “boxplot” for the Eysenck Personality Inventoryboxplot(my.data[1:5]) #just the first 5 variables
epiE epiS epiImp epilie epiNeur
05
1015
20
Boxplots of EPI scales
65 / 71
What is psychometrics? What is R? Where did it come from, why use it? Basic statistics and graphics TOD
Basic descriptive and inferential statistics
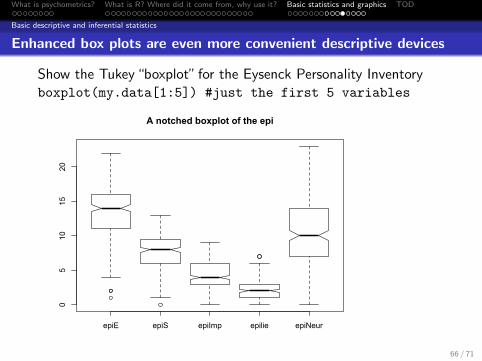
Enhanced box plots are even more convenient descriptive devices
Show the Tukey “boxplot” for the Eysenck Personality Inventoryboxplot(my.data[1:5]) #just the first 5 variables
epiE epiS epiImp epilie epiNeur
05
1015
20
A notched boxplot of the epi
66 / 71
What is psychometrics? What is R? Where did it come from, why use it? Basic statistics and graphics TOD
Basic descriptive and inferential statistics
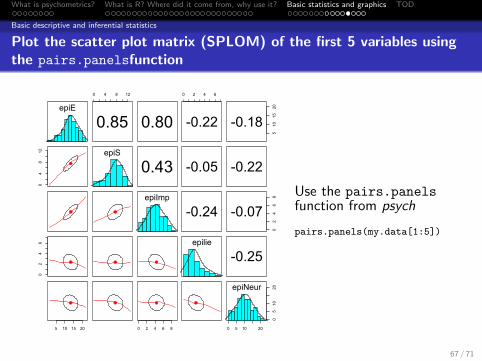
Plot the scatter plot matrix (SPLOM) of the first 5 variables usingthe pairs.panelsfunction
epiE
0 4 8 12
0.85 0.80
0 2 4 6
-0.22
510
1520
-0.18
04
812 epiS
0.43 -0.05 -0.22
epiImp
-0.24
02
46
8
-0.07
02
46 epilie
-0.25
5 10 15 20 0 2 4 6 8 0 5 10 20
05
1020epiNeur
Use the pairs.panelsfunction from psych
pairs.panels(my.data[1:5])
67 / 71
What is psychometrics? What is R? Where did it come from, why use it? Basic statistics and graphics TOD
Basic descriptive and inferential statistics
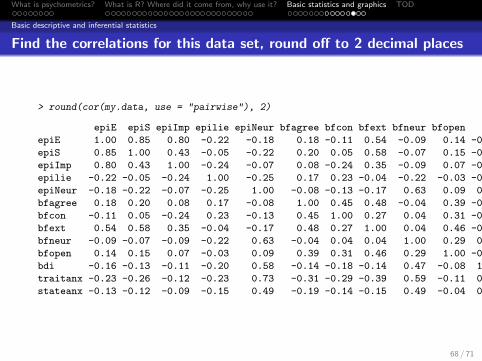
Find the correlations for this data set, round off to 2 decimal places
> round(cor(my.data, use = "pairwise"), 2)
epiE epiS epiImp epilie epiNeur bfagree bfcon bfext bfneur bfopen bdi traitanx stateanx
epiE 1.00 0.85 0.80 -0.22 -0.18 0.18 -0.11 0.54 -0.09 0.14 -0.16 -0.23 -0.13
epiS 0.85 1.00 0.43 -0.05 -0.22 0.20 0.05 0.58 -0.07 0.15 -0.13 -0.26 -0.12
epiImp 0.80 0.43 1.00 -0.24 -0.07 0.08 -0.24 0.35 -0.09 0.07 -0.11 -0.12 -0.09
epilie -0.22 -0.05 -0.24 1.00 -0.25 0.17 0.23 -0.04 -0.22 -0.03 -0.20 -0.23 -0.15
epiNeur -0.18 -0.22 -0.07 -0.25 1.00 -0.08 -0.13 -0.17 0.63 0.09 0.58 0.73 0.49
bfagree 0.18 0.20 0.08 0.17 -0.08 1.00 0.45 0.48 -0.04 0.39 -0.14 -0.31 -0.19
bfcon -0.11 0.05 -0.24 0.23 -0.13 0.45 1.00 0.27 0.04 0.31 -0.18 -0.29 -0.14
bfext 0.54 0.58 0.35 -0.04 -0.17 0.48 0.27 1.00 0.04 0.46 -0.14 -0.39 -0.15
bfneur -0.09 -0.07 -0.09 -0.22 0.63 -0.04 0.04 0.04 1.00 0.29 0.47 0.59 0.49
bfopen 0.14 0.15 0.07 -0.03 0.09 0.39 0.31 0.46 0.29 1.00 -0.08 -0.11 -0.04
bdi -0.16 -0.13 -0.11 -0.20 0.58 -0.14 -0.18 -0.14 0.47 -0.08 1.00 0.65 0.61
traitanx -0.23 -0.26 -0.12 -0.23 0.73 -0.31 -0.29 -0.39 0.59 -0.11 0.65 1.00 0.57
stateanx -0.13 -0.12 -0.09 -0.15 0.49 -0.19 -0.14 -0.15 0.49 -0.04 0.61 0.57 1.00
68 / 71
What is psychometrics? What is R? Where did it come from, why use it? Basic statistics and graphics TOD
Basic descriptive and inferential statistics
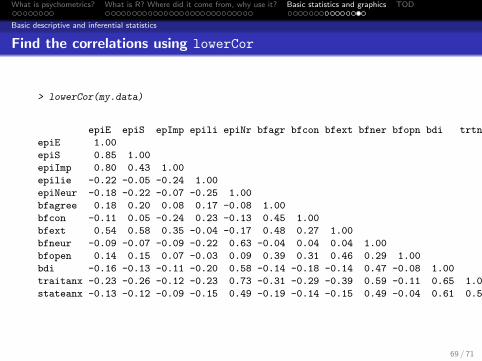
Find the correlations using lowerCor
> lowerCor(my.data)
epiE epiS epImp epili epiNr bfagr bfcon bfext bfner bfopn bdi trtnx sttnx
epiE 1.00
epiS 0.85 1.00
epiImp 0.80 0.43 1.00
epilie -0.22 -0.05 -0.24 1.00
epiNeur -0.18 -0.22 -0.07 -0.25 1.00
bfagree 0.18 0.20 0.08 0.17 -0.08 1.00
bfcon -0.11 0.05 -0.24 0.23 -0.13 0.45 1.00
bfext 0.54 0.58 0.35 -0.04 -0.17 0.48 0.27 1.00
bfneur -0.09 -0.07 -0.09 -0.22 0.63 -0.04 0.04 0.04 1.00
bfopen 0.14 0.15 0.07 -0.03 0.09 0.39 0.31 0.46 0.29 1.00
bdi -0.16 -0.13 -0.11 -0.20 0.58 -0.14 -0.18 -0.14 0.47 -0.08 1.00
traitanx -0.23 -0.26 -0.12 -0.23 0.73 -0.31 -0.29 -0.39 0.59 -0.11 0.65 1.00
stateanx -0.13 -0.12 -0.09 -0.15 0.49 -0.19 -0.14 -0.15 0.49 -0.04 0.61 0.57 1.00
69 / 71
What is psychometrics? What is R? Where did it come from, why use it? Basic statistics and graphics TOD
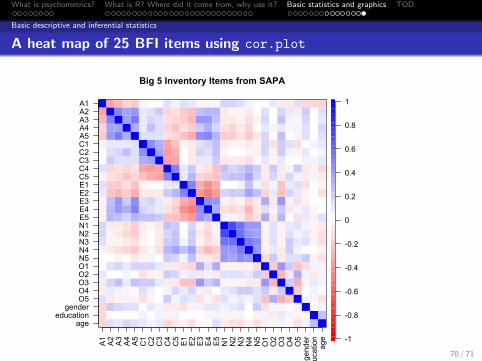
Basic descriptive and inferential statistics
A heat map of 25 BFI items using cor.plot
Big 5 Inventory Items from SAPA
ageeducationgender
O5O4O3O2O1N5N4N3N2N1E5E4E3E2E1C5C4C3C2C1A5A4A3A2A1
A1A2A3A4A5C1C2C3C4C5E1E2E3E4E5N1N2N3N4N5
O1
O2
O3
O4
O5
gender
education
age -1
-0.8
-0.6
-0.4
-0.2
0
0.2
0.4
0.6
0.8
1
70 / 71