Embed Size (px)
Citation preview

AN INTRODUCTION TO OIM ANALYSIS™
Raising thestandard for
EBSD software
The mostpowerful,
flexible, andeasy to usetool for the
visualizationand analysis
of EBSDmapping data
OIM Analysis™ - The Standard for EBSD Data Analysis
Why OIM Analysis™?Orientation Imaging Microscopy (OIM) Analysis™ is a technique based on the automated collection and analysis ofElectron Backscatter Diffraction (EBSD) patterns. This mapping data provides information on the orientation, phasedistribution, grain size and shape, grain boundary structure, and local deformation of crystallographic microstructures.OIM Analysis™ provides virtually unlimited potential for interrogating the wealth of information contained in OIM scans.
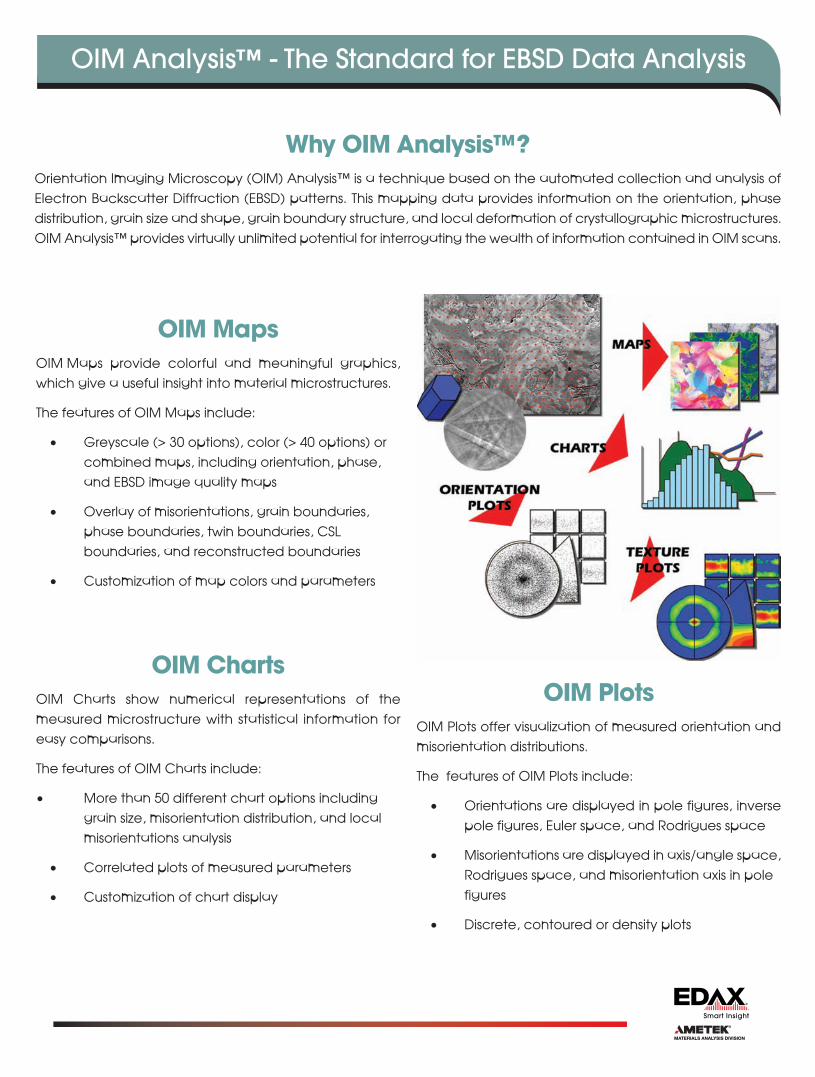
OIM MapsOIM Maps provide colorful and meaningful graphics,which give a useful insight into material microstructures.
The features of OIM Maps include:
• Greyscale (> 30 options), color (> 40 options) or combined maps, including orientation, phase, and EBSD image quality maps
• Overlay of misorientations, grain boundaries, phase boundaries, twin boundaries, CSL boundaries, and reconstructed boundaries
• Customization of map colors and parameters
OIM ChartsOIM Charts show numerical representations of themeasured microstructure with statistical information foreasy comparisons.
The features of OIM Charts include:
• More than 50 different chart options including grain size, misorientation distribution, and local misorientations analysis
• Correlated plots of measured parameters
• Customization of chart display
OIM PlotsOIM Plots offer visualization of measured orientation andmisorientation distributions.
The features of OIM Plots include:
• Orientations are displayed in pole figures, inverse pole figures, Euler space, and Rodrigues space
• Misorientations are displayed in axis/angle space, Rodrigues space, and misorientation axis in pole figures
• Discrete, contoured or density plots
OIM Analysis™ - The Standard for EBSD Data Analysis
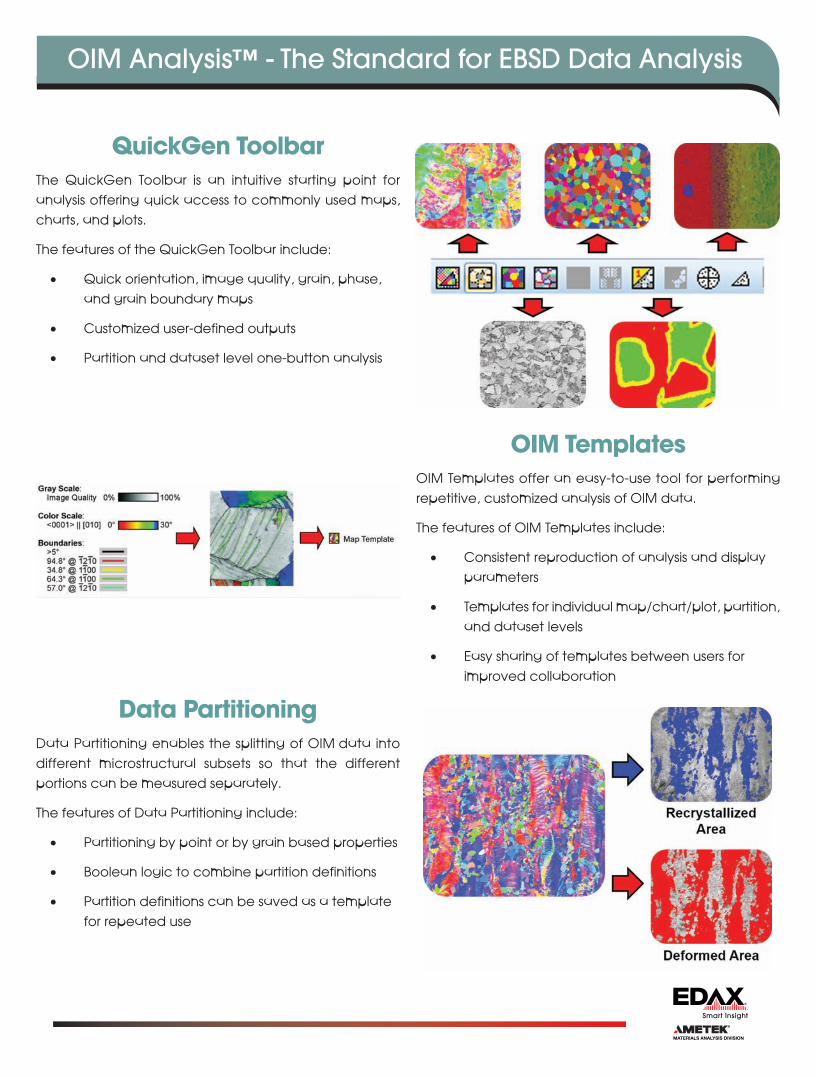
QuickGen ToolbarThe QuickGen Toolbar is an intuitive starting point foranalysis offering quick access to commonly used maps,charts, and plots.
The features of the QuickGen Toolbar include:
• Quick orientation, image quality, grain, phase, and grain boundary maps
• Customized user-defined outputs
• Partition and dataset level one-button analysis
Data PartitioningData Partitioning enables the splitting of OIM data intodifferent microstructural subsets so that the differentportions can be measured separately.
The features of Data Partitioning include:
• Partitioning by point or by grain based properties
• Boolean logic to combine partition definitions
• Partition definitions can be saved as a template for repeated use
OIM TemplatesOIM Templates offer an easy-to-use tool for performingrepetitive, customized analysis of OIM data.
The features of OIM Templates include:
• Consistent reproduction of analysis and display parameters
• Templates for individual map/chart/plot, partition, and dataset levels
• Easy sharing of templates between users for improved collaboration
Comprehensive AnalysisComprehensive Analysis offers grouped functions for awide range of focused analysis within an integratedanalysis package.
The features of Comprehensive Analysis include:
• Boundary analysis for characterization of misorientations, grain boundaries, inter-grain misorientations, twin boundaries, and reconstructed boundaries
• Grain analysis for the determination of grain size, grain shape, and average grain properties
• Materials properties characterization including Taylor Factors, Schmid Factors, Elastic Modulus, and Dislocation Density
• Quantitative texture analysis and calculation of full orientation distribution function
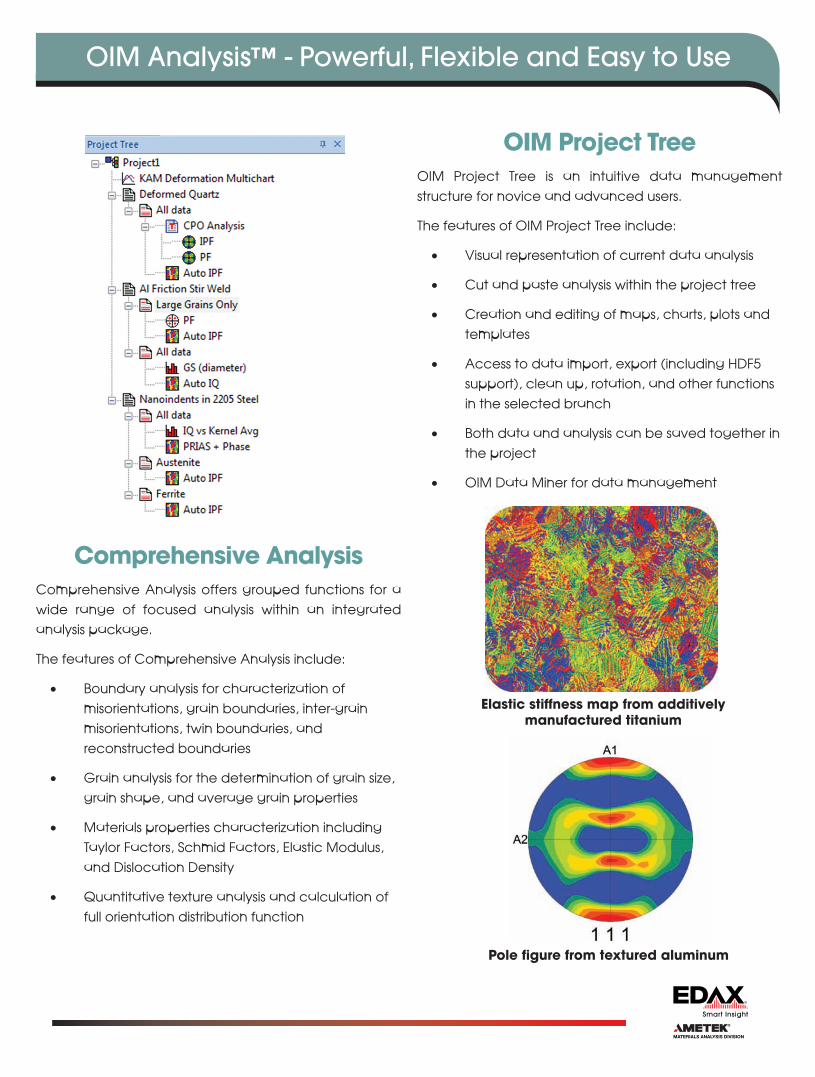
OIM Project TreeOIM Project Tree is an intuitive data managementstructure for novice and advanced users.
The features of OIM Project Tree include:
• Visual representation of current data analysis
• Cut and paste analysis within the project tree
• Creation and editing of maps, charts, plots and templates
• Access to data import, export (including HDF5 support), clean up, rotation, and other functions in the selected branch
• Both data and analysis can be saved together in the project
• OIM Data Miner for data management
OIM Analysis™ - Powerful, Flexible and Easy to Use
Elastic stiffness map from additivelymanufactured titanium
Pole figure from textured aluminum
OIM Analysis™ - Powerful, Flexible and Easy to Use
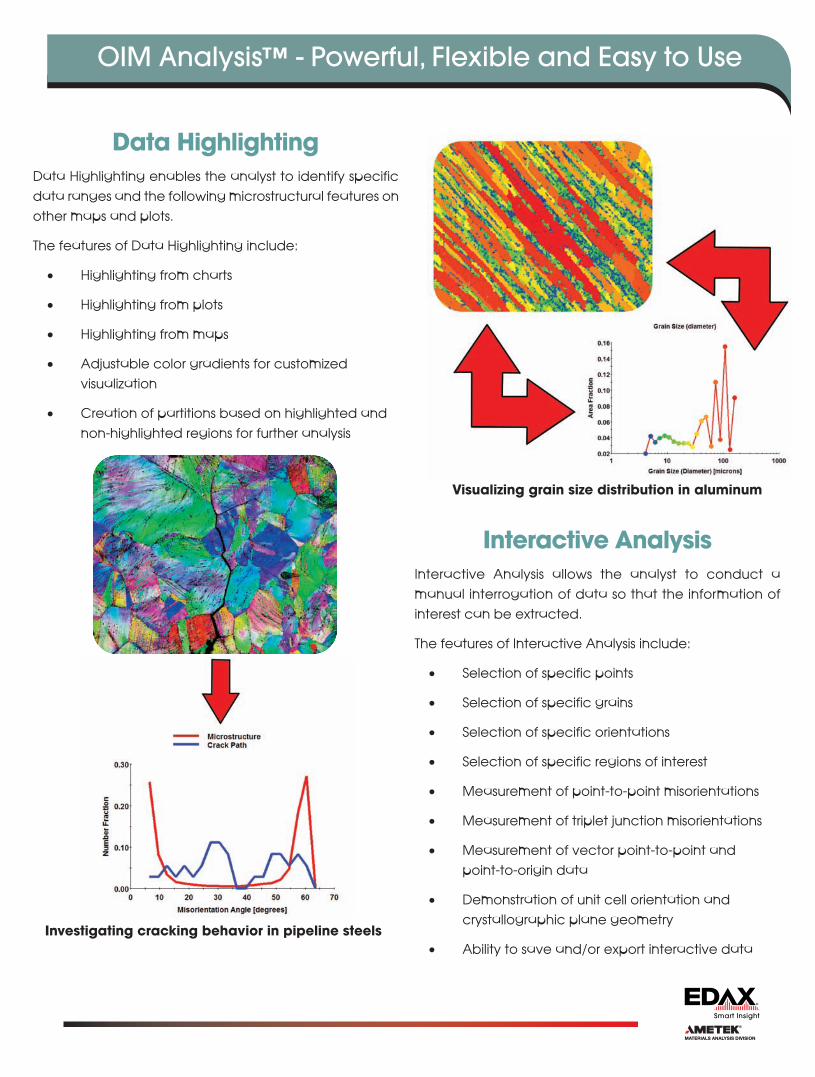
Data HighlightingData Highlighting enables the analyst to identify specificdata ranges and the following microstructural features onother maps and plots.
The features of Data Highlighting include:
• Highlighting from charts
• Highlighting from plots
• Highlighting from maps
• Adjustable color gradients for customized visualization
• Creation of partitions based on highlighted and non-highlighted regions for further analysis
Interactive AnalysisInteractive Analysis allows the analyst to conduct amanual interrogation of data so that the information ofinterest can be extracted.
The features of Interactive Analysis include:
• Selection of specific points
• Selection of specific grains
• Selection of specific orientations
• Selection of specific regions of interest
• Measurement of point-to-point misorientations
• Measurement of triplet junction misorientations
• Measurement of vector point-to-point and point-to-origin data
• Demonstration of unit cell orientation and crystallographic plane geometry
• Ability to save and/or export interactive data
Visualizing grain size distribution in aluminum
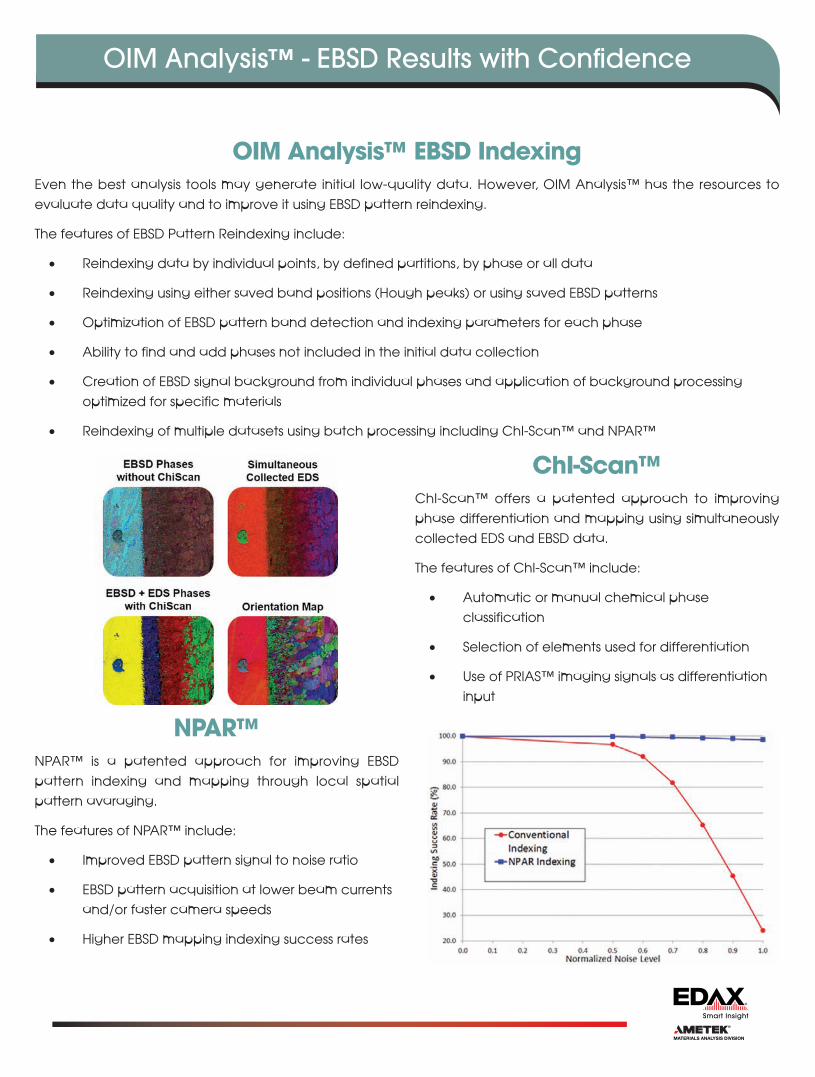
Investigating cracking behavior in pipeline steels
OIM Analysis™ - EBSD Results with Confidence
OIM Analysis™ EBSD Indexing Even the best analysis tools may generate initial low-quality data. However, OIM Analysis™ has the resources toevaluate data quality and to improve it using EBSD pattern reindexing.
The features of EBSD Pattern Reindexing include:
• Reindexing data by individual points, by defined partitions, by phase or all data
• Reindexing using either saved band positions (Hough peaks) or using saved EBSD patterns
• Optimization of EBSD pattern band detection and indexing parameters for each phase
• Ability to find and add phases not included in the initial data collection
• Creation of EBSD signal background from individual phases and application of background processing optimized for specific materials
• Reindexing of multiple datasets using batch processing including ChI-Scan™ and NPAR™
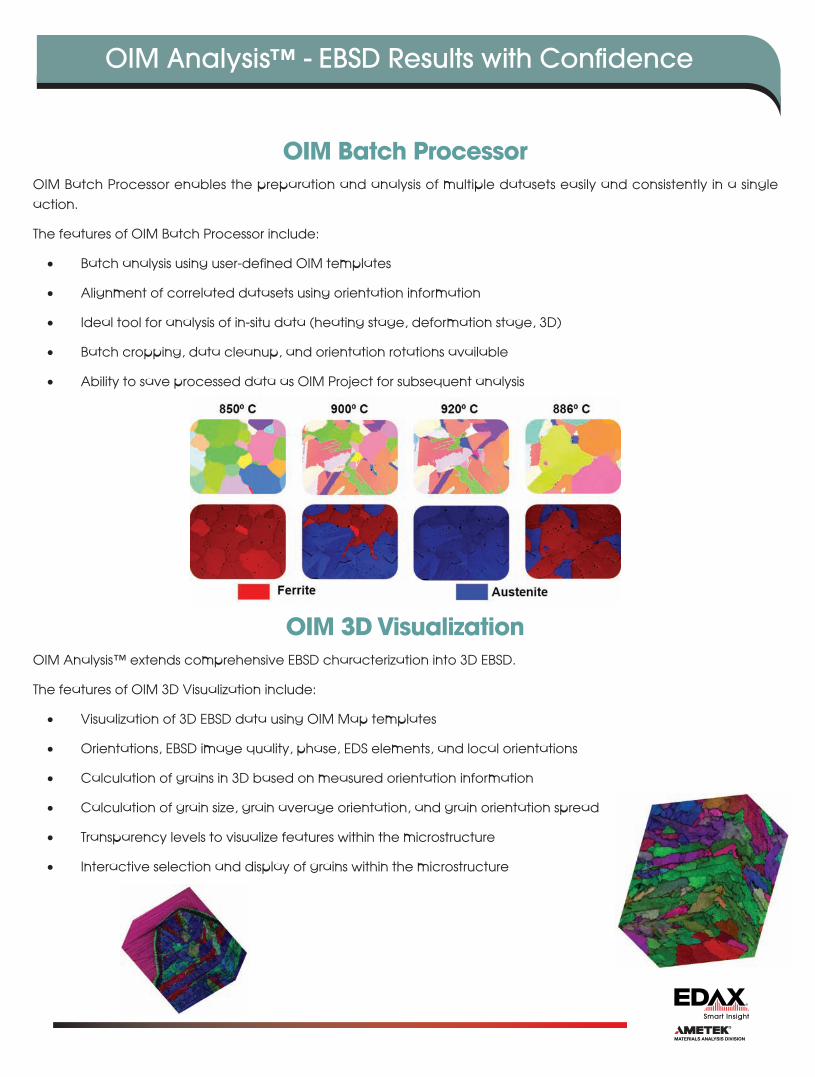
NPAR™ NPAR™ is a patented approach for improving EBSDpattern indexing and mapping through local spatialpattern avaraging.
The features of NPAR™ include:
• Improved EBSD pattern signal to noise ratio
• EBSD pattern acquisition at lower beam currents and/or faster camera speeds
• Higher EBSD mapping indexing success rates
ChI-Scan™ChI-Scan™ offers a patented approach to improvingphase differentiation and mapping using simultaneouslycollected EDS and EBSD data.
The features of ChI-Scan™ include:
• Automatic or manual chemical phase classification
• Selection of elements used for differentiation
• Use of PRIAS™ imaging signals as differentiation input
OIM Analysis™ - EBSD Results with Confidence
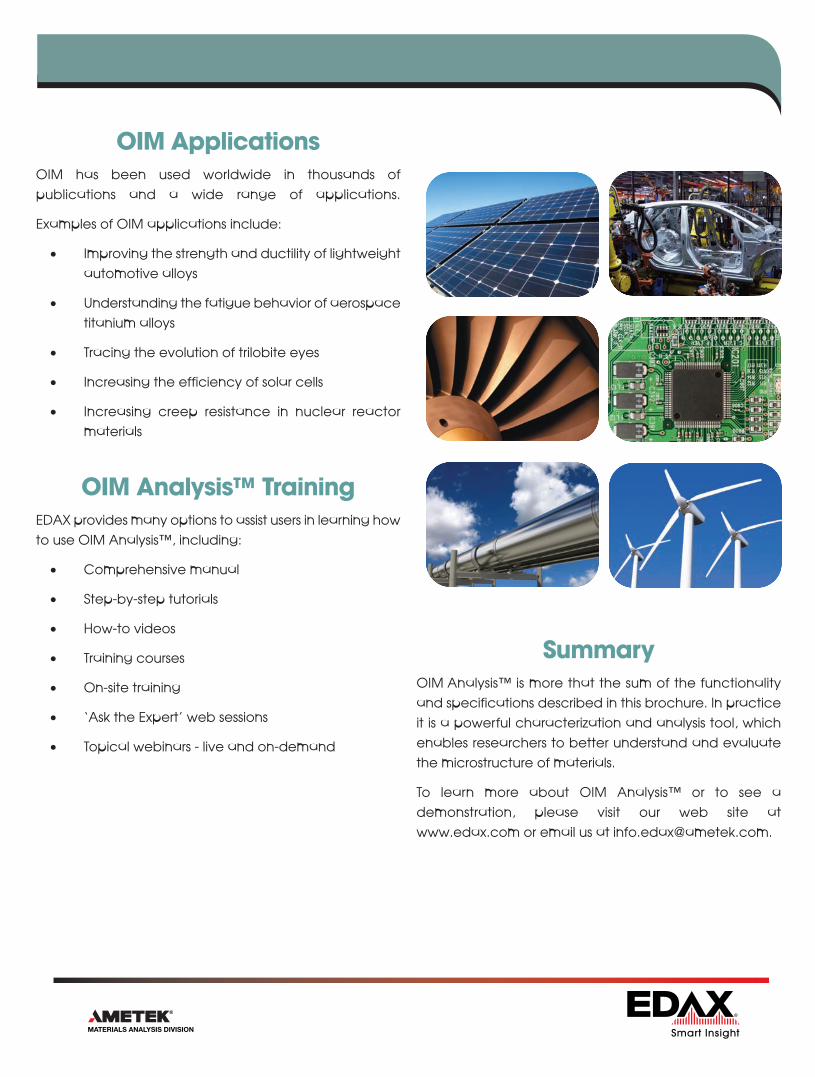
OIM Batch Processor OIM Batch Processor enables the preparation and analysis of multiple datasets easily and consistently in a singleaction.
The features of OIM Batch Processor include:
• Batch analysis using user-defined OIM templates
• Alignment of correlated datasets using orientation information
• Ideal tool for analysis of in-situ data (heating stage, deformation stage, 3D)
• Batch cropping, data cleanup, and orientation rotations available
• Ability to save processed data as OIM Project for subsequent analysis
OIM 3D Visualization OIM Analysis™ extends comprehensive EBSD characterization into 3D EBSD.
The features of OIM 3D Visualization include:
• Visualization of 3D EBSD data using OIM Map templates
• Orientations, EBSD image quality, phase, EDS elements, and local orientations
• Calculation of grains in 3D based on measured orientation information
• Calculation of grain size, grain average orientation, and grain orientation spread
• Transparency levels to visualize features within the microstructure
• Interactive selection and display of grains within the microstructure
OIM Applications OIM has been used worldwide in thousands ofpublications and a wide range of applications.
Examples of OIM applications include:
• Improving the strength and ductility of lightweight automotive alloys
• Understanding the fatigue behavior of aerospace titanium alloys
• Tracing the evolution of trilobite eyes
• Increasing the efficiency of solar cells
• Increasing creep resistance in nuclear reactor materials
OIM Analysis™ Training EDAX provides many options to assist users in learning howto use OIM Analysis™, including:
• Comprehensive manual
• Step-by-step tutorials
• How-to videos
• Training courses
• On-site training
• ‘Ask the Expert’ web sessions
• Topical webinars - live and on-demand
Summary OIM Analysis™ is more that the sum of the functionalityand specifications described in this brochure. In practiceit is a powerful characterization and analysis tool, whichenables researchers to better understand and evaluatethe microstructure of materials.
To learn more about OIM Analysis™ or to see ademonstration, please visit our web site atwww.edax.com or email us at [email protected].