Embed Size (px)
Citation preview
by Jo Bergs
An Introduction to Matlab
Why Matlab?high-level scripting language => rapid prototypingcompatibility with established languages (java, C++, …) allows recoding of speed-limiting modulesexcellent interface and documentationlarge userbase with well-documented, ready-to-use applicationswell-suited for analysis of complex data
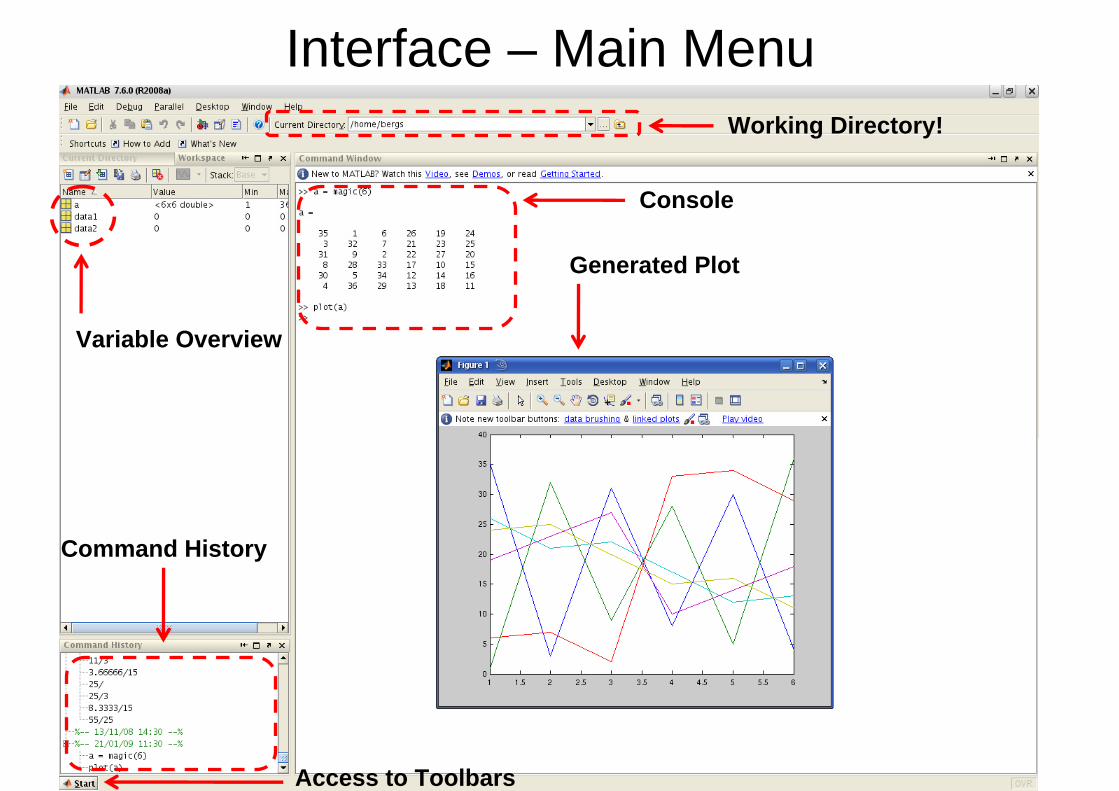
Interface – Main Menu
Variable Overview
Command History
Access to Toolbars
Console
Generated Plot
Working Directory!
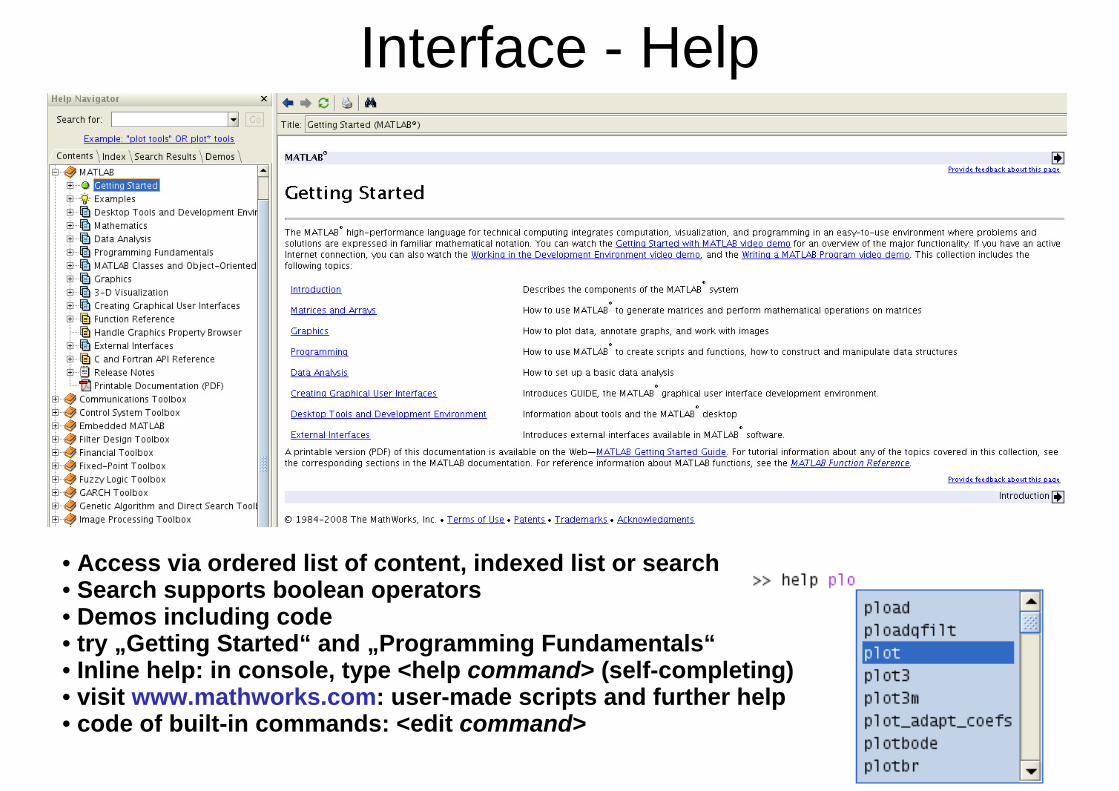
Interface - Help
• Access via ordered list of content, indexed list or search• Search supports boolean operators• Demos including code• try „Getting Started“ and „Programming Fundamentals“• Inline help: in console, type <help command> (self-completing)• visit www.mathworks.com: user-made scripts and further help• code of built-in commands: <edit command>
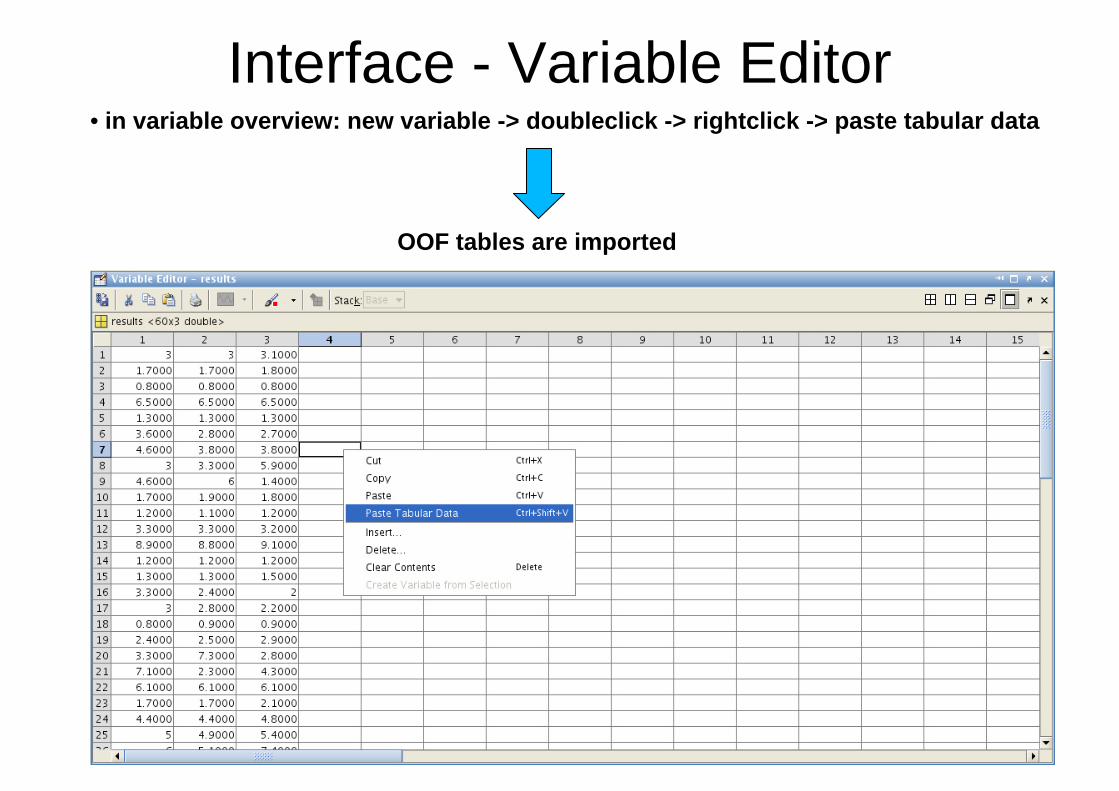
Interface - Variable Editor• in variable overview: new variable -> doubleclick -> rightclick -> paste tabular data
OOF tables are imported
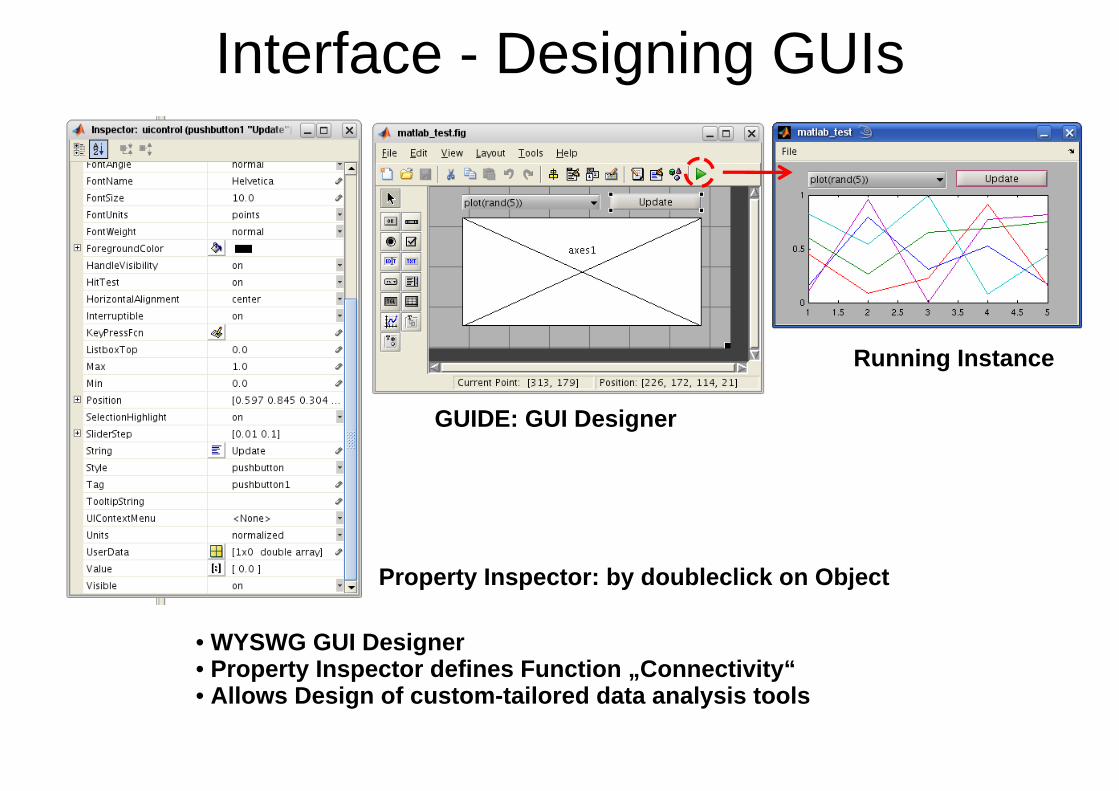
Interface - Designing GUIs
Property Inspector: by doubleclick on Object
Running Instance
GUIDE: GUI Designer
• WYSWG GUI Designer• Property Inspector defines Function „Connectivity“• Allows Design of custom-tailored data analysis tools
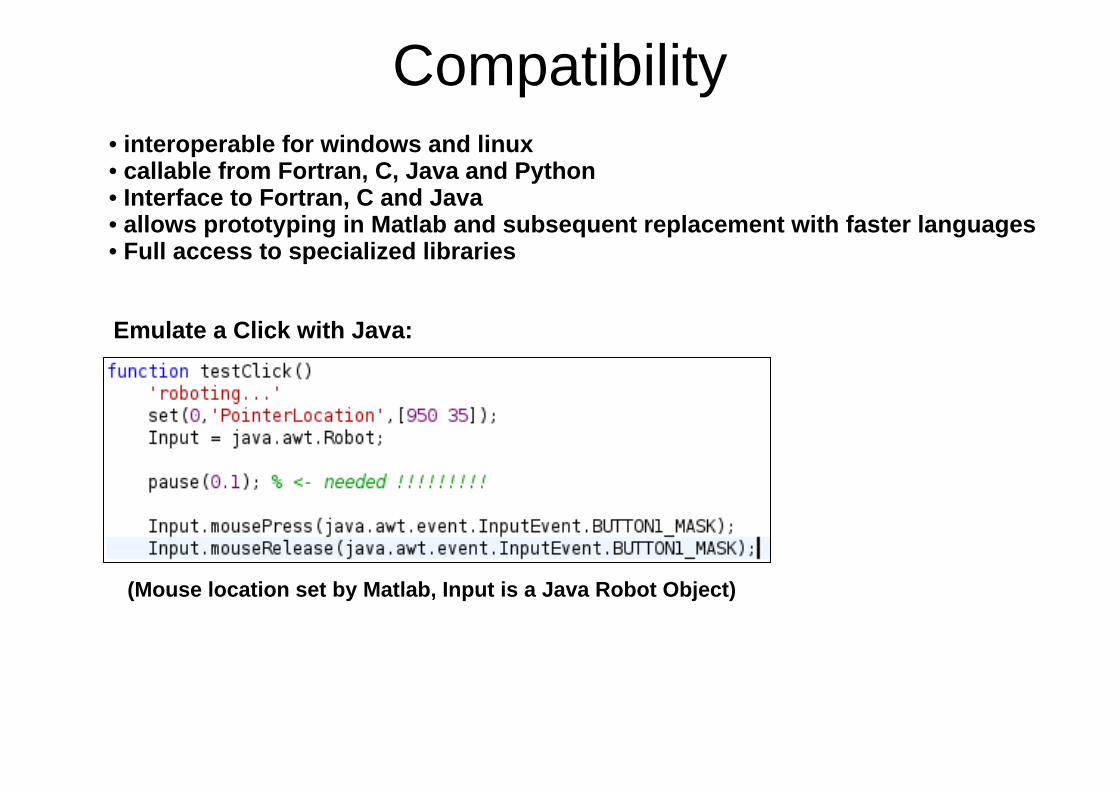
Compatibility• interoperable for windows and linux• callable from Fortran, C, Java and Python• Interface to Fortran, C and Java• allows prototyping in Matlab and subsequent replacement with faster languages• Full access to specialized libraries
Emulate a Click with Java:
(Mouse location set by Matlab, Input is a Java Robot Object)
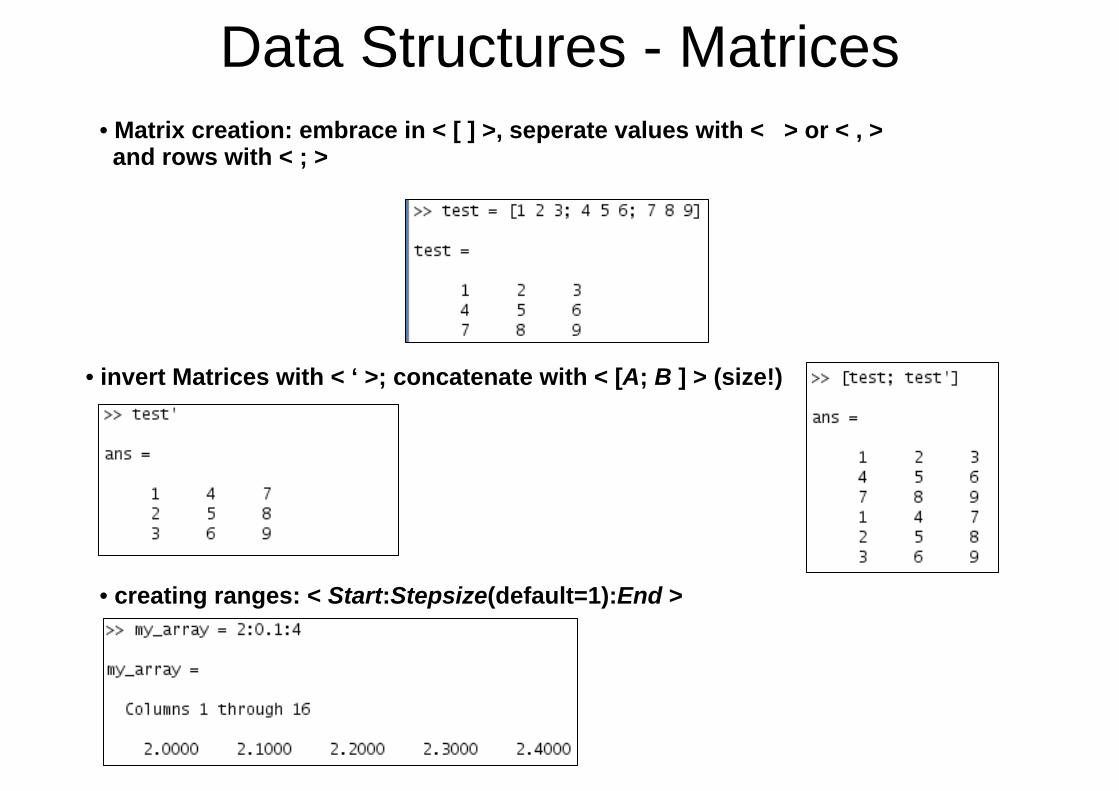
Data Structures - Matrices• Matrix creation: embrace in < [ ] >, seperate values with < > or < , > and rows with < ; >
• invert Matrices with < ‘ >; concatenate with < [A; B ] > (size!)
• creating ranges: < Start:Stepsize(default=1):End >
Data Structures - Matrices
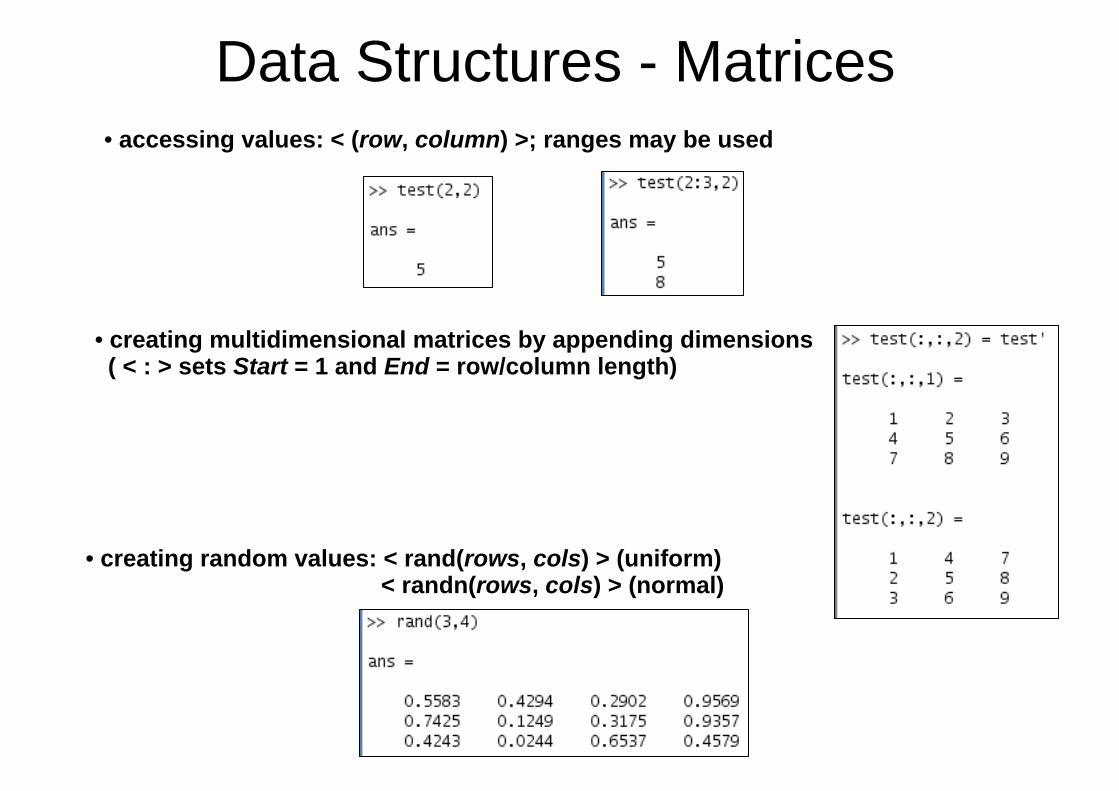
• creating random values: < rand(rows, cols) > (uniform) < randn(rows, cols) > (normal)
• creating multidimensional matrices by appending dimensions( < : > sets Start = 1 and End = row/column length)
• accessing values: < (row, column) >; ranges may be used
Data Structures - Matrices
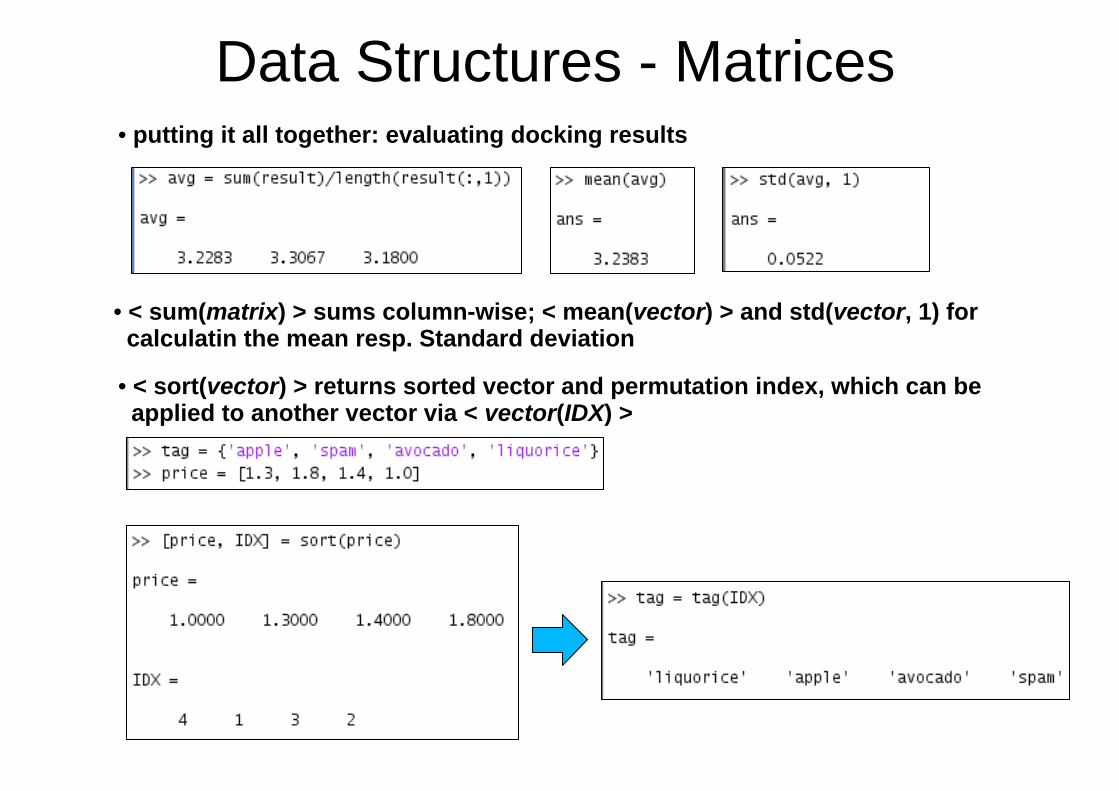
• < sum(matrix) > sums column-wise; < mean(vector) > and std(vector, 1) forcalculatin the mean resp. Standard deviation
• putting it all together: evaluating docking results
• < sort(vector) > returns sorted vector and permutation index, which can beapplied to another vector via < vector(IDX) >
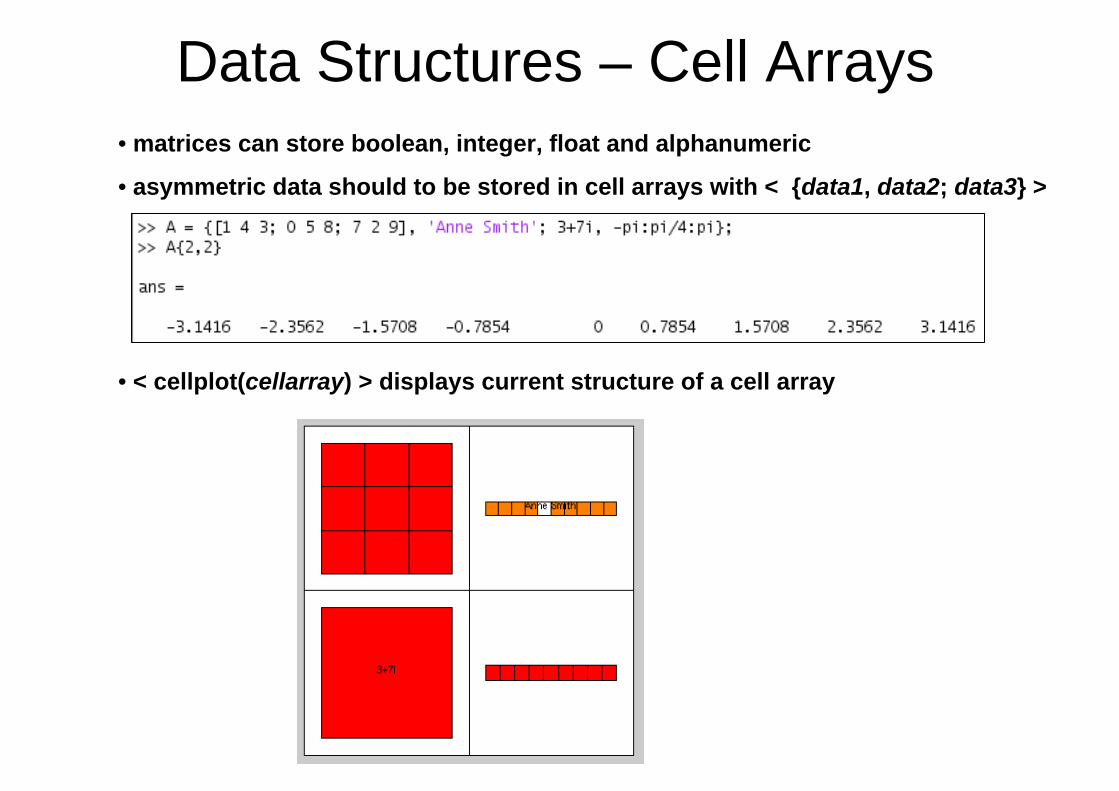
Data Structures – Cell Arrays• matrices can store boolean, integer, float and alphanumeric
• asymmetric data should to be stored in cell arrays with < {data1, data2; data3} >
• < cellplot(cellarray) > displays current structure of a cell array
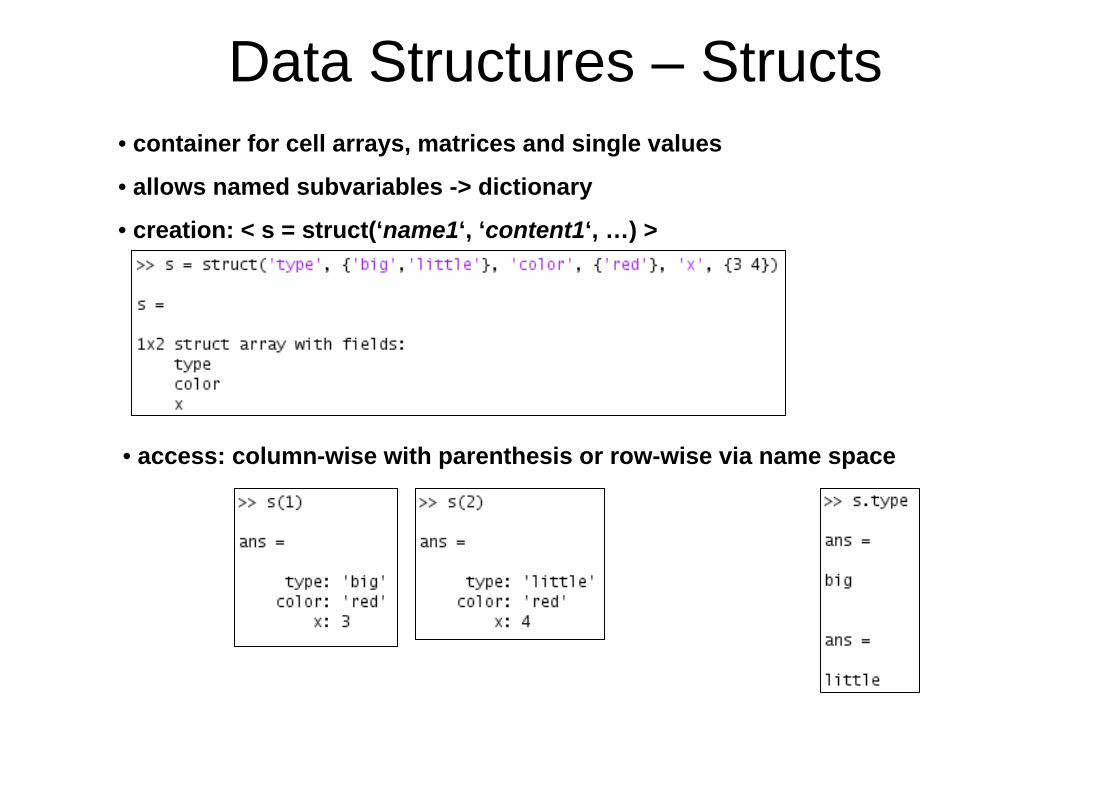
Data Structures – Structs• container for cell arrays, matrices and single values
• allows named subvariables -> dictionary
• creation: < s = struct(‘name1‘, ‘content1‘, …) >
• access: column-wise with parenthesis or row-wise via name space
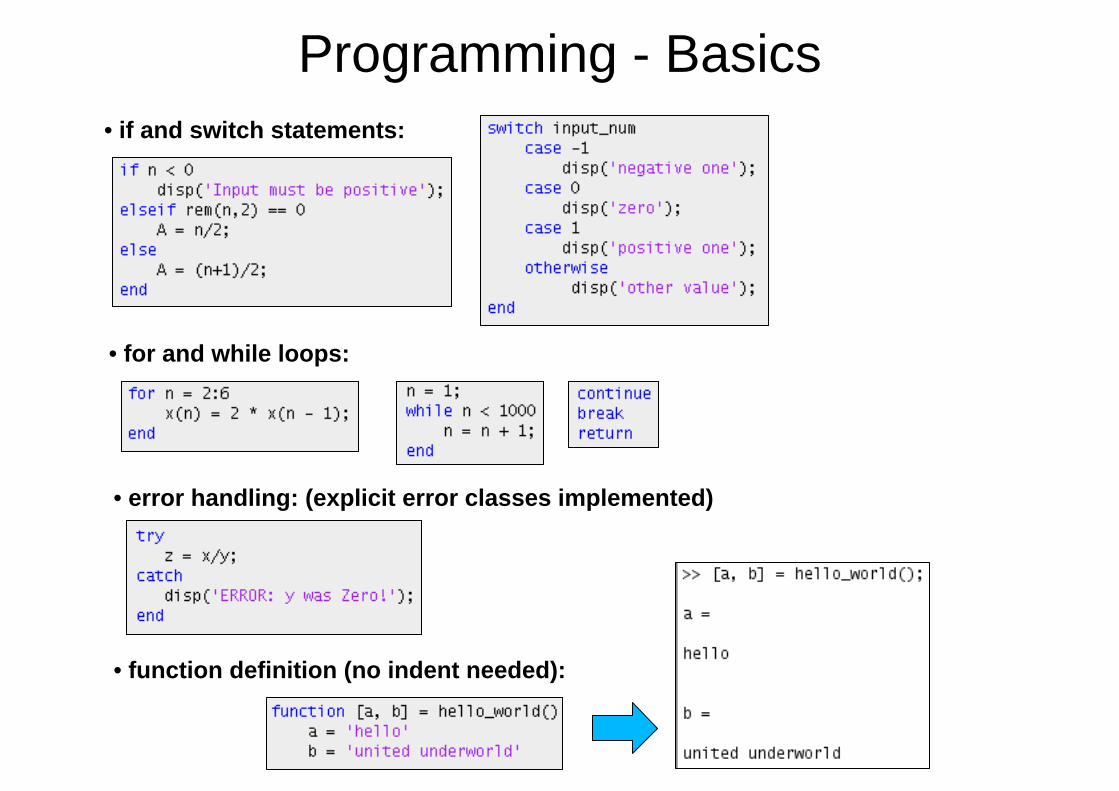
Programming - Basics• if and switch statements:
• for and while loops:
• error handling: (explicit error classes implemented)
• function definition (no indent needed):
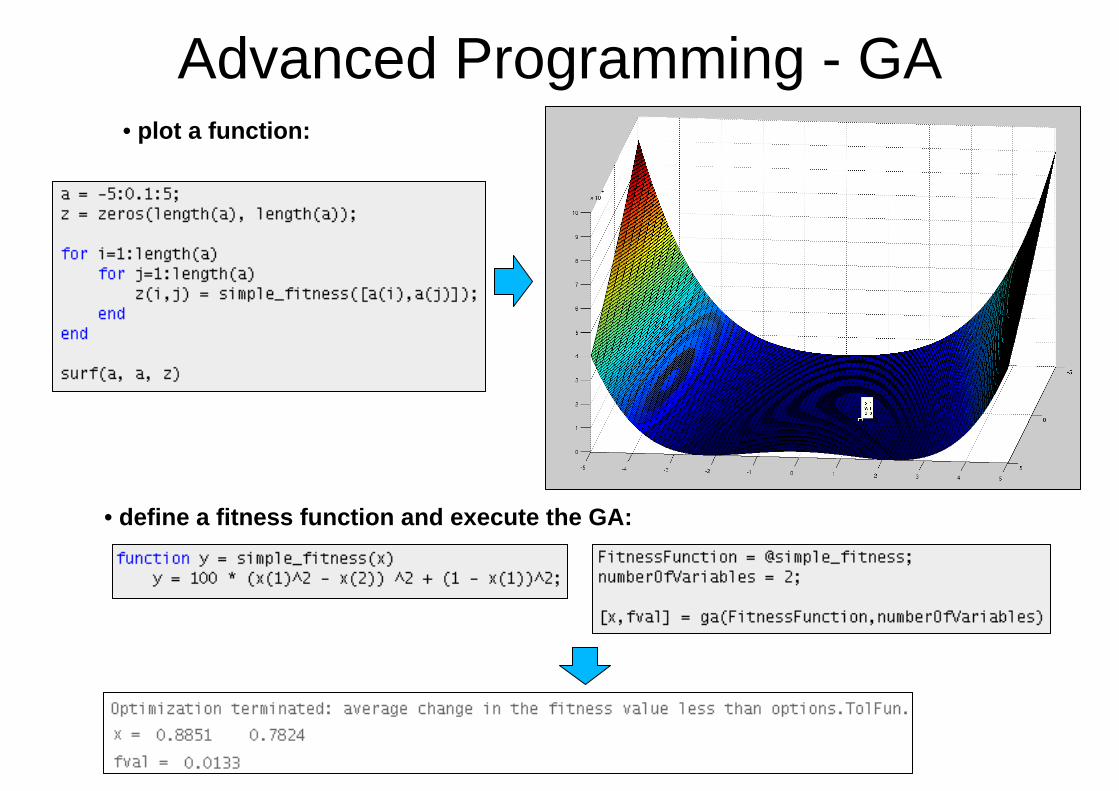
Advanced Programming - GA• plot a function:
• define a fitness function and execute the GA:
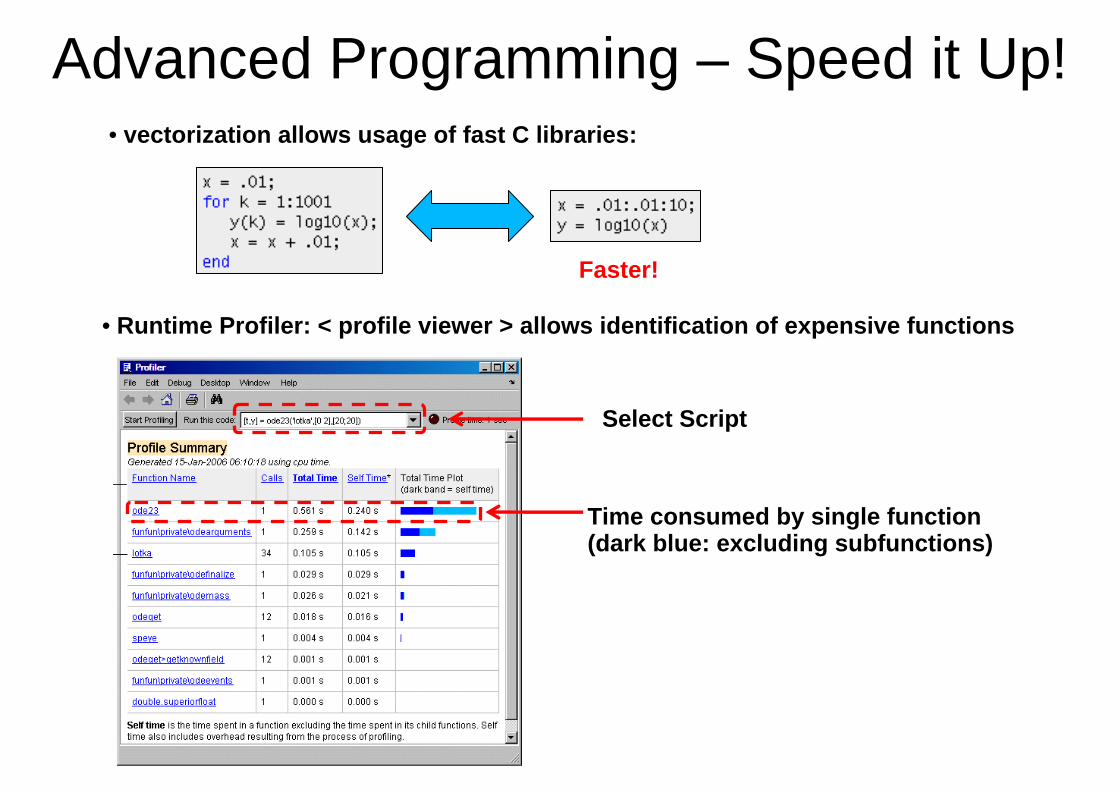
Advanced Programming – Speed it Up!• vectorization allows usage of fast C libraries:
Faster!
• Runtime Profiler: < profile viewer > allows identification of expensive functions
Select Script
Time consumed by single function(dark blue: excluding subfunctions)
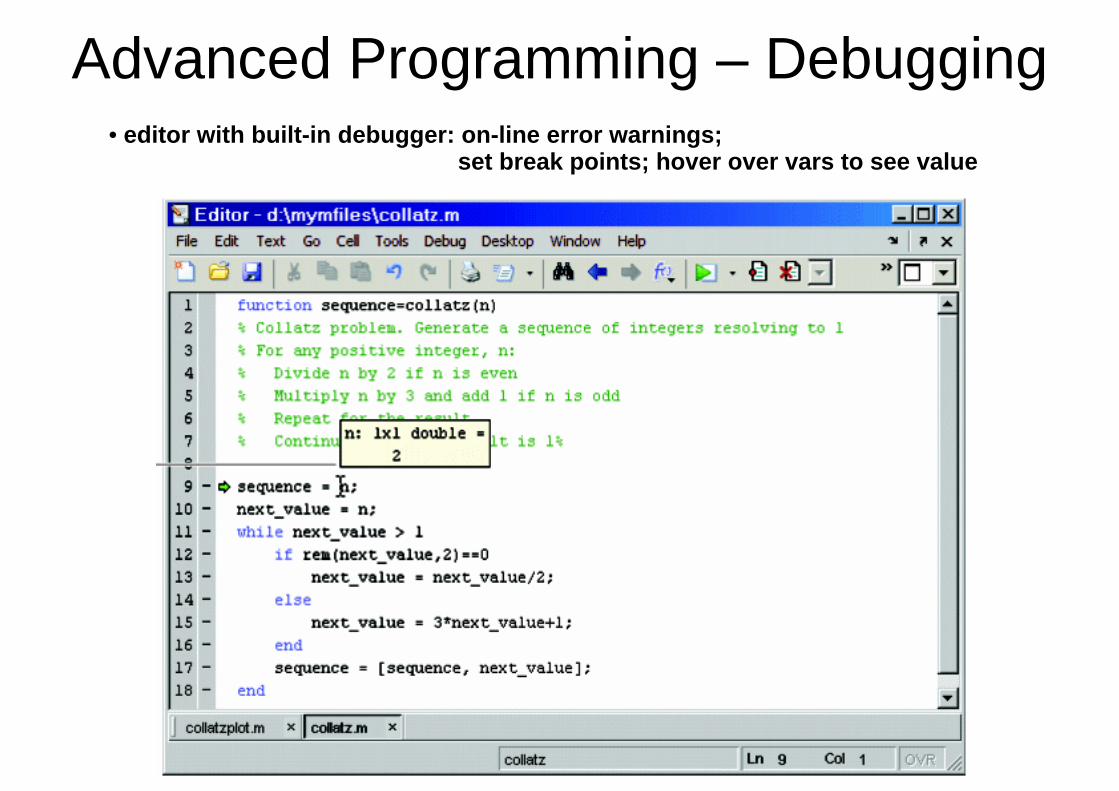
Advanced Programming – Debugging• editor with built-in debugger: on-line error warnings;
set break points; hover over vars to see value
Miscellaneous• use < … > as linebreak in code
• < display(variable) > prints variable value
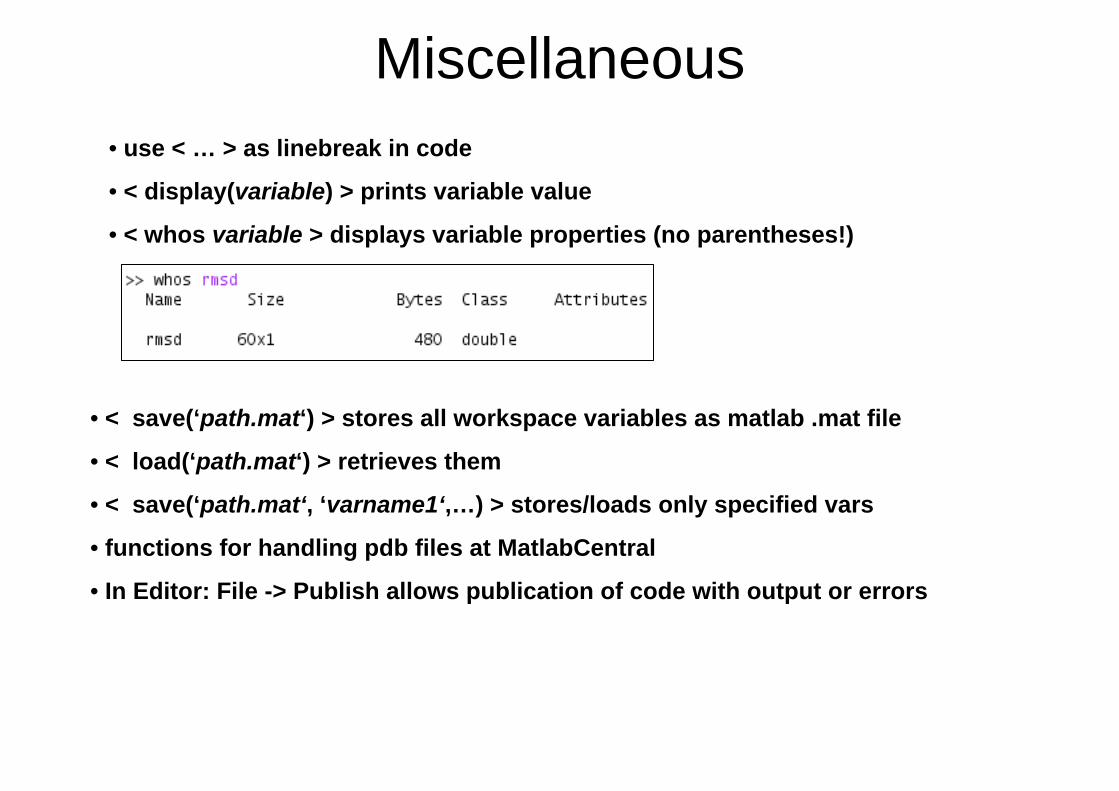
• < whos variable > displays variable properties (no parentheses!)
• < save(‘path.mat‘) > stores all workspace variables as matlab .mat file
• < load(‘path.mat‘) > retrieves them
• < save(‘path.mat‘, ‘varname1‘,…) > stores/loads only specified vars
• functions for handling pdb files at MatlabCentral
• In Editor: File -> Publish allows publication of code with output or errors
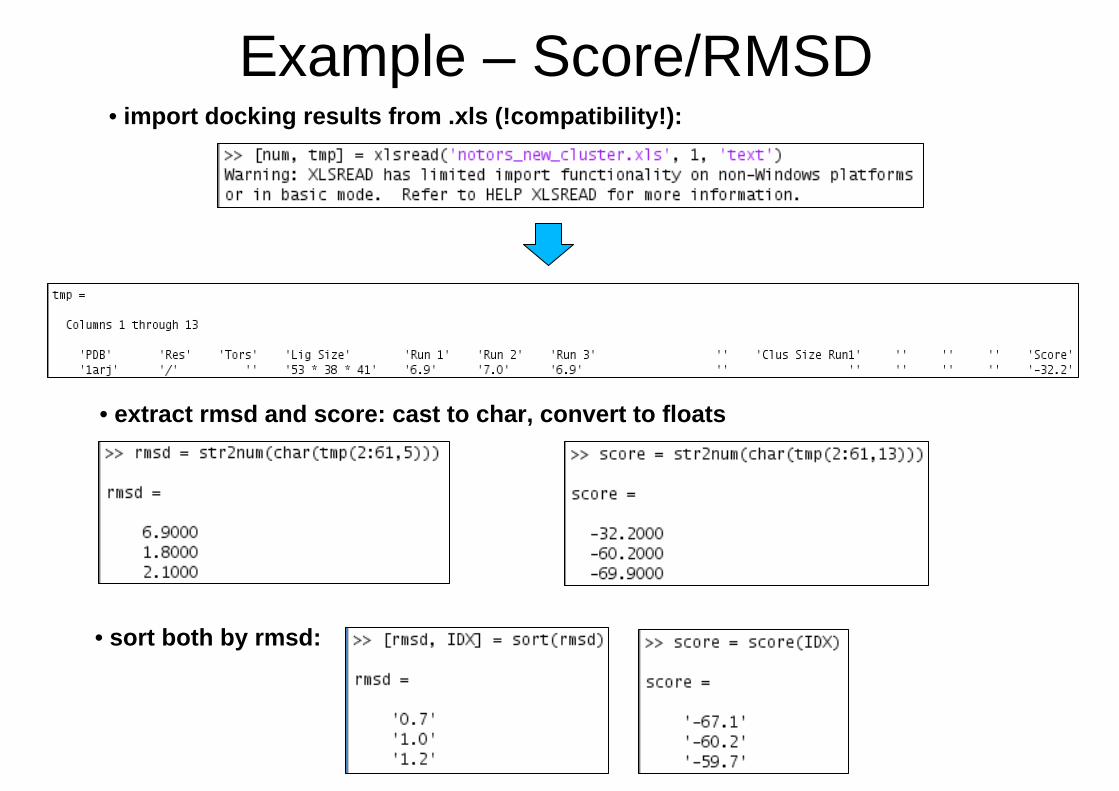
Example – Score/RMSD• import docking results from .xls (!compatibility!):
• extract rmsd and score: cast to char, convert to floats
• sort both by rmsd:
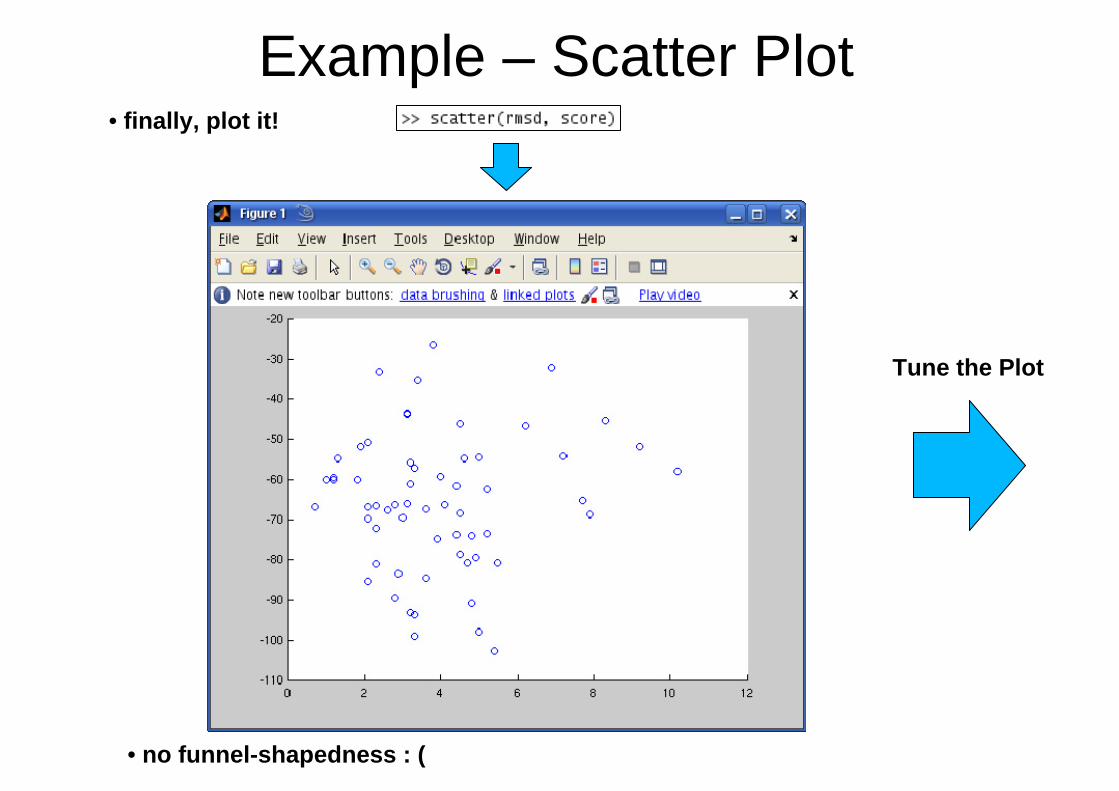
Example – Scatter Plot• finally, plot it!
• no funnel-shapedness : (
Tune the Plot
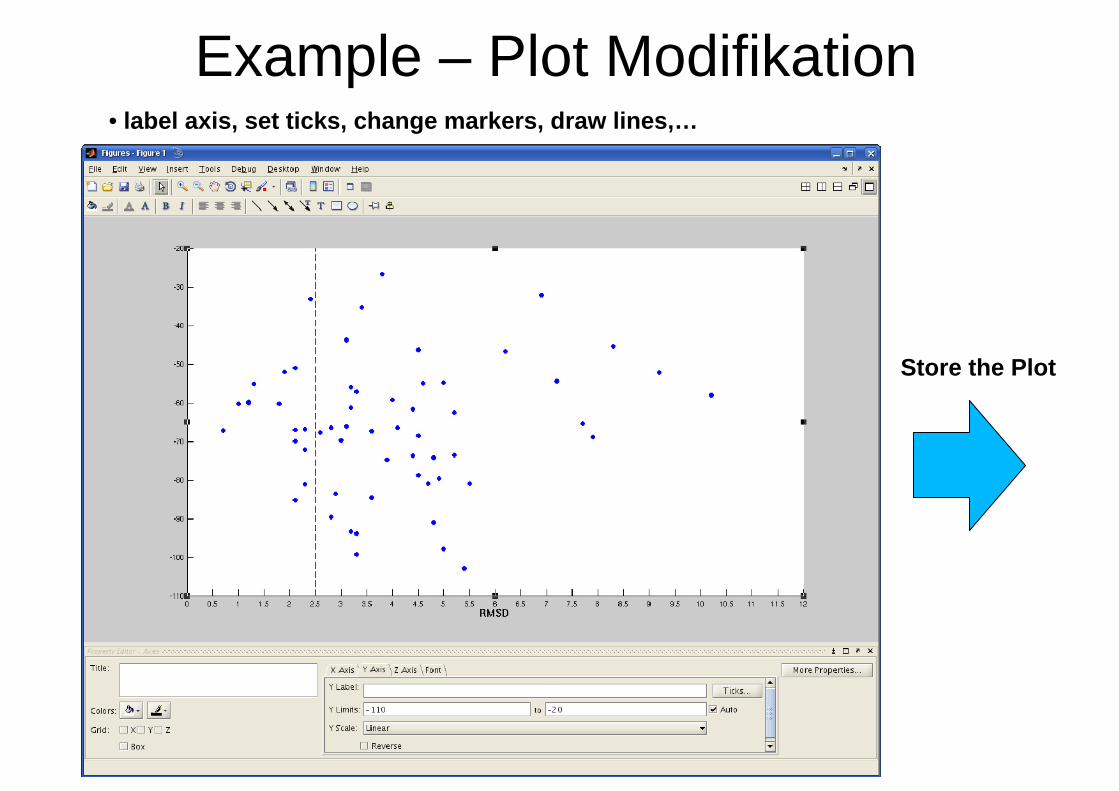
Example – Plot Modifikation• label axis, set ticks, change markers, draw lines,…
Store the Plot
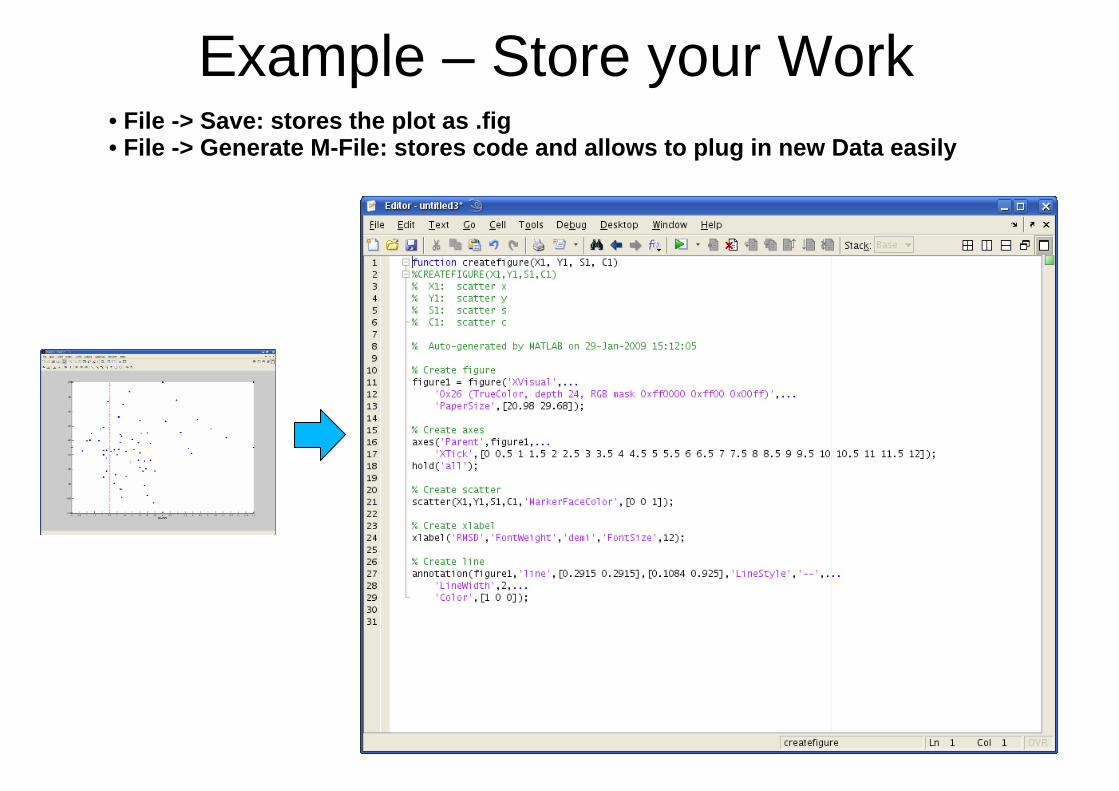
Example – Store your Work• File -> Save: stores the plot as .fig• File -> Generate M-File: stores code and allows to plug in new Data easily
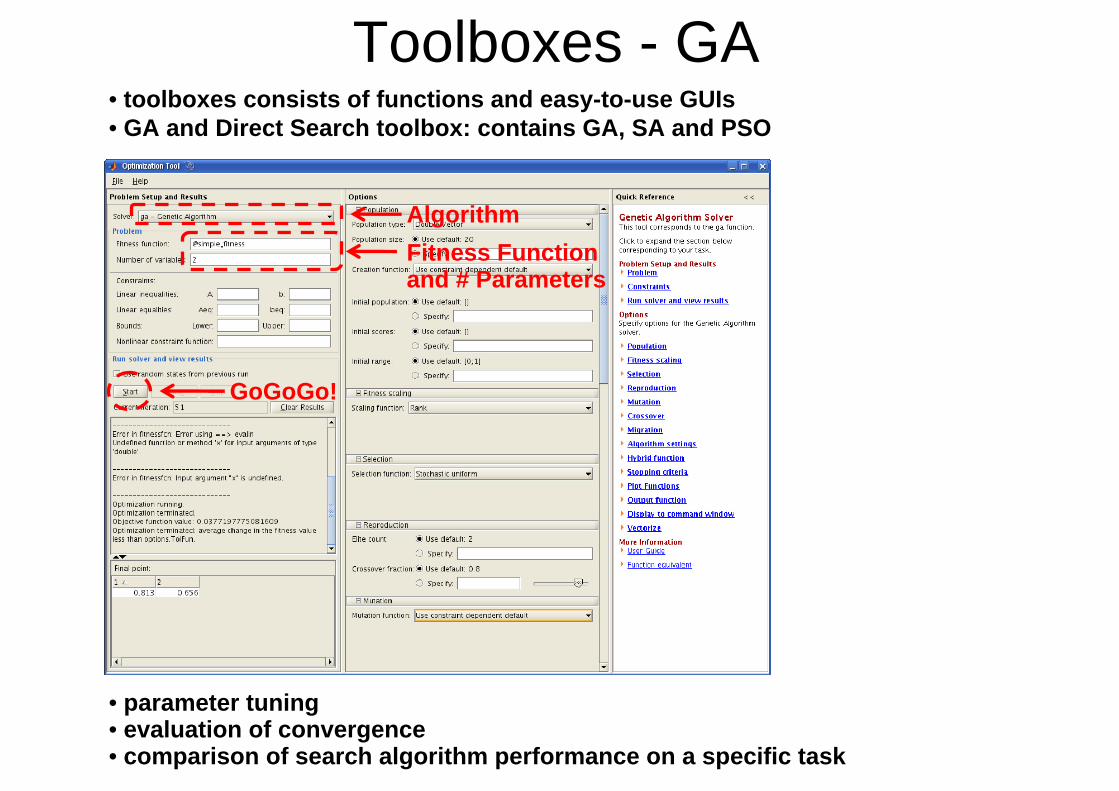
Toolboxes - GA• toolboxes consists of functions and easy-to-use GUIs• GA and Direct Search toolbox: contains GA, SA and PSO
• parameter tuning • evaluation of convergence• comparison of search algorithm performance on a specific task
Fitness Functionand # Parameters
GoGoGo!
Algorithm
Other Toolboxes• stochastics toolbox: Cluster Analysis, Classifiers, Markov Models, …
• optimization toolbox: linear programming, model-fitting (least square)
• symbolic math toolbox: linear algebra, equation solver, calculus
• bioinformatics: sadly, no structural bioinformatics, but sequence analysis etc.
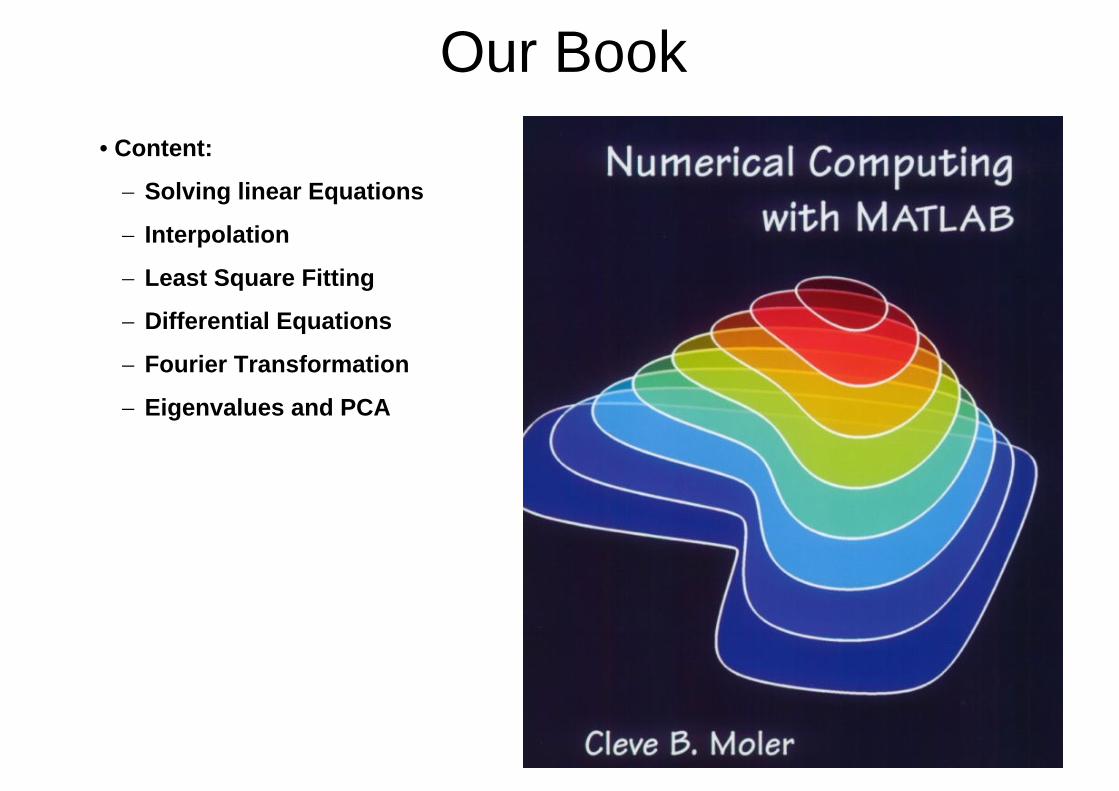
Our Book• Content:
− Solving linear Equations
− Interpolation
− Least Square Fitting
− Differential Equations
− Fourier Transformation
− Eigenvalues and PCA

Eyes Still Open?

Thank you for your attention!