Embed Size (px)
Citation preview
An Introduction to
Impedance Spectroscopy
and Conductivity
Damilola Daramola and Ramasamy
Palaniappan
Center for Electrochemical Engineering
Research
ABC’s of Electrochemistry
August 9, 2011
2
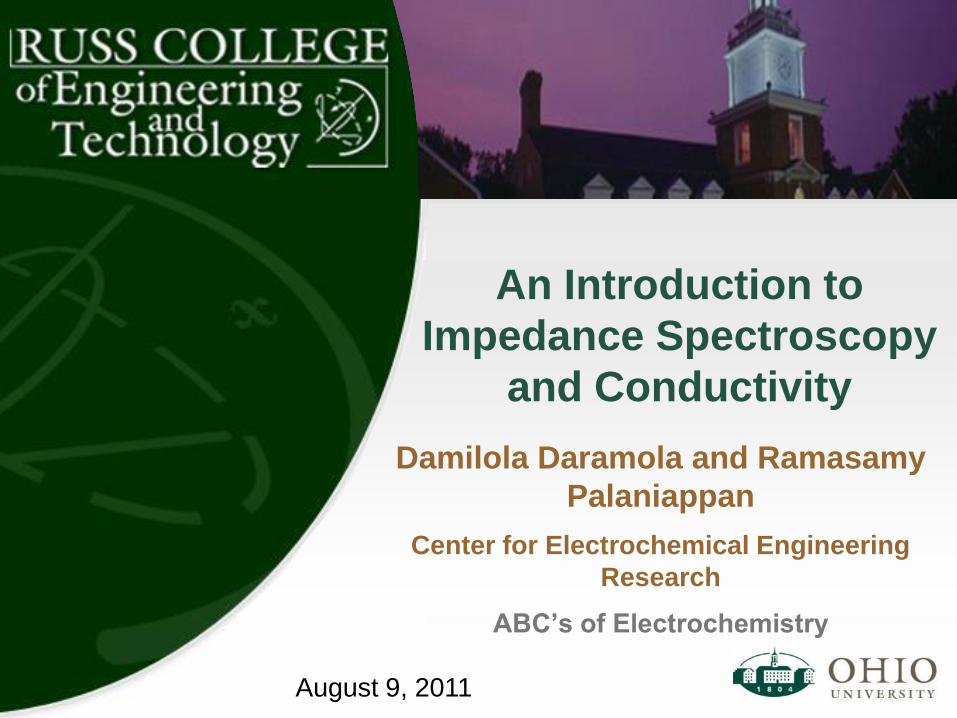
Introduction
• “Impedance spectroscopy is classified as the small-
signal measurement of linear electrical response . .
. and the subsequent analysis of the response”
• Most commonly performed in the frequency domain
but can also be performed in the time domain and
then Fourier transformed into the frequency
domain.
Center for Electrochemical Engineering Research, Ohio University
J. R. Macdonald Annals of Biomedical Engineering 20, pp 289 - 305
3
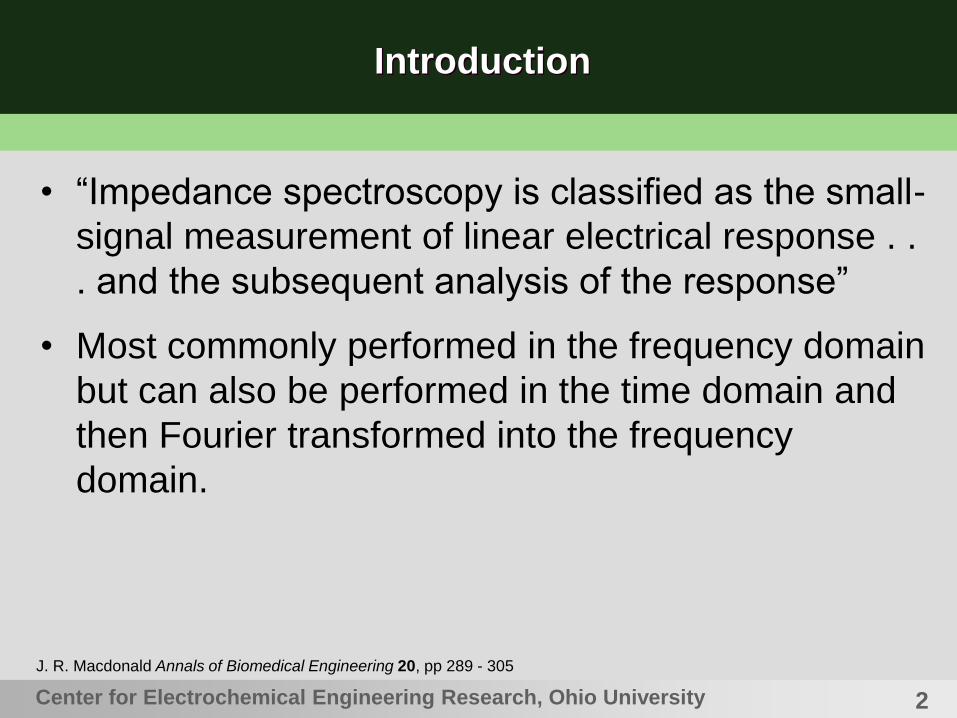
Impedance
• “To impede” means “to hinder”
– Resistance is a type of impedance
• Represented with the symbol Z
• Stimulus and response is frequency dependent i.e.
sinusoidal
• A complex term i.e. Z = Z' + jZ''
– Re (Z) = Z'
– Im (Z) = Z''
– j (usually expressed as i) =
Center for Electrochemical Engineering Research, Ohio University
1Impedance spectroscopy : emphasizing solid materials and systems / edited by J. Ross Macdonald; Wiley: New York :, 1987.
4
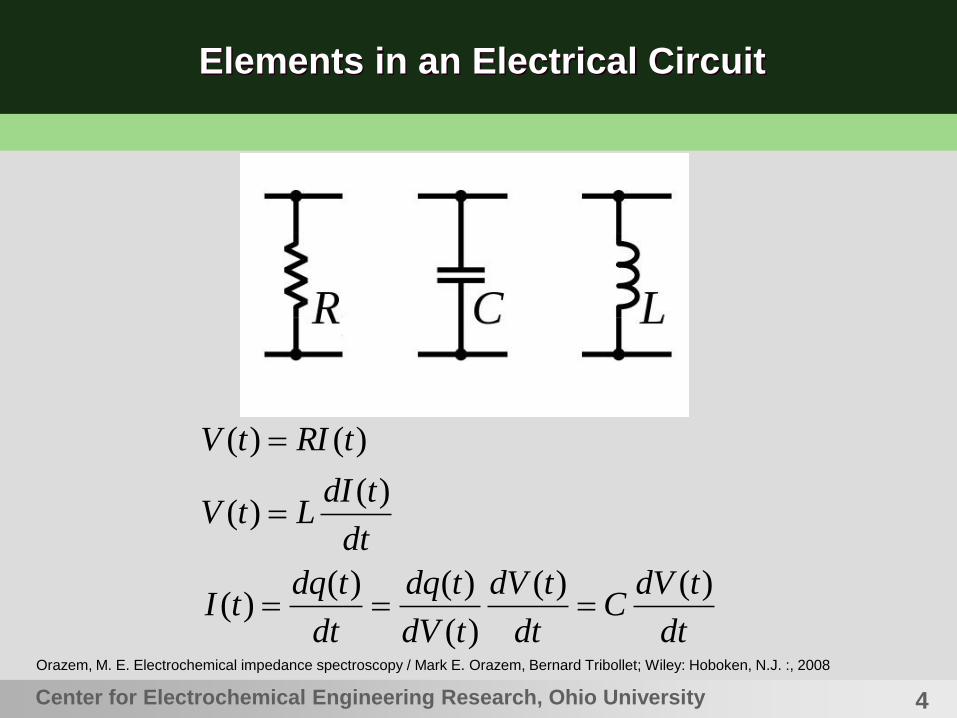
Elements in an Electrical Circuit
Center for Electrochemical Engineering Research, Ohio University
dt
tdVC
dt
tdV
tdV
tdq
dt
tdqtI
dt
tdILtV
tRItV
)()(
)(
)()()(
)()(
)()(
Orazem, M. E. Electrochemical impedance spectroscopy / Mark E. Orazem, Bernard Tribollet; Wiley: Hoboken, N.J. :, 2008
5
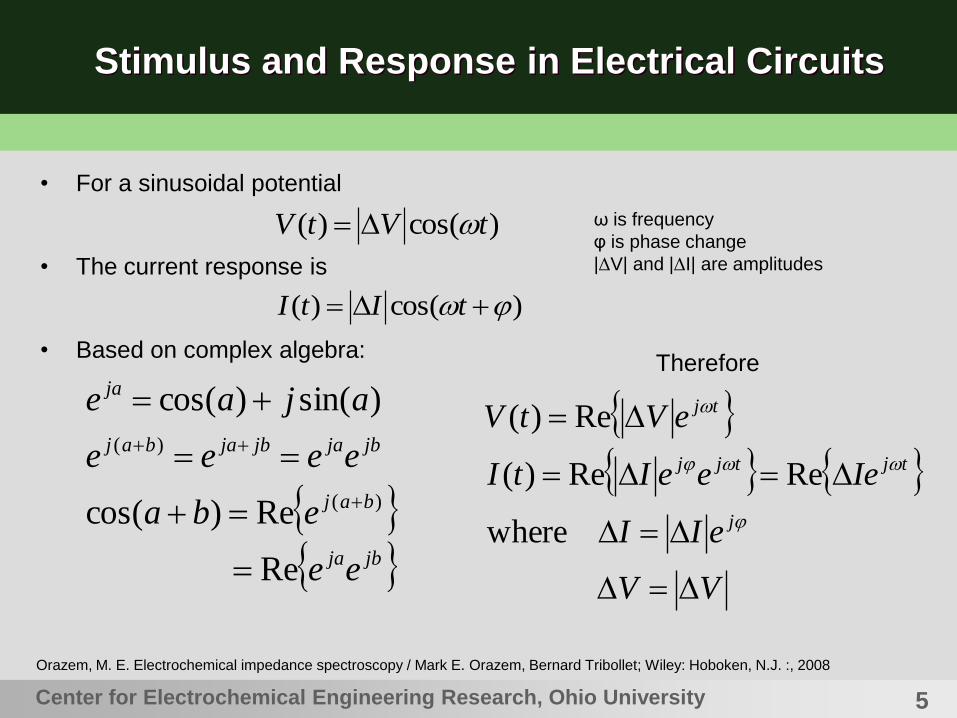
Stimulus and Response in Electrical Circuits
• For a sinusoidal potential
• The current response is
• Based on complex algebra:
Center for Electrochemical Engineering Research, Ohio University
)cos()( tVtV
)cos()( tItI
ω is frequency
φ is phase change
|ΔV| and |ΔI| are amplitudes
jbja
baj
jbjajbjabaj
ja
ee
eba
eeee
ajae
Re
Re)cos(
)sin()cos(
)(
)(
VV
eII
IeeeItI
eVtV
j
tjtjj
tj
where
ReRe)(
Re)(
Therefore
Orazem, M. E. Electrochemical impedance spectroscopy / Mark E. Orazem, Bernard Tribollet; Wiley: Hoboken, N.J. :, 2008
6
• For f, a continuous function of t
• Therefore,
• And Resistance, Inductance and Capacitance responses are
• Based on complex algebra:
Center for Electrochemical Engineering Research, Ohio University
dt
tdftf
dt
d )(Re)(Re
tj
tj
Vejdt
tdVtV
dt
d
Iejdt
tdItI
dt
d
Re)(
Re)(Re
Re)(
Re)(Re
tjtj
tjtj
tjtj
VejCIe
IejLVe
IeRVe
ReRe
ReRe
ReRe
dt
tdVCtI
dt
tdILtV
tRItV
)()(
)()(
)()(
jjeee
bjbeeee
jj
ajbajba
)sin()cos(
)sin()cos(
22
0022
22
22
ReReRe
ReReRe
ReRe
tjjtjtj
tjjtjtj
tjtj
VeCeVeCIe
IeLeIeLVe
IeRVe
Therefore
Orazem, M. E. Electrochemical impedance spectroscopy / Mark E. Orazem, Bernard Tribollet; Wiley: Hoboken, N.J. :, 2008
Stimulus and Response in Electrical Circuits
7
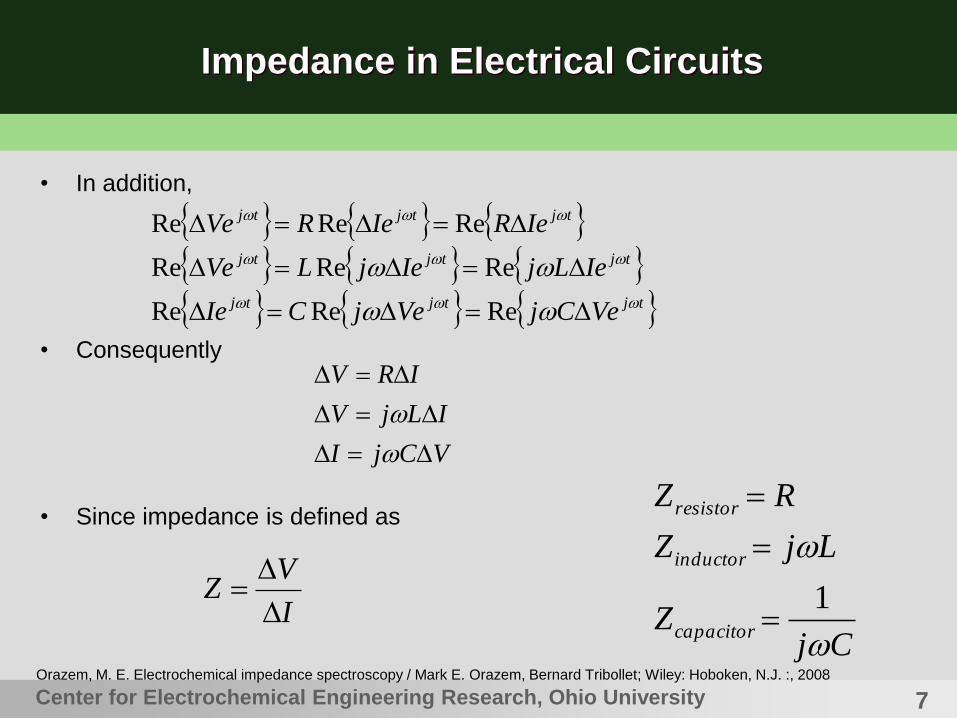
Impedance in Electrical Circuits
• In addition,
• Consequently
• Since impedance is defined as
Center for Electrochemical Engineering Research, Ohio University
tjtjtj
tjtjtj
tjtjtj
VeCjVejCIe
IeLjIejLVe
IeRIeRVe
ReReRe
ReReRe
ReReRe
VCjI
ILjV
IRV
I
VZ
CjZ
LjZ
RZ
capacitor
inductor
resistor
1
Orazem, M. E. Electrochemical impedance spectroscopy / Mark E. Orazem, Bernard Tribollet; Wiley: Hoboken, N.J. :, 2008
8
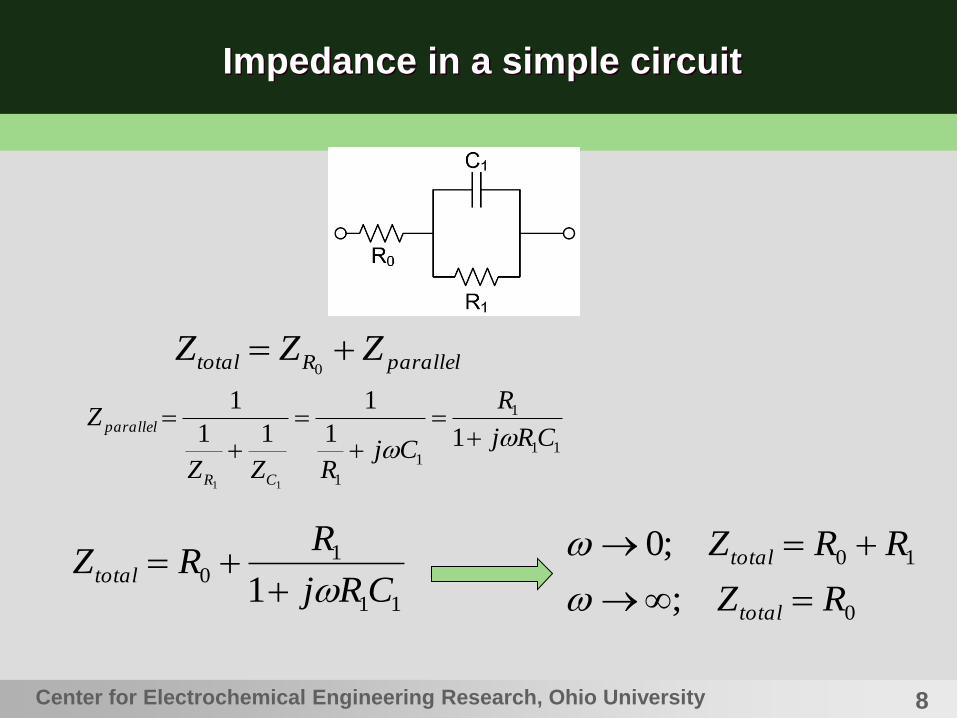
Impedance in a simple circuit
Center for Electrochemical Engineering Research, Ohio University
11
1
1
1
11
1
11
1
11
CRj
R
CjRZZ
Z
CR
parallel
11
10
1 CRj
RRZtotal
parallelRtotal ZZZ 0
0
10
;
;0
RZ
RRZ
total
total
9
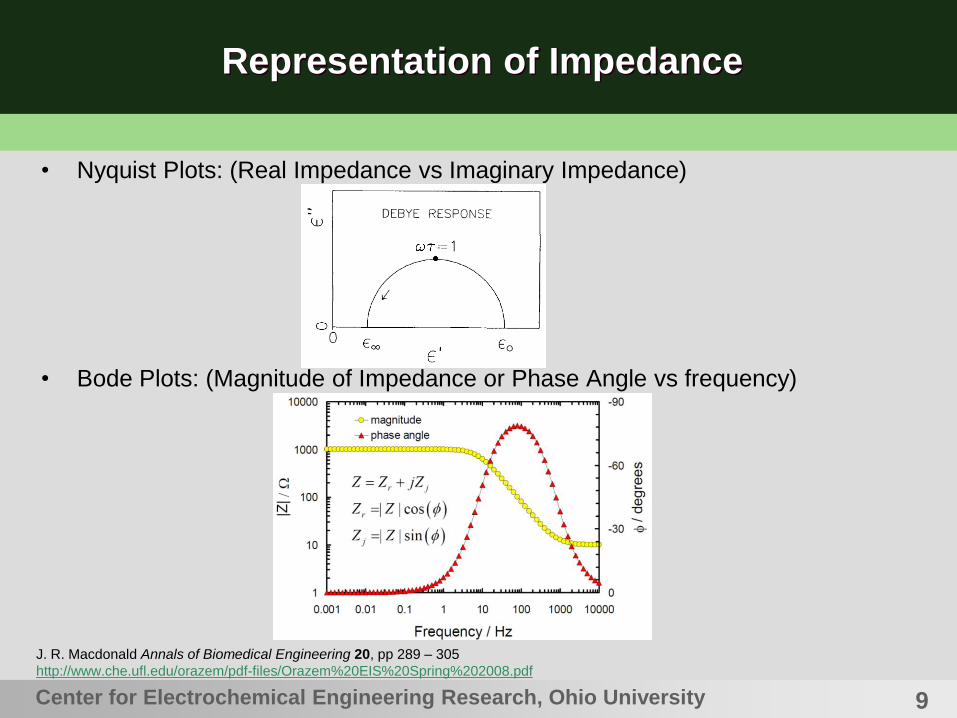
Representation of Impedance
• Nyquist Plots: (Real Impedance vs Imaginary Impedance)
• Bode Plots: (Magnitude of Impedance or Phase Angle vs frequency)
Center for Electrochemical Engineering Research, Ohio University
J. R. Macdonald Annals of Biomedical Engineering 20, pp 289 – 305
http://www.che.ufl.edu/orazem/pdf-files/Orazem%20EIS%20Spring%202008.pdf
10
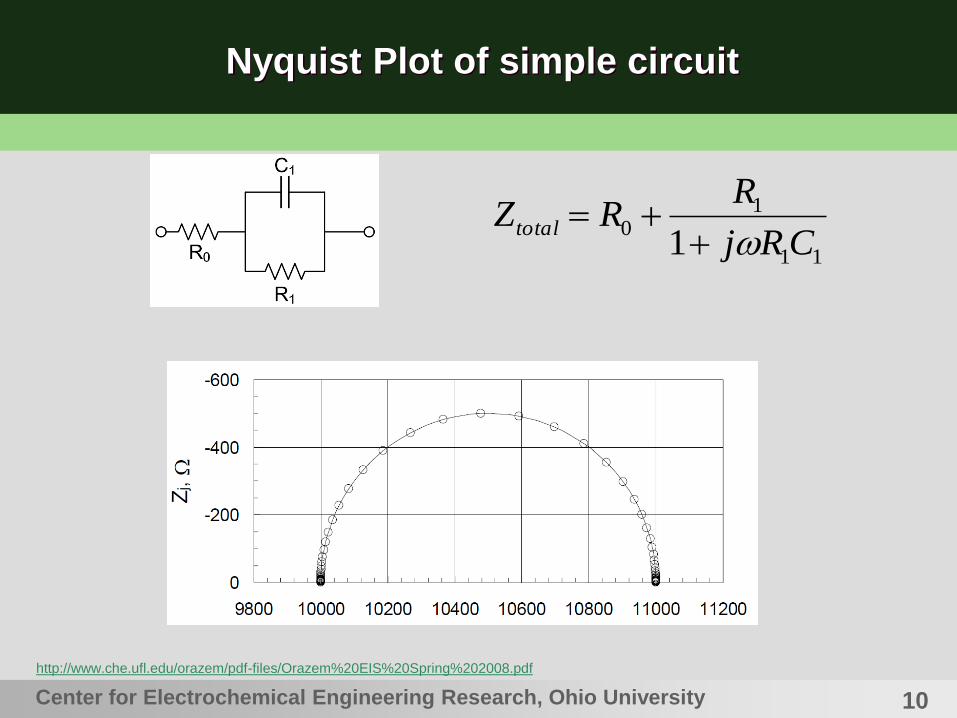
Nyquist Plot of simple circuit
Center for Electrochemical Engineering Research, Ohio University
http://www.che.ufl.edu/orazem/pdf-files/Orazem%20EIS%20Spring%202008.pdf
11
10
1 CRj
RRZtotal
11
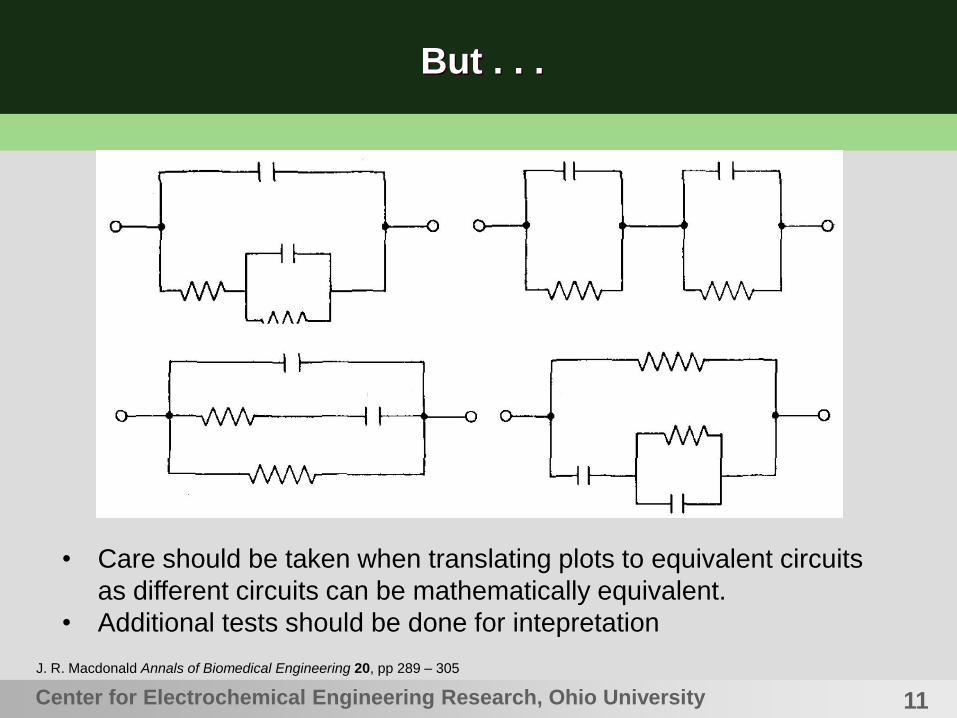
But . . .
Center for Electrochemical Engineering Research, Ohio University
J. R. Macdonald Annals of Biomedical Engineering 20, pp 289 – 305
• Care should be taken when translating plots to equivalent circuits
as different circuits can be mathematically equivalent.
• Additional tests should be done for intepretation
12
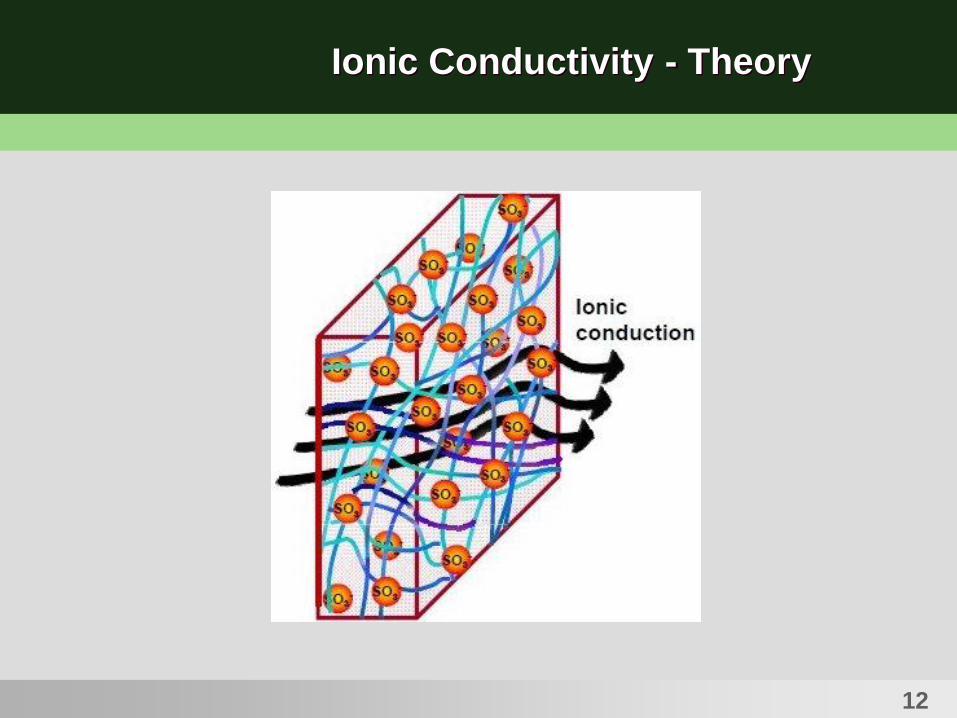
Ionic Conductivity - Theory
13
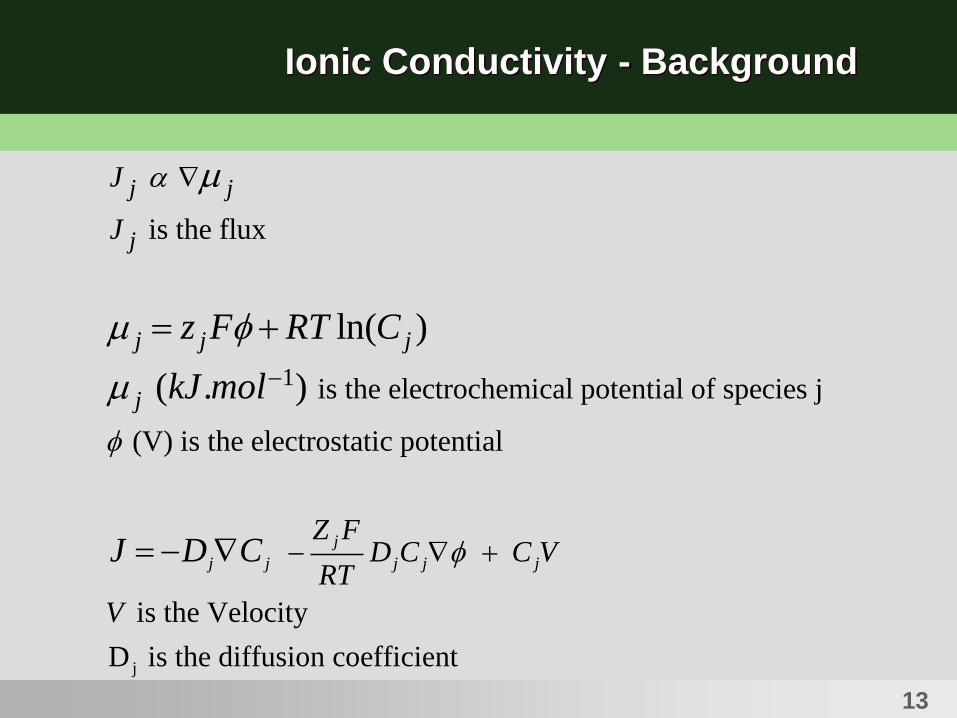
Ionic Conductivity - Background
j
1
is the flux
is the electrochemical potential of species j
(V) is the electrostatic potential
is the Velocity
D is the diffusion co
ln( )
( . )
j
j j j j j
j j
j
j j j
j
J
J
Z FD C C V
RT
V
J D C
z F RT C
kJ mol
efficient
14
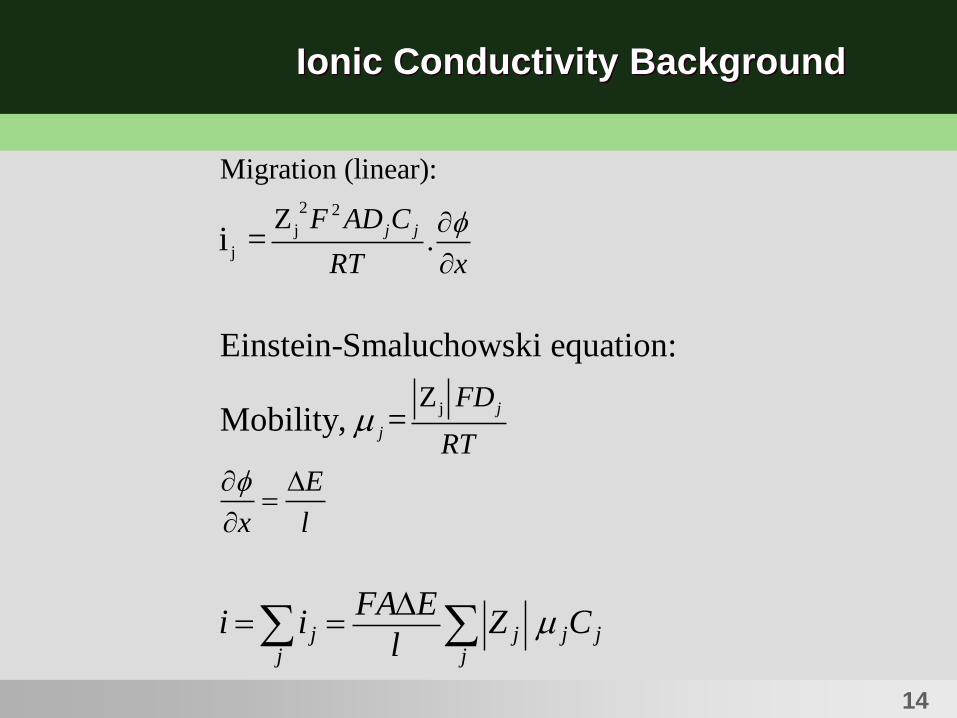
Ionic Conductivity Background
2 2
j
j
j
Migration (linear):
Z.
Z
i =
Einstein-Smaluchowski equation:
Mobility, =
j j
j
j
j j j jj j
F AD C
RT x
FD
RT
E
x l
FA Ei i Z C
l
15
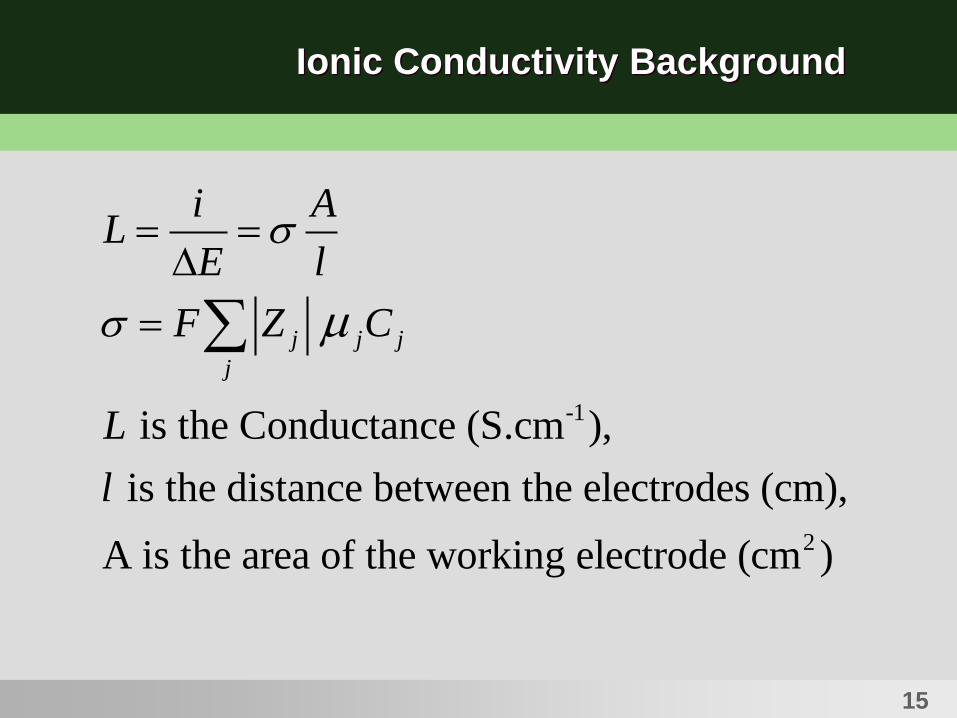
Ionic Conductivity Background
-1
2
is the Conductance (S.cm ),
is the distance between the electrodes (cm),
A is the area of the working electrode (cm )
j j j
j
i AL
E l
F Z C
L
l
16
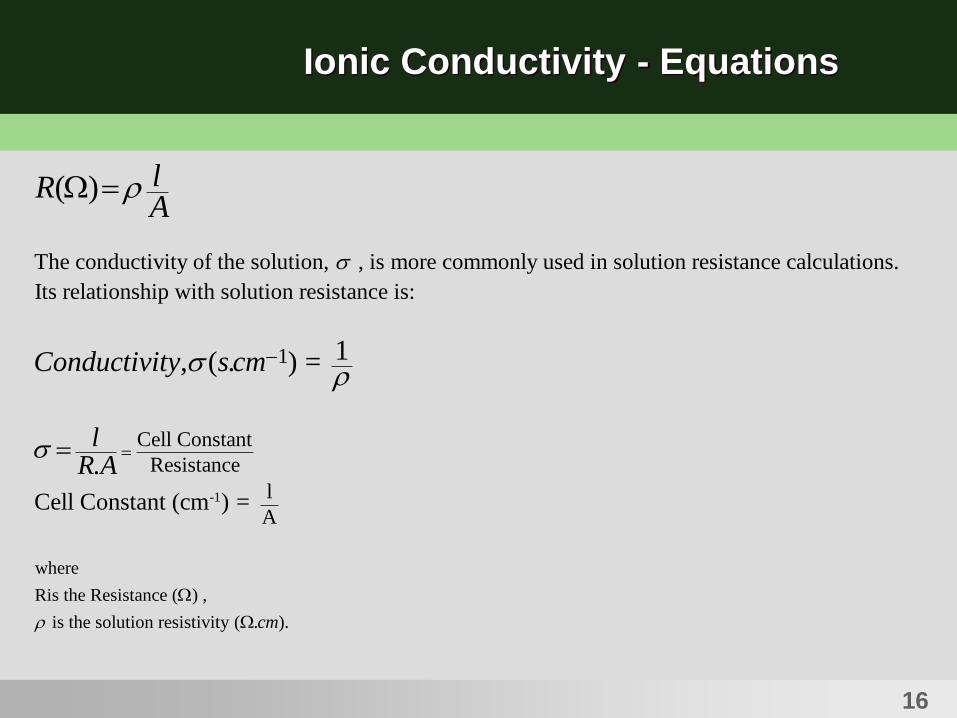
Ionic Conductivity - Equations
1
Cell Constant
Res
The conductivity of the solution, , is more commonly used in solution resistance calculations.
Its relationship with solution resistance is:
.
1, ( . ) =
( )
lR A
Conductivity s cm
lRA
-1
where
Ris the Resistance ( ) ,
is the solution resistivity ( . ).
istance
l
ACell Constant (cm ) =
cm
17
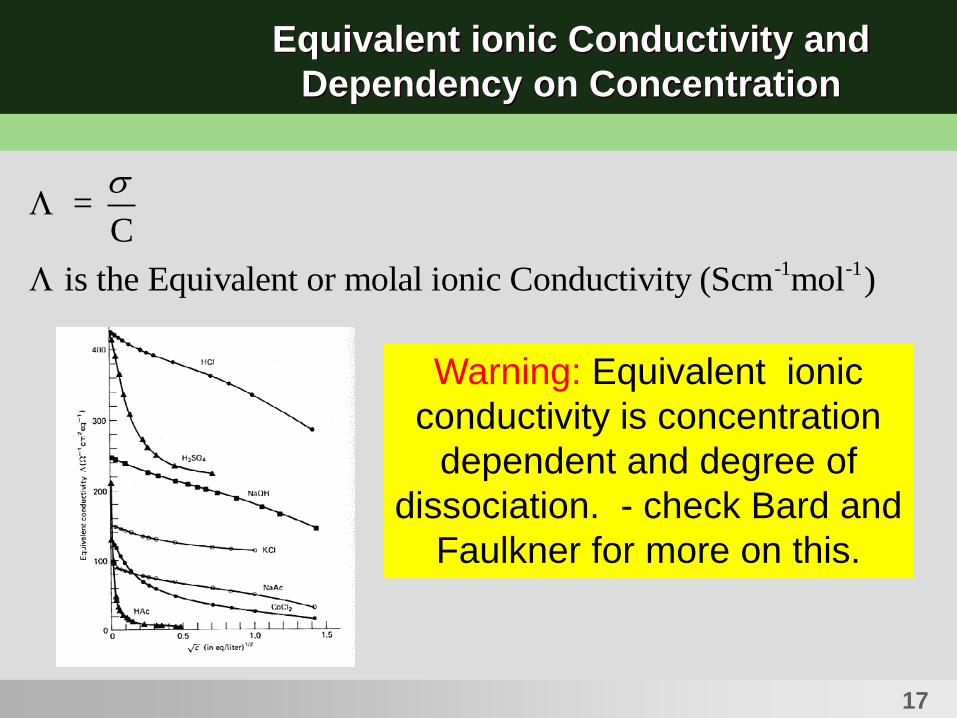
Equivalent ionic Conductivity and
Dependency on Concentration
-1 -1
= C
is the Equivalent or molal ionic Conductivity (Scm mol )
Warning: Equivalent ionic
conductivity is concentration
dependent and degree of
dissociation. - check Bard and
Faulkner for more on this.
18
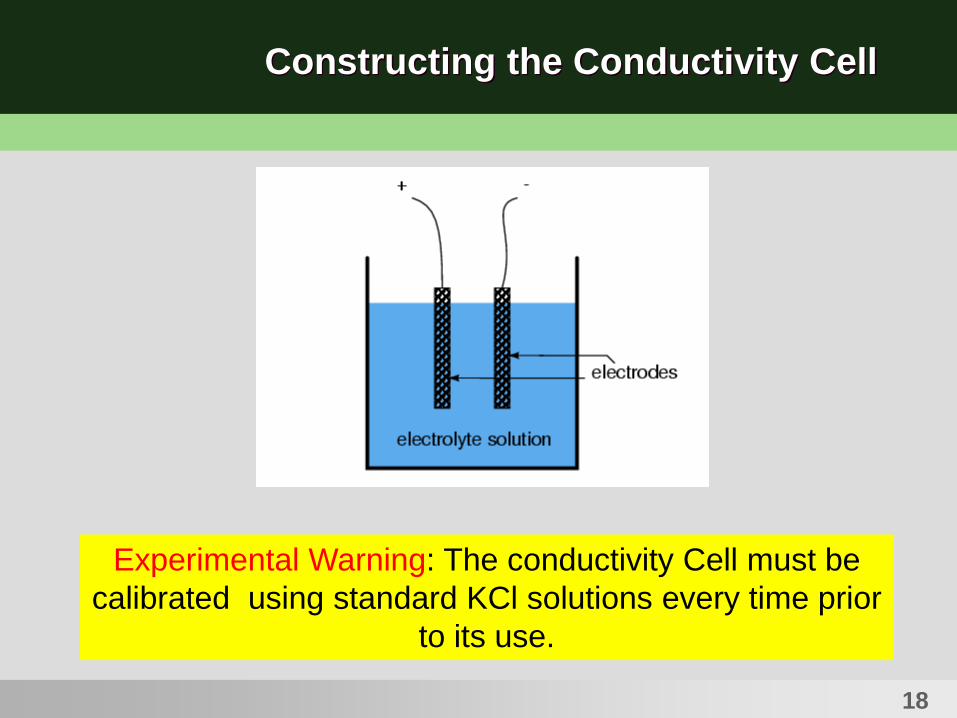
Constructing the Conductivity Cell
Experimental Warning: The conductivity Cell must be
calibrated using standard KCl solutions every time prior
to its use.
19
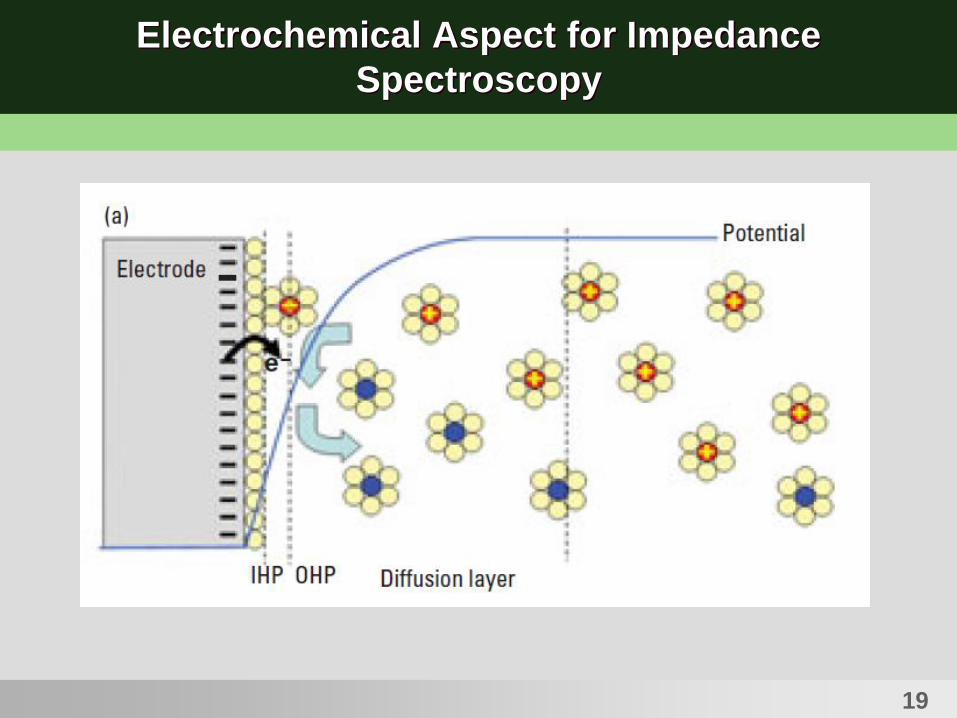
Electrochemical Aspect for Impedance
Spectroscopy
20
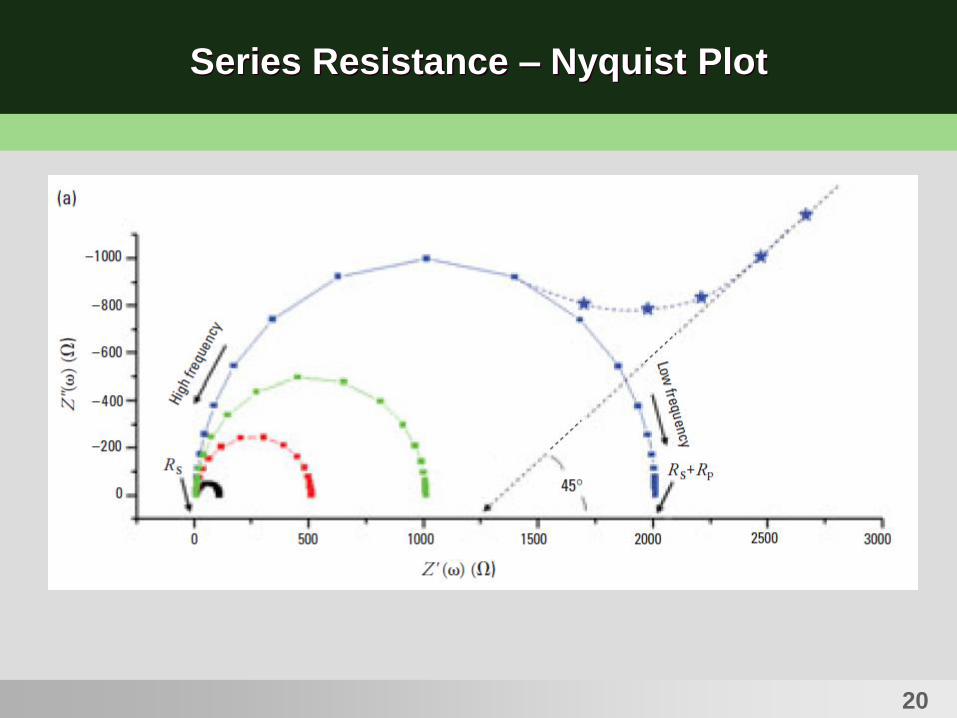
Series Resistance – Nyquist Plot
21
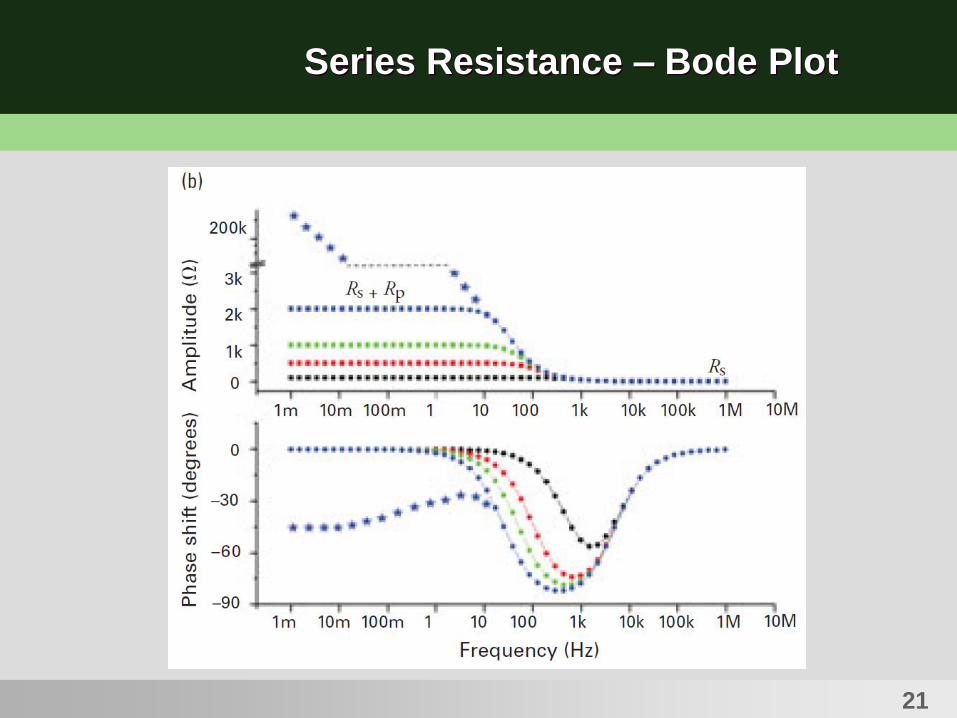
Series Resistance – Bode Plot
22
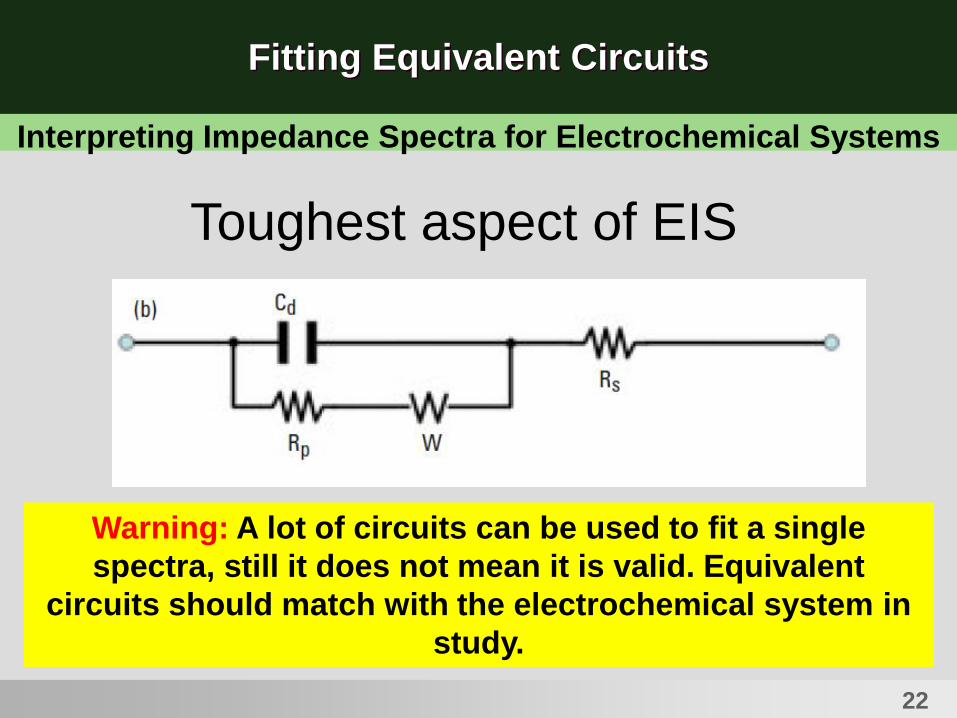
Fitting Equivalent Circuits
Interpreting Impedance Spectra for Electrochemical Systems
Toughest aspect of EIS
Warning: A lot of circuits can be used to fit a single
spectra, still it does not mean it is valid. Equivalent
circuits should match with the electrochemical system in
study.
23
References
• Electrochemical Methods Fundamentals and Applications – Bard
and Faulkner.
• Su-Moon Park et al., Analytical Chemistry, (2003), p. 453A
• J. R. Macdonald Annals of Biomedical Engineering 20, pp 289 –
305
• Impedance spectroscopy : emphasizing solid materials and
systems / edited by J. Ross Macdonald; Wiley: New York :, 1987.
• Orazem, M. E. Electrochemical impedance spectroscopy / Mark E.
Orazem, Bernard Tribollet; Wiley: Hoboken, N.J. :, 2008
• http://www.che.ufl.edu/orazem/pdf-
files/Orazem%20EIS%20Spring%202008.pdf (Mark Orazem
Presentation)
24Center for Electrochemical Engineering Research, Ohio University
Questions