Embed Size (px)
Citation preview

Curriculum Unit 86.05.03 1 of 21
Curriculum Units by Fellows of the Yale-New Haven Teachers Institute1986 Volume V: The Measurement of Adolescents, II
AN INTRODUCTION TO ELEMENTARY STATISTICSCurriculum Unit 86.05.03by Lauretta J. Fox
Introduction
Statistics have become an important part of everyday life. We are confronted by them in newspapers andmagazines, on television and in general conversations. We encounter them when we discuss the cost of living,unemployment, medical breakthroughs, weather predictions, sports, politics and the state lottery. Althoughwe are not always aware of it, each of us is an informal statistician. We are constantly gathering, organizingand analyzing information and using this data to make judgments and decisions that will affect our actions.
In this unit of study we will try to improve the students’ understanding of the elementary topics included instatistics. The unit will begin by discussing terms that are commonly used in statistics. It will then proceed toexplain and construct frequency distributions, dot diagrams, histograms, frequency polygons and cumulativefrequency polygons. Next, the unit will define and compute measures of central tendency including the mean,median and mode of a set of numbers. Measures of dispersion including range and standard deviation will bediscussed. Following the explanation of each topic, a set of practice exercises will be included.
There are several basic objectives for this unit of study. Upon completion of the unit, the student will be ableto:
—define basic terms used in statistics.
—compute simple measures of central tendency.
—compute measures of dispersion.
—construct tables and graphs that display measures of central tendency.
The material developed here may be used as a whole unit, or parts of it may be extracted and taught invarious courses. The elementary concepts may be incorporated into general mathematics classes in gradesseven to twelve, and the more difficult parts may be used in advanced algebra classes in the high school.Depending upon the amount of material used, several days or several weeks may be allotted to teach theunit.

Curriculum Unit 86.05.03 2 of 21
Definitions of Statistical Terms
Statistics is a branch of mathematics in which groups of measurements or observations are studied. Thesubject is divided into two general categories— descriptive statistics and inferential statistics . In descriptivestatistics one deals with methods used to collect, organize and analyze numerical facts. Its primary concern isto describe information gathered through observation in an understandable and usable manner. Similaritiesand patterns among people, things and events in the world around us are emphasized. Inferential statisticstakes data collected from relatively small groups of a population and uses inductive reasoning to makegeneralizations, inferences and predictions about a wider population.
Throughout the study of statistics certain basic terms occur frequently. Some of the more commonly usedterms are defined below:
A population is a complete set of items that is being studied. It includes all members of the set. The set mayrefer to people, objects or measurements that have a common characteristic. Examples of a population are allhigh school students, all cats, all scholastic aptitude test scores.
A relatively small group of items selected from a population is a sample . If every member of the populationhas an equal chance of being selected for the sample, it is called a random sample . Examples of a sample areall algebra students at Central High School, or all Siamese cats.
Data are numbers or measurements that are collected. Data may include numbers of individuals that make upthe census of a city, ages of pupils in a certain class, temperatures in a town during a given period of time,sales made by a company, or test scores made by ninth graders on a standardized test.
Variables are characteristics or attributes that enable us to distinguish one individual from another. They takeon different values when different individuals are observed. Some variables are height, weight, age and price.Variables are the opposite of constants whose values never change.
Exercises:
1.) Tell whether each of the following is a variable or a constant:a.) Scores obtained on a final examination by members of a statistics class.b.) The cost of clothing purchased each year by secretaries.c.) The number of days in the month of June.d.) The time it takes to do grocery shopping.e.) The age at which one may become a voter in the United States of America.2.) Fill in the missing word to make a true statement.a.) ____ are measurements obtained by observation.b.) A ____ is a complete set of items.c.) ________takes data collected from a small group and makes predictions about a wider sample.d.) When every member of a set has an equal chance of being selected as part of a sample, the

Curriculum Unit 86.05.03 3 of 21
sample is called a ____ ____.e.) Characteristics that vary from one individual to another are ____ .f.) The study that deals with methods of collecting, organizing and analyzing data is ____ ____.
Frequency Distributions
Groups of data have little value until they have been placed in some kind of order. Usually measurements arearranged in ascending or descending order. Such a group is an array or distribution . A frequency distributionis a table in which measurements are tallied and the frequency or total number of times that each item occursis recorded.
Example 1 :
The frequency distribution below shows data obtained in a survey asking a group of people to name theirfavorite among several kinds of cars. Use the table to answer the following questions:
a.) How many people are included in the sample?b.) What percent of the people surveyed preferred Chevrolets?c.) What is the ratio of people who prefer Oldsmobiles to those who prefer Buicks?d.) If the number of Subarus were increased by three, what would the percent of increase be?
(figure available in print form)

Curriculum Unit 86.05.03 4 of 21
Solution:
a.) 25 + 18 + 15 + 12 + 10 = 80 80 people are included in the survey.b.) 25 Ö 80 = .3125 = 31.25% 31.25% of the people surveyed preferred Chevrolets.c.) 15:10 = 3:2 The ratio of people who prefer Oldsmobiles to those who prefer Buicks is 3:2.d.) 3:18=x:100 1:6 =x:100 6x=100 x =16 2/3 The percent of increase is 16 2/3%.
When the number of measurements in a survey is large, or when the range, that is, the difference betweenthe highest and lowest measurements in the survey, is great, it is usually more efficient to arrange the data inintervals and show the number of items within each group. The number of intervals used in a frequencydistribution may vary. However, it has been found that ten to twenty intervals are most practical.
The following steps may be used to set up a frequency distribution:
1.) Select an appropriate number of intervals for the given data.2.) Find the difference between the highest and lowest measurements in the data. Add one to theresult end divide the sum by the number of intervals. If the quotient is not an integer, round it tothe nearest odd integer. This will be the size or width of each interval and will be designated bythe symbol w.3.) The lowest number in the bottom interval will be the lowest measurement in the given data.Add (w-1) to this measurement to obtain the highest number in the bottom interval. The nextinterval begins at the integer following the highest number in the bottom group. Continue in thismanner for each successive higher interval until every measurement has been placed in itsproper group.4.) After the intervals have been established, a tally mark is placed by the interval for eachmeasurement in the group. The frequency, or number of measurements in each interval, isindicated with a numeral.
Example 2 :
Make a frequency distribution of the following scores obtained by 40 students on a mathematics test.86 82 56 73 87 89 72 86 88 7672 69 84 85 62 97 70 78 84 9370 60 91 76 83 94 65 72 92 8198 78 88 76 96 89 90 83 74 80

Curriculum Unit 86.05.03 5 of 21
Solution :
Use ten intervals.
Highest Score—Lowest Score = 98Ð56 = 42 (42 + 1) = 10 = 43 $dv$ 10 = 4.3 Round to 5. The size of eachinterval is 5.
Scores Tall y Frequency96Ð100 111 391Ð95 1111 486Ð90 111 881Ð85 11 776Ð80 1 671Ð75 1111 566Ð70 111 361Ð65 11 256 Ð60 11 2Although it is not necessary, it is often helpful for use in further analysis to have additional information in afrequency distribution. This additional information may include the midpoint of each interval, the percentageof the numbers in the frequency column relative to the total frequencies, the cumulative frequency ofsuccessive summation of entries in the frequency column, and the percentage of the cumulative frequency.
Example 3 :
In the frequency distribution for example 2 find (a) the midpoint of each interval; (b) the percentage of eachfrequency relative to the total frequencies; (c) the cumulative frequency; and (d) the percentage ofcumulative frequency relative to the total frequencies.
Solution :
(a) Since the width of each interval is 5, the third score is the midpoint of the interval. Forexample, the lowest interval contains the scores 56, 57, 58, 59, 60. 58 is the midpoint of thisinterval.(b) To find the percentage of each frequency divide the frequency by the total number ofmeasurements and change the resulting decimal to a percent. The frequency of the lowestinterval is 2. The total number of measurements is 40. 2 $dv$ 40 = .05 = 5%(c) The cumulative frequency at any interval may be obtained by successively adding thefrequencies of all the groups from the lowest interval up to and including the given interval. Thecumulative frequency of the interval 76-80 is 2+ 2+ 3+ 5+ 6 =18.(d) To obtain the percentage of cumulative frequency relative to the total of the frequencies,divide the cumulative frequency by the total number of measurements. Change the resultingdecimal to a percent. The percentage of the cumulative frequency in the interval 76-80 is 18 $dv$40 = .45= 45%. This figure may also be found by adding the percentage of frequency of allgroups from the lowest up to and including the given interval.

Curriculum Unit 86.05.03 6 of 21
% of Cumulative % ofScores Midpoint Frequency Frequency Frequency Cumulative
Frequency99-100 98 3 7.5 40 100.09195 93 4 10.0 37 92.58690 88 8 20.0 33 82.58185 83 7 17.5 25 62.57680 78 6 15.0 18 45.07175 73 5 12.5 12 30.06670 68 3 7.5 7 17.56165 63 2 5.0 4 10.05660 58 2 5.0 2 5.0
Exercises :
1.) Ask the students in each of your classes which of the following colors they prefer—red, blue,yellow, green, brown, or purple. Construct a frequency distribution to display the results of yoursurveya.) How many people are included in the sample?
b.) What percent of the people surveyed prefer yellow? red? purple?
c.) What is the ratio of people who prefer green to those who prefer blue?
d.) What is the most popular color?
e.) What is the least popular color?
f.) If the number of people who prefer red were decreased by 2, what would be the percent of decrease?
2.) Tally the following scores in a frequency distribution. Do not use grouping.
84 98 92 88 91 91 85 80 84 9392 80 91 84 87 85 84 80 87 95
3.) Make a frequency distribution of the following scores obtained by a basketball team.
72 104 95 93 96 76 105 10088 62 79 78 87 78 89 81

Curriculum Unit 86.05.03 7 of 21
110 68 96 106 80 87 86 84102 84 96 88 82 83 92 8787 85 108 90 94 98 78 80a.) Use ten intervals and display the midpoint of each interval.
b.) Calculate the percentage of frequency of each interval.
c.) Find the cumulative frequency for each interval.
d.) Calculate the percentage of each cumulative frequency relative to the total of the frequencies.
Dot Diagrams
Many people find it easier to obtain information from pictures than from written material. Statisticians displaymathematical relationships with diagrams and graphs. From these pictures numerical data can be summarizedclearly and easily.
When the data of a frequency distribution have not been grouped in intervals, they can be represented on adot diagram . A dot diagram illustrates the pattern of a distribution. It clearly shows whether the data arespread out evenly or if they tend to cluster about any point.
To construct a dot diagram list the measurements, from lowest to highest, horizontally across the bottom ofthe graph. On the left side vertically list the frequencies or number of times that the measurements occur. Foreach time a measurement occurs place a dot in the column above the measurement.
Example :
Construct a dot diagram to represent the following distribution of daily temperature highs in twenty-four citiesof the United States.67 68 69 70 70 71 71 7172 72 72 74 74 74 74 7676 76 76 80 80 80 84 85
Solution :
(figure available in print form)
Exercises :
1.) Twenty workers were rated on a scale of 1 to 10 for efficiency. Construct a dot diagram torepresent the following ratings: 7, 8, 9, 4, 5, 5, 7, 10, 6, 8, 7, 7. 5, 6, 9, 6.2.) Draw a dot diagram to represent the following scores received on a spelling test: 98, 100, 78,75, 68, 62, 75, 80, 82, 94, 80, 72, 75, 85, 85, 80, 70, 82, 78, 78, 72, 70, 90, 65.3.) The distribution of heights of fifteen children is given below. Show the distribution on a dotdiagram.
Curriculum Unit 86.05.03 8 of 21
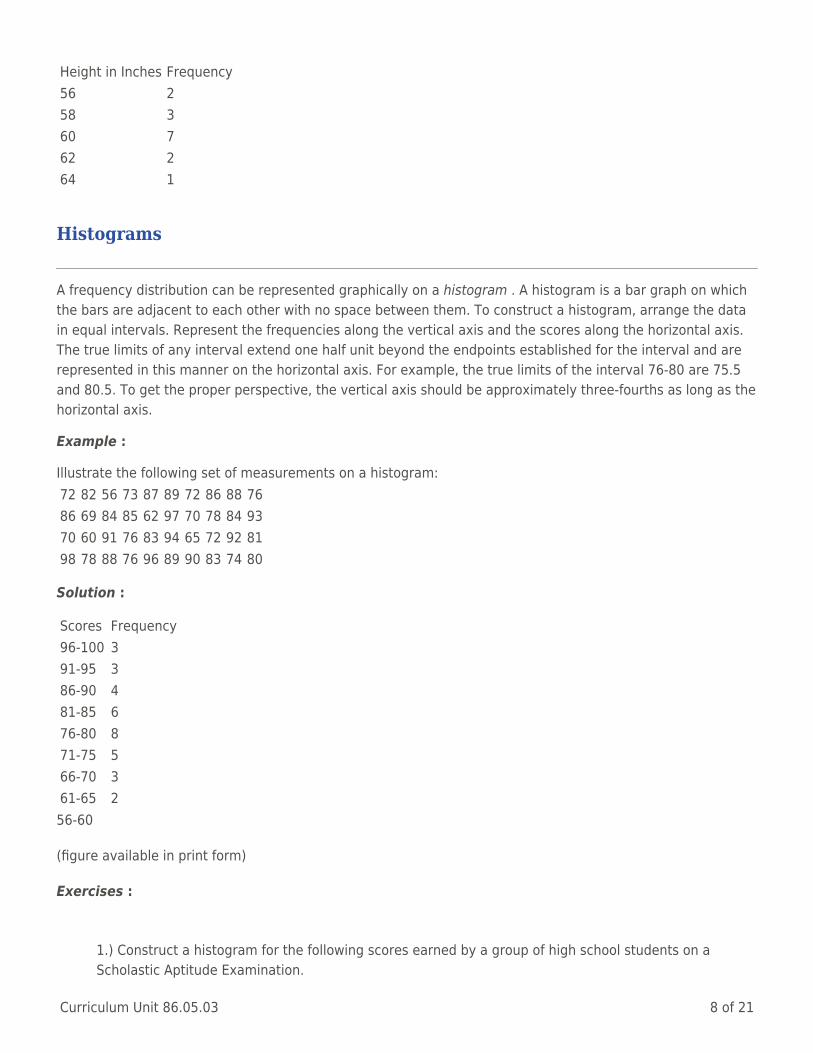
Height in Inches Frequency56 258 360 762 264 1
Histograms
A frequency distribution can be represented graphically on a histogram . A histogram is a bar graph on whichthe bars are adjacent to each other with no space between them. To construct a histogram, arrange the datain equal intervals. Represent the frequencies along the vertical axis and the scores along the horizontal axis.The true limits of any interval extend one half unit beyond the endpoints established for the interval and arerepresented in this manner on the horizontal axis. For example, the true limits of the interval 76-80 are 75.5and 80.5. To get the proper perspective, the vertical axis should be approximately three-fourths as long as thehorizontal axis.
Example :
Illustrate the following set of measurements on a histogram:72 82 56 73 87 89 72 86 88 7686 69 84 85 62 97 70 78 84 9370 60 91 76 83 94 65 72 92 8198 78 88 76 96 89 90 83 74 80
Solution :
Scores Frequency96-100 391-95 386-90 481-85 676-80 871-75 566-70 361-65 256-60
(figure available in print form)
Exercises :
1.) Construct a histogram for the following scores earned by a group of high school students on aScholastic Aptitude Examination.
Curriculum Unit 86.05.03 9 of 21
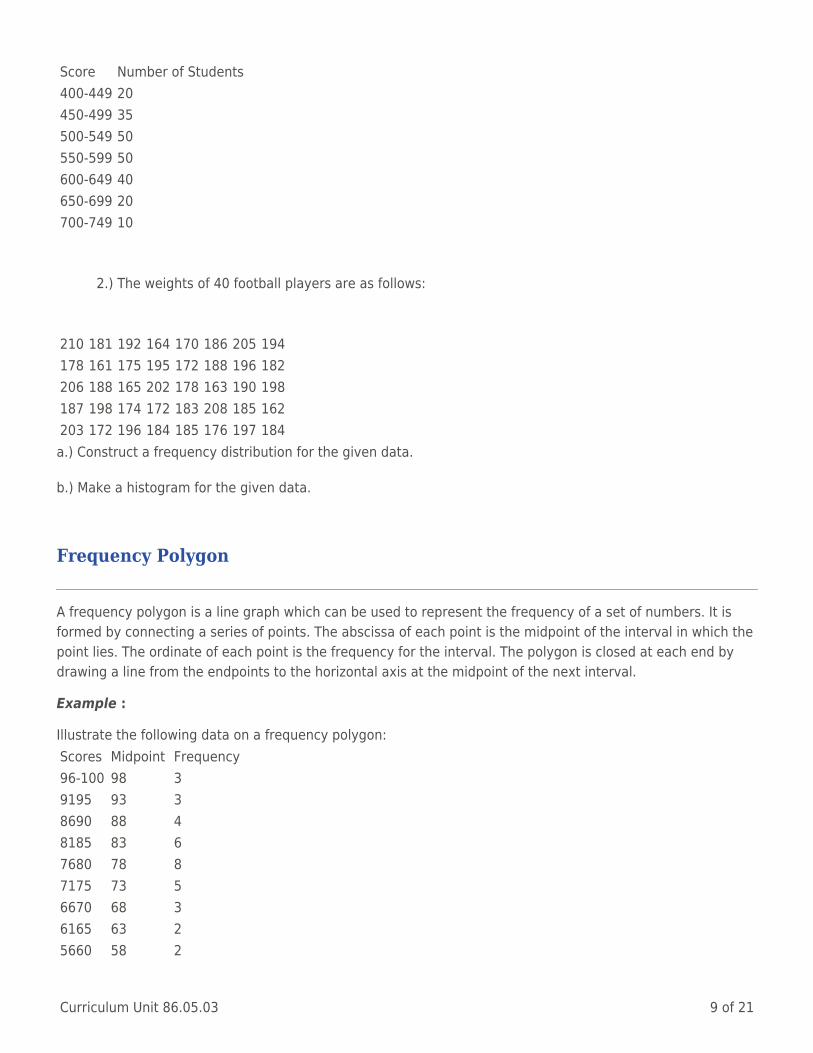
Score Number of Students400-449 20450-499 35500-549 50550-599 50600-649 40650-699 20700-749 10
2.) The weights of 40 football players are as follows:
210 181 192 164 170 186 205 194178 161 175 195 172 188 196 182206 188 165 202 178 163 190 198187 198 174 172 183 208 185 162203 172 196 184 185 176 197 184a.) Construct a frequency distribution for the given data.
b.) Make a histogram for the given data.
Frequency Polygon
A frequency polygon is a line graph which can be used to represent the frequency of a set of numbers. It isformed by connecting a series of points. The abscissa of each point is the midpoint of the interval in which thepoint lies. The ordinate of each point is the frequency for the interval. The polygon is closed at each end bydrawing a line from the endpoints to the horizontal axis at the midpoint of the next interval.
Example :
Illustrate the following data on a frequency polygon:Scores Midpoint Frequency96-100 98 39195 93 38690 88 48185 83 67680 78 87175 73 56670 68 36165 63 25660 58 2

Curriculum Unit 86.05.03 10 of 21
Solution :
(figure available in print form)
Exercises :
1.) The following table shows the weekly wages earned by workers in a local hospital:
Number of People 11 11 15 18 13 12 10Weekly Wage $140 $200 $180 $160 $190 $150 $170a.) Draw a histogram for the given data.
b.) Construct a frequency polygon for the given data.
2.) A baseball team made the following number of hits in a recent game:
Inning 1 2 3 4 5 6 7 8 9Number of Hits 1 4 2 3 3 5 3 2 1a.) Draw a dot diagram for the given data.
b.) Make a histogram for the given data.
c.) Construct a frequency polygon for the given data.
3.) The students in an English class received the following scores on a test:
60 95 85 100 8156 87 80 62 7573 64 69 86 9382 77 91 58 6976 94 72 88 78a.) Make a frequency distribution for the given scores.
b.) Draw a histogram to represent the scores.
c.) Construct a frequency polygon for the given data.

Curriculum Unit 86.05.03 11 of 21
Cumulative Frequency Polygon
Another method of graphical representation is the cumulative frequency polygon . The cumulative frequencypolygon is a line graph which is used to picture cumulative frequencies of a set of numbers. The abscissa ofeach point is the upper limit of an interval in a frequency distribution. The ordinate of each point is thecorresponding cumulative frequency. The graph starts at a frequency of zero for a group below the lowestinterval in the distribution.
Exam ple :
Construct a cumulative frequency polygon to represent the following scores obtained by 40 students on amathematics test.86 82 56 73 87 89 72 86 88 7672 69 84 85 62 97 70 78 84 9370 60 91 76 83 94 65 72 92 8198 78 88 76 96 89 90 83 74 80
Solution :
Make a frequency distribution for the scores, then draw the graph.Cumulative % of Cumulative
Scores Frequency Frequency Frequency96-100 3 40 100.09195 4 37 92.58690 8 33 82.58185 7 25 62.57680 6 18 45.07175 5 12 30.06670 3 7 17.56165 2 4 10.05660 2 2 5.0(figure available in print form)
For some purposes the cumulative frequency polygon is very valuable. On the right side of the polygon is ascale of percent that parallels the scale of cumulative frequency. On the percent scale you read 25corresponding to an abscissa of 72. This means that 25% of the scores were 72 or lower. The figure 72 iscalled the 25th percentile . The nth percentile is that score below which n percent of the scores in thedistribution will fall.
To find the score that corresponds to a percentile on the graph, draw a horizontal line through the desiredpercent to intersect the cumulative frequency polygon. From the point of intersection draw a vertical line tothe x-axis. The score at the point of intersection of the vertical line and the x-axis corresponds to the requiredpercentile.
The fiftieth percentile is the median or middle score in a set of measurements. The 25th percentile is calledthe lower quartile , and the 75th percentile is the upper quartile .

Curriculum Unit 86.05.03 12 of 21
Exercises :
1.) During one week a dealer sold the following number of cars: Monday 12, Tuesday 15,Wednesday 5, Thursday 6, Friday 10, Saturday 12.
a.) Construct a histogram to represent the given data.
b.) Make a frequency polygon to represent the given data.
c.) Draw a cumulative frequency polygon to represent the given data.
2.) The heights in inches of 50 high school students are:
60 68 74 79 62 75 60 65 61 6471 72 63 66 71 60 60 73 63 6573 68 76 75 62 76 72 70 69 6278 71 68 62 74 69 67 70 61 6372 67 71 68 62 60 70 69 65 64a.) Group the data into a frequency table.
b.) Construct a histogram to represent the data.
c.) Construct a cumulative frequency polygon.
d.) Find the median height. Find the upper and lower quartiles.
e.) Determine the 8Oth percentile.
3.) Forty students have the following IQ scores:
120 100 115 126 82 108 114 95150 92 140 88 98 116 134 13898 87 110 92 106 96 126 10280 82 100 128 110 100 118 8488 98 94 85 124 90 80 112a.) Group the data into a frequency table.
b.) Construct a cumulative frequency polygon.
c.) Determine the median IQ score and the 7Oth percentile.

Curriculum Unit 86.05.03 13 of 21
Measures of Central Tendency
When statisticians study a group of measurements, they try to determine which measure is mostrepresentative of the group. The score about which most of the other scores tend to cluster is a measure ofcentral tendency . Three measures of central tendency are the mode, the median and the mean.
The mode of a set of numbers is the element that appears most frequently in the set. There can be more thanone mode in a set of numbers. A set that has two modes is bimodal , and one that has three modes is trimodal. If no element of a set appears more often than any other element, the set has no mode. The mode is animportant measure for business people. It tells them what items are most popular with consumers.
Example 1 :
Find the mode of the following set of numbers: 34, 26, 30, 34, 28, 32, 32, 34, 33, 31, 33, 30.
Solution :
Element Frequency26 128 130 231 132 233 234 3The number 34 occurs most frequently, hence 34 is the mode of the set.
Example 2 :
Find the mode of the following set of numbers: 13 17, 14, 20, 18
Solution :
Element Frequency13 117 114 120 118 1No number appears more than any other number in the set. The set has no mode.
Example 3 :
Find the mode of the following set of numbers: 1, 2, 2, 3, 4, 4, 5
Solution :
Element Frequency1 1

Curriculum Unit 86.05.03 14 of 21
2 23 144 25 1The numbers 2 and 4 each appear twice. The set has two modes: 2 and 4.
Another measure of central tendency is the median . When the elements of a set of numbers have beenarranged in ascending order, the number in the middle of the set is the median of the set. The median dividesthe set of data into two equal parts. On a cumulative frequency polygon the median is the 50th percentile. Todetermine which element of a set is the middle number, use the following formula:
Middle Number = (Total Number of Elements + 1); = 2
If the set contains an even number of elements, the median is the average of the two middle numbers.
Example 1 :
The weights of nine children are as follows: 99, 98, 73, 81, 79, 86, 90, 94, 71. Find the median weight.
Solution :
Arrange the weights in order from lowest to highest: 71, 73, 79, 81, 86, 90, 94, 98, 99 (9 + 1) $dv$ 2 = 10$dv$ 2 = 5 The fifth number of the set is the middle number. The median weight is 86.
Example 2 :
Ten students received the following scores on an examination: 96, 68, 78, 82, 87, 74, 80, 70, 86, 84. Find themedian score.
Solution :
Arrange the scores in ascending order: 68, 70, 74, 78, 80, 82, 84, 86, 87, 96.
(10 + 1) Ö 2 = 11 Ö 2 = 5.5
The two middle numbers of the set are the fifth and sixth numbers: 80 and 82.
(80 + 82) Ö 2 = 162 Ö 2 = 81
The median score is 81.
A third, and most widely used, measure of central tendency is the arithmetic mean . The arithmetic mean isthe average of a set of numbers. It is usually denoted by the symbol x. To calculate the arithmetic mean of aset of numbers, add the members of the set and divide the sum by the number of items in the set.
Example :
Find the arithmetic mean of the following set of numbers: 25, 15, 20, 20, 10.
Solution :
(25 + 15 + 20 + 30 + 10) Ö 5 = 100 Ö 5 = 20

Curriculum Unit 86.05.03 15 of 21
The arithmetic mean of the set is 20.
Sometimes an item appears more than once in a set of measures. To find the arithmetic mean of a set ofmeasures when some items occur several times, multiply each item in the set by Its frequency and divide thesum of these products by the total number of items in the set.
Example :
Find the arithmetic mean of the following numbers: 28, 24, 22, 24, 26, 26, 22, 24, 22, 28, 30, 24.
Solution :
Item Frequency Product22 3 6624 4 9626 2 5228 2 5630 1 30Sum of Products = 66 + 96 + 52 + 56 + 30 = 300
Total Number of Items = 3 + 4 + 2 + 2 + 1 = 12
Sum of Products $dv$ Total # of Items = 300 $dv$ 12 = 25
The arithmetic mean is 25.
When the data have been arranged in intervals in a frequency distribution, the arithmetic mean is obtained inthe following manner:
1.) Multiply the midpoint of each interval by the frequency of the interval.2.) Find the sum of the products obtained in step 1.3.) Divide the sum obtained in step 2 by the total number of items in the distribution.
The formula used to find the arithmetic mean is:
n
x = 1/ni å1 xifi
x ; arithmetic mean xi = midpoint of the intervaln = number of items in fi = frequency of the intervalthe distribution = sum

Curriculum Unit 86.05.03 16 of 21
Example :
Find the arithmetic mean for the following distribution:Scores Midpoint Frequency xifi96-100 98 3 29491-95 93 4 37286-90 88 8 68481-85 83 7 58176-80 78 6 46871-75 73 5 36566-70 68 3 20461-65 63 2 12656-60 58 2 116
Solution
n = 3 + 4 + 8+ 7+ 6+ 5+ 3+ 2 + 2 = 40
40
åxifi= 294 + 372 + 684 + 581 + 468 + 365+ i= 1 204 + 126 + 116 = 3210
40
x = 1/n å xifi 1/40 x 3210 = 3210/40 = 80.25
i = 1
The arithmetic mean of the distribution is 80.25.
Exercises :
1.) Ten employees of a department store earn the following weekly wages: $200, $150, $160,$125, $160, $150, $180, $130, $170 $150
a.) Find the average weekly income.
b.) What is the median wage?
c.) Find the mode.
2.) Write mean, median, or mode to complete the sentence.
a.) 7, 13, 8, 5, 9, 12. The ____ is 9.
Curriculum Unit 86.05.03 17 of 21
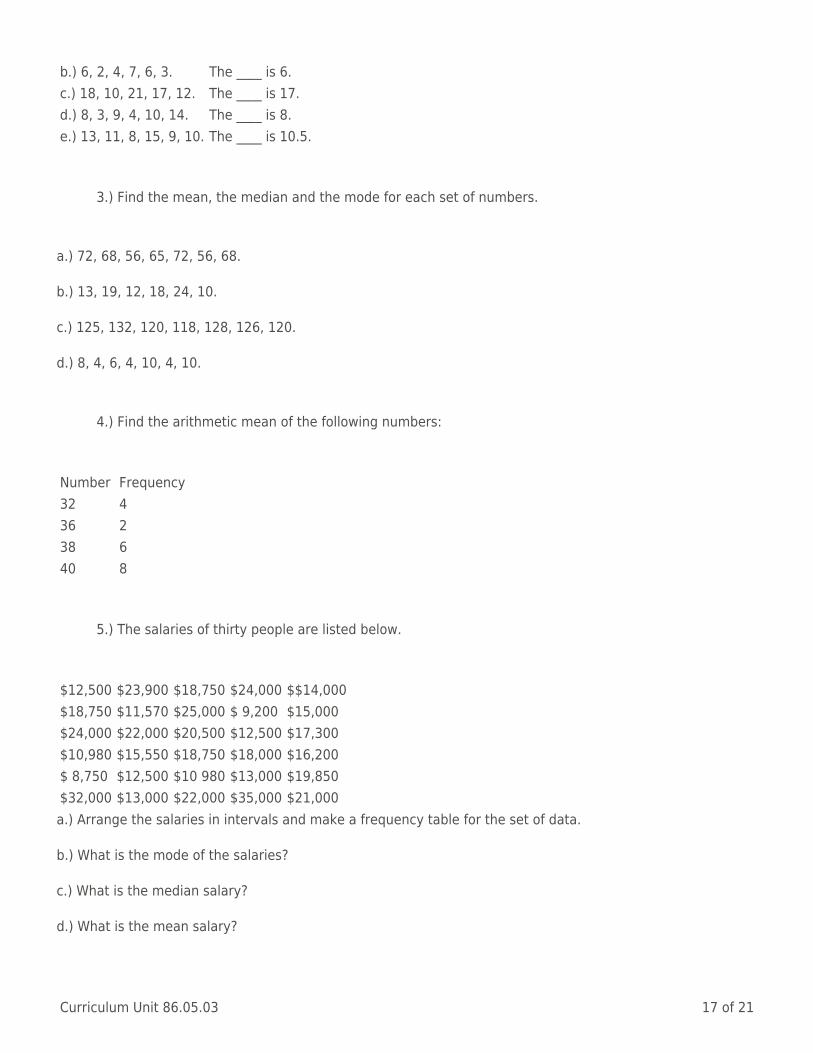
b.) 6, 2, 4, 7, 6, 3. The ____ is 6.c.) 18, 10, 21, 17, 12. The ____ is 17.d.) 8, 3, 9, 4, 10, 14. The ____ is 8.e.) 13, 11, 8, 15, 9, 10. The ____ is 10.5.
3.) Find the mean, the median and the mode for each set of numbers.
a.) 72, 68, 56, 65, 72, 56, 68.
b.) 13, 19, 12, 18, 24, 10.
c.) 125, 132, 120, 118, 128, 126, 120.
d.) 8, 4, 6, 4, 10, 4, 10.
4.) Find the arithmetic mean of the following numbers:
Number Frequency32 436 238 640 8
5.) The salaries of thirty people are listed below.
$12,500 $23,900 $18,750 $24,000 $$14,000$18,750 $11,570 $25,000 $ 9,200 $15,000$24,000 $22,000 $20,500 $12,500 $17,300$10,980 $15,550 $18,750 $18,000 $16,200$ 8,750 $12,500 $10 980 $13,000 $19,850$32,000 $13,000 $22,000 $35,000 $21,000a.) Arrange the salaries in intervals and make a frequency table for the set of data.
b.) What is the mode of the salaries?
c.) What is the median salary?
d.) What is the mean salary?
Curriculum Unit 86.05.03 18 of 21
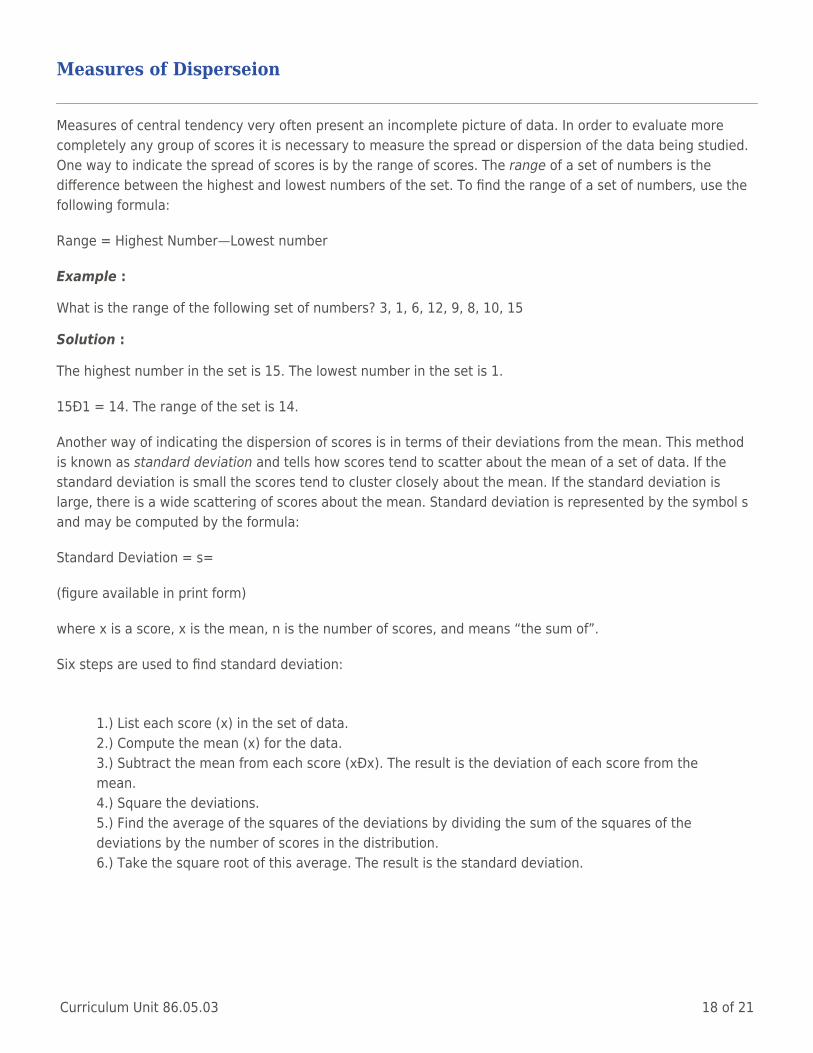
Measures of Disperseion
Measures of central tendency very often present an incomplete picture of data. In order to evaluate morecompletely any group of scores it is necessary to measure the spread or dispersion of the data being studied.One way to indicate the spread of scores is by the range of scores. The range of a set of numbers is thedifference between the highest and lowest numbers of the set. To find the range of a set of numbers, use thefollowing formula:
Range = Highest Number—Lowest number
Example :
What is the range of the following set of numbers? 3, 1, 6, 12, 9, 8, 10, 15
Solution :
The highest number in the set is 15. The lowest number in the set is 1.
15Ð1 = 14. The range of the set is 14.
Another way of indicating the dispersion of scores is in terms of their deviations from the mean. This methodis known as standard deviation and tells how scores tend to scatter about the mean of a set of data. If thestandard deviation is small the scores tend to cluster closely about the mean. If the standard deviation islarge, there is a wide scattering of scores about the mean. Standard deviation is represented by the symbol sand may be computed by the formula:
Standard Deviation = s=
(figure available in print form)
where x is a score, x is the mean, n is the number of scores, and means “the sum of”.
Six steps are used to find standard deviation:
1.) List each score (x) in the set of data.2.) Compute the mean (x) for the data.3.) Subtract the mean from each score (xÐx). The result is the deviation of each score from themean.4.) Square the deviations.5.) Find the average of the squares of the deviations by dividing the sum of the squares of thedeviations by the number of scores in the distribution.6.) Take the square root of this average. The result is the standard deviation.

Curriculum Unit 86.05.03 19 of 21
Example :
Compute the standard deviation for the scores: 2, 3, 4, 5, 6, 7, 8
Solution
(figure available in print form)
The standard deviation is a number that is used to compare scores in a distribution. If the mean of a group oftest scores is 75, and the standard deviation is 10, a person who receives a score of 85 is one standarddeviation above the mean. If the mean of another group of test scores is 80, and the standard deviation is 3, aperson who receives a score of 83 is one standard deviation above the mean. This person has done equallywell, with respect to the other class members, as the person who received 85 on the first test.
Exercises :
1.) Compute the range for the following sets of scores:
a.) 24, 15, 19, 29, 24, 22
b.) 113, 98, 107, 102, 123, 110
c.) 72.9, 75.6, 74.3, 86.1, 80, 82.7
d.) 56, 72, 98, 64, 87, 91, 22
2.) Compute the standard deviations for the following sets of scores:
a.) 26, 18, 19, 29, 20, 26
b.) 111, 98, 107, 103, 126
c.) 72.9, 75.6, 74.3, 86.1, 80, 82.7
3.) On an arithmetic test the mean was 78 and the standard deviation was 8. How many standarddeviations from the mean was each of the following scores? 86, 74, 94, 80, 98, 70, 62

Curriculum Unit 86.05.03 20 of 21
Bibliography for Teachers
Coxford, Arthur F., and Payne, Joseph N. HBJ Algebra 2 with Trigonometry . New York: Harcourt Brace Jovanovich, Incorporated,1983.
Algebraic skills and concepts are applied in each of eight “Using Statistics” lessons. The problem solving techniques illustratedinvolve organizing data in a table and graphing the data in order to draw a conclusion.
Downing, Douglas, and Clark, Jeff. Statistics the Easy Way . Woodbury, New York: Barron’s Educational Series, Incorporated, 1983.
This book is clearly organized and contains practical information written simply for rapid learning. It is a good overview of the subjectwith numerous examples and exercises.
Kline, William E., et al. Foundations of Advanced Mathematics . Second Edition. New York: American Book Company, 1965.
A fine textbook for high school students who are studying advanced algebra and trigonometry. A chapter on statistics and probabilityis included.
Mendenhall, William. Introduction to Probability and Statistics . Fourth Edition. North Scituate, Massachusetts: Duxbury Press, 1975.
The author provides a cohesive, connected presentation of statistics that identifies inference as its objective and stresses therelevance of statistics in learning about the world in which we live.
Runyon, Richard P., and Haber, Audrey. Fundamentals of Behavioral Statistics . Fifth Edition. Reading, Massachusetts: Addison-Wesley Publishing Company, 1984.
This text provides excellent resource material on statistics for teachers.
Stein, Edwin. Fundamentals of Mathematics . Modern Edition. Boston: Allyn and Bacon, Incorporated, 1960.
A comprehensive textbook on contemporary general mathematics for the junior and senior high schools. It contains all the basictopics of mathematics and includes computational practice and related enrichment materials. It is ideal for use in consumermathematics and shop mathematics classes in the high school.
White, Myron R. Advanced Algebra . Boston: Allyn and Bacon, Incorporated, 1961.
A good text for twelfth year mathematics students. The subject matter is flexible and easily adapted to individual and group needs.Exercises are divided into two groups: 1) those that represent minimum essentials and should be required of all students, end 2)those that present an additional challenge.
Willoughby, Stephen S., and Vogel, Bruce R. Probability end Statistics . Morristown, New Jersey: Silver Burdett Company, 1968.
An excellent reference book for teachers. It is meant to be used for a one semester, pre-calculus course in probability and statistics.

Curriculum Unit 86.05.03 21 of 21
Reading List for Students
Bolster, L. Carey, and Woodburn, H. Douglas. Mathematics in Life . Second Edition. Palo Alto, California: Scott Foresman andCompany, 1982.
Special features of this text include a pretest of each skill to be presented, lessons on the skills, and a posttest after the skill hasbeen studied. Recreational puzzles are provided to capture the interest of students.
Clark, Gerlena R., et al. Holt General Mathematics . New York: Holt, Rinehart and Winston Publishers, 1982.
A general mathematics book in which emphasis is placed upon basic skill development and practical applications. Worked outexamples guide students through the solution process. Exercise practice is organized according to skill and level of ability.
Johnson, Donovan A., and Glenn, William H. The World of Statistics. St. Louis, Missouri: Webster Publishing Company, 1961.
An excellent booklet that introduces statistics in a very simplified manner.
Nichols, Eugene D., et al. Holt Pre-Algebra . New York: Holt, Rinehart and Winston, Publishers, 1980.
This book is designed to aid students in making the transition from elementary mathematics to algebra. Chapter 10 includes asection on elementary statistics.
——— . Holt Algebra 2 With Trigonometry . New York: Holt, Rinehart and Winston Publishers, 1986.
A complete balanced course for second year algebra students. Special topic pages enrich the course. Included among these are niceintroductions to statistics and probability.
Rowntree, Derek. Statistics Without Tears . New York: Charles Scribner’s Sons, 1981.
A primer for those who want to know about statistics. Basic concepts are explained in words and diagrams without getting involvedin complex calculations.
Willcutt, Robert E., Fraze, Patricia R., and Gardilla, Francis J. Essentials for Algebra Concepts and Skills . Boston: Houghton MifflinCompany, 1984.
Chapter 10 presents a nice introduction to statistics.
https://teachersinstitute.yale.edu©2019 by the Yale-New Haven Teachers Institute, Yale UniversityFor terms of use visit https://teachersinstitute.yale.edu/terms


![An Introduction to Elementary Statistics[1]](https://img.pdfslide.us/doc/110x75/547024d0b4af9f5a628b46d8/an-introduction-to-elementary-statistics1.jpg)