Embed Size (px)
Citation preview
An introduction to
DVS & iGC
Technologies
By Thomas SchmidSupport and Sales Manager SMS
And Dr. Majid NaderiPrincipal Application Specialist
SWST Conference 2010 Geneva

Introduction to SMS
• SMS are regarded as world leaders in developing and engineering DVS and iGC vapour sorption instrumentation for the physical-chemical characterisation of complex solid materials
• SMS have been providing 18 years of world-class scientific and technical solutions and support.
• SMS’s unique scientific techniques and instruments have helped solve difficult problems for leading, pharmaceutical, biomaterial, polymer, catalyst, chemical, cosmetic and food industries worldwide.
• SMS coined the phrase ‘Dynamic Vapour Sorption : DVS’ and iGC-SEA

DVS Introduction

The Effects of Moisture/Vapour
• Water Vapour (humidity) is everywhere
• Water or Solvent -Solid interactions are
important for wide range of industries:
food, pharma, biomaterials, fuel cells,
packaging, high energy materials,
personal care…
• Accurately determining water/vapor
sorption isotherms critical for proper
development and storage of these
materials

What can the DVS do for me?
– How does my material interact with moisture or solvents and temperature in the vapour phase?
– Stability, Performance and Processing issues: Reversible and Irreversible effects of moisture
– Create Moisture Isotherms – i.e. Equilibrium moisture content as a function of %RH
– Heterogeneity? – Identify the Heterogeneity of a sample batch
– Homogeneity? – Identify variance within one sample
– Kinetics – Moisture transport properties, how fast or slow?
– Energy – How strongly is the moisture bound to the material, surface or bulk?
– Identify & Characterise Phase Transition/Changes, e.g. polymorphs, amorphous stoichiometry
– Hydration and Solvate Formation
– Drying Analysis
– Diffusion and Activation Energy
– Heat of Sorption
– Moisture Content? i.e. how much moisture/vapour is taken up or release

DVS Technique
• Dynamic gravimetric Vapor Sorption (DVS)– Fully automatic sorption instrument
– Fast equilibrium: significantly improved kinetics over
static sorption systems
– SMS pioneer in vapor sorption technology
• SMS Gravimetric UltraBalance– Up to 0.1 µg sensitivity
– Allows use of small samples 1-10 mg
– Unrivaled long-term baseline stability
• ‘Real-world’ conditions– Wide range of temperatures: measurement and preheat
conditions
– Wide range of measurement pressures: atmospheric
down to 10-6 Torr (DVS-vacuum)
– Wide range of vapors: water and organic vapors

DVS – General Instrument Schematic

DVS-Advantage
Water & SOLVENTS
Temp: 5 - 60 °°°°C
Pre-heater: up to 350 °°°°C

DVS-Advantage:
The Modular Design
Raman & NIR Raman & NIR Raman & NIR Raman & NIR
PortsPortsPortsPorts
HiHiHiHi----Res. Video Res. Video Res. Video Res. Video
CameraCameraCameraCamera
Pre-Heater (up to 350°C)

Why Organic Solvents?
Unlike water vapour, organic vapour (e.g. Octane) has several advantages:
(1) For example, Octane molecule has DISPERSIVE properties, i.e. Typically wets sample surface
(2) Also, Octane does not interact strongly with material.Therefore, limits unwanted sample recrystallisation
(3) However, If there is NO recrystallisation, then Octane sorption is completely REVERSIBLE
(4) Entire P/Po range can be studied
(5) Organic Vapour (e.g. Octane) kinetics are faster than water

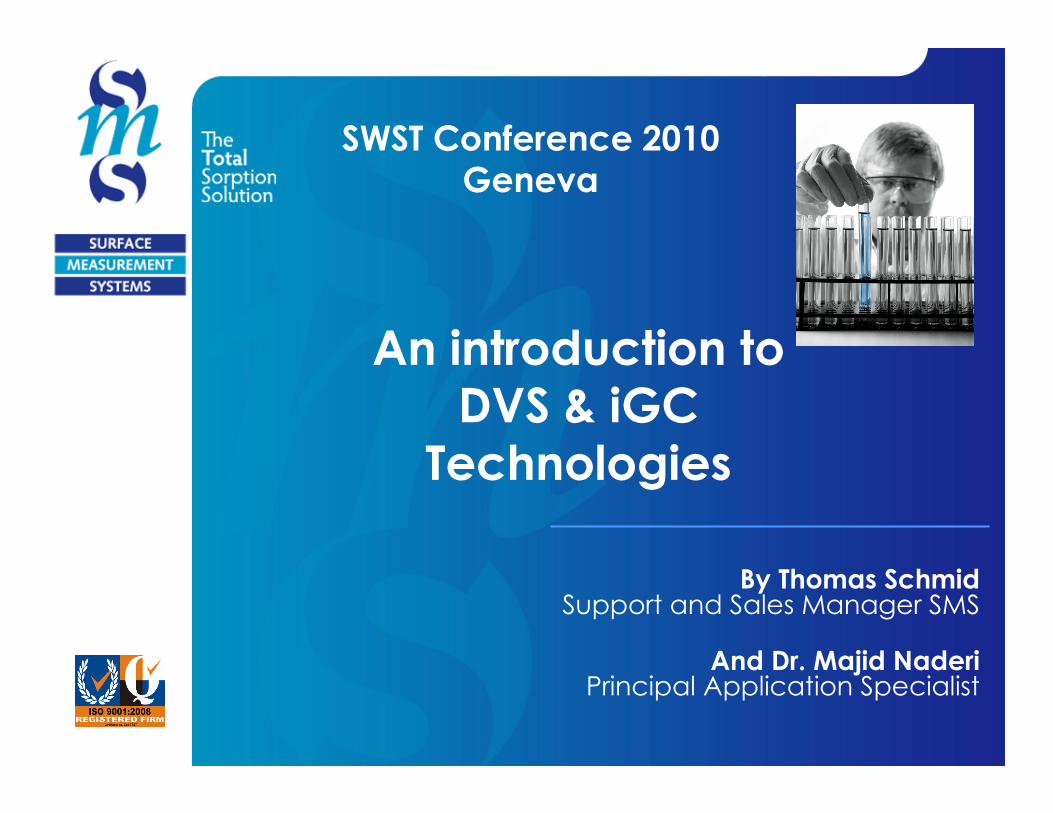
DVS Advantage - Video
• Microscope mounted below sample area
allows for in-situmonitoring of sample
• Up to 200x magnification
• Polarized light option
• Fully digital
• Annotated images
• Adjustable focal point
DVS Camera Assembly
DVS Advantage - Video
Tobacco – 60% RH

DVS Advantage - Video
Carbon Fibers – 0% RH

DVS Advantage - Video
Maltodextrin – 0% RH Maltodextrin – 95% RH, 0 mins.
Maltodextrin – 95% RH, 30 mins. Maltodextrin – 95% RH, 50 mins.

DVS Advantage - Raman
• Two independent ports for additional in-
situmeasurements of sample
• Integrated safety locks
• Trigger from DVS control software
• Raman Spectroscopy
• NIR Spectroscopy
• UV light source
• Other probes
Ports for additional measurements

Example: Amorphous Lactose Phase Change
@ 25ºC
DVS Data
DVS Sorption Data - LACTOSE
20.5
21
21.5
22
22.5
23
23.5
0 500 1000 1500 2000 2500
Time/mins
Ma
ss
/mg
0
10
20
30
40
50
60
70
80
90
100
Ta
rge
t %
P/P
o
Mass
Target % P/Po
© Surface Measurement Systems Ltd 2008DVS - The Sorption Solution
Amorphous State Crystalline State
60% RH
Amorphous State Crystalline State
Video
Images
Raman Data
Absorption Cycle 1
0
200
400
600
800
1000
1200
1400
1600
0 500 1000 1500 2000 2500 3000 3500 4000
Raman shifts (cm-1
)
Co
un
ts
Amorphous State
Crystalline State
0% RH
40% RH
60% RH
95% RH

DVS Family of Products

SEA Introduction

SEA – Surface Energy
• Surface energy is most commonly
measured property by IGC
• Analogous to surface tension of liquids
• Defined as the excess energy at the
surface of a material compared to the
bulk
• Directly related to the thermodynamic
work of adhesion
• Can be divided into dispersive, acidic,
and basic components
19

SEA – Why Measure Surface Energy?
• Adhesion and cohesion (composites)– J. Borch, Journal of Adhesion Science and Technology. 5 (1991) 523-541.
– R.H. Mills, D.J. Gardner, and R. Wimmer. Journal of Applied Polymer Science. 110 (2008) 3880-3888.
– B. Wang and M. Sain, BioResources, 2 (2007) 371-388.
– A. Ziani, R. Xu, H.P. Schrieber, and T. Kobayashi, Journal of Coatings Technology, 71 (1999) 53-60.
• Powder flow and powder mixing– I. Saleem, H. Smyth, and M. Telko, Drug Development and Industrial Pharmacy,
34 (2008) 1002-1010.
– I.M. Grimsey, J.C. Feeley, and P. York, Journal of Pharmaceutical Sciences, 91 (2002) 571-583.
– N.M. Ahfat, G. Buckton, R. Burrows, and M.D. Ticehurst, International Journal of Pharmaceutics, 156 (1997) 89-95.
• Static charge– N. Ahfat, G. Buckton, R. Burrows, and M. Ticehurst, European Journal of
Pharmaceutical Science. 9 (2000) 271-276.
– J.H. Clint and T.S. Dunstan, Europhysics Letters. 54 (2001) 320-322.
20

SEA – Why Measure Surface Energy?
• Milling or process-induced disorder– J.Y.Y. Heng, F. Thielmann, and D.R. Williams, Pharmaceutical Research, 23 (2006)
1918-1927.
– E. Papier, J.-M. Perrin, B. Siffert, G.I. Philipponnear, and J.-M. Lamerant, Journal of Colloid and Interface Sceince, 156 (1993) 104.
– S.P. Chamarthy and R. Pinal, Colloids and Surfaces A, 331 (2008) 68-75.
– M. Ohta and G. Buckton, International Journal of Pharmaceutics, 269 (2004) 81-88.
• Batch-to-batch variability– M. Ohta and G. Buckton, International Journal of Pharmaceutics, 289 (2005) 31-
38.
– S.P. Chamarthy, R. Pinal, and M.T. Carvajal, AAPS PharmSciTech, 10 (2009) 780-788.
• Surface Modification– C.S. Flour and E. Papier, Journal of Colloid and Interface Science, 91 (1983) 69-
75.
– E. Papier, H. Balard, E. Brendle, and J. Lignieres, Journal of Adhesion Science and Technology, 10 (1996) 1401-1411.
– J.Y.Y. Heng, D.F. Pearse, F. Thielmann, T. Lampke, and A. Bismarck, 14 (2007) 581-604.
21

Surface Energy and Wettability
22
Increasing Surface
Energy

Surface Energy and Cohesion or Agglomeration
23
Increasing Surface
Energy

Surface Energy and Particle Adhesion
24
Increasing Surface
Energy

Surface Energy and Process-Induced Disorder
25
Increasing Surface
Energy

SEA Introduction – IGC Principle
Animation by L. Teng, Surface Measurement Systems
26

27
SEA SEA Retention TimeRetention Time
Time
tMtN
�Single pulse of probe molecule
� tM is the retention time for an
inert molecule (usually methane)
� tR is the retention time for the
interacting probe
� Net retention time tN = tR - tM
tR

28
SEA Basic Configuration
Solvent
Reservoir
Colum Oven
Teflon
Insulation

29
SEA Basic Configuration
2 Columns
Fully Integrated
Colum Oven

30
SEA Add-on Options*
• Humidity Control– 0 to 90% RH (at 25 °C)
• High Temperature Oven– 2 column design
– Ambient to 600 °C
• Film Cell– Analyze flat sheets of material
– Temperature control
• Advanced methods– Increased method and analysis flexibility
– Access to broader range of surface and bulk properties
* Current Timeline: available 3rd quarter of 2010

31
SEA Properties Measured
• Surface Energy Analysis– Dispersive Surface Energy
– Specific Free Energy of Desorption
– Ability to specify desired surface coverages for analysis
• Surface Energy Heterogeneity– Ability to perform experiments over a range of surface
coverages
– ‘Energy Mapping’ of surfaces
• Surface Acid-Base interactions
• Heats of Sorption
• Glass Transition Temperatures
• Solubility Parameters
• BET Surface Area
• Henry’s Law Isotherms

32
Specific Free Energy Values
Decane
Nonane
Octane
Heptane
1,4-DioxaneDichloromethane
Acetone
Ethyl Acetate
Ethanol
0
2000
4000
6000
8000
10000
12000
14000
16000
18000
0 2E-20 4E-20 6E-20 8E-20 1E-19 1.2E-19 1.4E-19
a·gamma½
RT
lnV
Specific Free Energy ∆∆∆∆GSP
Measured by determining interactions of polar or acid-base probes
with the surface.
∆GSP Ethyl Acetate

Surface Energy Heterogeneity
33
20
25
30
35
40
45
50
0 0.1 0.2 0.3 0.4 0.5 0.6 0.7 0.8 0.9 1
Dis
pe
rsiv
e S
urf
ac
e E
ne
rgy [m
J/m
²]
Fractional Surface Coverage [-]
Dispersive Surface Energy Profile
More Defects
Less Defects

IGC-SEA
Applications
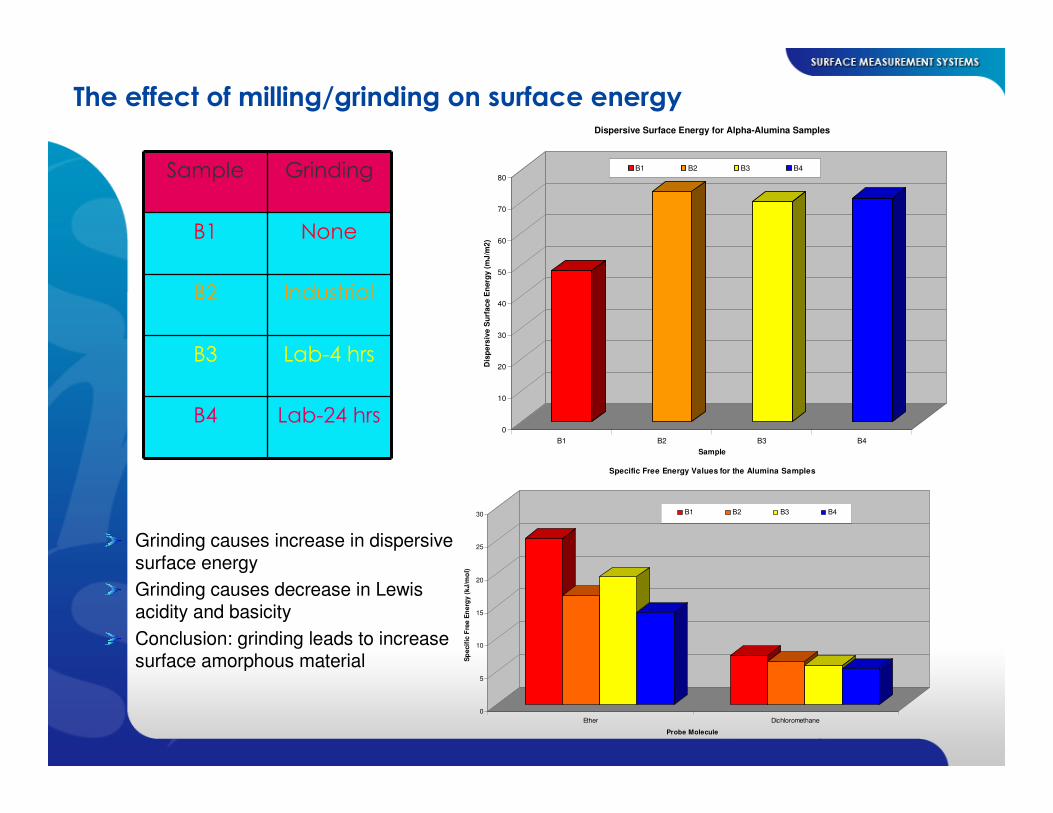
The effect of milling/grinding on surface energy
Sample Grinding
B1 None
B2 Industrial
B3 Lab-4 hrs
B4 Lab-24 hrs0
10
20
30
40
50
60
70
80
Dis
pe
rsiv
e S
urf
ace
En
erg
y (
mJ
/m2
)
B1 B2 B3 B4
Sample
Dispersive Surface Energy for Alpha-Alumina Samples
B1 B2 B3 B4
0
5
10
15
20
25
30
Sp
ecif
ic F
ree E
nerg
y (
kJ/m
ol)
Ether Dichloromethane
Probe Molecule
Specific Free Energy Values for the Alumina Samples
B1 B2 B3 B4
Grinding causes increase in dispersive surface energy
Grinding causes decrease in Lewis acidity and basicity
Conclusion: grinding leads to increase surface amorphous material

Case Study: the importance of adhesion/cohesion forcesthe importance of adhesion/cohesion forces
�1. Pack column with Material 1 (i.e. toner)
�Measure dispersive and polar (acid/base) surface energies
�2. Correlate surface energies directly with adhesive strength determined by physical/mechanical measurements
IGC Experimental Approach 1

Literature Examples
• Adhesion strength of toner to paper increases with dispersive surface energy of papers
•J. Borch, J. Adhesion Sci. Techol., 5 (1991) 523-541.

Literature Examples
• Bonding characteristics of images improve with increased dispersive surface energy of paper
•J. Borch, J. Adhesion Sci. Techol., 5 (1991) 523-541.

Case Study: the importance of adhesion/cohesion forcesthe importance of adhesion/cohesion forces
�1. Pack column with Material 1 (i.e. toner)
�Measure dispersive and polar (acid/base) surface energies
�2. Pack column with Material 2 (i.e. paper)
�Measure Dispersive and Polar surface energies
�3. Calculate Work of Adhesion using surface energy values of Material 1 and Material 2
IGC Experimental Approach 2

Adhesion and Cohesion
Compare Work of Adhesion value (WAd) with Work of Cohesion values (WCo)
High WAd values will lead to stronger toner-paperbonding strengths
High WCo values will lead to stronger toner-toner (i.e. agglomeration) or paper-paper bonding strengths
Ultimate Goal: to predict toner-paper interactions (without printing tests!) and select appropriate
toners as well as control toner properties�Same experiments can be performed on a wide range of
materials (toners, papers, fibers, wood, etc.)

41
If the surface energies of the individual compounds are known, the work of adhesion or cohesion can be obtained:
WAdhtotal = 2[(γ1
d* γ2
d)½ + (γ1+
* γ2-)½ +(γ1
-* γ2
+)½]
Work of Adhesion/CohesionWork of Adhesion/Cohesion
WCohtotal = 2[(γ1
d* γ1
d)½ + (γ1+
* γ1-)½ +(γ1
-* γ1
+)½]
Work of cohesion - between like bodiesWork of adhesion - between unlike bodies
Wd Wsp

Case Study: Granulation of glass beads
•Hydrophilic granules show finger print of HPC
•Hydrophobic granules a mixture of HPC and beads•Specific free energies show “fingerprint” of beads and binder
••MaterialsMaterials
••Hydrophilic and hydrophobic glass beadsHydrophilic and hydrophobic glass beads
••Binders: Hydroxypropylcellulose (HPC)Binders: Hydroxypropylcellulose (HPC)
Binder appears to Binder appears to ““spreadspread”” on hydrophilic glass beads on hydrophilic glass beads
which results in which results in ““coatingcoating””..

Surface Energy vs Coverage
Dispersive Surface Energy Profile for an untreated pine powder
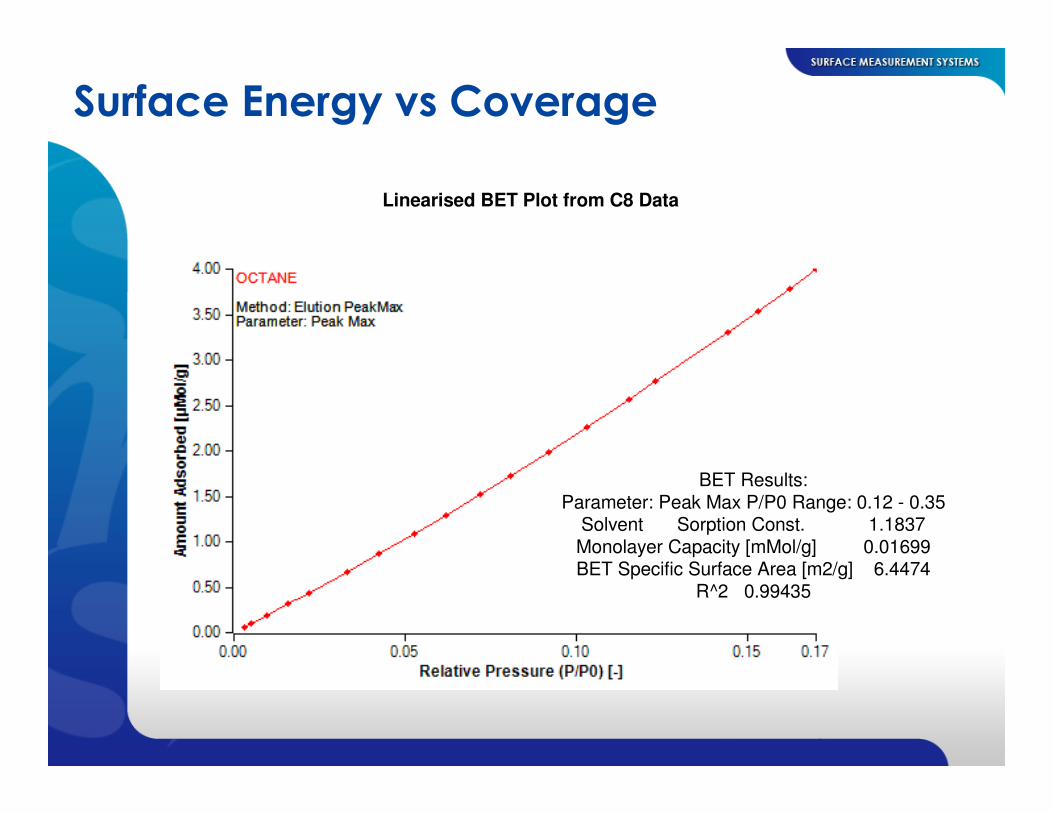
Surface Energy vs Coverage
Linearised BET Plot from C8 Data
BET Results:Parameter: Peak Max P/P0 Range: 0.12 - 0.35
Solvent Sorption Const. 1.1837Monolayer Capacity [mMol/g] 0.01699BET Specific Surface Area [m2/g] 6.4474
R^2 0.99435

DVS Applications

Typical Temperature Stability – 24 hours

Changing Temperature: 25C-85C

Changing Temperature:25C-12C-25C

10 Avicel samples by DVS-HT
1 Avicel sample by DVS Advantage
99
101
103
105
107
109
111
113
120 320 520 720 920 1120 1320
Time / min
Mass %
Ch
an
ge
0
10
20
30
40
50
60
70
80
90
100
Targ
et
RH
(%
)

DVS - Kinetics of Moisture Sorption of Sawdust
DVS Change In Mass (ref) Plot
0
2
4
6
8
10
12
14
16
18
20
0 500 1000 1500 2000 2500 3000 3500 4000 4500 5000
Time/mins
Ch
an
ge
In
Ma
ss
(%
) -
Re
f
0
10
20
30
40
50
60
70
80
90
100
Ta
rge
t R
H (
%)
dm - dry Target RH
© Surface Measurement Systems Ltd UK 1996-2005DVS - The Sorption Solution
Time: 16-21
File: Sawdust -
Sample: Sawdust
Temp: 25.0 °C
MRef: 10.72722

DVS- Sawdust Isotherms
DVS Isotherm Plot
0
2
4
6
8
10
12
14
16
18
20
0 10 20 30 40 50 60 70 80 90 100
Sample RH (%)
Ch
an
ge
In
Ma
ss
(%
) -
Re
f
Cycle 1 Sorp Cycle 1 Desorp
© Surface Measurement Systems Ltd UK 1996-2005DVS - The Sorption Solution
Time: 16-21
File: Sawdust -
Sample: Sawdust
Temp: 25.0 °C
Meth: Sawdust.sao
MRef: 10.72722

DVS – Natural wood and Composites
• Moisture control and measurement are critical parameters
for wood and wood composites.
• moisture plays a key role in the fungal degradation and
weathering of wood-plastic composites.
• Drying kinetics i.e. moisture sorption behaviour and
diffusion processes.
• The hysteresis between sorption and desorption isotherms
provides information related to wood stability i.e. the
narrower the hysteresis, the more stable the wood sample
is to fluctuating humidities.
• water vapour diffusion coefficients are related to wood
species, wood grain direction, wood age, and tree ring
location.

DVS – Natural wood and Composites
0
2
4
6
8
10
12
14
16
18
20
0 10 20 30 40 50 60 70 80 90 100
Ch
an
ge In
Ma
ss
(%
) -
Re
f
Sample RH (%)
DVS Isotherm Plot
Cycle 1 Sorp Cycle 1 Desorp
© Surface Measurement Systems Ltd UK 1996-2005DVS - The Sorption Solution
Temp: 25.0 C
0
2
4
6
8
10
12
0 10 20 30 40 50 60 70 80 90
Ch
an
ge
In M
ass
(%
) -
Ref
Target % P/Po
DVS Isotherm Plot
Cycle 1 Sorp Cycle 1 Desorp
© Surface Measurement Systems Ltd UK 1996-2005DVS - The Sorption Solution
Temp: 25.0 C
(b.)(a.)
Water sorption (red) and desorption (blue) isotherms at 25 °C
measured on sawdust (a.) and a solid wood sample (b.).
Different geometries can be used i.e. wood samples as sawdust, chunks, films, fibres, or slabscan be used to determine moisture sorption kinetics, diffusion coefficients and the equilibrium isotherm values (see SMS Application Notes 7, 12, 16, and 30).

Amorphous Content Determination
0
0.2
0.4
0.6
0.8
1
1.2
0 200 400 600 800 1000 1200Time/mins
Ch
an
ge
In
Ma
ss
(%
)-D
ry
0
10
20
30
40
50
60
70
80
90
Re
lati
ve
pre
ss
ure
Increase in amorphous content and decrease in crystallinity of cellulose
∆∆∆∆ AmorphousContent

Sorption Mechanisms
Monolayer Mechanism
(typical type II/IV)
dHads >> dHcond
Using water/organic vapour isotherms to study the sorption mechanism i.e. monolayer, multilayer and bulk adsorption as well as the strength of vapour/surface interaction.
Cluster Mechanism
(typical type III/V)
dHads ≥ dHcond

Case Study: Hemp vs Hemp Lime
Hemp is porous and the lime-based binder sticks together and protects the hemp. By varying the quantities of lime, different preparations can be made.
DVS Change In Mass (ref) Plot
Hemp vs Hemp Lime
-5
0
5
10
15
20
25
30
35
0 500 1000 1500 2000 2500 3000 3500 4000 4500
Time/mins
Ch
an
ge
In
Ma
ss
(%
) -
Re
f
0
10
20
30
40
50
60
70
80
90
100
Ta
rge
t R
H (
%)
hemp lime run 1 - Mon 20 Jul 2009 14-38-53 dm - dry hemp shiv run 3 - Tue 04 Aug 2009 09-50-21 dm - dry
hemp lime run 1 - Mon 20 Jul 2009 14-38-53 Target RH hemp shiv run 3 - Tue 04 Aug 2009 09-50-21 Target RH
© Surface Measurement Systems Ltd UK 1996-2004DVS - The Sorption Solution

Case Study: Hemp vs Hemp Lime
DVS Isotherm Plot
-5
0
5
10
15
20
25
30
35
0 10 20 30 40 50 60 70 80 90 100
Target RH (%)
Ch
an
ge In
Mass (
%)
- R
ef
hemp shiv run 3 - Tue 04 Aug 2009 09-50-21 (2) Cycle 1 Sorp hemp shiv run 3 - Tue 04 Aug 2009 09-50-21 (2) Cycle 1 Desorp
hemp lime run 1 - Mon 20 Jul 2009 14-38-53 (2) Cycle 1 Sorp hemp lime run 1 - Mon 20 Jul 2009 14-38-53 (2) Cycle 1 Desorp
© Surface Measurement Systems Ltd UK 1996-2010DVS - The Sorption Solution

Heat of Sorption
DVS Isotherm Plot
0
0.02
0.04
0.06
0.08
0.1
0.12
0.14
0.16
0.18
0 10 20 30 40 50 60 70 80 90 100
Target RH (%)
Ch
an
ge I
n M
ass (
%)
- D
ry
25 C 35 C 45 C
© Surface Measurement Systems Ltd UK 1996-2001DVS - The Sorption Solution

Heat of Sorption
Change in mass (%) Heat of sorption (kJ/mol)
(25 and 35 °C)
Heat of sorption (kJ/mol)
(35 and 45 °C)
0.06 -46.1 -43.3
0.07 -47.3 -44.2
0.08 -47.9 -44.5
0.09 -47.4 -45.2
dHads for Water ≥≥≥≥ dHcond for Water

DVS – Natural wood and Composites
• Degradation of wood-plastic composites
– Kim, K.-W., Harper, D.P., and Taylor, A.M., Wood and Fiber Science, 2008. 40, 519-531.
• Swelling and dimensional instability
– Neimsuwan, T., Wang, S., and Via, B.K., Wood and Fiber Science, 2008, 40, 495-504.
• Drying kinetics
– Neimsuwan, T., Wang, S., Taylor, A.M., and Rials, T.G., Wood Science and Technology, 2008. 42, 493-506.
• Fungal growth and degradation
– ANTEC 2002 Annual Technical Conference : May 5-9, 2002, San Francisco, CA. : conference proceedings. Volume II, Materials. S.l. : Society of Plastics Engineers, 2002: p. 2219-2222

An introduction to DVS & iGC Technologies