Embed Size (px)
Citation preview

Impact factor: 3.958/ICV: 4.10 ISSN: 0976-7908 355
Sunil et al. / Pharma Science Monitor 8(3), Jul-Sep 2017, 355-374
Pharma Science Monitor 8(3), Jul-Sep 2017
FORMULATION AND DEVELOPMENT OF REPAGLINIDE GASTRO RETENTIVE
FLOATING TABLETS
Sunil Patel*, Sanjesh Rathi, Pragnesh patani, Hardeep Banwait
Department of Pharmaceutics, A-one pharmacy college, Anasan. Gujarat.
ABSTRACTGastroretentive dosage forms have potential for use as controlled release drug delivery systems.A Controlled release system designed to increase its residence time in stomach without contactwith mucosa was achieved through the preparation of repaglinide floating tablets by directcompression method. In the present study, repaglinide an anti-diabetic agent was formulated intofloating tablets by direct compression method using polymers such as different grades ofHydroxypropyl methylcellulose (HPMC) polymers such as HPMC K4M, K15M and K100M,sodium alginate and Carbopol 934P. Sodium bicarbonate was used as gas generating agent. Thefloating tablets were evaluated for their physico-chemical properties, in-vitro release and stabilitystudies. The order of Swelling index was found to be Carbopol 934P > sodium alginate > HPMCK100M > HPMC K15M > HPMC K4M. Sodium bicarbonate at the concentration of 14 %w/wwas found to be ideal in achieving the buoyancy. The buoyancy lag time was found to be lessthan 1 minute. In all the five formulations prepared, formulation F4 (sodium alginate) wasselected as best formulation as it released 80.12% of drug in a period of 12 hrs. Tablets followeddiffusion controlled first order kinetics.KEYWORDS: Repaglinide, HPMC, Carbopol 934P, Buoyancy, Swelling index, In-vitrorelease.
INTRODUCTION
Oral route of administration is most convenient & preferred route of administration among
various other delivery system. More than 70% of drugs are available in market in form of oral
drug delivery system due to pain avoidance & versatility. Dysphagia is commonly found among
all age groups. [1,2] Gastrointestinal tract targeting dosage forms are prepared to release drug at
gastrointestinal site. Several types of gastrointestinal target dosage forms including intragastric
floating system, high density system, mucoadhesive system that gets adhere to gastric mucosal
surface to extend GRT, magnetic system & unfordable extendible or swellable systems have
been developed. Floating drug delivery system is useful for several categories of drugs which act
locally in stomach, poorly soluble in alkaline pH, having narrow window of absorption, unstable
in intestine or colonic environment & primarily absorbed in stomach. Drugs having solubility in
PHARMA SCIENCE MONITORAN INTERNATIONAL JOURNAL OF PHARMACEUTICAL SCIENCES
Journal home page: http://www.pharmasm.com
Impact factor: 3.958/ICV: 4.10 ISSN: 0976-7908 356
Sunil et al. / Pharma Science Monitor 8(3), Jul-Sep 2017, 355-374
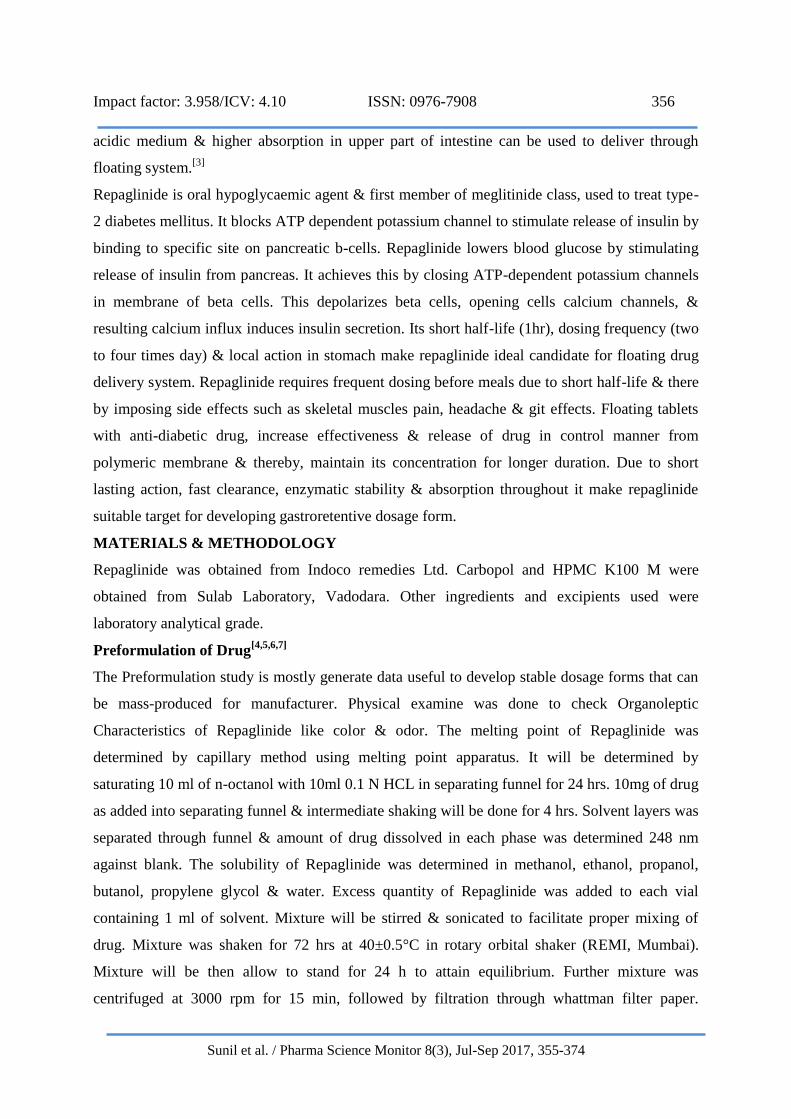
acidic medium & higher absorption in upper part of intestine can be used to deliver through
floating system.[3]
Repaglinide is oral hypoglycaemic agent & first member of meglitinide class, used to treat type-
2 diabetes mellitus. It blocks ATP dependent potassium channel to stimulate release of insulin by
binding to specific site on pancreatic b-cells. Repaglinide lowers blood glucose by stimulating
release of insulin from pancreas. It achieves this by closing ATP-dependent potassium channels
in membrane of beta cells. This depolarizes beta cells, opening cells calcium channels, &
resulting calcium influx induces insulin secretion. Its short half-life (1hr), dosing frequency (two
to four times day) & local action in stomach make repaglinide ideal candidate for floating drug
delivery system. Repaglinide requires frequent dosing before meals due to short half-life & there
by imposing side effects such as skeletal muscles pain, headache & git effects. Floating tablets
with anti-diabetic drug, increase effectiveness & release of drug in control manner from
polymeric membrane & thereby, maintain its concentration for longer duration. Due to short
lasting action, fast clearance, enzymatic stability & absorption throughout it make repaglinide
suitable target for developing gastroretentive dosage form.
MATERIALS & METHODOLOGY
Repaglinide was obtained from Indoco remedies Ltd. Carbopol and HPMC K100 M were
obtained from Sulab Laboratory, Vadodara. Other ingredients and excipients used were
laboratory analytical grade.
Preformulation of Drug[4,5,6,7]
The Preformulation study is mostly generate data useful to develop stable dosage forms that can
be mass-produced for manufacturer. Physical examine was done to check Organoleptic
Characteristics of Repaglinide like color & odor. The melting point of Repaglinide was
determined by capillary method using melting point apparatus. It will be determined by
saturating 10 ml of n-octanol with 10ml 0.1 N HCL in separating funnel for 24 hrs. 10mg of drug
as added into separating funnel & intermediate shaking will be done for 4 hrs. Solvent layers was
separated through funnel & amount of drug dissolved in each phase was determined 248 nm
against blank. The solubility of Repaglinide was determined in methanol, ethanol, propanol,
butanol, propylene glycol & water. Excess quantity of Repaglinide was added to each vial
containing 1 ml of solvent. Mixture will be stirred & sonicated to facilitate proper mixing of
drug. Mixture was shaken for 72 hrs at 40±0.5°C in rotary orbital shaker (REMI, Mumbai).
Mixture will be then allow to stand for 24 h to attain equilibrium. Further mixture was
centrifuged at 3000 rpm for 15 min, followed by filtration through whattman filter paper.

Impact factor: 3.958/ICV: 4.10 ISSN: 0976-7908 357
Sunil et al. / Pharma Science Monitor 8(3), Jul-Sep 2017, 355-374
Filtrates was diluted with 0.1 N HCL & quantified by UV Spectrophotometry at 231 nm.
Calibration curve for estimation of drug was constructed employing 0.1 N HCL as medium.
Stock solution of repaglinide (100μg/mL) prepared in methanol, was subsequently diluted with
distilled water to obtain series of dilutions containing 1, 2, 4, 6, 8, 10, 20 & 30 μg/mL of drug.
Absorbances of above dilutions were measured using UV-Visible spectrophotometer at λmax of
231 nm. These Calibration curves were used for estimation of repaglinide in present study.
Potassium bromide IR disc was prepared using Repaglinide, Ethyl cellulose, HPMC, Carbopol
934 & mixture on Hydraulic Pellet press will be scanned 4000-400 cm-1 region in FTIR &
obtained IR Spectrum was compared with reference spectrum of Repaglinide. Thermal analysis
of Drug Repaglinide & polymers will be studied employing differential scanning calorimetry
which was done to check compatibility for Floating Tablets formulations.
Formulation & Development of Repaglinide floating tablets by using DoE Approach
Repaglinide Floating Tablets was formulated using various Drug: Polymer ratio, polymer
concentration, type of floating agent, stirring time, concentration floating agent & evaluated for
floating time, buoyancy time & drug release profile for preliminary selection to develop DoE
approach. Risk assessments had been done to select formulation & process variable which may
affect product quality for CQAs by process characterization that defines satisfactory changes in
material & process parameters. Finally, this can result in quality assurance by Process Design
Space to understand & develop control strategy. Critical quality attributes was categorized into
high, medium & low risk parameters based on knowledge space. Usually high risk parameters
are considered important for Design of Experiments as they are having more effect than others &
need to be in accepting multivariate ranges. Effect of different variables was checked by floating
time, buoyancy time & % CDR characterization of floating agent formulated in Preliminary trial
batches. Based on that characterization, CQAs will be selected which affect highly on floating
agent Formulation.
Characterization of Repaglinide floating tablets
Precompression Parameters [8-11]
Angle of Repose:
Take required quantity of blend & poured into hollow cylinder which was placed on graph sheet.
Then cylinder was slowly lifted. Then height & diameter of heap formed was being note down.
Angle of repose (θ) was calculated by formula:
θ = tan-1 (h/r)
Where,

Impact factor: 3.958/ICV: 4.10 ISSN: 0976-7908 358
Sunil et al. / Pharma Science Monitor 8(3), Jul-Sep 2017, 355-374
h = Height of pile
r = Radius of pile
Bulk Density:
Blend will be weighed & transfer to measuring cylinder. Then bulk volume is noted. Bulk
density is being calculated by using following formula:
Bulk density = W/V0 g/ml
W= Mass of blend
V0 =Untapped volume
Tapped Density:
Tapped density will be measured by transferring known quantity of blend into graduated cylinder
& was placed on tapped density apparatus. Initial volume will be noted. Apparatus was set for
500 taps. Tapped density will be determined as ratio of mass of blend to tapped volume.
Tapped density=W/Vf g/ml
Where,
W= Mass of blend
Vf = Tapped volume
Carr’s Index:
It is measured by tapped density apparatus for 500 taps for which difference should be not more
than 2%. Based on apparent bulk density & tapped density Carr’s index will be calculated by
using following formula:
Carr’s index = [(V0 – Vf) / V0] X 100
Hausner’s ratio:
It indicates flow properties of powder. Ratio of tapped density to bulk density of powders is
called Hausner’s ratio.
Hausner’s ratio= Tapped density / Bulk density
Post compression evaluation [12-14]
Hardness Test:
The harness of tablet will be determined using Monsanto hardness tester. Three tablets will be
randomly selected & hardness of tablet will be measured.
Diameter & Thickness:
The diameter & thickness of tablet will be measured by using Vernier calliper.
Disintegration Time:

Impact factor: 3.958/ICV: 4.10 ISSN: 0976-7908 359
Sunil et al. / Pharma Science Monitor 8(3), Jul-Sep 2017, 355-374
The DT of tablet will be determined as per IP. Tablets will placed in DT tubes & time required
for complete disintegration, that is without leaving any residues on screen is recorded as
disintegration time.
Weight Variation Test:
Weight variation test will be conducted as per IP.20 Tablets were selected form batch.
Friability:
Twenty tablets will be weighed accurately & placed in tumbling apparatus that revolves at 25
rpm. After 4 min., tablets will be weighed & percentage loss in tablet weight was determined.
Drug content:
Twenty tablets are powdered, & equivalent weight powder was accurately weighed & transfer
into 100 ml volumetric flask. Initially, 5 ml methanol is added & shaken for 10 min. Then,
volume is made up to100 ml with 0.1N Hydrochloric acid. Solution in volumetric flask is filter,
dilute suitably & analyze spectrophotometrically.
In –Vitro Floating Lag time & Buoyancy Time:
The randomly selected tablets will kept in 100 ml beaker containing simulated gastric fluid pH
1.2 as per USP. Time taken for tablet rise to surface & float will be taken as floating time.
Duration of time dosage form constantly remained on surface of medium will be determined as
total floating time.
In –Vitro Dissolution Studies:
The release rate of tablet will be determined by using USP type-1 apparatus (Basket type). test
will performed by using 900 ml of 0.1 N HCL as dissolution medium at 37 +0.5 oc. 10 ml will be
withdrawn after each interval & replace with fresh medium. Amt. of drug release will be
measured by using standard calibration curve of PCM.
The kinetic release study will performed to find drug release mechanism from dissolution
parameter by using different various kinetic model equations. The conventional marketed
formulation will be compare with optimized Tablets. The drug or dosage form quality may affect
under impact of by varying temperature, humidity & light with time which can be found out by
stability testing. It can be carried out at 25°C ± 2°C/ 60% RH ± 5% RH & 40°C ± 2°C/ 75% RH
± 5% RH for selected formulation for three months. Samples were withdrawn on 0th, 30th, 60th
& 90th day & were analyzed for physical appearance & drug content.
RESULTS AND DISCUSSION
The pure drug Repaglinide & various other excipients were subjected to various preformulation
parameters such as organoleptic characteristic study, Melting Point Determination, solubility
Impact factor: 3.958/ICV: 4.10 ISSN: 0976-7908 360
Sunil et al. / Pharma Science Monitor 8(3), Jul-Sep 2017, 355-374
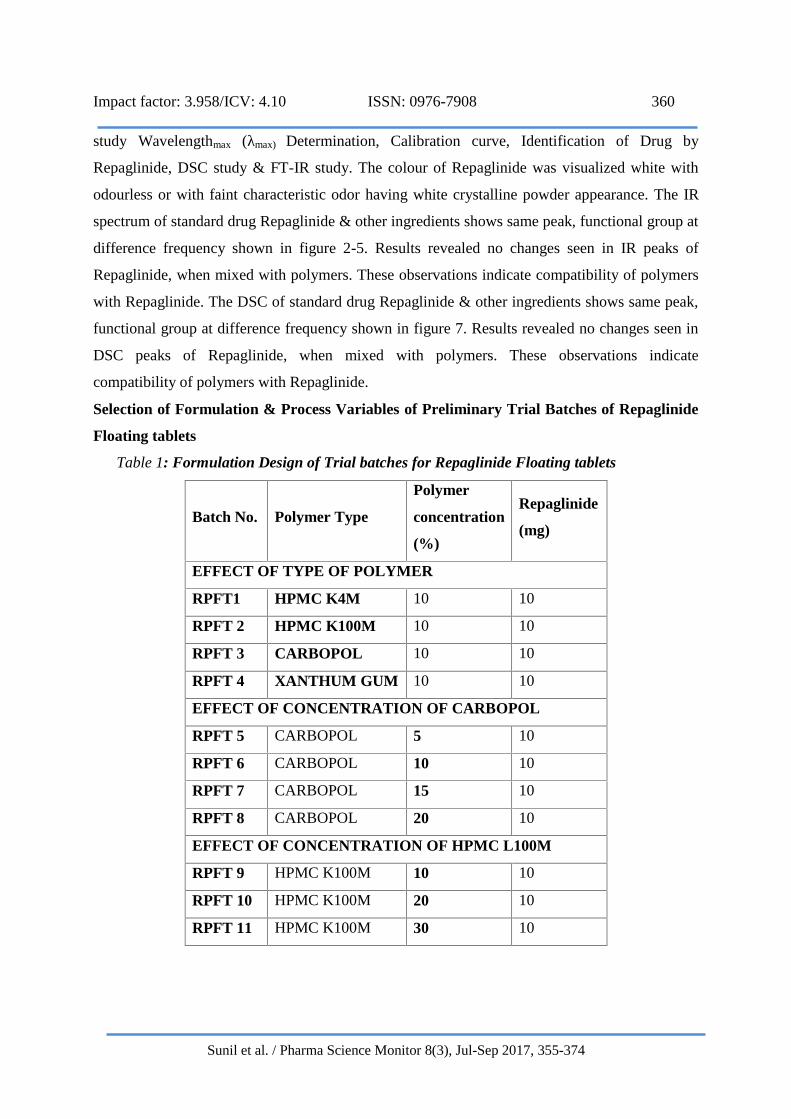
study Wavelengthmax (λmax) Determination, Calibration curve, Identification of Drug by
Repaglinide, DSC study & FT-IR study. The colour of Repaglinide was visualized white with
odourless or with faint characteristic odor having white crystalline powder appearance. The IR
spectrum of standard drug Repaglinide & other ingredients shows same peak, functional group at
difference frequency shown in figure 2-5. Results revealed no changes seen in IR peaks of
Repaglinide, when mixed with polymers. These observations indicate compatibility of polymers
with Repaglinide. The DSC of standard drug Repaglinide & other ingredients shows same peak,
functional group at difference frequency shown in figure 7. Results revealed no changes seen in
DSC peaks of Repaglinide, when mixed with polymers. These observations indicate
compatibility of polymers with Repaglinide.
Selection of Formulation & Process Variables of Preliminary Trial Batches of Repaglinide
Floating tablets
Table 1: Formulation Design of Trial batches for Repaglinide Floating tablets
Batch No. Polymer Type
Polymer
concentration
(%)
Repaglinide
(mg)
EFFECT OF TYPE OF POLYMER
RPFT1 HPMC K4M 10 10
RPFT 2 HPMC K100M 10 10
RPFT 3 CARBOPOL 10 10
RPFT 4 XANTHUM GUM 10 10
EFFECT OF CONCENTRATION OF CARBOPOL
RPFT 5 CARBOPOL 5 10
RPFT 6 CARBOPOL 10 10
RPFT 7 CARBOPOL 15 10
RPFT 8 CARBOPOL 20 10
EFFECT OF CONCENTRATION OF HPMC L100M
RPFT 9 HPMC K100M 10 10
RPFT 10 HPMC K100M 20 10
RPFT 11 HPMC K100M 30 10

Impact factor: 3.958/ICV: 4.10 ISSN: 0976-7908 361
Sunil et al. / Pharma Science Monitor 8(3), Jul-Sep 2017, 355-374
Characterization of batches RPFT1- RPFT4.
Figure 1: Effect of type of polymer
From result of trail batches we can conclude that HPMC shows fast floating lag time than
carbopol & Xanthan gum. Swelling index of HPMC is also high than carbopol. Thus, HPMC
K100M & Carbopol was selected for further study.
Figure 2: Effect of conc. of carbopol
From result of trail batches we can conclude that as Carbopol concentration increases, buoyancy
lag time, total floating time & swelling index also increases. Thus, 10-20 % Carbopol was
selected for further study.
0
50
100
150
200
250
300
350
RPFT1 RPFT 2 RPFT 3 RPFT 4
EFFECT OF TYPE OF POLYMER
Buoyancy lag time (s) Total floating time (h) Swelling index (%)
0
50
100
150
200
250
RPFT5 RPFT 6 RPFT7 RPFT 8
Effect of conc. of carbopol
Buoyancy lag time (s) Total floating time (h) Swelling index (%)

Impact factor: 3.958/ICV: 4.10 ISSN: 0976-7908 362
Sunil et al. / Pharma Science Monitor 8(3), Jul-Sep 2017, 355-374
Figure 3: Effect of type of HPMC K100M
From result of trail batches we can conclude that as HPMC K100M concentration increases,
buoyancy lag time, total floating time & swelling index also increases. Thus, 15-25 % HPMC
K100M was selected for further study.
% Cumulative Drug Release Study of Batches LMLC1-LMLC9
Figure 4: % Cumulative Drug Release Study of Batches RPFT1-RPFT11
Risk Assessment of Critical Quality Attributes from Preliminary trial Batches to Develop
DoE Approach:
Critical quality attributes are categorized in high, medium & low risk parameters based on
knowledge space to check influence of formulation & process parameters. Usually high risk
parameters are considered important for Design of Experiments as they are having more effect
050
100150200250300350400
Buoyancy lag time (s) Total floating time (h) Swelling index (%)
Effect of conc. of HPMC K100M
RPFT9 RPFT 10 RPFT 11
-20
0
20
40
60
80
100
120
0 2 4 6 8 10 12 14
Cummulative drug release (%)( 12 Hr.)
RPFT1 RPFT2 RPFT3 RPFT4 RPFT5 RPFT6
RPFT7 RPFT8 RPFT9 RPFT10 RPFT11

Impact factor: 3.958/ICV: 4.10 ISSN: 0976-7908 363
Sunil et al. / Pharma Science Monitor 8(3), Jul-Sep 2017, 355-374
than others & need to be in accepted multivariate ranges. Critical parameters & critical quality
attributes (CQAs) for selection of optimum formulation are shown.
Formulation & Development of Repaglinide floating tablets by using 32 Factorial Design
Approach
Table 2: 32Factorial Batches
Independent Variables of Formulations
Independent Variables Low(-1) Medium (0) High(+1)
Carbopol Concentration
(%) (X1)10 15 20
HPMC K100M Concentration (%)
(X2)10 20 30
Dependent Variables
Y1- Buoyancy lag time (s)
Y2- Total floating time (h)
Y3- Release after 12 hours (%CDR)
Characterization of Batches RPGFT1- RPGFT 9
Figure 5: Characterization Batches RPGFT1 – RPGFT9
0
20
40
60
80
100
120
RPGFT 1 RPGFT 2 RPGFT 3 RPGFT 4 RPGFT 5 RPGFT 6 RPGFT 7 RPGFT 8 RPGFT 9
Characteristics of RPGFT1-RPGFT9
Buoyancy -% (Y1) Total Floating Time (Y2) Drug release after 12 hr (Y3)

Impact factor: 3.958/ICV: 4.10 ISSN: 0976-7908 364
Sunil et al. / Pharma Science Monitor 8(3), Jul-Sep 2017, 355-374
% Cumulative Drug Release profile
Figure 6: % Cumulative Drug Release profile of Batches RPGFT1 – RPGFT9
Release Kinetic
The mechanism was analyzed with support of PCP V2.08 dissolution software using as shown
Table 31. By plotting values of Higuchi model, near straight lines with parallel positive slopes
were obtained representing that, best fit model for formulations was Higuchi model.
Statistical Analysis
Statistical analysis had done by Design expert software version 9.0.2.0. & generated first order
polynomial equations. From preliminary results, 32 full factorial design was utilized in which
four factors were evaluated, separately at three levels & possible nine combinations were
formulated. Three level factorial study was carried out using four different variable. In first
factorial design, Carbopol Concentration (X1) & HPMC concentration (X2) were taken as
independent variables while % buoyancy (Y1), total floating time (Y2), and Drug release after 12
hr. (Y3) were selected as dependent variables for both factorial designs. Full model was found
insignificant so reduced model was applied for all four independent variables & detailed
ANOVA, Response Surface Counter Plot & 3 D plot are as follows:
Effect on % buoyancy (Y1) - Surface Response Study
The positive value of coefficient of X1 in equation indicates decrease in buoyancy with Polymer
Concentration.
Final Equation in Terms of Actual Factors:
Buoyancy lag time = +116.25500 - 1.74100 * Carbopol Concentration - 0.22567 * HPMC
K100M Concentration
0
20
40
60
80
100
120
0 2 4 6 8 10 12 14
%CD
R
time (hrs.)
% Cumulative Drug Release profile of BatchesRPGFT1 – RPGFT9

Impact factor: 3.958/ICV: 4.10 ISSN: 0976-7908 365
Sunil et al. / Pharma Science Monitor 8(3), Jul-Sep 2017, 355-374
Table 3: ANOVA Table for Response Y1
ANOVA for Response Surface Linear model
Analysis of variance table [Partial sum of squares - Type III]
Sum of Mean F p-value
Source Squares df Square Value Prob >
F
Model 485.22 2 242.61 1292.09 <
0.0001
significant
A-Carbopol Concentration 454.66 1 454.66 2421.46 <
0.0001
B-HPMC K100M
Concentration
30.56 1 30.56 162.73 <
0.0001
Residual 1.13 6 0.19
Cor Total 486.34 8
(a) (b)
Figure 7: Response Surface Plot
Effect on Total Floating Time (Y2) - Surface Response Study
The positive value of coefficient of X1 in equation indicates increase in floating time with X1.
Final Equation in Terms of Actual Factors:
Design-Expert® SoftwareFactor Coding: ActualBuoyancy lag time (Sec.)
Design points above predicted valueDesign points below predicted value96.79
75.39
X1 = A: Carbopol ConcentrationX2 = B: HPMC K100M Concentration
10
15
20
25
30
10
12
14
16
18
20
70
75
80
85
90
95
100
Bu
oy
an
cy
la
g t
ime
(S
ec
.)
A: Carbopol Concentration (%)
B: HPMC K100M Concentration (%)
Design-Expert® SoftwareFactor Coding: ActualBuoyancy lag time (Sec.)
Design points above predicted valueDesign points below predicted value96.79
75.39
X1 = B: HPMC K100M ConcentrationX2 = A: Carbopol Concentration
10
12
14
16
18
20
10
15
20
25
30
70
75
80
85
90
95
100
Bu
oy
an
cy
la
g t
ime
(S
ec
.)
B: HPMC K100M Concentration (%)
A: Carbopol Concentration (%)

Impact factor: 3.958/ICV: 4.10 ISSN: 0976-7908 366
Sunil et al. / Pharma Science Monitor 8(3), Jul-Sep 2017, 355-374
Total floating time = +0.95556 +1.06667 * Carbopol Concentration +0.076667* HPMC
K100M Concentration
Table 4: ANOVA Table for Response Y2
ANOVA for Response Surface Linear model
Analysis of variance table [Partial sum of squares - Type III]
Sum of Mean F p-value
Source Squares df Square Value Prob > F
Model 174.19 2 87.10 14.82 0.0048 significant
A-Carbopol Concentration 170.67 1 170.67 29.05 0.0017
B-HPMC K100M Concentration 3.53 1 3.53 0.60 0.4679
Residual 35.26 6 5.88
Cor Total 209.45 8
(a)
(b)
Figure 8: 3D Surface Plot
Design-Expert® SoftwareFactor Coding: ActualTotal floating time (h)
Design points above predicted valueDesign points below predicted value24.9
10.7
X1 = A: Carbopol ConcentrationX2 = B: HPMC K100M Concentration
10
15
20
25
30
10
12
14
16
18
20
10
15
20
25
30
To
tal
flo
ati
ng
tim
e (
h)
A: Carbopol Concentration (%)B: HPMC K100M Concentration (%)
Design-Expert® SoftwareFactor Coding: ActualTotal floating time (h)
Design points above predicted valueDesign points below predicted value24.9
10.7
X1 = B: HPMC K100M ConcentrationX2 = A: Carbopol Concentration
10
12
14
16
18
20
10
15
20
25
30
10
15
20
25
30
To
tal
flo
ati
ng
tim
e (
h)
B: HPMC K100M Concentration (%)A: Carbopol Concentration (%)

Impact factor: 3.958/ICV: 4.10 ISSN: 0976-7908 367
Sunil et al. / Pharma Science Monitor 8(3), Jul-Sep 2017, 355-374
Effect on Release after 12 Hr. (Y3) - Surface Response Study
The Negative value of coefficient of X1 in equation indicates decrease drug release with Polymer
Concentration. Negative value of coefficient of X2 indicates decrease in Release after 12 Hr...
Final Equation in Terms of Actual Factors:
Release after 12 Hr. = +108.60000 -2.24667 * Carbopol Concentration -0.07200 *
HPMC K100M Concentration
Table 5: ANOVA Table for Response Y3
ANOVA for Response Surface Linear model
Analysis of variance table [Partial sum of squares - Type III]
Sum of Mean F p-value
Source Squares df Square Value Prob > F
Model 760.24 2 380.12 10.76 0.0104 significant
A-Carbopol Concentration 757.13 1 757.13 21.44 0.0036
B-HPMC K100M Concentration 3.11 1 3.11 0.088 0.7767
Residual 211.92 6 35.32
Cor Total 972.16 8
(a) (b)
Figure 9: 3D Surface Plot
Design-Expert® SoftwareFactor Coding: ActualRelease after 12 Hr. (%)
Design points above predicted valueDesign points below predicted value89.25
57.1
X1 = A: Carbopol ConcentrationX2 = B: HPMC K100M Concentration
10
15
20
25
30
10
12
14
16
18
20
50
60
70
80
90
100
Re
lea
se
aft
er
12
Hr.
(%
)
A: Carbopol Concentration (%)
B: HPMC K100M Concentration (%)
Design-Expert® SoftwareFactor Coding: ActualRelease after 12 Hr. (%)
Design points above predicted valueDesign points below predicted value89.25
57.1
X1 = B: HPMC K100M ConcentrationX2 = A: Carbopol Concentration
10
12
14
16
18
20
10
15
20
25
30
50
60
70
80
90
100
Re
lea
se
aft
er
12
Hr.
(%
)
B: HPMC K100M Concentration (%)
A: Carbopol Concentration (%)

Impact factor: 3.958/ICV: 4.10 ISSN: 0976-7908 368
Sunil et al. / Pharma Science Monitor 8(3), Jul-Sep 2017, 355-374
Establishing Design Space & Control Strategy
Figure 10: FDS Graph
Fraction of Design Space Graph shows relationship between design space volume & prediction
error quantity indicating fraction (percentage) prediction error or lower. Good design will have
flatter & lower curve than poor design as shown in figure 29. Flatter means overall prediction
error will be constant. Lower means overall prediction error will be smaller. FDS should be at
least 0.8 or 80% of exploration, & 100% for robustness testing. In extraction of mucilage FDS
was 0.93 or 93%, which indicating robust Standard error of prediction relates to prediction
interval around predicted response at given pair of factor levels.
Validation:
From polynomial equations generated in response using intensive grid & integrated search was
done over experimental field & one formulation was selected. Predicted & experimental values
of selected batch responses & percentage error indicate high prognostic ability using RSM
optimization. Percentage error varied between 0.6 & 1.9 from contrast of experimental responses
with those of anticipated responses indicating validity of applied model.
Check point analysis of Validation Batches
Two extra designs, check point formulation batches RPGFT10 & RPGFT11 were developed &
predicted & experimental values of dependent variables were compared using pooled t - test at
95% confidence interval, 4- degree of freedom & p < 0.05 of two batches RPGFT10 &
RPGFT11 thus starting validity of created model.
Design-Expert® Software
Min Std Error Mean: 0.333Avg Std Error Mean: 0.471Max Std Error Mean: 0.667Cuboidalradius = 1Points = 50000t(0.05/2,6) = 2.44691d = 1.4207, s = 1FDS = 0.93Std Error Mean = 0.581
0.00 0.20 0.40 0.60 0.80 1.00
0.000
0.200
0.400
0.600
0.800
1.000
FDS Graph
Fraction of Design Space
Std Er
ror M
ean

Impact factor: 3.958/ICV: 4.10 ISSN: 0976-7908 369
Sunil et al. / Pharma Science Monitor 8(3), Jul-Sep 2017, 355-374
Table 6: Validation Batches (RPGFT1 & RPGFT2): Predicted Response
Batch
No
Carbop
ol (X1)
HPMC
(X2)
Buoyan
cy -%
(Y1)
Total
floatin
g time
(Y2)
Release
after 12
Hr.%
(Y3)
RPGFT
1015.696 11.117 86.422 18.54 72.53
RPGFT
1115.50 13.90 86.126 18.55 72.76
Table 7: Validation Batches (RPGFT10 & RPGFT11): Actual Response
Batch NoCarbop
ol (X1)
HPMC
(X2)
Buoyan
cy -%
(Y1)
Total
floating
time
(Y2)
Release
after 12
Hr.%
(Y3)
RPGFT1
015.696 11.117 85.412 17.84 73.54
RPGFT1
115.50 13.90 84.361 17.18 71.47
% Cumulative Drug Release Profile:
Figure 11: % Cumulative Drug Release Profile of AT Microsponge (RPGFT10-RPGFT11)
-10
0
10
20
30
40
50
60
70
80
0 2 4 6 8 10 12 14
CUMULATIVE DRUG RELEASE
RPGFT10 RPGFT11

Impact factor: 3.958/ICV: 4.10 ISSN: 0976-7908 370
Sunil et al. / Pharma Science Monitor 8(3), Jul-Sep 2017, 355-374
Selection of Optimized Formulation
RPGFT10 was found & selected validated optimized Batch with having as per its evaluation
report.
Preparation & Characterization of Repaglinide Floating Tablets
Table 8: Formulation Design of Tablet
Ingredient (mg) TMBT1 TMBT2
Repaglinide 5 5
HPMC 14 16
Carbopol 18 18
Sodium bicarbonate 50 50
Citric Acid 10 10
MCC 60 60
Mg. Stearate 3 3
Talc 5 5
Lactose 35 33
Total 200 200
Table 9: Pre-compression Evaluation of powder blend
Batch
Code
Pre-compression Evaluation of powder blend
Bulk density
(gm/cm3)
(n=3)
Tapped Density
(gm/cm3)
(n=3)
Carr’s
Index (%)
Hausner’s
Ratio
Angle of
Repose (θ)
TMBT1 0.526±0.010 0.563±0.005 6.57 1.07 21º
TMBT2 0.539±0.005 0.617±0.012 12.64 1.14 20º
The bulk density & tapped density of lubricated blends was found to be range of 0.526±0.010 to
0.539±0.005 gm/cm3 & 0.563±0.005 to 0.617±0.012 gm/cm3. Carr’s index was found to be range
of 6.57 to 12.64% showed good compressibility. Hausner’s Ratio was found to be range of 1.07
to 1.14 & angle of repose was found to be range of 20º to 21º showing good flow property.
Post-compression evaluation parameter of tablets:
Impact factor: 3.958/ICV: 4.10 ISSN: 0976-7908 371
Sunil et al. / Pharma Science Monitor 8(3), Jul-Sep 2017, 355-374
Hardness: The hardness of tablets of all batches was found to be in range of 4.67 ± 0.2 to 4.78 ±
0.1 kg/cm2. The thickness of tablets of all batches was found to be in range of 3.44±0.15 to
3.49±0.15 mm. Friability of tablets measured by using Roche friability apparatus. The friability
of all tablets of all batches was come within official limit of not more than 1%. Weight variation
study was performed using analytical weight balance. All batches pass weight variation test as %
deviations are within range of ± 7.5 %.
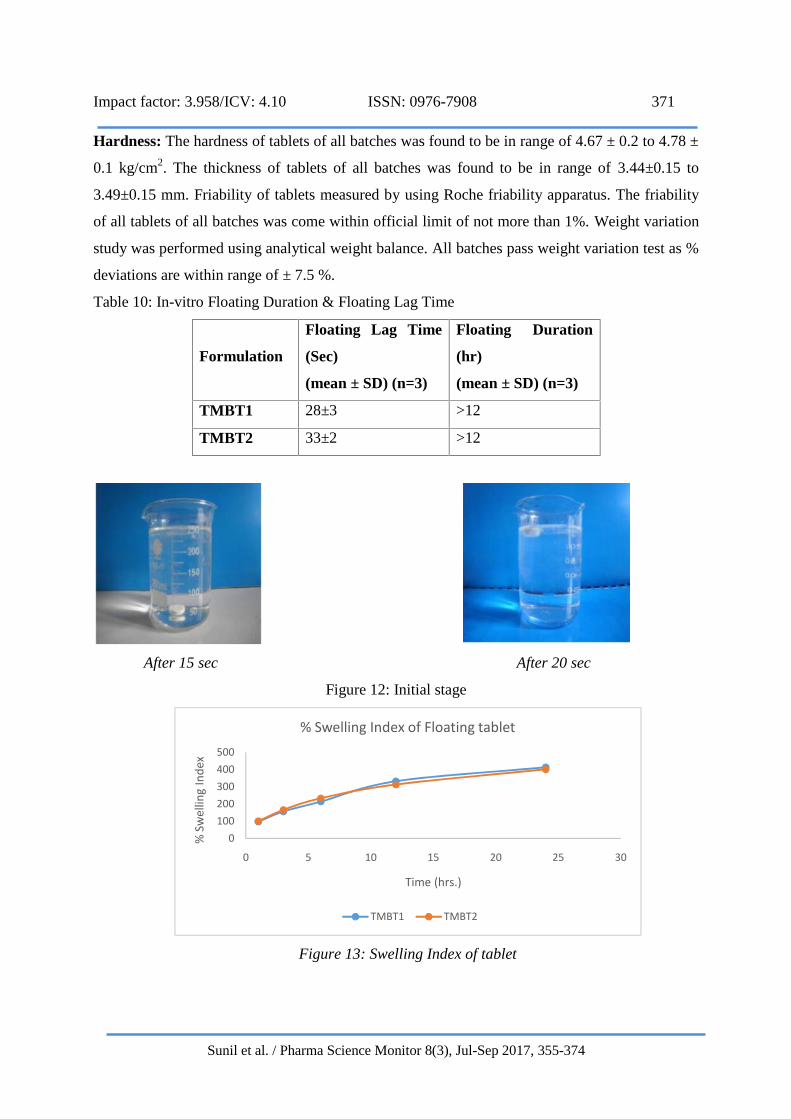
Table 10: In-vitro Floating Duration & Floating Lag Time
Formulation
Floating Lag Time
(Sec)
(mean ± SD) (n=3)
Floating Duration
(hr)
(mean ± SD) (n=3)
TMBT1 28±3 >12
TMBT2 33±2 >12
After 15 sec After 20 sec
Figure 12: Initial stage
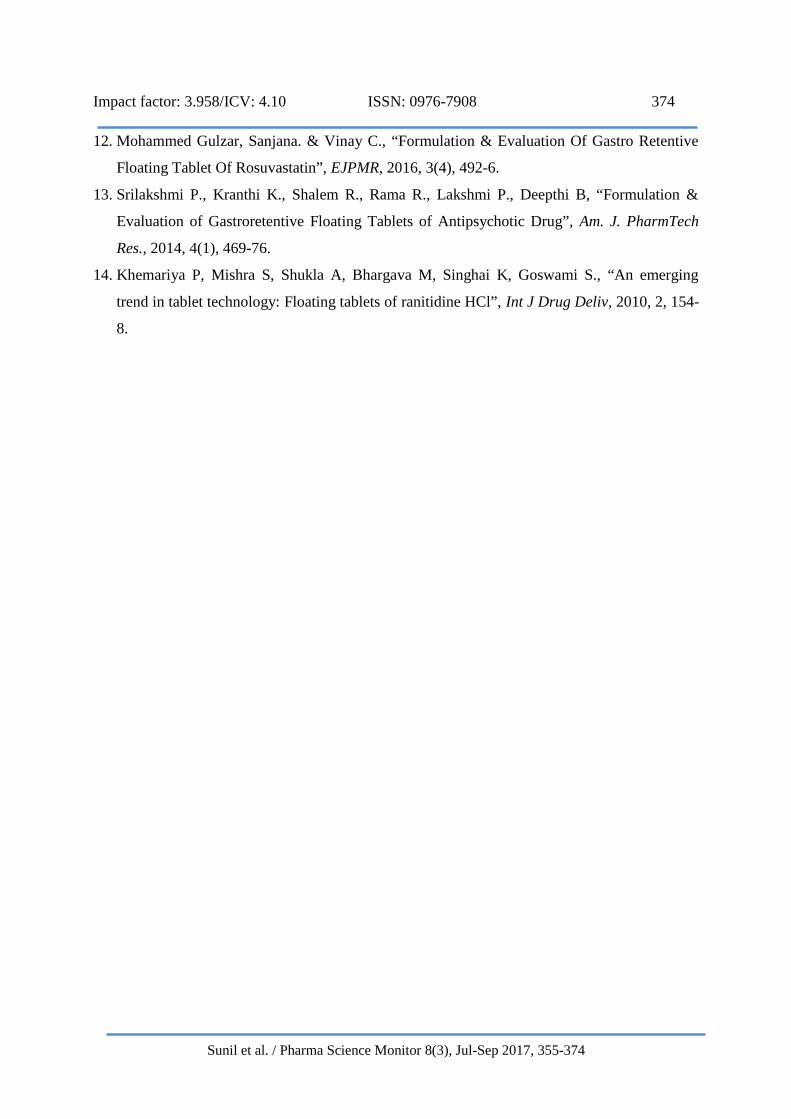
Figure 13: Swelling Index of tablet
0100200300400500
0 5 10 15 20 25 30
% S
wel
ling
Inde
x
Time (hrs.)
% Swelling Index of Floating tablet
TMBT1 TMBT2

Impact factor: 3.958/ICV: 4.10 ISSN: 0976-7908 372
Sunil et al. / Pharma Science Monitor 8(3), Jul-Sep 2017, 355-374
Figure 14: Swelling Index of tablet
Evaluation data for % drug release of formulated tablets & comparison with marketed
conventional Formulation
Figure 15: Drug Release Profile
Release Kinetic
The results indicate that there was no evident of change in physical appearance & % drug content
of formulations after subjecting them to stability studies. Optimized Repaglinide (RPGFT10)
loaded tablet formulation was chosen for stability studies from each concentration & each
polymer based on their release characteristics & no significant changes when compared to initial
formulations.
-100
102030405060708090
1 2 3 4 5 6 7 8 9
% C
DR
time (hrs.)
% Drug Release comparission with marketed Formulation
Time (hrs.)
TMBT1
TMBT2
Marketed ConventionalFormulation

Impact factor: 3.958/ICV: 4.10 ISSN: 0976-7908 373
Sunil et al. / Pharma Science Monitor 8(3), Jul-Sep 2017, 355-374
CONCLUSION
The floating tablets were evaluated for their physico-chemical properties, in-vitro release and
stability studies. The order of Swelling index was found to be Carbopol 934P > sodium alginate
> HPMC K100M > HPMC K15M > HPMC K4M. Sodium bicarbonate at the concentration of
14 %w/w was found to be ideal in achieving the buoyancy. The buoyancy lag time was found to
be less than 1 minute. In all formulations prepared, to be released 80.12% of drug in a period of
12 hrs. Tablets followed diffusion controlled first order kinetics.
REFERENCES
1. Kaur Mandeep, A.C. Rana & Seth Nimrata, “Fast Dissolving Films: Innovative Drug
Delivery System” International Journal of Pharmaceutical Research & Allied Sciences,
2013, 2, 14-24.
2. Narang N, "An updated review on: floating drug delivery system (fdds)" Int. J. App.
Pharm.2011, 3, 1-7.
3. Kaur M & Bala R, “chronotherapy: review”Int. J Pharm Sci. Res. 2013, 4, 90-102. Nayak
KP,Upadhyay P, Valera AR & Chauhan NP,“Gastroretentive drug delivery systems & recent
approaches”J Pharm Res. Opin.2012, 2, 1- 8.
4. www.wikipedia.com
5. www.drugbank.com
6. Biswajit B., Formulation & Evaluation of Repaglinide Buccal Tablet: Ex Vivo Bioadhesion
Study & Ex Vivo Permeability Study, J. of Applied Pharm. Sci., 2014, 4(05), 96-103.
7. Sandhya P. (2014), Formulation & Evaluation Of Repaglinide Biphasic Mini Tablets, J. of
Pharm. & Bio. Sci., 2014, 9(1), 66-73.
8. Harika K. (2013), influence of hydroxypropyl-β-cyclodextrin on repaglinide release from
sustained release bioadhesive buccal tablets, Asian J. Pharm. Clin. Res.,6 (3), 184-90.
9. Jitender J. (2012), Formulation & evaluation of solid matrix tablets of repaglinide, Der
Pharmacia Sinica, 3(5), 598-603.
10. Haritha Siddam, Niranjan G. Kotla, Balaji Maddiboyina, Sima Singh, Omprakash Sunnapu,
Anil Kumar, Dinesh Sharma, “Formulation & evaluation of atenolol floating bioadhesive
system using optimized polymer blends”, International Journal of Pharmaceutical
Investigation, 2016, 6(2), 116-22.
11. Vishal Yadav, Prakash Jadhav, Pranali Salunkhe, Priti Nikam, Shital Matkar, “Formulation
& Evaluation Of Gastroretentive Tablets Of Antiulcer Drug”, Asian J Pharm Clin Res, 2016,
9(6), 48-52.
Impact factor: 3.958/ICV: 4.10 ISSN: 0976-7908 374
Sunil et al. / Pharma Science Monitor 8(3), Jul-Sep 2017, 355-374
12. Mohammed Gulzar, Sanjana. & Vinay C., “Formulation & Evaluation Of Gastro Retentive
Floating Tablet Of Rosuvastatin”, EJPMR, 2016, 3(4), 492-6.
13. Srilakshmi P., Kranthi K., Shalem R., Rama R., Lakshmi P., Deepthi B, “Formulation &
Evaluation of Gastroretentive Floating Tablets of Antipsychotic Drug”, Am. J. PharmTech
Res., 2014, 4(1), 469-76.
14. Khemariya P, Mishra S, Shukla A, Bhargava M, Singhai K, Goswami S., “An emerging
trend in tablet technology: Floating tablets of ranitidine HCl”, Int J Drug Deliv, 2010, 2, 154-
8.