Embed Size (px)
Citation preview
June, 2019 Vol. 18 No. 1
ISSN 0856-664X
Division of Research & Dev.Ministry of Agriculture,
Dar es salaam
An International
Journal ofBasic and Applied
Research
College of AgricultureSokoine University of AgricultureMorogoro, Tanzania
Published by:
( TA J A S )
www.sua.ac.tz
www.coa.ac.tz/college_agriculture

TANZANIA JOURNAL OF AGRICULTURAL SCIENCES
June, 2019 Vol. 18 No. 1
An International Journal of Basic and Applied Research
ii Tanzania Journal of Agricultural SciencesEditor- in-Chief Prof. C.N. Nyaruhucha Department of Food Technology, Nutrition and Consumer Sciences, SUA.
Deputy Editor- in-ChiefDr H. Tindwa Department of Soil Science Sokoine University of Agriculture, Morogoro Dr. J.M. Nkuba MALF
Editorial Advisory BoardProf. S. Deckers KU Leuven, BelgiumDr. H. Tindwa Department of Soil and Geological Sciences, Sokoine University of Agriculture, MorogoroDr. J.M. Nkuba MALFProf. M. Erbaugh OSU, USA.Prof. D. Mwaseba Dept. of Agric. Extension and Community Development, SUA, MorogoroProf. L.O. Eik UMB, NORWAY.Dr. G. Rwegasira Department of Crop Sciences and Horticulture, SUA, MorogoroDr. D.M. Komwihangilo TALIRI, Mpwapwa, Dodoma .Dr. A. Shoko TAFIRI, Dar es SalaamDr. C.Z. Mkangwa ARI – Mlingano, TANGA Dr. L.M. Chove Dept. of Food Technology, Nutrition and Consumer Sciences, SUA.
The Scientific/Technical Editors Sub-committee of Tanzania Journal of Agricultural Sciences Dr. T. Jumbe Dept. of Food Technology, Nutrition and Consumer Sciences, SUA, Morogoro.Dr. B. Msangi Commission for Science and Technology (COSTECH), Dar es Salaam.Prof. P. Kusolwa Department of Crop Sciences and Horticulture, SUA, Morogoro.Prof. F. Kahimba Department of Engineering Sciences and Technology, SUA, MorogoroDr. D. Mushi Department of Animal Aquaculture and Range Sciences, SUA, Morogoro
Promotion Committee Dr. N. Madalla Department of Animal Aquaculture and Range Sciences, SUA. Dr. S. Kashenge ARI Cholima, MALFDr. T. Kaijage MALFProf. R. Haug NMBU, NorwayMrs. J. Mkindi TAHA, Arusha
Consulting Editors:Senior scientists in various fields of agricultural sciences within and outside the country shall act as peer reviewers of scientific manuscripts submitted to the Journal.
General InformationAims and Scope:- Tanzania Journal of Agricultural Sciences is a peer reviewed scientific journal that publishes original and scholarly research articles dealing with fundamental and applied aspects of Agriculture, Food Aquaculture and Wildlife. Occasionally invited review articles will be published as well.
Frequency of PublicationTanzania Journal of Agricultural Sciences will be published twice a year, one volume a year. The first issue will be published in June and the second in December of each year.
SubscriptionTanzania Shillings 88,000 or US $ 40 per issue.Price per issue is TZS 60,000 (Tanzania Institutions), T.Shs. 30,000 (Tanzania Scientists), TZS. 88,000 (Foreign subscribers) and should be sent to: Editor-In-Chief, TAJAS, Sokoine University of Agriculture, P. O. Box 3000, Morogoro, Tanzania; E-mail address: [email protected]
Tanzania Journal of Agricultural Sciences (2019) Vol. 18 No. 1
iiiTable of Contents
Economic Efficiency Analysis of Dairy Farmers Participating in Dairy Market Hubs in Tanga and Morogoro regions, Tanzania........................................................................................1Bayiyana, I., A. Hepelwa and E.J.O. Rao
Increased Productivity in Tanzanian Cattle is the Main Approach to Reduce Methane Emission per Unit of Product..........................................................................................................14Weisbjerg, M.R., Terkelsen, M., Hvelplund, T., Lund, P. and Madsen, J.
Weather Related Challenges and Transitory Food Insecurity in Semiarid Mixed Crop-Livestock Systems in Manyoni District, Tanzania................................................................22Urassa, N.S. and E.Y. Swai
Determinants of Yam Production and Resource use Efficiency under Agroforestry System in Edo State, Nigeria......................................................................................................35Idumah, F.O. and P.T. Owombo
Technical Note on Promoting Integrated Soil, Water and Nutrient Management Technologies in Southern Highlands Zone of Tanzania..................................................................43Mzimbiri, M.K., J.U.Z. Malley, and W.N. Mmari
An International Journal of Basic and Applied Research
iv Editorial
The College of Agriculture (CoA) formerly known as Faculty of Agriculture (FoA) of the Sokoine University of Agriculture (SUA) has been in existance for over 30 years. Among its
major responsibilities is to provide research leadership in all aspects of agriculture and food. In order to discharge this national responsibility, scientists in the College work closely with colleagues in other Colleges and the Ministry of Agriculture, Livestock and Fisheries (MALF). This close collaboration between SUA and MALF in enhancing agricultural development has been the main drive behind the initiative to start this point publication of the Tanzania Journal of Agricultural Sciences.
The Tanzania Journal of Agricultural Sciences (TAJAS) endeavors to bring together academic contributions in the field of agriculture in its broad term with the main aim being to:■ Focus on and foster the science of agriculture■ Provide a new leading source of information and knowledge in all fields of agriculture.
Thus, TAJAS provides a platform and outlet of publications for scientists, researchers and scholars in the field of agriculture. The scope of TAJAS encompasses original research (basic and applied), comprehensive up-to-date reviews and technical notes.
The development of this journal is the result of interest and tireless effort by many scientists from CoA and MALF. The Technical Editors subcommittee, the Editorial Advisory Board, the Promotion Subcommittee and peer reviewers have great responsibility towards the shaping and the growth of the journal. The Editor-in-Chief is deeply grateful to these persons for their work.
The contents and the extent of this journal will be determined by what the subscibers and contributors want and need. Your constant comments will assist in improving the journal and earn your growing respect. It is the hope of CoA, MALF and the Editors that TAJAS will meet the expectations of the local, regional and International scientific community in the field of agriculture and applied sciences.
Prof. C.N. Nyaruhucha Editor-in-Chief
Tanzania Journal of Agricultural Sciences (2019) Vol. 18 No. 1, 1-12
Introduction
Dairy farming is an important livelihood option for many poor rural households in
the developing world, providing an important source of nutrients (Chandio et al., 2017) (Duncan et al., 2013; Thorpe et al., 2000) and contributing to household incomes (Rao et al., 2016). Even though dairying offers promising opportunities to combat poverty, there is a significant risk that dairy development will exclude smallholder poor farmers such as women (Mishkin et al., 2018) (Rota, 2009). Developed and emerging nations have intensified milk production in order to reap the benefits of economies of scale while in many developing countries, milk production remains small-scale, scattered and poorly integrated into the market chain (Ngeno, 2018) (Bennett et al., 2005). To minimize costs, modern retailers often impose strict standards, which often exclude resource-poor producers (Schipmann and Qaim, 2011). However, restructuring supply chains
might also have impacts on economic efficiency and farm productivity; aspects which have not been sufficiently analyzed for less and pre-commercial dairy farmers so far.
Compared to extensive dairying, intensive dairy production often entails more sophisticated planning and use of inputs, which could positively influence cost/economic efficiency (Omore 2013). Economic efficiency is crucial to production, marketing and trade (Karamagi, 2002). Economic efficiency is a composite product of technical and allocative efficiency (Adesina and Djato, 2008). Hence, economic efficiency is defined as the firm’s capacity to produce a given amount of output at the minimum cost for a predetermined level of technology (Mburu et al. 2014). The hypothesis here is that optimal use of inputs is relevant and could contribute to improvements in dairy productivity and efficiency (Maina et al., 2018). If this is the case, intensive dairy farming could
Economic Efficiency Analysis of Dairy Farmers Participating in Dairy Market Hubs in Tanga and Morogoro regions, Tanzania
*Irene Bayiyana1, Aloyce Hepelwa1 and Elizaphan J.O. Rao2
1University of Dar es Salaam, Department of Economics 2International Livestock Research Institute (ILRI)
*Corresponding author’s e-mail address: [email protected]
AbstractThe regular supply of reliable quality milk may call for a hub approach where dairy services are clustered around a milk buyer under some form of contractual agreement. However, empirical evidence on the economic efficiency of hub participating farmers is limited. The objective of this study is to determine the economic efficiency of dairy farmers participating in dairy market hubs (DMHs). The study uses secondary data collected from 384 smallholder dairy farmers in Tanga and Morogoro regions and employs stochastic frontier translog cost model to estimate the level of economic efficiency among smallholder dairy farmers participating in DMHs. Results indicate that economic efficiency index ranged from 0.003-0.999 with a mean of 0.932 points implying that the sampled farmers were close to being fully economically efficient in the allocation of resources for producing a given level of milk output. Key factors indirectly related to cost inefficiency were education level, age, hub membership, and farmer location. These results indicate that new entrants especially the youths need to be encouraged to rear dairy cows. In addition, there is a need to provide farmers with basic information through trainings on profitable dairying, better technology and practices so as to improve their knowledge and skills.
Keywords – Dairy market hub, economic efficiency, smallholder, stochastic frontier
An International Journal of Basic and Applied Research
2 Bayiyana et al.
contribute to the needed dairy productivity and efficiency gains in Africa, with important positive effects for poverty reduction and rural development (World Bank, 2008).
This can be indicated by a decent standard of living, higher incomes and purchasing power or command over economic resources hence reduced poverty (UNDP and URT 2015). Whether the rise in farm income will be shared by poor smallholders who need it most is still controversial unless their efficiency is improved. Thus, using stochastic frontier cost function, the economic efficiency of smallholder dairy farmers is examined in this study. This study aims at estimating the level of economic efficiency among smallholder dairy farmers participating in the hubs in Tanga and Morogoro regions.
Methodology Theoretical frameworkThe study follows the contemporary production theory which looks at the implications of recent work using duality and translog specifications of the production functions for agricultural research (Debertin, 2002; Nguyen et al., 2008). These theoretical developments have a broad-based applicability to research in production economics and demand analysis for agricultural problems at varying levels of aggregation.
Farm efficiency is the ability of a farm to produce its output without wasting resources. An economically efficient farm is one that operates at the point of tangency between the production isoquant and the isocost line for a given output (Coelli et al., 2005). Given the situation of the Tanzanian dairy sector, dairy farmers are facing decisions of whether or not to intensify their production scale. According to economic principles, only producers who achieve low-cost production by pursuing economies of scale and management efficiency through the appropriate use of production technologies can survive over time in a competitive industry such as the dairy sector (FAO, 2010). Therefore, it is very important to understand differences in household efficiency in utilizing the resources (land, feed and labour) to achieve household
objectives.
There are three distinct approaches to measure the firm efficiency based on production, cost and profit functions (Parikh and Ali, 1995; Shaik, 2014). Coelli et al., (2005) distinguish between technical and allocative efficiency as a measure of production efficiency using a production frontier and cost function respectively. The cost function represents the dual approach in that technology is seen as a constant towards the optimizing behaviour of firms (Chambers and Quiggin, 1998). The cost function can be used to simultaneously predict both technical and allocative efficiency of a firm (Coelli, 1994).
This study has adopted a stochastic cost frontier approach following Coelli et al., (2005). This approach is stochastic and the observations may be off the frontier because they are inefficient or because of random shocks or measurement errors. The cost function approach is preferred over the profit function approach to avoid problems of estimation that may arise in situations where farm households realize zero or negative profits at the prevailing market prices (Gronberg et al., 2005). Dairy farmers use four inputs: purchased feed (F), hired labour (L), dairy cows (C), and other inputs (O) (Katsumata and Tauer, 2008). The other inputs category includes inputs for care and maintenance of the dairy herd such as veterinary drugs, bedding, and operator and family labour. Kumbhakar et al. (1991) defined the stochastic cost function as:C f y w v uit it it it it= + +( , ) ( ) (1)
Where, vit values are assumed to be independently and identically distributed N(0,σ2
v) two sided random errors, independent of the uit. uit are non-negative unobservable random variables associated with cost inefficiency or economic inefficiency, which are assumed to be independently and identically distributed as truncations at zero of the \N(0,σ2
u)\ distribution, μit being a vector of effects specific to smallholder dairy farms, Cit is the cost associated with milk production, yit is the milk output and wit is the vector of input prices.
Tanzania Journal of Agricultural Sciences (2019) Vol. 18 No. 1, 1-12
3Economic Efficiency Analysis of Dairy Farmers Participating in Dairy Market
In the cost inefficiency effects model, the error term is composed of two components: cost inefficiency effects and statistical noise. The two error components represent two entirely different sources of random variation in cost levels that cannot be explained by output and input prices. The cost inefficiency effects could be specified as:u z Wit it it= +δ (2)
Where zit is a vector representing possible inefficiency determinants, and δ is a vector of parameters to be estimated. Wit, is defined by the truncation of the normal distribution with mean zero and variance σ2. The parameters of the stochastic frontier and the inefficiency model are simultaneously estimated. uit provides information on the level of cost inefficiency of farm i.
The level of cost inefficiency CIit may be calculated as the ratio of frontier minimum cost (on the cost frontier) to the observed cost conditioned on the level of the farm output. This measure has a minimum value of one. Cost inefficiency can therefore be defined as the amount by which the level of production cost index for the firm is greater than the firm cost frontier. An estimated measure of cost inefficiency index for dairy farm i is:CI uit it= −exp( ) (3)
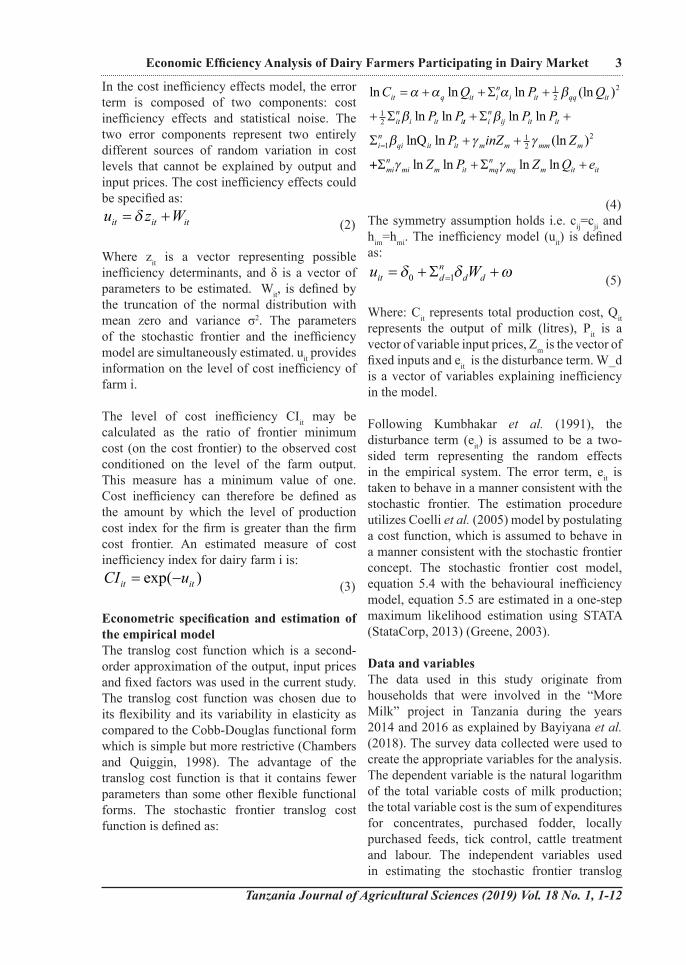
Econometric specification and estimation of the empirical modelThe translog cost function which is a second-order approximation of the output, input prices and fixed factors was used in the current study. The translog cost function was chosen due to its flexibility and its variability in elasticity as compared to the Cobb-Douglas functional form which is simple but more restrictive (Chambers and Quiggin, 1998). The advantage of the translog cost function is that it contains fewer parameters than some other flexible functional forms. The stochastic frontier translog cost function is defined as:
ln ln ln (ln )
ln ln
C Q P Q
P Pit q it i
ni it qq it
itn
i it i
= + + +
+
α α α β
β
Σ
Σ
12
2
12 tt i
nij it it
in
qi it it m m mm m
P P
P inZ Z
+ +
+ +=
Σ
Σ
β
β γ γ
ln ln
lnQ ln (ln )112
2
++ + +Σ Σmin
mi m it mqn
mq m it itZ P Z Q eγ γln ln ln ln
(4)The symmetry assumption holds i.e. cij=cji and him=hmi. The inefficiency model (uit) is defined as:u Wit d
nd d= + +=δ δ ω0 1Σ (5)
Where: Cit represents total production cost, Qit represents the output of milk (litres), Pit is a vector of variable input prices, Zm is the vector of fixed inputs and eit is the disturbance term. W_d is a vector of variables explaining inefficiency in the model.
Following Kumbhakar et al. (1991), the disturbance term (eit) is assumed to be a two-sided term representing the random effects in the empirical system. The error term, eit is taken to behave in a manner consistent with the stochastic frontier. The estimation procedure utilizes Coelli et al. (2005) model by postulating a cost function, which is assumed to behave in a manner consistent with the stochastic frontier concept. The stochastic frontier cost model, equation 5.4 with the behavioural inefficiency model, equation 5.5 are estimated in a one-step maximum likelihood estimation using STATA (StataCorp, 2013) (Greene, 2003).
Data and variablesThe data used in this study originate from households that were involved in the “More Milk” project in Tanzania during the years 2014 and 2016 as explained by Bayiyana et al. (2018). The survey data collected were used to create the appropriate variables for the analysis. The dependent variable is the natural logarithm of the total variable costs of milk production; the total variable cost is the sum of expenditures for concentrates, purchased fodder, locally purchased feeds, tick control, cattle treatment and labour. The independent variables used in estimating the stochastic frontier translog
An International Journal of Basic and Applied Research
4 Bayiyana et al.
cost function were natural logarithms of milk output value, price of animal feeds, price of animal health, labour wage rate, and areas of dairy grazing as fixed inputs. Milk output value variable was computed by multiplying the total milk produced in six months by average milk price.
To compute the price of feeds variable, the total expenditure and quantities for each respective feed was obtained for each household. The price was then obtained by dividing expenditure by the respective quantities of feed purchased in six months. The prices were added together across the feeds and a natural logarithm was obtained for the price of a bundle of feeds. The feeds included were concentrates, purchased fodder and crop residues.
The price of animal health variable was estimated by dividing the annual expenditure on tick control and cow treatment by the total number of the respective administrations, to get the price per treatment. The two prices were added together and the natural logarithm was computed for the total price of animal health treatment. However, this was removed from the model because it was not significant. The labour wage rate was computed by calculating the total monthly expenditure of labour on dairy cattle and the total number of person-hours. A division between these two variables resulted in the prevailing monthly wage rate for each household. All of the above four variables were expected to have a positive effect on the dependent variable. The fixed costs included in the analysis were the areas of dairy cattle grazing and these were taken as a proxy of cultivated land.
This calculation assumes that the cost of producing non-milk products is equal to their value. Although the translog cost function can accommodate multiple outputs, this approach and approximation to estimating the cost of non-milk products can be justified because the sales of non-milk products were small compared to the milk sales (less than 10%) for each farm in the survey, and that small percentage represents mostly by-products from milk production, such
as calves, skins and hides, fermented milk and cull dairy cows.
Several variables were hypothesised as being responsible for the estimated farm-specific cost/ economic inefficiencies (Table 1). On an a priori basis, age and education level were expected to have a positive effect on the level of economic efficiency as they embody strength and skills which can improve cost efficiency. The a priori expectation is that the level of market integration in dairy production would increase economic efficiency as it allows a household to acquire market information that enables it to have higher economic efficiency. Furthermore, most of the dairy inputs and dairy production technologies are interlocked with milk markets and they embody the number of milk cows kept. As such, the number of milk cows is expected to be positively associated with efficiency.
The availability of extension services, credit and production of fodder were expected to increase efficiency. The distance from the farm to the watering point was placed on off-farm employment. Engagement in off-farm income generating activities can reduce the amount of labour available for on-farm production. Nevertheless, off-farm incomes can be used to purchase inputs and hiring of labour thereby enhancing efficiency. The distance from homestead to the nearest trading centre is the section of infrastructure which is expected to influence efficiency. Expectations were that a higher distance would reduce efficiency since being far away from urban areas makes it difficult to access urban markets (Kavoi et al., 2010).
Farmers in Lushoto and Mvomero districts were relatively more intensive and commercial oriented hence expected to be more economically efficient than their counterparts in Handeni and Kilosa districts. Therefore, intensifying and commercialising dairy farming in marginalised areas was expected to reduce inefficiency.
Tanzania Journal of Agricultural Sciences (2019) Vol. 18 No. 1, 1-12
5Economic Efficiency Analysis of Dairy Farmers Participating in Dairy Market
For the average dairy farmer to attain the level of the most economically efficient farmer in the sample, he or she requires a cost saving of 1 100−
×
meanma imumx
% . The least economically
efficient farmer requires a cost saving of 1 100−
×
minimummean
% [1-minimum/mean]x100%
if he or she is to attain the level of the average dairy farmer in the sample.
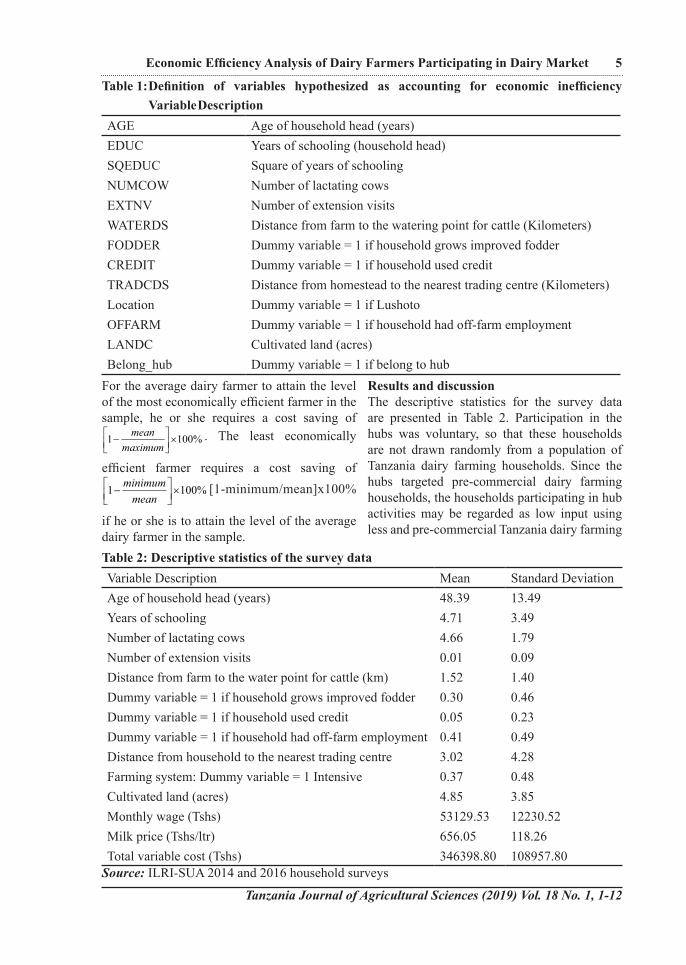
Results and discussionThe descriptive statistics for the survey data are presented in Table 2. Participation in the hubs was voluntary, so that these households are not drawn randomly from a population of Tanzania dairy farming households. Since the hubs targeted pre-commercial dairy farming households, the households participating in hub activities may be regarded as low input using less and pre-commercial Tanzania dairy farming
Table 1: Definition of variables hypothesized as accounting for economic inefficiency Variable Description
AGE Age of household head (years)EDUC Years of schooling (household head)SQEDUC Square of years of schoolingNUMCOW Number of lactating cowsEXTNV Number of extension visitsWATERDS Distance from farm to the watering point for cattle (Kilometers)FODDER Dummy variable = 1 if household grows improved fodder CREDIT Dummy variable = 1 if household used credit TRADCDS Distance from homestead to the nearest trading centre (Kilometers)Location Dummy variable = 1 if Lushoto OFFARM Dummy variable = 1 if household had off-farm employment LANDC Cultivated land (acres)Belong_hub Dummy variable = 1 if belong to hub
Table 2: Descriptive statistics of the survey dataVariable Description Mean Standard DeviationAge of household head (years) 48.39 13.49Years of schooling 4.71 3.49Number of lactating cows 4.66 1.79Number of extension visits 0.01 0.09Distance from farm to the water point for cattle (km) 1.52 1.40Dummy variable = 1 if household grows improved fodder 0.30 0.46Dummy variable = 1 if household used credit 0.05 0.23Dummy variable = 1 if household had off-farm employment 0.41 0.49Distance from household to the nearest trading centre 3.02 4.28Farming system: Dummy variable = 1 Intensive 0.37 0.48Cultivated land (acres) 4.85 3.85Monthly wage (Tshs) 53129.53 12230.52Milk price (Tshs/ltr) 656.05 118.26Total variable cost (Tshs) 346398.80 108957.80
Source: ILRI-SUA 2014 and 2016 household surveys
An International Journal of Basic and Applied Research
6 Bayiyana et al.
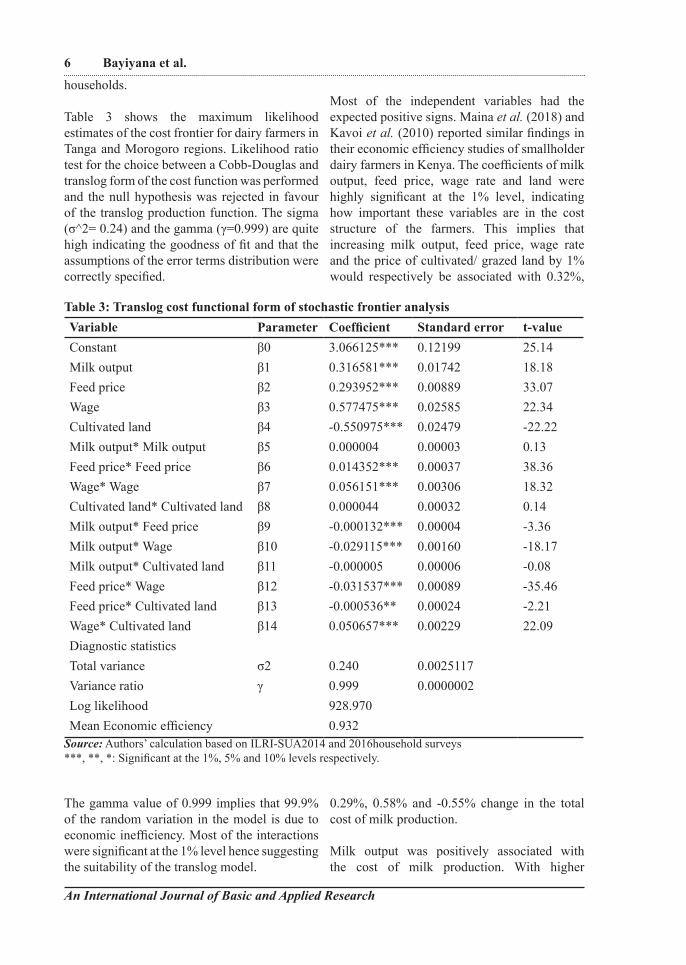
households. Table 3 shows the maximum likelihood estimates of the cost frontier for dairy farmers in Tanga and Morogoro regions. Likelihood ratio test for the choice between a Cobb-Douglas and translog form of the cost function was performed and the null hypothesis was rejected in favour of the translog production function. The sigma (σ^2= 0.24) and the gamma (γ=0.999) are quite high indicating the goodness of fit and that the assumptions of the error terms distribution were correctly specified.
The gamma value of 0.999 implies that 99.9% of the random variation in the model is due to economic inefficiency. Most of the interactions were significant at the 1% level hence suggesting the suitability of the translog model.
Most of the independent variables had the expected positive signs. Maina et al. (2018) and Kavoi et al. (2010) reported similar findings in their economic efficiency studies of smallholder dairy farmers in Kenya. The coefficients of milk output, feed price, wage rate and land were highly significant at the 1% level, indicating how important these variables are in the cost structure of the farmers. This implies that increasing milk output, feed price, wage rate and the price of cultivated/ grazed land by 1% would respectively be associated with 0.32%,
0.29%, 0.58% and -0.55% change in the total cost of milk production.
Milk output was positively associated with the cost of milk production. With higher
Table 3: Translog cost functional form of stochastic frontier analysisVariable Parameter Coefficient Standard error t-valueConstant β0 3.066125*** 0.12199 25.14Milk output β1 0.316581*** 0.01742 18.18Feed price β2 0.293952*** 0.00889 33.07Wage β3 0.577475*** 0.02585 22.34Cultivated land β4 -0.550975*** 0.02479 -22.22Milk output* Milk output β5 0.000004 0.00003 0.13Feed price* Feed price β6 0.014352*** 0.00037 38.36Wage* Wage β7 0.056151*** 0.00306 18.32Cultivated land* Cultivated land β8 0.000044 0.00032 0.14Milk output* Feed price β9 -0.000132*** 0.00004 -3.36Milk output* Wage β10 -0.029115*** 0.00160 -18.17Milk output* Cultivated land β11 -0.000005 0.00006 -0.08Feed price* Wage β12 -0.031537*** 0.00089 -35.46Feed price* Cultivated land β13 -0.000536** 0.00024 -2.21Wage* Cultivated land β14 0.050657*** 0.00229 22.09Diagnostic statisticsTotal variance σ2 0.240 0.0025117Variance ratio γ 0.999 0.0000002Log likelihood 928.970Mean Economic efficiency 0.932
Source: Authors’ calculation based on ILRI-SUA2014 and 2016household surveys***, **, *: Significant at the 1%, 5% and 10% levels respectively.
Tanzania Journal of Agricultural Sciences (2019) Vol. 18 No. 1, 1-12
productivity, fewer cows are needed to produce more litres of milk, hence reducing shelter and labour costs plus the amount of feed energy needed in production (FAO, 2018). The coefficient of feed price variable was positively related to the cost of milk production and significant at 1% level. Maina et al. (2018) and Kavoi et al. (2010) reported similar findings. A plausible reason for the positive relationship is that although feeding has the greatest potential for improving profitability of the majority of farming units, it contributes significantly to the cost of milk production (Bennett et al., 2005). To reduce feed related costs, there is a need to promote greater reliance on forage in general and grass in particular since dairy costing often shows worthwhile reductions in concentrate and other purchased feed costs regardless of the production level (AHDB, 2018).
Land holding affected the cost of milk production negatively and was significant at 1% level. A plausible reason for the negative relationship is that the study was done in marginalized rural areas where farmers occupied larger pieces of land and some grazing land is sometimes deserted and not grazed (Hogg, 1987). So, land for grazing was not costly.
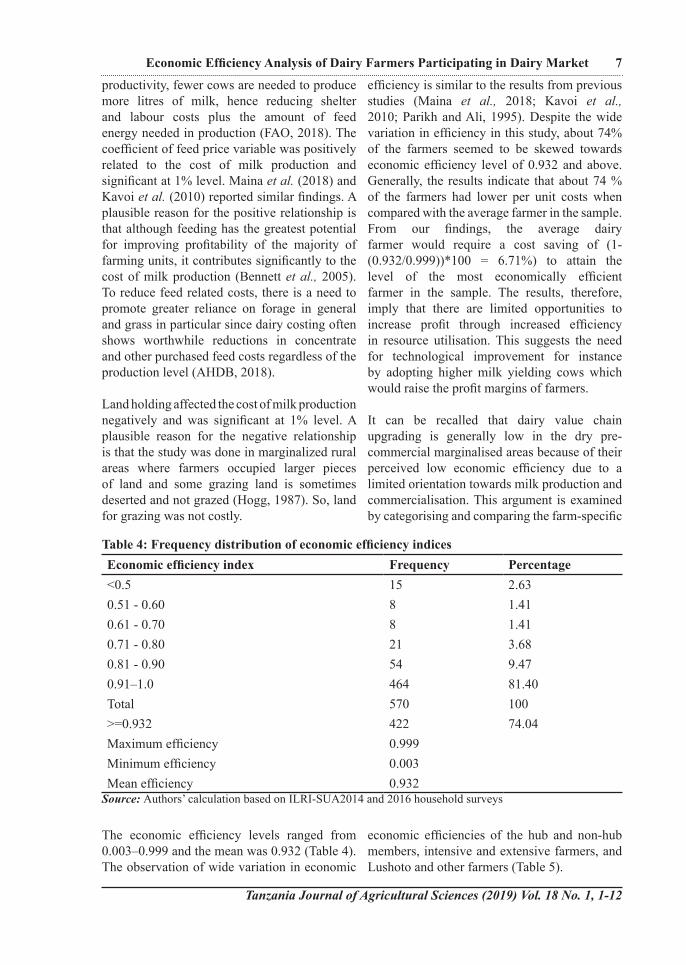
The economic efficiency levels ranged from 0.003–0.999 and the mean was 0.932 (Table 4). The observation of wide variation in economic
efficiency is similar to the results from previous studies (Maina et al., 2018; Kavoi et al., 2010; Parikh and Ali, 1995). Despite the wide variation in efficiency in this study, about 74% of the farmers seemed to be skewed towards economic efficiency level of 0.932 and above. Generally, the results indicate that about 74 % of the farmers had lower per unit costs when compared with the average farmer in the sample.From our findings, the average dairy farmer would require a cost saving of (1-(0.932/0.999))*100 = 6.71%) to attain the level of the most economically efficient farmer in the sample. The results, therefore, imply that there are limited opportunities to increase profit through increased efficiency in resource utilisation. This suggests the need for technological improvement for instance by adopting higher milk yielding cows which would raise the profit margins of farmers.
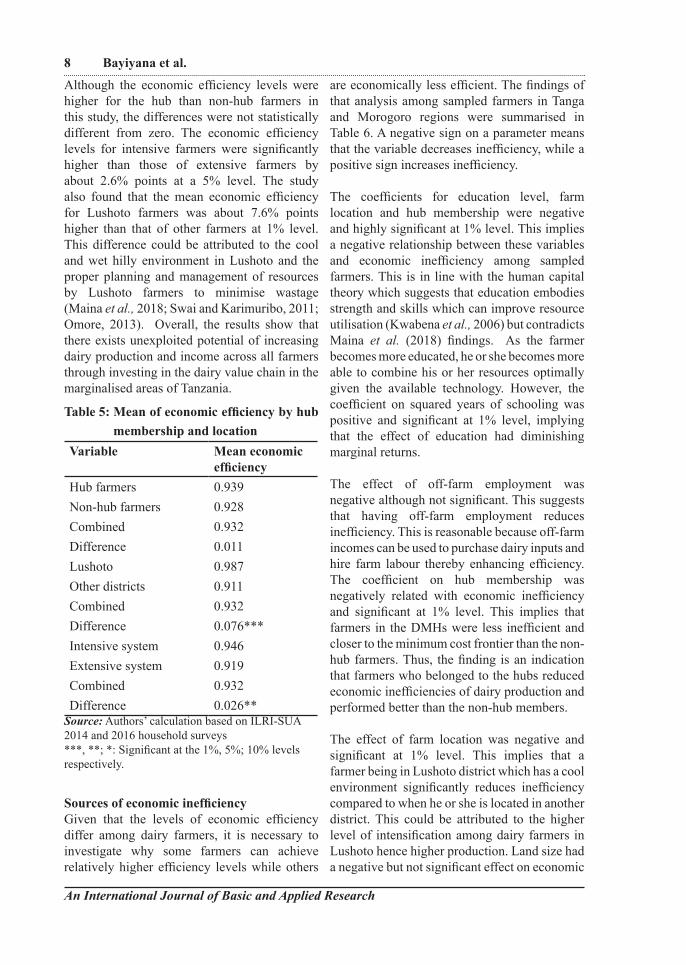
It can be recalled that dairy value chain upgrading is generally low in the dry pre-commercial marginalised areas because of their perceived low economic efficiency due to a limited orientation towards milk production and commercialisation. This argument is examined by categorising and comparing the farm-specific
economic efficiencies of the hub and non-hub members, intensive and extensive farmers, and Lushoto and other farmers (Table 5).
7Economic Efficiency Analysis of Dairy Farmers Participating in Dairy Market
Table 4: Frequency distribution of economic efficiency indicesEconomic efficiency index Frequency Percentage<0.5 15 2.630.51 - 0.60 8 1.410.61 - 0.70 8 1.410.71 - 0.80 21 3.680.81 - 0.90 54 9.470.91–1.0 464 81.40Total 570 100>=0.932 422 74.04Maximum efficiency 0.999Minimum efficiency 0.003Mean efficiency 0.932
Source: Authors’ calculation based on ILRI-SUA2014 and 2016 household surveys
An International Journal of Basic and Applied Research
8 Bayiyana et al.
Although the economic efficiency levels were higher for the hub than non-hub farmers in this study, the differences were not statistically different from zero. The economic efficiency levels for intensive farmers were significantly higher than those of extensive farmers by about 2.6% points at a 5% level. The study also found that the mean economic efficiency for Lushoto farmers was about 7.6% points higher than that of other farmers at 1% level. This difference could be attributed to the cool and wet hilly environment in Lushoto and the proper planning and management of resources by Lushoto farmers to minimise wastage (Maina et al., 2018; Swai and Karimuribo, 2011; Omore, 2013). Overall, the results show that there exists unexploited potential of increasing dairy production and income across all farmers through investing in the dairy value chain in the marginalised areas of Tanzania.
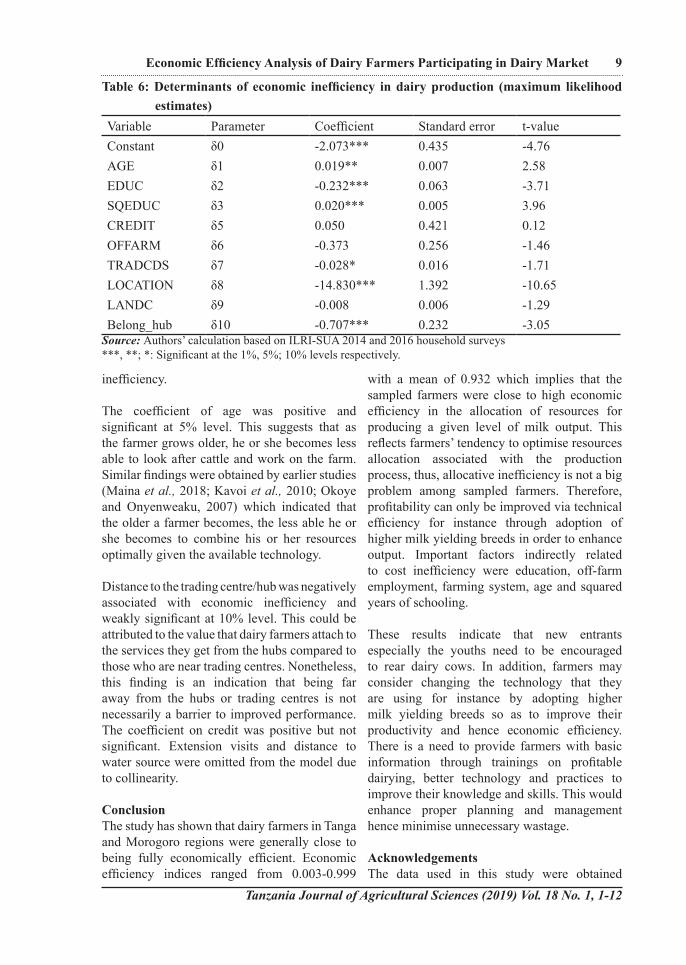
Sources of economic inefficiencyGiven that the levels of economic efficiency differ among dairy farmers, it is necessary to investigate why some farmers can achieve relatively higher efficiency levels while others
are economically less efficient. The findings of that analysis among sampled farmers in Tanga and Morogoro regions were summarised in Table 6. A negative sign on a parameter means that the variable decreases inefficiency, while a positive sign increases inefficiency.
The coefficients for education level, farm location and hub membership were negative and highly significant at 1% level. This implies a negative relationship between these variables and economic inefficiency among sampled farmers. This is in line with the human capital theory which suggests that education embodies strength and skills which can improve resource utilisation (Kwabena et al., 2006) but contradicts Maina et al. (2018) findings. As the farmer becomes more educated, he or she becomes more able to combine his or her resources optimally given the available technology. However, the coefficient on squared years of schooling was positive and significant at 1% level, implying that the effect of education had diminishing marginal returns.
The effect of off-farm employment was negative although not significant. This suggests that having off-farm employment reduces inefficiency. This is reasonable because off-farm incomes can be used to purchase dairy inputs and hire farm labour thereby enhancing efficiency. The coefficient on hub membership was negatively related with economic inefficiency and significant at 1% level. This implies that farmers in the DMHs were less inefficient and closer to the minimum cost frontier than the non-hub farmers. Thus, the finding is an indication that farmers who belonged to the hubs reduced economic inefficiencies of dairy production and performed better than the non-hub members.
The effect of farm location was negative and significant at 1% level. This implies that a farmer being in Lushoto district which has a cool environment significantly reduces inefficiency compared to when he or she is located in another district. This could be attributed to the higher level of intensification among dairy farmers in Lushoto hence higher production. Land size had a negative but not significant effect on economic
Table 5: Mean of economic efficiency by hub membership and location
Variable Mean economic efficiency
Hub farmers 0.939Non-hub farmers 0.928Combined 0.932Difference 0.011Lushoto 0.987Other districts 0.911Combined 0.932Difference 0.076***Intensive system 0.946Extensive system 0.919Combined 0.932Difference 0.026**
Source: Authors’ calculation based on ILRI-SUA 2014 and 2016 household surveys***, **; *: Significant at the 1%, 5%; 10% levels respectively.
Tanzania Journal of Agricultural Sciences (2019) Vol. 18 No. 1, 1-12
inefficiency.
The coefficient of age was positive and significant at 5% level. This suggests that as the farmer grows older, he or she becomes less able to look after cattle and work on the farm. Similar findings were obtained by earlier studies (Maina et al., 2018; Kavoi et al., 2010; Okoye and Onyenweaku, 2007) which indicated that the older a farmer becomes, the less able he or she becomes to combine his or her resources optimally given the available technology.
Distance to the trading centre/hub was negatively associated with economic inefficiency and weakly significant at 10% level. This could be attributed to the value that dairy farmers attach to the services they get from the hubs compared to those who are near trading centres. Nonetheless, this finding is an indication that being far away from the hubs or trading centres is not necessarily a barrier to improved performance. The coefficient on credit was positive but not significant. Extension visits and distance to water source were omitted from the model due to collinearity.
Conclusion The study has shown that dairy farmers in Tanga and Morogoro regions were generally close to being fully economically efficient. Economic efficiency indices ranged from 0.003-0.999
with a mean of 0.932 which implies that the sampled farmers were close to high economic efficiency in the allocation of resources for producing a given level of milk output. This reflects farmers’ tendency to optimise resources allocation associated with the production process, thus, allocative inefficiency is not a big problem among sampled farmers. Therefore, profitability can only be improved via technical efficiency for instance through adoption of higher milk yielding breeds in order to enhance output. Important factors indirectly related to cost inefficiency were education, off-farm employment, farming system, age and squared years of schooling.
These results indicate that new entrants especially the youths need to be encouraged to rear dairy cows. In addition, farmers may consider changing the technology that they are using for instance by adopting higher milk yielding breeds so as to improve their productivity and hence economic efficiency. There is a need to provide farmers with basic information through trainings on profitable dairying, better technology and practices to improve their knowledge and skills. This would enhance proper planning and management hence minimise unnecessary wastage.
AcknowledgementsThe data used in this study were obtained
Table 6: Determinants of economic inefficiency in dairy production (maximum likelihood estimates)
Variable Parameter Coefficient Standard error t-valueConstant δ0 -2.073*** 0.435 -4.76AGE δ1 0.019** 0.007 2.58EDUC δ2 -0.232*** 0.063 -3.71SQEDUC δ3 0.020*** 0.005 3.96CREDIT δ5 0.050 0.421 0.12OFFARM δ6 -0.373 0.256 -1.46TRADCDS δ7 -0.028* 0.016 -1.71LOCATION δ8 -14.830*** 1.392 -10.65LANDC δ9 -0.008 0.006 -1.29Belong_hub δ10 -0.707*** 0.232 -3.05
Source: Authors’ calculation based on ILRI-SUA 2014 and 2016 household surveys***, **; *: Significant at the 1%, 5%; 10% levels respectively.
9Economic Efficiency Analysis of Dairy Farmers Participating in Dairy Market
An International Journal of Basic and Applied Research
10 Bayiyana et al.
from a collaborative research project between International Livestock Research Institute (ILRI) and Sokoine University of Agriculture. The study was funded by ILRI and DAAD (Germany Academic Exchange Service). The authors therefore acknowledge financial support and comments from the collaborators, internal and anonymous reviewers. The contents of the paper are the responsibility of the authors and do not represent the views of the donor or collaborating institutions.
ReferencesAdesina, Akinwumi A, and Kouakou K Djato.
(2008). “Relative Efficiency of Women as Farm Managers : Profit Function Analysis in Cote d ’ Ivoire” 16 (1997): 47–53.
Agriculture and Horticulture Development Board (AHDB). (2018). “Improving through Feeding.” http://dairy.ahdb.org.uk/technical-information/feeding/improving-through-feeding/#.VZask_lVhHw.
Bayiyana, Irene, Aloyce Hepelwa, Elizaphan J.O. Rao, and Kenneth Mdadila. (2018). “Do Dairy Market Hubs Improve Smallholder Farmers’ Income? The Case of Dairy Farmers in the Tanga and Morogoro Regions of Tanzania.” Agrekon 57 (2): 1–16. https://doi.org/10.1080/03031853.2018.1481758.
Bennett, Anthony, Frederic Lhoste, Jay Crook, and Joe Phelan. 2005. “The Future of Small Scale Dairying.” Livestock Report.
Chambers, Robert G, and John Quiggin. (1998). “Cost Functions and Duality for Stochastic Technologies.” American Journal of Agricultural Economics 80(2):288–95. https://doi.org/10.2307/1244501.
Chandio, Abbas Ali, Abdul Rehman, Yuansheng Jiang, and Sanaullah Noonari. (2017) “Importance of the Dairy Industry and Economic Growth in Pakistan: An Empirical Study Importance of the Dairy Industry and Economic Growth in Pakistan: An Empirical Study.” Journal of Applied Environmental and Biological Sciences: 13-20.
Coelli, Tim J. 1994. “A Guide to Frontier Version 4.1: A Computer Programme for Stochastic Frontier Production and Cost
Function Estimation” Centre for Efficiency and Productivity Analysis (CEPA) Working Papers 7 (96): 1–33.
Coelli, Tim, D.S. Prasada, R., George, E., Battese, and J.Chrostopher O’Donnell. (2005). An Introduction to Efficiency Analysis. Springer, USA.
Debertin, D.L. (2002). “Contemporary Production Theory: The Factor Side.” In Agricultural Production Economics, 366–97.
Duncan, Alan, Diego Valbuena, Jimmy Smith, Katrien Descheemaeker, Peter Thorne, Sabine Homann-KeeTui, and Shirley Tarawali. (2013). “Sustainable Intensification of Agriculture in Africa: The Case for Mixed Crop-Livestock Farming.” International Livestock Research Institute (ILRI).
FAO. Dairy Market Review. Rome: Trade and Markets Division (EST), 2018.
FAO. (2010). Status of and Prospects for Smallholder Milk Production – A Global Perspective. Edited by T. Hemme and J. Otte. Rome.
Greene, William H. (2003). Econometric Analysis. Journal of the American Statistical Association. Vol. 97. https://doi.org/10.1198/jasa.2002.s458.
Gronberg, Timothy J, Dennis W Jansen, Lori L Taylor, and Booker Kevin. 2005. “School Outcomes and School Costs: A Technical Supplement.”
Hogg, R. (1987). “Development in Kenya : Drought , Desertification and Food Scarcity.” Oxford University Press on Behalf of The Royal African Society 86 (342): 47–58. http://www.jstor.org/stable/722865.
Karamagi, I.J. (2002). “Examining Technical and Economic Efficiency: Empirical Applications Using Panel Data From Alberta Dairy Farmers.” University of Alberta.
Katsumata, K. and Loren, T. 2008. “Empirical Analysis of Stanchion and Parlor Milking Cost on New York Dairy Farms.” In Southern Agricultural Economics Association Annual Meeting, Dallas, TX, February 2-6, 1–28.
Tanzania Journal of Agricultural Sciences (2019) Vol. 18 No. 1, 1-12
Kavoi, M.M, Dana, L.H. and James, P. 2010. “Measurement of Economic Efficiency for Smallholder Dairy Cattle in the Marginal Zones of Kenya.” Journal of Development and Agricultural Economics 2 (4): 122–37. https://doi.org/10.1080/03031851003798603.
Kumbhakar, C., Soumendra G. and Thomas, J. McGuckin. (1991). “A Generalized Production Frontier Approach for Estimating Determinants of Inefficiency in U.S. Dairy Farms.” Journal of Business and Economic Statistics 9 (3): 279–86. https://doi.org/10.1080/07350015.1991.10509853.
Kwabena, G., Oliver, P. and W.M. (2006(. “Higher Education and Economic Growth in Africa.” Journal of Development Studies 42 (3): 509–29. https://doi.org/10.1080/00220380600576490.
Mburu, S., Ackello-ogutu, C. and Mulwa, R. (2014). “Analysis of Economic Efficiency and Farm Size : A Case Study of Wheat Farmers in Nakuru District , Kenya.” Hindawi Publishing Corporation Economics Research International 2014: 10. http://dx.doi.org/10.1155/2014/802706.
Maina, F.,. Mburu, J., Gitau, G. Van Leeuwen, J. and Negusse, Y. (2018): “Economic efficiency of milk production among smallscale dairy farmers in Mukurweini, Nyeri County, kenya.” Journal of Development and Agricultural Economics, 152-158.
Mishkin, K.,. Raskind, I. Dominguez-Salas, P. Baltenweck, I., Omore, A. and Webb G. A. (2018) “The effect of participation in pro-poor dairy development project on milk consumption among reproductive age women in rural Tanzania.” Africana Journal of Food, Agriculture, Nutrition and Development, 12992-13008.
Ngeno, V. (2018). “Impact of dairy market hubs on smallholder welfare: Empirical evidence from Kenya.” Journal of Agricultural and Food Economics,
Nguyen, D., Keith, T. Mclaren, M. and Zhao, X. (2008). “Multi-Output Broadacre Agricultural Production : Estimating A Cost Function Using Quasi-Micro Farm
Level Data From Australia.” In AARES 2008 CONFERENCE.
Okoye, B.C. and Onyenweaku, C.E. (2007). “Economic Efficiency of Smallholder Cocoyam Farmers in Anambra State, Nigeria: A Translog Stochastic Frontier Cost Function Approach.” Agricultural Journal 2 (4): 535–41.
Omore, A. 2013. “More Milk by and for the Poor: Adapting Dairy Market Hubs for pro-Poor Smallholder Value Chains in Tanzania.”
Parikh, A. and Farman A. 1995. “Measurement of Economic Efficiency in Pakistani Agriculture.” American Journal of Agricultural Economics 77 (3): 675–85. https://doi.org/10.2307/1243234.
Rao, E.J.O., Omondi, I. Karimov, A.A. and Baltenweck. I. (2016). “Dairy Farm Households, Processor Linkages and Household Income: The Case of Dairy Hub Linkages in East Africa.” International Food and Agribusiness Management Review 19 (4): 95–108. https://doi.org/10.22434/IFAMR2014.0177.
Antonio, R. (2009). “Livestock Thematic Papers: Tools for Project Design.”
Schipmann, C. and Matin, Q. (2011). “Modern Food Retailers and Traditional Markets in Developing Countries: Comparing Quality, Prices, and Competition Strategies in Thailand.” Applied Economic Perspectives and Policy 33 (3): 345–62. https://doi.org/10.1093/aepp/ppr018.
Shaik, S. (2014). “Re-Examination of Production, Cost, and Restricted Profit Functions Using Quantile Regression Approach.” Agricultural Economics (United Kingdom) 45 (2): 199–212. https://doi.org/10.1111/agec.12041.
StataCorp. (2013) .Stata Statistical Software: Release 13. Texas, USA: College Station, TX: StataCorp LP,
Swai, E.S. and Karimuribo E.D. (2011). “Smallholder Dairy Farming in Tanzania: Current Profiles and Prospects for Development.” Outlook on Agriculture 40 (1): 21–27. https://doi.org/10.5367/oa.2011.0034.
The World Bank. 2008. Agriculture for
11Economic Efficiency Analysis of Dairy Farmers Participating in Dairy Market
Development: World Development Report. Agriculture. Vol. 54. https://doi.org/10.1596/978-0-8213-7233-3.
Thorpe, W., Muriuki, H.G. Omore, A., Owango, M.O. and. Staal, S. (2000). “Dairy Development in Kenya: The Past, the Present and the Future.” Annual
Symposium of the Animal Production Society of Kenya, 10.
UNDP and URT. (2015). Tanzania Human Development Report 2014. Economic Transformation for Human Development. Economic and Social Research Foundation. Dar es Salaam:
An International Journal of Basic and Applied Research
12 Bayiyana et al.
Tanzania Journal of Agricultural Sciences (2019) Vol. 18 No. 1, 13-21
Introduction
Enteric fermentation from livestock is on top three of the largest sources of global methane
production. Livestock account for 35 – 40 % of the global anthropogenic methane emission via enteric fermentation and manure (Steinfeld et al., 2006). Developing countries are responsible for three-quarters of the global enteric methane emission (Aluwong et al., 2011). Tanzania ranks third in Africa in terms of number of cattle after Ethiopia and Sudan, and is thereby one of the main contributors of methane emission in Africa. The high contribution to the total methane emission from developing countries is mainly due to the extensive production system
and the high number of animals (Steinfeld et al., 2006). Methane emission varies highly, and recent database analyses showed that g methane per kg dry matter (DM) intake (DMI) varies from 9.0 to 30.4 (Niu et al., 2018). Nutrition of the Tanzanian cattle herd is far from optimal, and generally cattle are underfed in dry periods, where they might lose the gain obtained in the previous rainy seasons. Improved nutrition obtained by either grass/pasture conservation in end of the rainy season for feeding in the end of dry season, concentrate supplementation, rangeland/pasture improvements, feed/forage cultivation, or herd reduction could heavily improve growth and production efficiency.
Increased Productivity in Tanzanian Cattle is the Main Approach to Reduce Methane Emission per Unit of Product
Weisbjerg, M.R.1, Terkelsen, M., Hvelplund, T., Lund, P. & Madsen2, J.
1Department of Animal Science, AU Foulum, Aarhus University, AU Foulum, Aarhus University, Blichers Allé 20, Postboks 50, DK-8830 Tjele, Denmark.
2Department of Large Animal Science, University of Copenhagen, Denmark
Corresponding author e-mail: [email protected]; Tel.: +45 8715 8046.
AbstractReduction in emission of the greenhouse gas methane is a major global goal, and ruminants are major contributors to methane emission. It is well known that increased productivity will reduce the methane emission per unit of product, but its immense quantitative importance under Tanzanian conditions may not be realised. The aim of this study was to compare the present situation (M0, F0) with two improved scenarios, one where weight gain until maturity is improved by 100 g/day for both male and female (M100-F100), and one where male gain is improved by 200 g/day and female by 100 g/day (M200-F100). Scenario calculations were based on 2003 statistics for Tanzanian cattle number and herd composition, on IPCC (2006) equations for feed energy requirements and methane emission, and on several assumptions to simplify scenario calculations, e.g. that all cattle are Tanzania Short Horn Zebu (TSHZ). Present weight gain was assumed to be 115 g/day for both males and females, and mature weight to be 280 kg for female and 300 kg for male. Increased growth rate reduced total stock number as slaughter weight was reached earlier, but birth of a similar number of calves per year in all scenarios was assured by number of female breeding stock. For scenario M0-F0, M100-F100 and M200-F100, total number of cattle were 17.0 (based on 2003 statistics), 14.6 and 13.7 million, total feed requirement in NE were 312, 351 and 354 million MJ/day, total kg of carcass meat harvested were 163, 246 and 264 million kg/year, and total methane emission were 588, 561 and 520 million kg/year. NE requirement was 699, 522 and 488 MJ/kg carcass, and methane emission was 3.61, 2.28 and 1.96 kg/kg carcass for scenario M0-F0, M100-F100 and M200-F100, respectively, equivalent to a reduction of 37% and 46% of the two scenarios compared to the present situation. In conclusion, the potential for improving productivity and reducing methane emission at the same time in Tanzanian cattle production is immense.
An International Journal of Basic and Applied Research
14 Weisbjerg et al.
Greater efficiency will direct a larger portion of the energy in the animals feed into useful products such as meat or milk, and methane emission per unit of product will be reduced. Increased production efficiency also leads to a significant reduction in the herd size required to produce a given level of product (Steinfeld et al., 2006).
The aim of this study was to document and quantify the potential for reducing methane emission by increasing productivity in Tanzanian cattle.
Materials and MethodsThe statistics on numbers of cattle used are based on NBS (2003). It is not a fully updated reference and the total number of cattle in Tanzania has increased since, but this reference is grouped (male and female calves, bulls, heifers and cows) satisfactorily for the scenario calculations. The numbers of male and female calves used were 1,700,000 and 2,047,617. The numbers of males, heifers and cows were 4,335,385, 2,996,525, and 5,920,781, respectively. No reliable statistic was found on the division between TSHZ and other indigenous cattle, therefore the numbers of cattle from NBS (2003) used in the calculations were all assumed to be TSHZ, as TSHZ is the dominant breed among the indigenous breeds (Njombe and Msanga, 2008; Chenyambuga et al., 2008). Three calculation scenarios were performed; present conditions as zero scenario (M0-F0), and two improved scenarios (M100-F100 and M200-F100). Improved scenarios were based on an increasing daily weight gain of either 100 (male/female) or 200 (male) g per day compared to zero scenario, respectively.
All calculations were made from country perspective, which means that they are based on the number of cattle in Tanzania and then eventually scaled down to production per cattle. This is an overall approach showing the effects of increasing productivity on methane emission from the cattle population in Tanzania as a whole.
CalculationsThe calculations were based on three scenarios for males (M0, M100, and M200) and two scenarios for females (F0, F100).
The calculations were divided by sex (male and female). Adult males were assumed to be 50 % bulls and 50 % steers. Birth weight was assumed to be 30 kg for male calves and 28 kg for female calves (Reynolds et al., 1980). Mature weight depends on many factors, including nutrition, sex, and breed, and many different estimates are given for TSHZ in the literature due to the great variation in the conditions cattle face before maturity. In this study the mature weight was assumed to be 300 kg for males and 280 kg for females (Mwilawa, 2011).
The weights in the different age groups were calculated from birth weight (males 30, female 28 kg), daily weight gain (115, 215 (+100) and 315 (+200) g/day) and 365 days/year. The estimated present daily weight gain (115 g/day) as average gain over the growth period was based on pasture fed cattle (Mwilawa, 2011), where live weight for 3.5 years old TSHZ was 177 kg and assuming birth weight was 30 kg.
The yearly death rate was assumed to be 25 % for calves and 10 % for older cattle (Mwilawa, 2011). The slaughter rate was rational guesstimates for different age groups, as proportions of number of cattle. For improved male scenarios, it was simply assumed that 50,000 slaughter cattle cover the cattle required yearly for celebrations like weddings, other important celebrations or other reasons to slaughter a few number of cattle. The slaughter rates were included because it was assumed that some animals are slaughtered before mature weight due to celebrations etc. At female scenarios the slaughter rates also reflected the non-fertility rate, as unfertile females are not useful for the herd.
The grouping according to sex, calves/adult and heifers/cows was based on the statistic information NBS (2003). Calves from NBS (2003) were defined as the number of animals less than one year. Heifers are females above
Tanzania Journal of Agricultural Sciences (2019) Vol. 18 No. 1, 13-21
15Increased Productivity in Tanzanian Cattle is the Main Approach to Reduce Methane
one year until they reach mature weight where they become cows. Within scenario animals were divided, and calculations performed, into groups at one-year intervals.
It was assumed that the weight of the carcass is 50 % of the live weight of the slaughtered animals by the current productivity (M0, F0) (Mwilawa, 2011). This was expected to increase with increased productivity, at M100 and F100 the carcass percentage was assumed to 51 % and at M200 to 52 %, based on slaughter data from studies of un-supplemented and feedlot supplemented TSHZ (Asimwe et al., 2015a; Asimwe et al, 2015b).
Methane emission from cattle was estimated from required gross energy intake (GEI) as a conversion rate. To estimate GEI, the required net energy intake (NEI) is first estimated. The NEI specifies the requirements for maintenance, growth and lactation. The energy requirements for maintenance were estimated as a function of the weight of the animal. The energy requirements for growth were estimated as a function of the mature weight of the animal and the rate of weight gain. The energy requirements for pregnancy and the portion of cows that give birth each year are not included in the calculation of total NE, to simplify the calculations and due to the lack of reliable data. The possible energy requirements for milk production is neither included, but it was assumed that this energy requirement is covered in the calves requirements for energy for growth. Energy requirement calculations were based on IPCC (2006).
Equation 1:NE Cf weightm i= × ( ) .0 75
where;NEm = Net energy for maintenance, MJ/day Cfi is a coefficient MJ/kg/day that varies for each animal category. Table 10.4 in IPCC (2006) is used for Cfi coefficients. For males (steers) the Cfi is 0.370, and 15 % higher for intact males, = 0.426. It was assumed that 50 % of the males are castrated and 50 % are intact males, then Cfi used in male groups was 0.398 (average of 0.370 and 0.426). Cfi used for the females was
the coefficient for non-lactating cows 0.322.Weight = live-weight of animal, kg (mean in group)
Equation 2: NE BWC MW
WGg = ××
×22 020 75
1 097..
.
where;NEg = Net energy required for growth, MJ/dayBW = the average live body weight (BW) of the animals in the group, kgC = a coefficient with the value of 0.8 for females, 1.0 for castrated males and 1.2 for bulls. The coefficient used in male groups in the scenarios was 1.1, mean of 1.0 and 1.2.MW = 280 (female) and 300 (male). The mature live weight of an adult animal in moderate body condition, kg.WG = the average daily weight gain of the animals in the group, kg/day
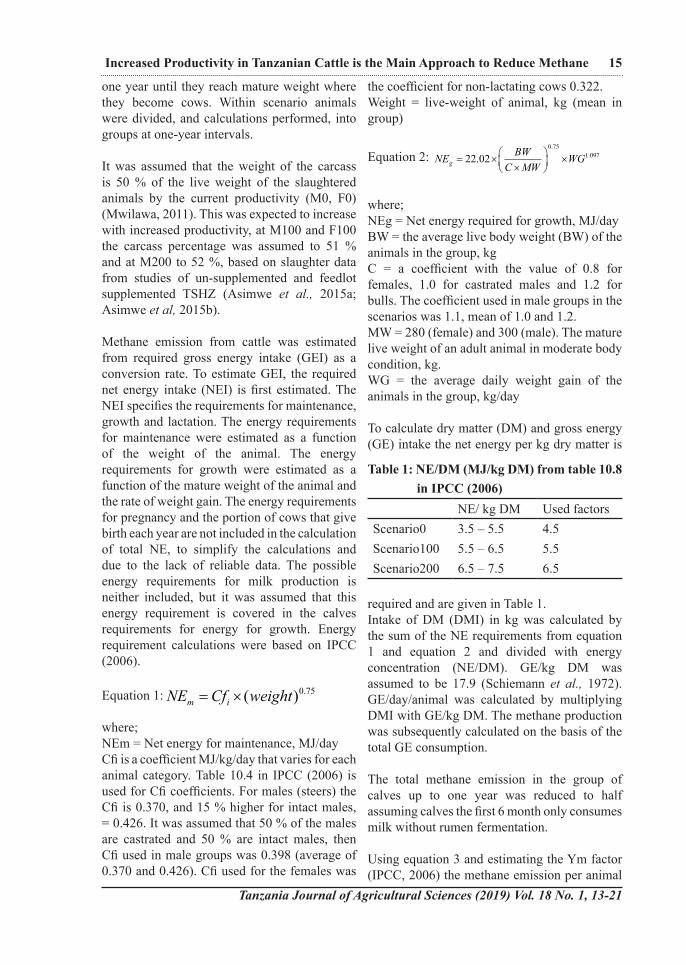
To calculate dry matter (DM) and gross energy (GE) intake the net energy per kg dry matter is
required and are given in Table 1.Intake of DM (DMI) in kg was calculated by the sum of the NE requirements from equation 1 and equation 2 and divided with energy concentration (NE/DM). GE/kg DM was assumed to be 17.9 (Schiemann et al., 1972). GE/day/animal was calculated by multiplying DMI with GE/kg DM. The methane production was subsequently calculated on the basis of the total GE consumption.
The total methane emission in the group of calves up to one year was reduced to half assuming calves the first 6 month only consumes milk without rumen fermentation.
Using equation 3 and estimating the Ym factor (IPCC, 2006) the methane emission per animal
Table 1: NE/DM (MJ/kg DM) from table 10.8 in IPCC (2006)
NE/ kg DM Used factorsScenario0 3.5 – 5.5 4.5Scenario100 5.5 – 6.5 5.5Scenario200 6.5 – 7.5 6.5
per year was calculated.
Equation 3: EFGE Ym
=∗ ∗
( )
.100
365
55 65
where;EF = emission factor, kg CH4/animal/yearGE = Gross energy intake, MJ/animal/dayYm = Methane conversion factor, % of GE in feed converted to methane. Table 10.12 in IPCC (2006) shows percentages for different cattle categories. The factor used in these scenarios was from category ‘Other cattle or Buffalo – grazing’, however for M0 and F0 the factor was raised to 7.5 % due to the forage characteristics (fibre rich, low digestibility) often found in tropical Africa (USEPA, 1994). As the efficiency increase, this factor will decrease, and was assumed to be 7.0 for M100 and F100 and 6.5 % for M200.The factor 55.65 (MJ/kg CH4) is the energy content of methane.
Results and DiscussionDetails on the impact of the alternative scenarios on herd size, herd composition, energy requirements, meat harvest and CH4 emission are given in Table 2-6 for scenario M0, M100, M200, F0 and F100, respectively. With the improved scenarios (M0 to M200 and F0 to F100), number of males decrease from 6068 to 4007 thousand, and females decreased from 10922 to 9690 thousand. Carcass yield increased for males from 88883 to 155929 ton, and for females from 74115 to 108571 ton. Methane emission (kg) per kg carcass meat decreased for males from 2.19 to 0.77, and for females from 5.30 to 3.68.
Herd size and compositionIncreasing daily weight gain severely affected the herd size and age composition using the present assumptions where the number of calving per year was kept constant. The male part of the herd was considerably reduced in number and age by increased live weight gain, whereas the female part of the herd was less affected, as the fertile female herd had to be conserved to give birth to maintain the herd (Table 2, 3, 4, 5, 6).
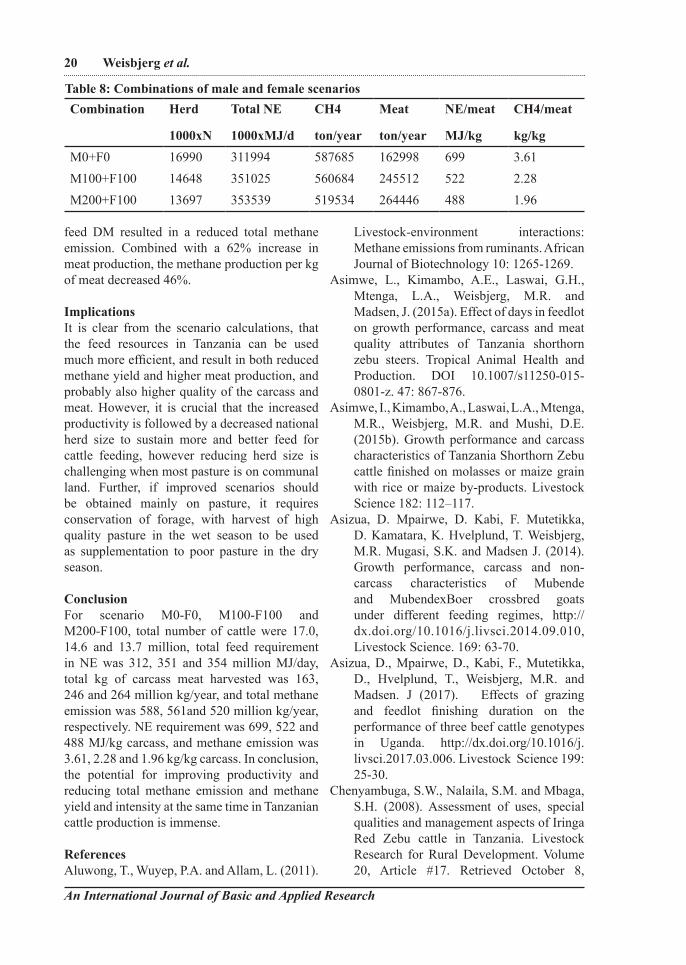
In Table 7 and Table 8 consequences for the total herd size are shown for sex specific scenarios, and for combined scenarios, respectively. For the combined scenarios the total herd was reduced by 3.3 million heads when moving from present situation (M0, F0) to the most improved (M200, F100) scenario (Table 8).
It is important to consider whether the herd can maintain itself, e.g. whether the number of fertile cows is high enough to give birth to the number of calves needed. In the scenarios a total of 3748 thousand calves were included yearly (sum of female and male, Table 2, 3, 4, 5, 6). From the number of heifers becoming cows (and giving birth to a calf), and from the remaining number of cows, and assuming an annual fertility rate for cows of 0.5 for F0 and 0.7 for F100, it can be calculated that 3108 and 3683 thousand calves were born per year in F0 and F100 scenarios, respectively (results not shown). It is reasonable to assume that fertility was improved considerably when nutrition was improved, although the rise from 0.5 to 0.7 was a qualified guess as no data for Tanzanian conditions were available. The calculated birth numbers shows that it is possible to maintain the herd with the reduced number of female stock in the improved scenario, due to earlier maturity and thereby earlier first calving, and improved fertility.
Feed consumptionThe energy requirements only increased slightly, from 312 million MJ/year in the zero scenario (M0, F0) to 351 for the medium scenario (M100, F100) and 353 for the most improved (M200, F100) scenario (Table 8). The much higher gain with only a slight increase in NE requirement is possible as earlier slaughter age saves energy which alternatively would have been used for maintenance.
This indicates that the production efficiency in the improved scenario could be obtained with only a minor increase in feed resources due to better utilization. The basis is that improved scenarios result in reduced herd size, which will improve pasture availability and quality, and combined with conservation of forages in
16 Weisbjerg et al.
An International Journal of Basic and Applied Research
Tanzania Journal of Agricultural Sciences (2019) Vol. 18 No. 1, 13-21
the wet season it is realistic that the improved scenario could be attained with only minor requirements for extra supplemental feed. Therefore, extra supplemental feed as e.g. by-products from the milling, oil or sugar industry would probably only be required for e.g. feedlot finishing of males for a short period before slaughter.
Often cattle gain weight in the wet season, and lose weight (mobilise) due to starvation in the dry period. Avoiding varying gain and mobilization will increase total energy efficiency; however, this is not taken into account in the scenarios. The increased supply and quality of feed in improved scenarios will reduce or eliminate the periods with mobilisation, and thereby the overall improvements in utilisation of feed energy are probably even greater than shown in these scenario calculations.
Meat productionScenarios with increased live weight gain considerably increased the amount of carcass which could be harvested, from 163 to 264 thousand tons moving from the present (M0, F0) to the most improved (M200, F100) scenario (Table 8). As the same number of calves were born in all scenarios, the increase was a result of fewer dead animals, higher dressing percentage and higher slaughter weight although the final slaughter weight for males was kept constant.
NE required to produce one kg of meat was reduced considerably, from 699 to 488 MJ/kg meat when moving from present situation (M0, F0) to the most improved (M200, F100) scenario (Table 8), as improved scenarios increased carcass output considerably whereas NE requirements were only slightly increased. The potential for increased and improved meat production has been studied extensively in both Tanzania and Uganda in recent years. Focus has been on finishing of cattle in the last period before slaughter, either in feedlot or by concentrate supplementation to pasture (Mwilawa et al., 2010; Asizua et al., 2014; Asimwe et al., 2015a; Asimwe et al., 2015b; Asizua et al., 2017). The positive results obtained in these studies on weight gain, slaughter quality and meat quality call for studies, where nutrition for the whole lifetime production of the animals is improved as used in the present scenario calculations.
Methane productionDespite increased meat production, improved scenarios slightly decreased methane production per year from 588 thousand ton to 520 thousand ton, and methane per kg of meat was reduced substantially, from 3.61 to 1.96 kg CH4/kg meat moving from present situation (M0, F0) to the most improved (M200, F100) scenario, equivalent to a 46% reduction (Table 8). Despite an increased total NE use, the in average increased energy concentration in
17Increased Productivity in Tanzanian Cattle is the Main Approach to Reduce Methane
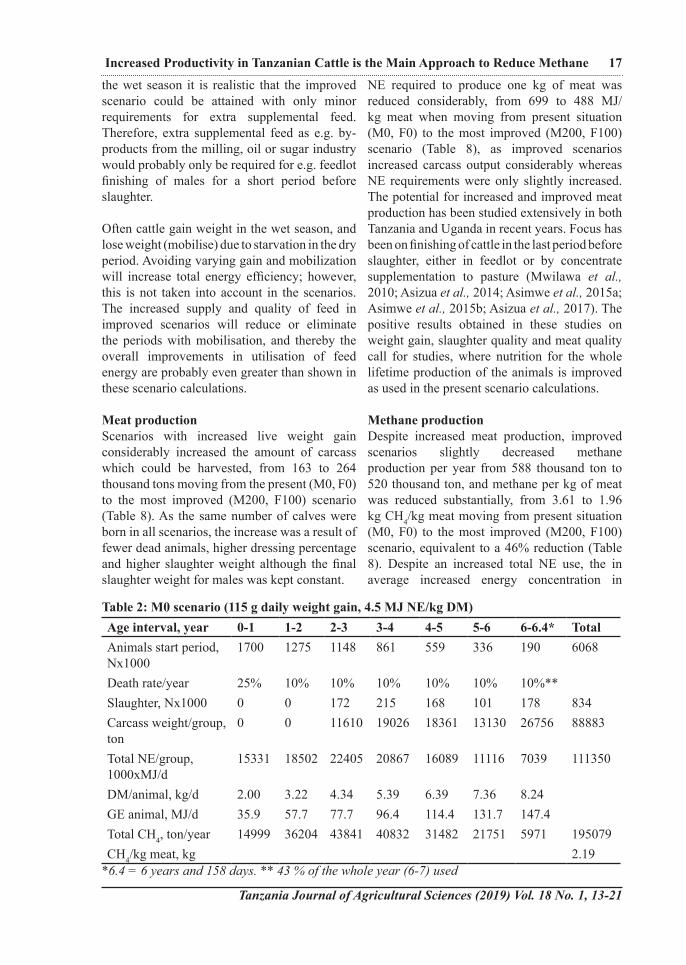
Table 2: M0 scenario (115 g daily weight gain, 4.5 MJ NE/kg DM)Age interval, year 0-1 1-2 2-3 3-4 4-5 5-6 6-6.4* TotalAnimals start period, Nx1000
1700 1275 1148 861 559 336 190 6068
Death rate/year 25% 10% 10% 10% 10% 10% 10%**Slaughter, Nx1000 0 0 172 215 168 101 178 834Carcass weight/group, ton
0 0 11610 19026 18361 13130 26756 88883
Total NE/group, 1000xMJ/d
15331 18502 22405 20867 16089 11116 7039 111350
DM/animal, kg/d 2.00 3.22 4.34 5.39 6.39 7.36 8.24GE animal, MJ/d 35.9 57.7 77.7 96.4 114.4 131.7 147.4Total CH4, ton/year 14999 36204 43841 40832 31482 21751 5971 195079CH4/kg meat, kg 2.19
*6.4 = 6 years and 158 days. ** 43 % of the whole year (6-7) used
18 Weisbjerg et al.
An International Journal of Basic and Applied Research
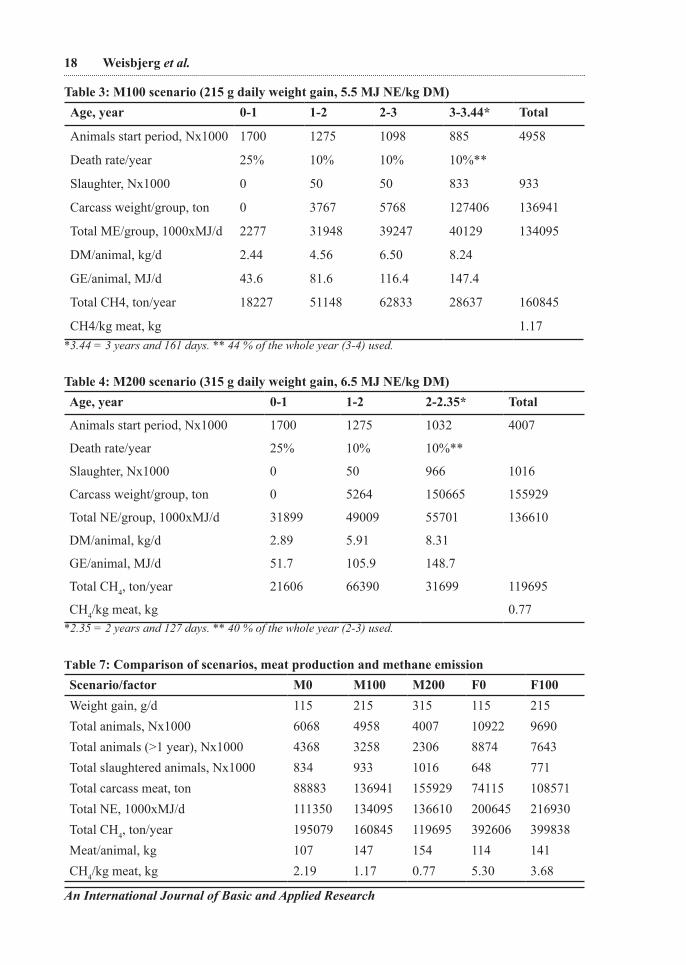
Table 3: M100 scenario (215 g daily weight gain, 5.5 MJ NE/kg DM)Age, year 0-1 1-2 2-3 3-3.44* Total
Animals start period, Nx1000 1700 1275 1098 885 4958
Death rate/year 25% 10% 10% 10%**
Slaughter, Nx1000 0 50 50 833 933
Carcass weight/group, ton 0 3767 5768 127406 136941
Total ME/group, 1000xMJ/d 2277 31948 39247 40129 134095
DM/animal, kg/d 2.44 4.56 6.50 8.24
GE/animal, MJ/d 43.6 81.6 116.4 147.4
Total CH4, ton/year 18227 51148 62833 28637 160845
CH4/kg meat, kg 1.17*3.44 = 3 years and 161 days. ** 44 % of the whole year (3-4) used.
Table 4: M200 scenario (315 g daily weight gain, 6.5 MJ NE/kg DM)Age, year 0-1 1-2 2-2.35* Total
Animals start period, Nx1000 1700 1275 1032 4007
Death rate/year 25% 10% 10%**
Slaughter, Nx1000 0 50 966 1016
Carcass weight/group, ton 0 5264 150665 155929
Total NE/group, 1000xMJ/d 31899 49009 55701 136610
DM/animal, kg/d 2.89 5.91 8.31
GE/animal, MJ/d 51.7 105.9 148.7
Total CH4, ton/year 21606 66390 31699 119695
CH4/kg meat, kg 0.77*2.35 = 2 years and 127 days. ** 40 % of the whole year (2-3) used.
Table 7: Comparison of scenarios, meat production and methane emissionScenario/factor M0 M100 M200 F0 F100Weight gain, g/d 115 215 315 115 215Total animals, Nx1000 6068 4958 4007 10922 9690Total animals (>1 year), Nx1000 4368 3258 2306 8874 7643Total slaughtered animals, Nx1000 834 933 1016 648 771Total carcass meat, ton 88883 136941 155929 74115 108571Total NE, 1000xMJ/d 111350 134095 136610 200645 216930Total CH4, ton/year 195079 160845 119695 392606 399838Meat/animal, kg 107 147 154 114 141CH4/kg meat, kg 2.19 1.17 0.77 5.30 3.68
Tanzania Journal of Agricultural Sciences (2019) Vol. 18 No. 1, 13-21
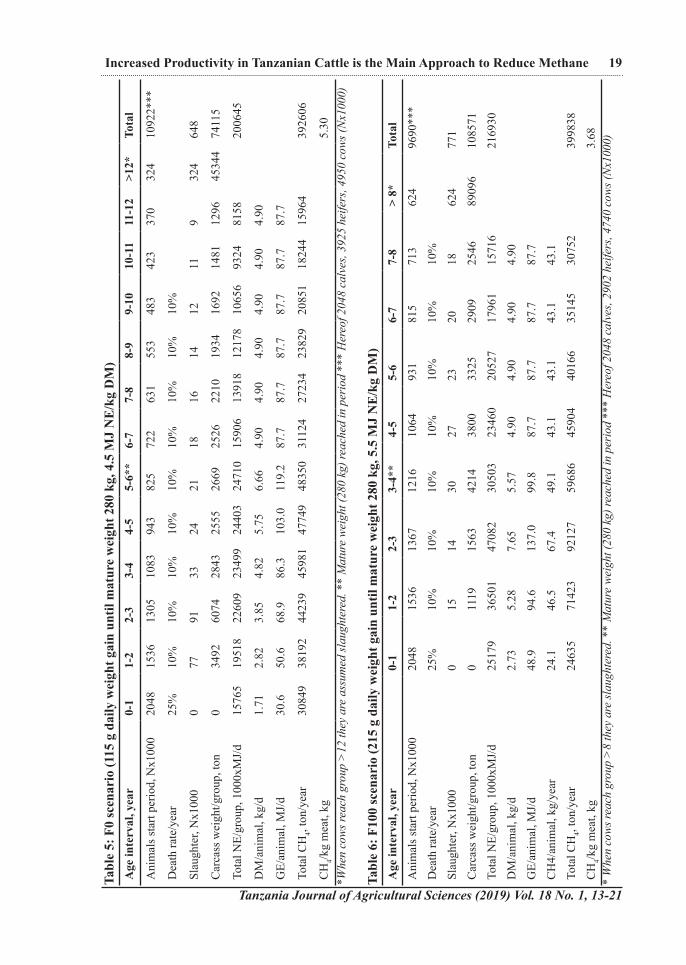
19Increased Productivity in Tanzanian Cattle is the Main Approach to Reduce Methane
Tabl
e 5:
F0
scen
ario
(115
g d
aily
wei
ght g
ain
until
mat
ure
wei
ght 2
80 k
g, 4
.5 M
J N
E/k
g D
M)
Age
inte
rval
, yea
r0-
11-
22-
33-
44-
55-
6**
6-7
7-8
8-9
9-10
10-1
111
-12
>12*
Tota
l
Ani
mal
s sta
rt pe
riod,
Nx1
000
2048
1536
1305
1083
943
825
722
631
553
483
423
370
324
1092
2***
Dea
th ra
te/y
ear
25%
10%
10%
10%
10%
10%
10%
10%
10%
10%
Slau
ghte
r, N
x100
00
7791
3324
2118
1614
1211
932
464
8
Car
cass
wei
ght/g
roup
, ton
034
9260
7428
4325
5526
6925
2622
1019
3416
9214
8112
9645
344
7411
5
Tota
l NE/
grou
p, 1
000x
MJ/
d15
765
1951
822
609
2349
924
403
2471
015
906
1391
812
178
1065
693
2481
5820
0645
DM
/ani
mal
, kg/
d1.
712.
823.
854.
825.
756.
664.
904.
904.
904.
904.
904.
90
GE/
anim
al, M
J/d
30.6
50.6
68.9
86.3
103.
011
9.2
87.7
87.7
87.7
87.7
87.7
87.7
Tota
l CH
4, to
n/ye
ar30
849
3819
244
239
4598
147
749
4835
031
124
2723
423
829
2085
118
244
1596
439
2606
CH
4/kg
mea
t, kg
5.30
*Whe
n co
ws r
each
gro
up >
12 th
ey a
re a
ssum
ed sl
augh
tere
d. *
* M
atur
e w
eigh
t (28
0 kg
) rea
ched
in p
erio
d **
* H
ereo
f 204
8 ca
lves
, 392
5 he
ifers
, 495
0 co
ws (
Nx1
000)
Tabl
e 6:
F10
0 sc
enar
io (2
15 g
dai
ly w
eigh
t gai
n un
til m
atur
e w
eigh
t 280
kg,
5.5
MJ
NE
/kg
DM
)A
ge in
terv
al, y
ear
0-1
1-2
2-3
3-4*
*4-
55-
66-
77-
8>
8*To
tal
Ani
mal
s sta
rt pe
riod,
Nx1
000
2048
1536
1367
1216
1064
931
815
713
624
9690
***
Dea
th ra
te/y
ear
25%
10%
10%
10%
10%
10%
10%
10%
Slau
ghte
r, N
x100
00
1514
3027
2320
1862
477
1
Car
cass
wei
ght/g
roup
, ton
011
1915
6342
1438
0033
2529
0925
4689
096
1085
71
Tota
l NE/
grou
p, 1
000x
MJ/
d25
179
3650
147
082
3050
323
460
2052
717
961
1571
621
6930
DM
/ani
mal
, kg/
d2.
735.
287.
655.
574.
904.
904.
904.
90
GE/
anim
al, M
J/d
48.9
94.6
137.
099
.887
.787
.787
.787
.7
CH
4/an
imal
, kg/
year
24.1
46.5
67.4
49.1
43.1
43.1
43.1
43.1
Tota
l CH
4, to
n/ye
ar24
635
7142
392
127
5968
645
904
4016
635
145
3075
239
9838
CH
4/kg
mea
t, kg
3.68
* W
hen
cow
s rea
ch g
roup
>8
they
are
slau
ghte
red.
**
Mat
ure
wei
ght (
280
kg) r
each
ed in
per
iod
***
Her
eof 2
048
calv
es, 2
902
heife
rs, 4
740
cow
s (N
x100
0)
An International Journal of Basic and Applied Research
20 Weisbjerg et al.
feed DM resulted in a reduced total methane emission. Combined with a 62% increase in meat production, the methane production per kg of meat decreased 46%.
ImplicationsIt is clear from the scenario calculations, that the feed resources in Tanzania can be used much more efficient, and result in both reduced methane yield and higher meat production, and probably also higher quality of the carcass and meat. However, it is crucial that the increased productivity is followed by a decreased national herd size to sustain more and better feed for cattle feeding, however reducing herd size is challenging when most pasture is on communal land. Further, if improved scenarios should be obtained mainly on pasture, it requires conservation of forage, with harvest of high quality pasture in the wet season to be used as supplementation to poor pasture in the dry season.
ConclusionFor scenario M0-F0, M100-F100 and M200-F100, total number of cattle were 17.0, 14.6 and 13.7 million, total feed requirement in NE was 312, 351 and 354 million MJ/day, total kg of carcass meat harvested was 163, 246 and 264 million kg/year, and total methane emission was 588, 561and 520 million kg/year, respectively. NE requirement was 699, 522 and 488 MJ/kg carcass, and methane emission was 3.61, 2.28 and 1.96 kg/kg carcass. In conclusion, the potential for improving productivity and reducing total methane emission and methane yield and intensity at the same time in Tanzanian cattle production is immense.
ReferencesAluwong, T., Wuyep, P.A. and Allam, L. (2011).
Livestock-environment interactions: Methane emissions from ruminants. African Journal of Biotechnology 10: 1265-1269.
Asimwe, L., Kimambo, A.E., Laswai, G.H., Mtenga, L.A., Weisbjerg, M.R. and Madsen, J. (2015a). Effect of days in feedlot on growth performance, carcass and meat quality attributes of Tanzania shorthorn zebu steers. Tropical Animal Health and Production. DOI 10.1007/s11250-015-0801-z. 47: 867-876.
Asimwe, I., Kimambo, A., Laswai, L.A., Mtenga, M.R., Weisbjerg, M.R. and Mushi, D.E. (2015b). Growth performance and carcass characteristics of Tanzania Shorthorn Zebu cattle finished on molasses or maize grain with rice or maize by-products. Livestock Science 182: 112–117.
Asizua, D. Mpairwe, D. Kabi, F. Mutetikka, D. Kamatara, K. Hvelplund, T. Weisbjerg, M.R. Mugasi, S.K. and Madsen J. (2014). Growth performance, carcass and non-carcass characteristics of Mubende and MubendexBoer crossbred goats under different feeding regimes, http://dx.doi.org/10.1016/j.livsci.2014.09.010, Livestock Science. 169: 63-70.
Asizua, D., Mpairwe, D., Kabi, F., Mutetikka, D., Hvelplund, T., Weisbjerg, M.R. and Madsen. J (2017). Effects of grazing and feedlot finishing duration on the performance of three beef cattle genotypes in Uganda. http://dx.doi.org/10.1016/j.livsci.2017.03.006. Livestock Science 199: 25-30.
Chenyambuga, S.W., Nalaila, S.M. and Mbaga, S.H. (2008). Assessment of uses, special qualities and management aspects of Iringa Red Zebu cattle in Tanzania. Livestock Research for Rural Development. Volume 20, Article #17. Retrieved October 8,
Table 8: Combinations of male and female scenariosCombination Herd Total NE CH4 Meat NE/meat CH4/meat
1000xN 1000xMJ/d ton/year ton/year MJ/kg kg/kgM0+F0 16990 311994 587685 162998 699 3.61M100+F100 14648 351025 560684 245512 522 2.28M200+F100 13697 353539 519534 264446 488 1.96
Tanzania Journal of Agricultural Sciences (2019) Vol. 18 No. 1, 13-21
2012, from http://www.lrrd.org/lrrd20/2/chen20017.htm
IPCC (2006). 2006 IPCC Guidelines for National Greenhouse Gas Inventories, Prepared by the National Greenhouse Gas Inventories Programme, Eggleston H.S., Buendia L., Miwa K., Ngara T. and Tanabe K. (eds). Published: IGES, Japan. Retrieved October 3, 2019, from https://www.ipcc-nggip.iges.or.jp/public/2006gl/pdf/0_Overview/V0_0_Cover.pdf
Mwilawa, A.J.T. (2011). Effects of different diets on weight gain, carcass and meat quality characteristics of two Tanzanian indigenous cattle. PHD thesis. Sokoine university of agriculture. Morogoro, Tanzania. 296 pp.
Mwilawa, A., Kimambo, A.E., Mtenga, L.A., Laswai, G.H., Madsen, J., Hvelplund, T., Weisbjerg, M.R., Christensen, M., and Mgheni, D.M. (2010). Growth performance and the economy of producing quality beef in Tanzania. In: Book of Abstracts. The 5th All Africa Conference on Animal Agriculture and the 18th Meeting of the Ethiopian Society of Animal Production (ESAP), October 25-28, 2010, Addis Ababa, Etiopia. 165.
NBS. (2003). National Bureau of Statistics (NBS). Agriculture Census 2002-2003 – Main results Small holdings sector. Retrieved May 12, 2012, from http://www.fao.org/fileadmin/templates/ess/documents/world_census_of_agriculture/main_results_by_country/Tanzania_2002-03F_2.pdf
Niu, M., Kebreab, E., Hristov, A.N., Oh, J., Arndt, C., Bannink, A., Bayat, A.R., Brito, A.F., Boland, T., Casper, D., Crompton, L.A., Dijkstra, J., Eugène, M.A., Garnsworthy, P.C., Haque, M.N., Hellwing, A.L.F., Huhtanen, P., Kreuzer,
M., Kuhla, B., Lund, P., Madsen, J., Martin, C., McClelland, S.C., McGee, M., Moate, P.J., Muetzel, S., Muñoz, C., O’Kiely, P., Peiren, N., Reynolds, C.K., Schwarm, A., Shingfield, K.J., Storlien, T.M., Weisbjerg, M.R., Yáñez-Ruiz, D.R., and Yu, Z. (2018). Enteric methane production, yield and intensity prediction models of various complexity levels in dairy cows. doi: 10.1111/gcb.14094. Global Change Biology 24: 3368–3389.
Njombe, A.P., and Msanga, Y.N. (2008). Livestock and dairy industry development in Tanzania. Ministry of livestock development. Located via www on May 18, 2012. http://www.mifugo.go.tz/documents_storage/LIVESTOCK INDUSTRY DAIRY DEVELOPMENT IN TANZANIA - LATEST3.pdf
Reynolds, W.L., DeRouen, T.M., Moin, S. and Koonce K.L. (1980). Factors influencing gestation length, birth weight and calf survival of Angus, Zebu and Zebu Cross Beef Cattle. Journal of Animal Science 51, 860-867.
Schiemann, R., Nehring, K., Hoffmann, L., Jentsch, W. and Chudy, A. (1972). Energetische Futterbewertung und Energienormen. WEB Deutscher Landwirtschaftsverlag Berlin. 344 pp.
Steinfeld, H., Gerber, P., Wassenaar, T., Castel, V., Rosales, M., and De Haan, C. (2006). Livestock’s long shadow. LEAD. FAO 2006. 390 pp.
USEPA-U.S. Environmental Protection Agency (USEPA) (1994). International Anthropogenic Methane Emissions: Estimates for 1990. Michael J. Adler (Ed). Office of Policy, Planning and Evaluation. 332 pp.
21Increased Productivity in Tanzanian Cattle is the Main Approach to Reduce Methane

Tanzania Journal of Agricultural Sciences (2019) Vol. 18 No. 1, 22-34
Introduction
Transitory food insecurity which occurs when a household faces a temporary decline
in the security of its entitlement and the risk of failure to meet food needs is of short duration. Transitory food insecurity is divided into cyclical and temporary food insecurity (CIDA, 1989, cited by Maxwell and Frankenberger, 1992). Temporary food insecurity occurs for a limited time because of unforeseen and unpredictable circumstances such as illness, weather instability and calamities including fire, floods or rodents devouring pastures and crops in field or crop products in store. Cyclical or seasonal
food insecurity occurs when there is a regular pattern in the periodicity of inadequate access to food. It may be due to logistical difficulties or prohibitive costs in storing or transporting food.Studies conducted worldwide have shown that rural communities are highly affected by the impact of weather related challenges on food security. Studies conducted in East African region have shown how the issue of weather related challenges might be addressed in different levels including household (Thornton et al., 2009). Likewise, Smit et al., 2001 identifies several determinants that influence the preparation of any community to face weather
Weather Related Challenges and Transitory Food Insecurity in Semiarid Mixed Crop-Livestock Systems in Manyoni District,
Tanzania
Neema S. Urassa1 and Elirehema Y. Swai2
1Tanzania Livestock Research Institute (TALIRI) P.O. Box 202, Mpwapwa, Dodoma, Tanzania2Agricultural Research Institute Hombolo P.O. Box 299, Dodoma, Tanzania
*E-mail of the corresponding author: [email protected]
Abstract Many studies done in Latin America, Africa and Tanzania have reported various experiences on impact of weather-related challenges; perception and adaptation strategies practiced in various farming systems mainly crop and mangrove communities. However, little is documented about the experiences of households depending on mixed crop-livestock systems in semiarid areas in Central Tanzania. Using Manyoni District of Singida Region as a study area, quantitative data were collected from 90 respondents/households. Structured questionnaire was used to explore in-depth information about knowledge on weather related challenges; number of meals taken per day; role of some demographic and socio-economic factors and constraints faced. SPSS was employed for data entry and analysis. The findings showed 92.2% had knowledge about weather related challenges including changes in temperature rainfall pattern and wind; number of meals taken per household per day varied from one (1) and two (2) meals; a Chi-Square model at p ≤ 0.05 indicated that status of food in terms of the number of meals taken per household per day was determined by some demographic and socio-economic factors including age; size of the household, ownership and size of land; type and number of livestock owned as well as distance from areas of residence to the nearby urban centres. On the bases of these findings it is concluded that transitory food insecurity can be reduced/controlled if farmers are engaged in wide scope of income generating activities including livestock keeping. Therefore, Tanzania Livestock Research Institute (TALIRI) in collaboration with Local Government Authorities (LGA) and other development partners are encouraged to introduce livestock proven technologies and their packages for improved livestock production to cope with these challenges. In addition, livestock technologies should address production issues as well as identification of market opportunities to reduce transaction costs.Key word: Livestock-crop producers, weather related challenges, Transitory Food Insecurity
An International Journal of Basic and Applied Research
23 Urassa and Swai
related challenges. These include economic wealth; skills or experiences; infrastructure; institution and equity. The same authors argue that the rural community members will be prepared to face weather related challenges based on the degree of these determinants. Henceforth, a present research paper builds on this framework to analyse some skills and experiences of individual households towards transitory food insecurity.
Several efforts have been in place to address the problem of food insecurity caused by weather related challenges by putting an emphasis on increased crops productivity, however, the great lakes report about regional project on food security suggests other key areas to be focused to achieve food security goals besides improving crop productivity; these include livestock production, research, extension services and access to markets (ICGLR, 2006). The same report puts an emphasis on the integration of scientific innovations and the use of farmers’ indigenous knowledge/experiences in addressing the problem of food insecurity in the rural areas in a sustainable manner.
Since livestock-crop production is one of the important components in smallholder farming systems in Africa and Tanzania in particular, researches have shown that this system is also experiencing weather related challenges towards its role on food security in the community currently (Thornton et al., 2009; Mongi et al., 2010). Studies done in Latin America, Africa and Tanzania have reported various experiences on the impact of weather related challenges, perception and adaptation strategies mainly among crop producers and mangrove community dependants (Duivenbooden et al., 2002; Mohamed et al., 2002; Jones and Thornton, 2003; Mongi et al., 2010; Schlenker and Lobell, 2010; Mbwambo et al., 2012; Swai et al., 2012; Richard et al., 2013). The previous few studies conducted in Manyoni District on weather related challenges concentrated on climate change adaptation strategies and livelihood of smallholder crop producers (Richard et al., 2013). However, little is documented about the position of the
household’s experiences regarding knowledge of weather related challenges and transitory food insecurity status. This is a case particularly in the communities engaged in complex farming system which involves non-farm/off-farm activities, crops and livestock production as their sources of food. This study therefore, sought to fill the present gap of knowledge by establishing the link between household’s experiences on status of food under weather related challenges towards transitory food insecurity in mixed crop-livestock systems in Manyoni District particularly in Itigi division. The results obtained from this study unfold the household experiences to researchers, extension agents, Faith Based Organizations operating in the area and policy makers to design recommend and implement crop-livestock movements relevant to clients’ experiences in their local areas.
MethodologyStudy AreaThe study was conducted in Manyoni District located in Singida Region Tanzania. The district was selected for the research because it is one of the areas situated in semiarid zones in Tanzania and it has some areas which have frequently experienced moderate to severe transitory food insecurity (URT, 2005). The district is characterised by inadequate and unreliable rainfall, high temperature and evaporation. Manyoni District has a uni-modal rainfall regime, which spans from November to April.
Research Design and Methods of Data CollectionA cross-sectional research design was used to collect data once from smallholders engaged in mixed crop-livestock systems in the community, an individual household being the sampling unit. The sampling frame consisted of all livestock-crop smallholders in Itigi division, Sanjaranda ward whereby three villages distinctively Gurungu, Kitopeni and Sanjaranda were surveyed. The surveyed villages were purposively selected based on the availability of integrated livestock and crop production systems where limited or no research especially on household experiences on whether related challenges and transitory food insecurity had
Tanzania Journal of Agricultural Sciences (2019) Vol. 18 No. 1, 22-34
been conducted. Furthermore, the surveyed villages were within the project area where one of the Faith Based Organisations in Itigi named Sanjaranda Bible College and Rural Training Centre sought to understand the existing experiences in order to initiate farmers practical trainings to cope with challenges at the household level. The study used systematic sampling to select 30 households from each village to get a sample of 90 respondents from their respective households. Both primary and secondary data were collected. Quantitative data were collected using structured questionnaire while qualitative data were obtained through focus group discussion and key informant interview. A prepared checklist of items was used for the interview with nine (9) key informants (three interviewees in each of the three villages); and a focus group discussion guide was used in discussion to gather information from 24 (crops - livestock) smallholders who participated in three group discussions (eight participants in each of the three villages). The recommended number of focus group participants per session was eight (Barbour, 2011). Likewise, secondary data were obtained from the village and district offices.
Data AnalysisThe quantitative data were analyzed using the Statistical Package for Social Sciences (SPSS) whereby descriptive statistics including means, percentages, frequencies and multiple responses were computed. Likewise, inferential analysis was done by using Chi-square model at p ≤ 0.05 concomitantly with cross tabulations to analyze associations between some categorical variables such as demographic and socio-economic factors along with the number of meals taken per household per day. The Chi-square model used is:
χ 2 = ∑
−(o )ee
Where:χ2 = the value of Chi-Square statisticso = Observed frequencies in the contingency
tablee = expected frequencies in the contingency
table
Results and DiscussionsSocio-Demographic Characteristics of the HouseholdsThe summarized socio-demographic characteristics of respondents that were involved in the study include: age; sex; marital status; education levels of the respondents; household size and household annual income. The interviewed sample was dominated by the active age group 36-49 years (66.7%) as shown in Table 1. People in this age group of 36-49 years are known to be in their active and productive ages. The average age of respondents was 42.8 years. This implies that in rural areas middle aged people were engaged in both livestock and crop production more than people of other age groups do because mixed farming activities requires very active people to cope with hardships of crop-livestock production at the same time. Furthermore, active age group is capable for undertaking a range of economic activities including investments in the mixed crop-livestock production and non-farm activities to cope with weather related challenges.
Contrary to other studies conducted in many rural areas, the sample for this study was dominated by female respondents (53.3%) than males (46.7%) as shown in Table 1. The higher proportion of females than males was assumed to be contributed by the existing habits whereby males tend to migrate from rural to urban areas searching for other income generating activities not related to agriculture especially when the household faces transitory food insecurity crisis. It may also be attributed by the rapid changes on the gender roles with women increasingly holding roles that were more traditionally held by men. Thus, during off season more females were engaged in daily household tasks including access to food for consumption of their household members.
Regarding the marital status among the 90 respondents as it is indicated in Table 1 it shows that, four - fifths (80%) were married; 7.8% widowed; 8.9% were divorced and/or separated and some who represented household heads (3.3%) were still young to be married. The
24Weather Related Challenges and Transitory Food Insecurity in Semiarid
An International Journal of Basic and Applied Research
25 Urassa and Swai
majority of the interviewed respondents were mostly married (80%) this may have positive effects on the availability of family labour for diverse economic activities. Regarding levels of education, of the respondents 97.8% had attained primary school education (1.1%) had secondary education. while 1.1% did not have any formal education. Since the use of crop-livestock proven technologies requires basic level of education to cope with extension services provided, it shows that the literacy level of majority (97.8%) can have a positive effect on the adoption of recommended good practices on crop-livestock production technologies and weather related tips for daily farming activities. The findings are in line with (Makura et al. (2002); Martey et al. (2012) and Adeoti et al. (2014) who suggested that basic education helps farmer to improve the understating for better management of their production environment and timely decision-making leading to market participation.
Household SizeIt was found that the sizes of the surveyed households ranged between one (1) and 13 members where as majority are used as source of labour for livestock and farm activities. This is not far from the fact that many African communities consider family members as their major source of labour (IAC, 2004 and Swai et al., 2012 ) .The major economic activities carried out by the entire surveyed sample (n = 90), which is more than Seven-eighths (94.4%) were crop and livestock production as shown in Fig.1 based on the multiple responses given by respondents. This is due to the nature of the environment mostly characterized by agro-pastoral activities. Some farmers were also engaged in off-farm activities including petty trade 4.4%, and formal employment 1.1% to earn their daily breads.
Distribution of Respondents by Land Ownership and Utilization StylesAccess to land is vital in any farming business including mixed crop-livestock farming; land
Table 1: Background characteristics of respondents/households in Gurungu, Kitopeni and Sanjaranda villages (n=90)
Age group Frequency PercentYoung age (21-34) 23 25.6Active age (36-49) 60 66.7Elderly (50<) 7 7.7Total 90 100.0SexMale 42 46.7Female 48 53.3Total 90 100.0Marital StatusMarried 72 80.0Single 3 3.3Separated/divorced 8 8.9Widowed 7 7.8Total 90 100.0EducationAttained formal education 85 98. 9No formal education 5 1.1Total 90 100.0
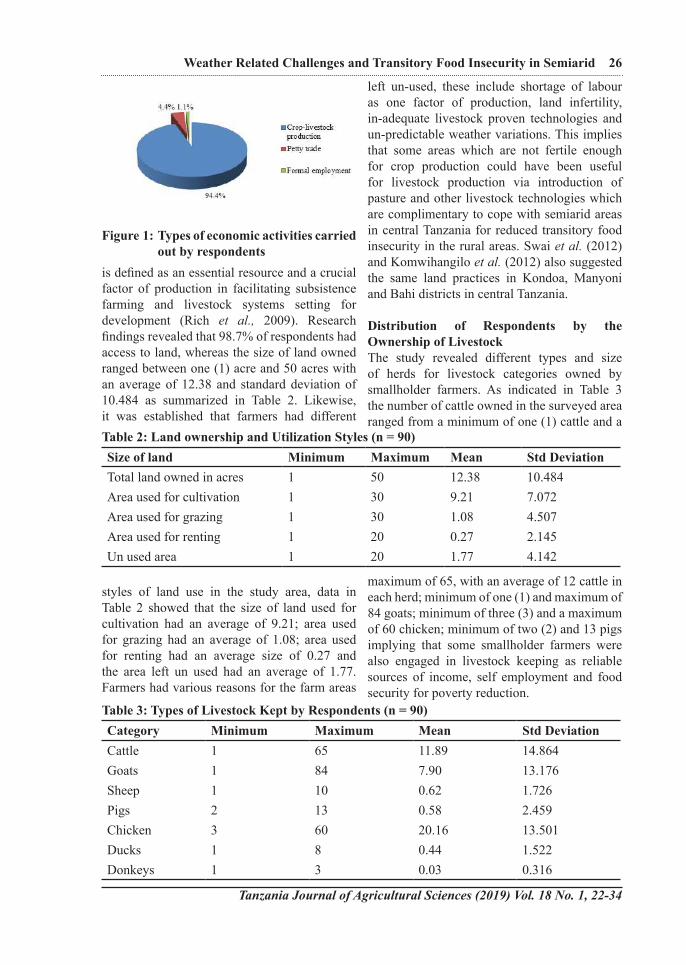
Tanzania Journal of Agricultural Sciences (2019) Vol. 18 No. 1, 22-34
26Weather Related Challenges and Transitory Food Insecurity in Semiarid
is defined as an essential resource and a crucial factor of production in facilitating subsistence farming and livestock systems setting for development (Rich et al., 2009). Research findings revealed that 98.7% of respondents had access to land, whereas the size of land owned ranged between one (1) acre and 50 acres with an average of 12.38 and standard deviation of 10.484 as summarized in Table 2. Likewise, it was established that farmers had different
styles of land use in the study area, data in Table 2 showed that the size of land used for cultivation had an average of 9.21; area used for grazing had an average of 1.08; area used for renting had an average size of 0.27 and the area left un used had an average of 1.77. Farmers had various reasons for the farm areas
left un-used, these include shortage of labour as one factor of production, land infertility, in-adequate livestock proven technologies and un-predictable weather variations. This implies that some areas which are not fertile enough for crop production could have been useful for livestock production via introduction of pasture and other livestock technologies which are complimentary to cope with semiarid areas in central Tanzania for reduced transitory food insecurity in the rural areas. Swai et al. (2012) and Komwihangilo et al. (2012) also suggested the same land practices in Kondoa, Manyoni and Bahi districts in central Tanzania.
Distribution of Respondents by the Ownership of LivestockThe study revealed different types and size of herds for livestock categories owned by smallholder farmers. As indicated in Table 3 the number of cattle owned in the surveyed area ranged from a minimum of one (1) cattle and a
maximum of 65, with an average of 12 cattle in each herd; minimum of one (1) and maximum of 84 goats; minimum of three (3) and a maximum of 60 chicken; minimum of two (2) and 13 pigs implying that some smallholder farmers were also engaged in livestock keeping as reliable sources of income, self employment and food security for poverty reduction.
Figure 1: Types of economic activities carried out by respondents
Table 2: Land ownership and Utilization Styles (n = 90)Size of land Minimum Maximum Mean Std DeviationTotal land owned in acres 1 50 12.38 10.484Area used for cultivation 1 30 9.21 7.072Area used for grazing 1 30 1.08 4.507Area used for renting 1 20 0.27 2.145Un used area 1 20 1.77 4.142
Table 3: Types of Livestock Kept by Respondents (n = 90)Category Minimum Maximum Mean Std DeviationCattle 1 65 11.89 14.864Goats 1 84 7.90 13.176Sheep 1 10 0.62 1.726Pigs 2 13 0.58 2.459Chicken 3 60 20.16 13.501Ducks 1 8 0.44 1.522Donkeys 1 3 0.03 0.316
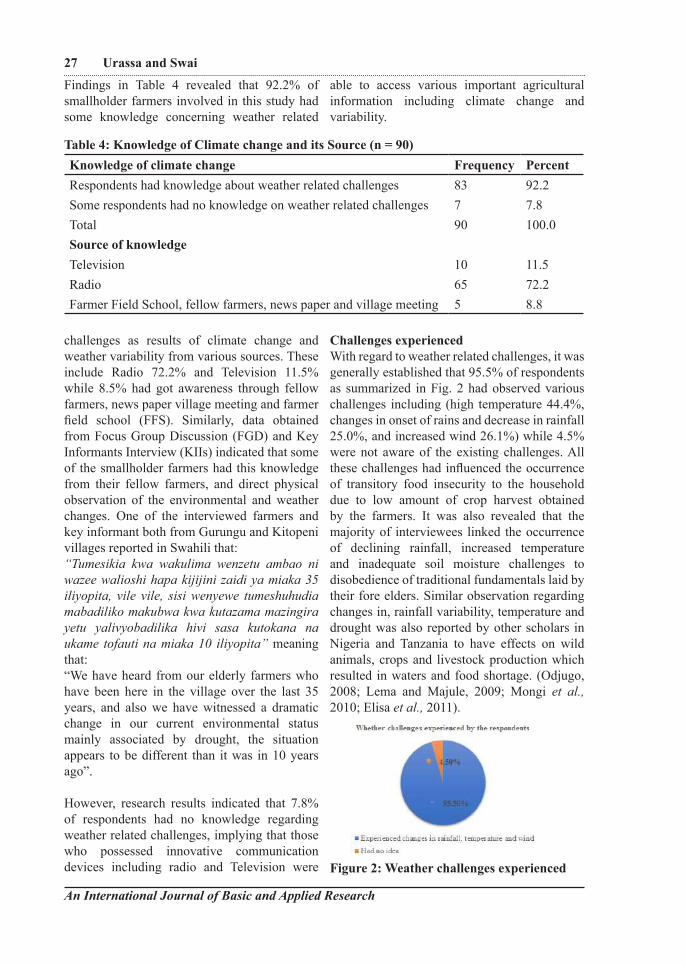
An International Journal of Basic and Applied Research
27 Urassa and Swai
Findings in Table 4 revealed that 92.2% of smallholder farmers involved in this study had some knowledge concerning weather related
challenges as results of climate change and weather variability from various sources. These include Radio 72.2% and Television 11.5% while 8.5% had got awareness through fellow farmers, news paper village meeting and farmer field school (FFS). Similarly, data obtained from Focus Group Discussion (FGD) and Key Informants Interview (KIIs) indicated that some of the smallholder farmers had this knowledge from their fellow farmers, and direct physical observation of the environmental and weather changes. One of the interviewed farmers and key informant both from Gurungu and Kitopeni villages reported in Swahili that: “Tumesikia kwa wakulima wenzetu ambao ni wazee walioshi hapa kijijini zaidi ya miaka 35 iliyopita, vile vile, sisi wenyewe tumeshuhudia mabadiliko makubwa kwa kutazama mazingira yetu yalivyobadilika hivi sasa kutokana na ukame tofauti na miaka 10 iliyopita” meaning that: “We have heard from our elderly farmers who have been here in the village over the last 35 years, and also we have witnessed a dramatic change in our current environmental status mainly associated by drought, the situation appears to be different than it was in 10 years ago”.
However, research results indicated that 7.8% of respondents had no knowledge regarding weather related challenges, implying that those who possessed innovative communication devices including radio and Television were
able to access various important agricultural information including climate change and variability.
Challenges experiencedWith regard to weather related challenges, it was generally established that 95.5% of respondents as summarized in Fig. 2 had observed various challenges including (high temperature 44.4%, changes in onset of rains and decrease in rainfall 25.0%, and increased wind 26.1%) while 4.5% were not aware of the existing challenges. All these challenges had influenced the occurrence of transitory food insecurity to the household due to low amount of crop harvest obtained by the farmers. It was also revealed that the majority of interviewees linked the occurrence of declining rainfall, increased temperature and inadequate soil moisture challenges to disobedience of traditional fundamentals laid by their fore elders. Similar observation regarding changes in, rainfall variability, temperature and drought was also reported by other scholars in Nigeria and Tanzania to have effects on wild animals, crops and livestock production which resulted in waters and food shortage. (Odjugo, 2008; Lema and Majule, 2009; Mongi et al., 2010; Elisa et al., 2011).
Table 4: Knowledge of Climate change and its Source (n = 90)Knowledge of climate change Frequency PercentRespondents had knowledge about weather related challenges 83 92.2Some respondents had no knowledge on weather related challenges 7 7.8Total 90 100.0Source of knowledgeTelevision 10 11.5Radio 65 72.2Farmer Field School, fellow farmers, news paper and village meeting 5 8.8
Figure 2: Weather challenges experienced
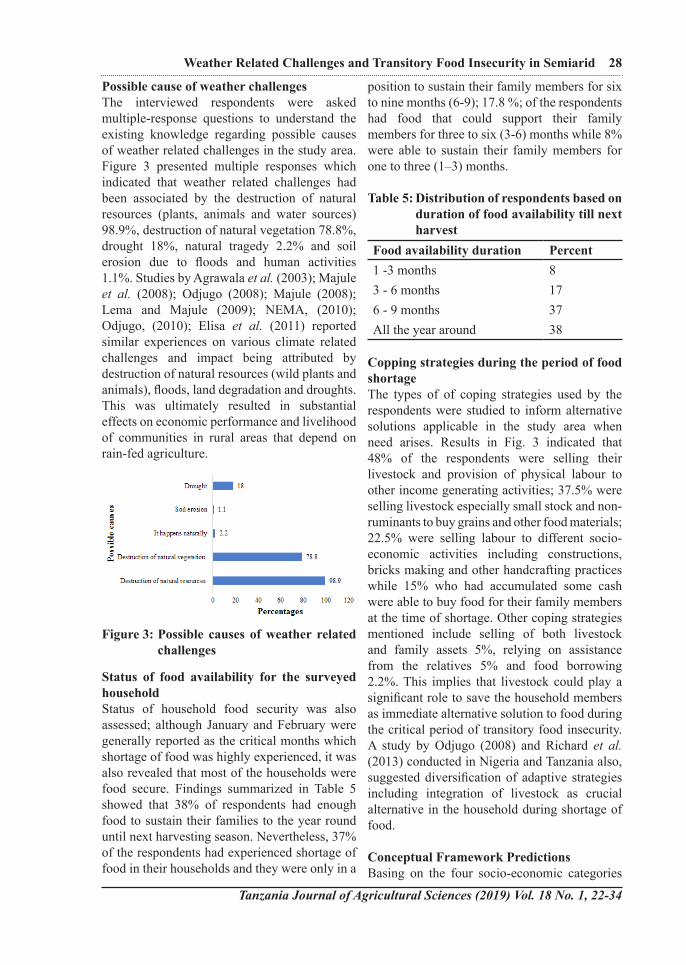
Tanzania Journal of Agricultural Sciences (2019) Vol. 18 No. 1, 22-34
28Weather Related Challenges and Transitory Food Insecurity in Semiarid
Possible cause of weather challengesThe interviewed respondents were asked multiple-response questions to understand the existing knowledge regarding possible causes of weather related challenges in the study area. Figure 3 presented multiple responses which indicated that weather related challenges had been associated by the destruction of natural resources (plants, animals and water sources) 98.9%, destruction of natural vegetation 78.8%, drought 18%, natural tragedy 2.2% and soil erosion due to floods and human activities 1.1%. Studies by Agrawala et al. (2003); Majule et al. (2008); Odjugo (2008); Majule (2008); Lema and Majule (2009); NEMA, (2010); Odjugo, (2010); Elisa et al. (2011) reported similar experiences on various climate related challenges and impact being attributed by destruction of natural resources (wild plants and animals), floods, land degradation and droughts. This was ultimately resulted in substantial effects on economic performance and livelihood of communities in rural areas that depend on rain-fed agriculture.
Status of food availability for the surveyed householdStatus of household food security was also assessed; although January and February were generally reported as the critical months which shortage of food was highly experienced, it was also revealed that most of the households were food secure. Findings summarized in Table 5 showed that 38% of respondents had enough food to sustain their families to the year round until next harvesting season. Nevertheless, 37% of the respondents had experienced shortage of food in their households and they were only in a
position to sustain their family members for six to nine months (6-9); 17.8 %; of the respondents had food that could support their family members for three to six (3-6) months while 8% were able to sustain their family members for one to three (1–3) months.
Table 5: Distribution of respondents based on duration of food availability till next harvest
Food availability duration Percent 1 -3 months 83 - 6 months 176 - 9 months 37All the year around 38
Copping strategies during the period of food shortage The types of of coping strategies used by the respondents were studied to inform alternative solutions applicable in the study area when need arises. Results in Fig. 3 indicated that 48% of the respondents were selling their livestock and provision of physical labour to other income generating activities; 37.5% were selling livestock especially small stock and non-ruminants to buy grains and other food materials; 22.5% were selling labour to different socio-economic activities including constructions, bricks making and other handcrafting practices while 15% who had accumulated some cash were able to buy food for their family members at the time of shortage. Other coping strategies mentioned include selling of both livestock and family assets 5%, relying on assistance from the relatives 5% and food borrowing 2.2%. This implies that livestock could play a significant role to save the household members as immediate alternative solution to food during the critical period of transitory food insecurity. A study by Odjugo (2008) and Richard et al. (2013) conducted in Nigeria and Tanzania also, suggested diversification of adaptive strategies including integration of livestock as crucial alternative in the household during shortage of food. Conceptual Framework PredictionsBasing on the four socio-economic categories
Figure 3: Possible causes of weather related challenges
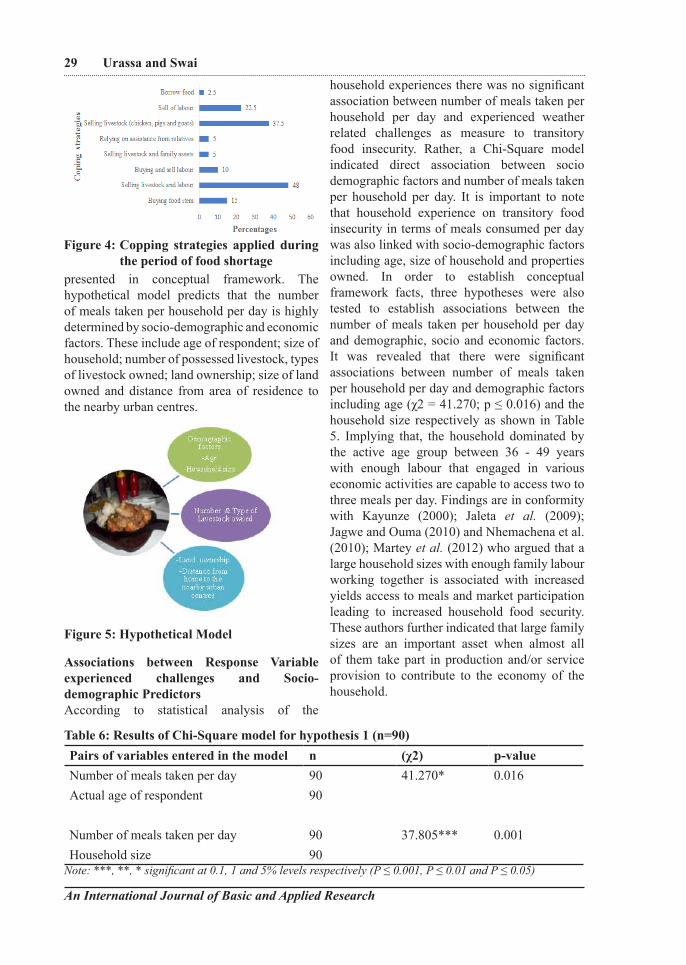
An International Journal of Basic and Applied Research
29 Urassa and Swai
presented in conceptual framework. The hypothetical model predicts that the number of meals taken per household per day is highly determined by socio-demographic and economic factors. These include age of respondent; size of household; number of possessed livestock, types of livestock owned; land ownership; size of land owned and distance from area of residence to the nearby urban centres.
Associations between Response Variable experienced challenges and Socio-demographic Predictors According to statistical analysis of the
household experiences there was no significant association between number of meals taken per household per day and experienced weather related challenges as measure to transitory food insecurity. Rather, a Chi-Square model indicated direct association between socio demographic factors and number of meals taken per household per day. It is important to note that household experience on transitory food insecurity in terms of meals consumed per day was also linked with socio-demographic factors including age, size of household and properties owned. In order to establish conceptual framework facts, three hypotheses were also tested to establish associations between the number of meals taken per household per day and demographic, socio and economic factors. It was revealed that there were significant associations between number of meals taken per household per day and demographic factors including age (χ2 = 41.270; p ≤ 0.016) and the household size respectively as shown in Table 5. Implying that, the household dominated by the active age group between 36 - 49 years with enough labour that engaged in various economic activities are capable to access two to three meals per day. Findings are in conformity with Kayunze (2000); Jaleta et al. (2009); Jagwe and Ouma (2010) and Nhemachena et al. (2010); Martey et al. (2012) who argued that a large household sizes with enough family labour working together is associated with increased yields access to meals and market participation leading to increased household food security. These authors further indicated that large family sizes are an important asset when almost all of them take part in production and/or service provision to contribute to the economy of the household.
Figure 4: Copping strategies applied during the period of food shortage
Figure 5: Hypothetical Model
Table 6: Results of Chi-Square model for hypothesis 1 (n=90)Pairs of variables entered in the model n (χ2) p-valueNumber of meals taken per day 90 41.270* 0.016Actual age of respondent 90
Number of meals taken per day 90 37.805*** 0.001Household size 90
Note: ***, **, * significant at 0.1, 1 and 5% levels respectively (P ≤ 0.001, P ≤ 0.01 and P ≤ 0.05)
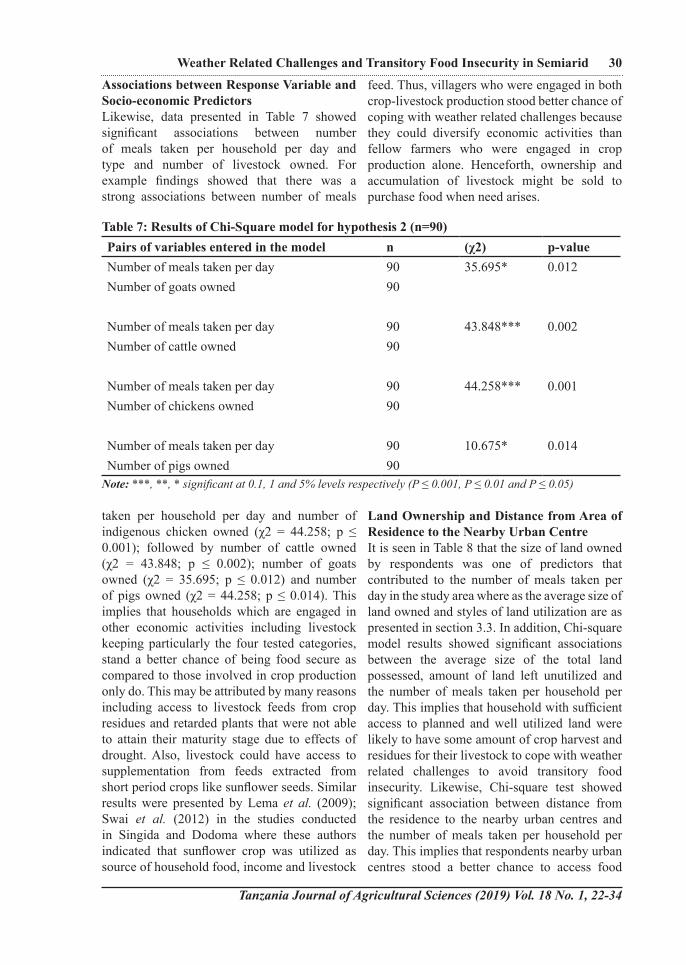
Tanzania Journal of Agricultural Sciences (2019) Vol. 18 No. 1, 22-34
Associations between Response Variable and Socio-economic Predictors Likewise, data presented in Table 7 showed significant associations between number of meals taken per household per day and type and number of livestock owned. For example findings showed that there was a strong associations between number of meals
taken per household per day and number of indigenous chicken owned (χ2 = 44.258; p ≤ 0.001); followed by number of cattle owned (χ2 = 43.848; p ≤ 0.002); number of goats owned (χ2 = 35.695; p ≤ 0.012) and number of pigs owned (χ2 = 44.258; p ≤ 0.014). This implies that households which are engaged in other economic activities including livestock keeping particularly the four tested categories, stand a better chance of being food secure as compared to those involved in crop production only do. This may be attributed by many reasons including access to livestock feeds from crop residues and retarded plants that were not able to attain their maturity stage due to effects of drought. Also, livestock could have access to supplementation from feeds extracted from short period crops like sunflower seeds. Similar results were presented by Lema et al. (2009); Swai et al. (2012) in the studies conducted in Singida and Dodoma where these authors indicated that sunflower crop was utilized as source of household food, income and livestock
feed. Thus, villagers who were engaged in both crop-livestock production stood better chance of coping with weather related challenges because they could diversify economic activities than fellow farmers who were engaged in crop production alone. Henceforth, ownership and accumulation of livestock might be sold to purchase food when need arises.
Land Ownership and Distance from Area of Residence to the Nearby Urban CentreIt is seen in Table 8 that the size of land owned by respondents was one of predictors that contributed to the number of meals taken per day in the study area where as the average size of land owned and styles of land utilization are as presented in section 3.3. In addition, Chi-square model results showed significant associations between the average size of the total land possessed, amount of land left unutilized and the number of meals taken per household per day. This implies that household with sufficient access to planned and well utilized land were likely to have some amount of crop harvest and residues for their livestock to cope with weather related challenges to avoid transitory food insecurity. Likewise, Chi-square test showed significant association between distance from the residence to the nearby urban centres and the number of meals taken per household per day. This implies that respondents nearby urban centres stood a better chance to access food
30Weather Related Challenges and Transitory Food Insecurity in Semiarid
Table 7: Results of Chi-Square model for hypothesis 2 (n=90)Pairs of variables entered in the model n (χ2) p-valueNumber of meals taken per day 90 35.695* 0.012Number of goats owned 90
Number of meals taken per day 90 43.848*** 0.002Number of cattle owned 90
Number of meals taken per day 90 44.258*** 0.001Number of chickens owned 90
Number of meals taken per day 90 10.675* 0.014Number of pigs owned 90
Note: ***, **, * significant at 0.1, 1 and 5% levels respectively (P ≤ 0.001, P ≤ 0.01 and P ≤ 0.05)
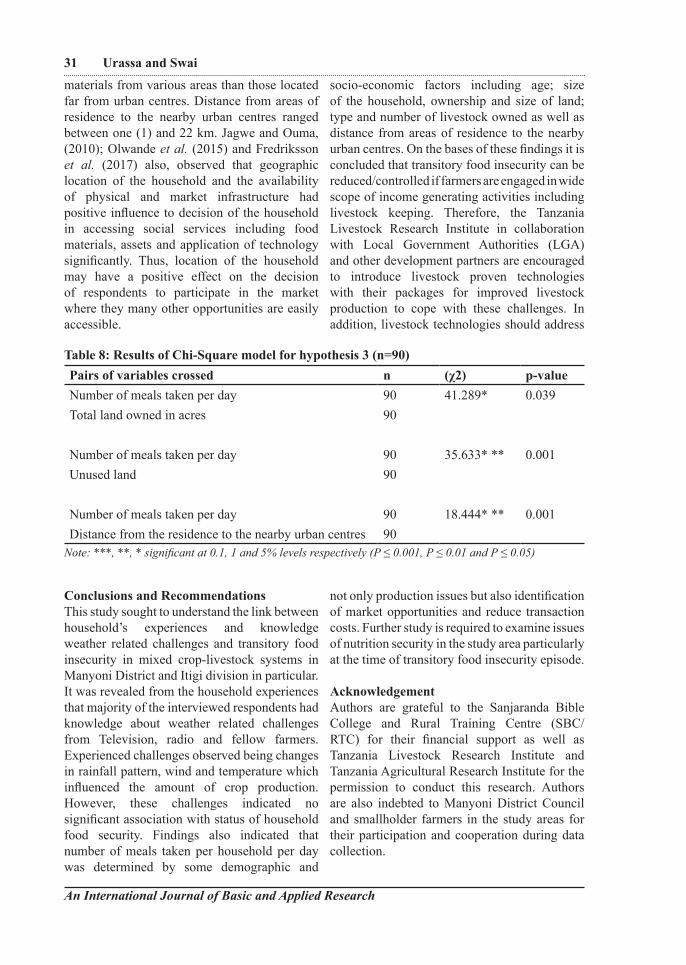
materials from various areas than those located far from urban centres. Distance from areas of residence to the nearby urban centres ranged between one (1) and 22 km. Jagwe and Ouma, (2010); Olwande et al. (2015) and Fredriksson et al. (2017) also, observed that geographic location of the household and the availability of physical and market infrastructure had positive influence to decision of the household in accessing social services including food materials, assets and application of technology significantly. Thus, location of the household may have a positive effect on the decision of respondents to participate in the market where they many other opportunities are easily accessible.
Conclusions and RecommendationsThis study sought to understand the link between household’s experiences and knowledge weather related challenges and transitory food insecurity in mixed crop-livestock systems in Manyoni District and Itigi division in particular. It was revealed from the household experiences that majority of the interviewed respondents had knowledge about weather related challenges from Television, radio and fellow farmers. Experienced challenges observed being changes in rainfall pattern, wind and temperature which influenced the amount of crop production. However, these challenges indicated no significant association with status of household food security. Findings also indicated that number of meals taken per household per day was determined by some demographic and
socio-economic factors including age; size of the household, ownership and size of land; type and number of livestock owned as well as distance from areas of residence to the nearby urban centres. On the bases of these findings it is concluded that transitory food insecurity can be reduced/controlled if farmers are engaged in wide scope of income generating activities including livestock keeping. Therefore, the Tanzania Livestock Research Institute in collaboration with Local Government Authorities (LGA) and other development partners are encouraged to introduce livestock proven technologies with their packages for improved livestock production to cope with these challenges. In addition, livestock technologies should address
not only production issues but also identification of market opportunities and reduce transaction costs. Further study is required to examine issues of nutrition security in the study area particularly at the time of transitory food insecurity episode.
AcknowledgementAuthors are grateful to the Sanjaranda Bible College and Rural Training Centre (SBC/RTC) for their financial support as well as Tanzania Livestock Research Institute and Tanzania Agricultural Research Institute for the permission to conduct this research. Authors are also indebted to Manyoni District Council and smallholder farmers in the study areas for their participation and cooperation during data collection.
An International Journal of Basic and Applied Research
31 Urassa and Swai
Table 8: Results of Chi-Square model for hypothesis 3 (n=90)Pairs of variables crossed n (χ2) p-valueNumber of meals taken per day 90 41.289* 0.039Total land owned in acres 90
Number of meals taken per day 90 35.633* ** 0.001Unused land 90
Number of meals taken per day 90 18.444* ** 0.001Distance from the residence to the nearby urban centres 90
Note: ***, **, * significant at 0.1, 1 and 5% levels respectively (P ≤ 0.001, P ≤ 0.01 and P ≤ 0.05)
Tanzania Journal of Agricultural Sciences (2019) Vol. 18 No. 1, 22-34
32Weather Related Challenges and Transitory Food Insecurity in Semiarid ReferencesAdeoti, A.I., Oluwatayo, I.B. and Soliu,
R.O. (2014). Determinants of market participation among Maize producers in Oyo State, Nigeria. British Journal of Economics and Management and Trade 4 (7), 1115–1127.
Agrawala, S., Moehder, A., Hemp, A., Van Aalst, M., Hitz, S., Smith, J., Meena, H., Mwakifamba, S., Hyera, T.and Mwaipopo, O. (2003). Development and Climate Change in Tanzania: Focus on Mount Kilimanjaro. OECD, Paris.
Ben, M.A., Van Duivenbooden, N., Abdoussallam, S. (2002). Impact of climate change on agricultural production in the Sahel-Part 1: Methodological approach and case study for groundnut and cowpea in Niger, Climatic Change 54(3):327-348.
Benoît, S. (2012). Present and future climate change in the semi-arid region of West Africa: a crucial input for practical adaptation in agriculture. Atmospheric Science Letters. Volume: 13, Issue: 2, Publisher: Wiley-Blackwell, Pp: 108-112
Deschenes, O. and Greenstone, M. (2007). ‘The Economic Impacts of Climate Change: Evidence from Agricultural Output and Random Fluctuations in Weather’. The American Economic Review 97(1): 354-385
Elisa, M., Gara, J.I. and Wolanski, E. (2011). A Review of Water Crisis in Tanzania’s protected areas with emphasis on Katuma River-Lake Rukwa Ecosystem. Journal of Ecohydrology and Hydrobiology [DOI: 10.2478/v10104- 011-0001-z]
Fredriksson, L., Bailey, A., Davidova, S. Gorton, M. and Traikova, D. (2017). The commercialisation of subsistence farms: evidence from the new member states of the European Union. Land Use Policy 60, 37–47.
IAC. (2004). Realizing the Promise and Potential of African Agriculture: Science and Technology Strategies for improving agricultural Productivity and Food Security in Africa. Annual Report. Inter-Academy Council.
International Conference on the Great Lakes
Region (2006). Regional Project on Food Security Report: Regional Programme of Action for Economic Development and Regional Integration.
Jagwe, J.N., Ouma, E. (2010). Transaction Costs and Smallholder Farmers’ Participation in Banana Markets in the Great Lakes Region of Burundi, Rwanda and the Democratic Republic of Congo.
Jaleta, M., Gebremedhin, B., Hoekstra, D. (2009). Smallholder Commercialization: Processes, Determinants and Impact. Discussion Paper No. 18: Improving Productivity and Market Success of Ethiopian Farmers Improving Market Opportunities. (ILRI), Addis Ababa, Ethiopia 55 pp
Jones P.G., and Thornton, P.K. (2003). The potential impacts of climate change on maize production in Africa and Latin America in 2055. Global Environment Change 13:51-59.
Kangalawe, R.Y.M., and Lyimo, J.G. (2013). Climate Change, Adaptive Strategies and Rural Livelihoods in Semiarid Tanzania. Natural Resource Journal 1(4): 266-278
Kayunze, K.A. (2000). Poverty disparities in small, large and male headed households in rural Tanzania: A case study of Mbeya Region. Tanzanian Journal of Population and Development Studies, 7(1&2), 1-16. Africa Journal of Agricultural Economics and Development 6: 125 – 145
Komwihangilo, D.M., Jackson, M., Munishi, Y. and Liheta, B.S.A. (2012). Situational analysis of smallholder goat production and marketing in central Tanzania point towards the establishment of farmers’ groups. Journal of Agricultural Extension and Rural Development 4(12): 356 - 364. [http:// academicjournals.org/JAERD]
Lema, M. and Majule, A. (2009). Impacts of climate change, variability and adaptation strategies on agriculture in semi-arid areas of Tanzania: The case of Manyoni District in Singida Region, Tanzania. African Journal of Environmental Science and Technology, 3(8), 206-218.
Lyimo, J.G. Ngana, J.O., Liwenga, E. and Maganga, F. (2013). Climate change, impacts and adaptations in the coastal
An International Journal of Basic and Applied Research
33 Urassa and Swai
communities in Bagamoyo District, Tanzania. Environmental Economics, 4(1)
Majule, A.E. (2008). Climate Change and Variability: Impacts on Agriculture and Water Resource and Implications for Livelihoods in Selected Basins. Towards Climate Change Adaptation. InWEnt-Int. Weiterbildung und Entwicklung gGmbH (publisher). ISBN: 978-3-939394- 28-0
Majule, A.E., Ngongondo, C., Kallanda-Sabola, M., Lamboll, R., Stathers, T., Liwenga, E. and Ngana, O.J. (2008). Strengthening local Agriculture Innovation Systems in Less and More Favoured Areas of Tanzania and Malawi to Adapt to Climate Change and Variability: Perceptions. Impacts, vulnerability and adaptation. Research Abstracts. Issue Number 3: Sokoine University of Agriculture: ISBN: 9987-38-9.
Makura, M., Kirsten, Jand, Delgado, C. (2002). Transactions costs and smallholder participation in the maize market in the northern province of South Africa. In: Integrated Approaches to Higher Maize Productivity in the New Millennium.
Martey, E., Al-Hassan, R.M., Kuwornu, J.K. (2012). Commercialization of smallholder agriculture in Ghana: a Tobit regression analysis. African Journal of Agricultural Research. 7 (14) : 2131–2141.
Maxwell, S. and Frankenberger, T.R. (eds) (1992). Household food security: concepts, indicators and measurements: a technical review. New York and Rome: UNICEF and Food and Agriculture Organization. pp 277.
Mbwambo, J.S., Ndelolia, D., Madalla, N., Mnembuka, B., Lamtane, H.A., Mwandya, A.W., and Zahabu, E. (2012). Climate Change Impacts and Adaptation Among Coastal and Mangrove Dependent Communities: A Case of Bagamoyo District. Proceedings of the first Climate Change Impacts, Mitigation and Adaptation Programme Scientific Conference, 2012
Mongi, H., Majule, A.E. and Lyimo, J.G., (2010). Vulnerability and adaptation of rain fed agriculture to climate change and variability in semi-arid Tanzania. African Journal of Environmental Science and Technology
Vol. 4(6), pp. 371-381 Available online at http://www.academicjournals.org/AJEST
NEMA (National Environment Management Authority). 2010. State of the Environment Report for Uganda. NEMA, Kampala, Uganda.
Nhemachena, C., R. Hassan, and Kurukulasuriya, P. (2010). Measuring the Economic Impact of Climate Change on African Agricultural Production Systems. Climate Change Economics1(1): 33-55.
Odjugo, P.A.O. (2008). Quantifying the Cost of Climate Change Impact in Nigeria: Emphasis on Wind and Rainstorm. Journal of Human Ecology 28(2):93- 101.
Odjugo, P.A.O. (2010). General Overview of Climate Change Impacts in Nigeria. Journal of Human Ecolog, 29(1):47-55.
Olwande, J., Smale, M., Mathenge, M.K., Place, F. and Mithöfer, D. (2015). Agricultural marketing by smallholders in Kenya: a comparison of maize, kale and dairy. Food Policy 52, 22–32.
Richard, Y.M., James, G. Lyimo. (2013). Climate Change, Adaptive Strategies and Rural Livelihoods in Semiarid Tanzania.
Schlenker, W. and Lobell, D.B. (2010). Robust negative impacts of climate change on African. Agricultural Environmental Research. Lett. 5:1-8.
Smit, B. and Skinner, M.W. (2001). Adaptation options in agriculture to climate change: Typology, Mitigation Adaptation Strategies Global Change 7:85-114.
Sivakumar, M V K Das, H P and Brunini, O. (2005) Impacts of Present and Future Climate Variability and Change on Agriculture and Forestry in the Arid and Semi-Arid Tropics 70: 31 – 72. (http://www.scirp.org/journal/nr)
Swai, O.W., Mbwambo, J.S. and Magayane, F. T. (2012). Gender and perception on climate change in Bahi and Kondoa Districts, Dodoma Region, Tanzania. Journal of African Studies and Development Vol. 4(9), pp. 218-231. [http://www. www. academicjournlas.org/JASD]
Thornton, K.P., Jones, G.P., Alagarswamy, G. Andresen, J.and Herrero, M. (2009) Adapting to climate change: Agricultural
Tanzania Journal of Agricultural Sciences (2019) Vol. 18 No. 1, 22-34
34Weather Related Challenges and Transitory Food Insecurity in Semiarid
system and household impacts in East Africa. Journal of Agricultural Systems 103:73-82 [journal homepage: www.elsevier.com/locate/agsy]
United Republic of Tanzania (URT). (2005). “Singida Region Socio-Economic Profile,” National Bureau of Statistics, Dar es Salaam and Regional Commissioner’s
Office, Singida,Van Duivenbooden, N., Abdoussallam, S. and
Ben Mohamed, A. (2002). Impact of climate change on agricultural production in the Sahel-Part 2: Methodological approach and case study for millet in Niger, Climatic Change 54(3), 349-368

Tanzania Journal of Agricultural Sciences (2019) Vol. 18 No. 1, 35-42
Introduction
Food crop production remains a major component of all production activities
in the agricultural sub-sector in Nigeria. Food crop production comes under different agricultural farming systems which include agroforestry. With increasing need to conserve natural resources particularly the forests, there was an introduction of agroforestry systems which permits the cultivation of food crops alongside tree crops. Agroforestry is a land use management system in which woody perennials are grown with food crops and or livestock leading to many beneficial, ecological and economic interactions between trees and non-tree components (FAO, 2015). It is one of the
methods designed to create a climate-smart agriculture, increase food security, alleviate rural poverty and achieve a truly sustainable development (Garrity and Stapleton, 2011). Lambert and Ozioma (2011) stated that agroforestry combines agriculture and forestry technology to create a more integrated, diverse, productive, profitable healthy and sustainable land use system.
Some of the benefits of agroforestry are that direct provision of food thereby supporting food nutrition and raising farmers’ income, providing fuel for cooking etc. Agroforestry has the advantage of mitigating change in climate, enhancing soil fertility as well as enhancing
Determinants of Yam Production and Resource use Efficiency under Agroforestry System in Edo State, Nigeria
*Idumah, F.O.1 and P.T. Owombo2
1Forestry Research Institute of Nigeria, Ibadan, Nigeria2Department of Agricultural Economics, Ondo State University of Science and Technology,
Okitipupa, Nigeria
*Corresponding email address: [email protected]
AbstractThis study was carried to determine the economics of yam production under agroforestry system in Sapoba forest area, Edo State, Nigeria. A two-stage sampling procedure was used to purposively select five villages and 12 respondents from each village engaged in food crop production under agroforestry system. About 60 farmers were thus selected from the area. Structured questionnaires were administered on the respondents to elicit answers on their socioeconomic characteristics and food production operations. Sixty farmers were selected in all. Data collected were analyzed with the aid of descriptive statistics, Cobb-Douglas production function was used to estimate the coefficients of the various variables analyzed. MPP, MVP and allocative efficiency index were used to estimate the efficiency of resource use in the study area. The results showed that farm size, yam seed and years of farming were significantly positive to yam production in the area. The results of the efficiency estimation, however, indicated that farm size (1.55), yam seed (1.5) were underutilized while hired labour (0.24), hoes (0.46) and matchete (0.32) were over-utilized. The regression also showed that the farmers were in the first stage of production which is increasing return to scale (using the elasticities). The study therefore recommends that to ensure the restoration of our forest, farmers should be encouraged to adopt agroforestry as a farming system. Farmers should also be encouraged to increase their productivity and, by extension, profit through the provision of improved yam seeds and given the opportunity for plot expansion. They should also maximize the utilization of the farm land by increasing the number of yam sett planted per hectare.Keywords: Efficiency, agroforestry, yam, production function, Sapoba forest area,
An International Journal of Basic and Applied Research
36 Idumah and Owombo
farmers’ revenue through income from fuel wood (Bifarin et al., 2013). Some studies have been carried to estimate the adoption of agroforestry technologies in Nigeria (Owombo et al., 2017; Bifarin et al., 2013)
One of the major food crops usually cultivated under that agroforestry farming system is yam. Yam belongs to the genus “Dioscorea” and family “Dioscoreaceae”. It is an important tuber crop of the tropics and some other countries in East Asia, South America and India (Iwueke et al, 2003). Yam (Dioscorea spp.) is among the oldest recorded food crops and ranked second after cassava in the study of carbohydrates in West Africa (Agwu and Alu, 2005). Yam is one of the major staple food in Nigeria and has potential for livestock feed and industrial starch production (Ayanwuyi et al, 2011). It is one of the principal tuber crops in the Nigeria economy, in terms of land under cultivation and in the volume and value of production (Bamire and Amujoyegbe, 2005).
Nigeria is the largest producer of the crop, producing about 38.92 million metric tonnes annually (FAO, 2008). There has, however, been a general decline in yam production in Nigeria over years. Madukwe et al. (2000); Agwu and Alu (2005) and International Institute of Tropical Agricultural [2009] reported that both area under yam cultivation and total yam output were declining. The decline in average yield per hectare has been more drastic, as it dropped from 14.9% in 1986-1990 to 2.5% in 1996-1999 (CBN, 2002; Agbaje et al, 2005 and FAO, 2007). This declining trend may not be unconnected with the type of operating farming system and inefficiency of resource use and allocation (Nwosu and Okoli, 2010).
Efficiency is a very important factor for productivity growth. In an economy where resources are scarce and opportunities to use new technologies are limited, inefficiency studies indicate the potential possibility to raise productivity by improving efficiency without necessarily developing new technologies or increasing the resource base (Bifarin et. al. (2010). International Atomic Energy Agency
(2009), highlighted that agroforestry which is the integration of trees and crops can increase resource use efficiency but that the management and design of the system must be such that are compatible with the local climate and soil conditions so as to avoid competition and the resultant decrease in crop yields.
Several studies have been carried out to determine the efficiency of resource use in yam production in Nigeria (Izekor and Olumese, 2010; Shehu et al. 2010; Awoniyi et al. 2010; Rueben and Barau, 2012). All these studies reported that farmers were inefficient in the use of resources in yam production. No known study has been carried out to determine the efficiency of farmers in yam production under agroforestry farming system. This study is, therefore, carried out to determine the efficiency of farmers in the production of yam under agroforestry by asking the following question:i. How optimally are resources used in yam
production under agroforestry in Edo State?ii. What are the factors that influence the
efficiency of farmers in yam production under agroforestry?
iii. What are the needed adjustments in resource use if they are not optimally utilized?
Objectives of this studyThe study was carried out to1. Identify the factors that determine
the efficiency of yam farmers under agroforestry enterprise
2. Describe the socio-economic characteristics of the yam farmers;
3. Identify the problems faced by farmers in yam production
MethodologyStudy areaThis study was carried out in Sapoba Forest Area in Orhionmwon Local Government Area of Edo state. Edo state is located between latitude 5°51N -7°33i N and longitudes 5°E-6°40iE. It shares common boundary with Ondo state in the west, Delta State in the east and Kogi state in the north. The vegetation of the state is moist rain forest in the south and derived savanna in the north. Sakpoba Forest Reserve lies between
latitudes 4°-4° 30’ and longitudes 6°- 6°5’E. It is bounded on the south by Delta State, on the East by Urhonigbe Forest Reserve and on the West by Free Area. It is located in Orhionmwon Local Government Area, about 30 kilometers South-East of Benin City. Some of the major villages located within and around the reserve are Ugo, Ikobi, Oben, Iguelaba and Amaladi in Area, and Ugboko-Niro, Iguere, Idunmwowina, Evbarhue, Idu, Evbueka, Iguomokhua, Ona, Abe, Igbakele, Adeyanba, Evbuosa in Area.
Orhionmwon LGA has a population of about 182,717 according to 2006 census with a land area of 2.382km2 (NPC, 2006). The people of the area are farmers and traders. Crops grown in the area include: yam, cassava, maize, plantain, and cocoyam interplant with some trees like Tectona grandis (teak) Gmelina arborea, Terminalia ivorenisis, Khaya ivorensis etc.
Sampling technique and dataA two-stage sampling procedure was used to select respondents for the study. In the first stage, 5 villages namely: Ageka, Evbuosa, Ona, Iguomokhua and FRIN Camp were purposively selected because of the predominance of agroforestry farming in the area. In the second stage, 12 respondents per village were purposively selected for the study. A total of 60 respondents were used for the study. Data collected include the socio-economic characteristics of respondents and the input-out factors of farm enterprise.
Analytical TechniqueData were analyzed with the aid of descriptive statistics and multiple log-linear regression. Descriptive statistics was employed to describe the socio-economic characteristics of respondents. It employed simple percentage, means and standard deviation.
The multiple log-linear regression model was used to determine quantitatively the socio-economic factors that influence the efficiency of yam farmers under agroforestry system. This is specified as follows:
Multiple log-linear Regression Model specificationThe empirical specification of the model is of the form shown below: Y oXi ii= β εβ 1
where Y = output βo = intercept of the function Xi = explanatory variable (i= 1-----n) εi = error termThe error term is assumed to be log normally distributed with mean 1 and contains among other things, differences in efficiency between farms. The explicit form of the equation is as stated below Log Y o X x
x x i= + + ++ +β β β
β β ε1 1 2 2
3 3 4 4
log loglog log
2
WhereY = yam output in kilogramsX1= land (farm size in hectares)X2 = hired labour(man days) X3 = value of capital used (hoes, matchete)X4 = quantity of seed yam εi = error term. β0 and βi are the constant and the regression coefficients respectively
From the Cobb-Douglas production function, the output elasticity of each production input was determined. This is equal to the value of the coefficient of the input. Also derived from the log-linear production function is the ratio of the marginal value product (MVP) of the various production inputs to the respective acquisition costs. This is done to examine the marginal returns to the agroforestry farm. This is an indication of efficiency in production.
Efficiency Model The marginal physical product MPP was given as MPPi bi APPi= × 3
where:bi = elasticity of the various inputs.
APPi yx
= 4
Tanzania Journal of Agricultural Sciences (2019) Vol. 18 No. 1, 35-42
37Determinants of Yam Production and Resource use Efficiency under Agroforestry
Where y is the mean of the output and x is the mean of the factor. Using the above specification and the output and input prices, the marginal value products (MVPs) and allocative efficiency index (AEI) were computed as follows:MVPi MPPi Py= × 5
AEI MVPiMFCi
= 6
where Py and MFC are the unit prices of output and factor input respectively.
The decision of whether a resource is used efficiently or not thus allocative efficient is basically on the value of AEI (Nimoh, et al., 2012). If AEI is equal to one (AEI=1) the factor input is efficiently utilized, hence the farmer is considered allocative efficient. The factor is over-utilized if AEI is less than one (AEI<1) and underutilized if AEI is greater than unity (AEI>1).
Results and DiscussionThis section discusses the socio-economic characteristics of farmers which are known to influence resource productivity and returns on the farms. The summary of the demographic and socio-economic characteristics of farmers is presented in Table 1. The demographic and socio economic variables considered include age, gender of farmers, household size, farm size, years of farming, level of education and marital status. About 63.3 % of the sampled farmers were between the age bracket 20 -50 years. This shows that majority of the farmers were middle aged and this implies that the farmers were still in their economic active age which could result in a positive effect on production. This result agrees with the findings of Alabi et al (2005) who observed that farmer’s age has great influence on maize production in Kaduna state with younger farmers producing more than the older ones plausibly because of their flexibility to new ideas and risk.
Furthermore 83.3% of the sampled respondents had one form of formal education or the other. Onyenweaku et al. (2005) and Idiong et al. (2006)
observed that formal education has positive influence on the acquisition and utilization of information on improved technology by the farmers as well as their innovativeness adoption of innovations. Majority of the farmers (73.3%) have over 5 years farming experience in agroforestry. This means that they must have acquired good experience in agroforestry farming. Rahman et al (2005) indicated that the length of time in farming business can be linked to age. Age, access to capital and experiences in farming may explain the tendency to adopt innovation and new technology.
Results of the Regression AnalysisThe results of the production function that was used to determine the nature of the relationship between the inputs and output in food production are shown in Table 2. The results in the table showed that the coefficient of multiple determinations (R2) and adjusted R were 0.7111 and 0.6784, respectively. This implies that 67.84 percent variation in the output of yam in the area is accounted for by the specified independent variables. The F-ratio (21.75) which was significant at 1 per cent level of probability indicates the overall significance and fitness of the model.
The results further showed that year of farming and seed yam (X4) were positive and significantly influenced yam production in the study area. Years of experience and seed yam were both significant at 1% level of probability. Farm size was positively significant at 10% and influenced yam production in the study area; it equally conformed to the expected sign of the study. The quality and, to some extent, the quantity of seed yam greatly influenced yam output under agroforestry enterprise. In addition, the quality and fertility of the soil although not accounted for in our estimation has great effect on output especially since the soil under which the farmers were farming was an undisturbed high forest area. The elasticities of production (EP) with respect to the inputs were 1.0580, 1.0771, and 0.6498 for years of farming, farm size and seed yam, respectively. From the regression analysis, the sum of the elasticities of the various variables equal to 2.0836 indicating
38 Idumah and Owombo
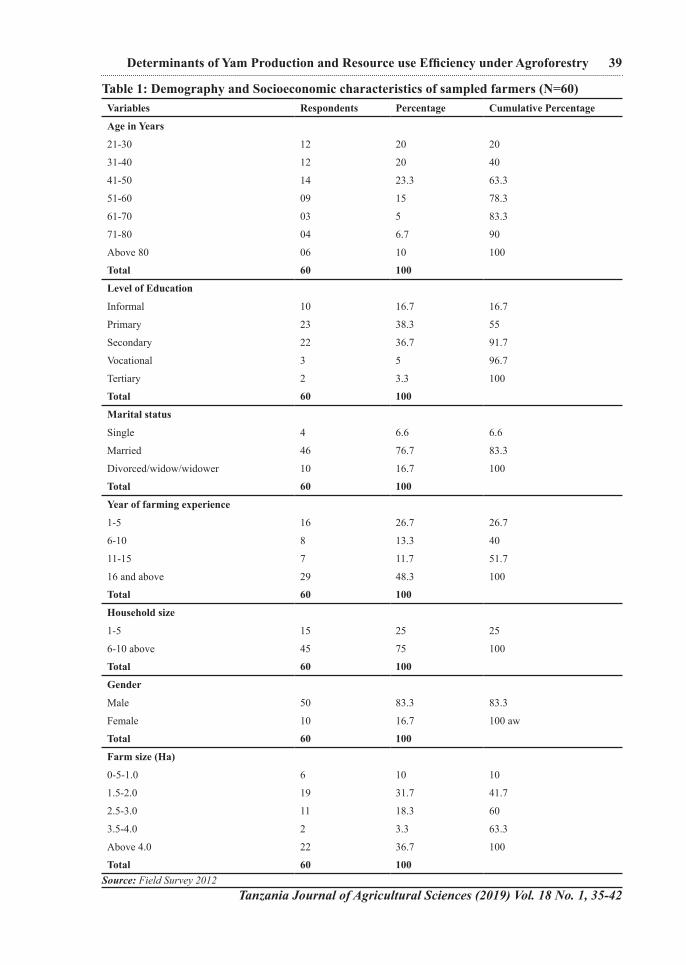
Table 1: Demography and Socioeconomic characteristics of sampled farmers (N=60)Variables Respondents Percentage Cumulative Percentage
Age in Years
21-30 12 20 20
31-40 12 20 40
41-50 14 23.3 63.3
51-60 09 15 78.3
61-70 03 5 83.3
71-80 04 6.7 90
Above 80 06 10 100
Total 60 100
Level of Education
Informal 10 16.7 16.7
Primary 23 38.3 55
Secondary 22 36.7 91.7
Vocational 3 5 96.7
Tertiary 2 3.3 100
Total 60 100
Marital status
Single 4 6.6 6.6
Married 46 76.7 83.3
Divorced/widow/widower 10 16.7 100
Total 60 100
Year of farming experience
1-5 16 26.7 26.7
6-10 8 13.3 40
11-15 7 11.7 51.7
16 and above 29 48.3 100
Total 60 100
Household size
1-5 15 25 25
6-10 above 45 75 100
Total 60 100
Gender
Male 50 83.3 83.3
Female 10 16.7 100 aw
Total 60 100
Farm size (Ha)
0-5-1.0 6 10 10
1.5-2.0 19 31.7 41.7
2.5-3.0 11 18.3 60
3.5-4.0 2 3.3 63.3
Above 4.0 22 36.7 100
Total 60 100Source: Field Survey 2012
Tanzania Journal of Agricultural Sciences (2019) Vol. 18 No. 1, 35-42
39Determinants of Yam Production and Resource use Efficiency under Agroforestry
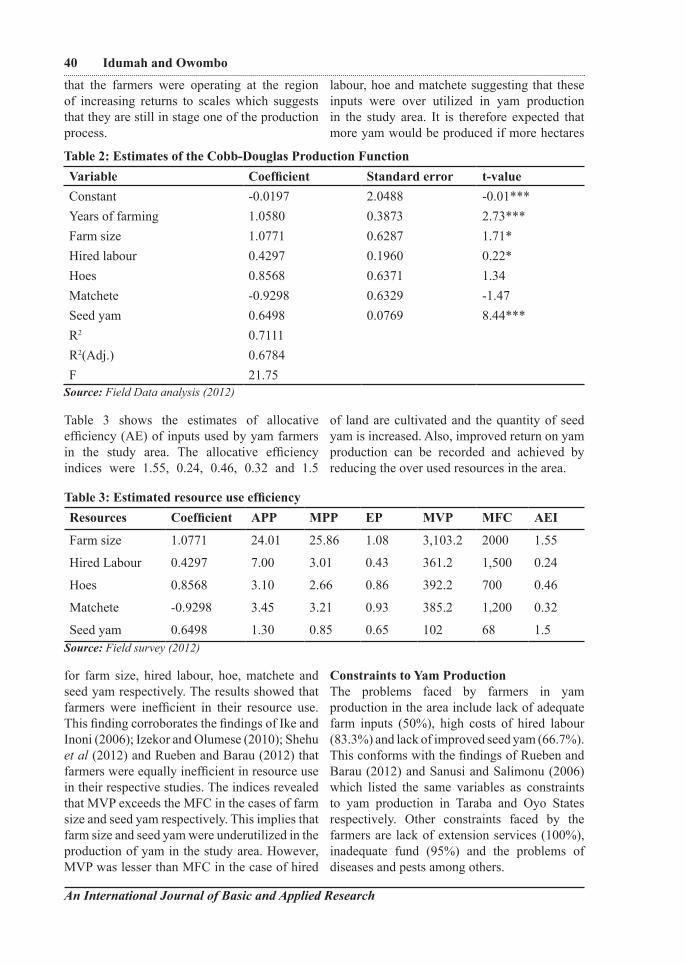
An International Journal of Basic and Applied Research
40 Idumah and Owombo
that the farmers were operating at the region of increasing returns to scales which suggests that they are still in stage one of the production process.
Table 3 shows the estimates of allocative efficiency (AE) of inputs used by yam farmers in the study area. The allocative efficiency indices were 1.55, 0.24, 0.46, 0.32 and 1.5
for farm size, hired labour, hoe, matchete and seed yam respectively. The results showed that farmers were inefficient in their resource use. This finding corroborates the findings of Ike and Inoni (2006); Izekor and Olumese (2010); Shehu et al (2012) and Rueben and Barau (2012) that farmers were equally inefficient in resource use in their respective studies. The indices revealed that MVP exceeds the MFC in the cases of farm size and seed yam respectively. This implies that farm size and seed yam were underutilized in the production of yam in the study area. However, MVP was lesser than MFC in the case of hired
labour, hoe and matchete suggesting that these inputs were over utilized in yam production in the study area. It is therefore expected that more yam would be produced if more hectares
of land are cultivated and the quantity of seed yam is increased. Also, improved return on yam production can be recorded and achieved by reducing the over used resources in the area.
Constraints to Yam ProductionThe problems faced by farmers in yam production in the area include lack of adequate farm inputs (50%), high costs of hired labour (83.3%) and lack of improved seed yam (66.7%). This conforms with the findings of Rueben and Barau (2012) and Sanusi and Salimonu (2006) which listed the same variables as constraints to yam production in Taraba and Oyo States respectively. Other constraints faced by the farmers are lack of extension services (100%), inadequate fund (95%) and the problems of diseases and pests among others.
Table 2: Estimates of the Cobb-Douglas Production FunctionVariable Coefficient Standard error t-valueConstant -0.0197 2.0488 -0.01***Years of farming 1.0580 0.3873 2.73***Farm size 1.0771 0.6287 1.71*Hired labour 0.4297 0.1960 0.22*Hoes 0.8568 0.6371 1.34Matchete -0.9298 0.6329 -1.47Seed yam 0.6498 0.0769 8.44***R2 0.7111R2(Adj.) 0.6784F 21.75
Source: Field Data analysis (2012)
Table 3: Estimated resource use efficiencyResources Coefficient APP MPP EP MVP MFC AEI
Farm size 1.0771 24.01 25.86 1.08 3,103.2 2000 1.55
Hired Labour 0.4297 7.00 3.01 0.43 361.2 1,500 0.24
Hoes 0.8568 3.10 2.66 0.86 392.2 700 0.46
Matchete -0.9298 3.45 3.21 0.93 385.2 1,200 0.32
Seed yam 0.6498 1.30 0.85 0.65 102 68 1.5Source: Field survey (2012)
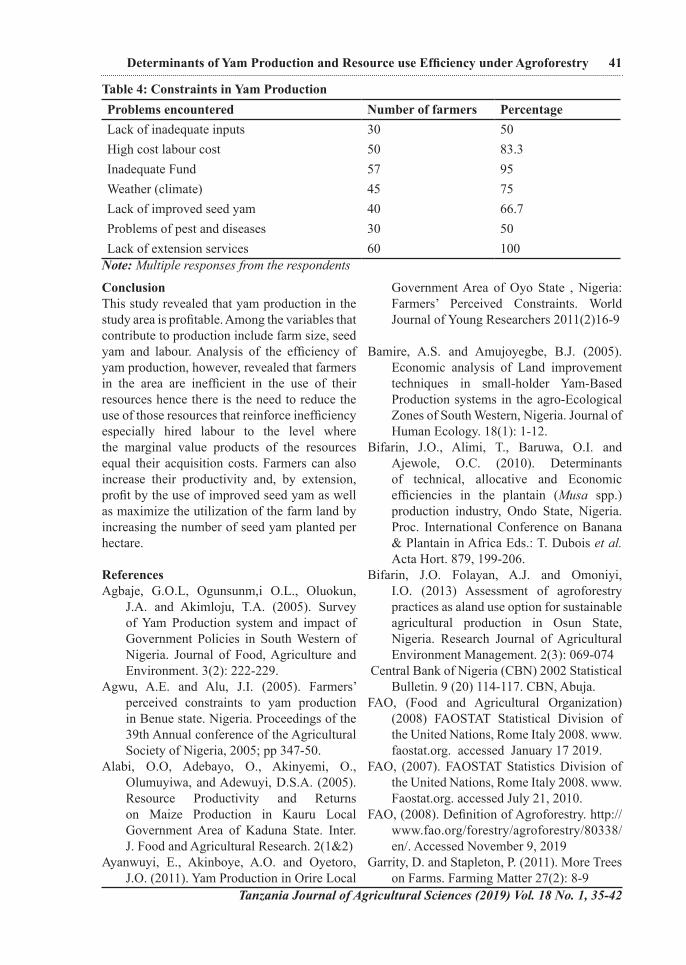
Tanzania Journal of Agricultural Sciences (2019) Vol. 18 No. 1, 35-42
41Determinants of Yam Production and Resource use Efficiency under Agroforestry
ConclusionThis study revealed that yam production in the study area is profitable. Among the variables that contribute to production include farm size, seed yam and labour. Analysis of the efficiency of yam production, however, revealed that farmers in the area are inefficient in the use of their resources hence there is the need to reduce the use of those resources that reinforce inefficiency especially hired labour to the level where the marginal value products of the resources equal their acquisition costs. Farmers can also increase their productivity and, by extension, profit by the use of improved seed yam as well as maximize the utilization of the farm land by increasing the number of seed yam planted per hectare.
ReferencesAgbaje, G.O.L, Ogunsunm,i O.L., Oluokun,
J.A. and Akimloju, T.A. (2005). Survey of Yam Production system and impact of Government Policies in South Western of Nigeria. Journal of Food, Agriculture and Environment. 3(2): 222-229.
Agwu, A.E. and Alu, J.I. (2005). Farmers’ perceived constraints to yam production in Benue state. Nigeria. Proceedings of the 39th Annual conference of the Agricultural Society of Nigeria, 2005; pp 347-50.
Alabi, O.O, Adebayo, O., Akinyemi, O., Olumuyiwa, and Adewuyi, D.S.A. (2005). Resource Productivity and Returns on Maize Production in Kauru Local Government Area of Kaduna State. Inter. J. Food and Agricultural Research. 2(1&2)
Ayanwuyi, E., Akinboye, A.O. and Oyetoro, J.O. (2011). Yam Production in Orire Local
Government Area of Oyo State , Nigeria: Farmers’ Perceived Constraints. World Journal of Young Researchers 2011(2)16-9
Bamire, A.S. and Amujoyegbe, B.J. (2005). Economic analysis of Land improvement techniques in small-holder Yam-Based Production systems in the agro-Ecological Zones of South Western, Nigeria. Journal of Human Ecology. 18(1): 1-12.
Bifarin, J.O., Alimi, T., Baruwa, O.I. and Ajewole, O.C. (2010). Determinants of technical, allocative and Economic efficiencies in the plantain (Musa spp.) production industry, Ondo State, Nigeria. Proc. International Conference on Banana & Plantain in Africa Eds.: T. Dubois et al. Acta Hort. 879, 199-206.
Bifarin, J.O. Folayan, A.J. and Omoniyi, I.O. (2013) Assessment of agroforestry practices as aland use option for sustainable agricultural production in Osun State, Nigeria. Research Journal of Agricultural Environment Management. 2(3): 069-074
Central Bank of Nigeria (CBN) 2002 Statistical Bulletin. 9 (20) 114-117. CBN, Abuja.
FAO, (Food and Agricultural Organization) (2008) FAOSTAT Statistical Division of the United Nations, Rome Italy 2008. www.faostat.org. accessed January 17 2019.
FAO, (2007). FAOSTAT Statistics Division of the United Nations, Rome Italy 2008. www. Faostat.org. accessed July 21, 2010.
FAO, (2008). Definition of Agroforestry. http://www.fao.org/forestry/agroforestry/80338/en/. Accessed November 9, 2019
Garrity, D. and Stapleton, P. (2011). More Trees on Farms. Farming Matter 27(2): 8-9
Table 4: Constraints in Yam ProductionProblems encountered Number of farmers PercentageLack of inadequate inputs 30 50High cost labour cost 50 83.3Inadequate Fund 57 95Weather (climate) 45 75Lack of improved seed yam 40 66.7Problems of pest and diseases 30 50Lack of extension services 60 100
Note: Multiple responses from the respondents
An International Journal of Basic and Applied Research
42 Idumah and Owombo
Idiong, C.I, Agom, D.I, and Ohen, S.B., (2006). Comparative Analysis of Technical Efficiency in Swamp and Upland Production Systems in Cross River State, Nigeria. In (Eds) Adepoju O.A. and Okunneye P.B. Technology and Agricultural Development in Nigeria. Proceedings of the 20th Annual National Conference of the Farm Management Association held in Federal College of Forestry, Jos 18th -21 September 2006. Pp 30- 39.
International Atomic Energy Agency (2009). Management of Agroforestry Systems for Enhancing Resource Use Efficiency and Crop Productivity, IAEA-TECDOC-CD-1606, IAEA, Vienna.
International Institute for Tropical Agriculture (IITA) 2009 http.//www.iita.org. accessed July 21, 2010.
Ike, P.C. and Inoni, O.E. (2006). Determinants of yam production and economic efficiency among small-scale farmers in South-eastern Nigeria. Journal of Central European Agriculture. 7. (2.): 337-342.
Iwueke, C.C., Mbata, E.N. and Okereke, H.E. (2003). Rapid Multiplication of seed yam by minisett technique. National Root Crops Research Institute, Umudike, Abia State, Nigeria, Advisory Bulletin 2003 No 9 pp5
Izekor, O.B. and Olumese, M.I. (2010). Determinants of yam production and profitability in
Edo State, Nigeria. African Journal of General Agriculture. 6(4): 205-210.
Lambert, O. and Ozioma, A.F., (2011). Adoption of improved agroforestry technologies among contact farmers in Imo state, Nigeria. Asian Journal Agricultural Rural Development 2(1):1-9
Madukwe, M.C., Ayichi, D.,and Okoli, E.C.(2000). Issues in yam minisett technology transfer to farmers in Southwestern Nigeria. African Technology policy studies working paper No. 4, Nairobi, Kenya. 2000; 52.
Nwosu, C.S. and Okoli, V.B.N. (2010).
Economic Analysis of Resource use by Wase Yam Farmers in Owerri Agricultural zone of Imo State, Nigeria in Proceedings of 44th Annual Conference of Agricultural Society of Nigeria held in Ladoke Akintola University, Ogbomosho, 18-22 October, 2010.
Nimoh, F., Tham-Agyekum, E.K. and Nyarko, P.K.(2012). Resource Use Efficiency in Rice Production: The Case of Kpong Irrigation Project in the Dangume West District of Ghana. International Journal of Agriculture and Forestry 2(1):35-40
National Population Commission (NPC) (2006). Abuja, Nigeria.
Onyeweaku, C.E., Igwe K.C. and Mbanasor J.A.(2005). Application of a Stochastic Frontier Production Function to a Measurement of Technical Efficiency in Yam Production in Nasarawa State, Nigeria, Journal of Sustainable Tropical Agricultural Research.13:20-35.
Owombo, P.T. and Idumah, F.O.(2017) Determinants of agroforestry technology adoption among arable crop farmers in Ondo state, Nigeria: an empirical investigation. Agroforest System: 91:919-926. DOI 10.1007/s10457-016-9967-2
Rahman, S.A. Ajayi F.A. and Gabriel, J. (2005). Technical Efficiency in Sorghum-based cropping System in Soba Area of Kaduna State, Nigeria. Journal of Research in Science and Management. 3(1):100-104.
Reuben, J and Barau, A.D.(2012). Resource Use Efficiency in Yam Production in Taraba State Nigeria. Journal of Agricultural Science. 3 (2): 71-77.
Sanusi, W.A. and Salimonu, K.K. (2006). Food Security among Households: Evidence from Yam Production in Oyo state, Nigeria. Agricultural Journal 1(4):249-253
Shehu, J.F., Iyortyer, I.T., Mshelia S.I. and Jongur A.A.U(2010). Determinants of yam production and technical efficiency among farmers in Benue State, Nigeria. Journal of Social Science 24 (2): 143-148.
Tanzania Journal of Agricultural Sciences (2019) Vol. 18 No. 1, 43-49
Introduction
Rain water harvesting can be done either through one point collection of water
into a dam or pond and later used for different purposes or through insitu collection which spread in micro-catchments basins in the fields for recharging plant available soil water. This work focused on insitu water harvesting. Insitu rain water harvesting is the process whereby rain water is captured in field through creation of surface roughness (Romkens and Wang, 1986) so that runoff is reduced and water infiltration and conservation enhanced for crops use over longer period of time in the fields (Larson, 1962; Zobeck and Onstad, 1984). Apart from water harvesting for crop use in the same field the rough soil surfaces are important for environmental conservation through controlling the runoff and soil erosion (Romkens and Wang, 1986). Insitu rain water harvesting in the sloping lands are conventionally done by using contour ridges, furrows and contour ditches (ICRAF, 1988). Research in the Southern Highlands of Tanzania has identified the potential of traditional soil management and tie ridge techniques that can recharge soil available water, control soil erosion and runoff, improve soil productivity (Malley, 1999; Malley et al., 2004).
The improvements for increasing their effectiveness in soil productivity enhancement and environmental conservation have been introduced and evaluated and proved to be more productive with farmers (Malley et al., 2002a; 2002b). Limited adoption of the improved technologies for land and environmental conservation has been the result of lack of promotion of these technologies. Ridge tillage systems are widely used by smallholder famers
throughout the world to enhance land productive quality (Lal, 1990). Smallholder farmers grow a variety of crops in Southern Africa, including Tanzania, and practice a traditional ridge tillage system.
Despite the wide use of traditional practices for mitigating and coping with changes in productive quality and/or quality of environmental resources, little attention is given to understand them and particularly to improve their effectiveness to enhance rural livelihoods.Farmers do not practice soil conservation due to lack of technologies. Promotion of these technologies would contribute to increased crop production and enhanced environmental conservation in the Southern Highlands of Tanzania.
The study aim to promote insitu rain water harvesting technologies based on the earlier work done by potential of ridging in soil surface management undertaken in Mbozi district and improvement of traditional soil and water conservation in Mbinga District (Malley et al., 2002a; 2002b).
Overall objective of this work was to increase adoption of land management technologies that integrate soil, water and nutrient management practices on the farms. Specifically, this work aimed to: (1) promote use of developed Integrated Soil Fertility Management (ISFM) technologies for increased crop yield per unit area through a package of integrated improved land husbandry practices; (2) monitor changes in critical soil fertility properties identified and physical trapping of soil particles.
Technical Note on Promoting Integrated Soil, Water and Nutrient Management Technologies in Southern
Highlands Zone of Tanzania
Mhamadi K. Mzimbiri, Zacharia .J.U. Malley, and William N. Mmari,
TARI-Uyole, P.O. Box 400, Mbeya
Email: [email protected]
An International Journal of Basic and Applied Research
44 Mzimbiri et al.Methodology The study area The field study was conducted for 3 growing seasons in Mbozi plateau, Mbozi district, SW Tanzania (8° – 9°12’ S, 32° – 7°2’ E). The area receives mono-modal rainfall of 800-1200 mm per annum from late October to April/May. Short dry spells are common in February/March. Mean minimum monthly temperatures vary between 17°C and 19°C and maximum temperatures range from 29°C to 30°C. The Mbozi plateau has an undulating to rolling landscape with rift benches, dominated by deep red sandy clay loam soils that are well to excessive drained. According to FAO classification, the soil at the site is mainly Ferralic Cambisols.
All households in the study area grow maize and beans for livelihoods. Average land holding per household is 1.2 ha. On average, the majority devote 71% of their land to maize-bean rotation. Smallholder households apply small quantities of N-fertilizers for maize, and do not fertilize the bean crop.
Study approach In 2009/10 -2011/12 seasons, researcher guided and backstopped, farmer-extension driven technology promotion approach, which built on earlier research results and outputs in Mbozi District was undertaken.
Farmer selected package of best-bets in integrated soil, water and nutrient management technologies were promoted through an acre scale demonstrations per farm, village field days and farmer-to-farmer training methods. A package of ISFM technology developed between 2000/01-2004/05 seasons, which included: cross-ridging techniques for water, soil and nutrients trapping into the basins, fertilizers use in beans and maize production, minimum tillage of dibbling maize seeding holes into cross-ridge system instead of open ridges and notorious weeds controlled by roundup herbicides. This was tested against farmers’ conservation tillage practices of organic matter incorporation and maize-bean rotation system, In addition, use of improved maize and beans seeds was promoted along with this soil management package. During
the period, a total of 260 farmers participated in groups constituted by 10-30 farmers.
Data collectionBaseline data were collected through key informant interviews and existing experimental information of the earlier works. Farmers who participated in research process volunteered to promote the package through forming farmer groups, which committed their resources (land, labour) to demonstrate and organized field days in their villages with assistance of extension workers and support of researchers.
PlanningJoint planning of promotions actions were undertaken and roles divided between researchers, extension and farmer groups. Farmers allocated land for demonstrations and measurements done with assistance of extension workers, prepared land and planted as per agreed prescriptions and managed the plots. Researchers supplied necessary inputs, particularly fertilizers and improved seeds with also collateral contributions from the groups and provided working tools (tape measures, weighing balance and data recording forms) and train farmer-data collectors.
Implementation of the ProjectThose farmers who planted beans last year, next year planted maize. So they have two acres (one for maize and one for beans). For both maize and beans the whole acre was 2m cross ridge. This is because the 2m cross ridges was profitable compared to 4m cross ridges.
Crop husbandryThionex was used for controlling insects like bean flies and bollworms in beans (1.5 Litres per hectare). First, spraying of insecticide (Thionex) was done 7 days after germination to control bean fly. Second and third spraying was done also by farmers to control bollworms then land preparation was done by farmers by using ox-plough and hand hoes. They made ridges as instructed by researchers. The planting of beans was according to their practice i.e. small holes by using their small hoes.
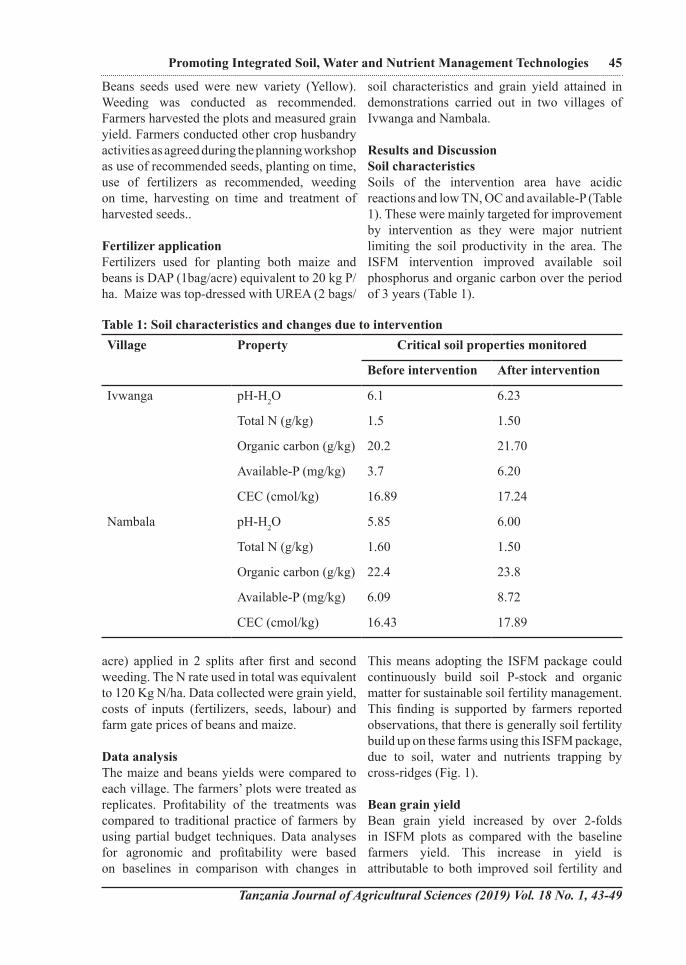
Tanzania Journal of Agricultural Sciences (2019) Vol. 18 No. 1, 43-49
45Promoting Integrated Soil, Water and Nutrient Management Technologies
Beans seeds used were new variety (Yellow). Weeding was conducted as recommended. Farmers harvested the plots and measured grain yield. Farmers conducted other crop husbandry activities as agreed during the planning workshop as use of recommended seeds, planting on time, use of fertilizers as recommended, weeding on time, harvesting on time and treatment of harvested seeds..
Fertilizer applicationFertilizers used for planting both maize and beans is DAP (1bag/acre) equivalent to 20 kg P/ha. Maize was top-dressed with UREA (2 bags/
acre) applied in 2 splits after first and second weeding. The N rate used in total was equivalent to 120 Kg N/ha. Data collected were grain yield, costs of inputs (fertilizers, seeds, labour) and farm gate prices of beans and maize.
Data analysisThe maize and beans yields were compared to each village. The farmers’ plots were treated as replicates. Profitability of the treatments was compared to traditional practice of farmers by using partial budget techniques. Data analyses for agronomic and profitability were based on baselines in comparison with changes in
soil characteristics and grain yield attained in demonstrations carried out in two villages of Ivwanga and Nambala.
Results and DiscussionSoil characteristics Soils of the intervention area have acidic reactions and low TN, OC and available-P (Table 1). These were mainly targeted for improvement by intervention as they were major nutrient limiting the soil productivity in the area. The ISFM intervention improved available soil phosphorus and organic carbon over the period of 3 years (Table 1).
This means adopting the ISFM package could continuously build soil P-stock and organic matter for sustainable soil fertility management. This finding is supported by farmers reported observations, that there is generally soil fertility build up on these farms using this ISFM package, due to soil, water and nutrients trapping by cross-ridges (Fig. 1).
Bean grain yield Bean grain yield increased by over 2-folds in ISFM plots as compared with the baseline farmers yield. This increase in yield is attributable to both improved soil fertility and
Table 1: Soil characteristics and changes due to interventionVillage Property Critical soil properties monitored
Before intervention After intervention
Ivwanga pH-H2O 6.1 6.23
Total N (g/kg) 1.5 1.50
Organic carbon (g/kg) 20.2 21.70
Available-P (mg/kg) 3.7 6.20
CEC (cmol/kg) 16.89 17.24
Nambala pH-H2O 5.85 6.00
Total N (g/kg) 1.60 1.50
Organic carbon (g/kg) 22.4 23.8
Available-P (mg/kg) 6.09 8.72
CEC (cmol/kg) 16.43 17.89
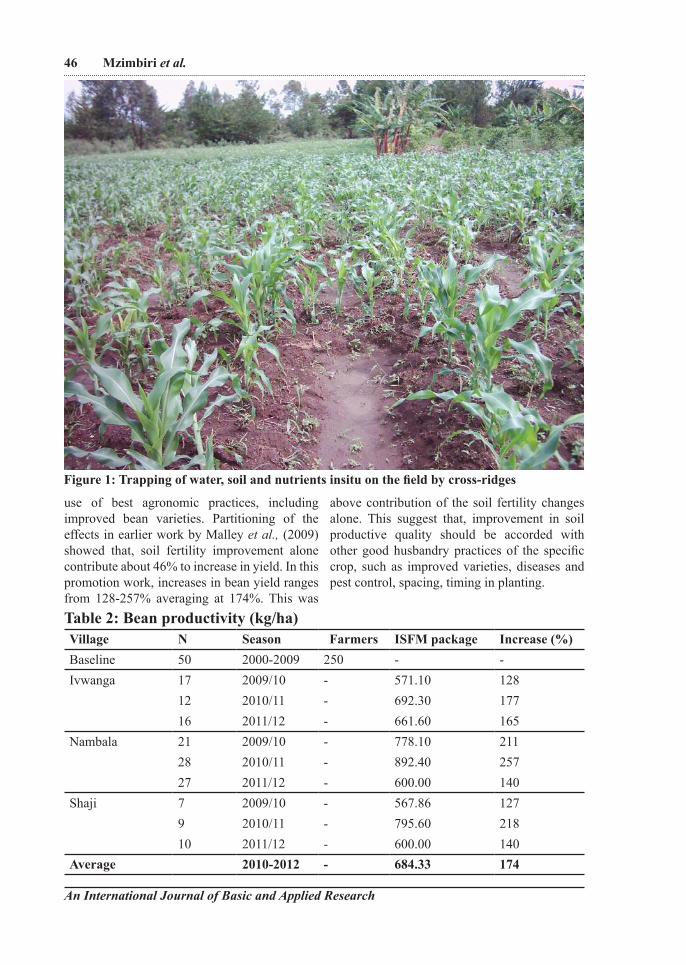
An International Journal of Basic and Applied Research
46 Mzimbiri et al.
use of best agronomic practices, including improved bean varieties. Partitioning of the effects in earlier work by Malley et al., (2009) showed that, soil fertility improvement alone contribute about 46% to increase in yield. In this promotion work, increases in bean yield ranges from 128-257% averaging at 174%. This was
above contribution of the soil fertility changes alone. This suggest that, improvement in soil productive quality should be accorded with other good husbandry practices of the specific crop, such as improved varieties, diseases and pest control, spacing, timing in planting.
Table 2: Bean productivity (kg/ha)Village N Season Farmers ISFM package Increase (%)Baseline 50 2000-2009 250 - -Ivwanga 17 2009/10 - 571.10 128
12 2010/11 - 692.30 17716 2011/12 - 661.60 165
Nambala 21 2009/10 - 778.10 21128 2010/11 - 892.40 25727 2011/12 - 600.00 140
Shaji 7 2009/10 - 567.86 1279 2010/11 - 795.60 21810 2011/12 - 600.00 140
Average 2010-2012 - 684.33 174
Figure 1: Trapping of water, soil and nutrients insitu on the field by cross-ridges
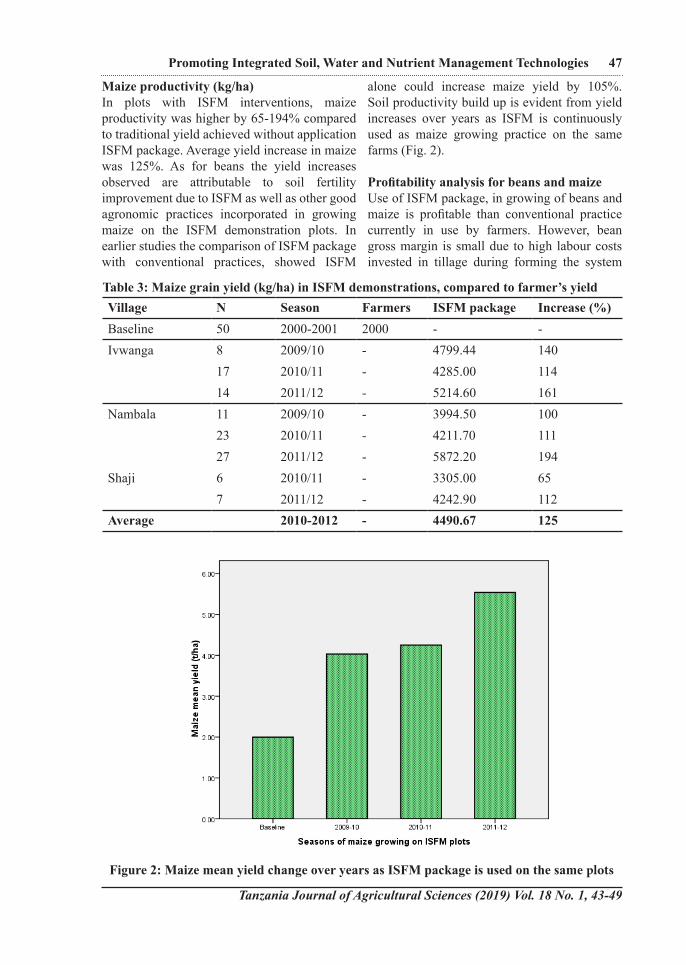
Tanzania Journal of Agricultural Sciences (2019) Vol. 18 No. 1, 43-49
47Promoting Integrated Soil, Water and Nutrient Management Technologies
Maize productivity (kg/ha)In plots with ISFM interventions, maize productivity was higher by 65-194% compared to traditional yield achieved without application ISFM package. Average yield increase in maize was 125%. As for beans the yield increases observed are attributable to soil fertility improvement due to ISFM as well as other good agronomic practices incorporated in growing maize on the ISFM demonstration plots. In earlier studies the comparison of ISFM package with conventional practices, showed ISFM
alone could increase maize yield by 105%. Soil productivity build up is evident from yield increases over years as ISFM is continuously used as maize growing practice on the same farms (Fig. 2).
Profitability analysis for beans and maizeUse of ISFM package, in growing of beans and maize is profitable than conventional practice currently in use by farmers. However, bean gross margin is small due to high labour costs invested in tillage during forming the system
Table 3: Maize grain yield (kg/ha) in ISFM demonstrations, compared to farmer’s yieldVillage N Season Farmers ISFM package Increase (%)Baseline 50 2000-2001 2000 - -Ivwanga 8 2009/10 - 4799.44 140
17 2010/11 - 4285.00 11414 2011/12 - 5214.60 161
Nambala 11 2009/10 - 3994.50 10023 2010/11 - 4211.70 11127 2011/12 - 5872.20 194
Shaji 6 2010/11 - 3305.00 657 2011/12 - 4242.90 112
Average 2010-2012 - 4490.67 125
Figure 2: Maize mean yield change over years as ISFM package is used on the same plots
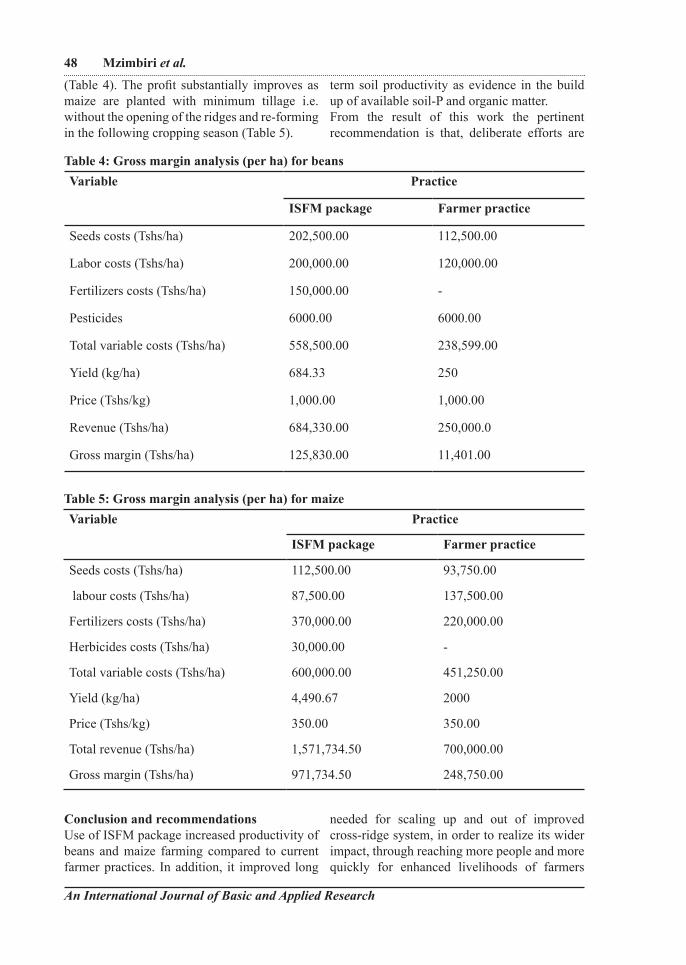
An International Journal of Basic and Applied Research
48 Mzimbiri et al.
(Table 4). The profit substantially improves as maize are planted with minimum tillage i.e. without the opening of the ridges and re-forming in the following cropping season (Table 5).
Conclusion and recommendationsUse of ISFM package increased productivity of beans and maize farming compared to current farmer practices. In addition, it improved long
term soil productivity as evidence in the build up of available soil-P and organic matter. From the result of this work the pertinent recommendation is that, deliberate efforts are
needed for scaling up and out of improved cross-ridge system, in order to realize its wider impact, through reaching more people and more quickly for enhanced livelihoods of farmers
Table 5: Gross margin analysis (per ha) for maizeVariable Practice
ISFM package Farmer practice
Seeds costs (Tshs/ha) 112,500.00 93,750.00
labour costs (Tshs/ha) 87,500.00 137,500.00
Fertilizers costs (Tshs/ha) 370,000.00 220,000.00
Herbicides costs (Tshs/ha) 30,000.00 -
Total variable costs (Tshs/ha) 600,000.00 451,250.00
Yield (kg/ha) 4,490.67 2000
Price (Tshs/kg) 350.00 350.00
Total revenue (Tshs/ha) 1,571,734.50 700,000.00
Gross margin (Tshs/ha) 971,734.50 248,750.00
Table 4: Gross margin analysis (per ha) for beans Variable Practice
ISFM package Farmer practice
Seeds costs (Tshs/ha) 202,500.00 112,500.00
Labor costs (Tshs/ha) 200,000.00 120,000.00
Fertilizers costs (Tshs/ha) 150,000.00 -
Pesticides 6000.00 6000.00
Total variable costs (Tshs/ha) 558,500.00 238,599.00
Yield (kg/ha) 684.33 250
Price (Tshs/kg) 1,000.00 1,000.00
Revenue (Tshs/ha) 684,330.00 250,000.0
Gross margin (Tshs/ha) 125,830.00 11,401.00
Tanzania Journal of Agricultural Sciences (2019) Vol. 18 No. 1, 43-49
49Promoting Integrated Soil, Water and Nutrient Management Technologies
and for conservation of the natural resources in similar environments. AcknowledgementsThe work was initiated by Ministry of Agriculture and currently receives some support fund from Government of Tanzania. The authors wish to thanks participating farmers and extension staff for sharing their knowledge and resources. I am grateful to the research institute authority for resources and encouragement to publish this work.
References ICRAF. 1988. Agro forestry in dryland Africa.
Nairobi.Lal, R (1990). Ridge tillage. Soil Tillage
Research 18:107-111.Larson, W.E. 1962. Tillage requirements
for corn. Journal of Soil and Water Conservation 17 (1): 3-7.
Malley, Z.J.U. 1999. The Ngoro cultivation system: soil productivity in the South Western Tanzania, Chapter 2; pp 15-27. In: Devin. and Ted, Z. (Eds). Eco-Agriculture: Initiatives in Eastern and Southern Africa. Weaver Press and the University of Guelph,
Canada.Malley Z.J.U., Kayombo, B. and Willcoks, T.J.
and Mtakwa, P. 2004. Ngoro: an indigenous sustainable and profitable soil, water and nutrient conservation system in Tanzania for sloping land. Soil and Tillage Research Journal 77(1): 47-58.
Malley, Z.J.U., Kamasho, J.A. and Haule, K.L. 2002a. Improvement of traditional soil and water conservation practices in Mbinga District, Ruvuma region, Tanzania, pp 67-76.
Malley, Z.J.U.; Kamasho, J.A. and Haule. K. L. 2002b. Potential of Ridging for Soil Surface Management. Annual Progress Report. ARI-Uyole.
Onstad, C.A. 1984. Depressional storage on tilled soil surfaces. Transactions of the American Society of Agricultural Engineers 27 (3): 729-732.
Romkens, M.J.M. and Wang, J.Y. 1986. Effect of tillage on surface roughness. Transactions of the American Society of Agricultural Engineers 29 (2): 429-433.
Zobeck, T.M. and Onstad, C.A. 1987. Tillage and rainfall effects on random roughness: A review. Soil and Tillage Research 9: 1-20.

Tanzania Journal of Agricultural Sciences (2019) Vol. 18 No. 1
Tanzania Journal of Agricultural Sciences (TAJAS)
Instructions to Authors
Submission of Papers
Submission of a paper to this journal implies it reports original and unpublished work and
if is accepted the paper will not be published else where in the same form.
Types of ContributionsPapers reporting results of original research. However, review articles, short communicationsand book reviews can be accepted after invitation.
Type of presentationi. File type: Word documentii. Font: Times New Roman, point 12iii. Spacing: doubleiv. Margins: 1-inch top, bottom, left and right.v. Line numbering: Continuousvi. Units of measurement: SIvii. Scientific names should be in italics
Length of manuscriptMaximum 20 pages
Arrangement of the manuscriptThe manuscript should be arranged into the following sections, each starting on a new page;i. Title page, includinga. Author(s) name(s) and affiliation(s);b. Complete address, email and telephone number of corresponding authorii. Abstract, including 4-6 key wordsiii. Introductioniv. Materials and Methodv. Resultsvi. Discussion,vii. Conclusionviii. Acknowledgementix. Referencesx. List of captions for tables and figuresDuring submission for review, tables and figurescan be embedded in the main document. Each table, figure, plate should be presented on a separate page.
Figures, tables and platesOnce the manuscript has been accepted for publication, each figure, table, plate tables MUST be submitted as a separate file.
Captions to figures and plates should be presented on separate pages, as paragraphs, under the following format:
Figure 1: (Title of the figure)
Table 1: (Title of the table)
• Figures Figures/diagrams should be presented in the following formats; JPEG, TIFF..; on a scale that can be reduced to a width of 75mm (one column) or 160 mm (two columns) without losing resolution.
• Tables All column headings should be typed left justified.
• Plates (photographs) may be included if they provide additional information.
ReferencesFor source cited in the text there should be a fullcitation in the reference list and vice versa.
Sample formatsJournal articleAuthor(s) name(s), title, journal name, volume,pages.Fulani, F. (1900). Publishing in TAJAS. Tanzania Journal of Agricultural Sciences 1(1): 1 – 2.
BookAuthor(s) name(s), year, title, publisher, town.number of pages.Fulani, F. (1900). Publishing in TAJAS. Lugurupublishers Ltd, Morogoro. 400 pp.
Chapter in a bookAuthor(s) name(s), year, title of the article, titleof the book, editor(s), publisher, town, pages. Fulani, F. (1900). Publishing in TAJAS. In: Publishing in peer reviewed journals (edited bySomeone, A.), Luguru publishers Ltd, Morogoro. pp. 1-2.
An International Journal of Basic and Applied Research
Instructions to Authors
ProceedingsAuthor(s) name(s), year, title of the article, titleof the proceedings, pages.Fulani, F. (1900). Publishing in TAJAS. In: Proceedings of of TAJAS workshop, Morogoro,Tanzania. (Edited by Someone, A), 1-2 January1900. Morogoro, Tanzania. pp 1-2.
Online articlesAuthor(s) name(s), title, URL, date accessed.
SubmissionAll files should be submitted to [email protected]


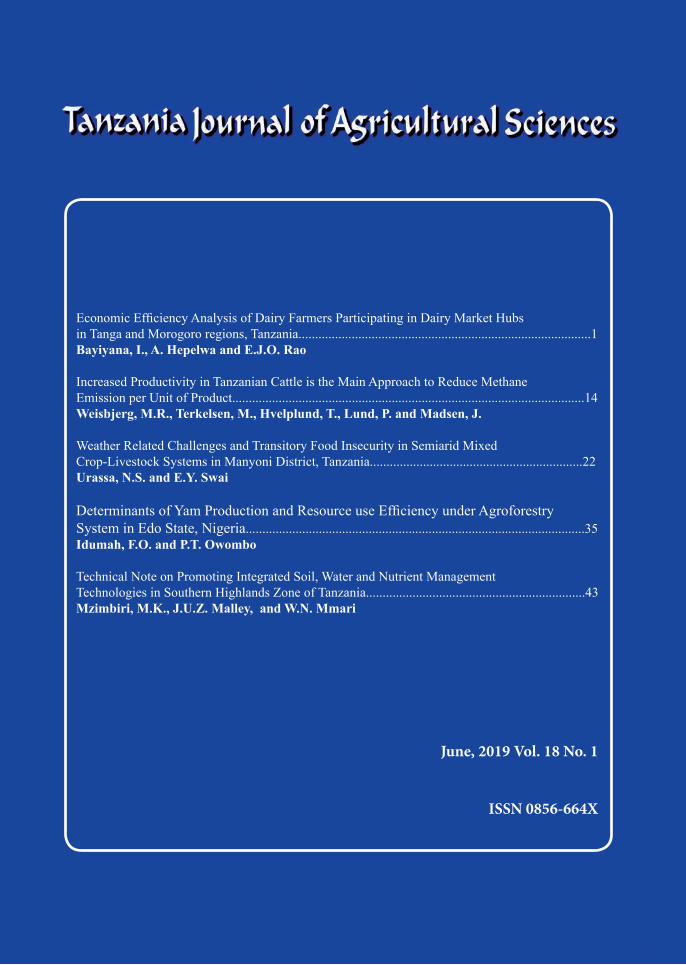
Economic Efficiency Analysis of Dairy Farmers Participating in Dairy Market Hubs in Tanga and Morogoro regions, Tanzania........................................................................................1Bayiyana, I., A. Hepelwa and E.J.O. Rao
Increased Productivity in Tanzanian Cattle is the Main Approach to Reduce Methane Emission per Unit of Product..........................................................................................................14Weisbjerg, M.R., Terkelsen, M., Hvelplund, T., Lund, P. and Madsen, J.
Weather Related Challenges and Transitory Food Insecurity in Semiarid Mixed Crop-Livestock Systems in Manyoni District, Tanzania................................................................22Urassa, N.S. and E.Y. Swai
Determinants of Yam Production and Resource use Efficiency under Agroforestry System in Edo State, Nigeria......................................................................................................35Idumah, F.O. and P.T. Owombo
Technical Note on Promoting Integrated Soil, Water and Nutrient Management Technologies in Southern Highlands Zone of Tanzania..................................................................43Mzimbiri, M.K., J.U.Z. Malley, and W.N. Mmari
June, 2019 Vol. 18 No. 1
ISSN 0856-664X