Embed Size (px)
Citation preview
491
J. Gen. Physiol.
© The Rockefeller University Press
•
0022-1295/2000/04/491/18 $5.00Volume 115 April 2000 491–508http://www.jgp.org/cgi/content/full/115/4/491
An Intermediate State of the
g
-Aminobutyric Acid Transporter GAT1 Revealed by Simultaneous Voltage Clamp and Fluorescence
Ming Li, Robert A. Farley,
and
Henry A. Lester
From the Division of Biology, California Institute of Technology, Pasadena, California 91125
abstract
The rat
g
-aminobutyric acid transporter GAT1 expressed in
Xenopus
oocytes was labeled at Cys74, andat one or more other sites, by tetramethylrhodamine-5-maleimide, without significantly altering GAT1 function.Voltage-jump relaxation analysis showed that fluorescence increased slightly and monotonically with hyperpolariza-
tion; the fluorescence at
2
140 mV was
z
0.8% greater than at
1
60 mV. The time course of the fluorescence relax-ations was mostly described by a single exponential with voltage-dependent but history-independent time constantsranging from
z
20 ms at
1
60 mV to
z
150 ms at
2
140 mV. The fluorescence did not saturate at the most negativepotentials tested, and the midpoint of the fluorescence–voltage relation was at least 50 mV more negative than the
midpoint of the charge–voltage relation previously identified with Na
1
binding to GAT1. The presence of
g
-ami-nobutyric acid did not noticeably affect the fluorescence waveforms. The fluorescence signal depended on Na
1
concentration with a Hill coefficient approaching 2. Increasing Cl
2
concentration modestly increased and acceler-ated the fluorescence relaxations for hyperpolarizing jumps. The fluorescence change was blocked by the GAT1 in-hibitor, NO-711. For the W68L mutant of GAT1, the fluorescence relaxations occurred only during jumps to highpositive potentials, in agreement with previous suggestions that this mutant is trapped in one conformational stateexcept at these potentials. These observations suggest that the fluorescence signals monitor a novel state of GAT1,
intermediate between the
E
*
out
and
E
out
states of Hilgemann, D.W., and C.-C. Lu (1999.
J. Gen. Physiol
.
114:459–476). Therefore, the study provides verification that conformational changes occur during GAT1 function.
key words:
voltage clamp •
Xenopus
oocyte • tetramethylrhodamine • conformational change
I N T R O D U C T I O N
Specific Na
1
-coupled transporters are present on neu-ronal and glial membranes for all known low–molecu-lar weight neurotransmitters or, in the case of acetyl-choline, for their catabolites. These transporters arethought to be responsible for removal of the neu-rotransmitter from the vicinity of receptors and aretherefore important for termination of synaptic trans-mission. To influence the time course of synaptic trans-mission, this removal would be expected to occur on atime scale of milliseconds for ligand-gated channels,and on a time scale of hundreds of milliseconds forG-protein–coupled receptors. This postulated role forneurotransmitter transporters in neurotransmissioncalls for direct measurements of the time course ofneurotransmitter transporter action.
Besides their postulated physiological function, neu-rotransmitter transporters are pharmacologically im-portant: they appear to be the sites of action for impor-tant abused (cocaine) and therapeutic (antidepressants,psychostimulants, antiepileptics) drugs (Kuhar et al.,1991; Amara and Kuhar, 1993; Lester et al., 1996). De-
spite their pharmacological function, the molecularmechanisms of these inhibitors are not known. Under-standing the detailed mechanism of neurotransmittertransporter action would facilitate rational drug design.
Therefore it is an important goal to study the physicalmechanism of neurotransmitter transporters at the mo-lecular level. The driving force for transporting neu-rotransmitter across the cell membrane comes from theelectrochemical gradient of the cotransported ions, pri-marily Na
1
. Na
1
, Cl
2
, and sometimes K
1
are cosubstrateswith a stoichiometry of 1 or 2 mol/mol of neurotransmit-ter (Rudnick, 1977; Kanner, 1978; Rudnick and Nelson,1978; Kanner and Bendahan, 1982; Pastuszko et al., 1982;Radian and Kanner, 1983, 1985). With the molecular
cloning of the
g
-aminobutyric acid (GABA) transporterGAT1 (Guastella et al., 1990), and the subsequent clon-ing of many other neurotransmitter transporters (Blakelyet al., 1991; Hoffman et al., 1991; Pacholczyk et al., 1991;Shimada et al., 1991; Usdin et al., 1991), research onneurotransmitter transporters has been accelerating.Sequence analysis shows that some neurotransmittertransporters, such as GAT1 and the serotonin transporterSERT, are homologous members of a family whose mem-bers are postulated to contain 12 transmembrane helices
and
z
600 amino acid residues. Structure–function stud-ies of transporters in this GAT1 family, based on site-directed mutagenesis and heterologous expression, have
Address correspondence to Henry A. Lester, Division of Biology 156-29, California Institute of Technology, 1201 East California Boule-vard, Pasadena, CA 91125. Fax: 626-564-8709; E-mail: [email protected]
on August 21, 2006
ww
w.jgp.org
Dow
nloaded from
492
Fluorescence Kinetics of
g
-Aminobutyric Acid Transporter
identified certain residues that are critical for transporterfunction and have provided clues about some functionaldomains (Mabjeesh and Kanner, 1992; Bendahan andKanner, 1993; Pantanowitz et al., 1993; Kleinberger-Doron and Kanner, 1994; Penado et al., 1998). Neverthe-less, the actual molecular structure and physical mecha-nism(s) of transport is still not known. This situation callsfor additional biophysical study of these transporters.
In this research, we used combined electrophysiologi-cal and optical techniques to study the molecular mech-anism of neurotransmitter transporter function. Electro-physiology can be used for transporter studies becauseion binding and translocation steps, which are partial re-actions in the transport cycle, produce electrical signals.For GAT1, electrophysiology is employed to assess rates,reaction steps, and turnover numbers (Mager et al.,1993, 1996; Hilgemann and Lu, 1999; Lu and Hilge-mann, 1999a,b). On the other hand, recording of fluo-rescent probes has more recently been applied to moni-tor the conformational changes of channel proteins(Mannuzzu et al., 1996; Cha and Bezanilla, 1997, 1998;Siegel and Isacoff, 1997; Baker et al., 1998; Loots and Isa-coff, 1998) and transporters (Loo et al., 1998) expressedin cell membranes. Such experiments have provided im-portant insights into the motion of S2 and S4 segmentsof K
1
channel domains and the Na
1
-glucose transporter.For the experiments, we built an apparatus for simul-
taneous electrophysiological and optical recordingfrom
Xenopus
oocytes. We detected and analyzed con-formational transitions at GAT1 with a time resolutionof milliseconds. These results may contribute to ex-plaining the molecular mechanism of transporter func-tion and drug action, which are important for under-standing the physiological and pathological role ofneurotransmitter transporters in native cells.
Our studies were enhanced by the use of two previouslycharacterized GAT1 mutants. (a) The C74A mutant func-
tions rather similarly to wild type (WT),
1
yet is insensitiveto the sulfhydryl reagent MTS-ethyltrimethylammonium(MTSET) (Yu et al., 1998). This mutant was therefore ex-pected to undergo normal conformational changes, butto lack a crucial site for labeling by sulfhydryl-specificprobes. Indeed, we find that C74A-GAT1 is labeled to alesser extent than WT-GAT1 by our fluorescent probe,tetramethylrhodamine maleimide. (b) The W68L mu-
tant appears to be locked in a high-affinity state for Na
1
(Mager et al., 1996). We expected that this W68L-GAT1would show WT levels of labeling but reduced fluores-cence relaxations. This expectation is fulfilled.
M A T E R I A L S A N D M E T H O D S
Reagents and Solutions
The fluorescent dye tetramethylrhodamine-5-maleimide was pur-
chased from Molecular Probes, Inc. The blocking reagent 3-male-imidopropionic acid was purchased from Aldrich Chemical Co.MTSET was purchased from Toronto Research Chemicals. TheGAT1 inhibitor NO-711 was purchased from Research Biochemi-cals, Inc. Other reagents were purchased from Sigma ChemicalCo. The recording solution, ND96, contained 96 mM NaCl, 2mM KCl, 1 mM MgCl
2
, and 5 mM HEPES, pH 7.4. The incuba-tion solution contained ND96 plus 2% horse serum. The NMDGsubstitution for Na
1
contained 96 mM NMDG instead of Na
1
inthe ND96 solution. The gluconate substitution of Cl
2
contained96 mM gluconate instead of Cl
2
in the ND96 solution.
Oocyte Expression
The high-efficiency expression system for GABA and serotonintransporters in
Xenopus
oocytes (Mager et al., 1993) was used forrGAT1 expression, with modifications for the fluorescence label-ing. In brief, 30 ng cRNA of WT-rGAT1 (Mager et al., 1993) orC74A-rGAT1 (Yu et al., 1998) was injected into stage VI oocytesand the cells were incubated at 18
8
C for 1 d, and then moved to12
8
C for incubation for 5 d. At the end of the sixth day of incuba-tion, the oocytes were treated for fluorescence labeling, as de-scribed in the following.
Fluorescence Labeling and MTSET Reaction
At the end of the sixth day of incubation, the oocytes were reacted
with 10 mM 3-maleimidopropionic acid in ND96 for 1 h at 18
8
C, toblock the endogenous reactive sulfhydryl groups in the oocytemembrane. After this blocking reaction, the oocytes were washedand brought to 18
8
C incubation for 1 d. On the eighth day aftercRNA injection, the oocytes were incubated in ND96 solution con-taining 5 mM tetramethylrhodamine-5-maleimide (TMRM) for 1 hon ice as described (Mannuzzu et al., 1996), or at room tempera-ture for 30 min; these two treatments produced similar results inthe fluorescence signals. The labeled oocytes were then washed andincubated in ND96, ready for recording and GABA uptake assay.For MTSET reactions, oocytes were incubated in ND96 containing3.75 mM MTSET for 0.5 h at room temperature (Yu et al., 1998).
The result of TMRM labeling was examined by measuring thefluorescence intensity of the oocyte surface at the animal pole withthe apparatus described below, and by fluorescence confocal imag-ing of the oocyte surface using a MRC-600 confocal microscope
(MRC-600; Bio-Rad Laboratories) with a 10
3
, NA 0.5 objective.
Apparatus
The recording setup, as shown in Fig. 1, consists of a microscope,a photomultiplier tube (PMT) attached to the side port of themicroscope, and conventional two-electrode voltage clamp in-struments. The inverted fluorescence microscope (IX-70-FLA;Olympus Corp.) is fitted with a stabilized 100-W Hg light sourceand an oil-immersion objective of 40
3
, NA 1.3. The dichroic mir-ror is the high Q TRITC set from Chroma Technology Corp. ThePMT (R928P; Hamamatsu Phototonics) is in a housing originallybuilt by Photon Technology, Inc. The oocyte is placed on the mi-croscope stage and is visualized for electrophysiology by a sepa-rate stereomicroscope. The exciting beam was attenuated by fac-tors approaching 300 by neutral density filters; therefore, an in-candescent lamp would probably suffice. A digitally controlled(i.e., finger-operated) shutter blocked the beam, except duringactual data trials, to minimize bleaching. The emission signalfrom the oocytes was appropriately amplified and filtered at 200
1
Abbreviations used in this paper:
GABA,
g
-aminobutyric acid; MTSET,methanethiosulfonate-ethyltrimethylammonium; PMT, photomulti-plier tube; TMRM, tetramethylrhodamine-5-maleimide; WT, wild type.
on August 21, 2006
ww
w.jgp.org
Dow
nloaded from
493
Li et al.
Hz by an eight-pole low-pass filter (902-LPF; Frequency Devices,Inc.). Each trace was acquired and averaged over 30 sweeps by anAxon Digidata interface and pCLAMP 7 (Axon Instruments). AHumBug (Quest Scientific) removed the remaining 60 Hz. Two-electrode voltage clamp procedures were used as described(Quick and Lester, 1994; Mager et al., 1998). We optimized theapparatus using the
Shaker
H4 R359C mutation, generously pro-vided by E. Isacoff (Univerisity of California, Berkely, Berkely,CA), and found 31% changes in fluorescence upon voltage depo-larization from
2
80 to
1
40 mV. This signal is comparable withprevious results with a similar apparatus (Mannuzzu et al., 1996).
Off-line Data Analysis
Steady state fluorescence values were measured as the averageover the final 200 ms at the test potential. For kinetic analyses suchas those shown in Figs. 6–9 (below), signals were subjected to fur-ther averaging across cells, digital filtering (50 Hz eight-poleBessel), baseline alignment, and linear detrending where appro-priate. Waveforms were fit to single or double exponentials withroutines in ORIGIN 5 and CLAMPFIT 8. In preliminary analyses,we verified that (a) the baseline alignment did not result in sys-tematic voltage-dependent shifts, and (b) the linear detrendingdid not result in systematic elimination of slow exponential com-ponents with time constants of
z
500 ms or less. We cannot ruleout the possibility that relaxations with larger time constantswould be detected by test potentials longer than those used here.
Because the fluorescence relaxations were small and noisy, ac-curate analysis of these relaxations is a major topic of this paper.Therefore, several details of the analysis are evaluated in the
re-sults
. Figs. 5 and 6 show the progression from raw to analyzedtraces for two important data sets. Figs. 7 and 8 present tests forhistory dependence. Figs. 9 and 10 compare two methods for an-alyzing the voltage dependence of the fluorescence relaxations.
GABA Uptake Assay
[
3
H]GABA uptake experiments were performed as follows. Oo-cytes expressing GAT1 were incubated in ND96 solution contain-ing various concentrations of GABA and trace amounts of[
3
H]GABA for 20 min, and then washed with ND96 solution fivetimes. Each individual oocyte was then dissolved in 1 ml 10% SDSand the radioactivity was measured using a scintillation counter(LS 5000 TD/TA; Beckman Instruments Inc.).
R E S U L T S
TMRM Treatment of GAT1 Does Not Affect GABA Uptake
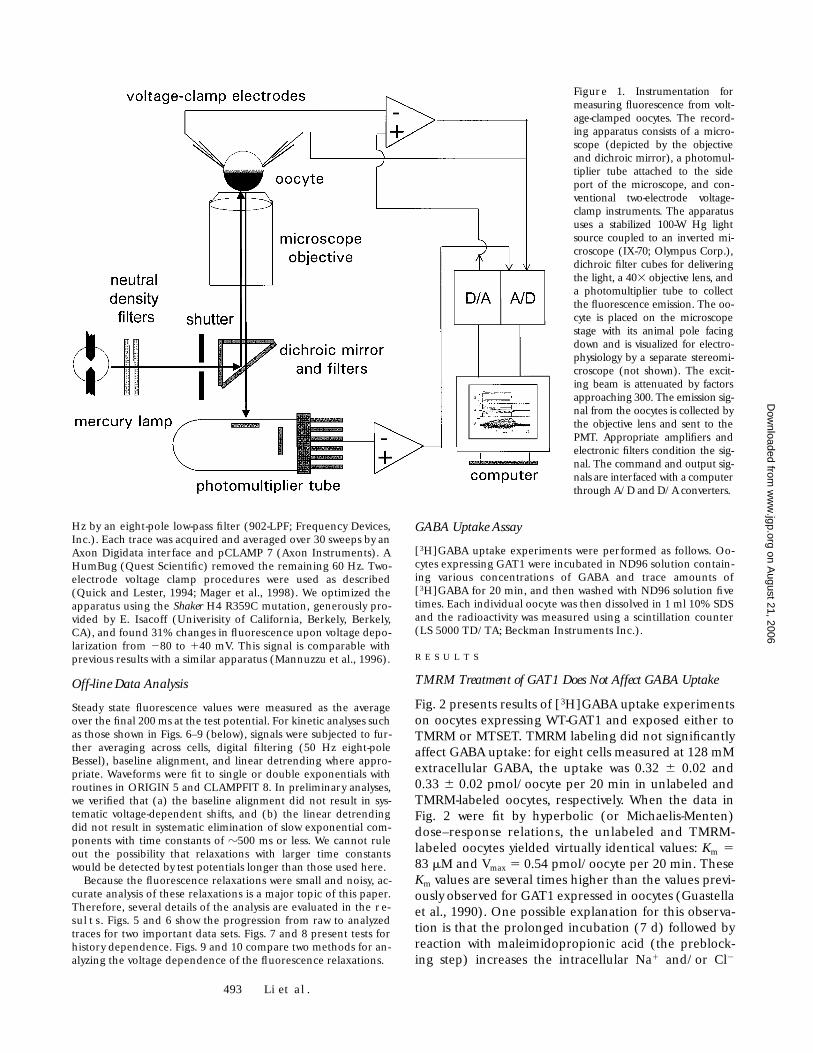
Fig. 2 presents results of [
3
H]GABA uptake experimentson oocytes expressing WT-GAT1 and exposed either toTMRM or MTSET. TMRM labeling did not significantlyaffect GABA uptake: for eight cells measured at 128 mMextracellular GABA, the uptake was 0.32
6
0.02 and0.33
6
0.02 pmol/oocyte per 20 min in unlabeled andTMRM-labeled oocytes, respectively. When the data inFig. 2 were fit by hyperbolic (or Michaelis-Menten)dose–response relations, the unlabeled and TMRM-labeled oocytes yielded virtually identical values:
K
m
5
83
m
M and V
max
5
0.54 pmol/oocyte per 20 min. These
K
m
values are several times higher than the values previ-ously observed for GAT1 expressed in oocytes (Guastellaet al., 1990). One possible explanation for this observa-tion is that the prolonged incubation (7 d) followed byreaction with maleimidopropionic acid (the preblock-ing step) increases the intracellular Na
1
and/or Cl
2
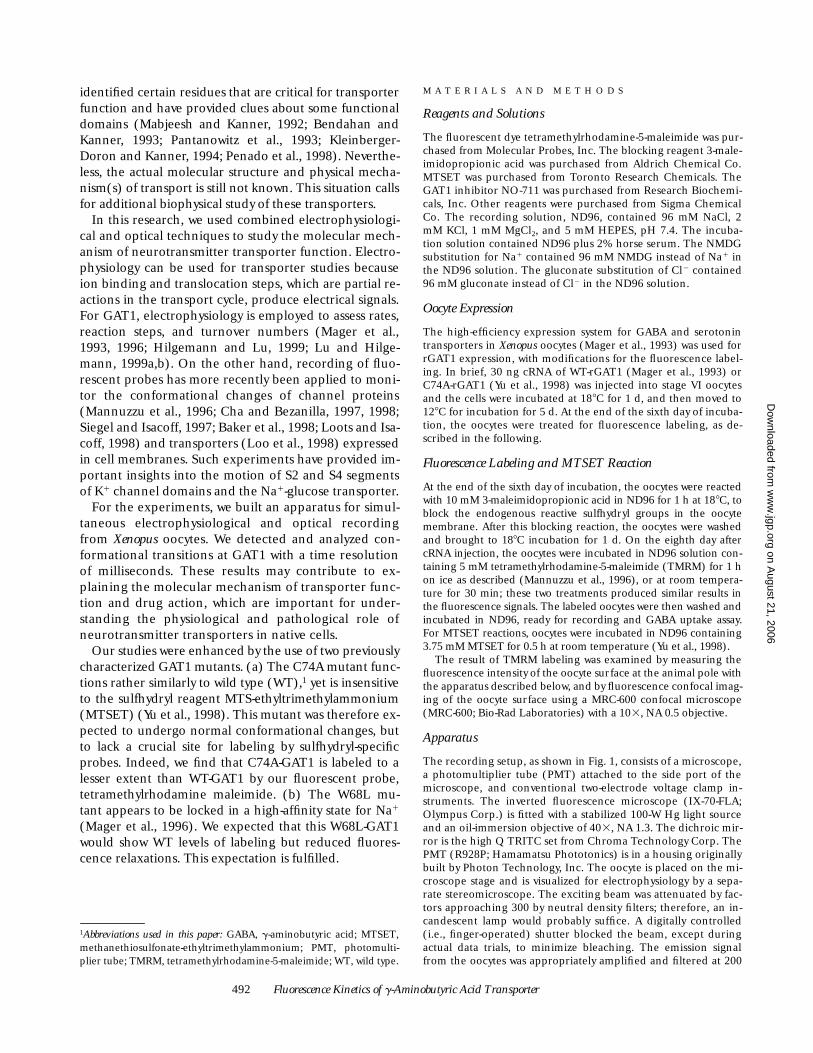
Figure 1. Instrumentation formeasuring fluorescence from volt-age-clamped oocytes. The record-ing apparatus consists of a micro-scope (depicted by the objectiveand dichroic mirror), a photomul-tiplier tube attached to the sideport of the microscope, and con-ventional two-electrode voltage-clamp instruments. The apparatususes a stabilized 100-W Hg lightsource coupled to an inverted mi-croscope (IX-70; Olympus Corp.),dichroic filter cubes for deliveringthe light, a 403 objective lens, anda photomultiplier tube to collectthe fluorescence emission. The oo-cyte is placed on the microscopestage with its animal pole facingdown and is visualized for electro-physiology by a separate stereomi-croscope (not shown). The excit-ing beam is attenuated by factorsapproaching 300. The emission sig-nal from the oocytes is collected bythe objective lens and sent to thePMT. Appropriate amplifiers andelectronic filters condition the sig-nal. The command and output sig-nals are interfaced with a computerthrough A/D and D/A converters.
on August 21, 2006
ww
w.jgp.org
Dow
nloaded from
494
Fluorescence Kinetics of
g
-Aminobutyric Acid Transporter
concentration and thereby increases the
K
m
for GABA(Lu and Hilgemann, 1999b). This preblocking step wasdone for both unlabeled and TMRM-labeled oocytes.
GAT1 and C74A-GAT1 Are Labeled by TMRM
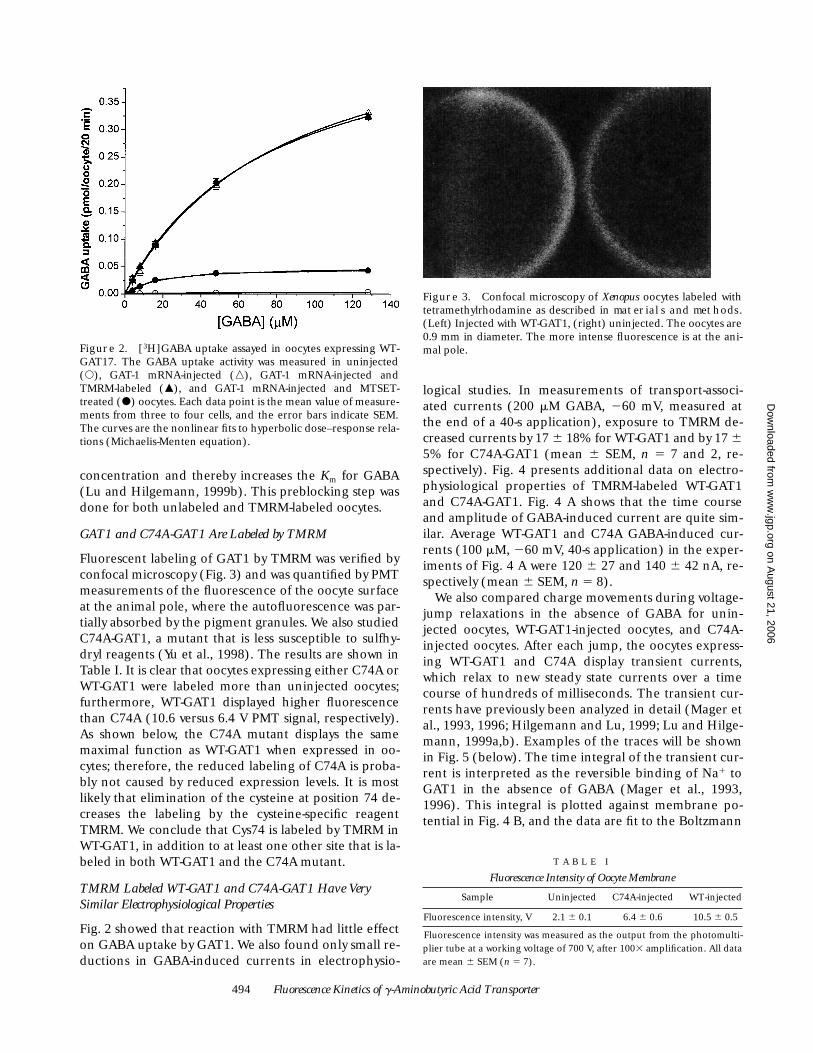
Fluorescent labeling of GAT1 by TMRM was verified byconfocal microscopy (Fig. 3) and was quantified by PMTmeasurements of the fluorescence of the oocyte surfaceat the animal pole, where the autofluorescence was par-tially absorbed by the pigment granules. We also studiedC74A-GAT1, a mutant that is less susceptible to sulfhy-dryl reagents (Yu et al., 1998). The results are shown inTable I. It is clear that oocytes expressing either C74A orWT-GAT1 were labeled more than uninjected oocytes;furthermore, WT-GAT1 displayed higher fluorescencethan C74A (10.6 versus 6.4 V PMT signal, respectively).As shown below, the C74A mutant displays the samemaximal function as WT-GAT1 when expressed in oo-cytes; therefore, the reduced labeling of C74A is proba-bly not caused by reduced expression levels. It is mostlikely that elimination of the cysteine at position 74 de-creases the labeling by the cysteine-specific reagentTMRM. We conclude that Cys74 is labeled by TMRM inWT-GAT1, in addition to at least one other site that is la-beled in both WT-GAT1 and the C74A mutant.
TMRM Labeled WT-GAT1 and C74A-GAT1 Have Very Similar Electrophysiological Properties
Fig. 2 showed that reaction with TMRM had little effecton GABA uptake by GAT1. We also found only small re-ductions in GABA-induced currents in electrophysio-
logical studies. In measurements of transport-associ-ated currents (200
m
M GABA,
2
60 mV, measured atthe end of a 40-s application), exposure to TMRM de-creased currents by 17
6
18% for WT-GAT1 and by 17
6
5% for C74A-GAT1 (mean
6
SEM,
n
5
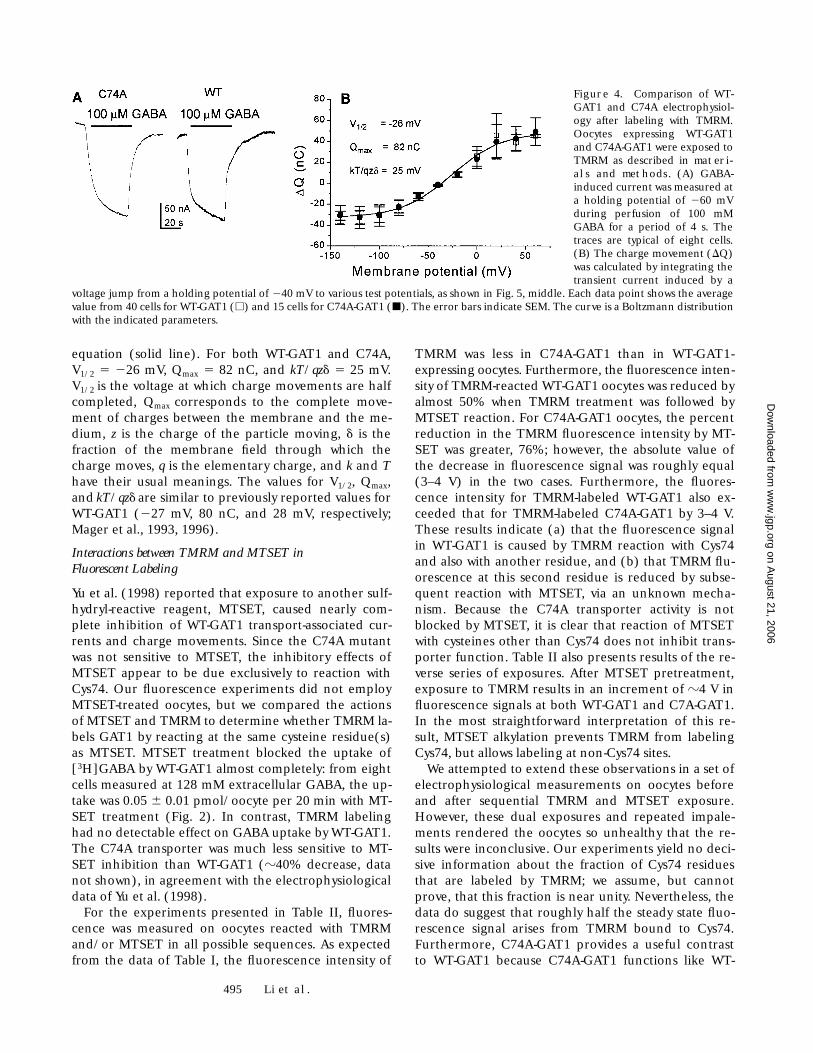
7 and 2, re-spectively). Fig. 4 presents additional data on electro-physiological properties of TMRM-labeled WT-GAT1and C74A-GAT1. Fig. 4 A shows that the time courseand amplitude of GABA-induced current are quite sim-ilar. Average WT-GAT1 and C74A GABA-induced cur-rents (100
m
M,
2
60 mV, 40-s application) in the exper-iments of Fig. 4 A were 120
6
27 and 140
6
42 nA, re-spectively (mean
6
SEM,
n
5
8).We also compared charge movements during voltage-
jump relaxations in the absence of GABA for unin-jected oocytes, WT-GAT1-injected oocytes, and C74A-injected oocytes. After each jump, the oocytes express-ing WT-GAT1 and C74A display transient currents,which relax to new steady state currents over a timecourse of hundreds of milliseconds. The transient cur-rents have previously been analyzed in detail (Mager etal., 1993, 1996; Hilgemann and Lu, 1999; Lu and Hilge-mann, 1999a,b). Examples of the traces will be shownin Fig. 5 (below). The time integral of the transient cur-rent is interpreted as the reversible binding of Na
1
toGAT1 in the absence of GABA (Mager et al., 1993,1996). This integral is plotted against membrane po-tential in Fig. 4 B, and the data are fit to the Boltzmann
Figure 2. [3H]GABA uptake assayed in oocytes expressing WT-GAT17. The GABA uptake activity was measured in uninjected(s), GAT-1 mRNA-injected (n), GAT-1 mRNA-injected andTMRM-labeled (m), and GAT-1 mRNA-injected and MTSET-treated (d) oocytes. Each data point is the mean value of measure-ments from three to four cells, and the error bars indicate SEM.The curves are the nonlinear fits to hyperbolic dose–response rela-tions (Michaelis-Menten equation).
Figure 3. Confocal microscopy of Xenopus oocytes labeled withtetramethylrhodamine as described in materials and methods.(Left) Injected with WT-GAT1, (right) uninjected. The oocytes are0.9 mm in diameter. The more intense fluorescence is at the ani-mal pole.
T A B L E I
Fluorescence Intensity of Oocyte Membrane
Sample Uninjected C74A-injected WT-injected
Fluorescence intensity, V 2.1
6
0.1 6.4
6
0.6 10.5
6
0.5
Fluorescence intensity was measured as the output from the photomulti-plier tube at a working voltage of 700 V, after 100
3
amplification. All dataare mean
6
SEM (
n
5 7).
on August 21, 2006
ww
w.jgp.org
Dow
nloaded from
495 Li et al.
equation (solid line). For both WT-GAT1 and C74A,V1/2 5 226 mV, Qmax 5 82 nC, and kT/qzd 5 25 mV.V1/2 is the voltage at which charge movements are halfcompleted, Qmax corresponds to the complete move-ment of charges between the membrane and the me-dium, z is the charge of the particle moving, d is thefraction of the membrane field through which thecharge moves, q is the elementary charge, and k and Thave their usual meanings. The values for V1/2, Qmax,and kT/qzd are similar to previously reported values forWT-GAT1 (227 mV, 80 nC, and 28 mV, respectively;Mager et al., 1993, 1996).
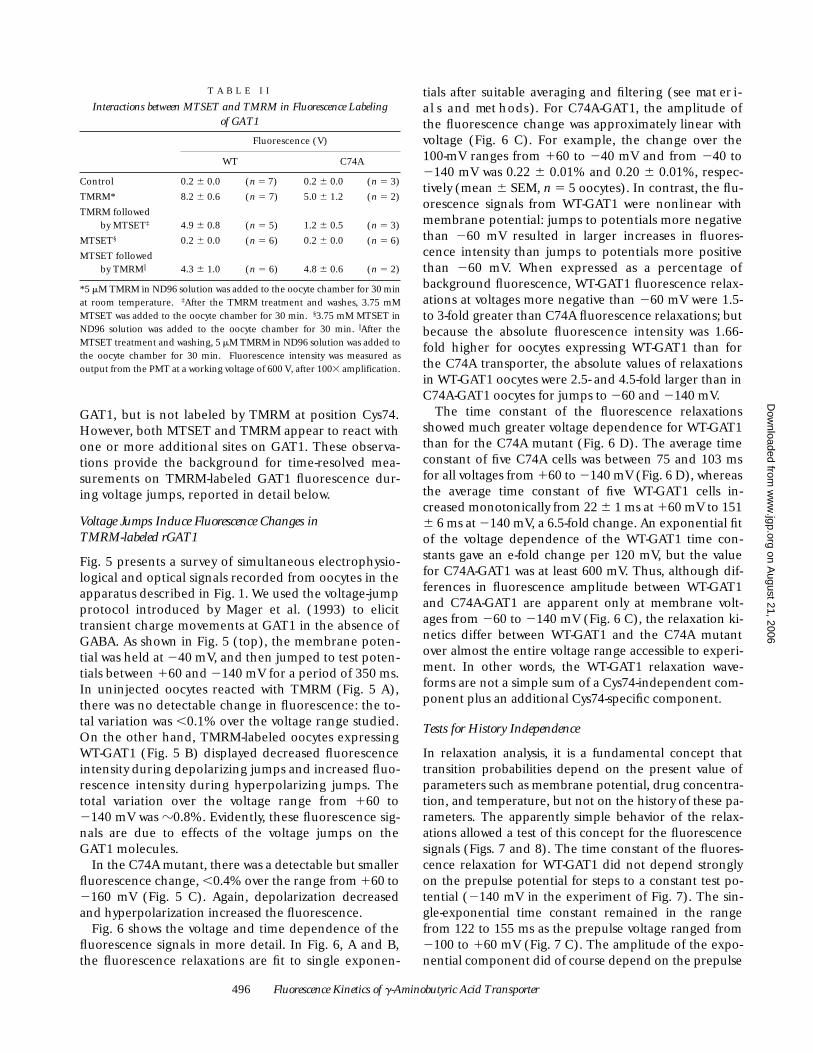
Interactions between TMRM and MTSET inFluorescent Labeling
Yu et al. (1998) reported that exposure to another sulf-hydryl-reactive reagent, MTSET, caused nearly com-plete inhibition of WT-GAT1 transport-associated cur-rents and charge movements. Since the C74A mutantwas not sensitive to MTSET, the inhibitory effects ofMTSET appear to be due exclusively to reaction withCys74. Our fluorescence experiments did not employMTSET-treated oocytes, but we compared the actionsof MTSET and TMRM to determine whether TMRM la-bels GAT1 by reacting at the same cysteine residue(s)as MTSET. MTSET treatment blocked the uptake of[3H]GABA by WT-GAT1 almost completely: from eightcells measured at 128 mM extracellular GABA, the up-take was 0.05 6 0.01 pmol/oocyte per 20 min with MT-SET treatment (Fig. 2). In contrast, TMRM labelinghad no detectable effect on GABA uptake by WT-GAT1.The C74A transporter was much less sensitive to MT-SET inhibition than WT-GAT1 (z40% decrease, datanot shown), in agreement with the electrophysiologicaldata of Yu et al. (1998).
For the experiments presented in Table II, fluores-cence was measured on oocytes reacted with TMRMand/or MTSET in all possible sequences. As expectedfrom the data of Table I, the fluorescence intensity of
TMRM was less in C74A-GAT1 than in WT-GAT1-expressing oocytes. Furthermore, the fluorescence inten-sity of TMRM-reacted WT-GAT1 oocytes was reduced byalmost 50% when TMRM treatment was followed byMTSET reaction. For C74A-GAT1 oocytes, the percentreduction in the TMRM fluorescence intensity by MT-SET was greater, 76%; however, the absolute value ofthe decrease in fluorescence signal was roughly equal(3–4 V) in the two cases. Furthermore, the fluores-cence intensity for TMRM-labeled WT-GAT1 also ex-ceeded that for TMRM-labeled C74A-GAT1 by 3–4 V.These results indicate (a) that the fluorescence signalin WT-GAT1 is caused by TMRM reaction with Cys74and also with another residue, and (b) that TMRM flu-orescence at this second residue is reduced by subse-quent reaction with MTSET, via an unknown mecha-nism. Because the C74A transporter activity is notblocked by MTSET, it is clear that reaction of MTSETwith cysteines other than Cys74 does not inhibit trans-porter function. Table II also presents results of the re-verse series of exposures. After MTSET pretreatment,exposure to TMRM results in an increment of z4 V influorescence signals at both WT-GAT1 and C7A-GAT1.In the most straightforward interpretation of this re-sult, MTSET alkylation prevents TMRM from labelingCys74, but allows labeling at non-Cys74 sites.
We attempted to extend these observations in a set ofelectrophysiological measurements on oocytes beforeand after sequential TMRM and MTSET exposure.However, these dual exposures and repeated impale-ments rendered the oocytes so unhealthy that the re-sults were inconclusive. Our experiments yield no deci-sive information about the fraction of Cys74 residuesthat are labeled by TMRM; we assume, but cannotprove, that this fraction is near unity. Nevertheless, thedata do suggest that roughly half the steady state fluo-rescence signal arises from TMRM bound to Cys74.Furthermore, C74A-GAT1 provides a useful contrastto WT-GAT1 because C74A-GAT1 functions like WT-
Figure 4. Comparison of WT-GAT1 and C74A electrophysiol-ogy after labeling with TMRM.Oocytes expressing WT-GAT1and C74A-GAT1 were exposed toTMRM as described in materi-als and methods. (A) GABA-induced current was measured ata holding potential of 260 mVduring perfusion of 100 mMGABA for a period of 4 s. Thetraces are typical of eight cells.(B) The charge movement (DQ)was calculated by integrating thetransient current induced by a
voltage jump from a holding potential of 240 mV to various test potentials, as shown in Fig. 5, middle. Each data point shows the averagevalue from 40 cells for WT-GAT1 (h) and 15 cells for C74A-GAT1 (j). The error bars indicate SEM. The curve is a Boltzmann distributionwith the indicated parameters.
on August 21, 2006
ww
w.jgp.org
Dow
nloaded from
496 Fluorescence Kinetics of g-Aminobutyric Acid Transporter
GAT1, but is not labeled by TMRM at position Cys74.However, both MTSET and TMRM appear to react withone or more additional sites on GAT1. These observa-tions provide the background for time-resolved mea-surements on TMRM-labeled GAT1 fluorescence dur-ing voltage jumps, reported in detail below.
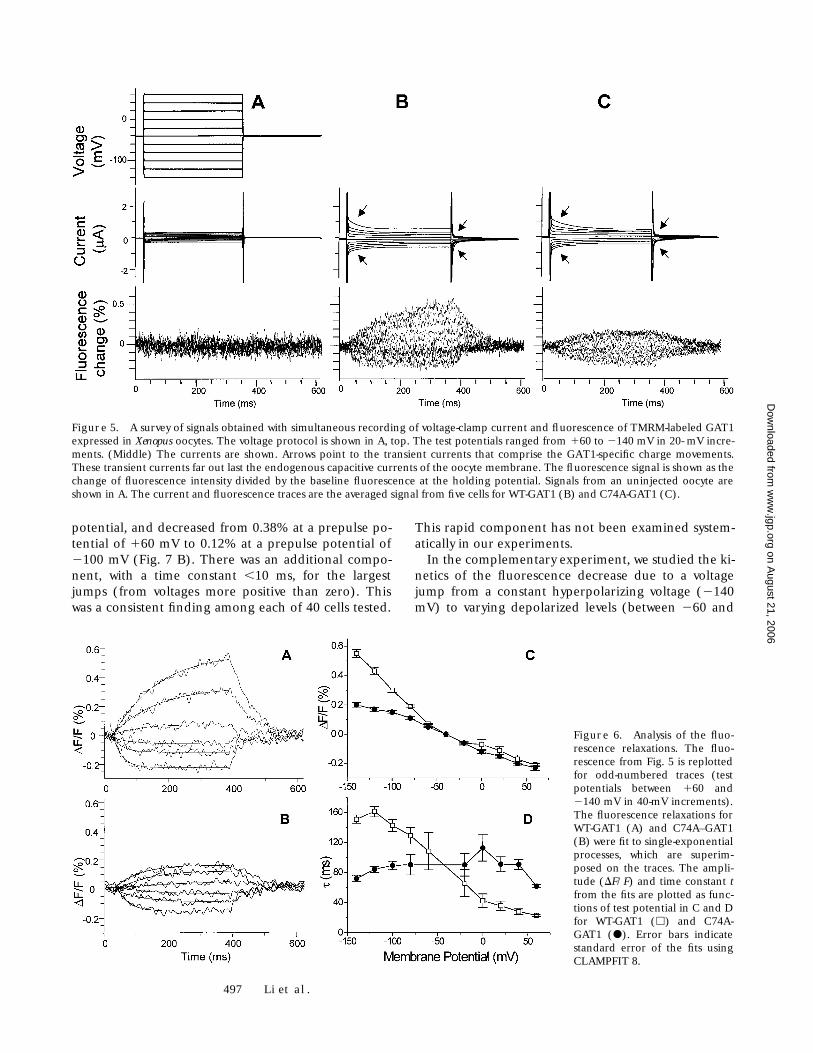
Voltage Jumps Induce Fluorescence Changes inTMRM-labeled rGAT1
Fig. 5 presents a survey of simultaneous electrophysio-logical and optical signals recorded from oocytes in theapparatus described in Fig. 1. We used the voltage-jumpprotocol introduced by Mager et al. (1993) to elicittransient charge movements at GAT1 in the absence ofGABA. As shown in Fig. 5 (top), the membrane poten-tial was held at 240 mV, and then jumped to test poten-tials between 160 and 2140 mV for a period of 350 ms.In uninjected oocytes reacted with TMRM (Fig. 5 A),there was no detectable change in fluorescence: the to-tal variation was ,0.1% over the voltage range studied.On the other hand, TMRM-labeled oocytes expressingWT-GAT1 (Fig. 5 B) displayed decreased fluorescenceintensity during depolarizing jumps and increased fluo-rescence intensity during hyperpolarizing jumps. Thetotal variation over the voltage range from 160 to2140 mV was z0.8%. Evidently, these fluorescence sig-nals are due to effects of the voltage jumps on theGAT1 molecules.
In the C74A mutant, there was a detectable but smallerfluorescence change, ,0.4% over the range from 160 to2160 mV (Fig. 5 C). Again, depolarization decreasedand hyperpolarization increased the fluorescence.
Fig. 6 shows the voltage and time dependence of thefluorescence signals in more detail. In Fig. 6, A and B,the fluorescence relaxations are fit to single exponen-
tials after suitable averaging and filtering (see materi-als and methods). For C74A-GAT1, the amplitude ofthe fluorescence change was approximately linear withvoltage (Fig. 6 C). For example, the change over the100-mV ranges from 160 to 240 mV and from 240 to2140 mV was 0.22 6 0.01% and 0.20 6 0.01%, respec-tively (mean 6 SEM, n 5 5 oocytes). In contrast, the flu-orescence signals from WT-GAT1 were nonlinear withmembrane potential: jumps to potentials more negativethan 260 mV resulted in larger increases in fluores-cence intensity than jumps to potentials more positivethan 260 mV. When expressed as a percentage ofbackground fluorescence, WT-GAT1 fluorescence relax-ations at voltages more negative than 260 mV were 1.5-to 3-fold greater than C74A fluorescence relaxations; butbecause the absolute fluorescence intensity was 1.66-fold higher for oocytes expressing WT-GAT1 than forthe C74A transporter, the absolute values of relaxationsin WT-GAT1 oocytes were 2.5- and 4.5-fold larger than inC74A-GAT1 oocytes for jumps to 260 and 2140 mV.
The time constant of the fluorescence relaxationsshowed much greater voltage dependence for WT-GAT1than for the C74A mutant (Fig. 6 D). The average timeconstant of five C74A cells was between 75 and 103 msfor all voltages from 160 to 2140 mV (Fig. 6 D), whereasthe average time constant of five WT-GAT1 cells in-creased monotonically from 22 6 1 ms at 160 mV to 1516 6 ms at 2140 mV, a 6.5-fold change. An exponential fitof the voltage dependence of the WT-GAT1 time con-stants gave an e-fold change per 120 mV, but the valuefor C74A-GAT1 was at least 600 mV. Thus, although dif-ferences in fluorescence amplitude between WT-GAT1and C74A-GAT1 are apparent only at membrane volt-ages from 260 to 2140 mV (Fig. 6 C), the relaxation ki-netics differ between WT-GAT1 and the C74A mutantover almost the entire voltage range accessible to experi-ment. In other words, the WT-GAT1 relaxation wave-forms are not a simple sum of a Cys74-independent com-ponent plus an additional Cys74-specific component.
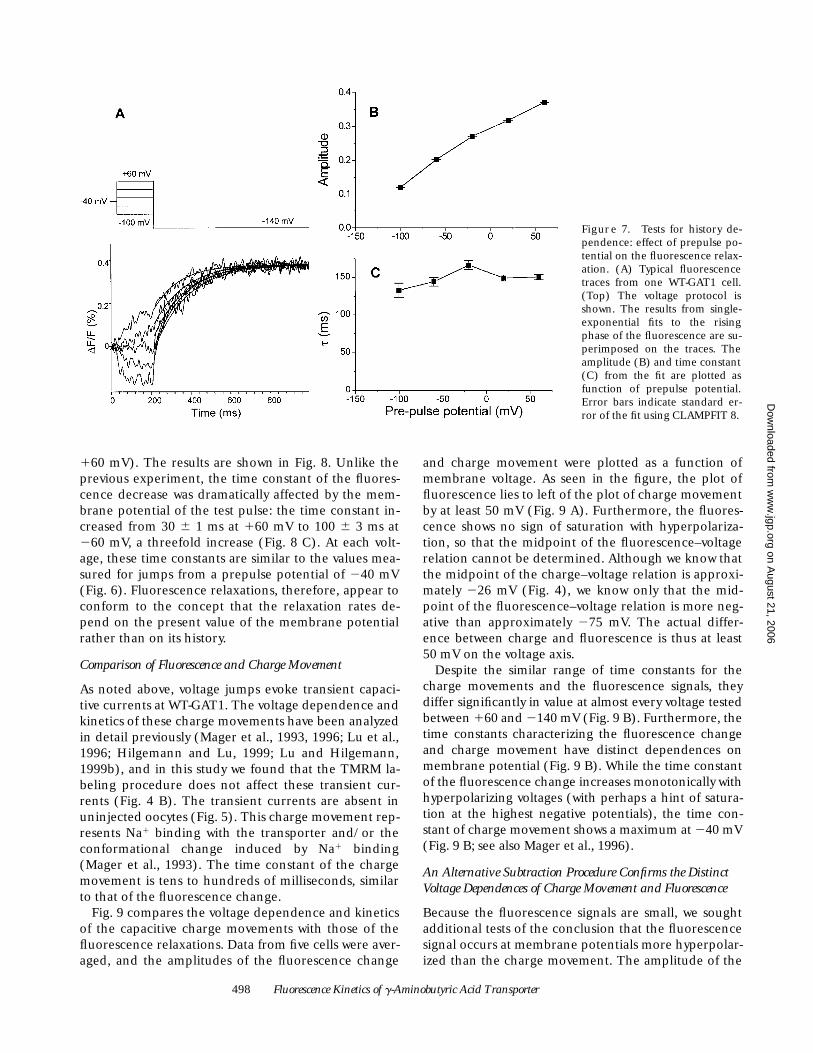
Tests for History Independence
In relaxation analysis, it is a fundamental concept thattransition probabilities depend on the present value ofparameters such as membrane potential, drug concentra-tion, and temperature, but not on the history of these pa-rameters. The apparently simple behavior of the relax-ations allowed a test of this concept for the fluorescencesignals (Figs. 7 and 8). The time constant of the fluores-cence relaxation for WT-GAT1 did not depend stronglyon the prepulse potential for steps to a constant test po-tential (2140 mV in the experiment of Fig. 7). The sin-gle-exponential time constant remained in the rangefrom 122 to 155 ms as the prepulse voltage ranged from2100 to 160 mV (Fig. 7 C). The amplitude of the expo-nential component did of course depend on the prepulse
T A B L E I I
Interactions between MTSET and TMRM in Fluorescence Labeling of GAT1
Fluorescence (V)
WT C74A
Control 0.2 6 0.0 (n 5 7) 0.2 6 0.0 (n 5 3)
TMRM* 8.2 6 0.6 (n 5 7) 5.0 6 1.2 (n 5 2)
TMRM followed by MTSET‡ 4.9 6 0.8 (n 5 5) 1.2 6 0.5 (n 5 3)
MTSET§ 0.2 6 0.0 (n 5 6) 0.2 6 0.0 (n 5 6)
MTSET followed by TMRMi 4.3 6 1.0 (n 5 6) 4.8 6 0.6 (n 5 2)
*5 mM TMRM in ND96 solution was added to the oocyte chamber for 30 minat room temperature. ‡After the TMRM treatment and washes, 3.75 mMMTSET was added to the oocyte chamber for 30 min. §3.75 mM MTSET inND96 solution was added to the oocyte chamber for 30 min. iAfter theMTSET treatment and washing, 5 mM TMRM in ND96 solution was added tothe oocyte chamber for 30 min. Fluorescence intensity was measured asoutput from the PMT at a working voltage of 600 V, after 1003 amplification.
on August 21, 2006
ww
w.jgp.org
Dow
nloaded from
497 Li et al.
potential, and decreased from 0.38% at a prepulse po-tential of 160 mV to 0.12% at a prepulse potential of2100 mV (Fig. 7 B). There was an additional compo-nent, with a time constant ,10 ms, for the largestjumps (from voltages more positive than zero). Thiswas a consistent finding among each of 40 cells tested.
This rapid component has not been examined system-atically in our experiments.
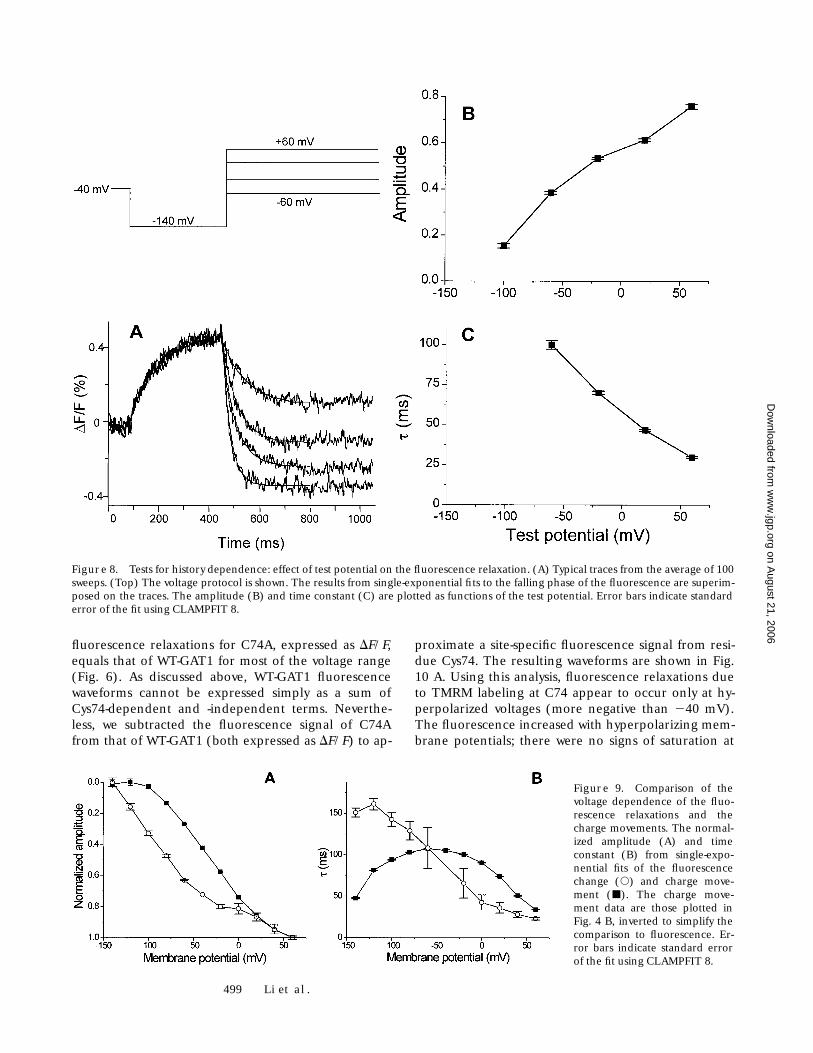
In the complementary experiment, we studied the ki-netics of the fluorescence decrease due to a voltagejump from a constant hyperpolarizing voltage (2140mV) to varying depolarized levels (between 260 and
Figure 5. A survey of signals obtained with simultaneous recording of voltage-clamp current and fluorescence of TMRM-labeled GAT1expressed in Xenopus oocytes. The voltage protocol is shown in A, top. The test potentials ranged from 160 to 2140 mV in 20- mV incre-ments. (Middle) The currents are shown. Arrows point to the transient currents that comprise the GAT1-specific charge movements.These transient currents far out last the endogenous capacitive currents of the oocyte membrane. The fluorescence signal is shown as thechange of fluorescence intensity divided by the baseline fluorescence at the holding potential. Signals from an uninjected oocyte areshown in A. The current and fluorescence traces are the averaged signal from five cells for WT-GAT1 (B) and C74A-GAT1 (C).
Figure 6. Analysis of the fluo-rescence relaxations. The fluo-rescence from Fig. 5 is replottedfor odd-numbered traces (testpotentials between 160 and2140 mV in 40-mV increments).The fluorescence relaxations forWT-GAT1 (A) and C74A–GAT1(B) were fit to single-exponentialprocesses, which are superim-posed on the traces. The ampli-tude (DF/F) and time constant tfrom the fits are plotted as func-tions of test potential in C and Dfor WT-GAT1 (h) and C74A-GAT1 (d). Error bars indicatestandard error of the fits usingCLAMPFIT 8.
on August 21, 2006
ww
w.jgp.org
Dow
nloaded from
498 Fluorescence Kinetics of g-Aminobutyric Acid Transporter
160 mV). The results are shown in Fig. 8. Unlike theprevious experiment, the time constant of the fluores-cence decrease was dramatically affected by the mem-brane potential of the test pulse: the time constant in-creased from 30 6 1 ms at 160 mV to 100 6 3 ms at260 mV, a threefold increase (Fig. 8 C). At each volt-age, these time constants are similar to the values mea-sured for jumps from a prepulse potential of 240 mV(Fig. 6). Fluorescence relaxations, therefore, appear toconform to the concept that the relaxation rates de-pend on the present value of the membrane potentialrather than on its history.
Comparison of Fluorescence and Charge Movement
As noted above, voltage jumps evoke transient capaci-tive currents at WT-GAT1. The voltage dependence andkinetics of these charge movements have been analyzedin detail previously (Mager et al., 1993, 1996; Lu et al.,1996; Hilgemann and Lu, 1999; Lu and Hilgemann,1999b), and in this study we found that the TMRM la-beling procedure does not affect these transient cur-rents (Fig. 4 B). The transient currents are absent inuninjected oocytes (Fig. 5). This charge movement rep-resents Na1 binding with the transporter and/or theconformational change induced by Na1 binding(Mager et al., 1993). The time constant of the chargemovement is tens to hundreds of milliseconds, similarto that of the fluorescence change.
Fig. 9 compares the voltage dependence and kineticsof the capacitive charge movements with those of thefluorescence relaxations. Data from five cells were aver-aged, and the amplitudes of the fluorescence change
and charge movement were plotted as a function ofmembrane voltage. As seen in the figure, the plot offluorescence lies to left of the plot of charge movementby at least 50 mV (Fig. 9 A). Furthermore, the fluores-cence shows no sign of saturation with hyperpolariza-tion, so that the midpoint of the fluorescence–voltagerelation cannot be determined. Although we know thatthe midpoint of the charge–voltage relation is approxi-mately 226 mV (Fig. 4), we know only that the mid-point of the fluorescence–voltage relation is more neg-ative than approximately 275 mV. The actual differ-ence between charge and fluorescence is thus at least50 mV on the voltage axis.
Despite the similar range of time constants for thecharge movements and the fluorescence signals, theydiffer significantly in value at almost every voltage testedbetween 160 and 2140 mV (Fig. 9 B). Furthermore, thetime constants characterizing the fluorescence changeand charge movement have distinct dependences onmembrane potential (Fig. 9 B). While the time constantof the fluorescence change increases monotonically withhyperpolarizing voltages (with perhaps a hint of satura-tion at the highest negative potentials), the time con-stant of charge movement shows a maximum at 240 mV(Fig. 9 B; see also Mager et al., 1996).
An Alternative Subtraction Procedure Confirms the Distinct Voltage Dependences of Charge Movement and Fluorescence
Because the fluorescence signals are small, we soughtadditional tests of the conclusion that the fluorescencesignal occurs at membrane potentials more hyperpolar-ized than the charge movement. The amplitude of the
Figure 7. Tests for history de-pendence: effect of prepulse po-tential on the fluorescence relax-ation. (A) Typical fluorescencetraces from one WT-GAT1 cell.(Top) The voltage protocol isshown. The results from single-exponential fits to the risingphase of the fluorescence are su-perimposed on the traces. Theamplitude (B) and time constant(C) from the fit are plotted asfunction of prepulse potential.Error bars indicate standard er-ror of the fit using CLAMPFIT 8.
on August 21, 2006
ww
w.jgp.org
Dow
nloaded from
499 Li et al.
fluorescence relaxations for C74A, expressed as DF/F,equals that of WT-GAT1 for most of the voltage range(Fig. 6). As discussed above, WT-GAT1 fluorescencewaveforms cannot be expressed simply as a sum ofCys74-dependent and -independent terms. Neverthe-less, we subtracted the fluorescence signal of C74Afrom that of WT-GAT1 (both expressed as DF/F) to ap-
proximate a site-specific fluorescence signal from resi-due Cys74. The resulting waveforms are shown in Fig.10 A. Using this analysis, fluorescence relaxations dueto TMRM labeling at C74 appear to occur only at hy-perpolarized voltages (more negative than 240 mV).The fluorescence increased with hyperpolarizing mem-brane potentials; there were no signs of saturation at
Figure 8. Tests for history dependence: effect of test potential on the fluorescence relaxation. (A) Typical traces from the average of 100sweeps. (Top) The voltage protocol is shown. The results from single-exponential fits to the falling phase of the fluorescence are superim-posed on the traces. The amplitude (B) and time constant (C) are plotted as functions of the test potential. Error bars indicate standarderror of the fit using CLAMPFIT 8.
Figure 9. Comparison of thevoltage dependence of the fluo-rescence relaxations and thecharge movements. The normal-ized amplitude (A) and timeconstant (B) from single-expo-nential fits of the fluorescencechange (s) and charge move-ment (j). The charge move-ment data are those plotted inFig. 4 B, inverted to simplify thecomparison to fluorescence. Er-ror bars indicate standard errorof the fit using CLAMPFIT 8.
on August 21, 2006
ww
w.jgp.org
Dow
nloaded from
500 Fluorescence Kinetics of g-Aminobutyric Acid Transporter
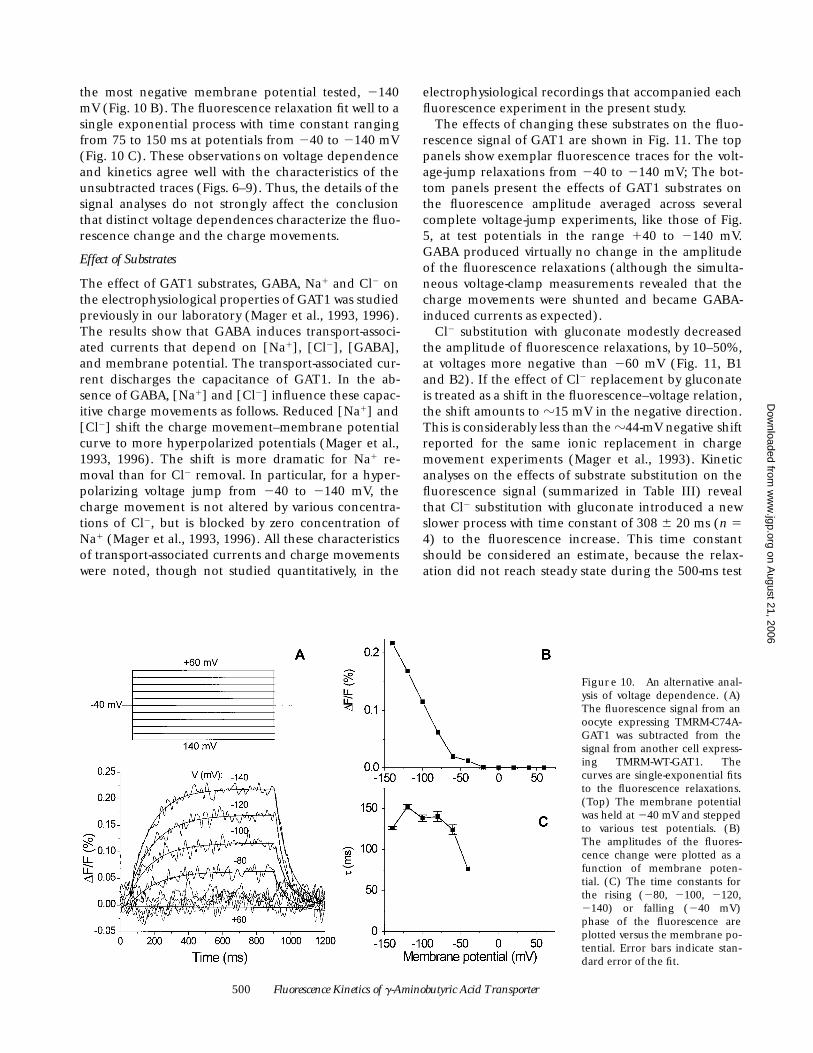
the most negative membrane potential tested, 2140mV (Fig. 10 B). The fluorescence relaxation fit well to asingle exponential process with time constant rangingfrom 75 to 150 ms at potentials from 240 to 2140 mV(Fig. 10 C). These observations on voltage dependenceand kinetics agree well with the characteristics of theunsubtracted traces (Figs. 6–9). Thus, the details of thesignal analyses do not strongly affect the conclusionthat distinct voltage dependences characterize the fluo-rescence change and the charge movements.
Effect of Substrates
The effect of GAT1 substrates, GABA, Na1 and Cl2 onthe electrophysiological properties of GAT1 was studiedpreviously in our laboratory (Mager et al., 1993, 1996).The results show that GABA induces transport-associ-ated currents that depend on [Na1], [Cl2], [GABA],and membrane potential. The transport-associated cur-rent discharges the capacitance of GAT1. In the ab-sence of GABA, [Na1] and [Cl2] influence these capac-itive charge movements as follows. Reduced [Na1] and[Cl2] shift the charge movement–membrane potentialcurve to more hyperpolarized potentials (Mager et al.,1993, 1996). The shift is more dramatic for Na1 re-moval than for Cl2 removal. In particular, for a hyper-polarizing voltage jump from 240 to 2140 mV, thecharge movement is not altered by various concentra-tions of Cl2, but is blocked by zero concentration ofNa1 (Mager et al., 1993, 1996). All these characteristicsof transport-associated currents and charge movementswere noted, though not studied quantitatively, in the
electrophysiological recordings that accompanied eachfluorescence experiment in the present study.
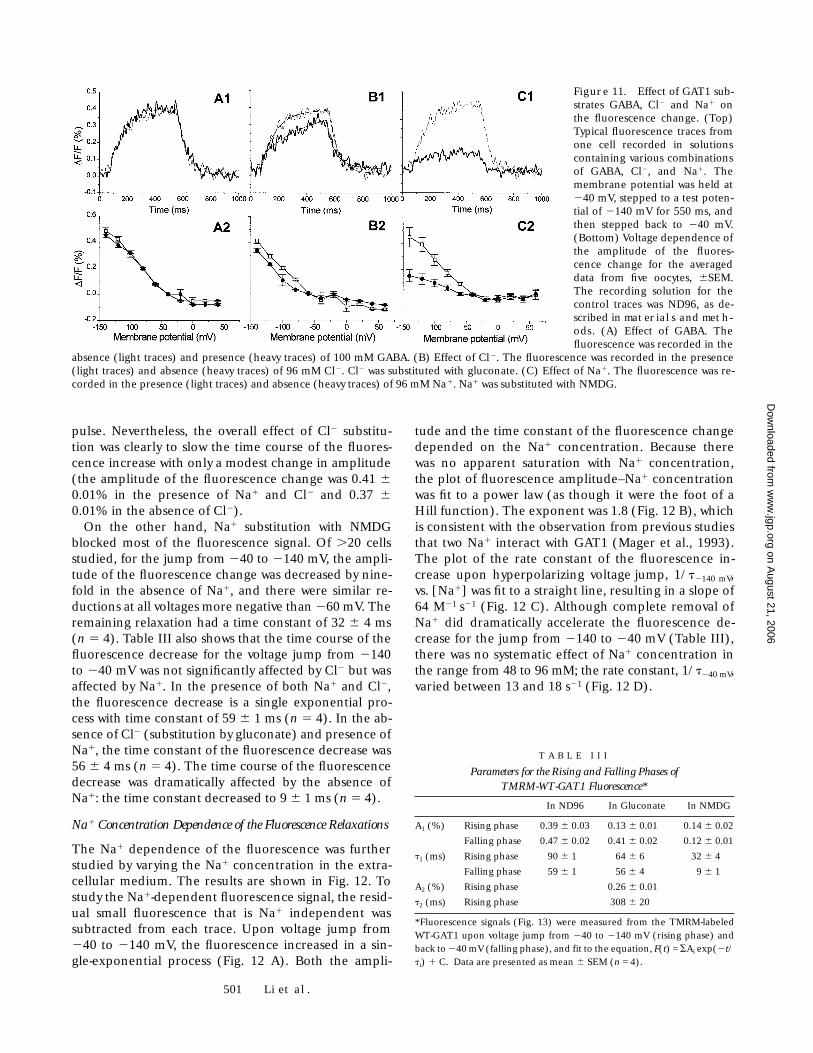
The effects of changing these substrates on the fluo-rescence signal of GAT1 are shown in Fig. 11. The toppanels show exemplar fluorescence traces for the volt-age-jump relaxations from 240 to 2140 mV; The bot-tom panels present the effects of GAT1 substrates onthe fluorescence amplitude averaged across severalcomplete voltage-jump experiments, like those of Fig.5, at test potentials in the range 140 to 2140 mV.GABA produced virtually no change in the amplitudeof the fluorescence relaxations (although the simulta-neous voltage-clamp measurements revealed that thecharge movements were shunted and became GABA-induced currents as expected).
Cl2 substitution with gluconate modestly decreasedthe amplitude of fluorescence relaxations, by 10–50%,at voltages more negative than 260 mV (Fig. 11, B1and B2). If the effect of Cl2 replacement by gluconateis treated as a shift in the fluorescence–voltage relation,the shift amounts to z15 mV in the negative direction.This is considerably less than the z44-mV negative shiftreported for the same ionic replacement in chargemovement experiments (Mager et al., 1993). Kineticanalyses on the effects of substrate substitution on thefluorescence signal (summarized in Table III) revealthat Cl2 substitution with gluconate introduced a newslower process with time constant of 308 6 20 ms (n 54) to the fluorescence increase. This time constantshould be considered an estimate, because the relax-ation did not reach steady state during the 500-ms test
Figure 10. An alternative anal-ysis of voltage dependence. (A)The fluorescence signal from anoocyte expressing TMRM-C74A-GAT1 was subtracted from thesignal from another cell express-ing TMRM-WT-GAT1. Thecurves are single-exponential fitsto the fluorescence relaxations.(Top) The membrane potentialwas held at 240 mV and steppedto various test potentials. (B)The amplitudes of the fluores-cence change were plotted as afunction of membrane poten-tial. (C) The time constants forthe rising (280, 2100, 2120,2140) or falling (240 mV)phase of the fluorescence areplotted versus the membrane po-tential. Error bars indicate stan-dard error of the fit.
on August 21, 2006
ww
w.jgp.org
Dow
nloaded from
501 Li et al.
pulse. Nevertheless, the overall effect of Cl2 substitu-tion was clearly to slow the time course of the fluores-cence increase with only a modest change in amplitude(the amplitude of the fluorescence change was 0.41 60.01% in the presence of Na1 and Cl2 and 0.37 60.01% in the absence of Cl2).
On the other hand, Na1 substitution with NMDGblocked most of the fluorescence signal. Of .20 cellsstudied, for the jump from 240 to 2140 mV, the ampli-tude of the fluorescence change was decreased by nine-fold in the absence of Na1, and there were similar re-ductions at all voltages more negative than 260 mV. Theremaining relaxation had a time constant of 32 6 4 ms(n 5 4). Table III also shows that the time course of thefluorescence decrease for the voltage jump from 2140to 240 mV was not significantly affected by Cl2 but wasaffected by Na1. In the presence of both Na1 and Cl2,the fluorescence decrease is a single exponential pro-cess with time constant of 59 6 1 ms (n 5 4). In the ab-sence of Cl2 (substitution by gluconate) and presence ofNa1, the time constant of the fluorescence decrease was56 6 4 ms (n 5 4). The time course of the fluorescencedecrease was dramatically affected by the absence ofNa1: the time constant decreased to 9 6 1 ms (n 5 4).
Na1 Concentration Dependence of the Fluorescence Relaxations
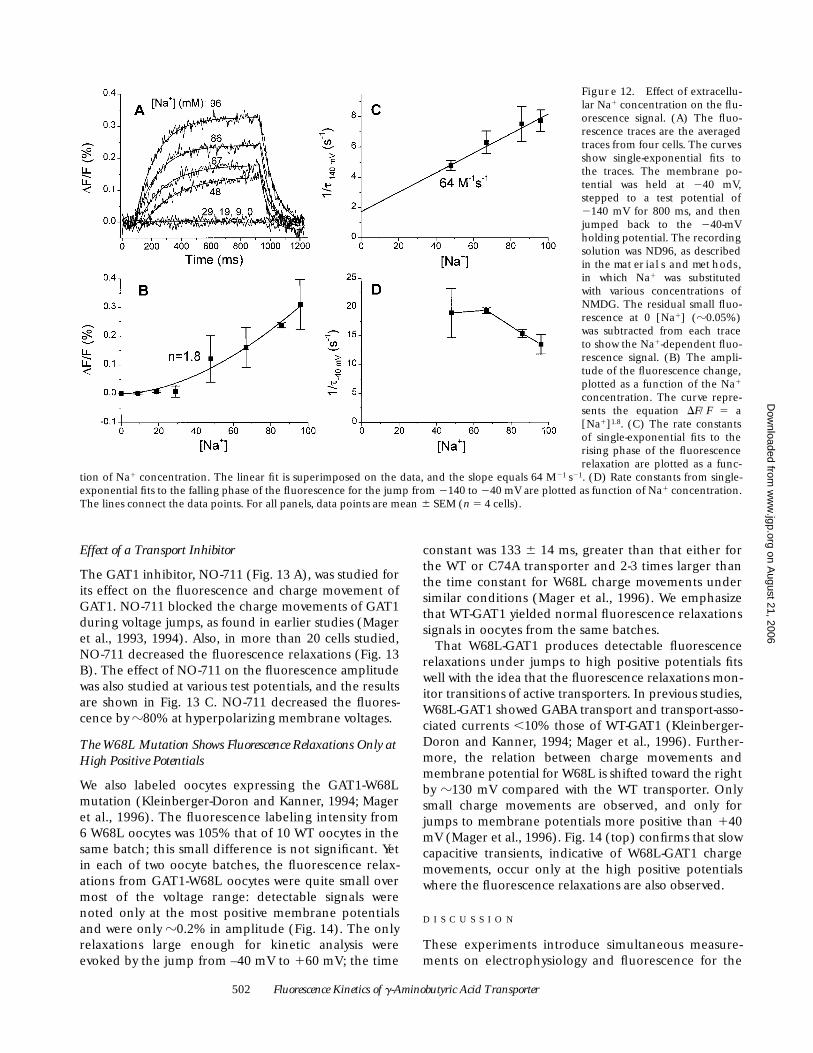
The Na1 dependence of the fluorescence was furtherstudied by varying the Na1 concentration in the extra-cellular medium. The results are shown in Fig. 12. Tostudy the Na1-dependent fluorescence signal, the resid-ual small fluorescence that is Na1 independent wassubtracted from each trace. Upon voltage jump from240 to 2140 mV, the fluorescence increased in a sin-gle-exponential process (Fig. 12 A). Both the ampli-
tude and the time constant of the fluorescence changedepended on the Na1 concentration. Because therewas no apparent saturation with Na1 concentration,the plot of fluorescence amplitude–Na1 concentrationwas fit to a power law (as though it were the foot of aHill function). The exponent was 1.8 (Fig. 12 B), whichis consistent with the observation from previous studiesthat two Na1 interact with GAT1 (Mager et al., 1993).The plot of the rate constant of the fluorescence in-crease upon hyperpolarizing voltage jump, 1/t2140 mV,vs. [Na1] was fit to a straight line, resulting in a slope of64 M21 s21 (Fig. 12 C). Although complete removal ofNa1 did dramatically accelerate the fluorescence de-crease for the jump from 2140 to 240 mV (Table III),there was no systematic effect of Na1 concentration inthe range from 48 to 96 mM; the rate constant, 1/t240 mV,varied between 13 and 18 s21 (Fig. 12 D).
Figure 11. Effect of GAT1 sub-strates GABA, Cl2 and Na1 onthe fluorescence change. (Top)Typical fluorescence traces fromone cell recorded in solutionscontaining various combinationsof GABA, Cl2, and Na1. Themembrane potential was held at240 mV, stepped to a test poten-tial of 2140 mV for 550 ms, andthen stepped back to 240 mV.(Bottom) Voltage dependence ofthe amplitude of the fluores-cence change for the averageddata from five oocytes, 6SEM.The recording solution for thecontrol traces was ND96, as de-scribed in materials and meth-ods. (A) Effect of GABA. Thefluorescence was recorded in the
absence (light traces) and presence (heavy traces) of 100 mM GABA. (B) Effect of Cl2. The fluorescence was recorded in the presence(light traces) and absence (heavy traces) of 96 mM Cl2. Cl2 was substituted with gluconate. (C) Effect of Na1. The fluorescence was re-corded in the presence (light traces) and absence (heavy traces) of 96 mM Na1. Na1 was substituted with NMDG.
T A B L E I I I
Parameters for the Rising and Falling Phases of TMRM-WT-GAT1 Fluorescence*
In ND96 In Gluconate In NMDG
A1 (%) Rising phase 0.39 6 0.03 0.13 6 0.01 0.14 6 0.02
Falling phase 0.47 6 0.02 0.41 6 0.02 0.12 6 0.01
t1 (ms) Rising phase 90 6 1 64 6 6 32 6 4
Falling phase 59 6 1 56 6 4 9 6 1
A2 (%) Rising phase 0.26 6 0.01
t2 (ms) Rising phase 308 6 20
*Fluorescence signals (Fig. 13) were measured from the TMRM-labeledWT-GAT1 upon voltage jump from 240 to 2140 mV (rising phase) andback to 240 mV (falling phase), and fit to the equation, F(t) = SAi exp(2t/ti) 1 C. Data are presented as mean 6 SEM (n = 4).
on August 21, 2006
ww
w.jgp.org
Dow
nloaded from
502 Fluorescence Kinetics of g-Aminobutyric Acid Transporter
Effect of a Transport Inhibitor
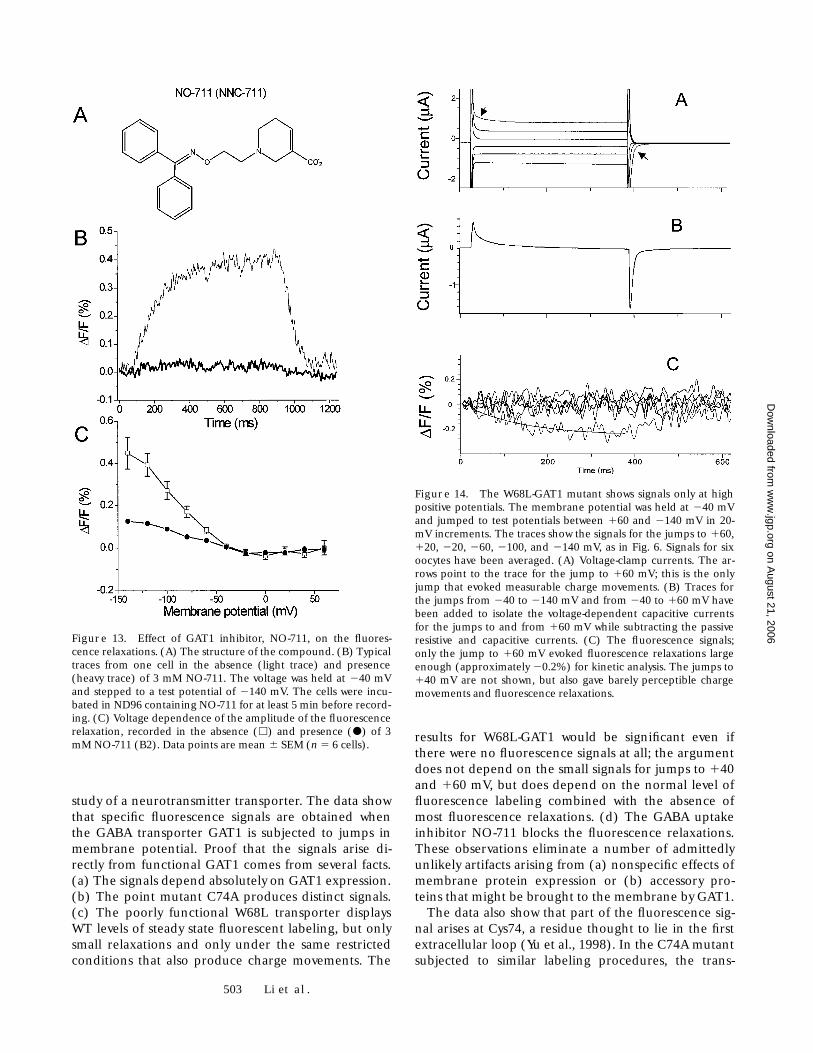
The GAT1 inhibitor, NO-711 (Fig. 13 A), was studied forits effect on the fluorescence and charge movement ofGAT1. NO-711 blocked the charge movements of GAT1during voltage jumps, as found in earlier studies (Mageret al., 1993, 1994). Also, in more than 20 cells studied,NO-711 decreased the fluorescence relaxations (Fig. 13B). The effect of NO-711 on the fluorescence amplitudewas also studied at various test potentials, and the resultsare shown in Fig. 13 C. NO-711 decreased the fluores-cence by z80% at hyperpolarizing membrane voltages.
The W68L Mutation Shows Fluorescence Relaxations Only at High Positive Potentials
We also labeled oocytes expressing the GAT1-W68Lmutation (Kleinberger-Doron and Kanner, 1994; Mageret al., 1996). The fluorescence labeling intensity from6 W68L oocytes was 105% that of 10 WT oocytes in thesame batch; this small difference is not significant. Yetin each of two oocyte batches, the fluorescence relax-ations from GAT1-W68L oocytes were quite small overmost of the voltage range: detectable signals werenoted only at the most positive membrane potentialsand were only z0.2% in amplitude (Fig. 14). The onlyrelaxations large enough for kinetic analysis wereevoked by the jump from –40 mV to 160 mV; the time
constant was 133 6 14 ms, greater than that either forthe WT or C74A transporter and 2-3 times larger thanthe time constant for W68L charge movements undersimilar conditions (Mager et al., 1996). We emphasizethat WT-GAT1 yielded normal fluorescence relaxationssignals in oocytes from the same batches.
That W68L-GAT1 produces detectable fluorescencerelaxations under jumps to high positive potentials fitswell with the idea that the fluorescence relaxations mon-itor transitions of active transporters. In previous studies,W68L-GAT1 showed GABA transport and transport-asso-ciated currents ,10% those of WT-GAT1 (Kleinberger-Doron and Kanner, 1994; Mager et al., 1996). Further-more, the relation between charge movements andmembrane potential for W68L is shifted toward the rightby z130 mV compared with the WT transporter. Onlysmall charge movements are observed, and only forjumps to membrane potentials more positive than 140mV (Mager et al., 1996). Fig. 14 (top) confirms that slowcapacitive transients, indicative of W68L-GAT1 chargemovements, occur only at the high positive potentialswhere the fluorescence relaxations are also observed.
D I S C U S S I O N
These experiments introduce simultaneous measure-ments on electrophysiology and fluorescence for the
Figure 12. Effect of extracellu-lar Na1 concentration on the flu-orescence signal. (A) The fluo-rescence traces are the averagedtraces from four cells. The curvesshow single-exponential fits tothe traces. The membrane po-tential was held at 240 mV,stepped to a test potential of2140 mV for 800 ms, and thenjumped back to the 240-mVholding potential. The recordingsolution was ND96, as describedin the materials and methods,in which Na1 was substitutedwith various concentrations ofNMDG. The residual small fluo-rescence at 0 [Na1] (z0.05%)was subtracted from each traceto show the Na1-dependent fluo-rescence signal. (B) The ampli-tude of the fluorescence change,plotted as a function of the Na1
concentration. The curve repre-sents the equation DF/F 5 a[Na1]1.8. (C) The rate constantsof single-exponential fits to therising phase of the fluorescencerelaxation are plotted as a func-
tion of Na1 concentration. The linear fit is superimposed on the data, and the slope equals 64 M21 s21. (D) Rate constants from single-exponential fits to the falling phase of the fluorescence for the jump from 2140 to 240 mV are plotted as function of Na1 concentration.The lines connect the data points. For all panels, data points are mean 6 SEM (n 5 4 cells).
on August 21, 2006
ww
w.jgp.org
Dow
nloaded from
503 Li et al.
study of a neurotransmitter transporter. The data showthat specific fluorescence signals are obtained whenthe GABA transporter GAT1 is subjected to jumps inmembrane potential. Proof that the signals arise di-rectly from functional GAT1 comes from several facts.(a) The signals depend absolutely on GAT1 expression.(b) The point mutant C74A produces distinct signals.(c) The poorly functional W68L transporter displaysWT levels of steady state fluorescent labeling, but onlysmall relaxations and only under the same restrictedconditions that also produce charge movements. The
results for W68L-GAT1 would be significant even ifthere were no fluorescence signals at all; the argumentdoes not depend on the small signals for jumps to 140and 160 mV, but does depend on the normal level offluorescence labeling combined with the absence ofmost fluorescence relaxations. (d) The GABA uptakeinhibitor NO-711 blocks the fluorescence relaxations.These observations eliminate a number of admittedlyunlikely artifacts arising from (a) nonspecific effects ofmembrane protein expression or (b) accessory pro-teins that might be brought to the membrane by GAT1.
The data also show that part of the fluorescence sig-nal arises at Cys74, a residue thought to lie in the firstextracellular loop (Yu et al., 1998). In the C74A mutantsubjected to similar labeling procedures, the trans-
Figure 13. Effect of GAT1 inhibitor, NO-711, on the fluores-cence relaxations. (A) The structure of the compound. (B) Typicaltraces from one cell in the absence (light trace) and presence(heavy trace) of 3 mM NO-711. The voltage was held at 240 mVand stepped to a test potential of 2140 mV. The cells were incu-bated in ND96 containing NO-711 for at least 5 min before record-ing. (C) Voltage dependence of the amplitude of the fluorescencerelaxation, recorded in the absence (h) and presence (d) of 3mM NO-711 (B2). Data points are mean 6 SEM (n 5 6 cells).
Figure 14. The W68L-GAT1 mutant shows signals only at highpositive potentials. The membrane potential was held at 240 mVand jumped to test potentials between 160 and 2140 mV in 20-mV increments. The traces show the signals for the jumps to 160,120, 220, 260, 2100, and 2140 mV, as in Fig. 6. Signals for sixoocytes have been averaged. (A) Voltage-clamp currents. The ar-rows point to the trace for the jump to 160 mV; this is the onlyjump that evoked measurable charge movements. (B) Traces forthe jumps from 240 to 2140 mV and from 240 to 160 mV havebeen added to isolate the voltage-dependent capacitive currentsfor the jumps to and from 160 mV while subtracting the passiveresistive and capacitive currents. (C) The fluorescence signals;only the jump to 160 mV evoked fluorescence relaxations largeenough (approximately 20.2%) for kinetic analysis. The jumps to140 mV are not shown, but also gave barely perceptible chargemovements and fluorescence relaxations.
on August 21, 2006
ww
w.jgp.org
Dow
nloaded from
504 Fluorescence Kinetics of g-Aminobutyric Acid Transporter
porter functions nearly normally (Fig. 4), yet the steadystate fluorescence is reduced by z40% (Table I) andthe voltage-dependent fractional change in fluores-cence is reduced by at least twofold at voltages morenegative than 280 mV (Figs. 5 and 6).
There are non-Cys74 signals as well; these appear to de-pend linearly on membrane potential. However, the factthat we measure single but different time constants in thepresence and absence of Cys74 suggests that the signalsare not a simple sum of Cys74 and non-Cys74 com-ponents, vitiating a clear view of possible interactionsamong fluorescent labels. Interpretation of the non-Cys74 signals is also complicated by four additional obser-vations about effects of sulfhydryl reagents. (a) In thepresent experiments, TMRM labeling could occur atnon-Cys74 sites despite previous reaction with MTSET,but could also be reversed by subsequent exposure toMTSET (Table II). (b) Reactivity at Cys residues otherthan Cys74 may depend on the functional state of thetransporter (Golovanevsky and Kanner, 1999), and thereare complex interactions involving the analogous posi-tion in SERT, C109 (Stephan et al., 1999). (c) Rather se-vere exposure to MTSET is required to alkylate Cys74 (Yuet al., 1998); concentrations of 1.5 mM (vs. 3.75 mM usedin the present experiments) and incubations of 5 min(vs. 30 min in the present experiments) produced noblockade (Bennett and Kanner, 1997). (d) Both TMRMand MTSET may react with other functional groups(Means and Feeney, 1971; Kluger and Tsui, 1980).
The fluorescence signals are small, limiting our abil-ity to resolve their detailed amplitude and time courseunder varying conditions. The largest change in fluo-rescence that we observed, corresponding to voltagejumps between 160 and 2140 mV, amounted to 0.8%.Our apparatus works well, as judged by the robust sig-nals (31%) obtained with a similarly labeled K1 chan-nel (Mannuzzu et al., 1996). Furthermore, these smallsignals occur despite an impressive expression level:the 80 nC of charge movement corresponds to a trans-porter density of z20,000/mm2 (Mager et al., 1993).Despite the small signals, we introduce history indepen-dence as a test for well-behaved conformational transi-tions, and we show that quantitative comparisons ofvoltage dependence can be made between fluores-cence and charge movements.
In addition to the challenges posed by temporal analy-sis of the relaxations, other uncertainties are raised inevaluating the steady state fluorescence intensities. Previ-ous studies show that changing the concentration of in-hibitors, of Na1, or of Cl2 at constant voltage producescharge movements associated with ion binding to GAT1(Mager et al., 1993, 1996). Changes in the concentra-tions of these agents also affect our fluorescence relax-ations and therefore might also change steady state fluo-rescence under our baseline conditions (usually 240
mV). However, these variations would be expected to liewithin the same amplitude range as the voltage-jump re-laxations, ,1%. Signals this small, occurring over severalseconds, would not be distinguishable from drifts causedby bleaching and oocyte motions. Although the figurespresent aligned baselines, it is likely that exposure toinhibitors or to varying substrate concentrations haschanged the baseline fluorescence. We think it likelythat the W68L transporter is actually fixed at a steadystate fluorescence level similar to that attained by theWT transporter only at large negative potentials, be-cause previous studies suggest that the W68L transporteris blocked at a point in the transport cycle after the bind-ing of Na1 and before that of GABA (Mager et al.,1996). Similar comments apply to the fluorescence inthe presence of NO-711 (Mager et al., 1996).
Despite these limitations, the experiments clearlyshow that the fluorescence signals differ in importantways from the previously known signals, primarily elec-trophysiological, associated with GAT1 function. Thedependence on membrane potential (Figs. 9 and 10),GABA (Fig. 11), Cl2 concentration (Fig. 11), and Na1
concentration (Fig. 12) all differ markedly from thecharacteristics of the transport-associated currents andtransient charge movements described in previousstudies (Mager et al., 1993, 1996; Lu et al., 1996; Hilge-mann and Lu, 1999; Lu and Hilgemann, 1999b). Thekinetics of the major fluorescence signal (time constantof 30–150 ms) are in the range of those expected froma rate-limiting process in the transport cycle, but de-tailed analysis shows that the kinetics do not match thewell-studied process associated with Na1 binding to thetransporter. These observations differ from the impres-sive correlations with electrophysiology obtained influorescence studies on voltage-gated channels (Man-nuzzu et al., 1996; Siegel and Isacoff, 1997) or, morerelevant, on the Na1-glucose transporter SGLT1 la-beled at position 457 (Loo et al., 1998).
Nature of the Voltage-induced Fluorescence Signal
The effects of jumping the membrane voltage on GAT1could have one or more of three physical bases. (a)Membrane potential changes the electrochemical gra-dient of the charged GAT1 substrates, Na1 and Cl2.Under most of our conditions, a hyperpolarizing volt-age jump increases the electrochemical driving forcefor Na1, thus possibly changing the balance of trans-porters among intermediate states in the transport cy-cle. (b) A jump in the membrane electrical field couldchange in the energy barrier for some conformationalchanges during GAT1 function. These conformationalchanges could involve entire domains of the protein, orindividual side chains. (c) In a related mechanism, thecovalently attached fluorophore itself, which has a sub-stantial dipole moment, could move in the field.
on August 21, 2006
ww
w.jgp.org
Dow
nloaded from
505 Li et al.
Changes in fluorescence of reporter groups arethought to arise from changes either in the polarity ofthe immediate environment and/or in quenching bydiscrete neighboring moieties. Any of the mechanismsdescribed above could involve such changes. In addi-tion, one should consider (d) altered quenching byions bound nearby. We also cannot rule out changes inquenching due to interactions between neighboringfluorophores, although modern studies have shown noevidence that transporters similar to GAT1 exist as mul-timers (Eskandari et al., 1998).
The fact that the fluorescence signal from WT-GAT1is a nonlinear function of voltage argues against hy-potheses c and d, which would be expected to produceeffects that are linear, at least to first order, with themembrane field. A related observation, that W68L-GAT1 displays fluorescence relaxations only at the highpositive potentials that also permit conformationalchanges (Fig. 14) (Mager et al., 1996), supports the hy-pothesis that the fluorescence changes do not originatefrom nonspecific movement of charged groups withinthe electrical field in response to voltage jumps. There-fore, we conclude that the fluorescence relaxation ob-served in GAT1 corresponds to a conformationalchange of GAT1 induced either by increased electro-chemical driving force of Na1 and/or by a decreasedenergy barrier between two conformational states ofGAT1.2 In fact, these two mechanisms may be indistin-guishable at the level of the finest details of the trans-port mechanism (Su et al., 1996; Lester et al., 1996).
Nature of the Fluorescent State
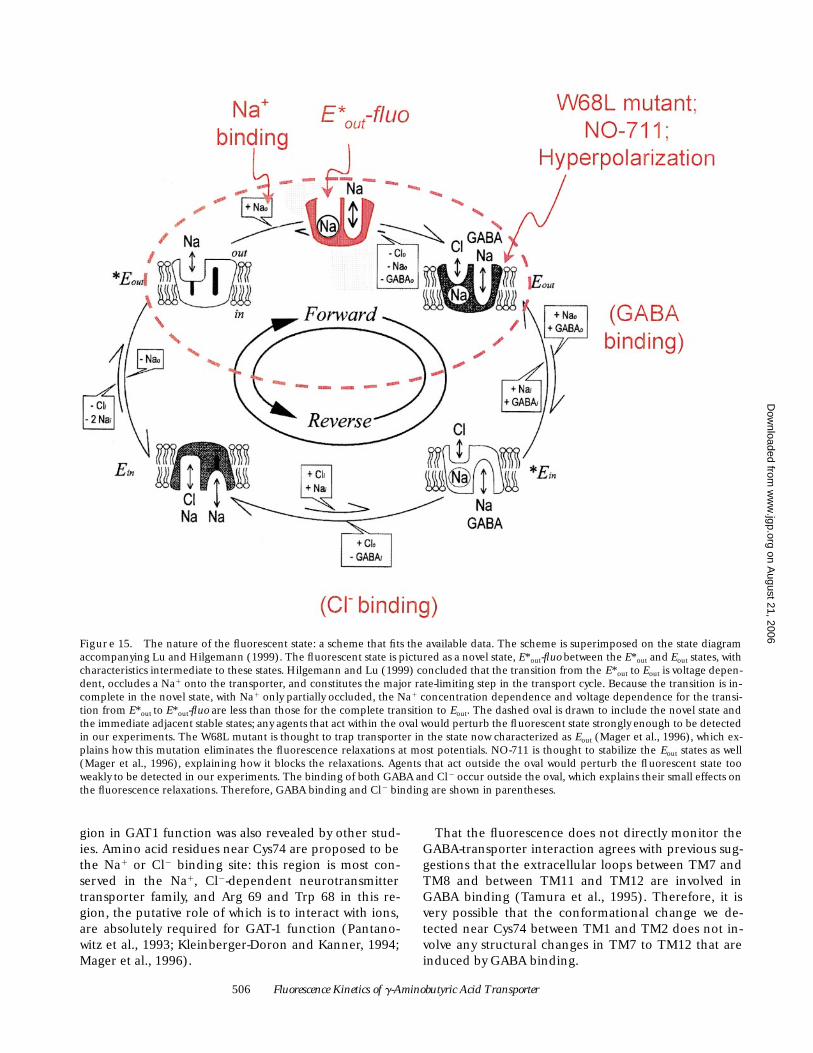
A conformational change produces the fluorescencesignal. Conformational changes form the basis of ki-netic-state models for GAT1 function studied by Hilge-mann and Lu (1999). Their favored model is shown inFig. 15. Dr. Hilgemann kindly spent some effort at in-vestigating states in this model that might parallel oursignals, but was unable to correlate the fluorescence sig-nals shown here with a kinetic state in their model. Wesuggest that the fluorescence relaxations observed withTMRM-labeled GAT1 accompany transitions to andfrom a novel intermediate state that was not detectablein the experiments of Hilgemann and Lu (Fig. 15).Hilgemann concluded that the transition from E*out toEout is voltage dependent, occludes a Na1 onto thetransporter, and constitutes the major rate-limiting step
in the transport cycle (Hilgemann and Lu, 1999). It istherefore not surprising that an additional detectiontechnique—fluorescence labeling in this case—has pro-duced evidence for the existence of an additional stepduring this complex E*out to Eout transition. Because thenovel state lies between the two states, E*out and Eout, weterm the new state E*out-fluo. Our measurements do notaccurately reflect the steady state fluorescence, but dotrack changes from this baseline level; therefore, themeasurements are expected to reflect primarily the rel-ative levels of E*out-fluo and the two adjacent states, E*out
and Eout. Fig. 15 explains how the scheme accounts forthe data in the present study: membrane potential,Na1, NO-711, and the W68L mutation all affect the flu-orescence relaxations strongly, while Cl2 and GABA af-fect the relaxations more weakly, if at all.
We were initially surprised that GABA does notstrongly affect the relaxations. However, we emphasizethat most transporters are thought to reside in thestates that include E*out, E*out-fluo, and Eout, both in thepresence and absence of GABA (Lester et al., 1996;Hilgemann and Lu, 1999). This point accounts for therelative lack of GABA effects on the relaxations.
Our study thus supports kinetic models in which mul-tiple conformational changes occur during neurotrans-mitter transporter function, and our data suggest thatone such conformational change comprises part of thetransition previously thought to limit the rate of trans-port (Mager et al., 1993, 1996; Hilgemann and Lu,1999). Because ion-coupled transport can be simulatedin the absence of conformational changes (Su et al.,1996), this is a noteworthy observation. The magnitudeof the fluorescence changes that we observe is verysmall; therefore, we cannot yet make quantitative state-ments about the newly identified intermediate state.However, much of our data suggests that E*out-fluo ispoorly populated under the conditions of all our ma-nipulations. The fluorescence relaxations show no signof saturation with hyperpolarizing voltage even at themost negative potentials studied (2140 mV); thus, atmost half the transporter population is in the fluores-cent state. The signal also shows no sign of saturationwith Na1 concentration even at the highest levels stud-ied (96 mM); this implies a similar factor of 50%. Weshall assume that these factors are multiplicative, imply-ing that even our largest signals correspond to an E*out-fluo occupancy of at most 25%. Perhaps only a few per-cent of the transporters are in E*out-fluo. This hypothe-sis also partially explains (a) the small size of the signaland (b) the fact that E*out-fluo escaped detection in theexperiments of Lu and Hilgemann (1999a,b).
Relationship to Other Work
We believe that we have detected a conformationalchange in GAT1 near Cys74. The importance of this re-
2On the other hand, the linear voltage dependence of the fluores-cence signal from the C74A mutant would be explained by contribu-tions from any or all of these four mechanisms. However, W68L-GAT1 both undergoes conformational changes and displays fluores-cence relaxations, only at positive potentials, suggesting that even theC74A signals arise from specific conformational changes. We have lit-tle data to suggest the nature of the conformational changes moni-tored by the C74A signals and will not consider them further.
on August 21, 2006
ww
w.jgp.org
Dow
nloaded from
506 Fluorescence Kinetics of g-Aminobutyric Acid Transporter
gion in GAT1 function was also revealed by other stud-ies. Amino acid residues near Cys74 are proposed to bethe Na1 or Cl2 binding site: this region is most con-served in the Na1, Cl2-dependent neurotransmittertransporter family, and Arg 69 and Trp 68 in this re-gion, the putative role of which is to interact with ions,are absolutely required for GAT-1 function (Pantano-witz et al., 1993; Kleinberger-Doron and Kanner, 1994;Mager et al., 1996).
That the fluorescence does not directly monitor theGABA-transporter interaction agrees with previous sug-gestions that the extracellular loops between TM7 andTM8 and between TM11 and TM12 are involved inGABA binding (Tamura et al., 1995). Therefore, it isvery possible that the conformational change we de-tected near Cys74 between TM1 and TM2 does not in-volve any structural changes in TM7 to TM12 that areinduced by GABA binding.
Figure 15. The nature of the fluorescent state: a scheme that fits the available data. The scheme is superimposed on the state diagramaccompanying Lu and Hilgemann (1999). The fluorescent state is pictured as a novel state, E*out-fluo between the E*out and Eout states, withcharacteristics intermediate to these states. Hilgemann and Lu (1999) concluded that the transition from the E*out to Eout is voltage depen-dent, occludes a Na1 onto the transporter, and constitutes the major rate-limiting step in the transport cycle. Because the transition is in-complete in the novel state, with Na1 only partially occluded, the Na1 concentration dependence and voltage dependence for the transi-tion from E*out to E*out-fluo are less than those for the complete transition to Eout. The dashed oval is drawn to include the novel state andthe immediate adjacent stable states; any agents that act within the oval would perturb the fluorescent state strongly enough to be detectedin our experiments. The W68L mutant is thought to trap transporter in the state now characterized as Eout (Mager et al., 1996), which ex-plains how this mutation eliminates the fluorescence relaxations at most potentials. NO-711 is thought to stabilize the Eout states as well(Mager et al., 1996), explaining how it blocks the relaxations. Agents that act outside the oval would perturb the fluorescent state tooweakly to be detected in our experiments. The binding of both GABA and Cl2 occur outside the oval, which explains their small effects onthe fluorescence relaxations. Therefore, GABA binding and Cl2 binding are shown in parentheses.
on August 21, 2006
ww
w.jgp.org
Dow
nloaded from
507 Li et al.
The GAT1 Fluorescence Signal Recalls a Phenomenon at Serotonin Transporters
The serotonin transporter SERT has z40% sequencesimilarity to GAT1, and therefore the two transporterspresumably share overall structural details. We feel jus-tified in comparing some functional phenomena aswell between SERT and GAT1. At SERT, jumps to hy-perpolarizing voltages induce the transient activationof a channel-like conducting pathway (Mager etal., 1994). Thus, SERT displays a hyperpolarization-induced conformational change. Several characteristicsof this state at SERT resemble those of the state weterm E*out-fluo at GAT1. (a) Voltage dependence: bothincrease with hyperpolarizing voltages with no sign ofsaturation at membrane voltage of 2140 mV. (b) Na1
dependence: both increase with increasing Na1 con-centration with a Hill coefficient of 1.7–1.8. (c) Cl2 de-pendence: both are affected by Cl2 to a lesser degreethan by Na1. (d) Substrate dependence: both occurin the absence of the respective neurotransmitter. (e)Time course: both the GAT1 fluorescence signal andthe inactivation of the SERT conductance occur ontime scale of z100 ms.
If a state like E*out-fluo does produce the transient re-sistive current in SERT, then E*out-fluo contains a chan-nel-like pathway in SERT but not in GAT1. Perhaps thispartially occluded state, which we have already drawnas extending nearly through the molecule (Fig. 15), isactually open to both sides in SERT. Indeed, severalstudies suggest that a channel-like pathway also exists inGAT1 (Cammack et al., 1994; Cammack and Schwartz,1996; Risso et al., 1996). Because channel-like behav-iors of neurotransmitter transporters are being investi-gated intensively (Mager et al., 1994; Cammack andSchwartz, 1996; Sonders et al., 1997; Petersen and De-Felice, 1999; Galli et al., 1998), fluorescence experi-ments may become a useful tool.
Outlook
Over the past decade, electrophysiological experimentshave revealed the existence of several previously unsus-pected states at neurotransmitter transporters. We haveshown how to conduct fluorescence measurements ona neurotransmitter transporter. We conclude that ourmeasurements monitor a novel conformational state ofGAT1, but this state has properties intermediate be-tween those of two known states, and it may resemble apreviously described state of SERT. We expect that itwill be possible to measure fluorescent signals associ-ated with labeling of other GAT1 residues. We hopethat some of these future signals will be larger andtherefore more amenable to quantitation.
We thank Mike Walsh for excellent technical assistance and EhudIsacoff, Micah Siegel, and Yong-Xin Li for advice and reagents.
This work is supported by grants from the National Institutesof Health (NS-11756, DA-09121).
Submitted: 7 December 1999Revised: 11 February 2000Accepted: 22 February 2000
R E F E R E N C E S
Amara, S.G., and M. Kuhar. 1993. Neurotransmitter transporters:recent progress. Annu. Rev. Neurosci. 16:73–93.
Baker, O.S., H.P. Larsson, L.M. Mannuzzu and E.Y. Isacoff. 1998.Three transmembrane conformations and sequence-dependentdisplacement of the S4 domain in Shaker K1 channel gating. Neu-ron. 20:1283–1294.
Bendahan, A., and B.I. Kanner. 1993. Identification of domains of acloned rat-brain GABA transporter which are not required for itsfunctional expression. FEBS Lett. 318:41–44.
Bennett, E.R., and B.I. Kanner. 1997. The membrane topology ofGAT-1, a (Na1 1 Cl2)-coupled g- aminobutyric acid transporterfrom rat brain. J. Biol. Chem. 272:1203–1210.
Blakely, R.D., H.E. Berson, J.R.T. Fremeau, M.G. Caron, M.M. Peek,H.K. Prince, and C.C. Bradley. 1991. Cloning and expression of afunctional serotonin transporter from rat brain. Nature. 354:66–70.
Cammack, J.N., S.V. Rakhilin, and E.A. Schwartz. 1994. A GABAtransporter operates asymmetrically and with variable stoichiom-etry. Neuron. 13:949–960.
Cammack, J.N., and E.A. Schwartz. 1996. Channel behavior in aGABA transporter. Proc. Natl. Acad. Sci. USA. 93:723–727.
Cha, A., and F. Bezanilla. 1997. Characterizing voltage-dependentconformational changes in the Shaker K1 channel with fluores-cence. Neuron. 19:1127–1140.
Cha, A., and F. Bezanilla. 1998. Structural implications of fluores-cence quenching in the Shaker K1 channel. J. Gen. Physiol. 112:391–408.
Eskandari, S., E.M. Wright, M. Kreman, D.M. Starace, and G.A.Zampighi. 1998. Structural analysis of cloned plasma membraneproteins by freeze-fracture electron microscopy. Proc. Natl. Acad.Sci. USA. 95:11235–11240.
Galli, A., R.D. Blakely, and L.J. DeFelice. 1998. Patch-clamp andamperometric recordings from norepinephrine transporters:channel activity and voltage-dependent uptake. Proc. Natl. Acad.Sci. USA. 95:13260–13265.
Golovanevsky, V., and B.I. Kanner. 1999. The reactivity of the g-ami-nobutyric acid transporter GAT-1 toward sulfhydryl reagents isconformationally sensitive. Identification of a major target resi-due. J. Biol. Chem. 274:23020–23026.
Guastella, J.G., N. Nelson, H. Nelson, L. Czyzyk, S. Keynan, M.C.Midel, N. Davidson, H.A. Lester, and B. Kanner. 1990. Cloningand expression of a rat brain GABA transporter. Science. 249:1303–1306.
Hilgemann, D.W., and C.C. Lu. 1999. GAT1 (GABA:Na1:Cl2)cotransport function. Database reconstruction with an alternat-ing access model. J. Gen. Physiol. 114:459–476.
Hoffman, B.J., E. Mezey, and M.J. Brownstein. 1991. Cloning of aserotonin transporter affected by antidepressants. Science. 254:579–580.
Kanner, B.I. 1978. Solubilization and reconstitution of the g-ami-nobutyric acid transporter from rat brain. FEBS Lett. 89:47–50.
Kanner, B.I., and A. Bendahan. 1982. Binding order of substratesto the sodium and potassium ion coupled L-glutamic acid trans-porter from rat brain. Biochemistry. 21:6327–6330.
Kleinberger-Doron, N., and B.I. Kanner. 1994. Identification oftryptophan residues critical for the function and targeting of the
on August 21, 2006
ww
w.jgp.org
Dow
nloaded from
508 Fluorescence Kinetics of g-Aminobutyric Acid Transporter
g-aminobutyric acid transporter (subtype A). J. Biol. Chem. 269:3063–3067.
Kluger, R., and W.C. Tsui. 1980. Amino group reactions of the sulf-hydryl reagent methyl methanesulfonothioate. Inactivation ofd-3-hydroxybutyrate dehydrogenase and reaction with amines inwater. Can. J. Biochem. 58:629–632.
Kuhar, M.J., M.C. Ritz, and J.W. Boja. 1991. The dopamine hypoth-esis of the reinforcing properties of cocaine. Trends Neurosci. 144:299–302.
Lester, H.A., Y. Cao, and S. Mager. 1996. Listening to neurotrans-mitter transporters. Neuron. 17:807–810.
Loo, D.D., B.A. Hirayama, E.M. Gallardo, J.T. Lam, E. Turk, andE.M. Wright. 1998. Conformational changes couple Na1 and glu-cose transport. Proc. Natl. Acad. Sci. USA. 95:7789–7794.
Loots, E., and E.Y. Isacoff. 1998. Protein rearrangements underly-ing slow inactivation of the Shaker K1 channel. J. Gen. Physiol. 112:377–389.
Lu, C.C., and D.W. Hilgemann. 1999a. GAT1 (GABA:Na1:Cl2)cotransport function. Kinetic studies in giant Xenopus oocytemembrane patches. J. Gen. Physiol. 114:445–458.
Lu, C.C., and D.W. Hilgemann. 1999b. GAT1 (GABA:Na1:Cl2)cotransport function. Steady state studies in giant Xenopus oocytemembrane patches. J. Gen. Physiol. 114:429–444.
Lu, C.-C., A. Kabakov, V.S. Markin, S. Mager, A. Frazier, and D.W.Hilgemann. 1996. Membrane transport mechanisms probed bycapacitance measurements with megahertz voltage clamp. Proc.Natl. Acad. Sci.USA. 92:11220–11224.
Mabjeesh, N.J., and B.I. Kanner. 1992. Neither amino nor carboxyltermini are required for function of the sodium- and chloride-coupled g-aminobutyric acid transporter from rat brain. J. Biol.Chem. 267:2563–2568.
Mager, S., Y. Cao, and H.A. Lester. 1998. Measurement of transientcurrents from neurotransmitter transporters expressed in Xeno-pus oocytes. Methods Enzymol. 296:551–566.
Mager, S., N. Kleinberger-Doron, G.I. Keshet, N. Davidson, B.I.Kanner, and H.A. Lester. 1996. Ion binding and permeation atthe GABA transporter GAT1. J. Neurosci. 16:5405–5414.
Mager, S., C. Min, D.J. Henry, C. Chavkin, B.J. Hoffman, N. David-son, and H.A. Lester. 1994. Conducting states of a mammalian se-rotonin transporter. Neuron. 12:845–859.
Mager, S., J. Naeve, M. Quick, J. Guastella, N. Davidson, and H.A.Lester. 1993. Steady states, charge movements, and rates for acloned GABA transporter expressed in Xenopus oocytes. Neuron.10:177–188.
Mannuzzu, L.M., M.M. Moronne, and E.Y. Isacoff. 1996. Directphysical measure of conformational rearrangement underlyingpotassium channel gating. Science. 271:213–216.
Means, G., and R.E. Feeney. 1971. Chemical Modification of Pro-teins. Holden-Day, Inc., San Francisco, CA. 105–114.
Pacholczyk, T., R.D. Blakely, and S.G. Amara. 1991. Expressioncloning of a cocaine-sensitive and antidepressant-sensitive hu-man noradrenaline transporter. Nature. 350:350–354.
Pantanowitz, S., A. Bandahan, and B.I. Kanner. 1993. Only one ofthe charged amino-acids located in the transmembrane a-helicesof the g-aminobutyric-acid transporter (subtype-A) is essentialfor its activity. J. Biol. Chem. 286:3222–3225.
Pastuszko, A., D.F. Wilson, and M. Erecinska. 1982. Energetics ofg-aminobutyrate transport in rat brain synaptosomes. J. Biol.Chem. 257:7514–7519.
Penado, K.M., G. Rudnick, and M.M. Stephan. 1998. Critical aminoacid residues in transmembrane span 7 of the serotonin trans-porter identified by random mutagenesis. J. Biol. Chem. 273:28098–28106.
Petersen, C.I., and L.J. DeFelice. 1999. Ionic interactions in theDrosophila serotonin transporter identify it as a serotonin chan-nel. Nat. Neurosci. 2:605–610.
Quick, M.W., and H.A. Lester. 1994. Methods for expression of ex-citability proteins in Xenopus oocytes. Methods Neurosci. 19:261–279.
Radian, R., and B.I. Kanner. 1983. Stoichiometry of sodium- andchloride-coupled g-aminobutyric acid transport by synapticplasma membrane vesicles isolated from rat brain. Biochemistry.22:142–168.
Radian, R., and B.I. Kanner. 1985. Reconstitution and purificationof the sodium- and chloride-coupled g-aminobutyric acid trans-porter from rat brain. J. Biol. Chem. 260:11859–11865.
Risso, S., L.J. DeFelice, and R.D. Blakely. 1996. Sodium-dependentGABA-induced currents in GAT1-transfected HeLa cells. J. Phys-iol. 490:691–702.
Rudnick, G. 1977. Active transport of 5-hydroxytryptamine inplasma membrane vesicles isolated from human blood platelets.J. Biol. Chem. 252:2170–2174.
Rudnick, G., and P.J. Nelson. 1978. Platelet 5-hydroxytryptaminetransport, an electroneutral mechanism coupled to potassium.Biochemistry. 17:4739–4742.
Shimada, S., S. Kitayama, C.L. Lin, A. Patel, E. Nanthakumar, M.Kuhar, and G. Uhl. 1991. Cloning and expression of a cocaine-sensitive dopamine transporter complementary-DNA. Science.254:576–578.
Siegel, M.S., and E.Y. Isacoff. 1997. A genetically encoded opticalprobe of membrane voltage. Neuron. 19:735–741.
Sonders, M., S.-J. Zhu, N. Zahniser, M. Kavanaugh, and S. Amara.1997. Multiple ionic conductances of the human dopaminetransporter: the actions of dopamine and psychostimulants. J.Neurosci. 17:960–974.
Stephan, M., G. Kamdar, G. Rudnick, and K. Penado. 1999. A func-tional link between transmembrane span 7 and extracellularloop 1 of the serotonin transporter: effects of Na1, Li1, andmethansulfonate reagents. Soc. Neurosci. Abstr. 25:1699.
Su, A., S. Mager, S.L. Mayo, and H.A. Lester. 1996. A multi-substratesingle-file model for ion-coupled transporters. Biophys. J. 70:762–777.
Tamura, S., H. Nelson, A. Tamura, and N. Nelson. 1995. Short ex-ternal loops as potential substrate binding site of g-aminobutyricacid transporters. J. Biol. Chem. 270:28712–28715.
Usdin, T.B., E. Mezey, C. Chen, M.J. Brownstein, and B.J. Hoffman.1991. Cloning of the cocaine-sensitive bovine dopamine trans-porter. Proc. Natl. Acad. Sci. USA. 88:11168–11171.
Yu, N., Y. Cao, S. Mager, and H.A. Lester. 1998. Topological localiza-tion of cysteine 74 in the GABA transporter, GAT1, and its impor-tance in ion binding and permeation. FEBS Lett. 426:174–178.
on August 21, 2006
ww
w.jgp.org
Dow
nloaded from