Embed Size (px)
Citation preview
Summary
A host of regulatory reforms are under way to make the fi nancial system safer, and the reforms are aimed in the right direction: to make markets and institutions more transparent, less complex, and less leveraged. Th e chapter uses these qualities, among others, as normative benchmarks and adds value by providing new measures of fi nancial intermediation structures and an early assessment of
whether the fi nancial system is headed in a safer direction. Th e same framework can be used for further evalu-ation when the crisis subsides. Th e chapter also takes stock of the host of regulatory reforms and their status with regard to implementation, and indicates where further eff ort is still needed.
Most reforms are in the banking sector and impose higher costs to encourage banks to internalize the costs of certain risky activities. Basel III requirements for more and better-quality capital and liquidity buff ers should enable institutions to better withstand distress. Banks will likely adjust to the new costs in various ways, some of which may not have been intended. Th e new banking standards may encourage certain activi-ties to move to the nonbank sector, where those standards do not apply. Alternatively, big banking groups with advantages of scale may be better able to absorb the costs of the regulations; as a result, they may become even more prominent in certain markets, making these markets more concentrated.
Although the intentions of policymakers are clear and positive, the reforms have yet to eff ect a safer set of fi nancial structures, in part because, in some economies and regions, the intervention measures needed to deal with the prolonged crisis are delaying a “reboot” of the system onto a safer path. Th ese intervention mea-sures are rightly aimed at preventing a collapse of the fi nancial system and supporting the real economy, but they can also provide time to allow damaged fi nancial systems to recover. Th e fi ndings suggest, however, that despite improvements along some dimensions and in some economies, the structure of intermediation remains largely unchanged. Th e data suggest that fi nancial systems are still overly complex, banking assets are concen-trated, with strong domestic interbank linkages, and the too-important-to-fail issues are unresolved. Innovative products are already being developed to circumvent some new regulations. Th ese same traits have been linked to the crisis, suggesting fi nancial systems remain vulnerable. Th e good news is that there do not appear to have been serious setbacks to fi nancial globalization (despite reversals from some crisis-hit economies); however, this also means that in the absence of appropriate policies, highly integrated economies are still susceptible to harmful cross-border spillovers.
Despite much progress on the reform agenda, reforms in some areas still need to be further refi ned by policymakers. Th ese areas include a global-level discussion on the pros and cons for direct restrictions on busi-ness models; monitoring, and a set of prudential standards if needed, for nonbank fi nancial institutions posing systemic risks within the so-called shadow banking sector; careful thought on how to encourage the use of simpler products and simpler organizational structures; and further progress on recovery and resolution plan-ning for large institutions, including cross-border resolution to help secure the benefi ts of fi nancial globaliza-tion. Finally, the success of the current and prospective reforms depends on enhanced supervision, incentives for the private sector to adhere to the reforms, the political will to implement regulations, and the resources necessary for the task of making the fi nancial system simpler and safer.
International Monetary Fund | October 2012 75
3chapter the reFOrM aGeNDa: aN INterIM repOrt ON prOGreSS tOWarD a SaFer FINaNcIaL SYSteM

G LO B A L F I N A N C I A L S TA B I L I T Y R E P O RT
76 International Monetary Fund | October 2012
The global regulatory reform agenda aims for a safer financial system so that financial intermediation can help produce stable and sustainable economic growth—
a system that avoids taxpayer-paid bailouts and large disruptions to economic activity. Many of the current reforms attempt to ensure that financial institutions internalize the risks and explicit or implicit costs of their business activities, mainly through the imposi-tion of additional costs on activities that, in the crisis, were shown to be riskier than originally envisaged or had broader systemic effects. This chapter takes the first step toward assessing the extent to which these reforms are producing a safer system and identifies some remaining gaps in the reform agenda.
This task should be viewed as a normative one: Have interim lessons from the crisis shaped the reforms appropriately? Or have some lessons not yet been adequately incorporated? Despite the dearth of up-to-date cross-country data on which to make quantitative assessments, some changes in financial systems are beginning to be noticeable, especially in economies in which the crisis has sub-sided and reforms are being implemented. Hence, the chapter should be viewed as an interim report on whether structural changes are starting to move us closer to a safer financial system, along with sug-gestions about how to reap the full benefits of the reform agenda.
It is helpful at the outset to describe what a safer financial system would look like. Most would envisage a system that is less complex and more transparent, a system in which institutions are less dependent on leverage, are better capitalized and better able to absorb loss, and can better manage liquidity risk through a more sustainable level of maturity mismatch. This safer system would discour-age individual institutions from taking advantage of an implicit government guarantee and would encourage all risks (including systemic risks) to be properly priced. It would apply similar prudential
standards to similar risks to avoid regulatory arbi-trage that would allow risks to migrate and poten-tially threaten stability.
Although structural changes are not always apparent, we believe that the thrust of the reforms is pushing in the right direction and will, over time, deliver a system less prone to instability. That said, the chapter finds that, since 2007, overall, financial buffers are being strengthened but vulner-abilities remain and implementation of the reforms is uneven. Progress is lacking in part because (1) in many economies the reforms have only begun to take root, and (2) in some economies and regions, the continued need for official support of the financial system to prevent a collapse is not accom-panied by resolute measures to deeply restructure the financial sector, which is affecting incentives and hampering normalization. The long transition period for implementation of reforms has been designed to minimize any potential disruption of the nascent economic recovery (as opposed to eventual steady-state impact). Hence, only a preliminary assessment of the effects of the proposed reforms is possible. As reforms and implementation advance and crisis man-agement effects unwind, however, it will be impor-tant to again evaluate progress in addressing the key structural components and, if needed, consider further improvements.
The analysis in this chapter suggests some areas for further attention, including the too-important-to-fail problem, risks posed by systemically impor-tant nonbank institutions, and methods to ensure that globalization does not reverse. Regulations imply that costs will rise for certain riskier activities, and some of the largest institutions will pursue their scale economies in certain business lines to absorb the higher costs. Consequently there is a risk that in some markets large institutions will become larger still, and more concentrated, and that these few global institutions will become even more influen-tial—thereby further entrenching the too-important-to-fail problem.
The risks inherent in a growing too-important-to-fail problem make regulatory initiatives to tackle the problem a high priority—initiatives such as enhanc-ing the resolvability of such global institutions and directly changing permissible business models.
Note: This chapter was written by Jennifer Elliott and Srobona Mitra (team leaders), Nicolas Arregui, Ana Carvajal, Su Hoong Chang, Ken Chikada, Ellen Gaston, Tom Gole, John Kiff, Michael Kleemann, Fabiana Melo, Lev Ratnovski, André Santos, Katharine Seal, Jay Surti, Rodolfo Wehrhahn, and Mamoru Yanase. Research support was provided by Oksana Khadarina. Gianni de Nicolò was a consultant for this chapter.
c h a p t e r 3 T h E R E F O R m AG E N dA: A N I N T E R I m R E P O RT O N P R O G R E S S TOwA R d A S A F E R F I N A N C I A L S YS T E m
International Monetary Fund | October 2012 77
However, in some cases, these initiatives may be very difficult to implement effectively or may not have the intended outcomes (either domestically or globally). Tighter bank regulation and more intense supervision may also push bank-like activities into some less-regulated nonbank financial institutions (the shadow banking system). If these are deemed to raise systemic risks, a wider regulatory perimeter is advisable.
Concerns about deglobalization are rising, especially with the fragmentation in the euro area, though solid evidence is currently lacking at the global level to substantiate a decline in cross-border activity. Although a pull-back from globalization may not yet be evident, further measures will be needed to make sure that the benefits of risk-sharing and diversification that come from an integrated global financial system are not lost.
The chapter will progress by addressing the fol-lowing questions in turn: • What structural features of the financial system
were associated with the crisis? The answers to this question will lay out the elements of a safe financial structure that regulations should address.
• What are the goals of the new regulatory initia-tives, and what is the current best guess regarding their implications—both intended and unin-tended—for the structure of intermediation?
• What are the potential long-term effects of the crisis intervention measures? The key risks of the much-needed policies to manage the prolonged crisis will be highlighted.
• Has the structure of the financial system become safer in the past five years? Evidence of changes in trends of three structural features will be docu-mented. Quantitative analysis on whether progress on key regulatory reforms is driving these changes will be provided.
• What are the implications of the reform agenda for the attainment of a safer structure? The chap-ter will identify key reform areas in which further discussions are needed.
Structural Features associated with the crisis The structure of financial intermediation can be
characterized in various ways, each with different
implications for systemic risk and economic growth.1 Financial intermediation that is more market based (and less traditional) can be characterized by three features: banks playing more of a nontraditional role by relying on fee-based income sources, trading activities, and nondeposit liabilities; a relatively large role for nonbank financial institutions in the inter-mediation process; and greater use of new financial products such as securitizations and derivatives (IMF, 2006, Box 3.1).2 On the other hand, the financial system is one with more traditional bank-based inter-mediation if banks primarily take deposits and make loans and are the main institutions in the economy that intermediate between savers and investors. With traditional intermediation, banks tend to depend on net interest income as their main source of profit-ability. These two basic intermediation structures, market based and traditional, give rise to financial institutions with different features of scale and scope (Box 3.1). In particular, certain market-based forms of intermediation could be related to larger, more interconnected (both domestically and globally), and more complex financial structures and instruments. Complexity can be detrimental to financial stability if the associated financial products are opaque and cannot be easily priced.
A surge of market-based financial intermediation and new financial products led to structural fea-tures that were associated with the recent financial crisis.3 Before the crisis, advanced financial systems conducted more market-based business rather than the traditional bank-based intermediation. Because the regulatory framework had not been adequately upgraded to preserve financial safety, new vulner-abilities emerged (Viñals and others, 2010). Box 3.1 examines the theoretical and empirical literature to demonstrate how these developments are linked to
1The implications for systemic risk are derived in this chapter; Chapter 4 explores a more formal cross-country examination of the effects on economic growth, on its volatility, and on financial stability.
2See Annex 3.1 for the indicators used to characterize the vari-ous structures of intermediation. The terms in italics represent the measures used to examine the structures.
3There were other contributing factors as well—poor lending standards, a “search for yield” driven by relatively loose monetary policy, weak supervision, and compensation policies encouraging risk taking, to name a few.

G LO B A L F I N A N C I A L S TA B I L I T Y R E P O RT
78 International Monetary Fund | October 2012
Changes in structures of financial intermediation over the decade have considerably expanded access to finance and contributed to social welfare. The changes led to new forms of bank intermediation, including the rise of the shadow banking system and innovative products. Yet, some of the changes—associated with the attributes of concentration, interconnectedness, complexity, and opac-ity—have come with risks.
The greatest change to intermediation in the history of finance has been spurred by advances in informa-tion technology (IT) that have enabled, among other things, better and faster processing of information and trading in a wider range of financial instruments. Over the past 10 years, these changes have allowed more financial intermediation to take place in markets instead of through bilateral negotiations. The more market-based system has in turn generated new or expanded forms of financial intermediation: banks deriving income from nontraditional sources and lend-ing to and borrowing from nonbank financial institu-tions, expanded intermediation by nonbanks, and new financial products like private-label asset-backed securities and customized derivatives.
Nontraditional Banking and Associated Risks
Bank business models have traditionally been built on information obtained from repeated interactions with customers, or “soft” informa-tion. Technology and transparency have shifted banks toward the use of hard information (e.g., credit registries or standardized scoring) and “arm’s length” transactions (IMF, 2006) for their tradi-tional deposit and lending business, and toward more fee-based business (Boot and Thakor, 2000). Thus, transactions that were based on customer relationships lost their natural advantage, and banks came to face greater competition. The tilt in intermediation toward nontraditional banking has entailed rising systemic risks: • Size and complexity. Soft information benefits
smaller, simpler banks. Hard information enables banks to become larger and more complex (Stein, 2002). Theoretically, large banks could benefit from economies of scale and scope. Yet the
evidence on such economies is mixed (De Nicolò, Boyd, and Jalal, 2009; Demsetz and Strahan, 1997; Saunders, 2000). Large and complex banks are hard to resolve, which increases the impact of crises (Hoenig and Morris, 2011; Ueda and Weder di Mauro, 2012). Also, when bank assets are tradable, banks can change risk profiles rapidly or structure their assets in a way that conceals risks from outside parties (Myers and Rajan, 1998). These factors challenge the ability of market discipline, corporate governance, and supervision to reduce potential systemic risks.
• Concentration. As banks grow, in part through mergers and acquisitions, the banking industry could become more concentrated, which tends to increase profits and could reduce the incentives to take risk. However, higher concentration could also induce banks to charge higher loan rates, which in turn could lead to higher risk taking by banks’ borrowers, thus increasing systemic risk (Allen and Gale, 2004; Boyd and De Nicolò, 2005). Concentration can also make institutions too important to fail if resolution regimes are inadequate, with detrimental effects on financial stability.
• Interconnectedness. With a wider universe of trad-able claims, banks become more connected with other banks and with nonbanks. Interconnected-ness improves opportunities for diversifying risks, allows a wider range of transactions, and facili-tates a more globally integrated financial system (Wagner, 2011; Freixas and Holthausen, 2005). Yet increased interconnectedness can also lead to higher systemic risk. Interconnected systems spread small and idiosyncratic shocks but can be fragile when subjected to large, systemic shocks, particularly when banks underestimate their likelihood (Allen and Gale, 2000; Acemoğlu, Ozdaglar, and Tahbaz-Salehi, 2012; Gennaioli, Shleifer, and Vishny, forthcoming).
• Procyclicality. When bank assets are tradable, it is easier for a bank to alter the size of its bal-ance sheet and leverage. This exposes the bank to boom-bust financial cycles, which can be ampli-fied by mark-to-market rules (Shleifer and Vishny, 2010; Plantin, Sapra, and Shin, 2008; IMF, 2009). The shedding of assets may trigger fire sales and
Box 3.1. risks associated with New Forms of Financial Intermediation
Note: Prepared by Lev Ratnovski.
c h a p t e r 3 T h E R E F O R m AG E N dA: A N I N T E R I m R E P O RT O N P R O G R E S S TOwA R d A S A F E R F I N A N C I A L S YS T E m
International Monetary Fund | October 2012 79
financial structures that may give rise to systemic risk.
It is now well accepted that financial systems became highly complex and the location of risks was
opaque, making it difficult for both authorities and investors to track risks and assess potential spill-overs. The inability of investors and supervisors to understand the underlying elements of new financial
credit freezes, with significant negative implications for macroeconomic outcomes and financial stabil-ity. Depressed asset values through fire sales pose a contagion risk in that they may lead to additional margin calls and losses for other institutions, including previously unaffected firms.
• Tail risk. With more tradable assets and less traditional banking business, banks can accu-mulate large, skewed exposures to various risks. In a common pattern before and, in some cases, during the global crisis, banks used structured investments and proprietary trading to generate additional return (“alpha”) at the cost of a rise in “tail risk”—the risk of a rare but catastrophic event (Acharya and others, 2010; Boot and Rat-novski, forthcoming). A realization of such risk is likely to bring about long-lasting bank distress (Brunnermeier, Dong, and Palia, forthcoming).
• Wholesale funding and market discipline. The provid-ers of wholesale funding are often senior creditors to a bank who can maintain lending to prop up a troubled bank, but they can also rapidly cut it off if the riskiness of the bank becomes excessive or its value falls below a certain threshold (Gorton and Metrick, 2012; Huang and Ratnovski, 2011). An abrupt funding freeze may complicate a policy response, particularly if such an event affects mul-tiple banks—that is, a systemic liquidity event. Lack of disclosure and transparency (particularly with respect to exposures taken by the bank) can under-mine the market discipline that should be applied by those providing wholesale funding and by equity investors. Market discipline can be further compro-mised if the losses of most creditors of distressed banks are cushioned by government interventions.
Nonbanks and New Financial Products
Another change in the financial sector structure has been the reemergence of a variety of nonbank intermediaries, including money market funds, major broker-dealers, and various off-balance-sheet vehicles sponsored by banks (Claessens and others,
forthcoming). Collectively, credit intermediation involving entities or activities by nonbanks (whether by maturity or liquidity transformation or leverage) has become known as the shadow banking system.1
The breakdown in credit markets in 2008 revealed how this type of financial intermediation can contrib-ute to systemic risks. The interconnection of nonbanks and banks led to contagion across both sets of entities as uncertainty caused funding markets to seize up. Reliance on very-short-term funding resulted in the private creation of money-like financial instruments that were subject to runs once market participants started seeing the instruments as risky instead of safe. The resilience of nonbanks—notably U.S. investment banks—was hampered by insufficient capital and there were no appropriate procedures for access to liquid-ity support or a set of rules for resolution (Duffie, 2010; Covitz, Liang, and Suarez, forthcoming). Banks had used nonbanks to move their own risks off the balance sheet—for instance by establishing separate special-purpose vehicles (SPVs) and providing them with insurance facilities to cover credit and liquidity risk—but had to take back those risks for reputational reasons during the crisis. Banks retained the residual risks that their customers eschewed (for instance, the risky tranches of structured instruments), while they sold off the safer tranches (Pozsar, 2011). As a result, banks had assumed too much residual risk (Gennaioli, Shleifer, and Vishny, forthcoming).
New insurance and investment products (like exchange traded products, customized derivatives, and synthetic debt obligations) have become easy to con-struct with greater availability of data and better infor-mation technology. Some of these new products can be complex and opaque; therefore, counterparties may not understand the risks that they are assuming (Gabaix and Laibson, 2006; Carlin, 2009; Lo, 2011), causing financial instability when their risks are revealed.
1The FSB (2012a) describes the shadow banking system as “credit intermediation involving entities and activities outside the regular banking system.”
Box 3.1 (continued)

G LO B A L F I N A N C I A L S TA B I L I T Y R E P O RT
80 International Monetary Fund | October 2012
instruments, in turn, allowed institutions to take on too much leverage. Technological advances also per-mitted financial institutions to become more highly interconnected through interbank, repo, and other wholesale markets, both domestically and globally. Both features enabled rapid transmission and ampli-fication of shocks during the crisis. Furthermore, large complex institutions became too important to fail and were bailed out by taxpayers during the cri-sis. In addition, the shadow banking system gained importance as it avoided the more stringent regula-tory requirements imposed on banks.
As motivation for examining structural character-istics, it is useful to note that economies that con-tained some of these features before the crisis appear to have been associated with a higher incidence of financial stress. Simple correlations between the pre-crisis structures and the financial stress index (IMF, 2009; Cardarelli, Elekdag, and Lall, 2011) during 2008–10 suggest that certain structures were associ-ated with greater instability during the crisis.4 In particular, bigger financial systems, higher cross-bor-der interconnectedness (which is also closely associ-ated with greater reliance on wholesale funding), and systems with lower net interest margins (also associ-ated with less profitable traditional banking systems) were associated with a higher degree of financial stress (Table 3.1).5 Financial systems that have relied on derivatives and securitization were also associated with higher financial stress, although in some cases the number of observations is small.6 The associa-
4The financial stress index (FSI) is a monthly indicator of strain in national financial systems. An increase in the FSI denotes higher stress. See Cardarelli, Elekdag, and Lall (2011) for advanced economies, and Balakrishnan and others (2009) for emerging market economies. The FSI for advanced economies is a combination of several variables: banking sector beta, the TED spread, term spreads, stock market returns, stock market volatility, sovereign debt spreads, and exchange market volatility. For emerg-ing market economies, the FSI has five variables—it excludes the TED and term spreads and replaces exchange market volatility with an exchange market pressure index.
5The monthly financial stress index is averaged for the years 2008–11, the structure variables are averaged over their annual observations for 2003–07, and then the correlation is calculated between the two variables across economies. Some high correla-tions in Table 3.1 are not statistically significant because of a low number of observations.
6Although there is no direct measure of complexity, use of derivatives and structured products in collateral chains could be
tion of the crisis with higher banking concentra-tion is ambiguous—what seem more important are domestic interconnectedness and globalization and the use of some types of derivatives that could add to complexity and interconnectedness.7
the Goal of reforms—Desirable Structures of Financial Intermediation
The new regulatory agenda should aim to reduce the burden of financial distress on the public sector (and ultimately taxpayers), lessen the severity of boom-bust cycles, and sustain growth—that is, make the system “safer” (Viñals and others, 2010; Kodres and Narain, 2010; and Chapter 4). The agenda involves making financial institutions less complex and more transparent and lowering the incentives for them to take excessive risk. Hence, financial policies should aim to move the financial system to more desirable structures along the following dimensions: • A more transparent financial system with better gov-
ernance—one in which both regulatory authorities and investors understand the location of risks and the way in which institutions are interconnected. Corporate structures, instruments, and markets should be less opaque and simple enough so that the risks can be properly priced by investors.
• A system with less leverage and hence less prone to boom and bust cycles; and one that reaps the positive aspects of interconnectedness and global-
weak links during a crisis. Bhatia and Bayoumi (2012) show that nongovernmental securities, such as top-rated asset-backed securi-ties (ABS) and mortgage-backed securities (MBS), were used as collateral for funding with a low or zero haircut in U.S. tri-party repo markets. The presence of these securities in the collateral pools triggered mass withdrawals of secured funding to intercon-nected market-making firms during the crisis. A good portion of the 2006–07 spike in securitization consisted of ABS, MBS, collateralized debt obligations (CDO), and resecuritizations. Also, much of the $1.4 trillion asset-backed commercial paper (ABCP) outstanding at the end of 2006 in Europe and the United States was backed by securitization products, including resecuritizations. Most of these highly leveraged products were part of the trend to generate fee income and move loans off of banks’ balance sheets.
7These observations are in line with existing evidence (Ötker-Robe and others, 2011) that large and complex financial institutions that were interconnected had a higher likelihood of distress during the recent crisis; the distress was notably higher for banks with investment and universal banking activities than for commercial banks. Also, see Chapter 4 on evidence that higher domestic interconnectedness increases the probability of crisis.

c h a p t e r 3 T h E R E F O R m AG E N dA: A N I N T E R I m R E P O RT O N P R O G R E S S TOwA R d A S A F E R F I N A N C I A L S YS T E m
International Monetary Fund | October 2012 81
ization (risk diversification and access to finance) while limiting contagion risk and rapid retrench-ment of cross-border flows during crisis.
• Higher and better-quality capital and liquid-ity buffers that enable institutions to withstand distress and that appropriately reflect the systemic risk of their activities.
• A better understanding and oversight of risks in the nonbank financial sector, which has been placed within a perimeter for monitoring and, as needed, regulation. The purpose is to ensure that
contagion is limited between banks and non-banks during a crisis and that the transactions by shadow banks are transparent and allow pricing to reflect risks.
• Systemically important financial institutions that can be resolved in an effective and timely way and with minimum cost to their customers, and, ide-ally no costs to the taxpayer.
In the process of limiting high-risk activities, the positive aspects of the recent financial developments
table 3.1. Financial Structure before the crisis and Financial Stress during the crisis
Structural Indicator, 2003–07Correlation with Financial Stress
Index, 2008–111 Number of Countries
Market-based intermediation 0.34 7Nontraditional bank intermediation 0.23 29
Noninterest income to total income 0.12 44Other earning assets to total assets –0.05 40Other interest-bearing liabilities to total liabilities 0.24 40
Nonbank intermediationLoans and bonds held by nonbanks over loans and bonds held
by financial sector 0.04 22
Use of new financial products 0.35 11Derivatives turnover to GDP 0.28 22Securitization to GDP 0.40 11
Traditional bank-based intermediation –0.41 15Loans and bonds held by banks relative to the overall financial
sector –0.04 22Net interest margin –0.44** 43
Scale and scope 0.21 20Size 0.40** 35Domestic interconnectedness 0.02 20
Wholesale funding ratio 0.16 23Interbank assets to total assets 0.00 32Interbank liabilities to total liabilities –0.10 32
Concentration (share of top three banks) 0.16 42Financial globalization 0.35* 25
Share of foreign banks (number of banks) 0.03 44Total bank foreign assets (in percent of GDP) 0.45** 33Global interconnectedness2 0.48** 42Global interconnectedness on assets 0.47** 42Global interconnectedness on liabilities 0.49** 42
Financial buffers –0.42** 44Liquid assets to deposits and short-term funding –0.12 44Equity to total assets –0.50** 44
Source: IMF staff estimates.
Note: See Annex 3.1 for the description of data and indices. The financial stress index (FSI) is a monthly indicator of national financial system strain. See Cardarelli, Elekdag, and Lall (2011) for advanced economies, and Balakrishnan and others (2009) for emerging market economies. For advanced economies, the FSI is an aggregate of several standardized indicators: banking sector beta, the TED spread, term spreads, stock market returns, stock market volatility, sovereign debt spreads, and exchange market volatility. For emerging market economies, the FSI consists of only five indicators (the TED and term spreads are excluded, and exchange market volatility is replaced with exchange market pressure index). An increase in the FSI denotes higher stress.
1** and * denote statistical significance at the 5 percent and 10 percent levels of confidence.2See Cihák, Muñoz, and Scuzzarella (2012).
G LO B A L F I N A N C I A L S TA B I L I T Y R E P O RT
82 International Monetary Fund | October 2012
should not be lost, as there are clear trade-offs. Non-traditional banking and nonbank financial interme-diation can benefit market depth and broaden access to finance. Diversifying financial intermediation beyond the traditional form of deposit taking and lending has expanded credit and can additionally benefit the economy through a wider dispersion of risks. New, well-conceived products can open up opportunities to price risks, share them among those best able to bear them, and enhance economic activ-ity. However, where risks in market-based finance are not well understood or not transparent—in particular, risks arising from (and underestimating the degree of ) interconnectedness, poor disclosure, undercapitalization, and complexity of financial intermediaries—the result is often costly for the financial system and the wider economy. A desirable financial system would limit these externalities, and policies should be clearly aimed at doing so.
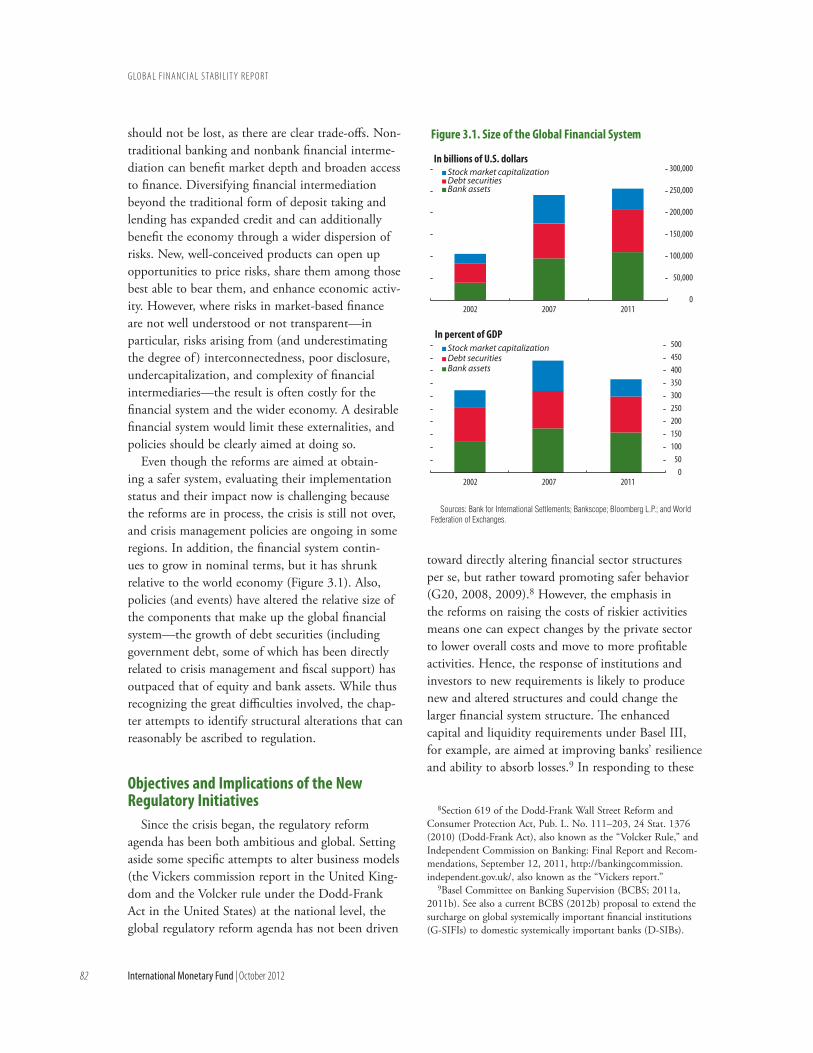
Even though the reforms are aimed at obtain-ing a safer system, evaluating their implementation status and their impact now is challenging because the reforms are in process, the crisis is still not over, and crisis management policies are ongoing in some regions. In addition, the financial system contin-ues to grow in nominal terms, but it has shrunk relative to the world economy (Figure 3.1). Also, policies (and events) have altered the relative size of the components that make up the global financial system—the growth of debt securities (including government debt, some of which has been directly related to crisis management and fiscal support) has outpaced that of equity and bank assets. While thus recognizing the great difficulties involved, the chap-ter attempts to identify structural alterations that can reasonably be ascribed to regulation.
Objectives and Implications of the New regulatory Initiatives
Since the crisis began, the regulatory reform agenda has been both ambitious and global. Setting aside some specific attempts to alter business models (the Vickers commission report in the United King-dom and the Volcker rule under the Dodd-Frank Act in the United States) at the national level, the global regulatory reform agenda has not been driven
toward directly altering financial sector structures per se, but rather toward promoting safer behavior (G20, 2008, 2009).8 However, the emphasis in the reforms on raising the costs of riskier activities means one can expect changes by the private sector to lower overall costs and move to more profitable activities. Hence, the response of institutions and investors to new requirements is likely to produce new and altered structures and could change the larger financial system structure. The enhanced capital and liquidity requirements under Basel III, for example, are aimed at improving banks’ resilience and ability to absorb losses.9 In responding to these
8Section 619 of the Dodd-Frank Wall Street Reform and Consumer Protection Act, Pub. L. No. 111–203, 24 Stat. 1376 (2010) (Dodd-Frank Act), also known as the “Volcker Rule,” and Independent Commission on Banking: Final Report and Recom-mendations, September 12, 2011, http://bankingcommission.independent.gov.uk/, also known as the “Vickers report.”
9Basel Committee on Banking Supervision (BCBS; 2011a, 2011b). See also a current BCBS (2012b) proposal to extend the surcharge on global systemically important financial institutions (G-SIFIs) to domestic systemically important banks (D-SIBs).
0
50,000
100,000
150,000
200,000
250,000
300,000
2002 2007 2011
2002 2007 2011
Stock market capitalizationDebt securitiesBank assets
In billions of U.S. dollars
050
100150200250300350400450500Stock market capitalization
Debt securitiesBank assets
In percent of GDP
Sources: Bank for International Settlements; Bankscope; Bloomberg L.P.; and World Federation of Exchanges.
Figure 3.1. Size of the Global Financial System

c h a p t e r 3 T h E R E F O R m AG E N dA: A N I N T E R I m R E P O RT O N P R O G R E S S TOwA R d A S A F E R F I N A N C I A L S YS T E m
International Monetary Fund | October 2012 83
enhanced requirements as well as to changing busi-ness conditions, banks must decide which activities to keep and how to structure their funding and capital profiles. Investors will in turn decide how they will participate and on what terms. These deci-sions will produce change, much of which is as yet unpredictable.
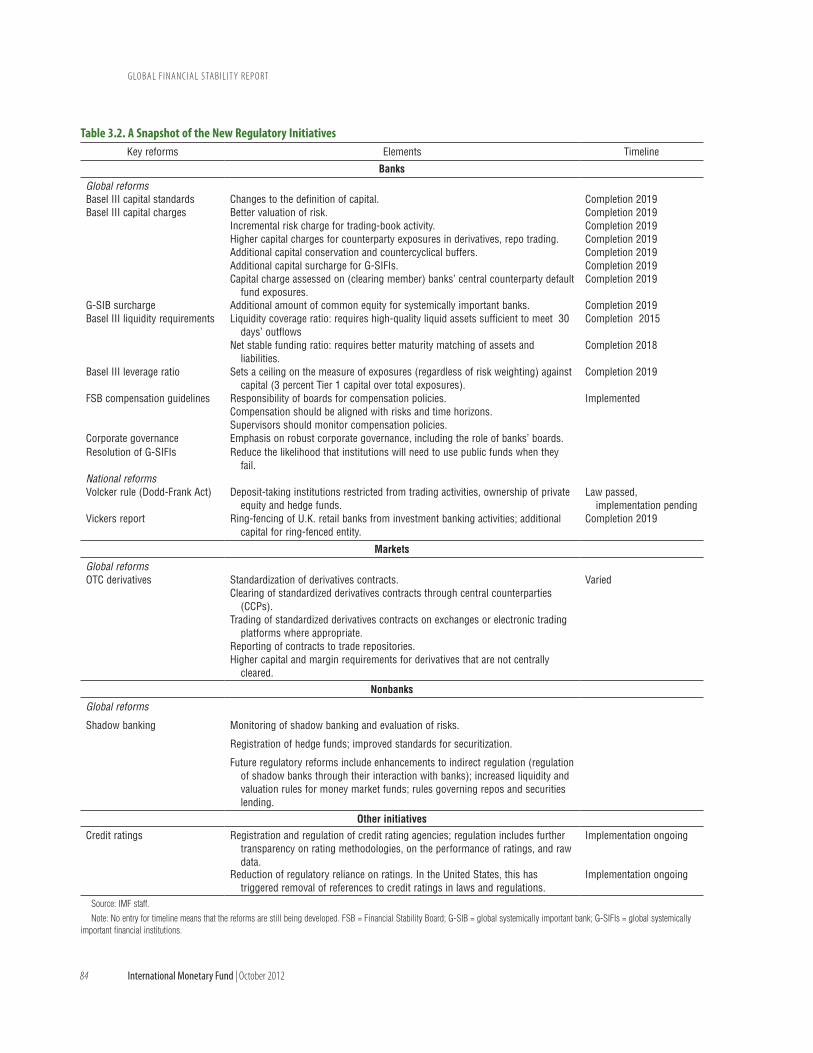
At this stage, as noted, an analysis is complicated: Some crucial elements of the reform are yet to be finalized, and many have not yet been implemented. This leaves open the possibility of differences in their implementation or application, particularly as they trickle down from the international to the national level. Nevertheless, assessments of the economic costs and benefits, both transitional and long term, of the Basel III capital and liquidity standards have shown that the long-term benefits vastly exceed the transi-tional costs (BCBS, 2010a; MAG, 2010). In addition, BCBS (2012a) and the European Banking Authority (EBA; 2012) report the impact of the Basel III capital and liquidity measures on the soundness (capital ratios) and liquidity of a sample of global and regional banks from advanced and emerging market econo-mies. This chapter adds to these studies by attempting to directly assess the impact of the reforms on finan-cial intermediation structures.10 Table 3.2 provides a snapshot of the new regulatory initiatives, and Annex 3.2 summarizes the regulatory proposals whose goals and implications are discussed here.11
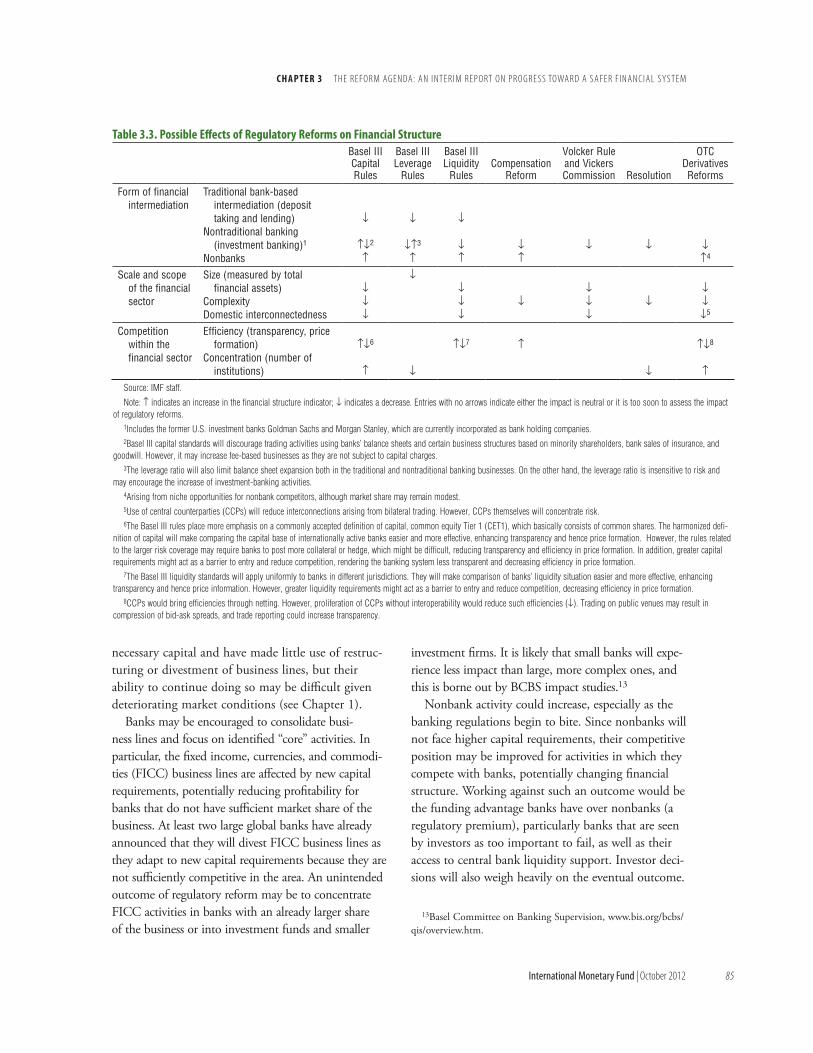
Acknowledging that these are early days in the reform agenda, we set out below the key regulatory goals and their potential impact on financial struc-ture. Table 3.2 provides a snapshot of the new regu-latory initiatives (which are set out in more detail in Annex 3.2); Table 3.3 summarizes our conclusions about the potential outcomes.
Banks
Capital
The new capital rules are designed to improve the “loss absorbency” of capital—creating additional
10Chapter 4 takes the additional step and attempts to link the structures to economic outcomes.
11See Table 3.8 on the status of implementation in 12 econo-mies and the European Union.
buffers that allow an institution to incur losses without being forced into insolvency or without liability holders becoming concerned about solvency. The new rules tighten the definition of capital, alter the risk weights assigned to various assets to better align them with the risk incurred, and raise the capital ratios themselves. A leverage ratio is being added as a separate backstop to risk-weighted capital. Global systemically important banks (G-SIBs) will be subject to additional capital requirements, usually referred to as a surcharge (BCBS, 2011c).
Banks can adjust to higher capital standards through a range of means. These would include reducing the payout of dividends and retaining more profits, raising equity, reducing balance sheet size, including by shedding assets, and changing asset composition. Through these changes, and depend-ing upon the ability to raise capital, the broader outcomes could include restructuring business lines, tightening credit availability, and increasing the cost of credit (Santos and Elliott, 2012).
Balance sheet optimization, in the face of higher capital charges, may drive change. The higher capital charges encourage banks to deemphasize activities that “consume” higher risk-weighted assets (RWAs), such as direct exposures, and increase activities that are more efficient from an RWA perspective, such as fee-generating business (especially relevant for banks accredited under the advanced Basel II approaches). Higher capital charges against positions in the trad-ing book and for over-the-counter (OTC) derivatives counterparty risk have increased the amounts needed for these riskier activities and could lead to a change in the asset composition from higher RWAs to lower ones.12
Early evidence suggests banks may be adjusting to capital requirements through “derisking” rather than “deleveraging.” Banks have been able to build regula-tory capital by substituting assets (taking on assets that need less required capital) or retaining earnings. The outcome of the recent exercise by the EBA to create additional capital buffers in the face of market stress is illustrative. So far, the EBA exercise has revealed that most banks have been able to raise the
12Exceptions are made for nonfinancial corporations as coun-terparties; these exceptions differ by jurisdiction.
G LO B A L F I N A N C I A L S TA B I L I T Y R E P O RT
84 International Monetary Fund | October 2012
table 3.2. a Snapshot of the New regulatory InitiativesKey reforms Elements Timeline
Banks
Global reformsBasel III capital standards Changes to the definition of capital. Completion 2019Basel III capital charges Better valuation of risk.
Incremental risk charge for trading-book activity.Higher capital charges for counterparty exposures in derivatives, repo trading.Additional capital conservation and countercyclical buffers.Additional capital surcharge for G-SIFIs.Capital charge assessed on (clearing member) banks’ central counterparty default
fund exposures.
Completion 2019Completion 2019Completion 2019Completion 2019Completion 2019Completion 2019
G-SIB surcharge Additional amount of common equity for systemically important banks. Completion 2019Basel III liquidity requirements Liquidity coverage ratio: requires high-quality liquid assets sufficient to meet 30
days’ outflowsCompletion 2015
Net stable funding ratio: requires better maturity matching of assets and liabilities.
Completion 2018
Basel III leverage ratio Sets a ceiling on the measure of exposures (regardless of risk weighting) against capital (3 percent Tier 1 capital over total exposures).
Completion 2019
FSB compensation guidelines Responsibility of boards for compensation policies. ImplementedCompensation should be aligned with risks and time horizons.Supervisors should monitor compensation policies.
Corporate governance Emphasis on robust corporate governance, including the role of banks’ boards.Resolution of G-SIFIs Reduce the likelihood that institutions will need to use public funds when they
fail.National reformsVolcker rule (Dodd-Frank Act) Deposit-taking institutions restricted from trading activities, ownership of private
equity and hedge funds.Law passed,
implementation pendingVickers report Ring-fencing of U.K. retail banks from investment banking activities; additional
capital for ring-fenced entity.Completion 2019
Markets
Global reformsOTC derivatives Standardization of derivatives contracts.
Clearing of standardized derivatives contracts through central counterparties (CCPs).
Trading of standardized derivatives contracts on exchanges or electronic trading platforms where appropriate.
Reporting of contracts to trade repositories.Higher capital and margin requirements for derivatives that are not centrally
cleared.
Varied
Nonbanks
Global reforms
Shadow banking Monitoring of shadow banking and evaluation of risks.
Registration of hedge funds; improved standards for securitization.
Future regulatory reforms include enhancements to indirect regulation (regulation of shadow banks through their interaction with banks); increased liquidity and valuation rules for money market funds; rules governing repos and securities lending.
Other initiativesCredit ratings Registration and regulation of credit rating agencies; regulation includes further
transparency on rating methodologies, on the performance of ratings, and raw data.
Implementation ongoing
Reduction of regulatory reliance on ratings. In the United States, this has triggered removal of references to credit ratings in laws and regulations.
Implementation ongoing
Source: IMF staff.
Note: No entry for timeline means that the reforms are still being developed. FSB = Financial Stability Board; G-SIB = global systemically important bank; G-SIFIs = global systemically important financial institutions.
c h a p t e r 3 T h E R E F O R m AG E N dA: A N I N T E R I m R E P O RT O N P R O G R E S S TOwA R d A S A F E R F I N A N C I A L S YS T E m
International Monetary Fund | October 2012 85
necessary capital and have made little use of restruc-turing or divestment of business lines, but their ability to continue doing so may be difficult given deteriorating market conditions (see Chapter 1).
Banks may be encouraged to consolidate busi-ness lines and focus on identified “core” activities. In particular, the fixed income, currencies, and commodi-ties (FICC) business lines are affected by new capital requirements, potentially reducing profitability for banks that do not have sufficient market share of the business. At least two large global banks have already announced that they will divest FICC business lines as they adapt to new capital requirements because they are not sufficiently competitive in the area. An unintended outcome of regulatory reform may be to concentrate FICC activities in banks with an already larger share of the business or into investment funds and smaller
investment firms. It is likely that small banks will expe-rience less impact than large, more complex ones, and this is borne out by BCBS impact studies.13
Nonbank activity could increase, especially as the banking regulations begin to bite. Since nonbanks will not face higher capital requirements, their competitive position may be improved for activities in which they compete with banks, potentially changing financial structure. Working against such an outcome would be the funding advantage banks have over nonbanks (a regulatory premium), particularly banks that are seen by investors as too important to fail, as well as their access to central bank liquidity support. Investor deci-sions will also weigh heavily on the eventual outcome.
13Basel Committee on Banking Supervision, www.bis.org/bcbs/qis/overview.htm.
table 3.3. possible effects of regulatory reforms on Financial StructureBasel III Capital Rules
Basel III Leverage
Rules
Basel III Liquidity
RulesCompensation
Reform
Volcker Rule and Vickers Commission Resolution
OTC Derivatives Reforms
Form of financial intermediation
Traditional bank-based intermediation (deposit taking and lending)
Nontraditional banking (investment banking)1
Nonbanks
↓
↑↓2
↑
↓
↓↑3
↑
↓
↓↑
↓↑
↓ ↓ ↓↑4
Scale and scope of the financial sector
Size (measured by total financial assets)
ComplexityDomestic interconnectedness
↓↓↓
↓↓↓↓
↓↓↓↓
↓↓↓↓5
Competition within the financial sector
Efficiency (transparency, price formation)
Concentration (number of institutions)
↑↓6
↑ ↓
↑↓7 ↑
↓
↑↓8
↑Source: IMF staff.
Note: ↑ indicates an increase in the financial structure indicator; ↓ indicates a decrease. Entries with no arrows indicate either the impact is neutral or it is too soon to assess the impact of regulatory reforms.
1Includes the former U.S. investment banks Goldman Sachs and Morgan Stanley, which are currently incorporated as bank holding companies.2Basel III capital standards will discourage trading activities using banks’ balance sheets and certain business structures based on minority shareholders, bank sales of insurance, and
goodwill. However, it may increase fee-based businesses as they are not subject to capital charges.3The leverage ratio will also limit balance sheet expansion both in the traditional and nontraditional banking businesses. On the other hand, the leverage ratio is insensitive to risk and
may encourage the increase of investment-banking activities.4Arising from niche opportunities for nonbank competitors, although market share may remain modest.5Use of central counterparties (CCPs) will reduce interconnections arising from bilateral trading. However, CCPs themselves will concentrate risk.6The Basel III rules place more emphasis on a commonly accepted definition of capital, common equity Tier 1 (CET1), which basically consists of common shares. The harmonized defi-
nition of capital will make comparing the capital base of internationally active banks easier and more effective, enhancing transparency and hence price formation. However, the rules related to the larger risk coverage may require banks to post more collateral or hedge, which might be difficult, reducing transparency and efficiency in price formation. In addition, greater capital requirements might act as a barrier to entry and reduce competition, rendering the banking system less transparent and decreasing efficiency in price formation.
7The Basel III liquidity standards will apply uniformly to banks in different jurisdictions. They will make comparison of banks’ liquidity situation easier and more effective, enhancing transparency and hence price information. However, greater liquidity requirements might act as a barrier to entry and reduce competition, decreasing efficiency in price formation.
8CCPs would bring efficiencies through netting. However, proliferation of CCPs without interoperability would reduce such efficiencies (↓). Trading on public venues may result in compression of bid-ask spreads, and trade reporting could increase transparency.

G LO B A L F I N A N C I A L S TA B I L I T Y R E P O RT
86 International Monetary Fund | October 2012
The more restrictive definition of what constitutes capital will also have an impact, mostly in advanced economies. For example, “carve outs” from capital (partial spin-offs), such as equity ownership of insur-ance companies, will have a direct impact on group structures and exposures and should work to make groups more transparent and less complex. These structural changes are already under way (Box 3.2). Reducing the use of goodwill and deferred tax assets and other intangibles will increase costs for banks and could also be expected to affect size and activity, but it may also have a positive impact on efficiency as a result of simpler organizational structures. The restriction on the eligibility of hybrid instruments is also having an effect on U.S. banks (Box 3.3). For instance, large U.S. banks have a large proportion of trust-preferred securities (TRuPs) that counted as Tier 1 capital under existing rules but will be phased out under Basel III.
For emerging market economies, the definition of capital will not represent significant change in practice. In these economies, there are few alterna-tives to equity; common equity has always been the major component of capital. The reaction of parent banks to new requirements, particularly the Basel III and G-SIB surcharges (see below) may, however, be a source of change. If parent banks react by reducing their exposure to emerging market and developing economies as a means of deleveraging, this will change local structures, although to date these effects have not been detected (see Box 3.2; and G20, 2012).
Liquidity
Basel III also aims to ensure that an institution can withstand a short-term severe liquidity freeze and to create a more sustainable maturity matching of assets to liabilities. The new liquidity ratios will require many banks to hold more short-term, high-quality assets or pay higher rates by tapping long-term funding sources. The liquidity coverage ratio (LCR) creates a strong demand for short-term, liquid government securities, while the net stable funding ratio (NSFR) promotes the growth of stable deposits and the issuance of long-term liabilities.14
14BCBS (2010b).The demand for “safe” assets from this source (and others) and its implications for financial stability are dis-cussed in IMF (2012b).
Banks that focus on commercial banking with a stable retail deposit base, particularly smaller banks, would be considerably less affected than those that focus on investment banking, with universal banks falling in between.15 Banks will consider how to construct the most efficient liquidity profiles under these requirements—with a drive toward lengthen-ing deposit offerings and possibly competing more strongly for those deposits. As with capital, nonbank financial institutions are largely unaffected by these changes and therefore could benefit from a move-ment of business in their direction provided inves-tors are willing to fund nonbanks in these activities. Liquidity requirements may increase the cost of operating in some jurisdictions and may therefore reduce cross-border activity or prompt changes to banking group structures.
Business Model Restrictions
The purpose of restricting business activities is to reduce systemic risk by prohibiting deposit-funded banks from engaging in certain investment banking businesses that are deemed to be too risky. So far, these restrictions have been addressed at the national level: They have already been adopted in the United States (regulations pending) and envisaged in the United Kingdom. Broader discussions on their design and effectiveness have not taken place.
The Volcker rule, in the United States, is intended to force banks to divest trading businesses—reducing their nontraditional revenues as a consequence—which would be picked up primarily by the nonbank sector and also by stand-alone investment banks, should the latter reenter the U.S. financial landscape in the longer run (see Chapter 1, Box 1.3). The result would be less connected, less complex, and smaller banks. The rule is now law but implementa-tion through regulation is pending. Implementa-tion of the rule will be a challenge to prudential authorities; and an inability to clearly distinguish permissible activities (market making and underwrit-ing) from prohibited ones (proprietary trading) may mitigate the impact of the rule.
15See IMF (2011b) for a discussion of the effect of the NSFR on different types of banks.
c h a p t e r 3 T h E R E F O R m AG E N dA: A N I N T E R I m R E P O RT O N P R O G R E S S TOwA R d A S A F E R F I N A N C I A L S YS T E m
International Monetary Fund | October 2012 87
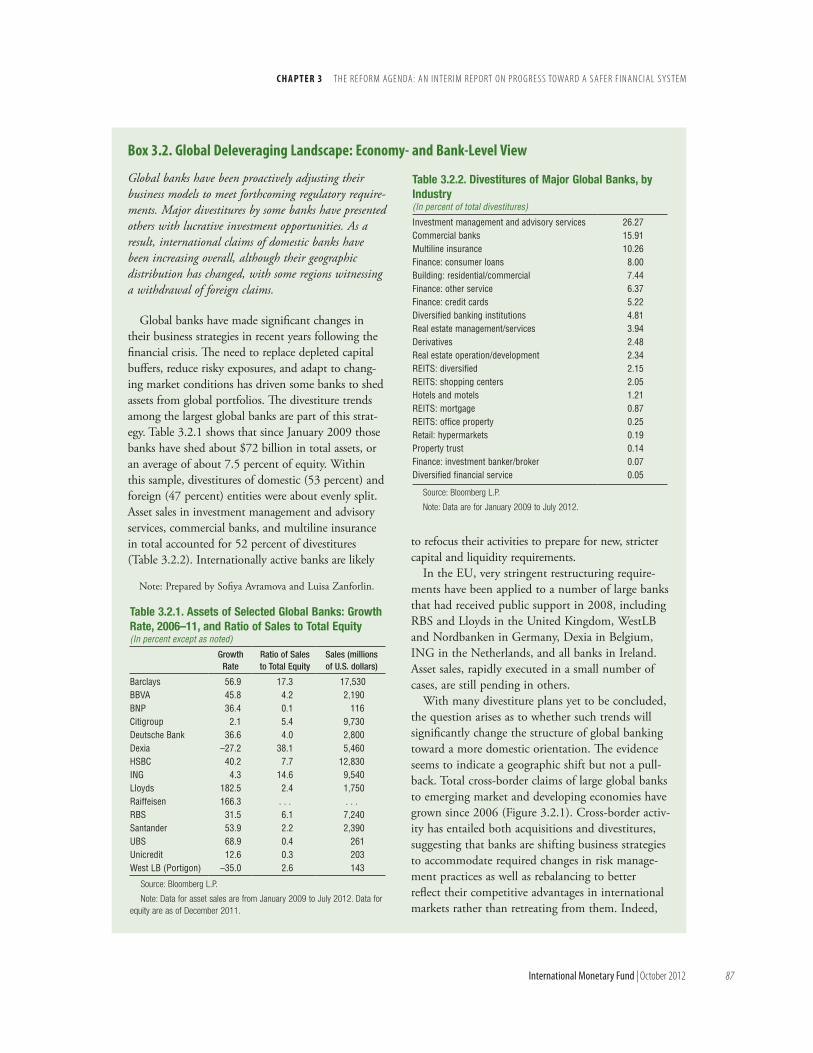
Global banks have been proactively adjusting their business models to meet forthcoming regulatory require-ments. Major divestitures by some banks have presented others with lucrative investment opportunities. As a result, international claims of domestic banks have been increasing overall, although their geographic distribution has changed, with some regions witnessing a withdrawal of foreign claims.
Global banks have made significant changes in their business strategies in recent years following the financial crisis. The need to replace depleted capital buffers, reduce risky exposures, and adapt to chang-ing market conditions has driven some banks to shed assets from global portfolios. The divestiture trends among the largest global banks are part of this strat-egy. Table 3.2.1 shows that since January 2009 those banks have shed about $72 billion in total assets, or an average of about 7.5 percent of equity. Within this sample, divestitures of domestic (53 percent) and foreign (47 percent) entities were about evenly split. Asset sales in investment management and advisory services, commercial banks, and multiline insurance in total accounted for 52 percent of divestitures (Table 3.2.2). Internationally active banks are likely
to refocus their activities to prepare for new, stricter capital and liquidity requirements.
In the EU, very stringent restructuring require-ments have been applied to a number of large banks that had received public support in 2008, including RBS and Lloyds in the United Kingdom, WestLB and Nordbanken in Germany, Dexia in Belgium, ING in the Netherlands, and all banks in Ireland. Asset sales, rapidly executed in a small number of cases, are still pending in others.
With many divestiture plans yet to be concluded, the question arises as to whether such trends will significantly change the structure of global banking toward a more domestic orientation. The evidence seems to indicate a geographic shift but not a pull-back. Total cross-border claims of large global banks to emerging market and developing economies have grown since 2006 (Figure 3.2.1). Cross-border activ-ity has entailed both acquisitions and divestitures, suggesting that banks are shifting business strategies to accommodate required changes in risk manage-ment practices as well as rebalancing to better reflect their competitive advantages in international markets rather than retreating from them. Indeed,
Box 3.2. Global Deleveraging Landscape: economy- and Bank-Level View
Table 3.2.1. Assets of Selected Global Banks: Growth Rate, 2006–11, and Ratio of Sales to Total Equity(In percent except as noted)
Growth Rate
Ratio of Sales to Total Equity
Sales (millions of U.S. dollars)
Barclays 56.9 17.3 17,530BBVA 45.8 4.2 2,190BNP 36.4 0.1 116Citigroup 2.1 5.4 9,730Deutsche Bank 36.6 4.0 2,800Dexia –27.2 38.1 5,460HSBC 40.2 7.7 12,830ING 4.3 14.6 9,540Lloyds 182.5 2.4 1,750Raiffeisen 166.3 . . . . . .RBS 31.5 6.1 7,240Santander 53.9 2.2 2,390UBS 68.9 0.4 261Unicredit 12.6 0.3 203West LB (Portigon) –35.0 2.6 143
Source: Bloomberg L.P.
Note: Data for asset sales are from January 2009 to July 2012. Data for equity are as of December 2011.
Note: Prepared by Sofiya Avramova and Luisa Zanforlin.
Table 3.2.2. Divestitures of Major Global Banks, by Industry(In percent of total divestitures)
Investment management and advisory services 26.27Commercial banks 15.91Multiline insurance 10.26Finance: consumer loans 8.00Building: residential/commercial 7.44Finance: other service 6.37Finance: credit cards 5.22Diversified banking institutions 4.81Real estate management/services 3.94Derivatives 2.48Real estate operation/development 2.34REITS: diversified 2.15REITS: shopping centers 2.05Hotels and motels 1.21REITS: mortgage 0.87REITS: office property 0.25Retail: hypermarkets 0.19Property trust 0.14Finance: investment banker/broker 0.07Diversified financial service 0.05
Source: Bloomberg L.P.
Note: Data are for January 2009 to July 2012.

G LO B A L F I N A N C I A L S TA B I L I T Y R E P O RT
88 International Monetary Fund | October 2012
In the United Kingdom, the retail ring-fence proposed by the Vickers commission (ICB, 2011) would allow a group to maintain all business lines but seeks to make U.K. retail banking businesses more resilient and insulated from trading risk by requiring more capital. The Vickers recommenda-tions are to be included in forthcoming legislation and implemented through 2019. As retail ring-fencing is limited to the United Kingdom, it may have little, if any, effect on the cross-border activity
of internationally active U.K. banks. One outcome could be that some U.K. banks divest trading activi-ties—with an impact on nontraditional banking revenues, bank size, complexity, and interconnected-ness—given the increased capital and liquidity costs. To the extent that ring-fencing is seen as remov-ing or reducing an implicit government guarantee, activities that were only sustainable with the benefit of such a guarantee would also be wound down. However, these effects could be mitigated by large
to date, there is little sign that international activi-ties (of the financial institutions in BIS reporting countries) are declining, even though there was a pullback in 2008.
Gross international claims of domestic banks on their foreign offices are significantly higher than at the end of 2006, before the onset of the global financial crisis. Even for those few econo-mies where gross claims appear to have fallen (such as Austria), net international exposures have remained constant, suggesting that subsidiaries are funding themselves locally. But on average, financial institutions have maintained the same level of exposure to international activities that they had before the crisis. These observations are in line with the data in BIS (2012a).
For individual financial institutions, the amount of total international claims on a consolidated basis sug-gests that international activity continues to be signif-icantly above its 2006 level. Significant deleveraging activity persists for some banks, especially those in Spain and the United Kingdom with respect to their activities in developed economies and those in Bel-gium and Sweden with respect to emerging Europe. However, overall, claims to developing economies continue to be quite robust. Banks in some econo-mies are changing the composition of their exposures in regions where they are already prominent (e.g., Spain from Latin America) while other economies are picking up the slack (France, Germany, and the United Kingdom). One explanation may be that rela-tively healthy, internationally active banks have taken advantage of favorable market conditions to restruc-ture their business toward different areas. This has shifted international exposures across banking sectors but has not lessened global financial interlinkages. In line with these trends, new acquirers from some large emerging market economies have entered western European and Latin American banking markets.
Box 3.2 (continued)
Figure 3.2.1. Growth in Total Foreign Claims from 2006 to 2011(In percent; 2006 and 2011 totals in billions of U.S. dollars)
Source: Bank for International Settlements.
73
1215
85
510Advanced Europe
2011$735.5
2006$545.7
53
10
37
52
12
36
France and Germany
$542.8$311.2
1512
73
818
74
Japan
2011
2006
$286
$108
2
98
0
9
89
2Spain
2011
821
71
9
20
71
United Kingdom
20112006$681.9$297.9
13
3651
11
37
52
United States
20112006$340 $419.7
20112006
2006$467$223.8
Emerging EuropeLatin AmericaEmerging Asia and Paci�c
c h a p t e r 3 T h E R E F O R m AG E N dA: A N I N T E R I m R E P O RT O N P R O G R E S S TOwA R d A S A F E R F I N A N C I A L S YS T E m
International Monetary Fund | October 2012 89
banks’ funding advantage, economies of scale, and the tendency to concentration.
Compensation and Governance
Compensation reforms aim to better align the incentives of key employees and managers with the longer-term stability of institutions and markets. These reforms could improve risk measurement,
monitoring, and management of financial institu-tions. Compensating employees on the basis of both risk and return will require more information about risk. In the long term, the reforms could also make business operations less risky, smaller in scale, and less complex as a result of more active and appro-priate governance and the alignment of employee compensation with risks. The “Principles for Sound
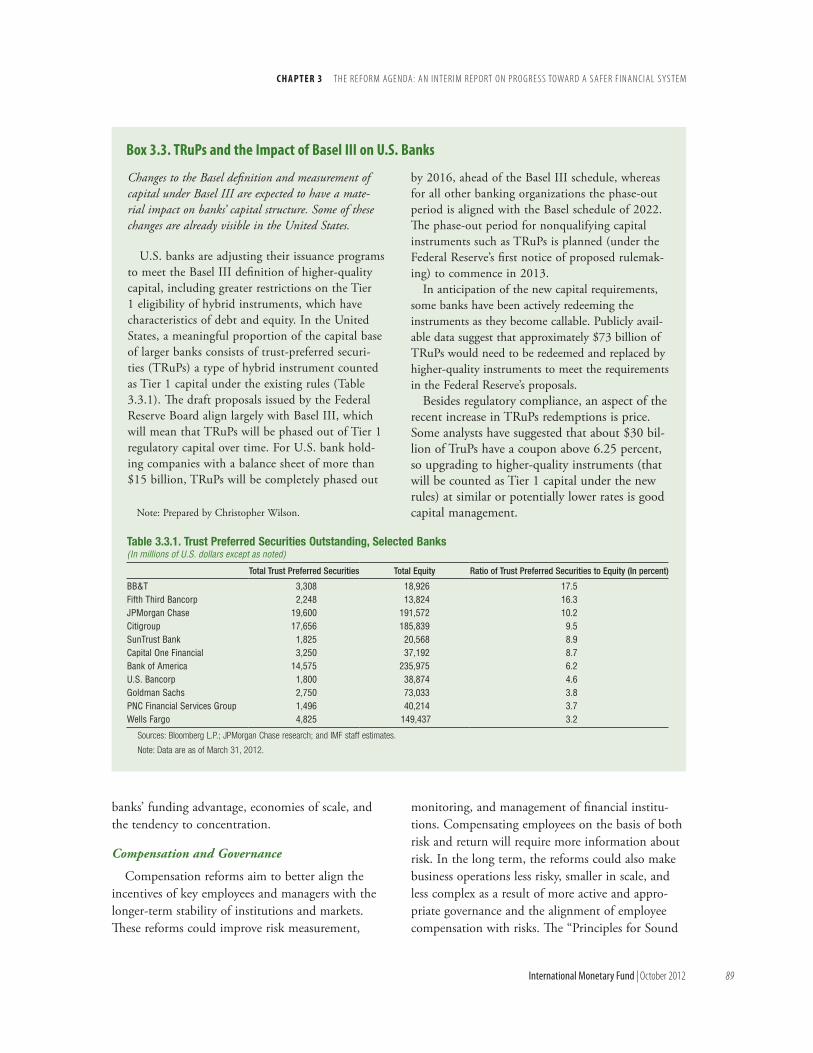
Changes to the Basel definition and measurement of capital under Basel III are expected to have a mate-rial impact on banks’ capital structure. Some of these changes are already visible in the United States.
U.S. banks are adjusting their issuance programs to meet the Basel III definition of higher-quality capital, including greater restrictions on the Tier 1 eligibility of hybrid instruments, which have characteristics of debt and equity. In the United States, a meaningful proportion of the capital base of larger banks consists of trust-preferred securi-ties (TRuPs) a type of hybrid instrument counted as Tier 1 capital under the existing rules (Table 3.3.1). The draft proposals issued by the Federal Reserve Board align largely with Basel III, which will mean that TRuPs will be phased out of Tier 1 regulatory capital over time. For U.S. bank hold-ing companies with a balance sheet of more than $15 billion, TRuPs will be completely phased out
by 2016, ahead of the Basel III schedule, whereas for all other banking organizations the phase-out period is aligned with the Basel schedule of 2022. The phase-out period for nonqualifying capital instruments such as TRuPs is planned (under the Federal Reserve’s first notice of proposed rulemak-ing) to commence in 2013.
In anticipation of the new capital requirements, some banks have been actively redeeming the instruments as they become callable. Publicly avail-able data suggest that approximately $73 billion of TRuPs would need to be redeemed and replaced by higher-quality instruments to meet the requirements in the Federal Reserve’s proposals.
Besides regulatory compliance, an aspect of the recent increase in TRuPs redemptions is price. Some analysts have suggested that about $30 bil-lion of TruPs have a coupon above 6.25 percent, so upgrading to higher-quality instruments (that will be counted as Tier 1 capital under the new rules) at similar or potentially lower rates is good capital management.
Box 3.3. trups and the Impact of Basel III on U.S. Banks
Note: Prepared by Christopher Wilson.
Table 3.3.1. Trust Preferred Securities Outstanding, Selected Banks(In millions of U.S. dollars except as noted)
Total Trust Preferred Securities Total Equity Ratio of Trust Preferred Securities to Equity (In percent)
BB&T 3,308 18,926 17.5Fifth Third Bancorp 2,248 13,824 16.3JPMorgan Chase 19,600 191,572 10.2Citigroup 17,656 185,839 9.5SunTrust Bank 1,825 20,568 8.9Capital One Financial 3,250 37,192 8.7Bank of America 14,575 235,975 6.2U.S. Bancorp 1,800 38,874 4.6Goldman Sachs 2,750 73,033 3.8PNC Financial Services Group 1,496 40,214 3.7Wells Fargo 4,825 149,437 3.2
Sources: Bloomberg L.P.; JPMorgan Chase research; and IMF staff estimates.
Note: Data are as of March 31, 2012.

G LO B A L F I N A N C I A L S TA B I L I T Y R E P O RT
90 International Monetary Fund | October 2012
Compensation Practices,” developed in 2009 by the Financial Stability Forum and its successor, the Financial Stability Board (FSB), are expected to be implemented by all significant financial institutions in the world.16 In practice, however, a number of jurisdictions limit their application to banks or other regulated financial institutions, and some limit their application to institutions of a particular size.
Bank Resolution
The global regulatory reform agenda has included an emphasis on the recovery and resolution of banks. In particular, the FSB has articulated the “Key Attributes of Effective Resolution Regimes for Financial Institutions,” which contain a number of recommendations to strengthen economies’ resolu-tion regimes and to make large complex financial institutions more resolvable (FSB, 2011a). The introduction of crisis management groups and recov-ery and resolution planning under these reforms increases the transparency of financial groups and may reduce complexity depending on the responses of both institutions and supervisors to what emerges in these processes.
Key resolution issues that may affect financial sec-tor structure are the efforts to impose burden sharing on unsecured debt holders who may have their hold-ings converted to equity at particular trigger points, including “bail in” at the point of unviability. These features may have an impact on the funding profile of banks, cost of funding, and the development of funding instruments. This will depend on both the implementation of this reform and investor reaction to it.
Otc Derivatives reforms
Much of the OTC derivatives reform agenda is meant to increase transparency, mitigate systemic risk, and protect customers against market abuse (FSB, 2012b). The most far-reaching aspect of the agenda is the movement of some types of OTC contracts to clearing through central counterpar-
16The original statement of the standards (FSF, 2009) is at www.financialstabilityboard.org/list/fsb_publications/tid_123/index.htm along with subsequent FSB publications on the standards.
ties (CCPs) for non-cleared trades. Although this reduces bilateral exposures, it increases the impor-tance of CCPs to the structure of the financial sector and will have a direct impact on whether and how institutions participate in these markets. Banks and nonbanks active as dealers in OTC derivatives trad-ing may find their costs higher and some of their revenues lower as the tailored derivatives business increasingly moves to low-margin standardized forms. The actual impact on structures will depend, however, on the extent and speed of the change, how clearing infrastructures are set up, and decisions by authorities on which types of OTC derivatives con-tracts will be subject to mandatory central clearing. In addition, increased use of trade repositories could open the door for enhanced transparency.
From a system-wide perspective, the main effect of these reforms will be to shift some types of risks to CCPs with the aim of improving the resiliency of the financial system.17 Concentration of counter-party risk in CCPs can make these entities systemi-cally important (in the United States, for example, some have already been designated as such). This necessitates careful regulation and oversight as well as establishment of credible liquidity backstops for potential clearing member defaults.18 If risks become concentrated in a very few CCPs—or a single CCP—(without appropriate risk-management sys-tems and well-designed default funds) these entities could become too important to fail. Use of multiple CCPs reduces the multilateral netting benefits and puts additional pressure on safe assets, because the inability to net transactions across CCPs will neces-sitate posting more collateral. If not appropriately managed and backstopped, CCPs in distress could reintroduce systemic risks to the financial system. Work is under way to address such issues; the FSB and the International Organization of Securities Commissions and the Committee on Payment and
17See IMF (2010) for an in-depth treatment of OTC deriva-tives and use of CCPs.
18The safeguard on liquidity provision developed by the FSB envisages a regime that ensures there are no technical obstacles for the timely provision of emergency liquidity assistance by central banks to solvent and viable CCPs (without precommitting to the provision of this liquidity). See Conclusions by the Economic Consultative Committee (ECC) of the Bank for International Settlements (FSB, 2012b).
c h a p t e r 3 T h E R E F O R m AG E N dA: A N I N T E R I m R E P O RT O N P R O G R E S S TOwA R d A S A F E R F I N A N C I A L S YS T E m
International Monetary Fund | October 2012 91
Settlement Systems (IOSCO-CPSS) have issued guidance, “four safeguards,” to mitigate these sys-temic concerns (FSB, 2012b).
Although CCPs can broaden the use of derivatives by end users, the rules governing clearing mem-bership could alter financial structures by further concentrating the benefits of these financial transac-tions in a small number of firms. In some CCPs, the clearing members are the same large financial institu-tions in which trading of OTC derivatives is concen-trated, potentially reinforcing a lack of competition in the OTC market if not governed and regulated properly. That said, clearing membership in CCPs typically requires all remaining members to assume the losses imposed by a defaulting member, thereby mutualizing the risks. Even with this mechanism in place, adequately regulating CCPs is very important from the systemic point of view.
Nonbanks: Shadow Banking
Efforts to address shadow banking—credit inter-mediation activities in the nonbanking sector—are meant to ensure that these activities are monitored and, if they are found to pose systemic risk, that robust prudential regulation and supervision are considered. Reforms, led by the FSB, are at a very early stage (both at the international and domestic levels), and a firm consensus has yet to emerge on what, if any, regulatory action is needed.19 Bank and nonbank regulators have given increased attention to interconnectedness and systemic risk beyond the banking sector. Data limitations are a key impedi-ment to progress on these issues and might curtail the ability of regulators to identify shadow banking entities.20
19See the FSB reports, “Shadow Banking: Scoping the Issues” (2011b) and “Strengthening the Oversight and Regulation of Shadow Banking” (2012a).
20The Data Gaps Initiative, endorsed by the G20 and the IMF’s International Monetary and Financial Committee (see www.imf.org/external/np/g20/pdf/102909.pdf ) aims to fill data gaps revealed by the global crisis. Its 20 recommendations include monitoring systemic risks arising from shadow banks and G-SIFIs. In cooperation with the members of the Interagency Group on Economic and Financial Statistics, a great deal of work is in progress, including improving data collecting and sharing information on G-SIFIs as well as monitoring the cross-border activities of nonbank financial institutions (see www.principal-
In jurisdictions where shadow banking is more readily identified, policymakers have taken some ini-tial steps to address risks. For example, rules shorten-ing the maturity of U.S. money market fund assets have been effective. However, the recent inability to enact reforms to U.S. money market funds proposed by staff of the Securities and Exchange Commission was a setback to a possible reduction of systemic risk from this source. However, if new rules reduce the size of the money market funds (by making them less attractive to investors as their returns fall), they would likewise provide less funding for banks.
Other Initiatives
Some other important initiatives that may affect the financial structure are taking place in the insur-ance sector as well as in credit ratings agencies and accounting. Initiatives on group-wide supervision in the insurance sector seek to minimize regulatory arbitrage, reduce contagion risks, and address com-plex group structures that hinder effective supervi-sion. Credit rating reforms aim at achieving better understanding of risks embedded in different prod-ucts and securities. Even though authorities have missed the end-2011 target set by the FSB and the G20 for completing the convergence between the IFRS (International Financial Reporting Standards) and U.S. GAAP (generally accepted accounting prin-ciples), it is expected that convergence and enhance-ment of U.S. and international accounting standards will foster greater comparability of data. Annex 3.2 provides further details on these initiatives.
Summary
The regulatory reform agenda seeks to improve financial sector safety by reducing risks to institu-tions and improving their resilience when risks are realized. It is likely that the impact of the new capital and liquidity requirements will be to favor stable, traditional banking rather than nontraditional banking activities. As a result, some institutions
globalindicators.org/default.aspx). The preparation of templates for a minimum and encouraged set of internationally comparable sectoral accounts and balance sheets is an important step for the collection of data relevant for the analysis of shadow banking.
G LO B A L F I N A N C I A L S TA B I L I T Y R E P O RT
92 International Monetary Fund | October 2012
may become smaller and there may be a migra-tion of nontraditional activities to the nonbanking sector. However, there is also potential for a greater concentration in some nontraditional business lines (for example, FICC) in banks where increased costs can be offset by economies of scale. Reform of OTC derivatives trading should help lower counterparty credit risks and hence potentially lessen some of the disruptive effects of interconnectedness.
Looking ahead, a great deal will depend on whether the higher-risk activity—investment bank-ing and trading—shrinks in size (contrary to current trends) and whether it remains in the banking sector or shifts to nonbank institutions. If activities move out of the banking sector, greater attention to regulation and supervision standards in the nonbank sector will be required to ensure that risks are prop-erly addressed. If risks remain within the banking sector, the effects of increased concentration or the entrenchment of too-important-to-fail institutions will need to be considered.
The major reform proposals, especially capital and liquidity rules, may not have a significant direct effect on emerging market economies. For instance, with regard to the capital rules, common equity has always been the major component of capital in these economies, so a tightening of the definition of capital will therefore have less impact. There may, however, be some other effects on structure: Parent banks in advanced economies may reduce their exposures to emerging market and developing economies as a means of deleveraging in reaction to Basel III and G-SIB surcharges and business model restrictions. Some emerging market economies fear that global banks may no longer make markets in their sovereign or corporate debt, which would lower liquidity and raise their costs of issuance. There is also a concern that a lack of eligible instruments for collateral will impede the effectiveness of the liquidity coverage ratio and also the ability to post collateral at CCPs.
Structural Implications of crisis Intervention Measures
Recent regulatory reforms are not the only influ-ences on the future financial structure. At the height of the global financial crisis, both governments and
central banks in advanced and emerging market economies took various measures to support bank funding, financial intermediation, creditor confidence, and, ultimately, financial stability (Table 3.4).21
• Fiscal measures included guarantees of bank liabilities (retail and wholesale), capital injections, and direct and indirect financial intermedia-tion by governments (through asset purchases or guarantees).
• Central bank measures included cutting policy interest rates to historical lows, broadening lender of last resort facilities,22 strengthening open mar-ket operation frameworks to provide more liquid-ity, asset purchases of private and public securities, and enhancement of multilateral and bilateral foreign exchange swaps between central banks to ensure cross-border intermediation.23
Many measures—particularly those designed to support market functioning and bank funding con-ditions—were designed to be temporary in principle and, indeed, various programs were terminated or scaled down as market conditions improved, although the pace and extent of the exits has differed by economy and region.24
However, the policy responses have been compli-cated by sluggish economic growth and by the inten-sification of sovereign and bank problems in some euro area economies. The slow recovery and new shocks to financial stability in some regions have called for further and more drastic policy actions by the major central banks. These new policies include the ECB’s launch of its Securities Markets Pro-gramme (SMP) to ease sovereign bond stress and its
21For more detailed discussions, see for example Schich and Kim (2011), IMF (2009, 2012b), Borio and Disyatat (2009), and Laeven and Valencia (forthcoming).
22The cuts in policy interest rates were primarily aimed to counter deflation risks and support economic growth. However they also helped lower banks’ funding costs (because a large portion of their liabilities are short term), thus supporting banks’ profitability and rebuilding of capital bases (see Box 3.4 and BIS, 2012a).
23In some emerging market economies, reserve requirements were also relaxed.
24For example, blanket guarantees of deposits were largely terminated by end-2011. Similarly, European arrangements for guarantees for unsecured bank bonds expired by end-2011 (but were replaced with new schemes in 2012).
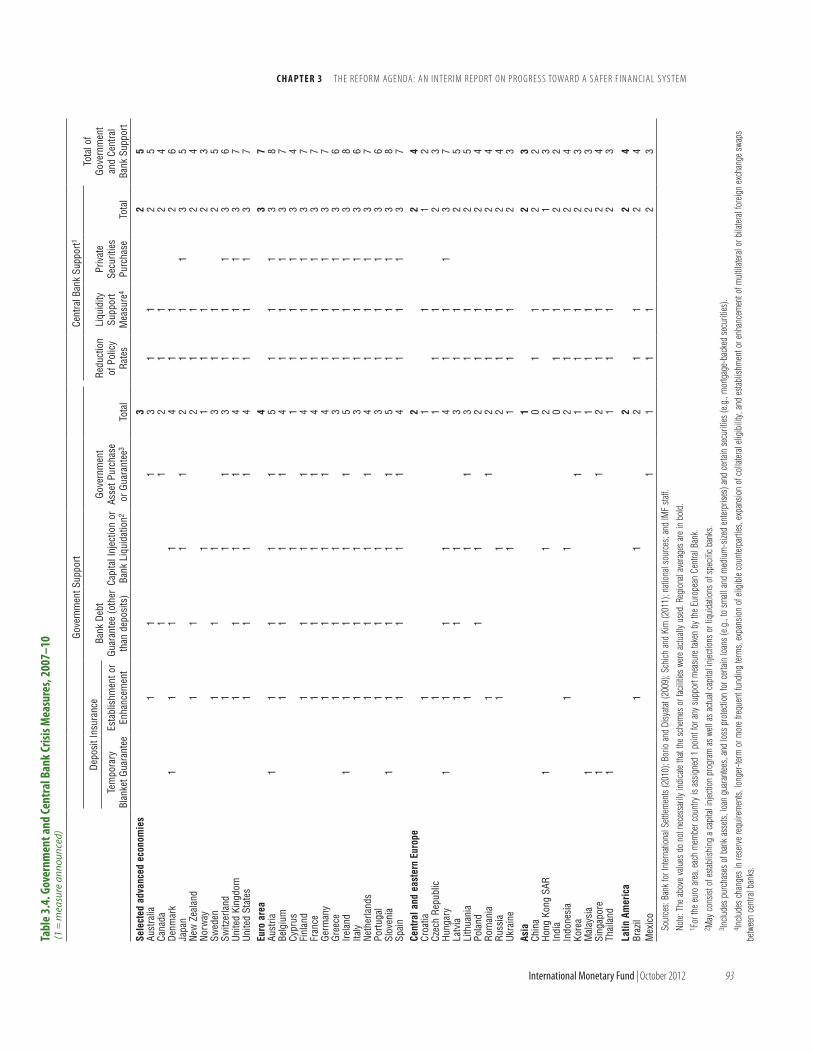
c h a p t e r 3 T h E R E F O R m AG E N dA: A N I N T E R I m R E P O RT O N P R O G R E S S TOwA R d A S A F E R F I N A N C I A L S YS T E m
International Monetary Fund | October 2012 93
tabl
e 3.4
. Gov
ernm
ent a
nd ce
ntra
l Ban
k cris
is M
easu
res,
2007
–10
(1 =
mea
sure
ann
ounc
ed)
Gove
rnm
ent S
uppo
rtCe
ntra
l Ban
k Su
ppor
t1
Tota
l of
Gove
rnm
ent
and
Cent
ral
Bank
Sup
port
Depo
sit I
nsur
ance
Bank
Deb
t Gu
aran
tee
(oth
er
than
dep
osits
)Ca
pita
l Inj
ectio
n or
Ba
nk L
iqui
datio
n2
Gove
rnm
ent
Asse
t Pur
chas
e or
Gua
rant
ee3
Tota
l
Redu
ctio
n of
Pol
icy
Rate
s
Liqu
idity
Su
ppor
t M
easu
re4
Priv
ate
Secu
ritie
s Pu
rcha
seTo
tal
Tem
pora
ry
Blan
ket G
uara
ntee
Esta
blis
hmen
t or
Enha
ncem
ent
Sele
cted
adv
ance
d ec
onom
ies
32
5Au
stra
lia1
11
31
12
5Ca
nada
11
21
12
4De
nmar
k1
11
14
11
26
Japa
n1
12
11
13
5Ne
w Z
eala
nd1
12
11
24
Norw
ay1
11
12
3Sw
eden
11
13
11
25
Switz
erla
nd1
11
31
11
36
Unite
d Ki
ngdo
m1
11
14
11
13
7Un
ited
Stat
es1
11
14
11
13
7Eu
ro a
rea
43
7Au
stria
11
11
15
11
13
8Be
lgiu
m1
11
14
11
13
7Cy
prus
11
11
13
4Fi
nlan
d1
11
14
11
13
7Fr
ance
11
11
41
11
37
Germ
any
11
11
41
11
37
Gree
ce1
11
31
11
36
Irela
nd1
11
11
51
11
38
Italy
11
13
11
13
6Ne
ther
land
s1
11
14
11
13
7Po
rtuga
l1
11
31
11
36
Slov
enia
11
11
15
11
13
8Sp
ain
11
11
41
11
37
Cent
ral a
nd e
aste
rn E
urop
e2
24
Croa
tia1
11
12
Czec
h Re
publ
ic1
11
12
3Hu
ngar
y1
11
14
11
13
7La
tvia
11
13
11
25
Lith
uani
a1
11
31
12
5Po
land
11
21
12
4Ro
man
ia1
12
11
24
Russ
ia1
12
11
24
Ukra
ine
11
11
23
Asia
12
3Ch
ina
01
12
2Ho
ng K
ong
SAR
11
21
13
Indi
a0
11
22
Indo
nesi
a1
12
11
24
Kore
a1
11
12
3M
alay
sia
11
11
23
Sing
apor
e1
12
11
24
Thai
land
11
11
23
Latin
Am
eric
a2
24
Braz
il1
12
11
24
Mex
ico
11
11
23
Sour
ces:
Bank
for I
nter
natio
nal S
ettlem
ents
(201
0); B
orio
and
Disy
atat (
2009
); Sc
hich
and
Kim
(201
1); n
ation
al so
urce
s; an
d IM
F sta
ff.
Note:
The
abo
ve v
alues
do
not n
eces
saril
y in
dica
te th
at th
e sc
hem
es o
r fac
ilitie
s we
re a
ctuall
y us
ed. R
egio
nal a
vera
ges
are
in b
old.
1 F
or th
e eu
ro a
rea,
each
mem
ber c
ount
ry is
ass
igne
d 1
poin
t for
any
sup
port
mea
sure
take
n by
the
Euro
pean
Cen
tral B
ank.
2 May
con
sist o
f esta
blish
ing
a ca
pital
injec
tion
prog
ram
as
well
as a
ctual
capi
tal in
jectio
ns o
r liq
uida
tions
of s
pecifi
c ba
nks.
3 Inclu
des
purc
hase
s of
ban
k as
sets,
loan
gua
rant
ees,
and
loss
pro
tectio
n fo
r cer
tain
loan
s (e
.g.,
to s
mall
and
med
ium
-size
d en
terpr
ises)
and
cer
tain
secu
rities
(e.g
., m
ortg
age-
back
ed s
ecur
ities
).4 In
clude
s ch
ange
s in
rese
rve
requ
irem
ents,
long
er-te
rm o
r mor
e fre
quen
t fun
ding
term
s, ex
pans
ion
of e
ligib
le co
unter
parti
es, e
xpan
sion
of c
ollat
eral
eligi
bilit
y, an
d es
tablis
hmen
t or e
nhan
cem
ent o
f mul
tilate
ral o
r bila
teral
fore
ign
exch
ange
swa
ps
betw
een
cent
ral b
anks
.
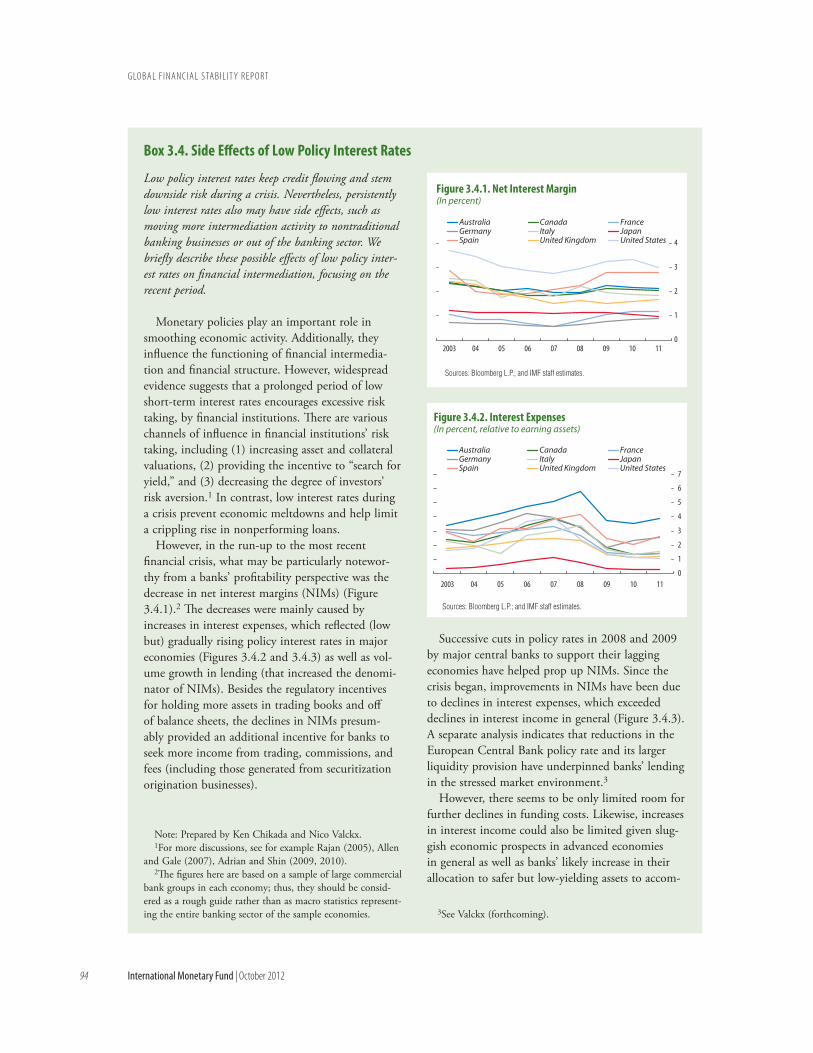
G LO B A L F I N A N C I A L S TA B I L I T Y R E P O RT
94 International Monetary Fund | October 2012
Low policy interest rates keep credit flowing and stem downside risk during a crisis. Nevertheless, persistently low interest rates also may have side effects, such as moving more intermediation activity to nontraditional banking businesses or out of the banking sector. We briefly describe these possible effects of low policy inter-est rates on financial intermediation, focusing on the recent period.
Monetary policies play an important role in smoothing economic activity. Additionally, they influence the functioning of financial intermedia-tion and financial structure. However, widespread evidence suggests that a prolonged period of low short-term interest rates encourages excessive risk taking, by financial institutions. There are various channels of influence in financial institutions’ risk taking, including (1) increasing asset and collateral valuations, (2) providing the incentive to “search for yield,” and (3) decreasing the degree of investors’ risk aversion.1 In contrast, low interest rates during a crisis prevent economic meltdowns and help limit a crippling rise in nonperforming loans.
However, in the run-up to the most recent financial crisis, what may be particularly notewor-thy from a banks’ profitability perspective was the decrease in net interest margins (NIMs) (Figure 3.4.1).2 The decreases were mainly caused by increases in interest expenses, which reflected (low but) gradually rising policy interest rates in major economies (Figures 3.4.2 and 3.4.3) as well as vol-ume growth in lending (that increased the denomi-nator of NIMs). Besides the regulatory incentives for holding more assets in trading books and off of balance sheets, the declines in NIMs presum-ably provided an additional incentive for banks to seek more income from trading, commissions, and fees (including those generated from securitization origination businesses).
Note: Prepared by Ken Chikada and Nico Valckx.1For more discussions, see for example Rajan (2005), Allen
and Gale (2007), Adrian and Shin (2009, 2010).2The figures here are based on a sample of large commercial
bank groups in each economy; thus, they should be consid-ered as a rough guide rather than as macro statistics represent-ing the entire banking sector of the sample economies.
Successive cuts in policy rates in 2008 and 2009 by major central banks to support their lagging economies have helped prop up NIMs. Since the crisis began, improvements in NIMs have been due to declines in interest expenses, which exceeded declines in interest income in general (Figure 3.4.3). A separate analysis indicates that reductions in the European Central Bank policy rate and its larger liquidity provision have underpinned banks’ lending in the stressed market environment.3
However, there seems to be only limited room for further declines in funding costs. Likewise, increases in interest income could also be limited given slug-gish economic prospects in advanced economies in general as well as banks’ likely increase in their allocation to safer but low-yielding assets to accom-
3See Valckx (forthcoming).
Box 3.4. Side effects of Low policy Interest rates
0
1
2
3
4
2003 1110090807060504
Sources: Bloomberg L.P.; and IMF staff estimates.
Figure 3.4.1. Net Interest Margin(In percent)
Australia Canada FranceGermany Italy JapanSpain United Kingdom United States
0
1
2
3
4
5
6
7
Australia Canada FranceGermany Italy JapanSpain United Kingdom United States
Figure 3.4.2. Interest Expenses(In percent, relative to earning assets)
2003 1110090807060504
Sources: Bloomberg L.P.; and IMF staff estimates.
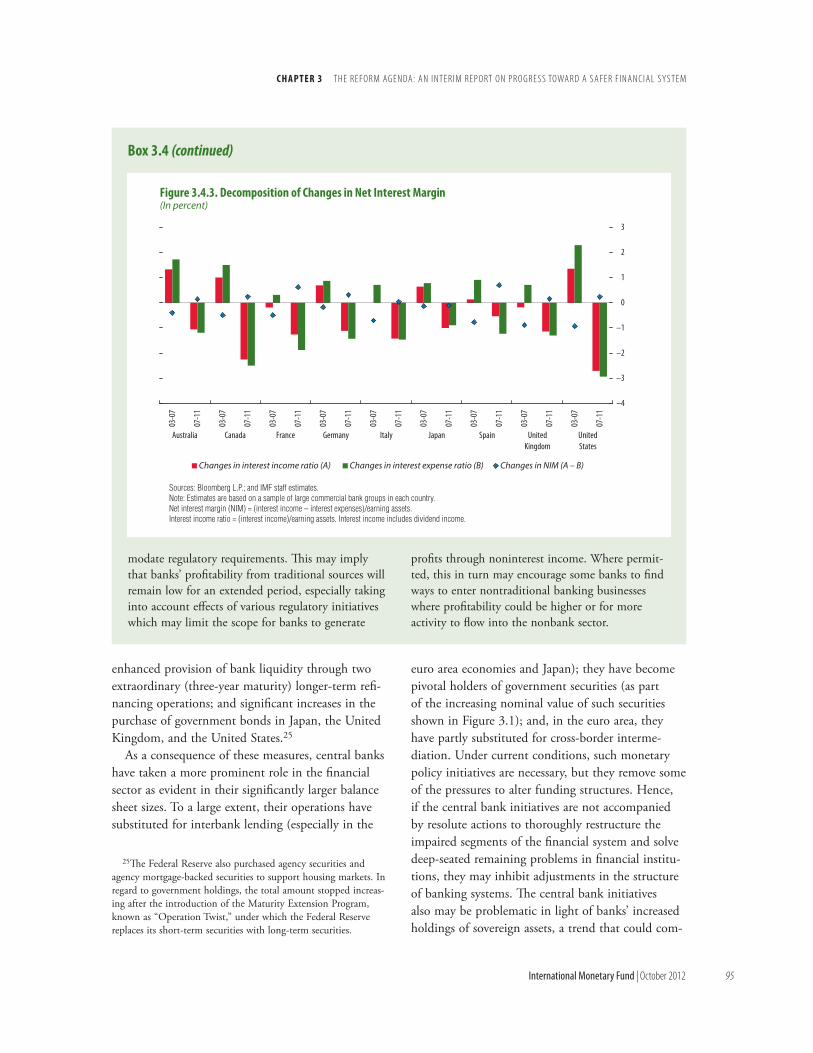
c h a p t e r 3 T h E R E F O R m AG E N dA: A N I N T E R I m R E P O RT O N P R O G R E S S TOwA R d A S A F E R F I N A N C I A L S YS T E m
International Monetary Fund | October 2012 95
enhanced provision of bank liquidity through two extraordinary (three-year maturity) longer-term refi-nancing operations; and significant increases in the purchase of government bonds in Japan, the United Kingdom, and the United States.25
As a consequence of these measures, central banks have taken a more prominent role in the financial sector as evident in their significantly larger balance sheet sizes. To a large extent, their operations have substituted for interbank lending (especially in the
25The Federal Reserve also purchased agency securities and agency mortgage-backed securities to support housing markets. In regard to government holdings, the total amount stopped increas-ing after the introduction of the Maturity Extension Program, known as “Operation Twist,” under which the Federal Reserve replaces its short-term securities with long-term securities.
euro area economies and Japan); they have become pivotal holders of government securities (as part of the increasing nominal value of such securities shown in Figure 3.1); and, in the euro area, they have partly substituted for cross-border interme-diation. Under current conditions, such monetary policy initiatives are necessary, but they remove some of the pressures to alter funding structures. Hence, if the central bank initiatives are not accompanied by resolute actions to thoroughly restructure the impaired segments of the financial system and solve deep-seated remaining problems in financial institu-tions, they may inhibit adjustments in the structure of banking systems. The central bank initiatives also may be problematic in light of banks’ increased holdings of sovereign assets, a trend that could com-
modate regulatory requirements. This may imply that banks’ profitability from traditional sources will remain low for an extended period, especially taking into account effects of various regulatory initiatives which may limit the scope for banks to generate
profits through noninterest income. Where permit-ted, this in turn may encourage some banks to find ways to enter nontraditional banking businesses where profitability could be higher or for more activity to flow into the nonbank sector.
Box 3.4 (continued)
–4
–3
–2
–1
0
1
2
3
03-0
7
07-1
1
03-0
7
07-1
1
03-0
7
07-1
1
03-0
7
07-1
1
03-0
7
07-1
1
03-0
7
07-1
1
03-0
7
07-1
1
03-0
7
07-1
1
03-0
7
Australia Canada France Germany Italy Japan Spain UnitedKingdom
UnitedStates
07-1
1
Changes in interest income ratio (A) Changes in interest expense ratio (B) Changes in NIM (A – B)
Figure 3.4.3. Decomposition of Changes in Net Interest Margin(In percent)
Sources: Bloomberg L.P.; and IMF staff estimates.Note: Estimates are based on a sample of large commercial bank groups in each country.Net interest margin (NIM) = (interest income – interest expenses)/earning assets.Interest income ratio = (interest income)/earning assets. Interest income includes dividend income.

G LO B A L F I N A N C I A L S TA B I L I T Y R E P O RT
96 International Monetary Fund | October 2012
pete with their acquisitions of highly liquid assets to meet the Basel III requirement for the liquidity coverage ratio.
Exceptionally low interest rates have been help-ful and necessary during the crisis and remain so at this juncture. However, their persistence could have the side effect of prompting banks to conduct more nontraditional banking business, which in turn would require heightened vigilance on the part of supervisors to avoid future problems. The policy rate cuts by major central banks supported econo-mies during the critical times of the global financial crisis and helped prop up net interest margins (Box 3.4). However, as sluggish economic prospects in advanced economies persist, the returns the banks earn on some of their assets are under downward pressure. Moreover, with central banks also attempt-ing to hold down long-term rates and keep yield curves flat, the natural pick-up banks receive from funding cheaply at short-term rates while lend-ing at higher, long-term rates is generating fewer profits. The result could potentially encourage banks to engage in more nontraditional business where permitted.26 Also, the protracted low interest rates could adversely affect the solvency of long-term institutional investors, thus potentially inducing them to take more investment risk (IMF, 2011a, 2012c).
However, the fiscal support provided to some banks at the height of the crisis could encourage tra-ditional banking intermediation. The fiscal measures underscored the special importance of banks in pre-serving financial stability and economic growth. This could in turn tilt the asset allocation of households and firms toward bank deposits and bonds, thus potentially affecting the financial structure in favor of more traditional banking.27
26 Other possible adverse effects of protracted low interest rates could be that the low rates and consequent thin trading spreads reduce incentives for financial institutions to trade in money mar-kets, which could lead to the downsizing of money market desks. Although, in principle, trading volumes could gradually increase as the market rate rises, the loss of skills and market infrastructure could require some time to recover (see BIS, 2010).
27This may not necessarily hold for economies with an extensive capital market, most notably the United States, which provided various supporting measures to nonbanking sectors and capital market instruments (such as guarantees on investments held in money market mutual funds).
Importantly, the impetus for the deep restructur-ing needed for normalization is lacking in some economies, given the current set of crisis response policies (Claessens and others, 2011). The inter-ventions during crises prior to 2008 went through three phases: (1) containment of liquidity stress, (2) resolution and balance sheet restructuring (remov-ing insolvent financial institutions and recapitalizing viable ones), and (3) operational restructuring to restore the profitability of viable institutions and remove and deal with nonperforming loans through various asset management techniques. The poli-cies during the crisis starting in 2008 dealt with the first phase but stopped short of completing the second stage—balance sheet restructuring in many economies has not occurred, while recapitaliza-tions have occurred but in some cases insufficiently. The targeted, diagnosis-based resolution and asset restructuring that should have preceded recapitaliza-tion could be delayed further by the current set of intervention policies.
In short, as the necessary and critical crisis inter-vention policies persist, their lingering presence may impede the movement of the structure in a suitable direction. Financial authorities must address this side effect by exerting strong vigilance and pushing forward with the necessary restructuring efforts. Low interest rates are still needed to support the real economy, and without them the financial sector would be even worse off. Yet, care should be taken that there are no delays that would impede the move to a structure that is less reliant on wholesale funding and is less complex.
change over the past Five Years: are Financial Systems Structurally Safer?
Having provided some indication of how regula-tion and crisis interventions are expected to alter the structure of financial intermediation, we look now for evidence of change toward safer financial structures. Since 1998, three major trends have been observed:28
28Three five-year periods are considered for this section: 1998–2002, 2003–07, and 2008–11 (but 2008–10 for a few indi-cators with less-recent data). The variations in availability of data across a wide range of economies dictated the starting point. Also, it should be noted that many of the regulatory reforms referred to have yet to be fully implemented.

c h a p t e r 3 T h E R E F O R m AG E N dA: A N I N T E R I m R E P O RT O N P R O G R E S S TOwA R d A S A F E R F I N A N C I A L S YS T E m
International Monetary Fund | October 2012 97
• The role of traditional banks—borrowing from depositors and lending to the household and cor-porate sectors—has diminished for some advanced economies and given way to innovative and non-traditional means in which banks rely more on financial markets for both funding and revenues (Box 3.1 and IMF, 2006).
• At the same time, greater consolidation among small (and sometimes large) financial institutions has resulted in more concentrated financial structures.
• Globalization has occurred through strategic foreign ownerships in emerging market econo-mies, especially in Europe and Latin America by European and U.S. banks.
While these three trends potentially make intermedi-ation more efficient and accessible, they also give rise to concerns about the large size of individual institutions and their contribution to systemic risk (too important to fail) through greater interconnectedness of the sys-tem (Ötker-Robe and Pazarbasioglu, 2010).
The next section provides some broad tendencies in the data for the period 1998–2011 (see Annex 3.1 for details on the various concepts of intermediation structures).29 Regional differences in the levels of these indicators are particularly noteworthy.
Market-Based Intermediation: Dented but Not reversed
Because the financial crisis originated in the United States, it was believed that the crisis would do serious damage to market-based (or “arm’s length”) intermediation—a hallmark of the U.S. financial system (IMF, 2006).30 Excessive bank reliance on market funding (rather than deposits) and on trading and investment income and com-
29Where indices are used to characterize financial structures, all intermediation data are standardized, using the data across both economies and years together to calculate the mean and standard deviation, then averaged across variables to form an index with zero mean and one standard deviation. Different subindices are averaged to arrive at the “conceptual” index. The five-year averages are taken to show the underlying structure and its trends. The units of the indices are in terms of standard deviations. Details are presented in Annex 3.1.
30Financial system intermediation is at arm’s length if interme-diation is done by transactions between two unaffiliated parties or between two parties with no relationship between them.
mission and fee income can be traced to the crisis in many of the hardest hit economies (Viñals and others, 2010). This nontraditional role in banks was accompanied by the rise of “shadow banks” and new financial products (Box 3.1). Evidence indicates that the precrisis upward trend in market-based interme-diation activities has not wholly reversed, although some of the components of this indicator have done so (Figures 3.2 and 3.3). It is worth acknowledging that some market-based intermediation, for instance, the issuance of corporate bonds and equity, was not a proximate cause of this crisis and should not be viewed as contributing to financial instability.
The share of nontraditional bank-based inter-mediation in total activities, which is one of the components of market-based intermediation, has fallen in only a few advanced economies (Figure 3.2).31 Where this share was very high in 2003–07, in France for instance, the reversal may be due to a deleveraging process in which banks started shedding noncore activities (IMF, 2012a). In other cases, as in Switzerland and the United Kingdom, the share con-tinues to grow, although for different reasons. The Swiss banks continue to rely on wholesale funding that shows up in nontraditional liabilities, whereas the U.K. banks rely on wholesale funding and hold more government securities.
The levels of market-based intermediation in emerging market economies were far below those in advanced economies in the precrisis period and have remained so. It was only in Latin America that a sharp upward trend in nontraditional banking emerged, and it leveled off during the crisis. Of note is the continuous decline in the share of nontradi-tional banking in emerging Europe.
On the other hand, the role of intermediation by nonbanks, as a share of total loans and bonds held by the financial sector, has changed little over all three periods in most countries (Figure 3.2).32 For advanced
31The share of nontraditional banking in total banking activities consists of two ratios: banks’ other earning assets over total assets, and banks’ other interest-bearing liabilities over total liabilities. If the share of income derived from non-interest-earning sources is included in this average, then the trend in the nontraditional banking share in advanced economies shows a sharper reversal overall, but data for this variable exist only up to 2010.
32Nonbanks include all institutions, regulated and unregulated, that are not classified as commercial banks.

G LO B A L F I N A N C I A L S TA B I L I T Y R E P O RT
98 International Monetary Fund | October 2012
economies as a whole, this share has fallen only slightly. One of the reasons that this score remains high is the substitution of (“high quality”) corporate bond issuance that took the place of issuance of securitization.33
Certain types of new financial products have been seriously affected by the crisis (Figure 3.3). The dis-appearance of the U.S. market for private-label resi-dential and commercial mortgage-backed securities (MBS, the underlying securities for resecuritizations) and collateralized debt obligations (both CDOs and CDO-squared) is symptomatic of the pullback from
33Even as the banking system has shrunk in scale, the global shadow banking system had recovered to its 2006 level by end-2010 (BIS, 2012a). By some measures, U.S. nonbank intermedia-tion has ebbed (FSOC, 2012).
new products that were found to be more risky than they first appeared.
Outstanding OTC derivatives have leveled off since the start of the crisis, and credit derivatives, some forms of which have been implicated in the crisis, have dropped below precrisis levels, from a peak of about $56 trillion at end-2007 to $29 trillion at end-2011, according to the Bank for International Settlements (BIS). However, much of the decline is due to “tear-up” and “compression” operations that lower counterparty exposures (see Figure 3.4).34 The use of other types of derivatives,
34Data from DTCC (the depository for data on credit deriva-tives trading), which begin with 2008, show that gross notionals went from $29.158 trillion at end-2008 to $25.880 trillion at
Relative Size of Nontraditional to Total Banking Activities1
(In percent)
Share of Total Loans and Bonds Held by Nonbanks3
(In percent)
Selected Advanced Economies2
10
20
30
40
50
1998–2002 03–07 08–11
Canada GermanyFrance JapanSpain SwitzerlandUnited Kingdom United States
Selected Country Groups and Regions
10
15
20
25
30
35
40
1998–2002 03–07 08–11
Selected advanced economiesEmerging EuropeAsiaLatin America
Selected Advanced Economies4
01020304050607080
1998–2002 03–07 08–11
Australia GermanyFrance ItalyJapan SpainSwitzerland United KingdomUnited States
Selected Country Groups and Regions
05
10152025303540
1998–2002 03–07 08–11
Selected advanced economiesEmerging Europe
Figure 3.2. Market-Based Intermediation
Source: IMF staff estimates based on the data sources in Annex 3.1.Note: Data for individual countries (left panels) and cross-country averages (right panels) are shown. The selected advanced economies in the panels on the
right refer to the average of those in the panels on the left.1The relative size of nontraditional to total banking activities is constructed as the average of the following two ratios: banks' other earning assets over total
assets, and banks' other interest-bearing liabilities over total liabilities.2Data for Canada, Spain, and Switzerland are available until 2010.3This variable represents loans and bonds held by nonbanks over loans and bonds held by the overall financial sector.4Data for Switzerland until 2009.
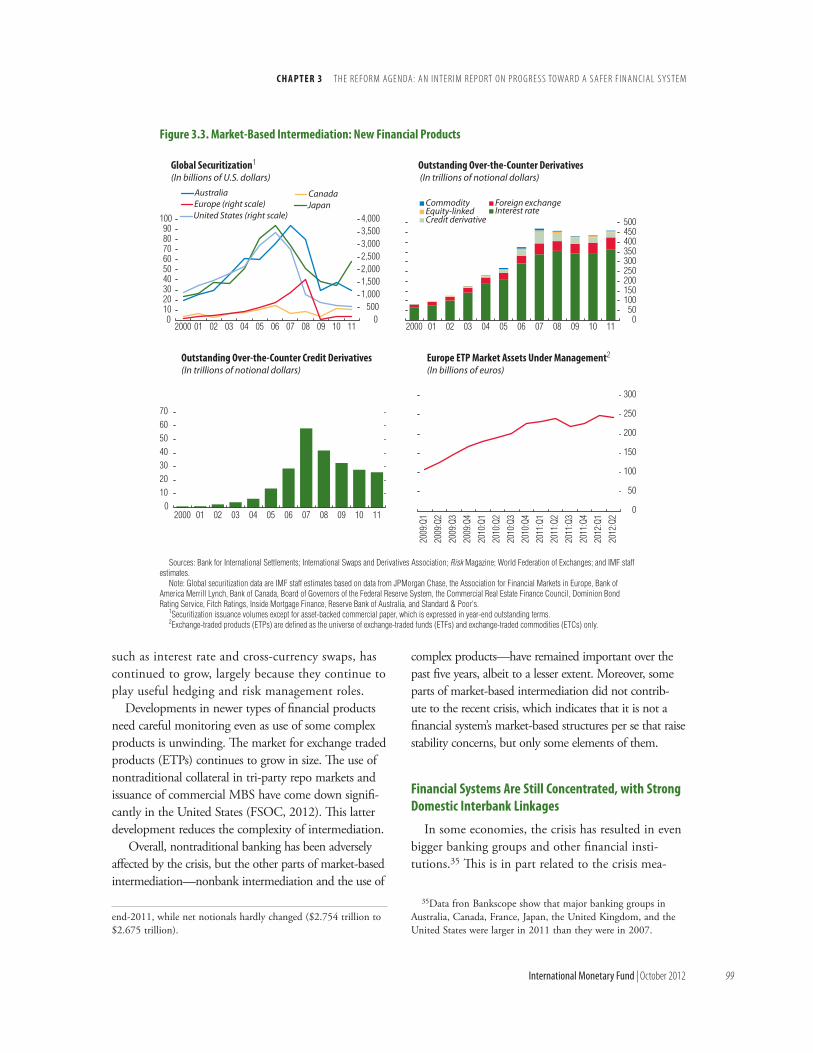
c h a p t e r 3 T h E R E F O R m AG E N dA: A N I N T E R I m R E P O RT O N P R O G R E S S TOwA R d A S A F E R F I N A N C I A L S YS T E m
International Monetary Fund | October 2012 99
such as interest rate and cross-currency swaps, has continued to grow, largely because they continue to play useful hedging and risk management roles.
Developments in newer types of financial products need careful monitoring even as use of some complex products is unwinding. The market for exchange traded products (ETPs) continues to grow in size. The use of nontraditional collateral in tri-party repo markets and issuance of commercial MBS have come down signifi-cantly in the United States (FSOC, 2012). This latter development reduces the complexity of intermediation.
Overall, nontraditional banking has been adversely affected by the crisis, but the other parts of market-based intermediation—nonbank intermediation and the use of
end-2011, while net notionals hardly changed ($2.754 trillion to $2.675 trillion).
complex products—have remained important over the past five years, albeit to a lesser extent. Moreover, some parts of market-based intermediation did not contrib-ute to the recent crisis, which indicates that it is not a financial system’s market-based structures per se that raise stability concerns, but only some elements of them.
Financial Systems are Still concentrated, with Strong Domestic Interbank Linkages
In some economies, the crisis has resulted in even bigger banking groups and other financial insti-tutions.35 This is in part related to the crisis mea-
35Data fron Bankscope show that major banking groups in Australia, Canada, France, Japan, the United Kingdom, and the United States were larger in 2011 than they were in 2007.
Figure 3.3. Market‐Based Intermediation: New Financial Products
Sources: Bank for International Settlements; International Swaps and Derivatives Association; Risk Magazine; World Federation of Exchanges; and IMF staff estimates.
Note: Global securitization data are IMF staff estimates based on data from JPMorgan Chase, the Association for Financial Markets in Europe, Bank of America Merrill Lynch, Bank of Canada, Board of Governors of the Federal Reserve System, the Commercial Real Estate Finance Council, Dominion Bond Rating Service, Fitch Ratings, Inside Mortgage Finance, Reserve Bank of Australia, and Standard & Poor's.
1Securitization issuance volumes except for asset‐backed commercial paper, which is expressed in year‐end outstanding terms.2Exchange‐traded products (ETPs) are defined as the universe of exchange‐traded funds (ETFs) and exchange‐traded commodities (ETCs) only.
0102030405060708090
100
2000 01 02 03 04 05 06 07 08 09 10 11 2000 01 02 03 04 05 06 07 08 09 10 11
2000 01 02 03 04 05 06 07 08 09 10 11
0500
1,0001,5002,0002,5003,0003,5004,000
JapanAustralia Canada
United States (right scale)Europe (right scale)
Global Securitization1
(In billions of U.S. dollars)Outstanding Over-the-Counter Derivatives (In trillions of notional dollars)
050
100150200250300350400450500
CommodityEquity-linkedCredit derivative
Foreign exchangeInterest rate
0
50
100
150
200
250
300
2009
:Q1
2009
:Q2
2009
:Q3
2009
:Q4
2010
:Q1
2010
:Q2
2010
:Q3
2010
:Q4
2011
:Q1
2011
:Q2
2011
:Q3
2011
:Q4
2012
:Q1
2012
:Q2
Europe ETP Market Assets Under Management2
(In billions of euros)Outstanding Over-the-Counter Credit Derivatives(In trillions of notional dollars)
0
10
20
30
40
50
60
70
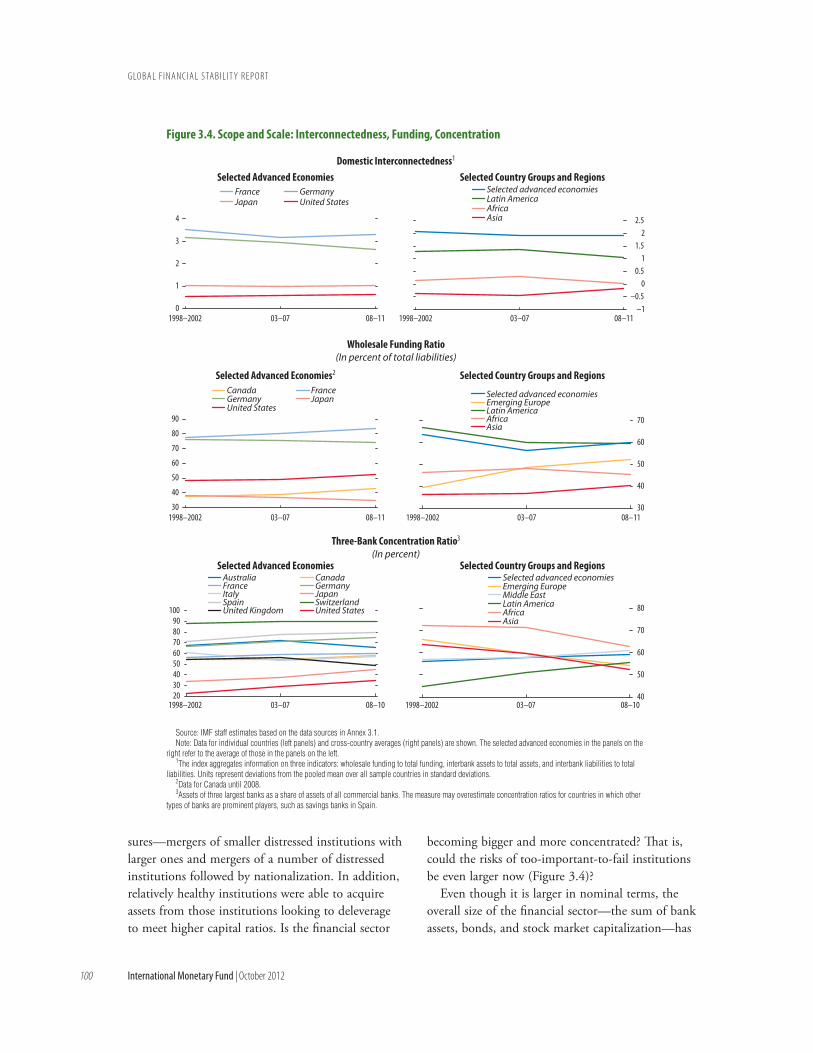
G LO B A L F I N A N C I A L S TA B I L I T Y R E P O RT
100 International Monetary Fund | October 2012
sures—mergers of smaller distressed institutions with larger ones and mergers of a number of distressed institutions followed by nationalization. In addition, relatively healthy institutions were able to acquire assets from those institutions looking to deleverage to meet higher capital ratios. Is the financial sector
becoming bigger and more concentrated? That is, could the risks of too-important-to-fail institutions be even larger now (Figure 3.4)?
Even though it is larger in nominal terms, the overall size of the financial sector—the sum of bank assets, bonds, and stock market capitalization—has
Selected Advanced Economies Selected Country Groups and Regions
Selected Advanced Economies Selected Country Groups and RegionsDomestic Interconnectedness1
Wholesale Funding Ratio(In percent of total liabilities)
Selected Advanced Economies2 Selected Country Groups and Regions
Three‐Bank Concentration Ratio3
(In percent)
0
1
2
3
4
1998–2002 03–07 08–11 1998–2002 03–07 08–11
1998–2002 03–07 08–11 1998–2002 03–07 08–11
1998–2002 03–07 08–10 1998–2002 03–07 08–10
France GermanyJapan United States
–1–0.5
00.5
11.5
22.5
Selected advanced economiesLatin AmericaAfricaAsia
30
40
50
60
70
80
90
Canada FranceGermany JapanUnited States
30
40
50
60
70
Selected advanced economiesEmerging EuropeLatin AmericaAfricaAsia
2030405060708090
100
Australia CanadaFrance GermanyItaly JapanSpain SwitzerlandUnited Kingdom United States
40
50
60
70
80
Selected advanced economiesEmerging EuropeMiddle EastLatin AmericaAfricaAsia
Figure 3.4. Scope and Scale: Interconnectedness, Funding, Concentration
Source: IMF staff estimates based on the data sources in Annex 3.1.Note: Data for individual countries (left panels) and cross-country averages (right panels) are shown. The selected advanced economies in the panels on the
right refer to the average of those in the panels on the left.1The index aggregates information on three indicators: wholesale funding to total funding, interbank assets to total assets, and interbank liabilities to total
liabilities. Units represent deviations from the pooled mean over all sample countries in standard deviations.2Data for Canada until 2008.3Assets of three largest banks as a share of assets of all commercial banks. The measure may overestimate concentration ratios for countries in which other
types of banks are prominent players, such as savings banks in Spain.
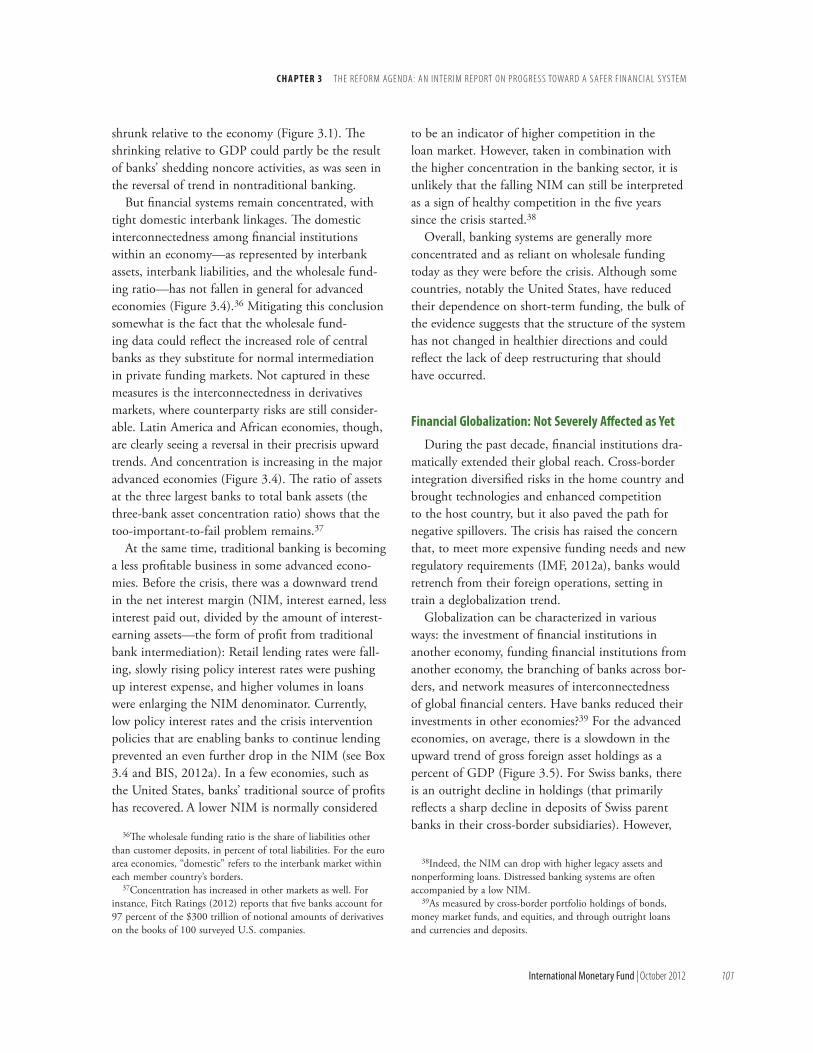
c h a p t e r 3 T h E R E F O R m AG E N dA: A N I N T E R I m R E P O RT O N P R O G R E S S TOwA R d A S A F E R F I N A N C I A L S YS T E m
International Monetary Fund | October 2012 101
shrunk relative to the economy (Figure 3.1). The shrinking relative to GDP could partly be the result of banks’ shedding noncore activities, as was seen in the reversal of trend in nontraditional banking.
But financial systems remain concentrated, with tight domestic interbank linkages. The domestic interconnectedness among financial institutions within an economy—as represented by interbank assets, interbank liabilities, and the wholesale fund-ing ratio—has not fallen in general for advanced economies (Figure 3.4).36 Mitigating this conclusion somewhat is the fact that the wholesale fund-ing data could reflect the increased role of central banks as they substitute for normal intermediation in private funding markets. Not captured in these measures is the interconnectedness in derivatives markets, where counterparty risks are still consider-able. Latin America and African economies, though, are clearly seeing a reversal in their precrisis upward trends. And concentration is increasing in the major advanced economies (Figure 3.4). The ratio of assets at the three largest banks to total bank assets (the three-bank asset concentration ratio) shows that the too-important-to-fail problem remains.37
At the same time, traditional banking is becoming a less profitable business in some advanced econo-mies. Before the crisis, there was a downward trend in the net interest margin (NIM, interest earned, less interest paid out, divided by the amount of interest-earning assets—the form of profit from traditional bank intermediation): Retail lending rates were fall-ing, slowly rising policy interest rates were pushing up interest expense, and higher volumes in loans were enlarging the NIM denominator. Currently, low policy interest rates and the crisis intervention policies that are enabling banks to continue lending prevented an even further drop in the NIM (see Box 3.4 and BIS, 2012a). In a few economies, such as the United States, banks’ traditional source of profits has recovered. A lower NIM is normally considered
36The wholesale funding ratio is the share of liabilities other than customer deposits, in percent of total liabilities. For the euro area economies, “domestic” refers to the interbank market within each member country’s borders.
37Concentration has increased in other markets as well. For instance, Fitch Ratings (2012) reports that five banks account for 97 percent of the $300 trillion of notional amounts of derivatives on the books of 100 surveyed U.S. companies.
to be an indicator of higher competition in the loan market. However, taken in combination with the higher concentration in the banking sector, it is unlikely that the falling NIM can still be interpreted as a sign of healthy competition in the five years since the crisis started.38
Overall, banking systems are generally more concentrated and as reliant on wholesale funding today as they were before the crisis. Although some countries, notably the United States, have reduced their dependence on short-term funding, the bulk of the evidence suggests that the structure of the system has not changed in healthier directions and could reflect the lack of deep restructuring that should have occurred.
Financial Globalization: Not Severely affected as Yet
During the past decade, financial institutions dra-matically extended their global reach. Cross-border integration diversified risks in the home country and brought technologies and enhanced competition to the host country, but it also paved the path for negative spillovers. The crisis has raised the concern that, to meet more expensive funding needs and new regulatory requirements (IMF, 2012a), banks would retrench from their foreign operations, setting in train a deglobalization trend.
Globalization can be characterized in various ways: the investment of financial institutions in another economy, funding financial institutions from another economy, the branching of banks across bor-ders, and network measures of interconnectedness of global financial centers. Have banks reduced their investments in other economies?39 For the advanced economies, on average, there is a slowdown in the upward trend of gross foreign asset holdings as a percent of GDP (Figure 3.5). For Swiss banks, there is an outright decline in holdings (that primarily reflects a sharp decline in deposits of Swiss parent banks in their cross-border subsidiaries). However,
38Indeed, the NIM can drop with higher legacy assets and nonperforming loans. Distressed banking systems are often accompanied by a low NIM.
39As measured by cross-border portfolio holdings of bonds, money market funds, and equities, and through outright loans and currencies and deposits.

G LO B A L F I N A N C I A L S TA B I L I T Y R E P O RT
102 International Monetary Fund | October 2012
at least through 2011, banking sector investment in other economies does not seem to have been severely affected during the crisis. This restraint could, in part, be related to crisis-intervention policies, such as the Vienna Initiative in Europe.40
In addition, analysis of cross-border banking flows through end-2011 and flows from G-SIBs show that these institutions have shifted their global portfolios but have not necessarily withdrawn significantly from foreign asset holdings (Box 3.2). BIS data for 2011 reveal little sign of a decline in the international activity of financial institutions on a country-by-country basis; a few exceptions are
40Formally, the European Bank Coordination Initiative; see, for example, www.imf.org/external/pubs/ft/survey/so/2009/INT102809A.htm.
within the euro area, where fragmentation is quite evident, even more so since the end of 2011 (see Chapter 1). Gross international claims of domestic banks on their foreign offices are higher than the 2006 level for the EU member countries as a whole, even though there was a noticeable retrenchment in 2008–09.
Network analyses that measure the importance, or centrality, of economies in banking flows do not show a reversal in trend (Figure 3.5).41 The central
41Centrality measures attempt to gauge the proportion of claims from one country in the total claims across all economies. The measure of centrality used in Figure 3.5 takes the average of an indicator for asset exposures of one country vis-à-vis those of other economies (“downstream” centrality) and an indicator for liabilities of one country vis-à-vis those of other economies (“upstream” centrality).
Gross Foreign Assets(In percent of GDP)
Banking Network Centrality2
0
50
100
150
200
250
Canada FranceGermany ItalyJapan SpainSwitzerland United Kingdom
0102030405060708090
012345678
–1
0
1
2
3
4
Figure 3.5. Globalization
Source: IMF staff estimates based on the data sources in Annex 3.1.Note: Data for individual countries (left panels) and cross-country averages (right panels) are shown. The selected advanced economies in the panels on the
right refer to the average of those in the panels on the left.1Data for France until 2010.2The index aggregates information on the global interconnectedness of banking systems in terms of banking assets and liabilities according to a network
analysis based on data from the Bank for International Settlements. Units represent deviations from the pooled mean over all sample countries in standard deviations. See Cihák, Muñoz, and Scuzzarella (2012).
Selected Advanced Economies
Selected Country Groups and RegionsSelected Advanced Economies1
1998–2002 03–07 08–11 1998–2002 03–07 08–11
1998–2002 03–07 08–10 1998–2002 03–07 08–10
Australia CanadaFrance GermanyItaly JapanSpain SwitzerlandUnited Kingdom United States
Selected advanced economiesEmerging EuropeMiddle East
Latin AmericaAfricaAsia
Selected Country Groups and RegionsSelected advanced economiesEmerging EuropeMiddle East
Latin AmericaAfricaAsia
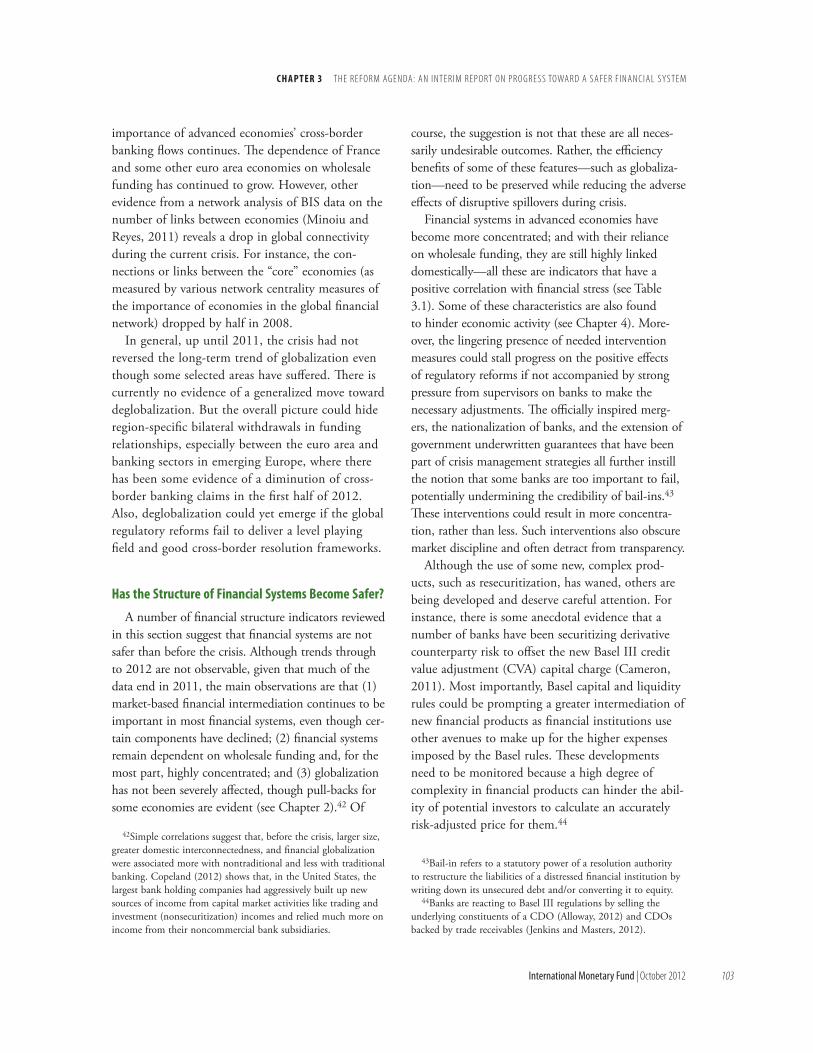
c h a p t e r 3 T h E R E F O R m AG E N dA: A N I N T E R I m R E P O RT O N P R O G R E S S TOwA R d A S A F E R F I N A N C I A L S YS T E m
International Monetary Fund | October 2012 103
importance of advanced economies’ cross-border banking flows continues. The dependence of France and some other euro area economies on wholesale funding has continued to grow. However, other evidence from a network analysis of BIS data on the number of links between economies (Minoiu and Reyes, 2011) reveals a drop in global connectivity during the current crisis. For instance, the con-nections or links between the “core” economies (as measured by various network centrality measures of the importance of economies in the global financial network) dropped by half in 2008.
In general, up until 2011, the crisis had not reversed the long-term trend of globalization even though some selected areas have suffered. There is currently no evidence of a generalized move toward deglobalization. But the overall picture could hide region-specific bilateral withdrawals in funding relationships, especially between the euro area and banking sectors in emerging Europe, where there has been some evidence of a diminution of cross-border banking claims in the first half of 2012. Also, deglobalization could yet emerge if the global regulatory reforms fail to deliver a level playing field and good cross-border resolution frameworks.
has the Structure of Financial Systems Become Safer?
A number of financial structure indicators reviewed in this section suggest that financial systems are not safer than before the crisis. Although trends through to 2012 are not observable, given that much of the data end in 2011, the main observations are that (1) market-based financial intermediation continues to be important in most financial systems, even though cer-tain components have declined; (2) financial systems remain dependent on wholesale funding and, for the most part, highly concentrated; and (3) globalization has not been severely affected, though pull-backs for some economies are evident (see Chapter 2).42 Of
42Simple correlations suggest that, before the crisis, larger size, greater domestic interconnectedness, and financial globalization were associated more with nontraditional and less with traditional banking. Copeland (2012) shows that, in the United States, the largest bank holding companies had aggressively built up new sources of income from capital market activities like trading and investment (nonsecuritization) incomes and relied much more on income from their noncommercial bank subsidiaries.
course, the suggestion is not that these are all neces-sarily undesirable outcomes. Rather, the efficiency benefits of some of these features—such as globaliza-tion—need to be preserved while reducing the adverse effects of disruptive spillovers during crisis.
Financial systems in advanced economies have become more concentrated; and with their reliance on wholesale funding, they are still highly linked domestically—all these are indicators that have a positive correlation with financial stress (see Table 3.1). Some of these characteristics are also found to hinder economic activity (see Chapter 4). More-over, the lingering presence of needed intervention measures could stall progress on the positive effects of regulatory reforms if not accompanied by strong pressure from supervisors on banks to make the necessary adjustments. The officially inspired merg-ers, the nationalization of banks, and the extension of government underwritten guarantees that have been part of crisis management strategies all further instill the notion that some banks are too important to fail, potentially undermining the credibility of bail-ins.43 These interventions could result in more concentra-tion, rather than less. Such interventions also obscure market discipline and often detract from transparency.
Although the use of some new, complex prod-ucts, such as resecuritization, has waned, others are being developed and deserve careful attention. For instance, there is some anecdotal evidence that a number of banks have been securitizing derivative counterparty risk to offset the new Basel III credit value adjustment (CVA) capital charge (Cameron, 2011). Most importantly, Basel capital and liquidity rules could be prompting a greater intermediation of new financial products as financial institutions use other avenues to make up for the higher expenses imposed by the Basel rules. These developments need to be monitored because a high degree of complexity in financial products can hinder the abil-ity of potential investors to calculate an accurately risk-adjusted price for them.44
43Bail-in refers to a statutory power of a resolution authority to restructure the liabilities of a distressed financial institution by writing down its unsecured debt and/or converting it to equity.
44Banks are reacting to Basel III regulations by selling the underlying constituents of a CDO (Alloway, 2012) and CDOs backed by trade receivables (Jenkins and Masters, 2012).
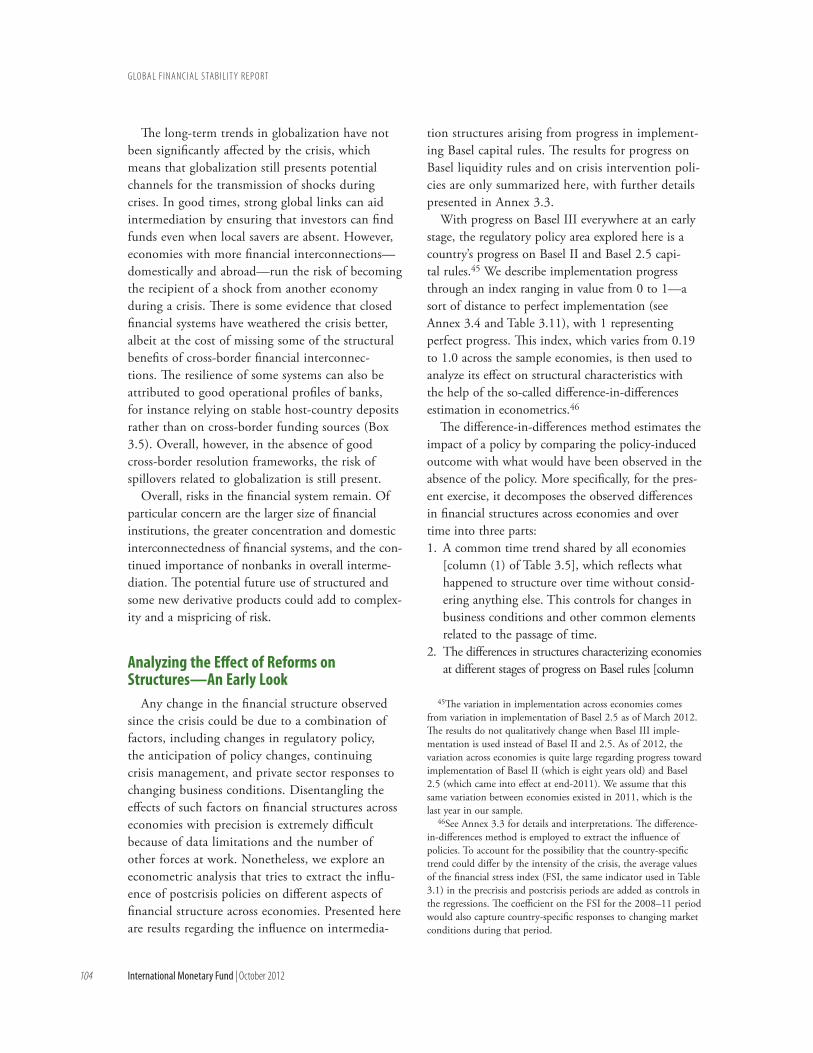
G LO B A L F I N A N C I A L S TA B I L I T Y R E P O RT
104 International Monetary Fund | October 2012
The long-term trends in globalization have not been significantly affected by the crisis, which means that globalization still presents potential channels for the transmission of shocks during crises. In good times, strong global links can aid intermediation by ensuring that investors can find funds even when local savers are absent. However, economies with more financial interconnections—domestically and abroad—run the risk of becoming the recipient of a shock from another economy during a crisis. There is some evidence that closed financial systems have weathered the crisis better, albeit at the cost of missing some of the structural benefits of cross-border financial interconnec-tions. The resilience of some systems can also be attributed to good operational profiles of banks, for instance relying on stable host-country deposits rather than on cross-border funding sources (Box 3.5). Overall, however, in the absence of good cross-border resolution frameworks, the risk of spillovers related to globalization is still present.
Overall, risks in the financial system remain. Of particular concern are the larger size of financial institutions, the greater concentration and domestic interconnectedness of financial systems, and the con-tinued importance of nonbanks in overall interme-diation. The potential future use of structured and some new derivative products could add to complex-ity and a mispricing of risk.
analyzing the effect of reforms on Structures—an early Look
Any change in the financial structure observed since the crisis could be due to a combination of factors, including changes in regulatory policy, the anticipation of policy changes, continuing crisis management, and private sector responses to changing business conditions. Disentangling the effects of such factors on financial structures across economies with precision is extremely difficult because of data limitations and the number of other forces at work. Nonetheless, we explore an econometric analysis that tries to extract the influ-ence of postcrisis policies on different aspects of financial structure across economies. Presented here are results regarding the influence on intermedia-
tion structures arising from progress in implement-ing Basel capital rules. The results for progress on Basel liquidity rules and on crisis intervention poli-cies are only summarized here, with further details presented in Annex 3.3.
With progress on Basel III everywhere at an early stage, the regulatory policy area explored here is a country’s progress on Basel II and Basel 2.5 capi-tal rules.45 We describe implementation progress through an index ranging in value from 0 to 1—a sort of distance to perfect implementation (see Annex 3.4 and Table 3.11), with 1 representing perfect progress. This index, which varies from 0.19 to 1.0 across the sample economies, is then used to analyze its effect on structural characteristics with the help of the so-called difference-in-differences estimation in econometrics.46
The difference-in-differences method estimates the impact of a policy by comparing the policy-induced outcome with what would have been observed in the absence of the policy. More specifically, for the pres-ent exercise, it decomposes the observed differences in financial structures across economies and over time into three parts:1. A common time trend shared by all economies
[column (1) of Table 3.5], which reflects what happened to structure over time without consid-ering anything else. This controls for changes in business conditions and other common elements related to the passage of time.
2. The differences in structures characterizing economies at different stages of progress on Basel rules [column
45The variation in implementation across economies comes from variation in implementation of Basel 2.5 as of March 2012. The results do not qualitatively change when Basel III imple-mentation is used instead of Basel II and 2.5. As of 2012, the variation across economies is quite large regarding progress toward implementation of Basel II (which is eight years old) and Basel 2.5 (which came into effect at end-2011). We assume that this same variation between economies existed in 2011, which is the last year in our sample.
46See Annex 3.3 for details and interpretations. The difference-in-differences method is employed to extract the influence of policies. To account for the possibility that the country-specific trend could differ by the intensity of the crisis, the average values of the financial stress index (FSI, the same indicator used in Table 3.1) in the precrisis and postcrisis periods are added as controls in the regressions. The coefficient on the FSI for the 2008–11 period would also capture country-specific responses to changing market conditions during that period.

c h a p t e r 3 T h E R E F O R m AG E N dA: A N I N T E R I m R E P O RT O N P R O G R E S S TOwA R d A S A F E R F I N A N C I A L S YS T E m
International Monetary Fund | October 2012 105
table 3.5. effect of progress in Basel capital rules on Intermediation Structures (Effect on levels; in percent except as noted)
(1) (2) (3) (4) (5) (6)
Structural Indicators
Change in Structure during
2008–11 (β1)
Association between
Progress on Basel Capital
Rules and Structure (β2)1
Effect of Progress in Basel Capital
Rules on Structure
during 2008–11 (β3)2
Number of Observations3 R2
Year of Latest
Available Data4
Market-based intermediation Nontraditional bank intermediation 0.28 1.47 –0.09 30 0.09 2010
Noninterest income to total income 3.67 0.15 –9.12 46 0.01 2010Other earning assets to total assets –6.89 2.72 0.66 46 0.07 2011Other interest-bearing liabilities to total
liabilities –2.16 4.27 11.34* 46 0.06 2011
Nonbank intermediationLoans and bonds held by nonbanks relative to
the overall financial sector 13.28 –75.18** –4.73 26 0.43 2011Ratio of private bond market capitalization to
GDP (percentage points) 6.02 13.10 –2.14 43 0.06 2010
Use of new financial productsDerivatives turnover to GDP –0.60 0.58 0.35 32 0.07 2010Securitization to GDP –26.93*** –15.18*** 25.17*** 22 0.15 2011
Traditional bank-based intermediationLoans and bonds held by banks relative to the
overall financial sector –13.28 75.18** 4.73 26 0.43 2011Net interest margin 1.71** –2.63*** –0.32 46 0.24 2010Bank credit versus stocks and bonds5 –0.28 0.70** 1.02 43 0.27 2010
Scale and scope Size (index) –39.18 281.49*** –16.08 42 0.48 2010Domestic interconnectedness (index) 0.62 2.02* 0.22 20 0.37 2011
Wholesale funding ratio 2.93 29.18** 6.46 24 0.30 2011Interbank assets to total assets 3.43 10.66* 1.82 30 0.23 2011Interbank liabilities to total liabilities 3.02 7.34 2.22 30 0.26 2011
Concentration (asset share of top three banks) –6.92 29.97** 9.41 46 0.25 2010Financial globalization 0.44 0.69 –1.52** 26 0.22 2010
Share of foreign banks (number of banks) 7.29 –5.60 –20.59* 46 0.15 2010Gross foreign assets (percentage points of GDP) 3.64 93.91** –39.32 35 0.16 2011Global interconnectedness (index)6 –0.18 1.73 –1.25 46 0.11 2010Source: IMF staff estimates.
Note: For each structural indicator, the following regression is estimated by the difference-in-differences (DiD) method; see Annex 3.3.
sit = β0 + β1Dt
Crisis + β2Basel Capital Progress Indexi + β3DtCrisis * Basel Capital Progress Indexi + β4Financial Stress Indexi,t + ei,t ,
where, sit denotes the structural indicator, Dt
crisis is a crisis dummy taking the value of 1 in the period 2008–10 and zero in 2003–07, and Basel Capital Progress Indexi is taken from Table 3.11; Financial Stress Indexi,t is described in Table 3.1. Results for the constant β0 and the control β4 are not reported. ***, **, and * denote significance at the 1 percent, 5 percent, and 10 percent levels of confidence. Standard errors are clustered by country. See Annex 3.1 for an overview of the structural indicators and the underlying data.
1The parameter refers to the structural difference observed between countries for which the Basel Capital Progress Index differs by 1.2The parameter refers to the causal effect of an increase in Basel Capital Progress Index by 1 on the corresponding structural indicator. However, a causal interpretation requires strong
assumptions, especially, equal trends in the structural indicators among countries in the absence of the implementation of Basel regulations, which are not testable.3The difference-in-differences approach is based on a pooled panel. Accordingly, the number of observations is two times the number of countries in the corresponding sample. 4For structural indicators with data through 2011, a few countries in some cases are included that have data through 2010 only. The signs and levels of significance do not change if data
only through 2010 are used instead.5This variable is used to represent the share of traditional versus nontraditional intermediation.6This variable is based on the work of Cihák, Muñoz, and Scuzzarella (2012). See Annex 3.1 and Table 3.6 for further details.

G LO B A L F I N A N C I A L S TA B I L I T Y R E P O RT
106 International Monetary Fund | October 2012
The recent episode of global financial turmoil highlights the risk of international contagion and the potential resiliency of less integrated banking systems. This box explore the banking system “openness” and regu-latory frameworks of four jurisdictions generally regarded as less globally integrated, all of which fared relatively well in the financial crisis. It concludes that the funding structure of banks could be more important than a lack of foreign bank ownership for financial stability.
Australia, Canada, India, and Malaysia have a relatively low degree of exposure to international banking and also avoided the worst of the effects of the global financial crisis. Is there a connection?
We use three measures to gauge the extent of globalization of a banking system: the extent of foreign banks’ presence in the banking system, by taking the ratio of foreign bank assets to total bank assets and banks’ foreign assets as a percent of total assets or GDP; and the direction of global intercon-nectedness, by taking international financial claims and liabilities, both in percent of total assets. We use these three indicators to compare Australia, Canada, India, and Malaysia with peer groups.
Australia and Canada have limited foreign bank presence and low foreign claims when compared with the euro area and advanced Asia (Figures 3.5.1 and 3.5.2).1 But when the international positions of their banks are used, international integration becomes more evident. Even so, Australia and Canada relied far less on foreign liabilities than most peer groups before the crisis (Figure 3.5.3).
India and Malaysia appear insulated from foreign banks by almost all indicators when compared with all peer groups except developing Asia and the economies (besides India) that make up the BRIC group (Brazil, Russia, and China). Both India and Malaysia have low foreign bank presence, and banks there have a very low level of foreign assets in their balance sheet. Malaysia had relatively low reliance on foreign liabilities compared with other peers, whereas in 2007 India was close to the BRIC aver-age (Figures 3.5.1–3.5.3).
Regulatory policies in Australia and Canada share some features that might have resulted in less
Box 3.5. Did Some Banking Systems Withstand International contagion Because they are Less Globally Integrated?
0102030405060708090
100
Austr
alia
Cana
da
India
Mala
ysia
Euro
Area
G7 (e
xclud
ing Ca
nada
)
CIS CEE
BRIC
(exc
luding
India
)
Deve
loping
Asia
(exc
luding
India
, Mala
ysia)
Deve
loped
Asia
and P
aci�
c(e
xclud
ing Au
strali
a)
Latin
Amer
ica
Sample of countries
Figure 3.5.1. Degrees of Globalization in Banking Systems—Foreign Bank Presence (In percent, ratio of foreign bank subsidiary and branch assets to total banking assets)
Sources: Bank for International Settlements; European Central Bank; World Bank; and IMF staff estimates.Note: Data are as of December 2011. BRIC = Brazil, Russia, India, and China; CIS = Commonwealth of Independent States; CEE = Central and Eastern
Europe.
1Internationally comparable data from the Bank for Inter-national Settlements show thatafter the crisis, foreign liabilities (in percent of total bank assets) for Australia, Canada, the euro area, and the G7 (excluding Canada) declined to various degrees. Note: Prepared by Mamoru Yanase and Sofiya Avramova.

c h a p t e r 3 T h E R E F O R m AG E N dA: A N I N T E R I m R E P O RT O N P R O G R E S S TOwA R d A S A F E R F I N A N C I A L S YS T E m
International Monetary Fund | October 2012 107
globally integrated banking systems. One important policy they have in common is the de facto prohibi-tion of mergers among the major domestic banks. While its primary objective is to retain competi-tion, the prohibition has prevented an increase in
the size of these banks and the creation of national “champions” that could compete with major global financial institutions. This may have been a factor limiting their banks’ international activities. The two economies also impose restrictions on shareholder
Box 3.5 (continued)
0
20
40
60
80
100
120
140
160Total bank foreign assets to total assets
Total bank foreign assets to GDP
Sample of countries
Austr
alia
Cana
da
India
Mala
ysia
Euro
area
G7 (e
xclud
ing Ca
nada
)
CIS CEE
BRIC
(exc
luding
India
)
Deve
loping
Asia
(exc
luding
India
, Mala
ysia)
Deve
loped
Asia
and P
aci�
c(e
xclud
ing Au
strali
a)
Latin
Amer
ica
Sources: Bank for International Settlements; European Central Bank; World Bank; and IMF staff estimates.Note: Data are as of December 2011 and 2010 selectively. BRIC = Brazil, Russia, India, and China; CIS = Commonwealth of Independent States; CEE =
Central and Eastern Europe.
Figure 3.5.2. Degrees of Globalization in Banking Systems—International Positions(In percent)
0
10
20
30
40
50
60
70
80
90
2007 liabilities
2007 claims
Sources: Bank for International Settlements; European Central Bank; World Bank; and IMF staff estimates.Note: BRIC = Brazil, Russia, India, and China; CEE = Central and Eastern Europe.
Figure 3.5.3. Direction of Interconnectedness—International Claims versus Liabilities, 2007 (In percent of bank assets)
Austr
alia
Cana
da
India
Mala
ysia
Euro
area
G7 (e
xclud
ing Ca
nada
)
CEE
BRIC
(exc
luding
India
)
Deve
loped
Asia
and P
aci�
c(e
xclud
ing Au
strali
a)
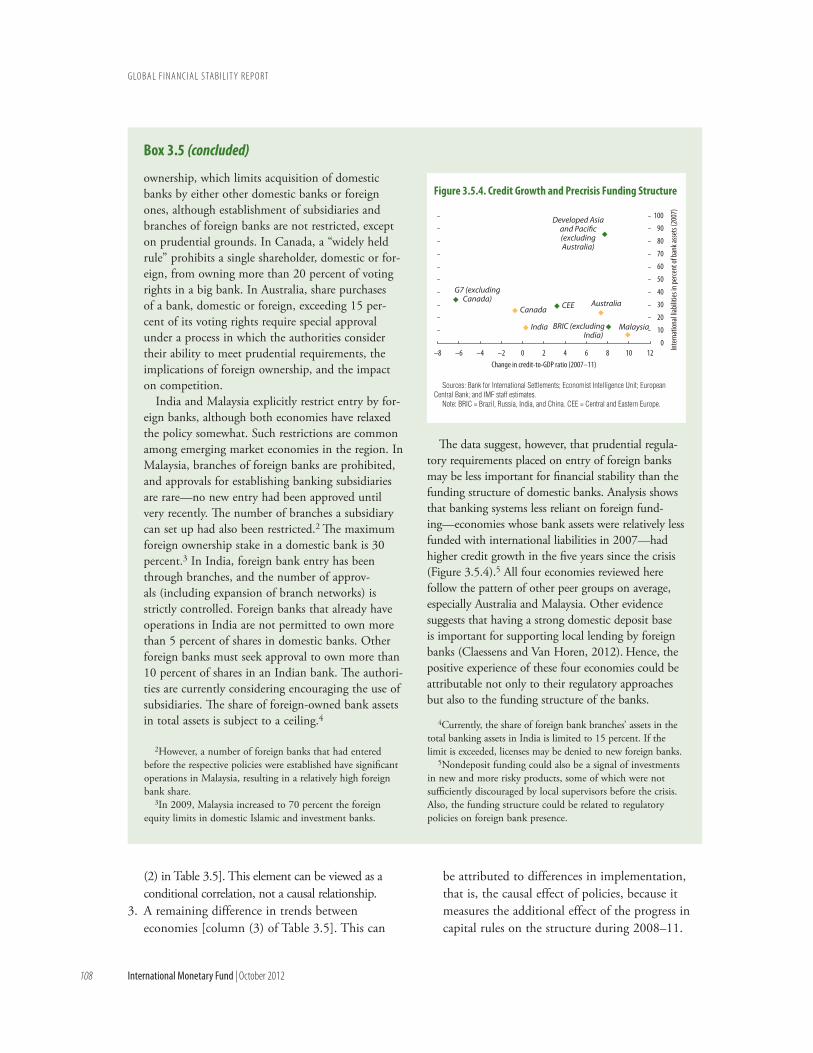
G LO B A L F I N A N C I A L S TA B I L I T Y R E P O RT
108 International Monetary Fund | October 2012
(2) in Table 3.5]. This element can be viewed as a conditional correlation, not a causal relationship.
3. A remaining difference in trends between economies [column (3) of Table 3.5]. This can
be attributed to differences in implementation, that is, the causal effect of policies, because it measures the additional effect of the progress in capital rules on the structure during 2008–11.
ownership, which limits acquisition of domestic banks by either other domestic banks or foreign ones, although establishment of subsidiaries and branches of foreign banks are not restricted, except on prudential grounds. In Canada, a “widely held rule” prohibits a single shareholder, domestic or for-eign, from owning more than 20 percent of voting rights in a big bank. In Australia, share purchases of a bank, domestic or foreign, exceeding 15 per-cent of its voting rights require special approval under a process in which the authorities consider their ability to meet prudential requirements, the implications of foreign ownership, and the impact on competition.
India and Malaysia explicitly restrict entry by for-eign banks, although both economies have relaxed the policy somewhat. Such restrictions are common among emerging market economies in the region. In Malaysia, branches of foreign banks are prohibited, and approvals for establishing banking subsidiaries are rare—no new entry had been approved until very recently. The number of branches a subsidiary can set up had also been restricted.2 The maximum foreign ownership stake in a domestic bank is 30 percent.3 In India, foreign bank entry has been through branches, and the number of approv-als (including expansion of branch networks) is strictly controlled. Foreign banks that already have operations in India are not permitted to own more than 5 percent of shares in domestic banks. Other foreign banks must seek approval to own more than 10 percent of shares in an Indian bank. The authori-ties are currently considering encouraging the use of subsidiaries. The share of foreign-owned bank assets in total assets is subject to a ceiling.4
The data suggest, however, that prudential regula-tory requirements placed on entry of foreign banks may be less important for financial stability than the funding structure of domestic banks. Analysis shows that banking systems less reliant on foreign fund-ing—economies whose bank assets were relatively less funded with international liabilities in 2007—had higher credit growth in the five years since the crisis (Figure 3.5.4).5 All four economies reviewed here follow the pattern of other peer groups on average, especially Australia and Malaysia. Other evidence suggests that having a strong domestic deposit base is important for supporting local lending by foreign banks (Claessens and Van Horen, 2012). Hence, the positive experience of these four economies could be attributable not only to their regulatory approaches but also to the funding structure of the banks.
Box 3.5 (concluded)
2However, a number of foreign banks that had entered before the respective policies were established have significant operations in Malaysia, resulting in a relatively high foreign bank share.
3In 2009, Malaysia increased to 70 percent the foreign equity limits in domestic Islamic and investment banks.
4Currently, the share of foreign bank branches’ assets in the total banking assets in India is limited to 15 percent. If the limit is exceeded, licenses may be denied to new foreign banks.
5Nondeposit funding could also be a signal of investments in new and more risky products, some of which were not sufficiently discouraged by local supervisors before the crisis. Also, the funding structure could be related to regulatory policies on foreign bank presence.
AustraliaCanada
India Malaysia
G7 (excludingCanada)
Developed Asiaand Paci�c(excludingAustralia)
CEE
BRIC (excludingIndia)
0
10
20
30
40
50
60
70
80
90
100
–8 –6 –4 –2 0 2 4 6 8 10 12Change in credit‐to‐GDP ratio (2007–11)
Inte
rnat
ional
liabil
ities
in pe
rcent
of ba
nk as
sets
(200
7)
Sources: Bank for International Settlements; Economist Intelligence Unit; European Central Bank; and IMF staff estimates.
Note: BRIC = Brazil, Russia, India, and China. CEE = Central and Eastern Europe.
Figure 3.5.4. Credit Growth and Precrisis Funding Structure
c h a p t e r 3 T h E R E F O R m AG E N dA: A N I N T E R I m R E P O RT O N P R O G R E S S TOwA R d A S A F E R F I N A N C I A L S YS T E m
International Monetary Fund | October 2012 109
This interpretation assumes that equal trends in the structural variables are captured by the com-mon time trend and other controls.The quantitative impact of regulatory policy mea-
sures on structural characteristics is likely to be small and confounded by other influences that would make it hard to find statistical relationships. This is especially so because many regulatory policies in addition to the Basel initiatives are still at the rule-making stage, and only a handful have been imple-mented so far (see the section above on “Objectives and Implications of the New Regulatory Initiatives” and Annexes 3.2 and 3.4). Furthermore, the ongo-ing crisis and the various intervention measures are obscuring change. Nevertheless, the variation across economies is large enough to warrant conducting this exercise in relation to Basel capital rules imple-mentation. The econometric exercise could illustrate the direction of the changes, even if these effects are currently weak. Importantly, this exercise sets out a framework that can be repeated from time to time, especially once the crisis is past, to understand the effect of policies on structure. Despite the strength of the technique in isolating various relationships, care should be exercised in interpreting the results. The structural variables themselves are only stand-ins for characteristics of financial systems, and thus their relationship to implementation progress could be capturing other regulatory initiatives common to both that are not picked up by the other controls.
Progress on Basel Capital Rules
Before turning to the empirical results, we recall the likely effects of the new Basel rules on capital and liquidity (Basel III) as presented in Table 3.3. The new rules are expected to reduce the scale and scope of operations of banks but could provide incentives for intermediation to move away from tra-ditional banking to nontraditional banking and non-bank institutions. Shifting from assets with higher risk weights to those with lower risk weights, to conserve capital, could further lower the investment and interest income of banks. At the same time, the banking system could become more concentrated as banks try to benefit from consolidating business lines in areas where they have advantages.
We find that in economies farthest along in implementing the Basel rules, the financial sector is relatively larger, has more traditional bank-based intermediation, is more domestically intercon-nected, and is more concentrated and globalized [see column (2) of Table 3.5].47 Most of the progress overall has been made on Basel II and 2.5 (as shown in Table 3.11 in Annex 3.4), so this result likely rep-resents the structural characteristics of the economies that had instituted these elements (e.g., European economies).
Furthermore, there is some evidence that the Basel capital rules are prompting more nontraditional bank-ing, creeping up home bias, and moderating the fall in securitization.48 Progress on capital rules is leading to changes in structural characteristics [column (3) of Table 3.5] that confirm some of the expectations summarized in Table 3.3, as recalled above. Banking systems are increasingly using non-interest-bearing liabilities (a subindex for nontraditional banking). Also, progress on the capital rules may be encourag-ing banking systems to use more of some forms of securitization (cushioning the overall fall in secu-ritization). Despite the gradual implementation of Basel capital rules, investor pressure may encourage banks to move rapidly to adopt the rules before the final implementation dates and, thus, could already have prompted banks to shed noncore activities like nonloan assets (IMF, 2012a). Banks’ greater reli-ance on nondeposit liabilities could be due to their attempts to cut expenses on funding by moving to a
47The coefficients in Table 3.5 are interpreted as follows. Taking the example of “Securitization” (the last entry in the category “Market-based intermediation”), column (1) shows that the mean level across all economies decreased by 26.93 percentage points of GDP between 2003 –07 and 2008–11 (and can be compared to the average decline shown in Figure 3.3), and economies that had made the most progress in Basel capital rules had relatively low securitization levels [the negative coefficient in column (2)]. Moreover, progress in capital rules had the effect of pushing up securitization by 25.17 percentage points of GDP in 2008–11 for those economies that made 0.1 unit higher progress on the capi-tal rules [column (3)]. Thus, on average, securitization changed by –1.76 percentage points of GDP (–26.93 + 25.17) in 2008–11 for economies with perfect progress.
48Even after removing the estimated amount of securitization potentially for use as collateral against ECB loans in Europe, the results still hold.
G LO B A L F I N A N C I A L S TA B I L I T Y R E P O RT
110 International Monetary Fund | October 2012
different liabilities structure.49 The negative relation-ship between globalization and progress on Basel capital rules implementation is suggestive of increas-ing home bias, especially for economies further along in implementation.
Basel Liquidity Rules and Crisis Intervention Measures
Applying the analysis to proposed liquidity standards, we find that market participants’ anticipa-tion that jurisdictions will be implementing them could already be prompting changes in structures.50 In particular, progress on implementing the Basel III liquidity rules in a domestic context is prompt-ing more nontraditional activities, especially larger holdings in other earning assets (see Table 3.9 in Annex 3.3). Most of the direct connections between implementation and structure are not statistically significant [Table 3.9, column (3)]. However, the significant relationship between implementation progress and lowered bank credit relative to other forms of intermediation supports the notion of intermediation moving out of banking systems as implementation of the liquidity standards proceeds.
Applying the model to crisis intervention measures, we found that greater intervention was associated with potentially more fragile structures.51 In general, economies with a greater degree of nontraditional banking, higher domestic interconnectedness (espe-cially reliance on wholesale funding), more concentra-tion, lower net interest margins, and stronger global interconnectedness were associated with a greater degree of intervention during the crisis [see Table 3.10, column (2), in Annex 3.3]. This observation could be an artifact of the large-scale interventions in the advanced economies, especially in Europe, and is
49The EBA exercise in July 2012 showed that the banks that were subject to EBA’s stress tests are cutting expenses and chang-ing the structure of liabilities to cheaper ones, to mitigate the costs arising from the capital regulatory measures.
50The progress in adopting and implementing legislation based on proposed Basel III liquidity standards (continuous indices ranging from 0 to 1) are shown in Table 3.11, although the prog-ress is judged on the basis of planning and preparation by domes-tic institutions for such implementation. The crisis intervention measures and the progress indices are country-specific variables and do not vary over time.
51The number of interventions during the crisis (an index rang-ing from 2 to 8) is taken from the last column in Table 3.4.
additional evidence that these structural characteristics were associated with crisis outcomes (see also Table 3.1). As such, it provides more comfort regarding regulatory reforms that seek to address the safety con-cerns related to some of these structural elements.
Implications for the reform agendaThe impact of the regulatory reform agenda on
the financial sector cannot yet be observed—these are still early days in the unfolding of the agenda, and the ongoing global financial crisis obscures, and to some extent delays, change. Nonetheless, the chapter provides some partial answers to the ques-tions posed in the introduction.
The crisis has provided some guidance about where financial systems need fixing. As noted above, a host of papers show that some specific structural features of financial systems were associated with the crisis. These include size of the financial system; overuse of leverage; reliance on wholesale fund-ing, including repo market financing; the role of nonbank institutions; and (a largely underestimated) degree of interconnectedness across institutions and economies. This earlier analysis provides the starting point for evaluating the reform agenda.
Learning from the crisis, the global reform agenda has focused on areas that are likely to bring about the fastest improvement—mostly in the banking system. Within banking regulations, the rules mostly impose higher costs on activities whose risks were found to have been underpriced. These higher costs should move the banking sector in a safer direction. The ultimate goal is broader, however: designing regulatory reforms to effect a safer financial system, one less complex, more transparent, and with larger financial buffers. In this chapter we have used these normative qualities as a benchmark and provided an early assessment (using raw data, analysis, and judgment) about whether the reforms are moving financial intermediation in a safer direction.
Unfortunately, much of the intended change cannot yet be observed, in part because the imple-mentation phases of the regulatory reforms have long timelines to avoid dampening the recovery, and in part because crisis intervention measures are still actively employed in some places. Crisis interven-

c h a p t e r 3 T h E R E F O R m AG E N dA: A N I N T E R I m R E P O RT O N P R O G R E S S TOwA R d A S A F E R F I N A N C I A L S YS T E m
International Monetary Fund | October 2012 111
tions have sometimes brought abrupt changes to structure that often worked against the direction of safety—for example, even larger institutions were created as strong institutions bought weaker ones. The low interest rate environment and unprec-edented levels of quantitative easing have been necessary to support credit growth and have kept the crisis from deepening, but they have also weakened the functioning of some markets, potentially with longer-term consequences. Moreover, the protracted crisis intervention measures, mostly in Europe, could be slowing the needed restructuring of their finan-cial sectors. Uncertainty about the economic and regulatory environment has also inhibited institu-tions from making strategic decisions about their activities.
Despite improvement in most financial systems along some dimensions, the structure of intermedia-tion remains largely unchanged overall and is still vulnerable in the following ways: • The data suggest that systemic risks arising from the
size and scope of intermediation remain much as before, with linkages across institutions in domestic financial systems still high and financial innovation and complex products taking on new forms.
• More importantly, some advanced economy financial institutions continue to rely heavily on wholesale funding, though in some cases this takes the form of relying on central bank liquidity support. In either case, it suggests that funding vulnerabilities remain.
• Since 2006, trend growth in cross-border bank linkages has continued after its dip in 2008–09, implying that ongoing retrenchment from some economies has coincided with flows moving to others. This is promising; such linkages will continue to permit better diversification of risks provided these movements are accompanied by appropriate risk management and good gover-nance within institutions. Nonetheless, without good risk management techniques and effective cross-border resolution schemes, the potential for disruptive withdrawals remains.
• The Basel capital rules are resulting in higher capital ratios and better-quality capital for many banks, but our findings suggest that these could also be raising the incentives to develop new
financial products. Banks are securitizing counter-party credit risk and attempting to raise profit-ability with more emphasis on non-interest-related activities.
• There is also a high chance that regulatory initia-tives could be moving intermediation to nonbank financial institutions. With nonbanks’ less regu-lated status and less intrusive supervision, new systemic risks may emerge.
One of the overarching intentions of the reform agenda is to render systemically important institu-tions less prone to failure and to prevent the use of taxpayer funds to avoid a collapse. The primary means of achieving this has been to increase capital and liquidity and other measures that increase explicit and implicit costs and reduce profitability. One of the key elements determining the future of the financial structure is how the pressure on profitability will play out. If investors in financial institutions continue to demand precrisis levels of return on equity, will the institutions achieve that by restructuring existing business lines, or will they be tempted to engage in new, risky activities in the search for return? There is a clear risk of further con-centration of trading activities in even fewer global institutions as they attempt to combine their fund-ing advantages with economies of scale to continue achieving an acceptable return. These institutions would become even more important.
At the same time, movements of some activities off of supervisors’ radar screens and into the shadow banking system may raise new concerns about transparency and the connection of those activities to the regulated banking system. Policymakers must vigilantly monitor the evolution of shadow banking, as is currently being done under the auspices of the FSB. For those jurisdictions with already substantial evidence of shadow banking, more needs to be done to ensure that potential risks are identified in a timely fashion and adequately addressed where needed.
Crisis management policies should act as a bridge, encouraging restructuring and disposal of bad assets, so the system can “reboot” on a safer path. It needs to be recognized that current crisis management pol-icies are not designed to fix longstanding structural issues, nor should they be. That said, crisis manage-

G LO B A L F I N A N C I A L S TA B I L I T Y R E P O RT
112 International Monetary Fund | October 2012
ment policies provide the needed breathing room to take actions to restructure banking operations and to deal with nonperforming assets or, if needed, to close nonviable institutions. Some economies, like the United States, have made good strides in this direction, while others, including some economies in the euro area, have not. Unlike in previous crises, the much needed deep restructuring has not yet occurred for the hardest-hit region.
Authorities have made much progress on the reform agenda, but several issues still need the attention of policymakers. While being cognizant of a tendency by government to over-regulate during periods of distress (potentially stifling economic ben-efits), we suggest that there are still some regulatory areas that remain unfinished or that may develop and require action because of unintended side effects of reform. The following is a list of those areas and a suggested agenda for further work.
too Important to Fail
• A global-level discussion on the pros and cons of direct business activity restrictions, because the effects of such national initiatives will not stop at the bor-ders. This discussion should address the question of whether imposing higher costs can be expected to lower systemic risks. If not, the questions become, will restraints on activities be more effective? And what might their cross-border implications be?
• Recovery and resolution planning for large institutions. Progress so far is uneven across economies and, especially for systemically important institutions, faster progress is needed. While a so-called living will is not a panacea for reducing risk at a financial institution, the discipline of constructing such a plan for its own demise can help it sort out its internal structures and enhance its governance mechanisms to control excessive risk taking. If properly imple-mented, implicit guarantees would be curtailed, lowering the potential use of taxpayer funds.
Financial Globalization
• Further progress on cross-border resolution. Global-ization works best when the flows are calm and consistent and disruptions can be handled in a
fair and transparent manner. Good management by financial institutions with cross-border activi-ties, well-coordinated supervision of cross-border institutions, and transparent methods of deal-ing with distress are all components of healthy financial globalization. Cross-border resolution remains the most difficult component of any plan to ensure a smooth unwinding of large global institutions—burden sharing and legal commit-ments are areas for further clarity (Leckow and Pazarbasioglu, 2012). The framework for coping with cross-border resolution needs to encourage operating behaviors, both by institutions them-selves and by their supervisors, that reduce the likelihood of having to resort to resolution.
Shadow Banking
• Enhanced monitoring of systemic risks posed by nonbanks. To the extent that nonbanks act like banks, a common set of prudential standards must be applied to both types of institution. Further monitoring to see where bank-like activi-ties pose systemic concerns needs to continue and be enhanced, since some of the cost pressures on banks mean some activities will undoubtedly move into the nonbank sector.
complexity and transparency
• Further thought on how to encourage the develop-ment of simpler products. While not inhibiting innovation, we need to have ways to encourage products that can be priced more accurately to reflect risks. Both the producers of such products and their customers should be able to see clearly where risks reside. For example, the new prod-ucts to securitize counterparty risks warrant close monitoring to ensure that they are transparent to investors and shareholders so they can appropri-ately price their exposures and to ensure that the products are not offsetting some of the goals of the new banking standards.
• More information to reveal interconnections and the buildup and spillover of risk. Lack of transparency on counterparty relationships, corporate gover-nance structures, and other potentially risk-laden

c h a p t e r 3 T h E R E F O R m AG E N dA: A N I N T E R I m R E P O RT O N P R O G R E S S TOwA R d A S A F E R F I N A N C I A L S YS T E m
International Monetary Fund | October 2012 113
conditions blocks investors and counterparties from imposing market discipline and prevents regulators and supervisors from taking early cor-rective actions.
Over-the-counter Derivatives
• More consideration of risks in moving OTC deriva-tives contracts to central counterparties (CCPs). Current efforts to reduce counterparty exposures through such moves come with some danger that the CCPs themselves will become too impor-tant to fail and that the “location” requirements enforced in multiple jurisdictions may create too many CCPs. These institutions could have diverse requirements and levels of oversight that would hinder the benefits of netting, increase the demands for collateral, and unnecessarily increase costs. In general, the international effort to har-monize approaches to reforms in OTC derivatives markets should be reenergized.
Other conditions
Though they are not part of the regulatory reforms effort, two conditions are essential if the reforms are to bring about a safer financial system: (1) strong supervision in implementing the reforms and (2) a private sector with the incentives to fol-low them. Without these elements, the reforms will wither and die.
Hence, we cannot overemphasize the importance of the role played by implementation of regula-tions—both in terms of the final version of rules at the national level and in terms of how those rules are
interpreted and enforced within and across institu-tions. National and regional approaches will vary considerably, and these have the potential to alter the effectiveness of the reforms, not only for themselves but globally as well. Hence, supervision must have a global focus. But with the system remaining complex, and with the set of new (detailed and complex) regulatory initiatives being added, a political and social consensus is needed to give supervisors the will to act and to be intrusive, skeptical, proactive, comprehensive, adaptive, and conclusive (Viñals and Fiechter, 2010).
In addition, the private sector needs to take its share of the responsibility for making financial systems safe for savers and investors—the ultimate beneficiaries. Compensation within institutions should seek to apportion rewards based on both risk and return. Governance structures should be set to support those responsible for ensuring the firm’s integrity and soundness. Product development should seek to satisfy customer’s bona fide needs in a manner that enables risk-adjusted pricing.
In summary, we must look beyond the crisis to ensure that the quick and urgent responses to problems arising during the crisis do not lead to new structural problems and do not fuel systemic risk down the road. To do this effectively, many of the key areas for further reform will require a strong global dialogue and commitment. Such action will help keep the benefits of global markets and institutions, miti-gate their downside risks, and avoid the pitfalls that accompany protective national tendencies.
G LO B A L F I N A N C I A L S TA B I L I T Y R E P O RT
114 International Monetary Fund | October 2012
annex 3.1. Financial Structure IndicesTo map the various aspects of financial structure
from the available economic indicators, the analysis in the chapter relies on indices as a way to aggre-gate information. All incorporated information is weighted equally in the associated index if not indicated otherwise. In addition, all indicators have been demeaned and divided by their standard devia-tion to equalize scaling patterns and to prevent more volatile indicators from determining the behavior of the aggregate index; and the corresponding means and standard deviations are calculated on the pooled country sample (across both time and economies) to enable cross-country comparisons while maintaining the time series structure of the underlying indica-tors. Finally, the frequency of the resulting indices is transformed from annual to five-year averages to filter business cycle patterns that are likely to interfere with the more persistent structural trends in the data.
Indices have been divided into various concepts. The concepts are partly borrowed from IMF (2006), which laid out the influence of different types of intermediation structures on economic cycles. Finan-cial systems in which intermediation is done at arm’s length—transactions between two unaffiliated parties or between two parties with no relationship to each other—have been found to facilitate consumption smoothing more effectively than systems that rely on relationships. At the same time, arm’s length systems make households sensitive to asset price changes
through leverage and wealth effects, exposing econo-mies to systemic risk.
In this chapter, the focus is on the difference between market-based systems (where there is a large role for banks doing nontraditional business, for nonbank intermediaries, and for the use of new financial products) and traditional bank-based inter-mediation structures (also see Box 3.1 for implica-tions of market-based systems for systemic risk). In addition, the chapter considers a different concept of structure that could result from the distinction between market-based and traditional relationship-based intermediation: scale and scope. This concept would involve size (credit, deposits, market capi-talization, securities holdings); domestic intercon-nectedness (interbank assets/total assets, interbank liabilities/total liabilities, and wholesale funding as a share of total liabilities); concentration (the asset share of the top three banks); and global intercon-nectedness (see Table 3.6 for the various indices).52
Not all indices were used in the chapter. However, those excluded are still presented here—some because they are used in Chapter 4 (at annual frequency) and some so that other users of such data can observe the types of data available for future studies. The correla-tions table (Table 3.1), the stylized facts (Figures 3.2, 3.4, and 3.5), and the tables showing econometric results (Tables 3.5, 3.9, and 3.10) are organized around these concepts of intermediation structures. See Table 3.6 for details on the components of the indices that represent these concepts.
52These concepts are partly based on the report to the G20 on identifying SIFIs (IMF-BIS-FSB, 2009) and the G-SIB identifica-tion methodology in BCBS (2011c). Note: Prepared by Michael Kleemann and Oksana Khadarina.
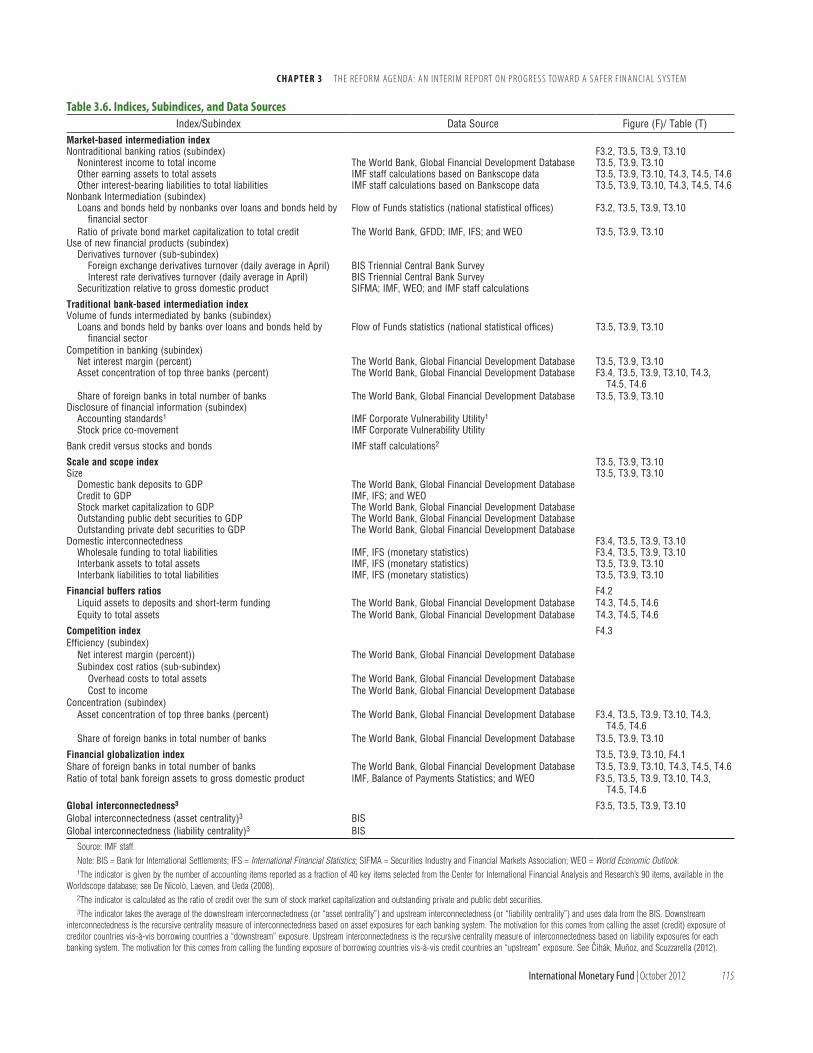
c h a p t e r 3 T h e R e f o R m Ag e n dA: A n I n T e R I m R e p o RT o n p R o g R e s s TowA R d A s A f e R f I n A n c I A l s ys T e m
International Monetary Fund | october 2012 115
table 3.6. Indices, Subindices, and Data SourcesIndex/Subindex Data Source Figure (F)/ Table (T)
Market-based intermediation indexNontraditional banking ratios (subindex) F3.2, T3.5, T3.9, T3.10
Noninterest income to total income The World Bank, Global Financial Development Database T3.5, T3.9, T3.10Other earning assets to total assets IMF staff calculations based on Bankscope data T3.5, T3.9, T3.10, T4.3, T4.5, T4.6Other interest-bearing liabilities to total liabilities IMF staff calculations based on Bankscope data T3.5, T3.9, T3.10, T4.3, T4.5, T4.6
Nonbank Intermediation (subindex)Loans and bonds held by nonbanks over loans and bonds held by
financial sectorFlow of Funds statistics (national statistical offices) F3.2, T3.5, T3.9, T3.10
Ratio of private bond market capitalization to total credit The World Bank, GFDD; IMF, IFS; and WEO T3.5, T3.9, T3.10Use of new financial products (subindex)
Derivatives turnover (sub-subindex)Foreign exchange derivatives turnover (daily average in April) BIS Triennial Central Bank Survey Interest rate derivatives turnover (daily average in April) BIS Triennial Central Bank Survey
Securitization relative to gross domestic product SIFMA; IMF, WEO; and IMF staff calculations
Traditional bank-based intermediation indexVolume of funds intermediated by banks (subindex)
Loans and bonds held by banks over loans and bonds held by financial sector
Flow of Funds statistics (national statistical offices) T3.5, T3.9, T3.10
Competition in banking (subindex) Net interest margin (percent) The World Bank, Global Financial Development Database T3.5, T3.9, T3.10Asset concentration of top three banks (percent) The World Bank, Global Financial Development Database F3.4, T3.5, T3.9, T3.10, T4.3,
T4.5, T4.6Share of foreign banks in total number of banks The World Bank, Global Financial Development Database T3.5, T3.9, T3.10
Disclosure of financial information (subindex)Accounting standards1 IMF Corporate Vulnerability Utility1 Stock price co-movement IMF Corporate Vulnerability Utility
Bank credit versus stocks and bonds IMF staff calculations2
Scale and scope index T3.5, T3.9, T3.10Size T3.5, T3.9, T3.10
Domestic bank deposits to GDP The World Bank, Global Financial Development DatabaseCredit to GDP IMF, IFS; and WEOStock market capitalization to GDP The World Bank, Global Financial Development DatabaseOutstanding public debt securities to GDP The World Bank, Global Financial Development DatabaseOutstanding private debt securities to GDP The World Bank, Global Financial Development Database
Domestic interconnectedness F3.4, T3.5, T3.9, T3.10Wholesale funding to total liabilities IMF, IFS (monetary statistics) F3.4, T3.5, T3.9, T3.10Interbank assets to total assets IMF, IFS (monetary statistics) T3.5, T3.9, T3.10Interbank liabilities to total liabilities IMF, IFS (monetary statistics) T3.5, T3.9, T3.10
Financial buffers ratios F4.2Liquid assets to deposits and short-term funding The World Bank, Global Financial Development Database T4.3, T4.5, T4.6Equity to total assets The World Bank, Global Financial Development Database T4.3, T4.5, T4.6
Competition index F4.3Efficiency (subindex)
Net interest margin (percent)) The World Bank, Global Financial Development DatabaseSubindex cost ratios (sub-subindex)
Overhead costs to total assets The World Bank, Global Financial Development DatabaseCost to income The World Bank, Global Financial Development Database
Concentration (subindex) Asset concentration of top three banks (percent) The World Bank, Global Financial Development Database F3.4, T3.5, T3.9, T3.10, T4.3,
T4.5, T4.6Share of foreign banks in total number of banks The World Bank, Global Financial Development Database T3.5, T3.9, T3.10
Financial globalization index T3.5, T3.9, T3.10, F4.1Share of foreign banks in total number of banks The World Bank, Global Financial Development Database T3.5, T3.9, T3.10, T4.3, T4.5, T4.6Ratio of total bank foreign assets to gross domestic product IMF, Balance of Payments Statistics; and WEO F3.5, T3.5, T3.9, T3.10, T4.3,
T4.5, T4.6
Global interconnectedness3 F3.5, T3.5, T3.9, T3.10Global interconnectedness (asset centrality)3 BISGlobal interconnectedness (liability centrality)3 BIS
Source: IMF staff.Note: BIS = Bank for International Settlements; IFS = International Financial Statistics; SIFMA = Securities Industry and Financial Markets Association; WEO = World Economic Outlook.1The indicator is given by the number of accounting items reported as a fraction of 40 key items selected from the Center for International Financial Analysis and Research’s 90 items, available in the
Worldscope database; see De Nicolò, Laeven, and Ueda (2008).2The indicator is calculated as the ratio of credit over the sum of stock market capitalization and outstanding private and public debt securities.3The indicator takes the average of the downstream interconnectedness (or “asset centrality”) and upstream interconnectedness (or “liability centrality”) and uses data from the BIS. Downstream
interconnectedness is the recursive centrality measure of interconnectedness based on asset exposures for each banking system. The motivation for this comes from calling the asset (credit) exposure of creditor countries vis-à-vis borrowing countries a “downstream” exposure. Upstream interconnectedness is the recursive centrality measure of interconnectedness based on liability exposures for each banking system. The motivation for this comes from calling the funding exposure of borrowing countries vis-à-vis credit countries an “upstream” exposure. See Cihák, Muñoz, and Scuzzarella (2012).

G LO B A L F I N A N C I A L S TA B I L I T Y R E P O RT
116 International Monetary Fund | October 2012
annex 3.2. regulatory Initiatives: proposals and Implementation Status
This annex details the status of selected regulatory reform proposals as of end-July 2012. It also pro-vides a summary of implementation by 12 selected economies and the European Union (shown in Table 3.8 at the end of this annex).
Banks
Capital
The Basel III standards established by the Basel Committee on Banking Supervision (BCBS) increase the amount of capital required, both through changes to the capital calculation and through changes to the definition of capital (Table 3.2). Basel III keeps the total capital ratio at the level specified in Basel I and Basel II, 8 percent of risk-weighted assets, but because it introduces major changes in the composition of capital and in the definition of eligible capital, many banks will nonetheless have to raise capital to meet the new standards. These new capital standards will be applicable to all major banks in most economies by 2019.
The new rules will require more common equity (as opposed to forms of capital such as hybrid and subordinated debt that proved to be less loss absorbing in the crisis). The definition of capi-tal will be further tightened, as banks will have a reduced ability to include intangibles such as good will and deferred tax assets as capital. They will not be allowed to include holdings in nonconsolidated financial companies as capital. In jurisdictions or institutions in which deferred tax assets have been a significant portion of capital, institutions will have to raise additional common equity.
Two capital buffers have been added: the so-called capital conservation buffer and countercyclical buffer. The capital conservation buffer is a layer of common equity that if encroached on will attract prompt supervisory corrective actions such as the suspension of dividends and bonus payments to management. The countercyclical buffer will be
applied by national authorities when there is exces-sive aggregate credit growth leading to the buildup of system-wide risk. In addition to capital buffers, global systemically important banks (G-SIBs) will be subject to additional capital requirements, usually referred to as a surcharge.
The new rules also increase capital that needs to be held against riskier activities by imposing specific capital charges for certain exposures, including the trading book and derivatives activities. The regula-tory capital calculation for market risk will include stressed inputs into the calculation and a charge for counterparty credit risk.
Liquidity
The Basel III rules will require banks to hold more highly liquid assets and better match the maturity of assets and liabilities. The BCBS has adopted these proposals, but final details are still subject to adjustment. The current international discussion focuses on the liquidity coverage ratio (LCR), which will be introduced before the net stable funding ratio (NSFR). Concerns have been raised regarding the challenges in implementing the LCR in some jurisdictions and unintended effects. The implemen-tation dates are 2015 for the LCR and 2018 for the NSFR. The BCBS has clarified that the LCR must be fully met in normal times but that banks should be allowed to use their pool of liquid assets in times of stress.
Leverage Ratio
The Basel reforms introduce a leverage ratio that will help authorities monitor the buildup of excessive leverage in the banking system. The leverage ratio limits the (unweighted) ratio of capital to total assets (including some off balance sheet items) to 3 percent and will act in tandem with the existing suite of risk-based capital ratios. The assignment of too-low risk weights was a weakness in the overall resilience of bank balance sheets, and the underweighting of what turned out to be riskier assets caused under-capitalization. Before the adoption of Basel I, several jurisdictions relied solely on the leverage ratio, which created incentives for banks to allocate resources to higher-risk assets because the returns on those assets were not offset by a requirement to hold larger
Note: Prepared by Ana Carvajal, Su Hoong Chang, Ellen Gaston, Fabiana Melo, André Santos, Katharine Seal, Jay Surti, Rodolfo Wehrhahn, and Mamoru Yanase.

c h a p t e r 3 T h E R E F O R m AG E N dA: A N I N T E R I m R E P O RT O N P R O G R E S S TOwA R d A S A F E R F I N A N C I A L S YS T E m
International Monetary Fund | October 2012 117
amounts of capital against them. By including some off balance sheet items, the leverage ratio will also, to some extent, address that area of risk.
Compensation and Governance
Various jurisdictions are putting rules in place to address the lack of effective alignment of compensa-tion with risk taking and the lack of governance of compensation by the boards of financial institutions. The FSB’s “Principles for Sound Compensation Practices” are general in nature and implementa-tion varies.53 Financial institutions’ practices have so far been widely divergent, and best practices are difficult to identify. The ultimate goal of changing major financial institutions’ culture and behavior is a long-term challenge. The BCBS included the FSB’s Principles as part of its Basel 2.5 framework. Compensation regulation for nonbanks is also an active issue—for example, the European Union has included compensation restrictions in its investment funds legislation.54
Banks’ corporate governance policies and practices have also come under renewed scrutiny, particularly in the context of systemically important financial institution (SIFI) supervision. Supervisory efforts are ongoing to address these issues, including the role of banks’ boards, with particular emphasis on risk management. The Basel Committee’s proposed revision of its Core Principles for Effective Banking Supervision includes a principle dedicated to corpo-rate governance.55
Business Model Restrictions
A number of jurisdictions are considering direct regulation of banks’ business models, most notably the United Kingdom with the Vickers proposals and the United States through the so-called Volcker rule
53See www.financialstabilityboard.org/list/fsb_publications/tid_123/index.htm.
54See for example, the European Union Directive on Alterna-tive Investment Fund Managers (2011/61/EU, http://ec.europa.eu/internal_market/investment/alternative_investments_en.htm), which applies remuneration rules to hedge fund managers; and the draft proposed European Union Directive on Undertakings in Collective Investments in Transferable Securities (UCITS V, http://eur-lex.europa.eu/LexUriServ/LexUriServ.do?uri=CELEX:52008PC0458:EN:HTML), which will apply to mutual fund managers.
55See www.bis.org/publ/bcbs213.htm.
in the Dodd-Frank Act (Table 3.2). These initiatives seek to reduce systemic risk in the financial system and the wider economy by prohibiting deposit-funded banks from engaging in certain investment banking businesses that are deemed to be too risky (such as proprietary trading, and the ownership or control of hedge funds and private equity arms). The aim is to improve resolvability and reduce the extent of too-important-to-fail issues.56
Resolution of Cross-Border Institutions and SIFIs
Reforms aimed at ensuring the smooth resolution of large failed institutions (especially global ones) could also have implications for the ex ante structure of the financial system. Recent initiatives are shown in Table 3.7.
Improving resolution frameworks, particularly for cross-border institutions and institutions deemed to be too important to fail has been a key focus of the overall regulatory reform agenda. Enhanced resolution frameworks and living wills are aimed at improving the ability of policymakers to resolve institutions, thus reducing moral hazard and reintroducing market discipline that might curb excessive risk taking. The ability to resolve institutions provides greater certainty and curbs contagion in times of distress.
The FSB has been instrumental in providing the cross-border element of the discussions, providing the basic principles that should underlie resolution frameworks to make them consistent across econo-mies. Its October 2011 “Key Attributes of Effec-tive Resolution Regimes for Financial Institutions” (FSB, 2011a) seeks to ensure that national frame-works are designed in a manner that enables and encourages the relevant authorities to cooperate with their counterparts in other jurisdictions in the resolution of a cross-border financial institution or group. In June, the EU proposed a Directive estab-lishing a framework for recovery and resolution of credit institutions and investment firms.57 A few key issues that may affect financial sector structure
56Also see Chow and Surti (2011).57 The proposed EU Directive was published June 6,
2012, and is subject to the approval of the European Par-liament Council (http://ec.europa.eu/internal_market/bank/docs/crisis-management/2012_eu_framework/COM_2012_280_en.pdf ).

G LO B A L F I N A N C I A L S TA B I L I T Y R E P O RT
118 International Monetary Fund | October 2012
include “bail in”—whereby unsecured debt holders may have their holdings converted to equity at par-ticular trigger points—and measures to simplify the operational complexity and structure of banks (e.g., “living wills”). Implementation of many of these changes, including bail-in, has not yet taken place. As discussed in earlier IMF staff work, however, the bail-in remains untested in a systemic crisis, and its effectiveness may be hampered by the lack of unen-cumbered collateral (Zhou and others, 2012).
Markets: Over-the-counter Derivatives reforms
A series of reforms under way for OTC deriva-tives are affecting the way derivatives are traded, reported, and cleared, as well as the capital required for bilateral trading. Articulation and implementa-tion of these rules are not fully complete. The basic thrust of the reforms is to move more OTC bilateral derivatives contracts to central counterparties (CCPs) and, where possible, to organized exchange trading platforms, while potentially increasing the transpar-ency of the market via reporting of transactions to trade repositories (TRs). The high-level principles for the design of CCPs and TRs have been prepared by the international standard setters, but the practical implementation in different jurisdictions remains a work in progress, with efforts in Japan, the United States, and the European Union being the most advanced.
OTC derivatives reforms are aimed at increas-ing transparency, mitigating systemic risk, and protecting against market abuse. Organized trading platforms contribute to price formation and increase the transparency of trades, assist-ing regulators in detecting market abuse. A CCP replaces bilateral counterparty risk with a single exposure to the CCP and further reduces expo-sures through multilateral netting and posted collateral. The exposures are reduced by collateral that is calculated and collected at least daily. In case of default by one of its participants the CCP can transfer customer positions and collateral to solvent CCP members and coordinate the orderly replacement of defaulted trades through auctions and hedging. Data provided by TRs to regulators and other relevant authorities will help them discharge their responsibilities in rela-tion to OTC derivatives markets. For example, prudential regulators will have access to data on bank and securities firm positions (counterparties and underlyings), market authorities can use the data to monitor and address market abuse, and macroprudential authorities can assess system-wide risks. Margin requirements for non-centrally cleared contracts (and higher capital requirements for banks when margins are not posted) promote the movement of contracts to CCPs and thereby help reduce counterparty risks, systemic risks, and interconnectedness.
table 3.7. Snapshot of the New Global regulatory Initiatives: resolution of G-SIFIsKey initiative Elements
Global reformsFSB "Key Attributes"1 • Sets out core elements of a resolution framework and improved capacity for cross-border resolution,
including designation of a resolution authority with appropriate powers; provisions for netting, offsetting, and segregation of client assets; provisions for funding of resolution; introduction of cross-border crisis management groups; and requirements for recovery and resolution plans for large institutions.
Statutory "bail in" powers
• The FSB Key Attributes include statutory powers to convert unsecured and uninsured creditor claims into equity at a certain threshold of financial distress of the institution (when it is no longer viable, etc.).
Recovery and resolution plans (RRPs)2
Crisis management groups
• Major international institutions (G-SIFIs) and their host authorities are to draft RRPs setting out specific actions that the firm could take to facilitate a recovery in response to stress and how they could be resolved if necessary.
• Supervisors to review and crisis management groups to assess these for G-SIFIs.• Authorities from home and key host jurisdictions form groups to assess recovery and resolution plans
of G-SIFIs and enhance preparedness for the management and resolution of a cross-border crisis.Source: IMF staff.
Note: FSB = Financial Stability Board; G-SIFIs = global systemically important financial institutions.1The FSB "Key Attributes of Effective Resolution Regimes for Financial Instructions," October 2011.2Also known as "living wills."

c h a p t e r 3 T h E R E F O R m AG E N dA: A N I N T E R I m R E P O RT O N P R O G R E S S TOwA R d A S A F E R F I N A N C I A L S YS T E m
International Monetary Fund | October 2012 119
Nonbanks: Shadow Banking
Regulatory change focused on shadow banking has varied depending on the type of institution or activity viewed as problematic. The role played in credit intermediation by nonbank entities such as special-purpose vehicles and money market funds came to the fore during the crisis; weaknesses in prudential regulation and oversight of these entities are seen as a key failing. More stringent regulation of the banking sector may drive risks to other financial entities that may not be adequately regulated or supervised. Authorities are now placing increased emphasis on the monitoring of risks arising from credit intermediation-like activities in the non-banking sector—those of shadow banks—with the application of robust prudential regulation and supervision where such activities pose a risk to finan-cial stability.
The focus on shadow banking has triggered enhancements in the regulation of certain activities (including securitization) and has brought renewed attention to entities that had not yet been regulated (e.g., requiring the registration of hedge funds). At the international level, the FSB is considering a number of changes, including regulating the interac-tion of banks with shadow banks, banks’ reliance on short-term funding (including through money market funds), and securities lending and repurchase agreements (repos).
Progress in advancing the regulation of other financial institutions that could pose systemic risk (for example, securities intermediaries and finance companies) is slower because the legal forms of those entities vary across jurisdictions, making it difficult to develop globally applicable recommendations. The development of a methodology to identify nonbank SIFIs is also at an early stage. At the domestic level, some regulators have addressed the potential sys-temic implications of entities and/or activities that in their jurisdictions fall under the definition of shadow banking. That is the case with money market funds in the United States, where certain reforms have already been implemented and additional measures to address potential runs are being considered.58 The
58Since the September 16, 2008, episode of a money market fund “breaking the buck” (in which the net asset value of a share
authorities in India also strengthened the framework for money market funds in light of stress pressures observed during the current crisis.
Other Initiatives
Insurance
The forum for authorities to discuss global insur-ance regulation is the International Association of Insurance Supervisors (IAIS), whose current propos-als for group-wide supervision are summarized in Table 3.2.
Group-wide supervision—The bailout of AIG Group is expected to lead to a more intensive level of supervision for insurance groups. In October 2011, the IAIS significantly strengthened the super-visory standards relating to group supervision.59 The key objectives are to minimize regulatory arbitrage, reduce contagion risks, and address complex group structures that hinder effective supervision. Non-regulated entities within an insurance group are now brought within the regulatory perimeter to allow for a holistic supervisory assessment. Enhanced super-vision of internationally active insurance groups (IAIGs) is targeted at reducing the impact of their failure on the financial system.60
falls below $1), the U.S. Securities and Exchange Commission has implemented several reforms for money market funds, including the establishment of a liquidity ratio, additional restrictions in connection with eligible assets (aimed at enhancing the “quality” of the assets), and the shortening of portfolio duration. Although these reforms have strengthened investor protections, they do not seem to have fully addressed systemic risk concerns associated with a run on money market funds. Two main proposals are being considered in that regard: (1) moving from a constant ($1) to a variable net asset value of shares (thus making investors bear the risks of the portfolio) and (2) keeping a constant net asset value but with a capital buffer, possibly combined with restrictions on withdrawals.
59Insurance Core Principles, Standards, Guidance and Assess-ment Methodology, issued by the IAIS on October 1, 2011, applies explicitly to insurance groups (www.iaisweb.org/Insurance-Core-Principles-material-adopted-in-2011-795).
60 Two criteria are proposed for identifying IAIGs: international activity—premiums are written in not less than three jurisdictions, and the percentage of gross premiums outside the home jurisdic-tion is not less than 10 percent of the group’s total gross written premium; and size—total assets of not less than $50 billion or gross written premiums of not less than $10 billion.

G LO B A L F I N A N C I A L S TA B I L I T Y R E P O RT
120 International Monetary Fund | October 2012
A multilateral supervisory framework, ComFrame,61 is intended to provide a better struc-ture for home and host supervisor cooperation and information sharing, leading to more effective super-vision of IAIGs while reducing duplicative super-visory efforts. In the absence of a global solvency regime for insurers, ComFrame seeks to establish a set of “partly harmonized” standards and parameters, including a common definition of capital resources, to facilitate capital assessment at the group level.62 Regulatory requirements on intragroup exposures and risk concentrations, aggregate group exposures, and transferability of financial resources are intended to motivate more effective management of contagion risks.
Systemically important insurers—The IAIS is currently formulating policy measures applicable to global systemically important insurers (G-SIIs), in line with the FSB’s regulatory reform agenda.63 The objective is to limit the impact of G-SIIs on finan-cial stability and improve the resilience of G-SIIs that remain large and complex. The methodology proposed by the IAIS for identifying G-SIIs gives the highest weight to the indicator for NTNIA (non-traditional insurance and noninsurance activities) and the second highest to interconnectedness.64 It is envisaged that G-SIIs may be subject to additional policy measures designed to provide regulatory incentives for them to reduce their potential sys-temic impact. These may include enhanced super-
61The IAIS issued Common Framework for the Supervision of Internationally Active Insurance Groups as a public consultation document in July 2012, with comments due on August 31 (www.iaisweb.org/ComFrame-938).
62ComFrame proposes to establish group regulatory capital at a level sufficient in times of adversity to allow an IAIG to meet its obligations to policyholders as they fall due; and it proposes that the calculation of capital be based on risk measurement criteria. A partly harmonized approach to these risk management criteria is currently a work in progress.
63The IAIS issued Global Systematically Important Insurers: Proposed Assessment Methodology as a public consultation docu-ment in May 2012, with comments due on July 31 (www.iaisweb.org/G-SIIs--918).
64Five key indicators were used: NTNIA (40 to 50 percent weighting), interconnectedness (30 to 40), size (5 to 10), global activities (5 to 10), and substitutability (5 to 10). Examples of NTNIA include financial guarantee insurance, finite reinsur-ance, purely synthetic investment portfolios, cascade of repos and securities lending, CDS/CDO underwriting, and third party asset management.
vision, improved resolvability, structural measures (e.g., separation of, or restrictions on, NTNIA), and higher loss absorbency.
Solvency II—With about 30 of the largest global insurance groups domiciled in the European Union, engagement with them by the EU authorities and the timely evaluation of their prudential conditions will be essential for global financial stability. Under current plans, Solvency II will replace the current regulatory framework (Solvency I) in the European Union in January 2014.65 Solvency II is a risk-sen-sitive solvency regime, similar in approach to Basel II, that takes into account all key risks of insurers, recognizing the interdependence between assets, liabilities, regulatory capital requirements, and capi-tal resources. It is based on three pillars: quantitative requirements, qualitative requirements such as risk management, and supervisory reporting. The use of internal models for capital calculations is encouraged for larger complex groups.
The reform of regulation pertaining to credit ratings aims to force both the credit ratings agencies (CRAs) and financial institutions to move toward a better understanding of the risks embedded in products and securities. The crisis revealed limita-tions in the way CRAs assess risks, in particular in connection with structured products. At the same time, market participants rely mechanistically on such ratings. In this context, unexpected negative outlooks and downgrades of rated securities below established thresholds have led to forced sales and negative price dynamics. Reduced reliance on ratings should improve the conduct of due diligence by market participants and help avoid forced sales and other such “cliff effects.” Because ratings will con-tinue to be used, it is critical that CRAs strengthen the quality of their rating processes, which have gen-erally been conducted under an “issuer pay” model, in which the issuer of the rated instrument pays the CRA for the rating. Registration regimes can play a role in this regard by ensuring that CRA governance policies are in place to mitigate the inherent conflicts of interest in the issuer-pay model.
65Solvency II Directive (2009/138/EC, http://eur-lex.europa.eu/LexUriServ/LexUriServ.do?uri=OJ:L:2009:335:0001:01:EN:HTML).

c h a p t e r 3 T h E R E F O R m AG E N dA: A N I N T E R I m R E P O RT O N P R O G R E S S TOwA R d A S A F E R F I N A N C I A L S YS T E m
International Monetary Fund | October 2012 121
Accounting Rules
Understanding the condition of both financial and nonfinancial firms (and hence counterparty and credit risk) depends on good-quality financial accounts that are comparable across institutions. The evolution of global accounting standards and the focus on improving their quality has been a key fea-ture of accounting policymaking for some years, but differences in approach across jurisdictions remain. Global convergence has also been the theme. Over 120 jurisdictions have adopted the International Financial Reporting Standards (IFRS) system, albeit in many cases under different mechanisms, while GAAP (generally accepted accounting principles) remains the standard in the United States. Conver-gence and enhancement of U.S. and international accounting standards will foster greater comparabil-ity of data and therefore improve transparency in markets and institutions. Even though convergence
has been agreed on in principle by the two major accounting bodies—the International Accounting Standards Board (IASB) and, in the United States, the Financial Accounting Standards Board (FASB)—in reality the United States has been slow in setting a timetable for IFRS adoption.66 The two boards have achieved convergence of IFRS and GAAP in some key areas, but they have missed the end-2011 target date set by the FSB and the G20. The FSB and G20 subsequently encouraged the IASB and FASB to achieve convergence regarding their most important projects by their expected timeframe of mid-2013.
66The Work Plan for the Consideration of Incorporating Interna-tional Financial Reporting Standards into the Financial Reporting System for U.S. Issuers: Final Staff Report, issued in July 2012 by the staff of the U.S. Securities and Exchange Commission, did not make a recommendation on whether IFRS “should be incorporated into the financial reporting system for U.S. issuers” (“Introductory Note” to the report), www.sec.gov/spotlight/globa-laccountingstandards/ifrs-work-plan-final-report.pdf.

G LO B A L F I N A N C I A L S TA B I L I T Y R E P O RT
122 International Monetary Fund | October 2012
table 3.8. Status of Initiatives, by Selected economyBrazil Canada China European Union Hong Kong SAR India Japan Russia Singapore South Africa Switzerland United Kingdom United States
Capital requirements Higher overall capital—Basel III or other
Currently above Basel III. Draft regulation implementing Basel III. New CET1 to be fully met by Jan. 2013.
Draft regulation issued in Aug. 2012. Implementation will follow Basel III schedule.
Basel III regulation finalized and released in June 2012, will be implemented from Jan. 1, 2013, to 2018. The minimum CARs are set at 5% for core Tier 1 capital, 6% for Tier 1 capital, and 8% for total capital.
Draft rules implementing Basel III. Countries will be limited in their capacity to require more capital than the Basel III minimum. Current draft allows for a 3% systemic buffer.
HKMA Banking Amendment bill introduced to legislative council in Dec. 2011. The bill was passed by the Legislative Council in Feb. 2012 and became the Banking (Amendment) Ordinance 2012.
Final Basel III regulations issued. Implementation as scheduled.
Final regulations for Basel III published. Implementation as scheduled.
No draft regulation has yet been published. Legal powers to implement Basel III pending legislative amendment.
Draft Basel III regulation published. Requires Singapore-incorporated banks to meet minimum CARs of 6.5% for CET1, 8% for Tier 1, and 10% for total capital as of Jan. 1, 2015.
Draft legislation published.
Draft regulation implementing Basel III published.
Draft rules, plus draft legislation requiring above Basel III.
Draft regulation implementing Basel III, applies only to bank holding companies with more than $500 million in total consolidated assets.
Higher quality capital Currently above Basel II. Draft regulation implementing Basel III.
Draft regulation issued in Aug. 2012. Implementation will follow Basel III schedule.
Basel III regulation finalized and released in June 2012, will be implemented from Jan. 1, 2013, to 2018.
Draft rules implementing Basel III. Deductions not aligned with Basel III.
New law to implement Basel III was approved in Feb. 2012.
Final Basel III regulations issued. Implementation as scheduled.
Final regulations for Basel III published. Implementation as scheduled.
No draft regulation has yet been published. Legal powers to implement Basel III pending legislative amendment.
Draft Basel III regulation published. Requires Singapore-incorporated banks to meet minimum CARs of 6.5% for CET1, 8% for Tier 1, and 10% for total capital as of Jan. 1, 2015.
Draft legislation published.
Draft regulation implementing Basel III published.
Draft rules, plus draft legislation requiring higher than Basel III capital, composed of common equity.
Draft regulation implementing Basel III, applies only to bank holding companies with more than $500 million in total consolidated assets.
G-SIFI buffer n.a. n.a. Basel III regulation finalized and released in June 2012; will be implemented from Jan. 1, 2013, to 2018. Additional capital requirements for D-SIBs are 1%. If the D-SIB is a G-SIB, the additional capital requirement cannot be lower than the Basel minimum level.
Draft rules implementing Basel III. Countries will be limited in their capacity to require more capital than the Basel III minimum. Current draft allows for a 3% systemic buffer; unclear whether the same provision will be used for countries that are home supervisors of G-SIBs. The systemic risk buffers can apply to all banks in the system.
n.a. n.a. n.a. n.a. n.a. n.a. Legislation adopted Sept. 2011, draft regulation published Dec. 2011. On top of CET1, SIBs must have a capital conservation buffer of 8.5% (5.5% conservation buffer and additional 3% in “recovery CoCos”) and a systemic surcharge of up to 6% (depending on market share and balance sheet size), bringing total capital requirements to 19%.
Draft legislation requiring buffers above Basel III capital, composed of common equity.
G-SIBs not yet covered, as BCBS has not finalized its framework. There are references to systemic institutions in Dodd Frank (sections 165 and 166) as passed in Dec. 2011
Capital conservation buffer
Draft regulation implementing Basel III includes the buffer according to the Basel schedule.
To be phased in starting in 2016.
Basel III regulation finalized and released in June 2012, will be implemented from Jan. 1, 2013, to 2018.
Draft rules implementing Basel III.
HKMA Banking Amendment bill introduced to legislative council in Dec. 2011. The bill was passed by the Legislative Council in Feb. 2012 and became the Banking (Amendment) Ordinance 2012.
Final Basel III regulations issued. Implementation as scheduled.
Not published yet. No draft regulation published yet. Legal powers to implement Basel III pending legislative amendment.
Draft Basel III regulation published. Capital conservation buffer will be phased in according to the Basel III schedule.
Draft legislation implementing Basel III published May 2012. The minimum required capital, including a conservation buffer, would increase from 9.5% in 2013 to 12.5% in 2019.
Draft regulation implementing Basel III published.
Draft rules. Draft regulation, limited scope of application. Includes capital conservation buffer of 2.5%.
(continued)
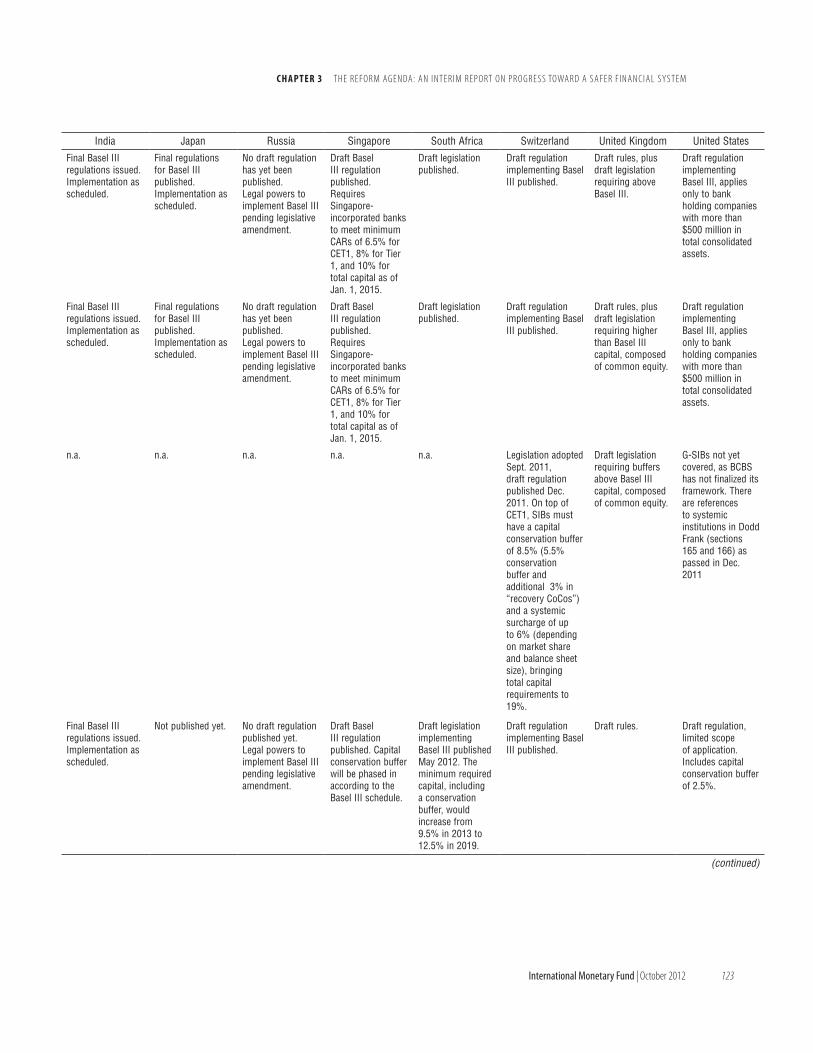
c h a p t e r 3 T h E R E F O R m AG E N dA: A N I N T E R I m R E P O RT O N P R O G R E S S TOwA R d A S A F E R F I N A N C I A L S YS T E m
International Monetary Fund | October 2012 123
table 3.8. Status of Initiatives, by Selected economyBrazil Canada China European Union Hong Kong SAR India Japan Russia Singapore South Africa Switzerland United Kingdom United States
Capital requirements Higher overall capital—Basel III or other
Currently above Basel III. Draft regulation implementing Basel III. New CET1 to be fully met by Jan. 2013.
Draft regulation issued in Aug. 2012. Implementation will follow Basel III schedule.
Basel III regulation finalized and released in June 2012, will be implemented from Jan. 1, 2013, to 2018. The minimum CARs are set at 5% for core Tier 1 capital, 6% for Tier 1 capital, and 8% for total capital.
Draft rules implementing Basel III. Countries will be limited in their capacity to require more capital than the Basel III minimum. Current draft allows for a 3% systemic buffer.
HKMA Banking Amendment bill introduced to legislative council in Dec. 2011. The bill was passed by the Legislative Council in Feb. 2012 and became the Banking (Amendment) Ordinance 2012.
Final Basel III regulations issued. Implementation as scheduled.
Final regulations for Basel III published. Implementation as scheduled.
No draft regulation has yet been published. Legal powers to implement Basel III pending legislative amendment.
Draft Basel III regulation published. Requires Singapore-incorporated banks to meet minimum CARs of 6.5% for CET1, 8% for Tier 1, and 10% for total capital as of Jan. 1, 2015.
Draft legislation published.
Draft regulation implementing Basel III published.
Draft rules, plus draft legislation requiring above Basel III.
Draft regulation implementing Basel III, applies only to bank holding companies with more than $500 million in total consolidated assets.
Higher quality capital Currently above Basel II. Draft regulation implementing Basel III.
Draft regulation issued in Aug. 2012. Implementation will follow Basel III schedule.
Basel III regulation finalized and released in June 2012, will be implemented from Jan. 1, 2013, to 2018.
Draft rules implementing Basel III. Deductions not aligned with Basel III.
New law to implement Basel III was approved in Feb. 2012.
Final Basel III regulations issued. Implementation as scheduled.
Final regulations for Basel III published. Implementation as scheduled.
No draft regulation has yet been published. Legal powers to implement Basel III pending legislative amendment.
Draft Basel III regulation published. Requires Singapore-incorporated banks to meet minimum CARs of 6.5% for CET1, 8% for Tier 1, and 10% for total capital as of Jan. 1, 2015.
Draft legislation published.
Draft regulation implementing Basel III published.
Draft rules, plus draft legislation requiring higher than Basel III capital, composed of common equity.
Draft regulation implementing Basel III, applies only to bank holding companies with more than $500 million in total consolidated assets.
G-SIFI buffer n.a. n.a. Basel III regulation finalized and released in June 2012; will be implemented from Jan. 1, 2013, to 2018. Additional capital requirements for D-SIBs are 1%. If the D-SIB is a G-SIB, the additional capital requirement cannot be lower than the Basel minimum level.
Draft rules implementing Basel III. Countries will be limited in their capacity to require more capital than the Basel III minimum. Current draft allows for a 3% systemic buffer; unclear whether the same provision will be used for countries that are home supervisors of G-SIBs. The systemic risk buffers can apply to all banks in the system.
n.a. n.a. n.a. n.a. n.a. n.a. Legislation adopted Sept. 2011, draft regulation published Dec. 2011. On top of CET1, SIBs must have a capital conservation buffer of 8.5% (5.5% conservation buffer and additional 3% in “recovery CoCos”) and a systemic surcharge of up to 6% (depending on market share and balance sheet size), bringing total capital requirements to 19%.
Draft legislation requiring buffers above Basel III capital, composed of common equity.
G-SIBs not yet covered, as BCBS has not finalized its framework. There are references to systemic institutions in Dodd Frank (sections 165 and 166) as passed in Dec. 2011
Capital conservation buffer
Draft regulation implementing Basel III includes the buffer according to the Basel schedule.
To be phased in starting in 2016.
Basel III regulation finalized and released in June 2012, will be implemented from Jan. 1, 2013, to 2018.
Draft rules implementing Basel III.
HKMA Banking Amendment bill introduced to legislative council in Dec. 2011. The bill was passed by the Legislative Council in Feb. 2012 and became the Banking (Amendment) Ordinance 2012.
Final Basel III regulations issued. Implementation as scheduled.
Not published yet. No draft regulation published yet. Legal powers to implement Basel III pending legislative amendment.
Draft Basel III regulation published. Capital conservation buffer will be phased in according to the Basel III schedule.
Draft legislation implementing Basel III published May 2012. The minimum required capital, including a conservation buffer, would increase from 9.5% in 2013 to 12.5% in 2019.
Draft regulation implementing Basel III published.
Draft rules. Draft regulation, limited scope of application. Includes capital conservation buffer of 2.5%.
(continued)
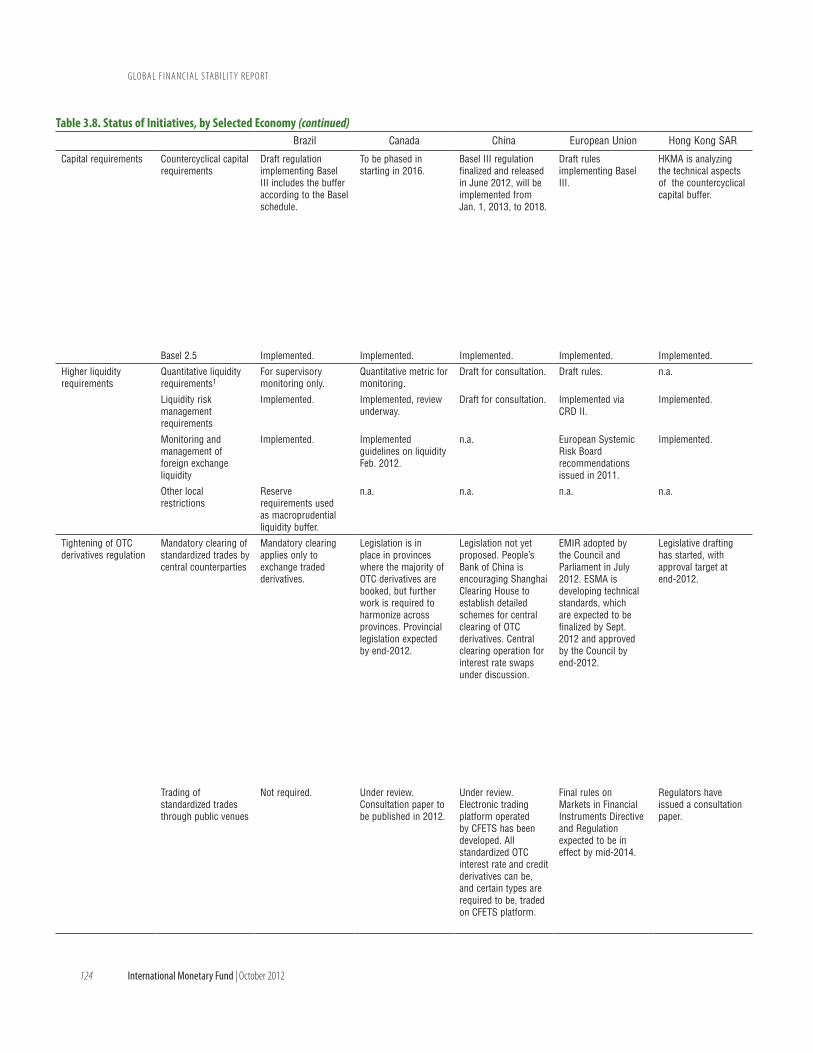
G LO B A L F I N A N C I A L S TA B I L I T Y R E P O RT
124 International Monetary Fund | October 2012
table 3.8. Status of Initiatives, by Selected economy (continued)Brazil Canada China European Union Hong Kong SAR India Japan Russia Singapore South Africa Switzerland United Kingdom United States
Capital requirements Countercyclical capital requirements
Draft regulation implementing Basel III includes the buffer according to the Basel schedule.
To be phased in starting in 2016.
Basel III regulation finalized and released in June 2012, will be implemented from Jan. 1, 2013, to 2018.
Draft rules implementing Basel III.
HKMA is analyzing the technical aspects of the countercyclical capital buffer.
Final Basel III regulations issued. Implementation as scheduled.
Not published yet. No draft regulation has yet been published. Legal powers to implement Basel III pending legislative amendment.
MAS should have in place a countercyclical capital framework by Jan. 1, 2016. MAS will have discretion to make decisions on the triggers for, and size of, the countercyclical capital buffer.
Countercyclical buffer of up to 2.5% is still to be finalized.
Draft regulation implementing Basel III published.
Draft rules. Proposed legislation applies countercyclical buffer only to banks using advanced IRB approach. Initially buffer set to zero and may increase in times of high credit growth. Banks will have 12-month transition time to comply after an announcement.
Basel 2.5 Implemented. Implemented. Implemented. Implemented. Implemented. Implemented. Implemented. Draft regulation. Implemented. Implemented. Implemented. Implemented. Draft regulation.
Higher liquidity requirements
Quantitative liquidity requirements1
For supervisory monitoring only.
Quantitative metric for monitoring.
Draft for consultation. Draft rules. n.a. n.a. Basel III schedule. Since 2004; reviewed in 2011.
Not required. Basel III timetable. For G-SIBs only. Implemented 2010. n.a.
Liquidity risk management requirements
Implemented. Implemented, review underway.
Draft for consultation. Implemented via CRD II.
Implemented. Draft regulation. Implemented. Since 2004; reviewed in 2011.
Revised guidance. Required since 2009.
For G-SIBs only. Implemented 2010. Introduced in 2010.
Monitoring and management of foreign exchange liquidity
Implemented. Implemented guidelines on liquidity Feb. 2012.
n.a. European Systemic Risk Board recommendations issued in 2011.
Implemented. Implemented. n.a. n.a. Through on-site supervision.
Limits on regulated and net open positions.
n.a. ESRB recommendations issued 2011.
n.a.
Other local restrictions
Reserve requirements used as macroprudential liquidity buffer.
n.a. n.a. n.a. n.a. n.a. n.a. n.a. n.a. n.a. n.a. n.a. n.a.
Tightening of OTC derivatives regulation
Mandatory clearing of standardized trades by central counterparties
Mandatory clearing applies only to exchange traded derivatives.
Legislation is in place in provinces where the majority of OTC derivatives are booked, but further work is required to harmonize across provinces. Provincial legislation expected by end-2012.
Legislation not yet proposed. People’s Bank of China is encouraging Shanghai Clearing House to establish detailed schemes for central clearing of OTC derivatives. Central clearing operation for interest rate swaps under discussion.
EMIR adopted by the Council and Parliament in July 2012. ESMA is developing technical standards, which are expected to be finalized by Sept. 2012 and approved by the Council by end-2012.
Legislative drafting has started, with approval target at end-2012.
Legislation not yet proposed. CCIL to transition soon to guaranteed settlement of interest rate swaps; no immediate timeframe for guaranteed settlement of CDS.
Legislation adopted via reform to the Financial Instruments and Exchange Act in May 2010. Initially the obligation will apply only to yen interest rate swaps and CDS. A cabinet ordinance to be implemented by November 2012 includes a requirement for central clearance of “trades that are significant in volume and would reduce settlement risk in the domestic markets.”
Legislation relating to clearing services and legislation relating to tax code create the legal basis for promulgation of regulation dealing with central clearing of standardized OTC derivatives. They have both been adopted. Pending regulations that implement new requirements.
Public consultation issued in Feb. 2012. Legislation to be introduced by end-2012.
Financial Markets Bill submitted to the National Treasury.
A working group was set up in 2011. Draft legislation scheduled for consultation in the second half of 2012.
EMIR adopted by the Council and Parliament in July 2012. ESMA is developing technical standards that are expected to be finalized by Sept. 2012 and approved by the Council by end-2012.
Dodd-Frank Act adopted in 2010. CFTC and SEC are finalizing regulations.
Trading of standardized trades through public venues
Not required. Under review. Consultation paper to be published in 2012.
Under review. Electronic trading platform operated by CFETS has been developed. All standardized OTC interest rate and credit derivatives can be, and certain types are required to be, traded on CFETS platform.
Final rules on Markets in Financial Instruments Directive and Regulation expected to be in effect by mid-2014.
Regulators have issued a consultation paper.
No legislation planned.
Legislation proposed in March 2012. A cabinet ordinance will be drafted afterward.
Law regulating electronic platform trading has been adopted; regulations are pending.
Public consultation issued in Feb. 2012; feedback is under review.
The authorities do not anticipate that electronic trading of OTC derivatives will be required.
A working group has been set up to consider the need for any changes.
Final rules on Markets in Financial Instruments Directive and Regulation are expected to be in effect by mid-2014.
Adopted in Dodd Frank Act. Law requires that any swap or security-based swap subject to clearing requirement be traded on a registered platform. CFTC and SEC are finalizing regulations.
(continued)

c h a p t e r 3 T h E R E F O R m AG E N dA: A N I N T E R I m R E P O RT O N P R O G R E S S TOwA R d A S A F E R F I N A N C I A L S YS T E m
International Monetary Fund | October 2012 125
table 3.8. Status of Initiatives, by Selected economy (continued)Brazil Canada China European Union Hong Kong SAR India Japan Russia Singapore South Africa Switzerland United Kingdom United States
Capital requirements Countercyclical capital requirements
Draft regulation implementing Basel III includes the buffer according to the Basel schedule.
To be phased in starting in 2016.
Basel III regulation finalized and released in June 2012, will be implemented from Jan. 1, 2013, to 2018.
Draft rules implementing Basel III.
HKMA is analyzing the technical aspects of the countercyclical capital buffer.
Final Basel III regulations issued. Implementation as scheduled.
Not published yet. No draft regulation has yet been published. Legal powers to implement Basel III pending legislative amendment.
MAS should have in place a countercyclical capital framework by Jan. 1, 2016. MAS will have discretion to make decisions on the triggers for, and size of, the countercyclical capital buffer.
Countercyclical buffer of up to 2.5% is still to be finalized.
Draft regulation implementing Basel III published.
Draft rules. Proposed legislation applies countercyclical buffer only to banks using advanced IRB approach. Initially buffer set to zero and may increase in times of high credit growth. Banks will have 12-month transition time to comply after an announcement.
Basel 2.5 Implemented. Implemented. Implemented. Implemented. Implemented. Implemented. Implemented. Draft regulation. Implemented. Implemented. Implemented. Implemented. Draft regulation.
Higher liquidity requirements
Quantitative liquidity requirements1
For supervisory monitoring only.
Quantitative metric for monitoring.
Draft for consultation. Draft rules. n.a. n.a. Basel III schedule. Since 2004; reviewed in 2011.
Not required. Basel III timetable. For G-SIBs only. Implemented 2010. n.a.
Liquidity risk management requirements
Implemented. Implemented, review underway.
Draft for consultation. Implemented via CRD II.
Implemented. Draft regulation. Implemented. Since 2004; reviewed in 2011.
Revised guidance. Required since 2009.
For G-SIBs only. Implemented 2010. Introduced in 2010.
Monitoring and management of foreign exchange liquidity
Implemented. Implemented guidelines on liquidity Feb. 2012.
n.a. European Systemic Risk Board recommendations issued in 2011.
Implemented. Implemented. n.a. n.a. Through on-site supervision.
Limits on regulated and net open positions.
n.a. ESRB recommendations issued 2011.
n.a.
Other local restrictions
Reserve requirements used as macroprudential liquidity buffer.
n.a. n.a. n.a. n.a. n.a. n.a. n.a. n.a. n.a. n.a. n.a. n.a.
Tightening of OTC derivatives regulation
Mandatory clearing of standardized trades by central counterparties
Mandatory clearing applies only to exchange traded derivatives.
Legislation is in place in provinces where the majority of OTC derivatives are booked, but further work is required to harmonize across provinces. Provincial legislation expected by end-2012.
Legislation not yet proposed. People’s Bank of China is encouraging Shanghai Clearing House to establish detailed schemes for central clearing of OTC derivatives. Central clearing operation for interest rate swaps under discussion.
EMIR adopted by the Council and Parliament in July 2012. ESMA is developing technical standards, which are expected to be finalized by Sept. 2012 and approved by the Council by end-2012.
Legislative drafting has started, with approval target at end-2012.
Legislation not yet proposed. CCIL to transition soon to guaranteed settlement of interest rate swaps; no immediate timeframe for guaranteed settlement of CDS.
Legislation adopted via reform to the Financial Instruments and Exchange Act in May 2010. Initially the obligation will apply only to yen interest rate swaps and CDS. A cabinet ordinance to be implemented by November 2012 includes a requirement for central clearance of “trades that are significant in volume and would reduce settlement risk in the domestic markets.”
Legislation relating to clearing services and legislation relating to tax code create the legal basis for promulgation of regulation dealing with central clearing of standardized OTC derivatives. They have both been adopted. Pending regulations that implement new requirements.
Public consultation issued in Feb. 2012. Legislation to be introduced by end-2012.
Financial Markets Bill submitted to the National Treasury.
A working group was set up in 2011. Draft legislation scheduled for consultation in the second half of 2012.
EMIR adopted by the Council and Parliament in July 2012. ESMA is developing technical standards that are expected to be finalized by Sept. 2012 and approved by the Council by end-2012.
Dodd-Frank Act adopted in 2010. CFTC and SEC are finalizing regulations.
Trading of standardized trades through public venues
Not required. Under review. Consultation paper to be published in 2012.
Under review. Electronic trading platform operated by CFETS has been developed. All standardized OTC interest rate and credit derivatives can be, and certain types are required to be, traded on CFETS platform.
Final rules on Markets in Financial Instruments Directive and Regulation expected to be in effect by mid-2014.
Regulators have issued a consultation paper.
No legislation planned.
Legislation proposed in March 2012. A cabinet ordinance will be drafted afterward.
Law regulating electronic platform trading has been adopted; regulations are pending.
Public consultation issued in Feb. 2012; feedback is under review.
The authorities do not anticipate that electronic trading of OTC derivatives will be required.
A working group has been set up to consider the need for any changes.
Final rules on Markets in Financial Instruments Directive and Regulation are expected to be in effect by mid-2014.
Adopted in Dodd Frank Act. Law requires that any swap or security-based swap subject to clearing requirement be traded on a registered platform. CFTC and SEC are finalizing regulations.
(continued)

G LO B A L F I N A N C I A L S TA B I L I T Y R E P O RT
126 International Monetary Fund | October 2012
table 3.8. Status of Initiatives, by Selected economy (continued)Brazil Canada China European Union Hong Kong SAR India Japan Russia Singapore South Africa Switzerland United Kingdom United States
Tightening of OTC derivatives regulation
Reporting of all OTC derivatives trades to a TR
Required under rules enacted by the central bank and the Brazilian Securities and Exchange Commission.
Canadian Securities Administrators published a consultation paper on TRs. Ontario and Quebec have already amended legislation to support reporting to TRs and regulatory access to data. Implementing regulations expected to be finalized by 2012. Anticipated that a small number of trades may not be accepted by TRs and could be reported to securities regulators.
Under current rules, interest rate trades executed outside of the CFETS platform should be reported to CFETS; credit risk mitigation trades should be reported to the National Association of Financial Market Institutional Investors. Need for complementary regulations on details of frequency and content of reporting and on which institutions can be TRs.
EMIR adopted by the Council and Parliament in July 2012. ESMA is developing technical standards, which are expected to be finalized by Sept. 2012 and approved by the EC by end-2012.
Proposal with required amendments intended to go to the legislature by end-2012. Regulators jointly issued a consultation paper including proposed mandatory reporting (consultation period ended Nov. 2011). OTC derivatives transactions that have a bearing on the financial market will be required to be reported to local TR to be developed by HKMA.
Legislation not yet proposed. Per existing guidelines, banks and primary dealers should report interest rate swaps and forward rate agreements to CCIL reporting platform. For CDS, all participants must report to the centralized reporting body within 30 minutes. CCIL will extend reporting to foreign exchange forwards and is considering it also for foreign exchange options. Working group on derivatives has recommended that CCIL serve as a single-point reporting platform for all OTC interest rate and foreign exchange derivatives transactions.
Adopted in 2010 via reform to the Financial Instruments and Exchange Act. A cabinet ordinance is expected to be completed by Nov. 2012. In general, trade data will be reported to a TR. Data not accepted by them (exotic OTC trades) will be reported to the Japan Financial Services Authority.
Legislation already adopted involving the Federal Financial Markets Service; regulations pending.
Relevant legislation to be introduced by end-2012.
Financial Markets bill submitted to National Treasury for approval of Cabinet and Parliament.
The legislative process is in progress. Rules apply to derivatives traded on an exchange and require that securities dealers report all information necessary to ensure transparency.
EMIR adopted by the Council and Parliament in July 2012. ESMA is developing technical standards, which are expected to be finalized by Sept. 2012 and approved by the EC by end-2012.
Adopted in Dodd- Frank Act. CFTC already finalized and SEC in the process of finalizing regulations. Reporting to SEC, CFTC if no TR is available.
Changes to securitization regulation
Skin-in-the game requirements
Implemented. Not implemented. Draft regulation expected end-2012.
CRD II establishes some risk retention in securitizations.
Not implemented. Draft regulation. Not required. Not required. Not required. Not required, market insignificant.
Not required. CRD II establishes some risk retention in securitizations.
Draft regulations published 2011.
Change to initial and ongoing disclosure requirements
Implemented. Draft regulation. Implemented. n.a. Not implemented. Implemented. Implemented. Not implemented. Implemented 2010. Implemented. Not implemented. No change. Final rules adopted Jan. 2011.
Underwriting standards imposed for securitization
Implemented. Supervisory guidance. Not implemented. n.a. Not implemented. Draft regulation. Implemented. Draft legislation. n.a. n.a. Implemented 2007. Implemented 2011. Draft regulations published 2011.
Reducing reliance on credit ratings
Restricted use of CRA ratings in standards, laws, and regulations
Report on replacing or removing references due in June 2012.
Regulation of CRAs should improve confidence in ratings.
n.a. Mapping exercise in 2011 to identify references to CRAs in EU legislation and proposal to remove references.
Regulatory agencies conducted reviews of existing legislation and regulations.
Set up standing committee of all regulators to reduce reliance on CRAs.
Japan Financial Services Authority removed several references to CRAs in its regulation in 2009 and 2010 and will continue to closely monitor financial institutions.
Limited reliance on CRAs in prudential regulation and central bank operations.
n.a. n.a. Relatively few references to CRAs, and few of those are material.
EU CRA3 proposal will reduce mechanistic reliance on ratings.
Federal Reserve removed references to credit ratings, substituting other measures in their place.
Actions taken to introduce alternatives to CRA ratings
Improved disclosures by issuers, internal ratings by banks, and internal controls by asset managers.
Absence of recognized alternatives to CRAs. Internal model for sovereign risk must be used.
n.a. Considering proposals being developed by international standard setters.
Under consideration. Development of alternatives to be carried out in a manner that allows industry to adapt.
Banks use IRB models for credit risk.
Since 2009, central bank has been conducting internal credit risk analysis of international issuers and counterparties.
n.a. Market capitalization of issuers being considered as a basis for setting investment limits for collective investment schemes.
Actively participating in international standard setting processes that consider alternative measures.
Considering proposals being developed by international standard setters.
SEC and Federal Reserve have proposed alternative approaches for capital adequacy purposes.
(continued)

c h a p t e r 3 T h E R E F O R m AG E N dA: A N I N T E R I m R E P O RT O N P R O G R E S S TOwA R d A S A F E R F I N A N C I A L S YS T E m
International Monetary Fund | October 2012 127
table 3.8. Status of Initiatives, by Selected economy (continued)Brazil Canada China European Union Hong Kong SAR India Japan Russia Singapore South Africa Switzerland United Kingdom United States
Tightening of OTC derivatives regulation
Reporting of all OTC derivatives trades to a TR
Required under rules enacted by the central bank and the Brazilian Securities and Exchange Commission.
Canadian Securities Administrators published a consultation paper on TRs. Ontario and Quebec have already amended legislation to support reporting to TRs and regulatory access to data. Implementing regulations expected to be finalized by 2012. Anticipated that a small number of trades may not be accepted by TRs and could be reported to securities regulators.
Under current rules, interest rate trades executed outside of the CFETS platform should be reported to CFETS; credit risk mitigation trades should be reported to the National Association of Financial Market Institutional Investors. Need for complementary regulations on details of frequency and content of reporting and on which institutions can be TRs.
EMIR adopted by the Council and Parliament in July 2012. ESMA is developing technical standards, which are expected to be finalized by Sept. 2012 and approved by the EC by end-2012.
Proposal with required amendments intended to go to the legislature by end-2012. Regulators jointly issued a consultation paper including proposed mandatory reporting (consultation period ended Nov. 2011). OTC derivatives transactions that have a bearing on the financial market will be required to be reported to local TR to be developed by HKMA.
Legislation not yet proposed. Per existing guidelines, banks and primary dealers should report interest rate swaps and forward rate agreements to CCIL reporting platform. For CDS, all participants must report to the centralized reporting body within 30 minutes. CCIL will extend reporting to foreign exchange forwards and is considering it also for foreign exchange options. Working group on derivatives has recommended that CCIL serve as a single-point reporting platform for all OTC interest rate and foreign exchange derivatives transactions.
Adopted in 2010 via reform to the Financial Instruments and Exchange Act. A cabinet ordinance is expected to be completed by Nov. 2012. In general, trade data will be reported to a TR. Data not accepted by them (exotic OTC trades) will be reported to the Japan Financial Services Authority.
Legislation already adopted involving the Federal Financial Markets Service; regulations pending.
Relevant legislation to be introduced by end-2012.
Financial Markets bill submitted to National Treasury for approval of Cabinet and Parliament.
The legislative process is in progress. Rules apply to derivatives traded on an exchange and require that securities dealers report all information necessary to ensure transparency.
EMIR adopted by the Council and Parliament in July 2012. ESMA is developing technical standards, which are expected to be finalized by Sept. 2012 and approved by the EC by end-2012.
Adopted in Dodd- Frank Act. CFTC already finalized and SEC in the process of finalizing regulations. Reporting to SEC, CFTC if no TR is available.
Changes to securitization regulation
Skin-in-the game requirements
Implemented. Not implemented. Draft regulation expected end-2012.
CRD II establishes some risk retention in securitizations.
Not implemented. Draft regulation. Not required. Not required. Not required. Not required, market insignificant.
Not required. CRD II establishes some risk retention in securitizations.
Draft regulations published 2011.
Change to initial and ongoing disclosure requirements
Implemented. Draft regulation. Implemented. n.a. Not implemented. Implemented. Implemented. Not implemented. Implemented 2010. Implemented. Not implemented. No change. Final rules adopted Jan. 2011.
Underwriting standards imposed for securitization
Implemented. Supervisory guidance. Not implemented. n.a. Not implemented. Draft regulation. Implemented. Draft legislation. n.a. n.a. Implemented 2007. Implemented 2011. Draft regulations published 2011.
Reducing reliance on credit ratings
Restricted use of CRA ratings in standards, laws, and regulations
Report on replacing or removing references due in June 2012.
Regulation of CRAs should improve confidence in ratings.
n.a. Mapping exercise in 2011 to identify references to CRAs in EU legislation and proposal to remove references.
Regulatory agencies conducted reviews of existing legislation and regulations.
Set up standing committee of all regulators to reduce reliance on CRAs.
Japan Financial Services Authority removed several references to CRAs in its regulation in 2009 and 2010 and will continue to closely monitor financial institutions.
Limited reliance on CRAs in prudential regulation and central bank operations.
n.a. n.a. Relatively few references to CRAs, and few of those are material.
EU CRA3 proposal will reduce mechanistic reliance on ratings.
Federal Reserve removed references to credit ratings, substituting other measures in their place.
Actions taken to introduce alternatives to CRA ratings
Improved disclosures by issuers, internal ratings by banks, and internal controls by asset managers.
Absence of recognized alternatives to CRAs. Internal model for sovereign risk must be used.
n.a. Considering proposals being developed by international standard setters.
Under consideration. Development of alternatives to be carried out in a manner that allows industry to adapt.
Banks use IRB models for credit risk.
Since 2009, central bank has been conducting internal credit risk analysis of international issuers and counterparties.
n.a. Market capitalization of issuers being considered as a basis for setting investment limits for collective investment schemes.
Actively participating in international standard setting processes that consider alternative measures.
Considering proposals being developed by international standard setters.
SEC and Federal Reserve have proposed alternative approaches for capital adequacy purposes.
(continued)

G LO B A L F I N A N C I A L S TA B I L I T Y R E P O RT
128 International Monetary Fund | October 2012
table 3.8. Status of Initiatives, by Selected economy (continued)Brazil Canada China European Union Hong Kong SAR India Japan Russia Singapore South Africa Switzerland United Kingdom United States
Reducing reliance on credit ratings
Actions taken by market participants
Rule change in 2009 for pension funds and proposed rule change for investment funds to remove requirement for rating when purchasing securities.
General requirement for firms to establish risk management controls, no specific action.
n.a. Use of internal risk models for banking sector and asset management. CRA rating used in combination with own risk assessment for collective investment schemes and alternative investment funds.
Banks to conduct internal due diligence on credit risk. Basel III as implemented in 2012 further reduces reliance on ratings in capital adequacy framework.
Banks encouraged to use IRB approach for credit risk. Securities and Exchange Board of India implemented FSB Principles for Mutual Funds 1996, due diligence in investment decisions.
n.a. n.a. n.a. Collective investment schemes to replace reference to CRA ratings in setting regulatory limits for nonequity investments.
The Financial Market Supervisory Authority will conduct education sessions with market participants on use and reliance of ratings.
The Financial Services Authority reviewed a sample of fund mandates and found they did not imply mechanistic reliance on CRAs.
State insurance laws generally require submission of investment guidelines and policies to the state insurance department for review.
Tougher regulation of credit rating agencies
Implementation of a registration requirement
Draft regulation. CRAs subject to regulation as of April 2012. Awaiting revisions to international standards.
n.a. Implemented. Implemented. Implemented. Implemented. Implemented. n.a. n.a. n.a. Implemented. Implemented.
Structural changes to banks and limitations on bank activities
Recovery and resolution plans (RRPs)
n.a. No Canadian banks have been identified as G-SIFIs. Draft recovery and resolution plans are being developed for largest banks, due to be completed in 2012.
D-SIBs required to develop recovery and resolution plans. An RRP for Bank of China (G-SIFI) is being developed.
Draft regulation on resolution.
n.a. n.a. n.a. Recovery plans to be developed for D-SIBs in the second half of 2012, and resolution plans in the first half of 2013.
n.a. Plans to produce RRPs for D-SIBs to be put in place during 2012.
SIBs are required to produce RRPs.
The Financial Services Act adopted in 2010 requires banks to produce RRPs. All banks and systemic investment firms required to complete RRPs by June 2012.
Under the Dodd-Frank Act, bank holding companies with total consolidated assets of $50 billion or more and nonbank financial companies designated by the Financial Stability Oversight Council for supervision by the Federal Reserve must submit resolution plans annually to the Federal Deposit Insurance Corporation and the Federal Reserve.
Structural limitations n.a. n.a. n.a. High-level Expert Group (Liikanen Group) on possible reforms to the structure of the EU banking sector formed in Feb. 2012.
n.a. n.a. n.a. n.a. n.a. n.a. Extra capital requirements of Swiss G-SIFIs (the “Swiss finish”) go beyond Basel III and must be in place by 2019.
Vickers commission has proposed structural changes in banking. White Paper to implement Vickers report published in June 2012.
Volcker rule to limit proprietary trading in banks and investment in private equity.
Changes in regulation of compensation and corporate governance
Implementation of Principles and Standards for Sound Compensation Practices (FSB, 2009)
A regulation issued in 2010.
Adopted a supervisory approach and integrated with regular supervisory work.
Various regulations and supervisory guidance issued.
Implementation by transposition of CRD III, in force Dec. 31, 2011, and EBA guidance.
A guideline issued in Mar. 2010.
Guidelines issued. Guidelines issued Mar. 2010.
Laws and regulations under preparation.
Changes made to regulations and guidelines in Dec. 2010.
Regulations issued Dec. 2010. Laws amended mid-2011.
Rules issued Jan. 2010.
Implementation by transposition of CRD III, in force Dec. 2011, and EBA guidance.
Supervisory guidance issued June 2010.
Pillar 3 disclosure on remuneration
Implemented. implemented. Implemented. Implemented. implemented. Implemented. Implemented. Implemented. Implemented. Implemented. Implemented. Implemented. Not implemented.
(continued)
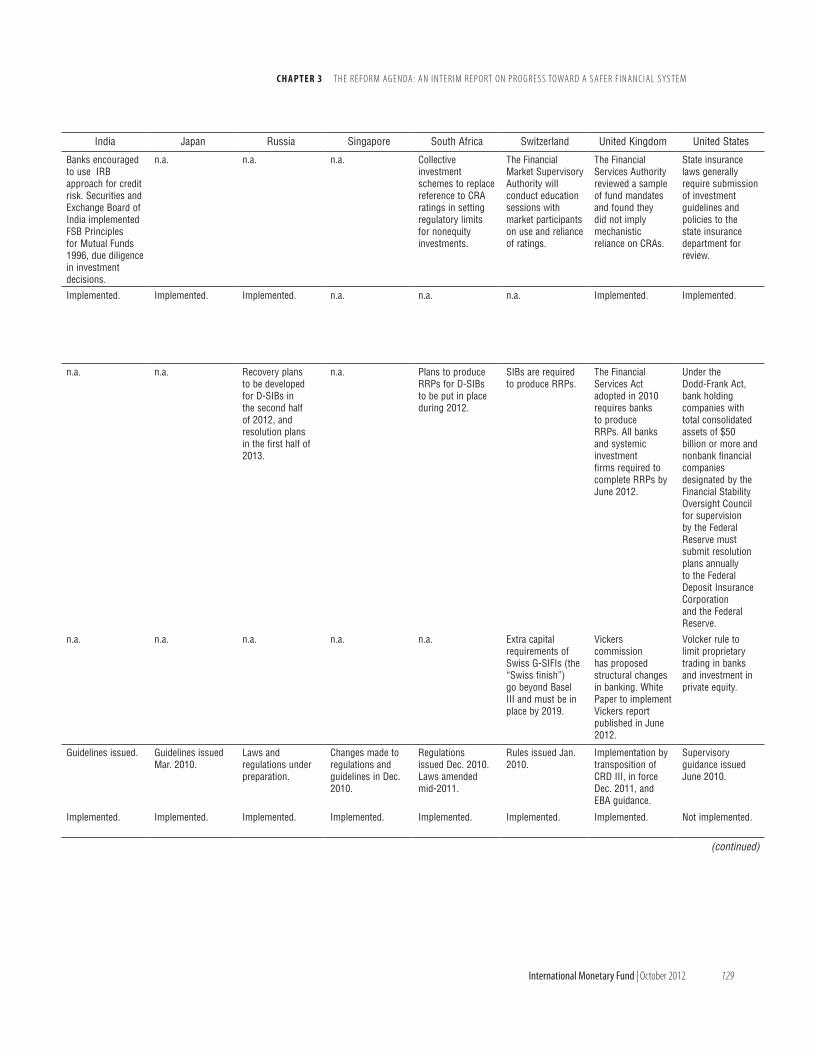
c h a p t e r 3 T h E R E F O R m AG E N dA: A N I N T E R I m R E P O RT O N P R O G R E S S TOwA R d A S A F E R F I N A N C I A L S YS T E m
International Monetary Fund | October 2012 129
table 3.8. Status of Initiatives, by Selected economy (continued)Brazil Canada China European Union Hong Kong SAR India Japan Russia Singapore South Africa Switzerland United Kingdom United States
Reducing reliance on credit ratings
Actions taken by market participants
Rule change in 2009 for pension funds and proposed rule change for investment funds to remove requirement for rating when purchasing securities.
General requirement for firms to establish risk management controls, no specific action.
n.a. Use of internal risk models for banking sector and asset management. CRA rating used in combination with own risk assessment for collective investment schemes and alternative investment funds.
Banks to conduct internal due diligence on credit risk. Basel III as implemented in 2012 further reduces reliance on ratings in capital adequacy framework.
Banks encouraged to use IRB approach for credit risk. Securities and Exchange Board of India implemented FSB Principles for Mutual Funds 1996, due diligence in investment decisions.
n.a. n.a. n.a. Collective investment schemes to replace reference to CRA ratings in setting regulatory limits for nonequity investments.
The Financial Market Supervisory Authority will conduct education sessions with market participants on use and reliance of ratings.
The Financial Services Authority reviewed a sample of fund mandates and found they did not imply mechanistic reliance on CRAs.
State insurance laws generally require submission of investment guidelines and policies to the state insurance department for review.
Tougher regulation of credit rating agencies
Implementation of a registration requirement
Draft regulation. CRAs subject to regulation as of April 2012. Awaiting revisions to international standards.
n.a. Implemented. Implemented. Implemented. Implemented. Implemented. n.a. n.a. n.a. Implemented. Implemented.
Structural changes to banks and limitations on bank activities
Recovery and resolution plans (RRPs)
n.a. No Canadian banks have been identified as G-SIFIs. Draft recovery and resolution plans are being developed for largest banks, due to be completed in 2012.
D-SIBs required to develop recovery and resolution plans. An RRP for Bank of China (G-SIFI) is being developed.
Draft regulation on resolution.
n.a. n.a. n.a. Recovery plans to be developed for D-SIBs in the second half of 2012, and resolution plans in the first half of 2013.
n.a. Plans to produce RRPs for D-SIBs to be put in place during 2012.
SIBs are required to produce RRPs.
The Financial Services Act adopted in 2010 requires banks to produce RRPs. All banks and systemic investment firms required to complete RRPs by June 2012.
Under the Dodd-Frank Act, bank holding companies with total consolidated assets of $50 billion or more and nonbank financial companies designated by the Financial Stability Oversight Council for supervision by the Federal Reserve must submit resolution plans annually to the Federal Deposit Insurance Corporation and the Federal Reserve.
Structural limitations n.a. n.a. n.a. High-level Expert Group (Liikanen Group) on possible reforms to the structure of the EU banking sector formed in Feb. 2012.
n.a. n.a. n.a. n.a. n.a. n.a. Extra capital requirements of Swiss G-SIFIs (the “Swiss finish”) go beyond Basel III and must be in place by 2019.
Vickers commission has proposed structural changes in banking. White Paper to implement Vickers report published in June 2012.
Volcker rule to limit proprietary trading in banks and investment in private equity.
Changes in regulation of compensation and corporate governance
Implementation of Principles and Standards for Sound Compensation Practices (FSB, 2009)
A regulation issued in 2010.
Adopted a supervisory approach and integrated with regular supervisory work.
Various regulations and supervisory guidance issued.
Implementation by transposition of CRD III, in force Dec. 31, 2011, and EBA guidance.
A guideline issued in Mar. 2010.
Guidelines issued. Guidelines issued Mar. 2010.
Laws and regulations under preparation.
Changes made to regulations and guidelines in Dec. 2010.
Regulations issued Dec. 2010. Laws amended mid-2011.
Rules issued Jan. 2010.
Implementation by transposition of CRD III, in force Dec. 2011, and EBA guidance.
Supervisory guidance issued June 2010.
Pillar 3 disclosure on remuneration
Implemented. implemented. Implemented. Implemented. implemented. Implemented. Implemented. Implemented. Implemented. Implemented. Implemented. Implemented. Not implemented.
(continued)
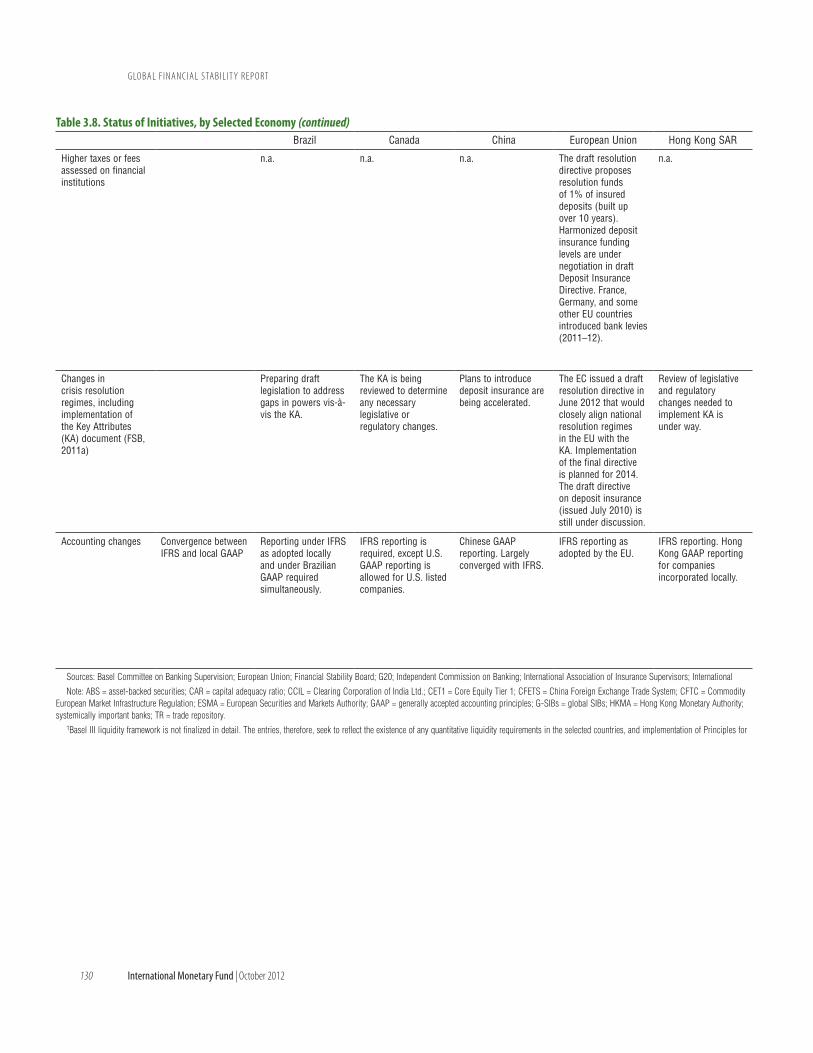
G LO B A L F I N A N C I A L S TA B I L I T Y R E P O RT
130 International Monetary Fund | October 2012
table 3.8. Status of Initiatives, by Selected economy (continued)Brazil Canada China European Union Hong Kong SAR India Japan Russia Singapore South Africa Switzerland United Kingdom United States
Higher taxes or fees assessed on financial institutions
n.a. n.a. n.a. The draft resolution directive proposes resolution funds of 1% of insured deposits (built up over 10 years). Harmonized deposit insurance funding levels are under negotiation in draft Deposit Insurance Directive. France, Germany, and some other EU countries introduced bank levies (2011–12).
n.a. n.a. n.a. n.a. n.a. n.a. n.a. Annual bank levy of 0.075% introduced in May 2011 and increased to 0.088% in Jan. 2012. Applies to total global consolidated liabilities exceeding £20 billion after excluding, inter alia, Tier 1 capital, insured retail deposits, sovereign repo liabilities, and derivatives on a net basis.
A financial crisis responsibility fee was proposed by the administration in Jan. 2010 but not introduced.
Changes in crisis resolution regimes, including implementation of the Key Attributes (KA) document (FSB, 2011a)
Preparing draft legislation to address gaps in powers vis-à-vis the KA.
The KA is being reviewed to determine any necessary legislative or regulatory changes.
Plans to introduce deposit insurance are being accelerated.
The EC issued a draft resolution directive in June 2012 that would closely align national resolution regimes in the EU with the KA. Implementation of the final directive is planned for 2014. The draft directive on deposit insurance (issued July 2010) is still under discussion.
Review of legislative and regulatory changes needed to implement KA is under way.
n.a. n.a. Review of legislative and regulatory changes needed to implement KA is under way.
Resolution regime was enhanced in 2007 and extended to insurers in 2011. Further enhancements to address some other aspects of KA are planned over the next two years.
n.a. The resolution regime was strengthened prior to and since the crisis (Banking Act was amended in Sept. 2011) and has most of the tools in the KA.
A temporary resolution regime was introduced in 2008, and replaced with a permanent special resolution regime in 2009. This has many of the powers in the KA but applies only to banks.
The resolution regime was extensively revised under Dodd-Frank, including by extending it to nonbanks and bank holding companies.
Accounting changes Convergence between IFRS and local GAAP
Reporting under IFRS as adopted locally and under Brazilian GAAP required simultaneously.
IFRS reporting is required, except U.S. GAAP reporting is allowed for U.S. listed companies.
Chinese GAAP reporting. Largely converged with IFRS.
IFRS reporting as adopted by the EU.
IFRS reporting. Hong Kong GAAP reporting for companies incorporated locally.
IFRS reporting or Indian GAAP reporting.
IFRS reporting as designated by the Financial Services Agency for certain listed companies. Otherwise, Japanese GAAP. Mandatory adoption of IFRS may start in 2015 or 2016.
IFRS reporting both for consolidated financial statements and for standalone financial statements for commercial banks.
IFRS reporting as adopted locally for certain listed companies.
IFRS reporting. IFRS reporting or U.S. GAAP reporting for firms listed on the main board of the SIX Swiss Exchange. IFRS, U.S. GAAP, and Swiss GAAP reporting allowed for other SIX registrants.
IFRS reporting as adopted by the EU required for consolidated financial statements. Unlisted companies can use U.K. GAAP.
U.S. GAAP reporting. IFRS reporting allowed for foreign private issuers.
Sources: Basel Committee on Banking Supervision; European Union; Financial Stability Board; G20; Independent Commission on Banking; International Association of Insurance Supervisors; International Organization of Securities Commissions; and PriceWaterhouse Coopers.
Note: ABS = asset-backed securities; CAR = capital adequacy ratio; CCIL = Clearing Corporation of India Ltd.; CET1 = Core Equity Tier 1; CFETS = China Foreign Exchange Trade System; CFTC = Commodity Futures Trading Commission; CoCos = contingent convertible bonds; CRA = credit rating agency; CRD = Capital Requirements Directive; CRR = Capital Requirements Regulation; D-SIBs = domestic SIBs; EMIR = European Market Infrastructure Regulation; ESMA = European Securities and Markets Authority; GAAP = generally accepted accounting principles; G-SIBs = global SIBs; HKMA = Hong Kong Monetary Authority; IFRS = International Financial Reporting Standards; IRB = internal-ratings based; MAS = Monetary Authority of Singapore; n.a. = not available or not applicable; SEC = Securities and Exchange Commission; SIBs = systemically important banks; TR = trade repository.
1Basel III liquidity framework is not finalized in detail. The entries, therefore, seek to reflect the existence of any quantitative liquidity requirements in the selected countries, and implementation of Principles for Sound Liquidity Risk Management and Supervision (BCBS, 2008).

c h a p t e r 3 T h E R E F O R m AG E N dA: A N I N T E R I m R E P O RT O N P R O G R E S S TOwA R d A S A F E R F I N A N C I A L S YS T E m
International Monetary Fund | October 2012 131
table 3.8. Status of Initiatives, by Selected economy (continued)Brazil Canada China European Union Hong Kong SAR India Japan Russia Singapore South Africa Switzerland United Kingdom United States
Higher taxes or fees assessed on financial institutions
n.a. n.a. n.a. The draft resolution directive proposes resolution funds of 1% of insured deposits (built up over 10 years). Harmonized deposit insurance funding levels are under negotiation in draft Deposit Insurance Directive. France, Germany, and some other EU countries introduced bank levies (2011–12).
n.a. n.a. n.a. n.a. n.a. n.a. n.a. Annual bank levy of 0.075% introduced in May 2011 and increased to 0.088% in Jan. 2012. Applies to total global consolidated liabilities exceeding £20 billion after excluding, inter alia, Tier 1 capital, insured retail deposits, sovereign repo liabilities, and derivatives on a net basis.
A financial crisis responsibility fee was proposed by the administration in Jan. 2010 but not introduced.
Changes in crisis resolution regimes, including implementation of the Key Attributes (KA) document (FSB, 2011a)
Preparing draft legislation to address gaps in powers vis-à-vis the KA.
The KA is being reviewed to determine any necessary legislative or regulatory changes.
Plans to introduce deposit insurance are being accelerated.
The EC issued a draft resolution directive in June 2012 that would closely align national resolution regimes in the EU with the KA. Implementation of the final directive is planned for 2014. The draft directive on deposit insurance (issued July 2010) is still under discussion.
Review of legislative and regulatory changes needed to implement KA is under way.
n.a. n.a. Review of legislative and regulatory changes needed to implement KA is under way.
Resolution regime was enhanced in 2007 and extended to insurers in 2011. Further enhancements to address some other aspects of KA are planned over the next two years.
n.a. The resolution regime was strengthened prior to and since the crisis (Banking Act was amended in Sept. 2011) and has most of the tools in the KA.
A temporary resolution regime was introduced in 2008, and replaced with a permanent special resolution regime in 2009. This has many of the powers in the KA but applies only to banks.
The resolution regime was extensively revised under Dodd-Frank, including by extending it to nonbanks and bank holding companies.
Accounting changes Convergence between IFRS and local GAAP
Reporting under IFRS as adopted locally and under Brazilian GAAP required simultaneously.
IFRS reporting is required, except U.S. GAAP reporting is allowed for U.S. listed companies.
Chinese GAAP reporting. Largely converged with IFRS.
IFRS reporting as adopted by the EU.
IFRS reporting. Hong Kong GAAP reporting for companies incorporated locally.
IFRS reporting or Indian GAAP reporting.
IFRS reporting as designated by the Financial Services Agency for certain listed companies. Otherwise, Japanese GAAP. Mandatory adoption of IFRS may start in 2015 or 2016.
IFRS reporting both for consolidated financial statements and for standalone financial statements for commercial banks.
IFRS reporting as adopted locally for certain listed companies.
IFRS reporting. IFRS reporting or U.S. GAAP reporting for firms listed on the main board of the SIX Swiss Exchange. IFRS, U.S. GAAP, and Swiss GAAP reporting allowed for other SIX registrants.
IFRS reporting as adopted by the EU required for consolidated financial statements. Unlisted companies can use U.K. GAAP.
U.S. GAAP reporting. IFRS reporting allowed for foreign private issuers.
Sources: Basel Committee on Banking Supervision; European Union; Financial Stability Board; G20; Independent Commission on Banking; International Association of Insurance Supervisors; International Organization of Securities Commissions; and PriceWaterhouse Coopers.
Note: ABS = asset-backed securities; CAR = capital adequacy ratio; CCIL = Clearing Corporation of India Ltd.; CET1 = Core Equity Tier 1; CFETS = China Foreign Exchange Trade System; CFTC = Commodity Futures Trading Commission; CoCos = contingent convertible bonds; CRA = credit rating agency; CRD = Capital Requirements Directive; CRR = Capital Requirements Regulation; D-SIBs = domestic SIBs; EMIR = European Market Infrastructure Regulation; ESMA = European Securities and Markets Authority; GAAP = generally accepted accounting principles; G-SIBs = global SIBs; HKMA = Hong Kong Monetary Authority; IFRS = International Financial Reporting Standards; IRB = internal-ratings based; MAS = Monetary Authority of Singapore; n.a. = not available or not applicable; SEC = Securities and Exchange Commission; SIBs = systemically important banks; TR = trade repository.
1Basel III liquidity framework is not finalized in detail. The entries, therefore, seek to reflect the existence of any quantitative liquidity requirements in the selected countries, and implementation of Principles for Sound Liquidity Risk Management and Supervision (BCBS, 2008).

G LO B A L F I N A N C I A L S TA B I L I T Y R E P O RT
132 International Monetary Fund | October 2012
annex 3.3. exploring the Impact of regulatory and crisis Intervention policies on Financial Structures
The impact of a policy change on financial struc-ture can be estimated using the difference-in-differ-ences (DiD) method. Since the work by Ashenfelter and Card (1985), DiD has been heavily used for the evaluation of socioeconomic developments in regional contexts. The chapter uses this method to examine the impact on financial structures from two types of policies: (1) announcements and imple-mentation of new capital and liquidity rules for the banking sector, and (2) crisis intervention measures taken by governments and central banks. This annex provides an introduction to the DiD method,
explains the empirical results presented in Tables 3.5, 3.9, and 3.10 and highlights the limitations of the DiD approach.67
The difference-in-differences setup compares two groups of economies at two points in time. One group is exposed to a policy change, which takes place between the first and the second point, while the second group is not exposed to the policy change. By contrasting the differences in the changes of financial structures over time between both groups, one can infer the effect of the policy change on the affected group of economies. Although this method is particularly suited to controlling for permanent differences in characteristics between both groups, a causality claim requires that cer-tain assumptions be imposed. Most crucially, both groups are assumed to have shown equal changes in financial structure over time if the policy would not have affected one of them. While this assumption seems to be rather strong for crisis intervention mea-sures, it might be less problematic in the case of the implementation of Basel II, which was well in train before the crisis. This analysis has taken two steps with regard to this assumption: it indirectly evalu-ated it by testing for differences in trends of financial
Note: Prepared by Michael Kleemann.67For an easily accessible introduction to the DiD method,
see also the following note provided by the European Com-mission: http://ec.europa.eu/regional_policy/sources/doc-gener/evaluation/evalsed/sourcebooks/method_techniques/counterfactual_impact_evaluation/difference-in-differences/difference-in-differences_en.htm.
structures between groups in the past; and it added controls, such as financial stress measures, to capture differential exposures to the crisis.
Driven by the nature of the policies under consid-eration, the DiD method uses continuous measures, indicating the magnitude of advancement, rather than zero-one decisions. This choice translates into contrasting many staggered groups instead of only two. Accordingly, the impact of intervention mea-sures, as well as of Basel capital and liquidity regula-tions, on financial structures is explored using the following three linear regression equations, which are estimated for each financial structures indicator sit individually:
sit = β0 + β1DtCrisis + β2Intervention Indexi
+ β3DtCrisis * Intervention Indexi
+ β4Financial Stress Indexi,t + ei,t (3.1)
sit = β0 + β1DtCrisis + β2Basel Capital Progress Indexi
+ β3DtCrisis * Basel Capital Progress Indexi
+ β4Financial Stress Indexi,t + ei,t (3.2)
sit = β0 + β1DtCrisis + β2Basel Liquidity Progress Indexi
+ β3DtCrisis * Basel Liquidity Progress Indexi
+ β4Financial Stress Indexi,t + ei,t (3.3)
As illustrated in Figure 3.6, the three regressions are used to account for • the different trends in the financial structure
variables, which are decomposed into an underly-ing trend, β1;
• differences in financial structure between country groups that were observed at the first point in time, before any policy change took place, and
FinancialMarketStructure
A
B
C
Precrisis (2003–07)Time
(Control) group withoutpolicy change
(Intervention) group with policy change
Crisis (2008–10)
β 2 *Intervention Index i
β 2 * Intervention Index i
β 1 * D t Crisis
β 3 * D t Crisis * Intervention
Index i
β 0 β 0
Source: IMF staff.
Figure 3.6. Illustration of Di�erence‐in‐Di�erences Method

c h a p t e r 3 T h E R E F O R m AG E N dA: A N I N T E R I m R E P O RT O N P R O G R E S S TOwA R d A S A F E R F I N A N C I A L S YS T E m
International Monetary Fund | October 2012 133
which are assumed to remain at the second point in time, when the policies are effective, β2;
• the effect of the policy change itself, β3.
Results for β1, β2, and β3 are reported in Tables 3.5, 3.9, and 3.10.
More precisely, in regression equation (3.1), the effect of an increase in the Intervention Indexi—which represents the magnitude of the crisis inter-vention measures taken by governments and central banks (see Table 3.4)—on any specific structural indicator of financial intermediation, sit, is illustrated by Figure 3.6. The constant, β0, is the average of structural indicators within the group of nonin-tervening countries (Intervention Indexi of zero) in the first period;68 while Dt
Crisis is a dummy variable indicating the two periods by taking on value zero in the precrisis period (2003–07) and 1 in the follow-ing period (2008–10).
The sum of β0 and β1 is the average of the struc-tural indicator within the group of nonintervening countries in the second period, and β1 is an estimate of the underlying trend observed in the absence of any intervention. This trend is further assumed to be identical across all economies. Moreover, β2 is the coefficient of the Intervention Indexi, which distin-guishes the country groups by the magnitudes of intervention. It therefore varies across countries, as
68Since all economies under consideration intervened to some extent, the group of nonintervening economies is an artificial construct for illustrative purposes.
indicated by the subscript i; but it does not vary in time, as indicated by the absence of the subscript t. Hence, β2 is an estimate of any permanent differences across country groups. Finally, β3 is the coefficient of the interaction of the Intervention Indexi and the time dummy variable Dt
Crisis. Their product varies across countries and over time to capture the differences in trends observed between the differing intensities of intervening groups, which are assumed to deviate from the underlying trend observed for the noninter-vening economies only as a result of the interventions.
β3 is an estimate of the causal effect of interven-tions on financial structure under the assumption that this underlying trend, which is confounded by the intervention effects and can therefore not be observed, would have been the same across econo-mies in the absence of any interventions. In the case of intervention measures especially, this assumption seems inappropriate, since they are direct reactions to the crisis and their magnitude is also directly related to the severity of the crisis. To tackle this issue, a Financial Stress Indexit (described in Table 3.1) is introduced to serve as a control and allow for variation in trends across economies according to crisis exposure. The analogue applies to the Basel Capital and Liquidity Progress Indices (described in Annex 3.4, Table 3.11).
Despite all potential caveats, the DiD approach is a more structured way to explore the effects of poli-cies on the structure of financial intermediation than unconditional correlations.

G LO B A L F I N A N C I A L S TA B I L I T Y R E P O RT
134 International Monetary Fund | October 2012
table 3.9. effect of progress in Basel Liquidity rules on Intermediation Structures (Effect on levels; in percent unless noted otherwise)
Structural Indicators
(1) (2) (3) (4) (5)
Change in Structure during 2008–11 Crisis
(β1)
Association between
Progress on Basel Liquidity
Rules and Structure (β2)1
Effect of Progress on
Basel Liquidity Rules on Structure
during 2008–11 (β3)2
Number of Observations3 R2
Market-based intermediation Nontraditional bank intermediation –1.03 –1.58 1.37** 24 0.03
Noninterest income to total income 5.21 9.56 –9.77 32 0.00Other earning assets to total assets –18.12** –16.64 15.62* 32 0.19Other interest-bearing liabilities to total
liabilities 3.71 –34.72** 2.83 32 0.22
Nonbank intermediationLoans and bonds held by nonbanks relative to
the overall financial sector 2.83 38.63 –0.51 20 0.18Private bond market capitalization to GDP 29.66 –72.48*** –39.31 30 0.29
Use of new financial products –0.65 3.46 1.72 20Derivatives turnover to GDP –0.79 2.02 1.78 24 0.30Securitization to GDP –1.49 17.23 0.17 20 0.23
Traditional bank-based intermediationLoans and bonds held by banks relative to the
overall financial sector –2.83 –38.63 0.51 20 0.18Net interest margin 0.38 4.35 2.62 32 0.26Bank credit versus stocks and bonds4 2.36 –1.86** –3.20* 30 0.48
Scale and scope Size (index) –46.92 26.13 23.79 28 0.07Domestic interconnectedness (index) 2.49** –0.75 –2.11 16 0.38
Wholesale funding ratio 32.40* –54.77** –24.08 18 0.63Interbank assets to total assets 10.82 2.99 –6.83 22 0.21Interbank liabilities to total liabilities 8.82 4.37 –5.56 22 0.26
Concentration (asset share of top three banks) 3.11 –40.70 –4.53 32 0.13Financial globalization –0.87 0.04 –0.13 22 0.20
Share of foreign banks (number of banks) –20.66* 6.22 12.46 32 0.19Gross foreign assets (percentage points of GDP) –71.94 –91.96 45.94 28 0.11Global interconnectedness (index)5 –1.05 –1.80 –0.27 32 0.07Source: IMF staff estimates.
Note: For each structural indicator, the following regression is estimated by the difference-in-differences (DiD) method; see Annex 3.3.
sit = β0 + β1Dt
Crisis + β2Basel Liquidity Progress Indexi + β3DtCrisis * Basel Liquidity Progress Indexi + β4Financial Stress Indexi,t + ei,t ,
where, sit sit denotes the structural indicator, Dt
crisis is a crisis dummy taking the value of 1 in the period 2008–10 and zero in 2003–07, and Basel Capital Progress Indexi is taken from Table 3.11; Financial Stress Indexi,t is described in Table 3.1. Results for the constant β0 and the control β4 are not reported. ***, **, and * denote significance at the 1 percent, 5 percent, and 10 percent levels of confidence. Standard errors are clustered by country. See Annex 3.1 for an overview of the structural indicators and the underlying data.
1The parameter refers to the structural difference observed between countries for which the Basel Capital Progress Index differs by 1.2The parameter refers to the causal effect of an increase in Basel Capital Progress Index by 1 on the corresponding structural indicator. However, a causal interpretation
requires strong assumptions, especially, equal trends in the structural indicators among countries in the absence of the implementation of Basel regulations, which are not testable.
3The difference-in-differences approach is based on a pooled panel. Accordingly, the number of observations is two times the number of countries in the corresponding sample.
4For structural indicators with data through 2011, a few countries in some cases are included that have data through 2010 only. The signs and levels of significance do not change if data only through 2010 are used instead.
5This variable is used to represent the share of traditional versus nontraditional intermediation.6This variable is based on the work of Cihák, Muñoz, and Scuzzarella (2012). See Annex 3.1 and Table 3.6 for further details.

c h a p t e r 3 T h E R E F O R m AG E N dA: A N I N T E R I m R E P O RT O N P R O G R E S S TOwA R d A S A F E R F I N A N C I A L S YS T E m
International Monetary Fund | October 2012 135
table 3.10. effect of Financial policies on Intermediation Structures: crisis Intervention policies (Effect on levels; in percent unless noted otherwise)
(1) (2) (3) (4) (5)
Structural Indicators
Change in Structure during 2008–11 Crisis
(β1)
Association between Crisis
Intervention Policies and
Structure (β2)1
Effect of Crisis Intervention Policies on Structure
during 2008–11 (β3)2
Number of Observations3 R2
Market-based intermediation Nontraditional bank intermediation 0.22 0.37*** –0.08 50 0.30
Noninterest income to total income 1.59 3.25** –0.31 62 0.13Other earning assets to total assets –3.24 2.01 0.04 62 0.08Other interest-bearing liabilities to total
liabilities 3.14 4.67*** 0.04 62 0.29
Nonbank intermediationLoans and bonds held by nonbanks relative to
the overall financial sector 3.36 –4.52 –0.46 42 0.10Private bond market capitalization to GDP –0.60 7.00** 1.10 54 0.18
Use of new financial productsDerivatives turnover to GDP –0.46 0.14* 0.04 42 0.11Securitization to GDP –11.46 1.87 0.74 22 0.18
Traditional bank-based intermediationLoans and bonds held by banks relative to the
overall financial sector –3.36 4.52 0.46 42 0.10Net interest margin 0.68 –0.39** –0.04 62 0.29Bank credit versus stocks and bonds4 –0.90 0.09 0.41*** 53 0.35
Scale and scope Size (index) –15.19 24.68** –8.39 54 0.21Domestic interconnectedness (index) –0.01 0.24 0.11 28 0.19
Wholesale funding ratio 1.71 6.04*** 1.52 30 0.54Interbank assets to total assets 0.78 1.04 0.22 46 0.06Interbank liabilities to total liabilities 0.12 0.56 0.58 46 0.09
Concentration (asset share of top three banks) –4.39 3.23* –0.21 62 0.10Financial globalization –0.21 0.03 –0.03 40 0.05
Share of foreign banks (number of banks) 4.05 –0.46 –0.51 62 0.01Gross foreign assets (percentage points of GDP) –8.67 22.06*** –2.48 49 0.41Global interconnectedness (index)5 –0.27 0.65*** –0.06 60 0.36Source: IMF staff estimates.
Note: For each structural indicator, the following regression is estimated by the difference-in-differences (DiD) method; see Annex 3.3.
sit = β0 + β1Dt
Crisis + β2Intervention Indexi + β3DtCrisis * Intervention Indexi + β4Financial Stress Indexi,t + ei,t ,
where, sit sit denotes the structural indicator, Dt
crisis is a crisis dummy taking the value of 1 in the period 2008–10 and zero in 2003–07, and Basel Capital Progress Indexi is taken from Table 3.11; Financial Stress Indexi,t is described in Table 3.1. Results for the constant β0 and the control β4 are not reported. ***, **, and * denote significance at the 1 percent, 5 percent, and 10 percent levels of confidence. Standard errors are clustered by country. See Annex 3.1 for an overview of the structural indicators and the underlying data.
1The parameter refers to the structural difference observed between countries for which the Basel Capital Progress Index differs by 1.2The parameter refers to the causal effect of an increase in Basel Capital Progress Index by 1 on the corresponding structural indicator. However, a causal interpretation
requires strong assumptions, especially, equal trends in the structural indicators among countries in the absence of the implementation of Basel regulations, which are not testable.
3The difference-in-differences approach is based on a pooled panel. Accordingly, the number of observations is two times the number of countries in the corresponding sample.
4For structural indicators with data through 2011, a few countries in some cases are included that have data through 2010 only. The signs and levels of significance do not change if data only through 2010 are used instead.
5This variable is used to represent the share of traditional versus nontraditional intermediation.6This variable is based on the work of Cihák, Muñoz, and Scuzzarella (2012). See Annex 3.1 and Table 3.6 for further details.

G LO B A L F I N A N C I A L S TA B I L I T Y R E P O RT
136 International Monetary Fund | October 2012
annex 3.4. Indices of progress on Basel capital and Liquidity Standards
This annex explains the derivation of the Prog-ress Indices for the Basel II and Basel 2.5 capital and liquidity regulations. These indices are used in the econometric work in the chapter’s section on “Analyzing the Effect of Reforms on Structures—An Early Look” (as explained in Annex 3.3).
The Basel Capital Progress Index is derived from BCBS (2012c), which gives number codes for progress on rules and color codes for progress on implementa-tion. For rules, the BIS number codes are as follows: 1 = draft regulation not published; 2 = draft regulation published; 3 = final rule published; 4 = final rule in force. For implementation (BIS color codes trans-formed to numbers): 6 = implementation completed; 4 = implementation in process; 1 = no implementation. These are shown in columns (1) to (5) in Table 3.11. The idea is to give a large weight to economies that have made good progress on both rules and imple-
mentation of Basel II and Basel 2.5, which are step-ping stones toward Basel III. The total in Table 3.11, column (6), is derived by multiplying the score on rules by the score on implementation and adding up for Basel II and Basel 2.5. The overall score is divided by the maximum possible, 48, to arrive at column (7).
The Basel Liquidity Progress Index is derived from Annex 3.2, Table 3.8 (the rows labeled “Higher Liquidity Requirements”). Basel III liquidity rules have not been implemented as yet, and liquidity was not covered in Basel II or 2.5. Economies are given a score from 1 to 4 (increasing in implementation) for domestic regula-tory initiatives regarding liuqidity in the table. These are (1) quantitative liquidity requirements, (2) liquidity risk management requirements, and (3) foreign exchange liquidity monitoring and management. The scores are then averaged across the three categories. Brazil, for example, has a score of 1 for (1), 4 for (2), and 4 for (3), for an average score of (1 + 4 + 4)/3 = 3, which is then divided by 4, the highest possible score, which brings Brazil’s score to 0.8, as shown in Table 3.11, column (8).
table 3.11. Basel capital and Liquidity progress Index (Index ranges from 0 to 1)
Basel II Basel 2.5
Basel IIIRules
(5)Total (maximum = 48)
(6) = (1) * (2) + (3) * (4)
Basel Capital Progress Index
(Basel II and 2.5)(7) = (6)/48
Basel Liquidity Progress
Index(8)
RulesImplemen-
tation RulesImplemen-
tationEconomies (1) (2) (3) (4)
Argentina 2 4 1 1 1 9 0.19 n.a.Australia 4 6 4 6 2 48 1.00 n.a.Belgium 4 6 4 6 2 48 1.00 0.3Brazil 4 6 4 6 2 48 1.00 0.8Canada 4 6 4 6 2 48 1.00 0.5China 4 4 4 4 2 32 0.67 0.6France 4 6 4 6 2 48 1.00 0.3Germany 4 6 4 6 2 48 1.00 0.3Hong Kong SAR 4 6 4 6 2 48 1.00 0.75India 4 6 4 6 2 48 1.00 0.7Indonesia 3.5 4 1 1 1 15 0.31 n.a.Italy 4 6 4 6 2 48 1.00 0.3Japan 4 6 4 6 3 48 1.00 0.75Korea 4 6 4 6 1 48 1.00 n.a.Luxembourg 4 6 4 6 2 48 1.00 0.3Mexico 4 6 1 1 1 25 0.52 n.a.Netherlands 4 6 4 6 2 48 1.00 0.3Russia 2.5 4 1.5 1 1 11.5 0.24 0.6Saudi Arabia 4 6 3 2 3 30 0.63 n.a.Singapore 4 6 4 6 2 48 1.00 0.4South Africa 4 6 4 6 1 48 1.00 0.75Spain 4 6 4 6 2 48 1.00 0.3Sweden 4 6 2.5 6 2 39 0.81 n.a.Switzerland 4 6 4 6 2 48 1.00 0.6Turkey 4 4 2.5 1 1 18.5 0.39 n.a.United Kingdom 4 6 4 6 2 48 1.00 0.75United States 4 4 1.5 1 1 17.5 0.36 0.5European Union 4 6 4 6 2 48 1.00 0.3
Source: IMF staff estimates based on Basel Committee on Banking Supervision (2012c) and the “Liquidity” row in Table 3.8.
Note: The data for the Basel capital rules given in BCBS (2012c) are as of March 2012. Since then, other countries, for example, Turkey, have introduced Basel II and 2.5.

c h a p t e r 3 T h E R E F O R m AG E N dA: A N I N T E R I m R E P O RT O N P R O G R E S S TOwA R d A S A F E R F I N A N C I A L S YS T E m
International Monetary Fund | October 2012 137
ReferencesAcemoğlu, Daron, Asuman Ozdaglar, and Alireza Tahbaz-
Salehi, 2012, “Systemic Risk and Stability in Financial Networks” (Cambridge: Massachusetts Institute of Tech-nology Columbia Business School).
Acharya, Viral, Thomas Cooley, Matthew Richardson, and Ingo Walter, 2010, “Manufacturing Tail Risk: A Perspec-tive on the Financial Crisis of 2007–09,” Foundations and Trends in Finance, Vol. 4, No. 4, pp. 247–325.
Adrian, Tobias, and Hyun Song Shin, 2009, “Money, Liquid-ity, and Monetary Policy,” American Economic Review, Vol. 99, No. 2, pp. 600–05.
———, 2010, “Financial Intermediaries and Monetary Economics,” Handbook of Monetary Economics (New York: Elsevier).
Allen, Franklin, and Douglas Gale, 2000, “Financial Contagion,” Journal of Political Economy, Vol. 108, No. 1, pp. 1–33.
———, 2004, “Competition and Financial Stability,” Journal of Money, Credit, and Banking, Vol. 36, No. 3, pp. 453–80.
———, 2007, Understanding Financial Crises (Oxford: Oxford University Press).
Alloway, Tracy, 2012, “Cooking (CDOs) with SocGen,” ft.com/alphaville, May 3. http://ftalphaville.ft.com/blog/2012/05/03/987001/cooking-cdos-with-socgen.
Ashenfelter, Orley, and David Card, 1985, “Using the Lon-gitudinal Structure of Earnings to Estimate the Effect of Training Programs,” The Review of Economics and Statistics, Vol. 67, No. 3, pp. 648–60.
Balakrishnan, Ravi, Stephan Danninger, Selim Elekdag, and Irina Tytell, 2009, “The Transmission of Financial Stress from Advanced to Emerging Economies,” IMF Working Paper No. 09/133 (Washington: International Monetary Fund).
Bhatia, Ashok V., and Tamim Bayoumi, 2012, “Leverage? What Leverage? A Deep Dive into the U.S. Flow of Funds in Search of Clues to the Global Crisis,” IMF Working Paper No. 12/162 (Washington: International Monetary Fund).
Bank for International Settlements (BIS), 2010, “Low Interest Rates: Do the Risks Outweigh the Rewards?” Chapter III in 80th Annual Report (Basel, June).
———, 2012a, 82nd Annual Report (Basel: June). www.bis.org/publ/arpdf/ar2012e.htm.
———, 2012b, “Progress Report on Basel III Implementation” (Update April 2012). www.bis.org/publ/bcbs215.htm.
Basel Committee on Banking Supervision (BCBS), (2008), “Principles for Sound Liquidity Risk Management and Supervision” (Basel: Bank for International Settlements.
———, 2010a, An Assessment of the Long-Term Economic Impact of Stronger Capital and Liquidity Requirements (Basel: Bank for International Settlements). www.bis.org/publ/bcbs173.htm.
———, 2010b, Basel III: International Framework for Liquid-ity Risk Measurement, Standards and Monitoring (Basel: Bank for International Settlements). www.bis.org/publ/bcbs188.htm.
———, 2011a, Basel III: A Global Regulatory Framework for More Resilient Banks and Banking Systems (Basel: Bank for International Settlements; June 1).www.bis.org/publ/bcbs189.htm.
———, 2011b, Basel III: International Framework for Liquid-ity Risk Measurement, Standards and Monitoring (Basel: Bank for International Settlements; December). www.bis.org/publ/bcbs188.htm.
———, 2011c, Global Systemically Important Banks: Assess-ment Methodology and the Additional Loss Absorbency Requirement (Basel: Bank for International Settlements; November). www.bis.org/publ/bcbs207.htm.
———, 2012a, Results of the Basel III Monitoring Exercise as of 30 June 2011 (Basel: Bank for International Settle-ments). www.bis.org/publ/bcbs217.htm.
———, 2012b, Dealing with Domestic Systemically Important Banks: Consultative Document (Basel: Bank for Interna-tional Settlements; June). www.bis.org/press/p120629.htm.
———, 2012c, Progress Report on Basel III Implementation (Basel: Bank for International Settlements; April). www.bis .org/publ/bcbs215.htm.
Boot, Arnoud, and Lev Ratnovski, forthcoming, “Banking and Trading,” IMF Working Paper (Washington: Interna-tional Monetary Fund).
Boot, Arnoud, and Anjan Thakor, 2000, “Can Relationship Banking Survive Competition?” Journal of Finance, Vol. 55, No. 2, pp. 679–713.
Borio, Claudio, and Piti Disyatat, 2009, “Unconventional Monetary Policies: An Appraisal,” BIS Working Paper No. 292 (Basel: Bank for International Settlements).
Boyd, J. H., and G. De Nicolò, 2005, “The Theory of Bank Risk Taking and Competition Revis-ited,” Journal of Finance, Vol. 60, pp. 1329–43. doi: 10.1111/j.1540-6261.2005.00763.x.
Brunnermeier, Marcus, Gang Dong, and Darius Palia, forth-coming, “Banks’ Non-Interest Income and Systemic Risk,” IMF Working Paper (Washington: International Monetary Fund).
Cameron, Matt, 2011, “The Art of Securitizing CVA,” RISK, February.
Cardarelli, Roberto, Selim Elekdag, and Subir Lall, 2011, “Financial Stress and Economic Contractions,” Journal of Financial Stability, Vol. 7, No. 2, pp. 78–97.
Carlin, Bruce, 2009, “Strategic Price Complexity in Retail Financial Markets,” Journal of Financial Economics, Vol. 91, No. 3, pp. 278–87.

G LO B A L F I N A N C I A L S TA B I L I T Y R E P O RT
138 International Monetary Fund | October 2012
Chow, J., and J. Surti, 2011, “Making Banks Safer: Can Vol-cker and Vickers Do It?” IMF Working Paper No. 11/236 (Washington: International Monetary Fund).
Čihák, Martin, Sònia Muñoz, and Ryan Scuzzarella, 2012, “The Bright and the Dark Side of Cross-Border Banking Linkages,” Czech Journal of Economics and Finance, Vol. 62, No. 3.
Claessens, Stijn, Ceyla Pazarbasioglu, Luc Laeven, Marc Dobler, Fabian Valencia, Oana Nedelescu, and Katharine Seal, 2011, “Crisis Management and Resolution: Early Les-sons from the Financial Crisis,” IMF Staff Discussion Note 11/05 (Washington: International Monetary Fund). doi: 10.5089/9781455286546.006.
Claessens, Stijn, Zoltan Pozsar, Lev Ratnovski, and Manmo-han Singh, forthcoming, “Shadow Banking: Economics and Policy,” IMF Working Paper (Washington: Interna-tional Monetary Fund).
Claessens, Stijn, and Neeltje Van Horen, 2012, “Foreign Banks: Trends, Impact and Financial Stability.” IMF Work-ing Paper No. 12/10 (Washington: International Monetary Fund).
Copeland, Adam, 2012, “Income Evolution at BHCs: How Big BHCs Differ” (New York: Federal Reserve Bank of New York; July 23). http://libertystreeteconomics.newyor-kfed.org/2012/07/income-evolution-at-bhcs-how-big-bhcs-differ.html.
Covitz, Daniel M., Nellie Liang, and Gustavo A. Suarez, forthcoming, “The Evolution of a Financial Crisis: Col-lapse of the Asset-Backed Commercial Paper Market,” Jour-nal of Finance.
Demsetz, Rebecca S., and Philip Strahan, 1997, “Diversifica-tion, Size and Risk at U.S. Bank Holding Companies, Journal of Money, Credit and Banking, Vol. 29, pp. 300–13.
De Nicolò, Gianni, John H. Boyd, and Abu M. Jalal, 2009, “Bank Competition, Risk and Asset Allocations,” IMF Working Paper No. 09/143 (Washington: International Monetary Fund).
De Nicolò, Gianni, Luc Laeven, and Kenichi Ueda, 2008, “Corporate Governance Quality: Trends and Real Effects,” Journal of Financial Intermediation, Vol. 17, No. 2, pp. 198–228. http://ideas.repec.org/s/eee/jfinin.html.
Duffie, Darrell, 2010, “The Failure Mechanics of Dealer Banks,” Journal of Economic Perspectives, Vol. 24, No. 1, pp. 51–72.
European Banking Authority (EBA), 2012, “Results of the 2011 EU-Wide Stress Test,” press release, July 15. www.eba.europa.eu/EU-wide-stress-testing/2011/2011-EU-wide-stress-test-results.aspx.
Financial Stability Board (FSB), 2011a, “Key Attributes of Effective Resolution Regimes for Financial Institutions”
(Basel; October). www.financialstabilityboard.org/cos/cos_111001a.htm.
———, 2011b, “Shadow Banking: Scoping the Issues,” A Back-ground Note of the Financial Stability Board (Basel; April). www.financialstabilityboard.org/list/fsb_publications/tid_150/index.htm.
———, 2012a, “Strengthening the Oversight and Regulation of Shadow Banking: Progress Report to G20 Ministers and Governors” (Basel; April). www.financialstabilityboard.org/publications/r_120420c.pdf.
———, 2012b, OTC Derivatives Market Reforms: Third Progress Report on Implementation (Basel; June). www.financialstabilityboard.org/publications/r_120615.pdf.
Financial Stability Forum, 2009, “FSF Principles for Sound Compensation Practices” (Basel; April). www.financialstabilityboard.org/publications/r_0904b.pdf.
Financial Stability Oversight Council (FSOC), 2012, Annual Report (Washington: U.S. Department of the Treasury).
Fitch Ratings, 2012, “Derivatives and U.S. Corporations,” Fitch Ratings Credit Policy, June 7.
Freixas, Xavier, and Cornelia Holthausen, 2005, “Interbank Market Integration under Asymmetric Information,” Review of Financial Studies, Vol. 18, No. 2, pp. 459–90.
G20, 2008, “Declaration of the Summit on Financial Markets and the World Economy” (Washington; November 15).
———,2009, “Global Plan for Recovery and Reform,” State-ment by the G20, London, April 2. www.g20.utoronto .ca/2008/2008declaration1115.html.
———, 2012, “Identifying the Effects of Regulatory Reforms on Emerging Market and Developing Economies: A Review of Potential Unintended Consequences,” June.
Gabaix, Xavier, and David Laibson, 2006, “Shrouded Attri-butes, Consumer Myopia, and Information Suppression in Competitive Markets,” Quarterly Journal of Economics, Vol. 121, No. 2, pp. 505–40.
Gennaioli, Nicola, Andrei Shleifer, and Robert Vishny, 2012, “Neglected Risks, Financial Innovation, and Financial Fragility,” Journal of Financial Economics, Vol. 104, pp. 452–68.
———, forthcoming, “A Model of Shadow Banking,” Journal of Finance.
Gorton, Gary, and Andrew Metrick, 2012, “Securitized Bank-ing and the Run on Repo,” Journal of Financial Economics, Vol. 104, No. 3, pp. 425–51.
Hoenig, Thomas, and Charles Morris, 2011, “Restructuring the Banking System to Improve Safety and Soundness,” Federal Reserve Bank of Kansas City.
Huang, Rocco, and Lev Ratnovski, 2011, “The Dark Side of Bank Wholesale Funding,” Journal of Financial Intermedia-tion, Vol. 20, No. 2, pp. 248–63.
c h a p t e r 3 T h E R E F O R m AG E N dA: A N I N T E R I m R E P O RT O N P R O G R E S S TOwA R d A S A F E R F I N A N C I A L S YS T E m
International Monetary Fund | October 2012 139
Independent Commission on Banking (ICB), 2011, Final Report: Recommendations (London). http://bankingcommission.independent.gov.uk.
International Monetary Fund, 2006, “How Do Financial Systems Affect Economic Cycles,” World Economic Outlook, World Economic and Financial Surveys (Washington; September), Chapter 4.
———, 2009, “Market Interventions during the Financial Crisis: How Effective and How to Disengage?” Global Financial Stability Report, World Economic and Financial Surveys (Washington; October), Chapter 3.
———, 2010, “Making Over-the-Counter Derivatives Safer: The Role of Central Counterparties,” Global Financial Stability Report, World Economic and Financial Surveys (Washington; April), Chapter 3.
———, 2011a, “Long-Term Investors and Their Asset Alloca-tion: Where Are They Now?” Global Financial Stability Report, World Economic and Financial Surveys (Washing-ton; September), Chapter 2.
———, 2011b, “How to Address the Systemic Part of Liquidity Risk,” Global Financial Stability Report, World Economic and Financial Surveys (Washington; April), Chapter 2.
———, 2012a, “Sovereigns, Banks, and Emerging Markets: Detailed Analysis and Policies,” Global Financial Stability Report, World Economic and Financial Surveys (Washing-ton; April), Chapter 2.
———, 2012b, “Safe Assets: Financial System Cornerstone?” Global Financial Stability Report, World Economic and Financial Surveys (Washington; April), Chapter 3.
———, 2012c, “The Financial Impact of Longevity Risk, “Global Financial Stability Report, World Economic and Financial Surveys (Washington; April), Chapter 4.
International Monetary Fund, Bank for International Settle-ments, and Financial Stability Board (IMF-BIS-FSB), 2009, Guidance to Assess the Systemic Importance of Finan-cial Institutions, Markets and Instruments: Initial Consider-ations, Report to the G20 Finance Ministers and Central Bank Governors (October).
Jenkins, Patrick, and Brooke Masters, 2012, “Banks Test CDOs for Trade Finance,” Financial Times, April 8.
Kodres, Laura, and Aditya Narain, 2010, “Redesigning the Contours of the Future Financial System,” IMF Staff Position Note 10/10 (Washington: International Monetary Fund).
Laeven, Luc, and Fabián Valencia, forthcoming, “The Real Effects of Financial Sector Interventions during Crises,” Journal of Money Credit and Banking.
Leckow, Ross, and Ceyla Pazarbasioglu, 2012, “Resolution of Cross-Border Banks: A Proposed Framework for Enhanced Coordination,” in Building a More Resilient Financial Sec-
tor: Reforms in the Wake of the Global Crisis, ed. by Aditya Narain, İnci Ötker-Robe, and Ceyla Pazarbasioglu (Wash-ington: International Monetary Fund), Chapter 6.
Lo, Andrew, 2011, “Complexity, Concentration and Conta-gion: A Comment,” Journal of Monetary Economics, Vol. 58, No. 5, pp. 47–79.
Macroeconomic Assessment Group (MAG), 2010, Assessing the Macro-Economic Impact of the Transition to Stronger Capital and Liquidity Requirements (Basel: Bank for Inter-national Settlements).
Minoiu, Camelia, and Javier Reyes, 2011, “A Network Analy-sis of Global Banking: 1978–2009,” IMF Working Paper No. 11/74 (Washington: International Monetary Fund).
Myers, Stewart, and Raghuram Rajan, 1998, “The Paradox of Liquidity,” Quarterly Journal of Economics, Vol. 113, No. 3, pp. 733–71.
Ötker-Robe, İnci, Aditya Narain, Anna Ilyina, and Jay Surti, 2011, “The Too-Important-to-Fail Conundrum: Impossible to Ignore and Difficult to Resolve,” IMF Staff Discussion Note 11/12 (Washington: International Monetary Fund). doi: 10.5089/9781463926588.006.A001.
Ötker-Robe, İnci, and Ceyla Pazarbasioglu, 2010, “Impact of Regulatory Reforms on Large and Complex Finan-cial Institutions,” IMF Staff Position Note 10/16 (Washington: International Monetary Fund). doi: 10.5089/9781462345496.004.A001.
Plantin, Guillaume, Haresh Sapra, and Hyun Shin, 2008, “Marking to Market: Panacea or Pandora’s Box?” Journal of Accounting Research, Vol. 46, No. 2, pp. 435–60.
Pozsar, Zoltan, 2011, “Institutional Cash Pools and the Triffin Dilemma of the U.S. Banking System,” IMF Working Paper No. 11/190 (Washington: International Monetary Fund).
Rajan, Raghuram, 2005, “Has Financial Development Made the World Riskier?” Proceedings of the 2005 Jackson Hole Economic Policy Symposium, pp. 313–69.
Santos, André Oliveira, and Douglas Elliott, 2012, “Estimat-ing the Costs of Financial Regulation,” IMF Staff Discus-sion Note 12/11 (Washington: International Monetary Fund).
Saunders, Antony, 2000, Financial Institutions Management, 3rd ed. (Columbus, Ohio: McGraw-Hill).
Schich, Sebastian, and Byoung-Hwan Kim, 2011, “Guarantee Arrangements for Financial Promises: How Widely Should the Safety Net Be Cast?” OECD Journal Financial Market Trends, Issue 1 (Paris: Organization for Economic Coop-eration and Development. www.oecd.org/dataoecd/42/49/48297609.pdf.
Shleifer, Andrei, and Robert Vishny, 2010, “Unstable Bank-ing,” Journal of Financial Economics, Vol. 97, pp. 306–18.
G LO B A L F I N A N C I A L S TA B I L I T Y R E P O RT
140 International Monetary Fund | October 2012
Stein, Jeremy, 2002, “Information Production and Capital Allocation: Decentralized Versus Hierarchical Firms,” Jour-nal of Finance, Vol. 57, No. 5, pp. 1891–1921.
Ueda, Kenichi, and Beatrice Weder di Mauro, 2012, “Quan-tifying the Value of the Subsidy for Systemically Important Financial Institutions,” IMF Working Paper No. 12/128 (Washington: International Monetary Fund).
Valckx, Nico, forthcoming, “How Did Recent ECB Policy Measures Affect Euro Area Banks’ Lending?” IMF Working Paper (Washington: International Monetary Fund).
Viñals, José, and Jonathan Fiechter, 2010, “The Making of Good Supervision: Learning to Say ‘No,’” IMF Staff Posi-tion Note 10/08 (Washington: International Monetary Fund). doi: 10.5089/9781462310180.004.A001.
Viñals, José, Jonathan Fiechter, Ceyla Pazarbasioglu, Laura Kodres, Aditya Narain, and Marina Moretti, 2010, “Shap-ing the New Financial System,” IMF Staff Position Note 10/15 (Washington: International Monetary Fund). doi: 10.5089/9781455267361.004.
Wagner, Wolf, 2011, “Systemic Liquidation Risk and the Diversity–Diversification Trade-Off,” Journal of Finance, Vol. 66, No. 4, pp. 1141–75.
Zhou, Jian-Ping, Virginia Skidmore Rutledge, Wouter Bossu, Marc Dobler, Nadège Jassaud, and Michael Moore, 2012, “From Bail-Out to Bail-In: Mandatory Debt Restructuring of Systemic Financial Institutions,” IMF Staff Discussion Note 12/03 (Washington: International Monetary Fund).