Embed Size (px)
Citation preview

An Integrated Speciality Steel
&
Global Wire Rope Company
STRENGTH THROUGH INTEGRATION
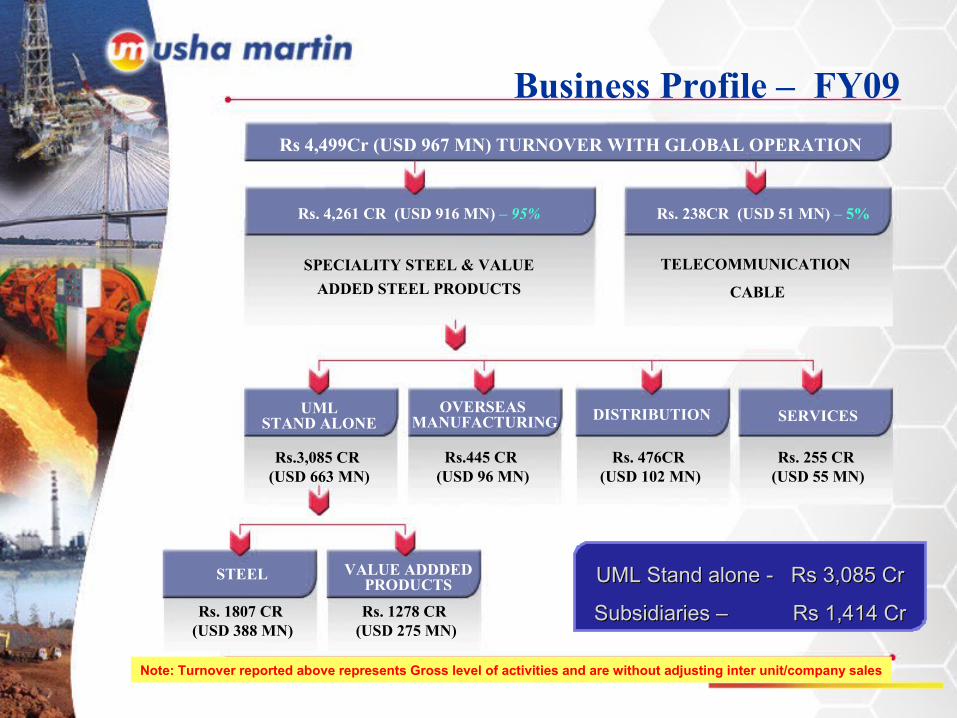
Business Profile – FY09
SPECIALITY STEEL & VALUE ADDED STEEL PRODUCTS
SERVICES
Rs 4,499Cr (USD 967 MN) TURNOVER WITH GLOBAL OPERATION
DISTRIBUTIONUMLSTAND ALONE
Rs. 238CR (USD 51 MN) – 5%Rs. 4,261 CR (USD 916 MN) – 95%
TELECOMMUNICATION
CABLE
Rs.3,085 CR (USD 663 MN)
OVERSEAS MANUFACTURING
Rs.445 CR (USD 96 MN)
Rs. 476CR (USD 102 MN)
Rs. 255 CR (USD 55 MN)
STEEL
Rs. 1807 CR (USD 388 MN)
VALUE ADDDED PRODUCTS
Rs. 1278 CR (USD 275 MN)
UML Stand alone - Rs 3,085 CrUML Stand alone - Rs 3,085 Cr
Subsidiaries – Rs 1,414 CrSubsidiaries – Rs 1,414 Cr
Note: Turnover reported above represents Gross level of activities and are without adjusting inter unit/company sales
STRENGTH THROUGH INTEGRATION
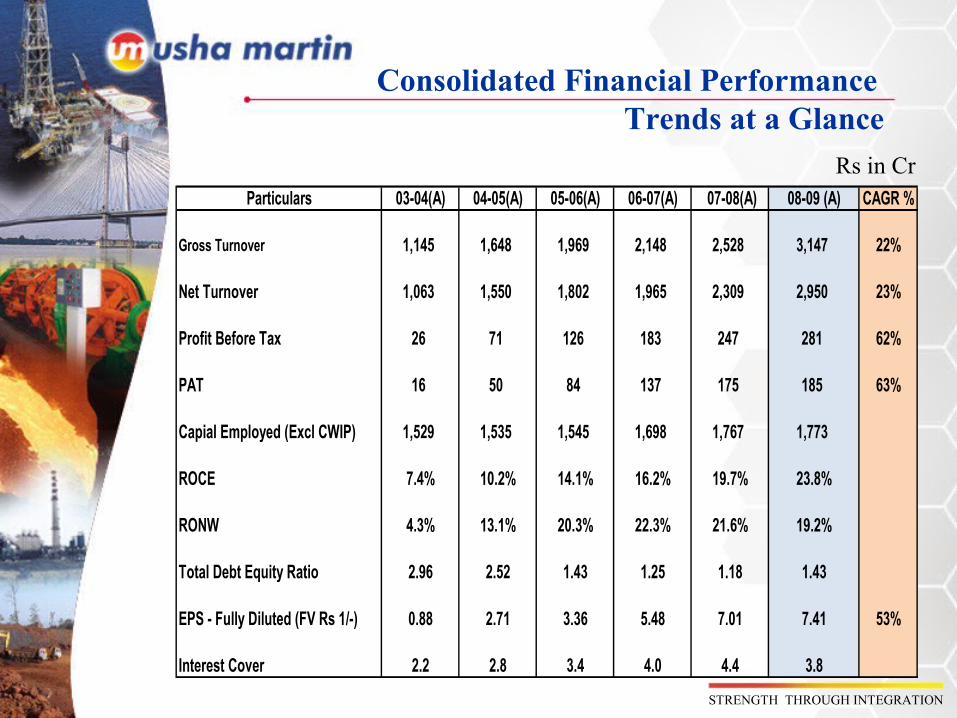
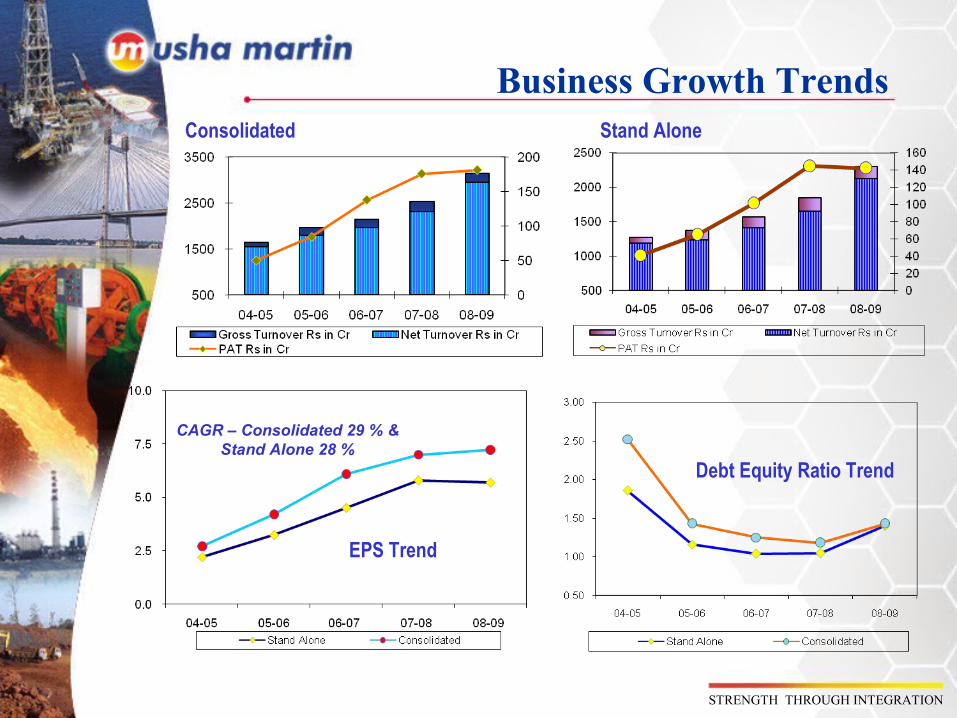
Consolidated Financial Performance Trends at a Glance
Rs in CrParticulars 03-04(A) 04-05(A) 05-06(A) 06-07(A) 07-08(A) 08-09 (A) CAGR %
Gross Turnover 1,145 1,648 1,969 2,148 2,528 3,147 22%
Net Turnover 1,063 1,550 1,802 1,965 2,309 2,950 23%
Profit Before Tax 26 71 126 183 247 281 62%
PAT 16 50 84 137 175 185 63%
Capial Employed (Excl CWIP) 1,529 1,535 1,545 1,698 1,767 1,773
ROCE 7.4% 10.2% 14.1% 16.2% 19.7% 23.8%
RONW 4.3% 13.1% 20.3% 22.3% 21.6% 19.2%
Total Debt Equity Ratio 2.96 2.52 1.43 1.25 1.18 1.43
EPS - Fully Diluted (FV Rs 1/-) 0.88 2.71 3.36 5.48 7.01 7.41 53%
Interest Cover 2.2 2.8 3.4 4.0 4.4 3.8
STRENGTH THROUGH INTEGRATION
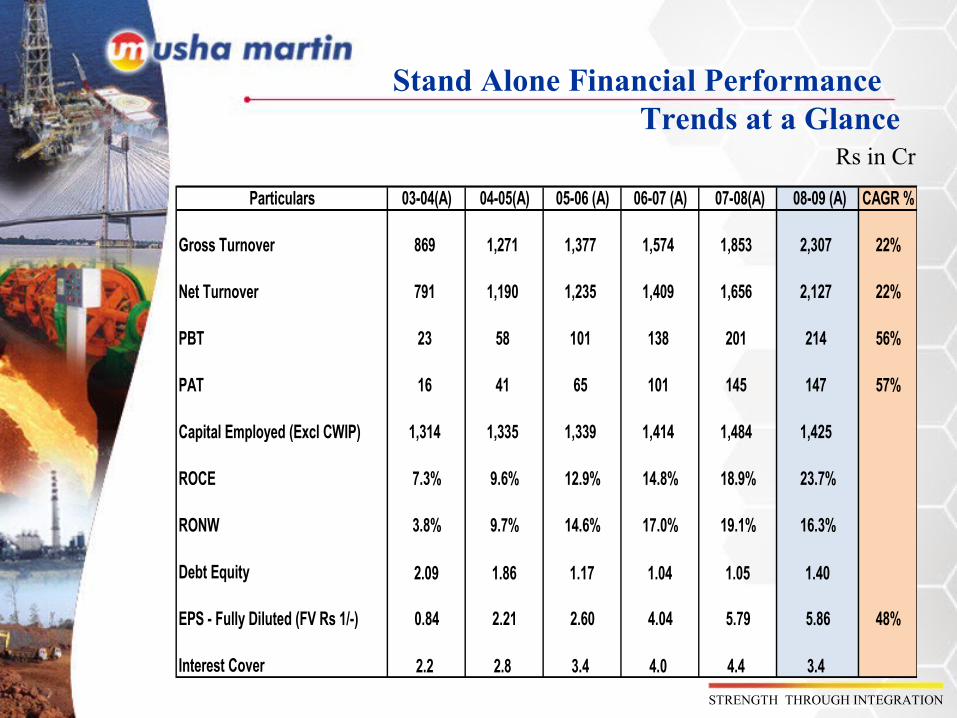
Stand Alone Financial Performance Trends at a Glance
Rs in Cr
Particulars 03-04(A) 04-05(A) 05-06 (A) 06-07 (A) 07-08(A) 08-09 (A) CAGR %
Gross Turnover 869 1,271 1,377 1,574 1,853 2,307 22%
Net Turnover 791 1,190 1,235 1,409 1,656 2,127 22%
PBT 23 58 101 138 201 214 56%
PAT 16 41 65 101 145 147 57%
Capital Employed (Excl CWIP) 1,314 1,335 1,339 1,414 1,484 1,425
ROCE 7.3% 9.6% 12.9% 14.8% 18.9% 23.7%
RONW 3.8% 9.7% 14.6% 17.0% 19.1% 16.3%
Debt Equity 2.09 1.86 1.17 1.04 1.05 1.40
EPS - Fully Diluted (FV Rs 1/-) 0.84 2.21 2.60 4.04 5.79 5.86 48%
Interest Cover 2.2 2.8 3.4 4.0 4.4 3.4
STRENGTH THROUGH INTEGRATION
Consolidated
EPS Trend
Debt Equity Ratio Trend
Stand Alone
CAGR – Consolidated 29 % & Stand Alone 28 %
Business Growth Trends
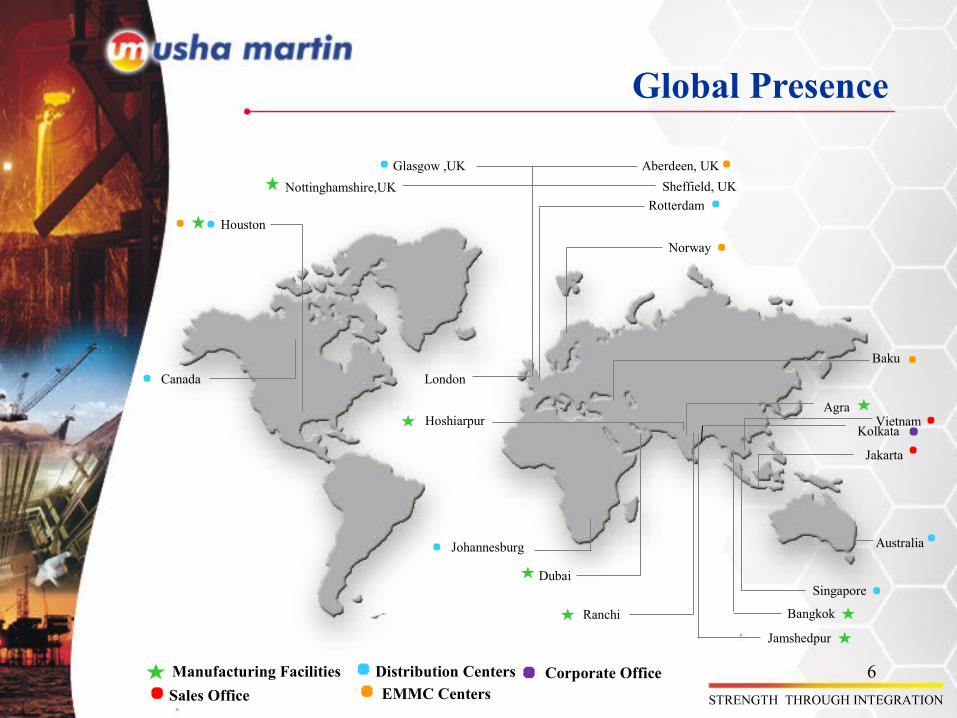
Global Presence
Aberdeen, UKGlasgow ,UK
Norway
Baku
Houston
Dubai
Jamshedpur
Bangkok
Johannesburg
Singapore
Sales Office EMMC CentersManufacturing Facilities Distribution Centers
Nottinghamshire,UK
Vietnam
Ranchi
Australia
STRENGTH THROUGH INTEGRATION
Canada
Hoshiarpur
Jakarta
RotterdamSheffield, UK
Agra
Kolkata
Corporate Office
London
6
STRENGTH THROUGH INTEGRATION
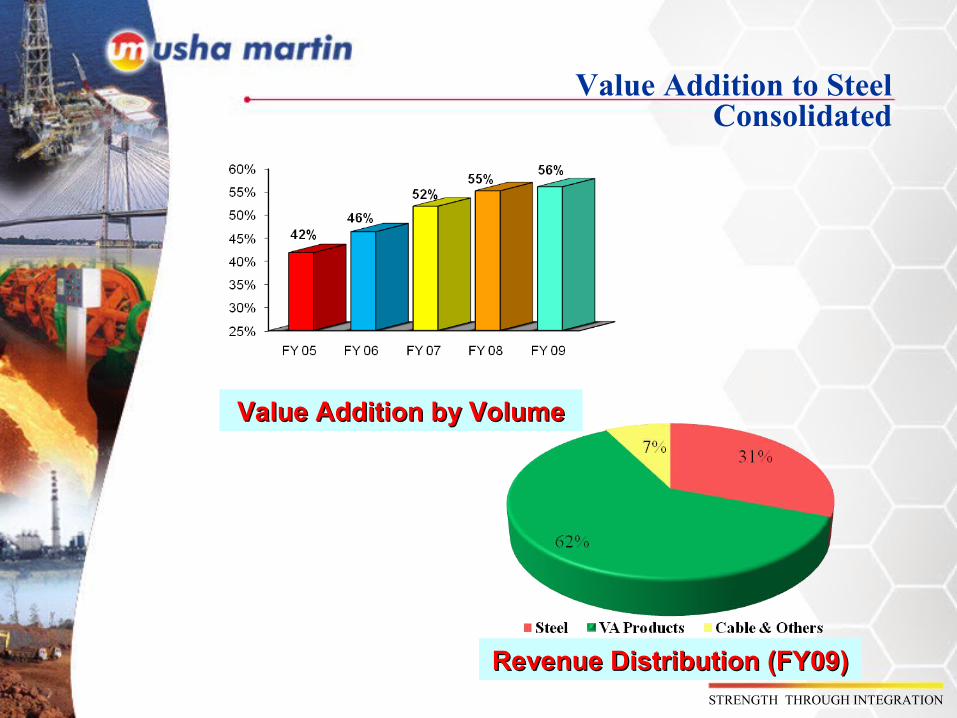
Value Addition to Steel Consolidated
Value Addition by VolumeValue Addition by Volume
Revenue Distribution (FY09)Revenue Distribution (FY09)
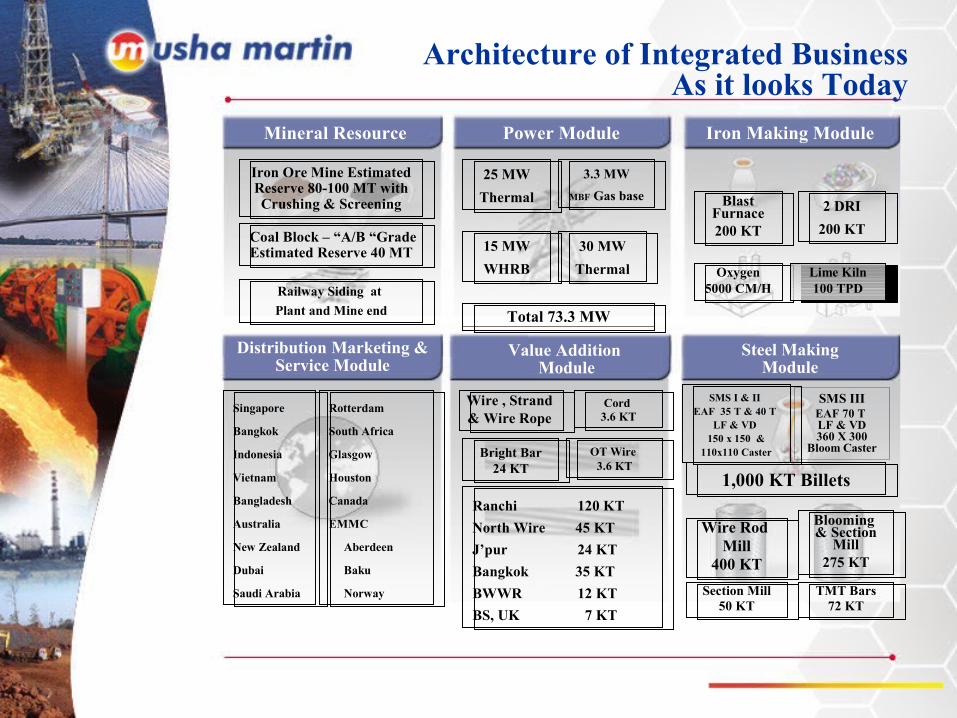
Architecture of Integrated Business As it looks Today
Mineral Resource Power Module Iron Making Module
Distribution Marketing & Service Module
Value Addition Module
Steel MakingModule
Wire , Strand & Wire Rope
Blooming & Section
Mill275 KT
Cord 3.6 KT
Ranchi 120 KTNorth Wire 45 KTJ’pur 24 KTBangkok 35 KTBWWR 12 KTBS, UK 7 KT
Bright Bar24 KT
OT Wire 3.6 KT
Iron Ore Mine Estimated Reserve 80-100 MT with Crushing & Screening
25 MWThermal
3.3 MWMBF Gas base
15 MWWHRB
Singapore
Bangkok
Indonesia
Vietnam
Bangladesh
Australia
New Zealand
Dubai
Saudi Arabia
Rotterdam
South Africa
Glasgow
Houston
Canada
EMMC
Aberdeen
Baku
Norway
30 MWThermal
Total 73.3 MW
Blast Furnace200 KT
2 DRI200 KT
1,000 KT Billets
Wire Rod Mill
400 KTSection Mill
50 KTTMT Bars
72 KT
Oxygen5000 CM/H
Lime Kiln100 TPDRailway Siding at
Plant and Mine end
Coal Block – “A/B “GradeEstimated Reserve 40 MT
SMS I & II EAF 35 T & 40 T
LF & VD 150 x 150 &
110x110 Caster
SMS IIIEAF 70 T LF & VD 360 X 300
Bloom Caster
STRENGTH THROUGH INTEGRATION
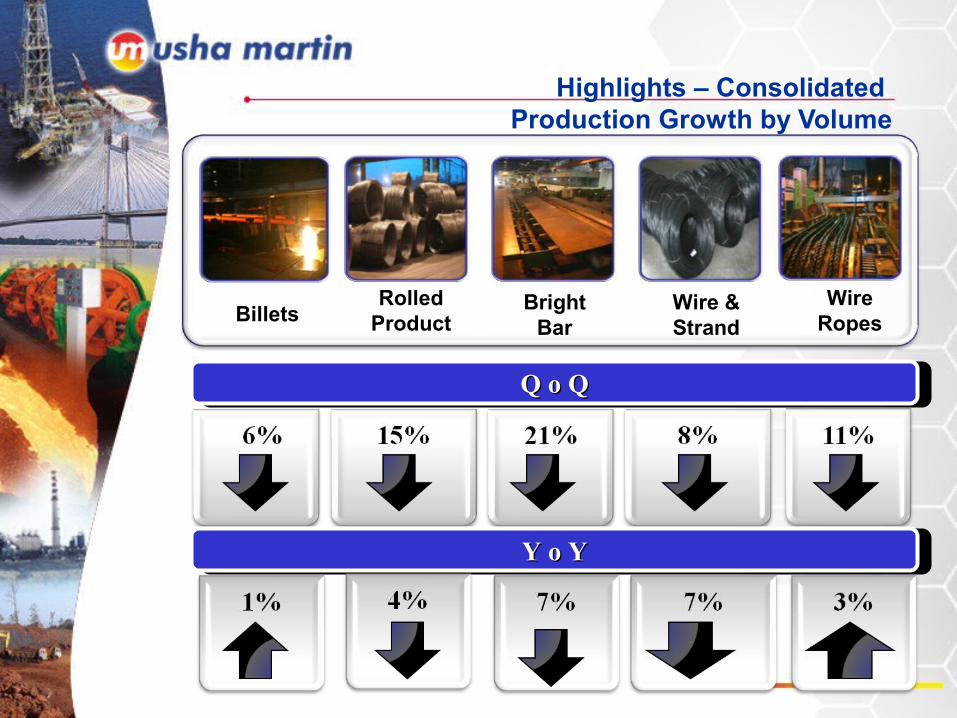
Highlights – Consolidated Production Growth by Volume
BilletsRolled
ProductBright
BarWire & Strand
Wire Ropes
Q o QQ o Q
Y o YY o Y
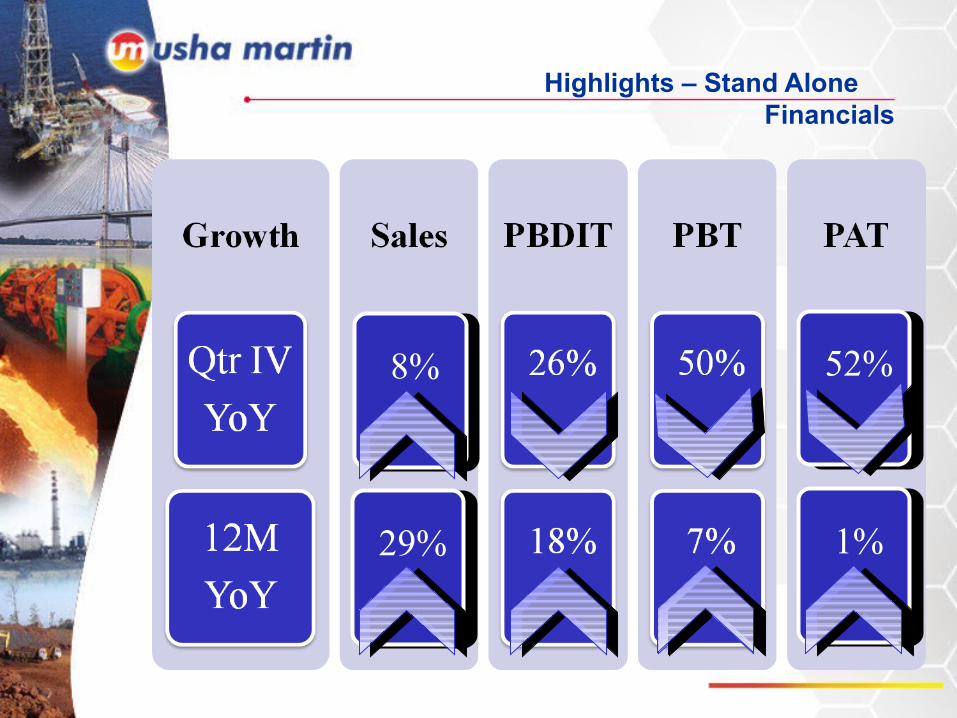
Highlights – Stand Alone Financials
8%
29%
52%
1%
STRENGTH THROUGH INTEGRATION
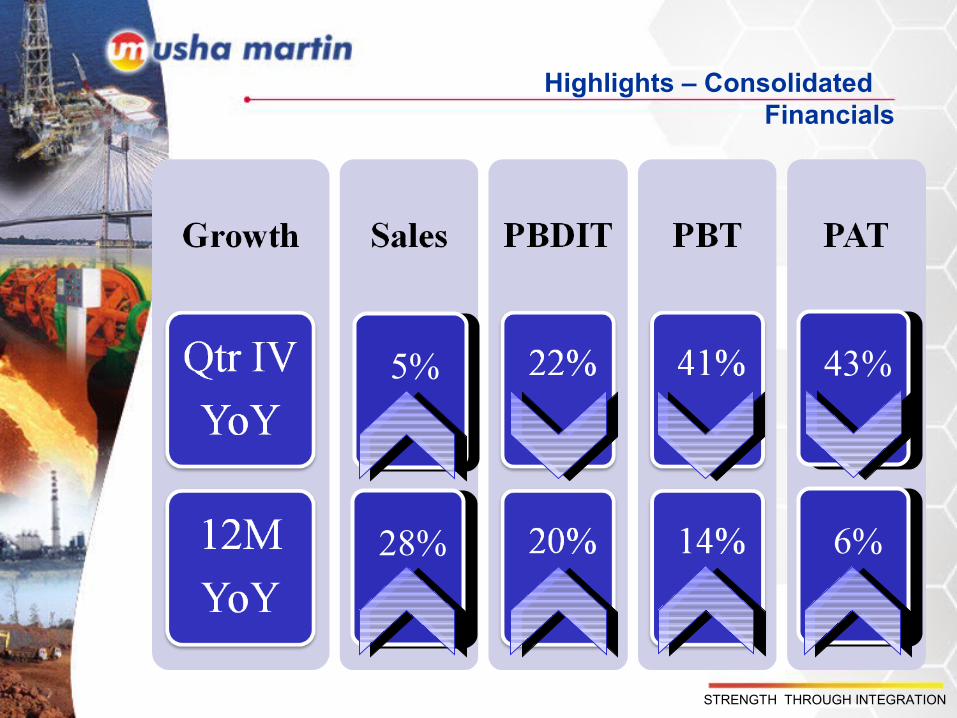
Highlights – Consolidated Financials
5%
28%
43%
6%
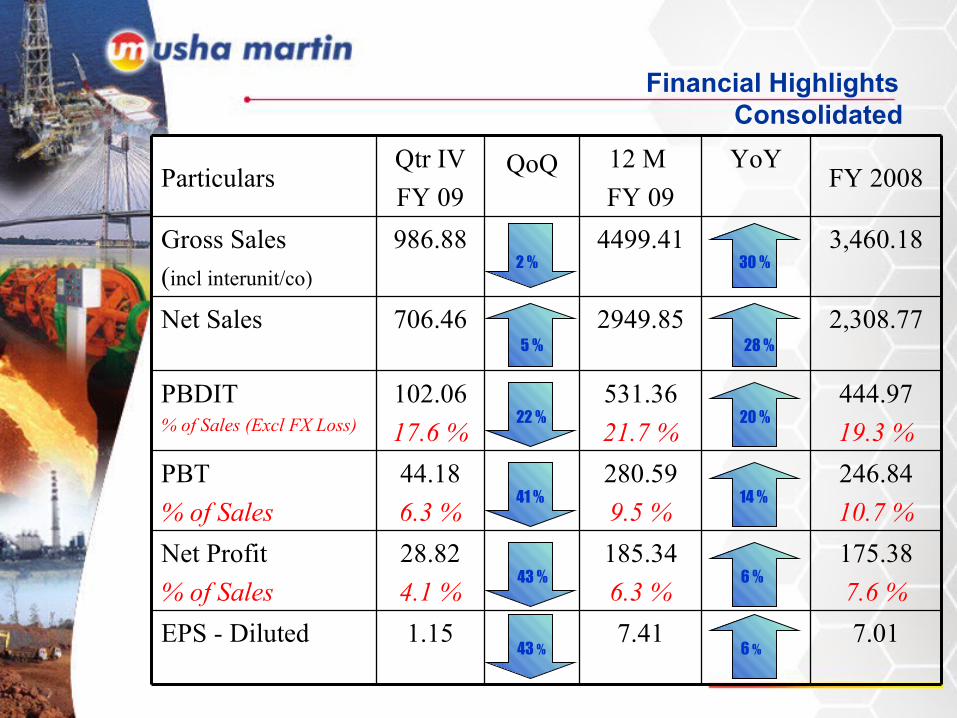
Financial Highlights Consolidated
ParticularsQtr IVFY 09
QoQ 12 M FY 09
YoYFY 2008
Gross Sales(incl interunit/co)
986.88 4499.41 3,460.18
Net Sales 706.46 2949.85 2,308.77
PBDIT% of Sales (Excl FX Loss)
102.0617.6 %
531.3621.7 %
444.9719.3 %
PBT% of Sales
44.186.3 %
280.599.5 %
246.8410.7 %
Net Profit% of Sales
28.824.1 %
185.346.3 %
175.387.6 %
EPS - Diluted 1.15 7.41 7.01
5 %
22 %
41 %
43 %
43 %
2 %
28 %
20 %
14 %
6 %
6 %
30 %
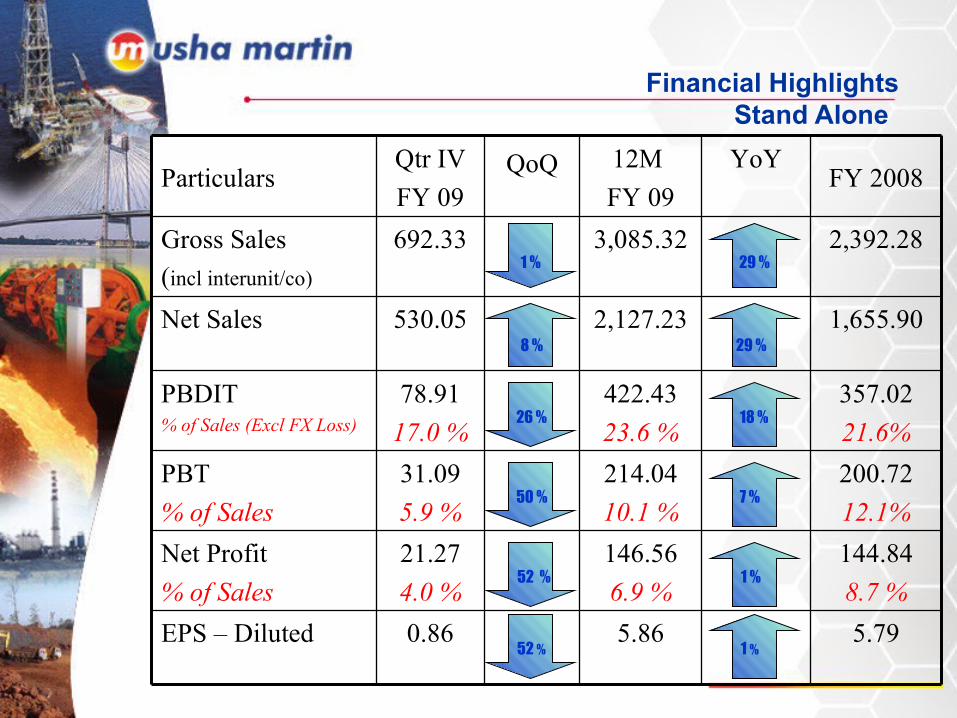
Financial Highlights Stand Alone
ParticularsQtr IVFY 09
QoQ 12M FY 09
YoYFY 2008
Gross Sales(incl interunit/co)
692.33 3,085.32 2,392.28
Net Sales 530.05 2,127.23 1,655.90
PBDIT% of Sales (Excl FX Loss)
78.9117.0 %
422.4323.6 %
357.0221.6%
PBT% of Sales
31.095.9 %
214.0410.1 %
200.7212.1%
Net Profit% of Sales
21.274.0 %
146.566.9 %
144.848.7 %
EPS – Diluted 0.86 5.86 5.79
29 %
18 %
7 %
1 %
1 %
29 %
8 %
26 %
50 %
52 %
52 %
1 %
STRENGTH THROUGH INTEGRATION
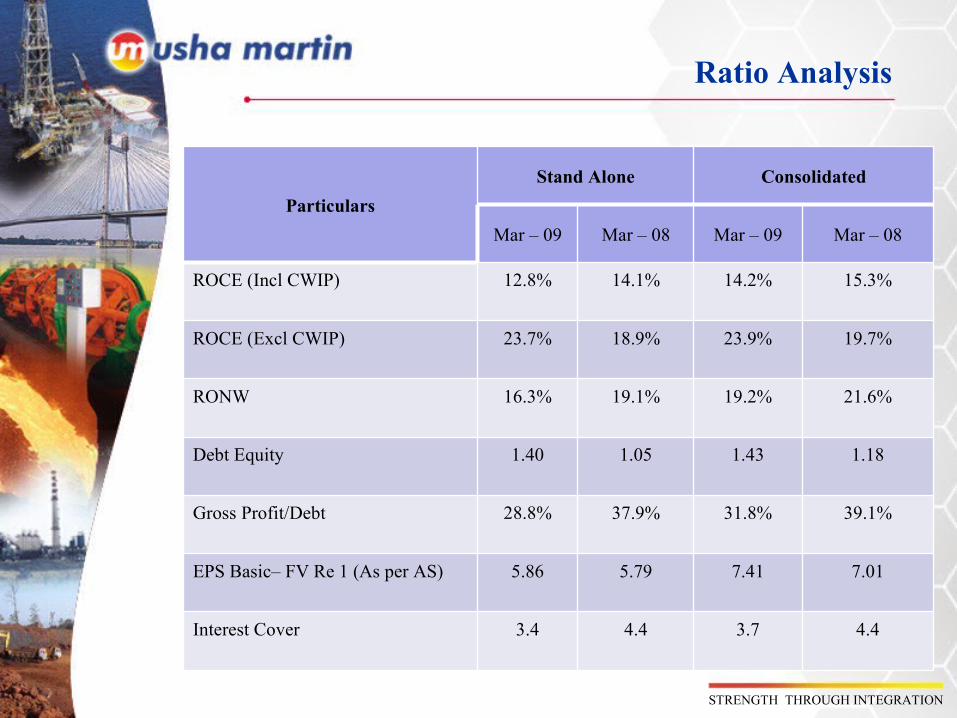
ParticularsStand Alone Consolidated
Mar – 09 Mar – 08 Mar – 09 Mar – 08
ROCE (Incl CWIP) 12.8% 14.1% 14.2% 15.3%
ROCE (Excl CWIP) 23.7% 18.9% 23.9% 19.7%
RONW 16.3% 19.1% 19.2% 21.6%
Debt Equity 1.40 1.05 1.43 1.18
Gross Profit/Debt 28.8% 37.9% 31.8% 39.1%
EPS Basic– FV Re 1 (As per AS) 5.86 5.79 7.41 7.01
Interest Cover 3.4 4.4 3.7 4.4
Ratio Analysis
STRENGTH THROUGH INTEGRATION
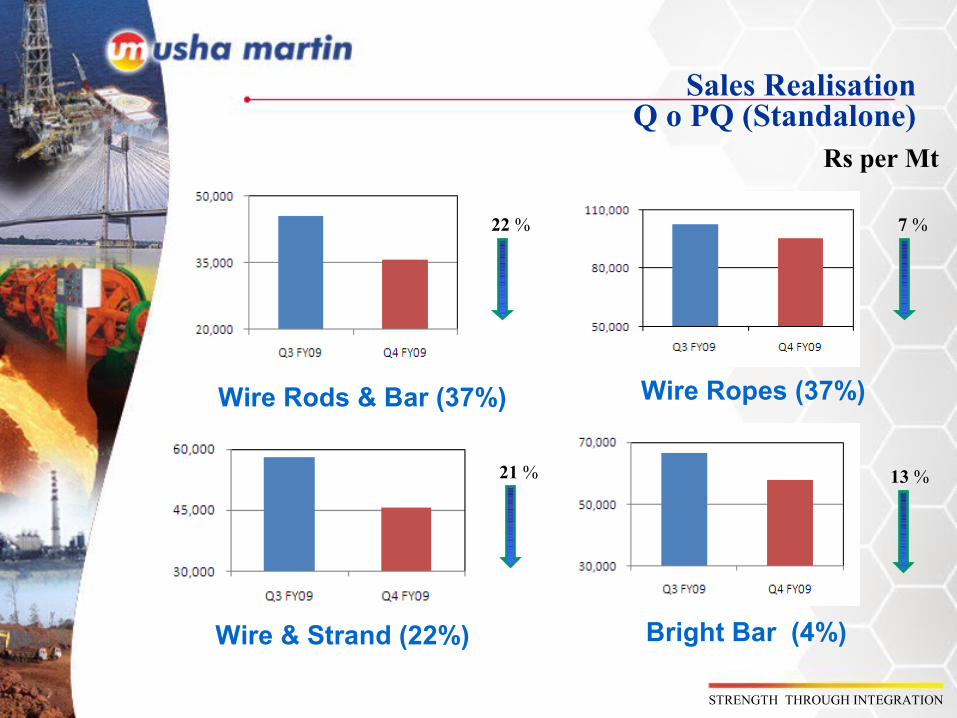
Sales RealisationQ o PQ (Standalone)
Rs per Mt
Wire Rods & Bar (37%)
Bright Bar (4%)Wire & Strand (22%)
Wire Ropes (37%)
21 % 13 %
7 %22 %
STRENGTH THROUGH INTEGRATION
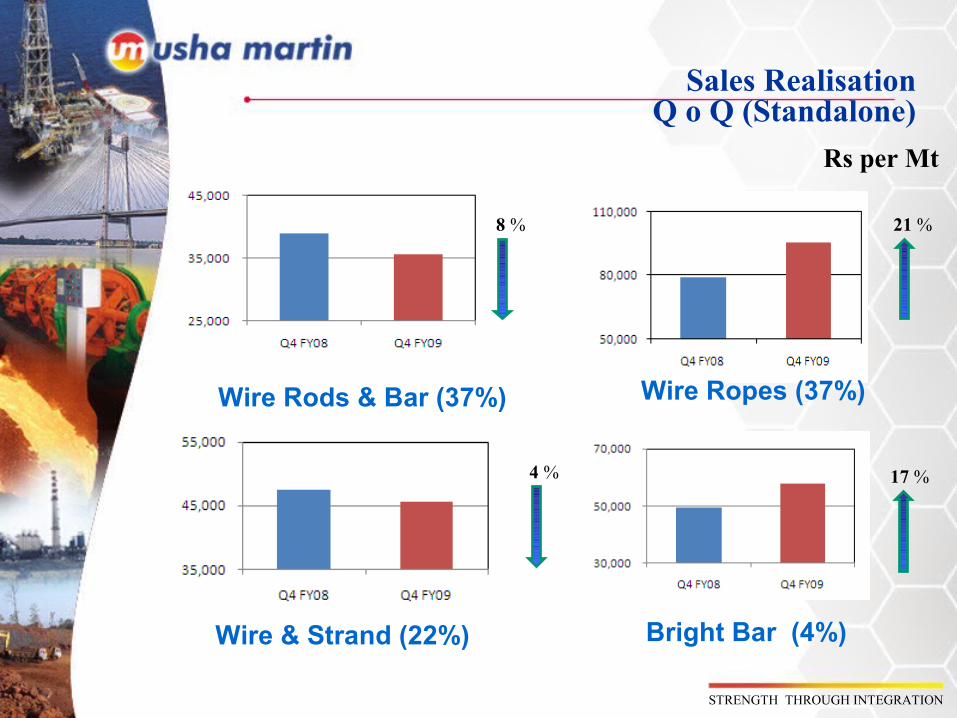
Sales RealisationQ o Q (Standalone)
Rs per Mt
Wire Rods & Bar (37%)
Bright Bar (4%)Wire & Strand (22%)
Wire Ropes (37%)
4 % 17 %
21 %8 %
STRENGTH THROUGH INTEGRATION
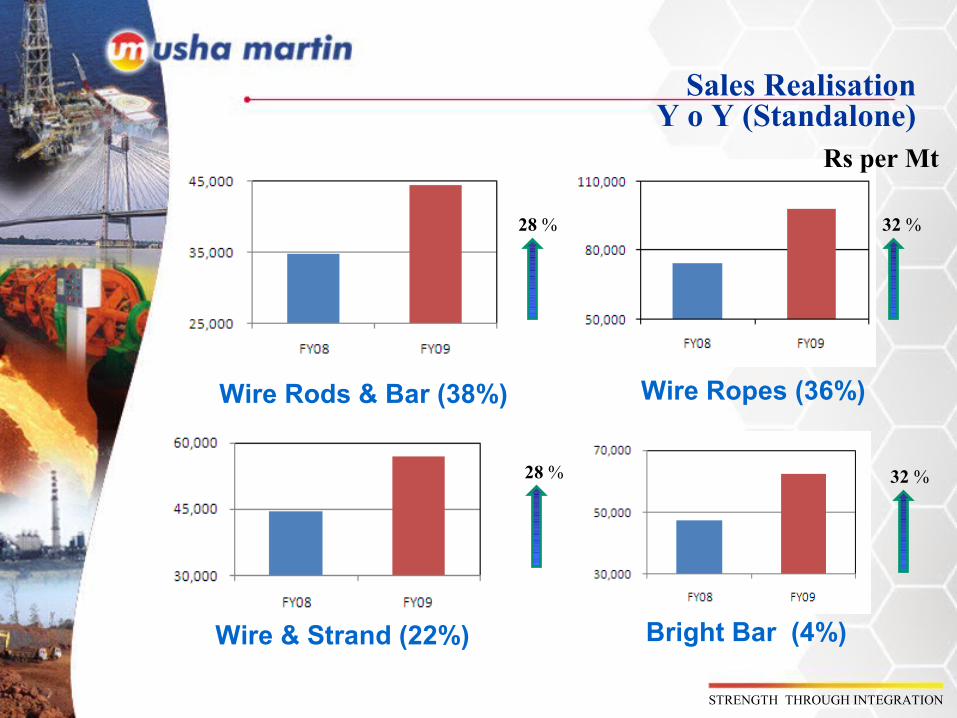
Sales RealisationY o Y (Standalone)
Rs per Mt
Wire Rods & Bar (38%)
Bright Bar (4%)Wire & Strand (22%)
Wire Ropes (36%)
28 % 32 %
32 %28 %
STRENGTH THROUGH INTEGRATION
Key Highlights
harp reduction in product and raw material prices in
second half of the financial year
olatility in foreign exchange – Loss of Rs 78.30 Cr in the
year against gain of Rs 20.33 Cr in the previous year
ull absorption of high cost inventory
ontinued focus on export market
roduct Mix diversification
igh cost of funds
ontinued focus on Value Addition
STRENGTH THROUGH INTEGRATION
STRENGTH THROUGH INTEGRATION
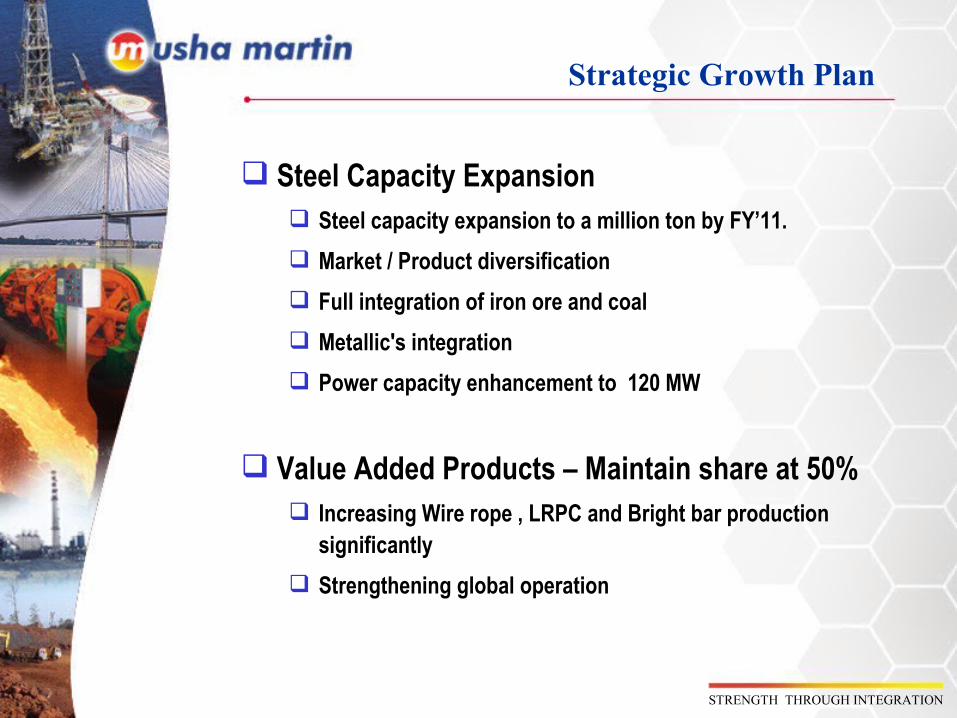
Strategic Growth Plan
Steel Capacity Expansion Steel capacity expansion to a million ton by FY’11. Market / Product diversification Full integration of iron ore and coal Metallic's integration Power capacity enhancement to 120 MW
Value Added Products – Maintain share at 50% Increasing Wire rope , LRPC and Bright bar production
significantly Strengthening global operation
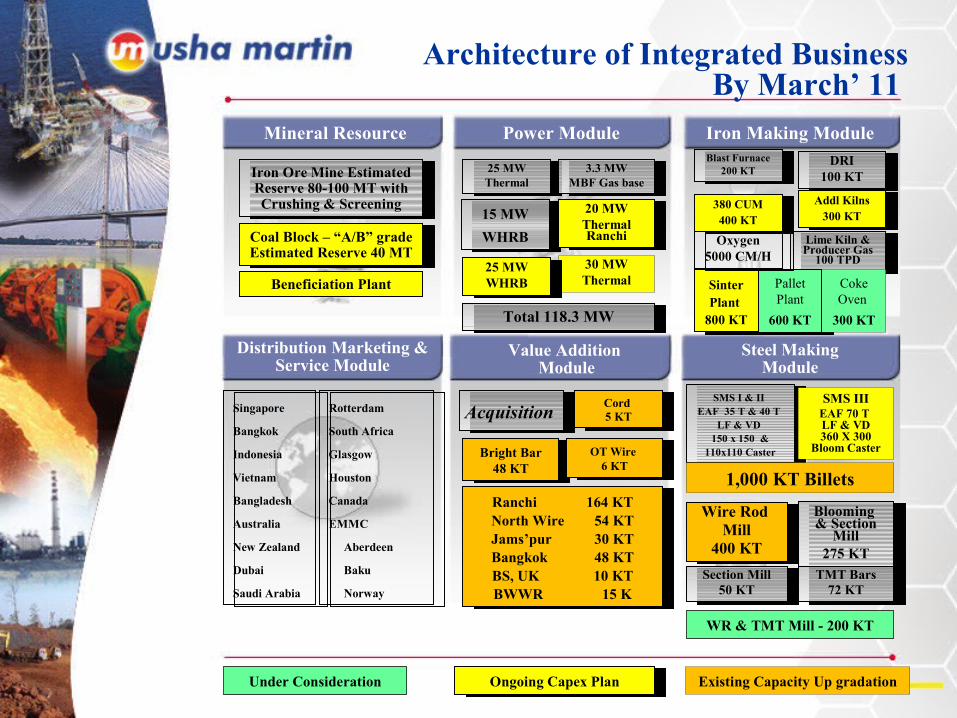
Lime Kiln & Producer Gas
100 TPD
Architecture of Integrated BusinessBy March’ 11
Mineral Resource Power Module Iron Making Module
Distribution Marketing & Service Module
Value Addition Module
Steel MakingModule
Acquisition SMS I & II
EAF 35 T & 40 T LF & VD
150 x 150 & 110x110 Caster
SMS IIIEAF 70 T LF & VD 360 X 300
Bloom Caster
Existing Capacity Up gradation
Blooming & Section
Mill275 KT
Cord 5 KT
Ranchi 164 KTNorth Wire 54 KTJams’pur 30 KTBangkok 48 KTBS, UK 10 KTBWWR 15 K
Bright Bar48 KT
OT Wire 6 KT
Ongoing Capex Plan
Iron Ore Mine Estimated Reserve 80-100 MT with Crushing & Screening
25 MWThermal
3.3 MWMBF Gas base
15 MWWHRB
20 MWThermal Ranchi
Singapore
Bangkok
Indonesia
Vietnam
Bangladesh
Australia
New Zealand
Dubai
Saudi Arabia
Rotterdam
South Africa
Glasgow
Houston
Canada
EMMC
Aberdeen
Baku
Norway
30 MWThermal
Total 118.3 MW
25 MWWHRB
380 CUM400 KT
Addl Kilns300 KT
Blast Furnace200 KT
DRI100 KT
Sinter Plant
800 KT
Pallet Plant
600 KT
Coke Oven
300 KT
1,000 KT Billets
Wire Rod Mill
400 KTSection Mill
50 KTTMT Bars
72 KT
Beneficiation Plant
Coal Block – “A/B” gradeEstimated Reserve 40 MT
Under Consideration
WR & TMT Mill - 200 KT
Oxygen5000 CM/H