Embed Size (px)
Citation preview

lable at ScienceDirect
Electrochimica Acta 280 (2018) 41e54
Contents lists avai
Electrochimica Acta
journal homepage: www.elsevier .com/locate/electacta
An integrated reduced order model considering degradation effectsfor LiFePO4/graphite cells
Xinchen Zhao a, Yalan Bi a, Song-Yul Choe a, *, Soo-Yeol Kim b
a Department of Mechanical Engineering, Auburn University, AL, 36849, USAb KEPCO R&D Center, 105 Munji-ro, Yuseong-gu, Daejeon, 305-760, South Korea
a r t i c l e i n f o
Article history:Received 22 January 2018Received in revised form17 April 2018Accepted 13 May 2018Available online 17 May 2018
Keywords:Extended Kalman FilterLithium iron phosphateReduced order modelSide reaction
* Corresponding author. 1418 Wiggins Hall, AuburnE-mail address: [email protected] (S.-Y. Choe).
https://doi.org/10.1016/j.electacta.2018.05.0910013-4686/© 2018 Published by Elsevier Ltd.
a b s t r a c t
A reduced order model (ROM) considering degradation effects is proposed and validated against ex-periments for both fresh and cycled lithium iron phosphate (LFP)/graphite cells. The ion behaviors in theLFP particles such as two-phase transition and path dependence are modeled using a shrinking core witha moving interface between a lithium-rich and a lithium-deficient phase. The model errors are furtherminimized by employing the Extended Kalman Filter (EKF) to achieve a more accurate state-of-charge(SoC) estimation. The average error of SoC and voltage estimation is kept within 4% and 2%, respec-tively. Side reaction is regarded as the predominant cause of degradation, which can be accelerated byelevated temperatures, high SoC levels and large SoC cycling limits. The effects of operating conditions ondegradation are described by a modified Butler-Volmer equation that is incorporated into the developedROM. The integrated model facilitates to represent the degradation effects of side reaction, including lossof ions, loss of active material, growth of solid electrolyte interphase and deposit layer, and electrolytedecomposition. The model is capable of estimating capacity and power with an accuracy of 2% and 3% upto 1000 cycles, respectively.
© 2018 Published by Elsevier Ltd.
1. Introduction
Lithium iron phosphate (LFP), firstly introduced by Padhi [1]et al., is a potential cathode material undergone remarkable de-velopments in the commercial market of lithium ion batteries(LiBs), due to the characteristics of good electrochemical andthermal stability [2]. Compared with the electrodes embedded byNi, Mn, Co, LFP based electrodes have the characteristics of two-phase transition and path dependence in both charge anddischarge cycles. Srinivasan and Newman [3], Wang et al. [4] andKavasajjula et al. [5] successively proposed a full ordermodel (FOM)based on the concept of a shrinking core to simulate the dischargebehaviors of both half and full cells with consideration of phasetransformation rate, two-phase interface mobility and diffusioncoefficients in both lithium-rich (Li1-bFePO4) and lithium-deficientphase (LiaFePO4). The electrochemical behaviors of charge profileswere validated by incorporating Laudau transformation to generatea moving boundary [6]. In spite of high accuracy, complexity of theparameters and high computational efforts limit the real-time
University, AL, 36849, USA.
application of FOM. Plenty of reduction methods have beenapplied to reduce the execution time with accuracy maintained,such as single particle model (SPM) [7], enhanced SPM [8,9], state-variable model [10], reformulated model [11], proper orthogonaldecomposition (POD) [12] model and volume averagingmodel [13].However, the lack of predictive capability of end-of-life (EoL) per-formance impedes its use in the battery management system(BMS).
The degradation of LiBs corresponding to calendar life [14,15]and cycle life [16e19] is as the results of exposing to the ambientenvironment and cycling usage, respectively. The capacity andpower fade are not caused by a single reason, but from large vari-eties. The inter-dependency of various degradation causes makesthe comprehension of degradation mechanism more difficult.Schematic diagram of potential degradation mechanism takingplace at composite electrodes, separator and current collectors isdepicted in Fig. 1.
Degradation phenomena occurring at positive and negativeelectrode are significantly different. Researchers have identified theside reaction taking place at the interface between electrode andelectrolyte at anode as the predominant cause of degradation forLiBs [20e30]. The main reaction is the intercalation/de-
Nomenclature
A sandwich area of the cell (m2)as specific surface area of electrode (m�1)c ion concentration (mol L�1)D diffusion coefficient(m2 s�1)F Faraday constant (96,487 Cmol�1)I current of the cell (A)i0 exchange current density of intercalation (Am�2)jLi reaction rate of intercalation (Am�3)ks isolation coefficient due to SEIL thickness of the micro cell (cm)Q capacity of the cell (Ah)Q amount of ion loss caused by side reaction (Ah)R resistance (U m2) or universal gas constant
(8.314 Jmol-1 K-1)Rs radius of spherical electrode particle (m)R coordinate along the radius of electrode particle (m)T cell temperature (K)t time (s)U potential (V)V voltage (V) or volume of the composite electrode
(m3)~V molar volume (m3 mol�1)x stoichiometric number of the anodey stoichiometric number of the cathode
Greek symbolsa transfer coefficient for an electrode reactiond thickness (m)ε volume fraction of a porous medium
F potential (V)h over-potential of electrode reaction (V)k ionic conductivity (S m�1)s conductivity (S m�1)
Subscripts and Superscriptsa anodicact actualaged aged cellave average valuec cathodice electrolyte phaseeff effectiveequ equilibriumerror errorexp experimentfresh fresh cellLi lithium ionmain main reactionmax maximumr radial direction in electrode particles solid phaseside side reactionsim simulationsurf electrode particle surface0% 0% SoC100% 100% SoCþ positive electrode (cathode)� negative electrode (anode)Q standard
X. Zhao et al. / Electrochimica Acta 280 (2018) 41e5442
intercalation of lithium ions to/from the electrode solid matrixduring cycling. The side reaction takes place between the lithiumions and the electrolyte solvents, which leads to the formation ofthe unsolvable byproducts that are the main components of thesolid electrolyte interphase (SEI) layer. The side reaction is
Fig. 1. Schematic diagram of degradatio
described in Eqs. (1) and (2).
2Liþ þ 2e� þ EC/CH2 ¼ CH2[þ Li2CO3Y (1)
n mechanism in LFP/graphite cells.
Table 1Specifications of testing cells (provided by Top Battery).
Material Cathode LFPAnode GraphiteElectrolyte Confidential
End-of-charge (EoC) voltage 3.6 VEnd-of-discharge (EoD) voltage 2.0 VNominal capacity 20Ah
X. Zhao et al. / Electrochimica Acta 280 (2018) 41e54 43
2Liþ þ 2e� þ 2EC/CH2 ¼ CH2[þ ðCH2OCO2LiÞ2Y (2)
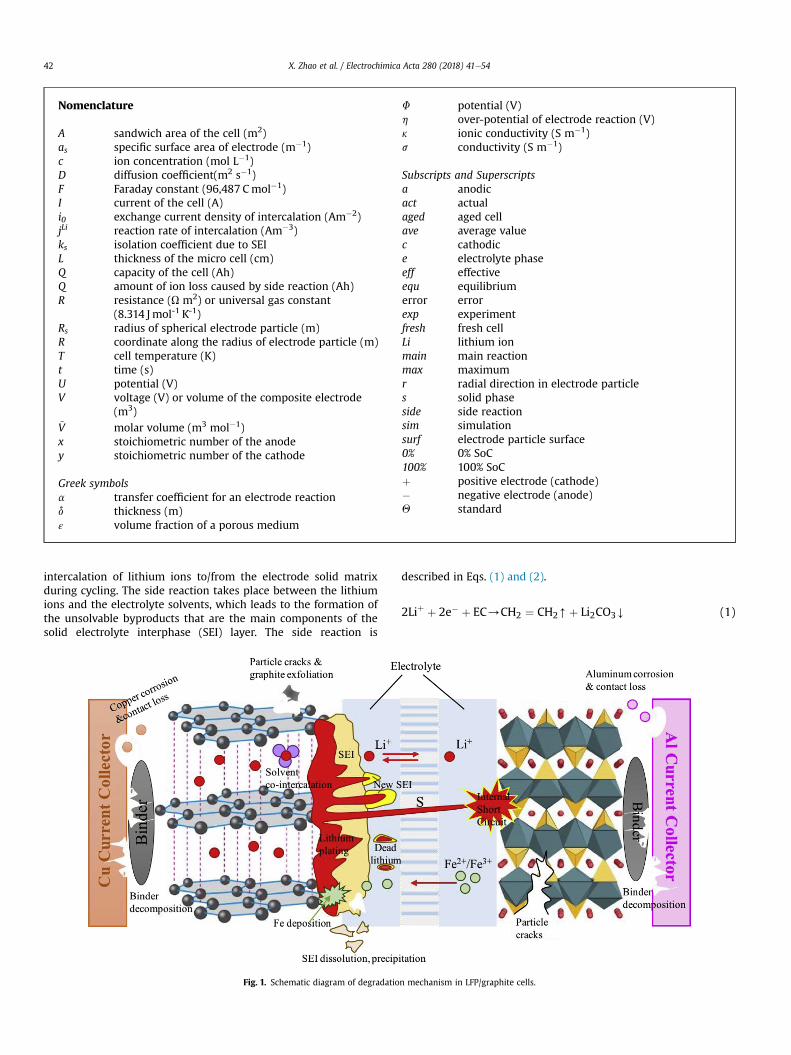
Other byproducts of the side reaction, such as LiOH, Li2O, andROLi etc., are neglected as minor components. The major compo-sitions of the SEI after the reduction of ethylene carbonate (EC)based electrolyte are lithium carbonate (Li2CO3) and lithiumethylene dicarbonate (CH2OCO2Li)2). The SEI is prone to form atinitial cycles, especially in charging protocol, which is used toprotect the electrode from possible corrosion and prevent elec-trolyte from being decomposed. The SEI is permeable to lithiumions and electrolyte solvents, but impermeable to electrons, whichcan be treated as a natural barrier of the main reaction on thecovered surface of anode. The schematic diagram of SEI formationat anode is shown in Fig. 2. The new SEI is formed at the interfacebetween the pre-formed SEI and graphite particles. In addition, theSEI grows over time, clogs pores and isolates graphite particles thatcause a decrease of the accessible area for lithium ions to partici-pate in the reduction reactions, which provokes loss of active anodematerial. When the graphite particle is fully covered by the SEI, theisolation of electrons makes it impossible to participate in thechemical reaction anymore, which is treated as one source of theloss of recyclable lithium ions. The continuous consumption oflithium ions is the other source of loss of ions, which could result incapacity fade during prolonged cycles.
Previous study shows that the byproducts of side reaction arenot only accumulated on the surface of graphite particles, but alsoon the interface between the composite anode and separator,which is defined as the deposit layer (DL) [31]. As the increasingthickness of the SEI and DL, the ionic conductivity decreases, whichcauses power fade. The continuous electrolyte decomposition andits attribute to side reaction leads to the impedance rise of elec-trolyte, which induces power fade as well. Thereby, loss of recy-clable lithium ions and loss of active material (AM) of graphiteelectrode mainly result in capacity fade, while the impedance riseinduced from the growth of SEI and DL and electrolyte decompo-sition are the main causes for power fade.
To degradation effects of LFP cathode, researchers [32e34] haveidentified iron deposition on the surface of graphite electrode byvarious characterization techniques, such as transmission electronmicroscopy (TEM) and Raman spectroscopy. It was also proposedthat the iron dissolution from LFP electrode surface was caused bythe chemical reaction between acidic species in the electrolyte andFe3þ impurities [35]. In a failure case, the deposited irons on thesurface of graphite electrode could grow as dendrites to cause in-ternal short circuit. However, Liu et al. [36] revealed that the irondissolution from LFP electrode was only a minor effect of degra-dation compared with those taking place on anode.
The various causes, impact factors and inter-dependencies ofdegradation mechanism make it extremely challenging to describethe degradation effects of LiBs mathematically. The models topredict the degradation phenomena can be divided into twogroups, empirical/semi-empirical models [17,37e40] and physics-based electrochemical thermal models [41,42]. The models in the
Fig. 2. Schematic diagram of
first group were developed by fitting the experimental data toobtain the empirical equations or extract degradation parametersto predict the capacity fade or impedance rise for both calendar lifeand cycle life. Even though it has the strengths of high accuracy, it isstill limited by its high dependence on experimental data andempirical coefficients. In addition, the accuracy cannot be main-tained if operating conditions are out of the experimental ranges.Conversely, the physics-based degradation models consider theside reactionwhose ratewas quantified by the reformulated Butler-Volmer (BV) equation based on the concept provided by Newman[43]. Considering the phase change phenomenon of LFP based cells,M. Safari and C. Delacourt [44,45] proposed a FOM incorporatingside reaction based on the resistive-reactant perspective. Thephysical boundary between two phases was replaced by theconcentration-dependent diffusion coefficients. P. Gambhire et al.[41] developed a ROM by volume averaging methods withconcentration-dependent diffusivities and then incorporated SEIformation by side reaction. No capacity or power fade could beestimated in the abovementioned model.
In this paper, a physics-based ROM considering degradationeffects were developed to estimate both beginning-of-life (BoL) andend-of-life (EoL) behaviors in real time. The integrated model wasvalidated against experiments conducted by large-format pouch-type LFP/graphite cells. Due to the existence of the voltage plateaucaused by two-phase transition on LFP electrode, the accuracy ofSoC estimation was enhanced by incorporating a hybrid methodcombing both Extended Kalman Filter (EKF) and Coulomb counting.The degradation effects of side reaction, including ion loss, AM loss,SEI and DL growth, and electrolyte decomposition, were estimated.The capacity loss and power fade as a function of cycling time werealso estimated by the model. The details of tests, including singlecycles, multiple cycles for BoL and cycling tests for EoL are sum-marized in Section 2. The principles and equations of the electro-chemical models are discussed in Section 3. Section 4 introducesthe results of model validation against both fresh and cycled LFP/graphite cells. Section 5 is the conclusion.
2. Experiments
Cells used for experiments are the large-format pouch-typeLiFePO4/graphite cells provided by Top Battery, whose specifica-tions are shown in Table 1. The LiBs are tested in a thermal chamberwith three K-type thermocouples adhesive to the cell surface tomeasure temperatures. A programmable power supply and an
SEI formation at anode.
X. Zhao et al. / Electrochimica Acta 280 (2018) 41e5444
electric-load are connected to supply the programmed charge/discharge current profiles. Impedance spectra are measured byelectrochemical impedance spectroscopy (EIS) equipment, GAMRY,and the parameters are extracted by fitting the equivalent circuitmodel (ECM).
The experiments of fresh cells include measurement of theopen-circuit voltage (OCV), application of the charge/dischargeprofiles in the single cycles and multiple cycles. The OCV ismeasured at the ambient temperature of 25 �C using a very smallcurrent of 0.05C-rate (1A) in order to allow the terminal voltage andOCV to be equal in the maximum likelihood. The charge/dischargeprotocols in the single and multiple cycles are as follows: 1) Pre-tests: 5 initial cycles at constant current (CC) of 1C-rate (20A)with 30min' rest between each consecutive charge/discharge cy-cle; 2) Single-cycle tests: ① Charge the cell using CC until end-of-charge (EoC) voltage (3.6 V); ② Rest for 30min; ③ Discharge thecell using CC until end-of-discharge (EoD) voltage (2 V). The CCapplied at charging and discharging varies among 1C-rate, 2C-rateand 4C-rate at different ambient temperatures (25/40/55 �C,respectively). 3) Multiple-cycle tests: Discharge the cell to 2 V andthen charge it to 3.6 V continuously without resting using CC at 1/2/4C-rate; 4) Post-tests: EIS and capacity measurements.
The test matrix of accelerated cycling tests is shown in Table 2.At every 30 or 60 cycles, the capacity and impedance are measuredat 25 �C in the following steps. Capacity measurement: 1) Chargethe cell using CC protocol (CC: 1C-rate) to 3.6 V; 2) Rest for 30min;3) Discharge the cell with 1C-rate CC to 2 V. EIS measurement: 1)Charge the cell to 50% SoC by 1C-rate CC; 2) Rest for 3 h; 3) ConductEIS test at the frequency from 10mHz to 1 kHz.
3. Model development
3.1. ROM
The single LFP/graphite cell is composed of multiple sandwich-structured microcells with three basic layers, composite anode,separator and composite cathode. The composite electrode ismainly fabricated by electrode particles, electrolyte and binder.When the cells are discharged, reduction and oxidation reactionstake place at the anode and cathode, respectively. The lithium ionsde-intercalated from the anode particles transport through theelectrolyte to the cathodewhile the electrons transport through theexternal circuit. Likewise, the reverse reaction takes place atcharging. The electrochemical behaviors, including intercalation/de-intercalation of lithium ions to/from the electrode, kinetics ofchemical reaction taking place at the interface between electrodeand electrolyte, ion transportation and diffusion through electrodeparticles and electrolyte, are described by the coupled partial dif-ferential equations (PDEs) which are solved by the finite differencemethod (FDM) in the FOM.
The mass transfer and charge conservation are governed byFick's law and Ohm's law, respectively. The electrochemical kineticsare governed by the BV equation under consideration of both
Table 2Test matrix.
T (�C) Cha. Current Dis. Current DSoC
25e95% 5e75% 45e55%
25 4C-rate (80A) 4C-rate (80A) 1080 cycles 3500 cycles3000 cycles
40 900 cycles55 870 cycles 540 cyclesEIS test Frequency range: 10mHz to 1 kHz
anodic and cathodic reactions. Due to the time-consuming de-merits of the FOM, it is still necessary to simplify the governingequations in the FOM with decent accuracy maintained. The poly-nomial approach, state space approach and linearization areapplied to reduce the order of the equations of ion concentration ofelectrode phase, ion concentration of electrolyte phase and currentdensity, respectively. The ion behaviors of the two-phase transitionand the existence of path dependence are considered by two set ofparameters and number of layers coexisting in the LFP particles,respectively. The moving interfaces of the coexisting layersdependent upon the usage history has induced a moving boundaryproblem, or Stephen problem that describes the location of theboundary as a function of time and space, which can be solved bythe variable space grid method. The governing equations and theircorresponding boundary conditions of both FOM and ROM and theapplied reduction methods are summarized in Table 3. Thesimplified governing equations of ion concentration in the solidparticles are shown in Table 4.
3.2. ROM with EKF
ROM can be used to estimate SoC calculated from the averageion concentration in the particles. However, the accuracy of SoCestimation is limited by the errors induced by the inaccuracy of theROM, sensors and initial values of integration of the ion concen-trations, which can be further minimized by using the EKF. Theapplied current and SoC are regarded as the input and output,respectively, where the average volume ion concentration of anodeis regarded as a state and the terminal voltage is the measuringoutput. The principles of the EKF is summarized in Table 5.
When a current is applied to the battery, the difference betweenthe measured and simulated terminal voltage is calculated at eachtime step and corrected by the optimized Kalman gain. Then thecorrected error is feed-backed to update the state and the errorcovariance matrix (P). Finally, SoC is calculated using the averageion concentration of anode by Eq. (19). The process is carried outrecursively and repetitively. The formulations of the EKF using ROMis shown in Table 6.
Since the SoC-OCV curve of LFP cells has a relatively flat regiondue to the characteristics of two-phase transition, the terminalvoltage error is very small andmight cause the EKF to stop updatingand the Kalman gain to be zero, which is inevitable regardless ofany controls. Therefore, a hybrid method of combining EKF andcoulomb counting has been used. When the battery enters thestage of voltage plateau area, the SoC estimation algorithmswitches from the EKF to coulomb counting. A tolerance is set to bethe criteria of determining the SoC estimation mode. When theerror of terminal voltage between the measured and estimatedstate is less than the tolerance, the algorithm used to do SoC esti-mation is coulomb counting and vice versa.
3.3. Physics-based degradation model
3.3.1. Model principlesIn order to develop a physics-based degradation model, several
assumptions have been made:
1. The byproducts of side reaction are only the mixture of Li2CO3
and (CH2OCO2Li)2 based on Eq. (1) and Eq. (2).2. The reduction reaction rate of side reaction is much higher than
the oxidation reaction rate, which implies that the side reactionis an irreversible process.
3. Degradation effects on cathode, such as iron dissolution, areneglected.
4. No overcharge or undercharge process is considered.
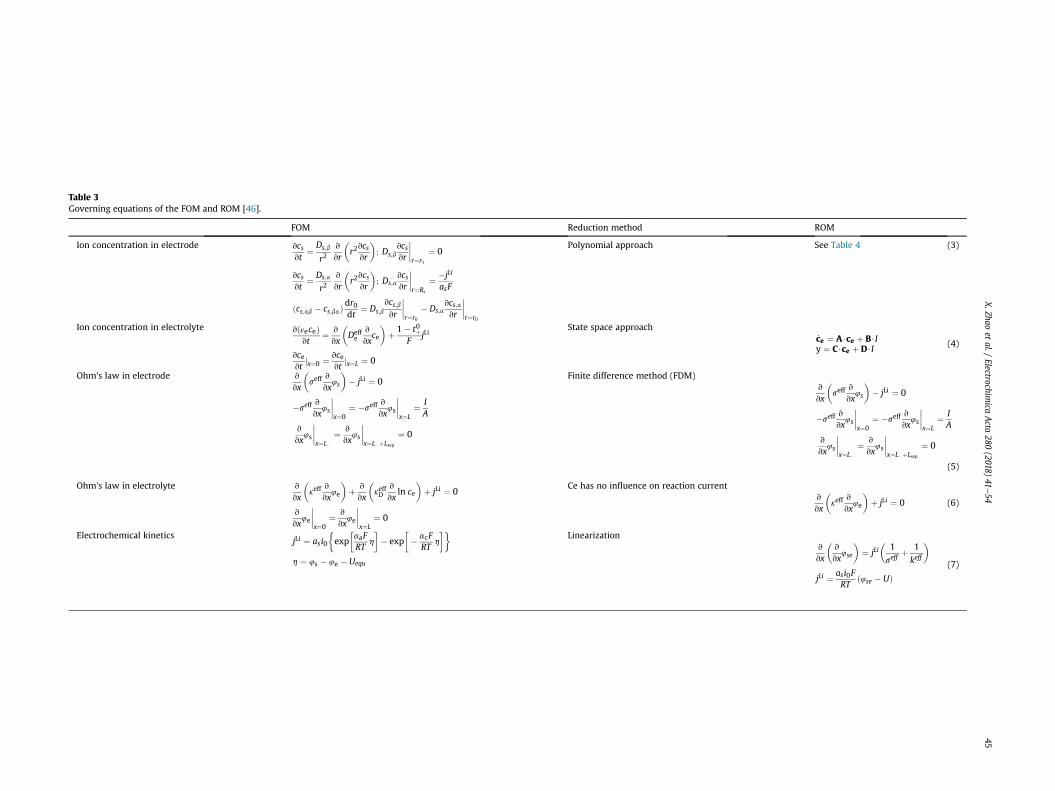
Table 3Governing equations of the FOM and ROM [46].
FOM Reduction method ROM
Ion concentration in electrode vcsvt
¼ Ds;b
r2v
vr
�r2vcsvr
�; Ds;b
vcsvr
����r¼r1
¼ 0
vcsvt
¼ Ds;a
r2v
vr
�r2vcsvr
�; Ds;a
vcsvr
����r¼Rs
¼ �jLi
asF
ðcs;ab � cs;baÞdr0dt
¼ Ds;bvcs;bvr
����r¼r0
� Ds;avcs;avr
����r¼r0
Polynomial approach See Table 4 (3)
Ion concentration in electrolyte vðεeceÞvt
¼ v
vx
�Deffe
v
vxce
�þ 1� t0þ
FjLi
vcevt
jx¼0 ¼ vcevt
jx¼L ¼ 0
State space approach_ce ¼ A$ce þ B$Iy ¼ C$ce þ D$I
(4)
Ohm's law in electrode v
vx
�seff
v
vx4s
�� jLi ¼ 0
�seffv
vx4s
����x¼0
¼ �seffv
vx4s
����x¼L
¼ IA
v
vx4s
����x¼L�
¼ v
vx4s
����x¼L�þLsep
¼ 0
Finite difference method (FDM)v
vx
�seff
v
vx4s
�� jLi ¼ 0
�seffv
vx4s
����x¼0
¼ �seffv
vx4s
����x¼L
¼ IA
v
vx4s
����x¼L�
¼ v
vx4s
����x¼L�þLsep
¼ 0
(5)
Ohm's law in electrolyte v
vx
�keff
v
vx4e
�þ v
vx
�keffD
v
vxln ce
�þ jLi ¼ 0
v
vx4e
����x¼0
¼ v
vx4e
����x¼L
¼ 0
Ce has no influence on reaction currentv
vx
�keff
v
vx4e
�þ jLi ¼ 0 (6)
Electrochemical kineticsjLi ¼ asi0
�exp
�aaFRT
h
�� exp
�� acF
RTh
��h ¼ 4s � 4e � Uequ
Linearizationv
vx
�v
vx4se
�¼ jLi
�1
seffþ 1
keff
�jLi ¼ asi0F
RTð4se � UÞ
(7)
X.Zhao
etal./
Electrochimica
Acta
280(2018)
41e54
45

Table 5Principles of EKF.
Prediction (Time update) State prediction: bx�k ¼ f ðbxk�1;uk�1Þ (13)
Error covariance prediction: P�k ¼ AkPk�1ATk þ WkQk�1W
Tk
Correction (Measurement update) Kalman gain: Kk ¼ P�k HTk ðHkP
�k H
Tk þ VkPk�1V
Tk Þ
�1(14)
State correction: bxk ¼ bx�k þ Kkðzk � hðbx�k ÞÞError covariance correction: Pk ¼ ð1� KkHkÞP�k
Note
A ¼ vfvx
����xk�1
;W ¼ vfvw
����wk�1
H ¼ vhvx
����xk;V ¼ vh
vw
����wk
(15)
Table 6Formulations of EKF using ROM.
State andmeasurement
x ¼�c�s;ave
�y ¼ ½Vt �
(16)
System
c�s;avek ¼ c�s;ave
k�1 � 3jL1IRsasFAL�
Vt ¼ UþðyÞ � U�ðxÞ � h
(17)
JacobiansA ¼ I
H ¼ vVt
vc�s;ave¼ vUþ
OCVvy
vy
vcþs;ave
vcþs;avevc�s;ave
� vU�OCVvx
vxvc�s;ave
(18)
SoC estimation
SoC ¼24 1L�
ZL�0
cs;ave� � cs;max$x0
cs;max$ðx100 � x0Þ
$dx
35$100% (19)
Table 4Simplified governing equations of the ion concentration of solid phase.
ROM equations
cs,surf �cs;surf � cs;ba
�ðk2 � 2k1ðrs � r0ÞÞ �
�cs;ave � cs;ba
�ð2k3ðrs � r0Þ � k4Þ
k2k3 � k1k4¼ �jLi
asF(8)
cs,ave of outer layer
ckþ1s;ave0
43p
�r3s �
�rkþ10
�3�� cks;ave043p
�r3s �
�rk0�3�
þckþ1s;ave1
43p�rkþ10
�3 � cks;ave143p�rkþ10
�3 ¼ �jLi
asF4pr2s
(9)
Interface �cs;ba � cs;ab
�dr0dt
¼ �Ds;b
�cs;surf � cs;ba
�k2 �
�cs;ave � cs;ba
�k4
k2k3 � k1k4
þDs
r0
�35�cs;surf � cs;ave
�� 8qaver0
� (10)
cs,ave of inner layerddtcs;ave � 3
Ds
r20
�35�cs;surf � cs;ave
�� 8qaver0
�¼ 0 (11)
qave of inner layerddtqave þ 1
2Ds
r30ð60qaver0 � 45Þ
�35�cs;surf � cs;ave
�� 8qaver0
�¼ 0 (12)
Notesk1 ¼ 3
4
r4s � r40r3s � r30
!� r0, k2 ¼ 3
5
r5s � r50r3s � r30
!� 3
2r0
r4s � r40r3s � r30
!, k3 ¼ rs � r0, k4 ¼ ðrs � r0Þ2
X. Zhao et al. / Electrochimica Acta 280 (2018) 41e5446
5. No mechanical failure, such as graphite exfoliation, electrodevolume change and particle cracks, is considered.
In the former developed ROM with EKF, the BV equation of Eq.(7) only describes the kinetics of main reaction. Considering sidereaction, the BV equation is reformulated to describe the total re-action rate which is the sum of the reaction rate of the main andside reaction. Based on the assumptions above, the side reactionrate only considers the reduction reaction. The correspondingequations about degradation are summarized in Table 7. Comparedto the over-potential of Eq. (7), the potential drop caused by SEIformation has been added in the model.
The equilibrium potential of main reaction,Uequ, is a function ofthe stoichiometric number and ion concentration in electrolyteaccording to the Nernst equation where UQ
equ� and UQequþ are the
standard equilibrium potential of anode and cathode when ce ¼ce0, respectively. The equilibrium potential of cathode, Uequþ, isestimated by an empirical equation derived from Ref. [2]. Then theequilibrium potential of anode, Uequ�, can be calculated by thedifference between measured OCV and Uequþ. However, the stan-dard equilibrium potential of the side reaction, UQ
equ;side, is no longer

Table 7Equations for physics-based degradation model.
Main reaction Side reaction
Reaction ratejLi ¼ asi0
ðaa þ acÞ,FRT
h jLiside ¼ � i0;sideas exp�� ac;sidensideF
RThside
�Over-potential
h ¼ fs � fe � Uequ � RSEIas
jLitotal hside ¼ 4s � 4e � Uequ;side �RSEIaS
jLitotal
Equilibrium potentialUequ� ¼ UQ
equ�ðxÞþRTnF
ln�ce�ce0
�Uequþ ¼ UQ
equþðyÞþRTnF
ln�ceþce0
�Uequ;side ¼ UQ
equ;side þRT
nsideFln�cece0
�Total reaction rate jLitotal ¼ jLi þ jLisideNotes [2] UequþðyÞ ¼ 3:4323þ 0:8428 expð�80:2493y1:3198Þ þ 3:2474� 10�6 expð20:2645y3:8003Þ
� 3:2482� 10�6 expð20:2646y3:7995Þ
Fig. 3. Schematic diagram of degradation mechanism at anode of a microcell.
X. Zhao et al. / Electrochimica Acta 280 (2018) 41e54 47
a function of the stoichiometric number, but depends on the ma-terial composition of the electrolyte. Various recommendationvalues of UQ
equ;side are provided by Ref. [24], such as 2 V, 1.7 V, 0.8 Vand 0.4 V. The specific value of UQ
equ;side in this model is obtained byfitting experimental data of terminal voltage at various operatingconditions.
3.3.2. Analysis of the effects of side reactionThe degradation effects of LiBs are inextricably linked to the side
reaction. The schematic diagram of degradation mechanism isdepicted in Fig. 3. Loss of recyclable lithium ions, loss of AM, growthof SEI and DL and electrolyte decomposition pertaining to maindegradation effects are considered in the physics-based degrada-tionmodel. The yellow shade in Fig. 3 denotes the byproducts of theside reaction, which are the major components of SEI and DL. Thebyproducts located at the interface between graphite particles andelectrolyte are SEI, which partially or fully covers the particle sur-face. The DL is defined as a layer composed of the byproducts thatare prone to accumulate at the interface between the compositeanode and the separator. The particles with marker “X” representthe totally isolated electrode particles which cannot be involved inany further chemical reaction.
The degradation effects resulting from the side reaction can bediscussed from two aspects, the consumption of the reactants andthe aggregation of the products. With regard to the analysis of thereactants, the amount of consumed lithium ions in the side reactioncan be calculated by integrating the side reaction rate over time andvolume of the composite anode.
qLisideðtÞ ¼Zd�
x¼0
0B@ Ztt¼0
jLisideðx; tÞdt
1CAAdx (20)
where qLiside is the amount of consumed lithium ions with a unit ofAh. d� is the thickness of the composite anode. A denotes the cross
section area of the LiB.The consumption of the electrolyte solvent is analyzed by the
change of the volume fraction of electrolyte, given by Eq. (21).
vεevt
¼ �a~Ve
d�F
Zd�x¼0
jLisidedx (21)
where εe is the volume fraction of electrolyte solvent. ~Ve is themolar volume of the electrolyte. a is a dimensionless coefficientindicating how many moles of the electrolyte solvents are involvedin the side reactionwhen onemole of the lithium ions is consumed.
Provided that the byproducts of the side reaction are only Li2CO3and (CH2OCO2Li)2, the consumed molars of the electrolyte solventare 0.5 and 1, respectively. Under the assumption of the same re-action rate for Eq. (1) and Eq. (2), a equals to 0.75. Correspondingly,the decrease of the volume fraction of the electrolyte solvents leadsto a decrease of the effective diffusion coefficient in the electrolyte.
Deffe ¼ De$εe (22)
The increasing rate of the SEI thickness is proportional to thereaction rate of the side reaction, given in Eq. (23).
vdSEIvt
¼ �~VSEI
2asFjLiside (23)
where dSEI and ~VSEI are the thickness and molar volume of the SEIlayer, respectively.
The resistance increase of the SEI layer is given in Eq. (24).
DRSEI ¼ dSEI=kSEI (24)
where kSEI is the ion conductivity of the SEI.The growth of the SEI layer limits the accessible area of com-
posite electrode, which causes the loss of AM, described in Eq. (25).
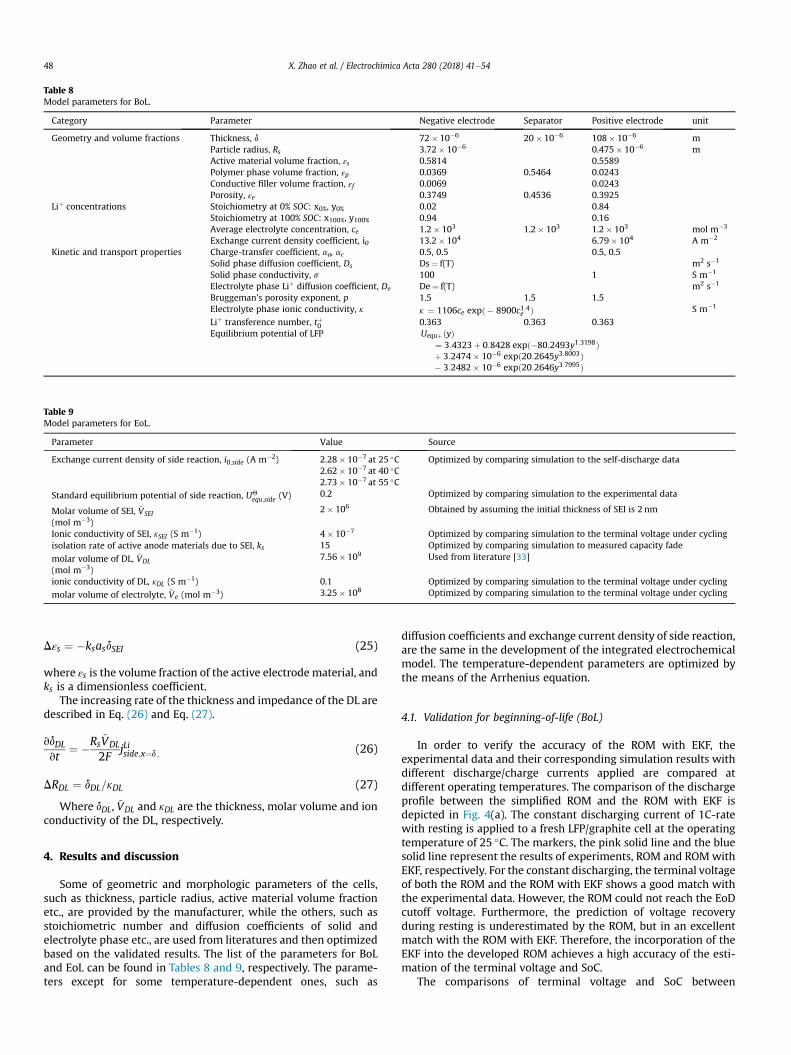
Table 8Model parameters for BoL.
Category Parameter Negative electrode Separator Positive electrode unit
Geometry and volume fractions Thickness, d 72� 10�6 20� 10�6 108� 10�6 mParticle radius, Rs 3.72� 10�6 0.475� 10�6 mActive material volume fraction, εs 0.5814 0.5589Polymer phase volume fraction, εp 0.0369 0.5464 0.0243Conductive filler volume fraction, εf 0.0069 0.0243Porosity, εe 0.3749 0.4536 0.3925
Liþ concentrations Stoichiometry at 0% SOC: x0%, y0% 0.02 0.84Stoichiometry at 100% SOC: x100%, y100% 0.94 0.16Average electrolyte concentration, ce 1.2� 103 1.2� 103 1.2� 103 mol m�3
Exchange current density coefficient, i0 13.2� 104 6.79� 104 A m�2
Kinetic and transport properties Charge-transfer coefficient, aa, ac 0.5, 0.5 0.5, 0.5Solid phase diffusion coefficient, Ds Ds¼ f(T) m2 s�1
Solid phase conductivity, s 100 1 S m�1
Electrolyte phase Liþ diffusion coefficient, De De¼ f(T) m2 s�1
Bruggeman's porosity exponent, p 1.5 1.5 1.5Electrolyte phase ionic conductivity, k k ¼ 1106ce expð� 8900c1:4e Þ S m�1
Liþ transference number, tþ0 0.363 0.363 0.363Equilibrium potential of LFP UequþðyÞ
¼ 3:4323þ 0:8428 expð�80:2493y1:3198Þþ 3:2474� 10�6 expð20:2645y3:8003Þ� 3:2482� 10�6 expð20:2646y3:7995Þ
Table 9Model parameters for EoL.
Parameter Value Source
Exchange current density of side reaction, i0;side (A m�2) 2.28� 10�7 at 25 �C2.62� 10�7 at 40 �C2.73� 10�7 at 55 �C
Optimized by comparing simulation to the self-discharge data
Standard equilibrium potential of side reaction, UQequ;side (V) 0.2 Optimized by comparing simulation to the experimental data
Molar volume of SEI, ~VSEI
(mol m�3)
2� 106 Obtained by assuming the initial thickness of SEI is 2 nm
Ionic conductivity of SEI, kSEI (S m�1) 4� 10�7 Optimized by comparing simulation to the terminal voltage under cyclingisolation rate of active anode materials due to SEI, ks 15 Optimized by comparing simulation to measured capacity fade
molar volume of DL, ~VDL
(mol m�3)
7.56� 109 Used from literature [33]
ionic conductivity of DL, kDL (S m�1) 0.1 Optimized by comparing simulation to the terminal voltage under cycling
molar volume of electrolyte, ~Ve (mol m�3) 3.25� 108 Optimized by comparing simulation to the terminal voltage under cycling
X. Zhao et al. / Electrochimica Acta 280 (2018) 41e5448
Dεs ¼ �ksasdSEI (25)
where εs is the volume fraction of the active electrode material, andks is a dimensionless coefficient.
The increasing rate of the thickness and impedance of the DL aredescribed in Eq. (26) and Eq. (27).
vdDLvt
¼ �Rs ~VDL
2FjLiside;x¼d�
(26)
DRDL ¼ dDL=kDL (27)
Where dDL, ~VDL and kDL are the thickness, molar volume and ionconductivity of the DL, respectively.
4. Results and discussion
Some of geometric and morphologic parameters of the cells,such as thickness, particle radius, active material volume fractionetc., are provided by the manufacturer, while the others, such asstoichiometric number and diffusion coefficients of solid andelectrolyte phase etc., are used from literatures and then optimizedbased on the validated results. The list of the parameters for BoLand EoL can be found in Tables 8 and 9, respectively. The parame-ters except for some temperature-dependent ones, such as
diffusion coefficients and exchange current density of side reaction,are the same in the development of the integrated electrochemicalmodel. The temperature-dependent parameters are optimized bythe means of the Arrhenius equation.
4.1. Validation for beginning-of-life (BoL)
In order to verify the accuracy of the ROM with EKF, theexperimental data and their corresponding simulation results withdifferent discharge/charge currents applied are compared atdifferent operating temperatures. The comparison of the dischargeprofile between the simplified ROM and the ROM with EKF isdepicted in Fig. 4(a). The constant discharging current of 1C-ratewith resting is applied to a fresh LFP/graphite cell at the operatingtemperature of 25 �C. The markers, the pink solid line and the bluesolid line represent the results of experiments, ROM and ROMwithEKF, respectively. For the constant discharging, the terminal voltageof both the ROM and the ROM with EKF shows a good match withthe experimental data. However, the ROM could not reach the EoDcutoff voltage. Furthermore, the prediction of voltage recoveryduring resting is underestimated by the ROM, but in an excellentmatch with the ROM with EKF. Therefore, the incorporation of theEKF into the developed ROM achieves a high accuracy of the esti-mation of the terminal voltage and SoC.
The comparisons of terminal voltage and SoC between

Fig. 4. Validation for BoL at different conditions. (a) Comparison of discharge behaviors between experimental data and simulation results of ROM with/without EKF at 25 �C; (b)Comparison of terminal voltage at 25 �C; (c) Comparison of SoC at 25 �C; (d) Voltage and SoC estimation error at 25 �C; (e) Comparison of terminal voltage and SoC at 40/55 �C; (f)Comparison of terminal voltage and SoC for multiple cycles at 25 �C.
X. Zhao et al. / Electrochimica Acta 280 (2018) 41e54 49
experimental data and simulation results of the ROM with EKF atdifferent discharge and charge currents (1/2/4C-rate) applied at25 �C are plotted in Fig. 4(b) and (c), respectively. Since constantcurrents are applied to the cells, the slope of the SoC should be aconstant. The markers and the solid lines represent the
experiments and simulations, respectively. The responses of ter-minal voltages and SoCs have a good match with experiments ofdifferent discharge and charge profiles at 25 �C. The error betweenthe experimental measurements and the estimated results ob-tained from the ROM with EKF are summarized and depicted in
X. Zhao et al. / Electrochimica Acta 280 (2018) 41e5450
Fig. 4(d). The estimated errors of terminal voltage and SoC underdifferent discharging and charging conditions arewithin 2% and 4%,respectively.
Some parameters of the ROM are highly sensitive to the tem-peratures, such as the diffusion coefficients of solid and electrolytephase. According to the analysis of parameter sensitivity, thediffusion coefficient of solid phase has affected the capacity, whilethat of the electrolyte phase has affected the over-potential. Thus,dependency of the diffusion coefficients of solid and electrolytephase on temperature are reflected using the Arrhenius equation.Different discharging currents (1/2/4C) are applied to the cells at40 �C and 55 �C. The comparison results of terminal voltage and SoCare plotted in Fig. 4(e). The upper two subplots in Fig. 4(e) are thecomparisons of terminal voltage and SoC at 40 �C from left to right,while the lower two subplots are those at 55 �C, respectively. Bothterminal voltage and SoC estimations are in a good match.
Besides the validation of the static response of the integratedROMwith EKF, such as constant discharging and constant charging,the transient response of the model is validated against multiplecycles. The upper subplot in Fig. 4(f) depicts the load current pro-files to the cells. The positive and negative sign of the current isdefined as the discharging and charging current, respectively. Themiddle subplot is the response of terminal voltage at multiple cy-cles at 25 �C. The bottom subplot is then the SoC comparison be-tween experiments and simulations at 25 �C. The makers, ‘X’, and
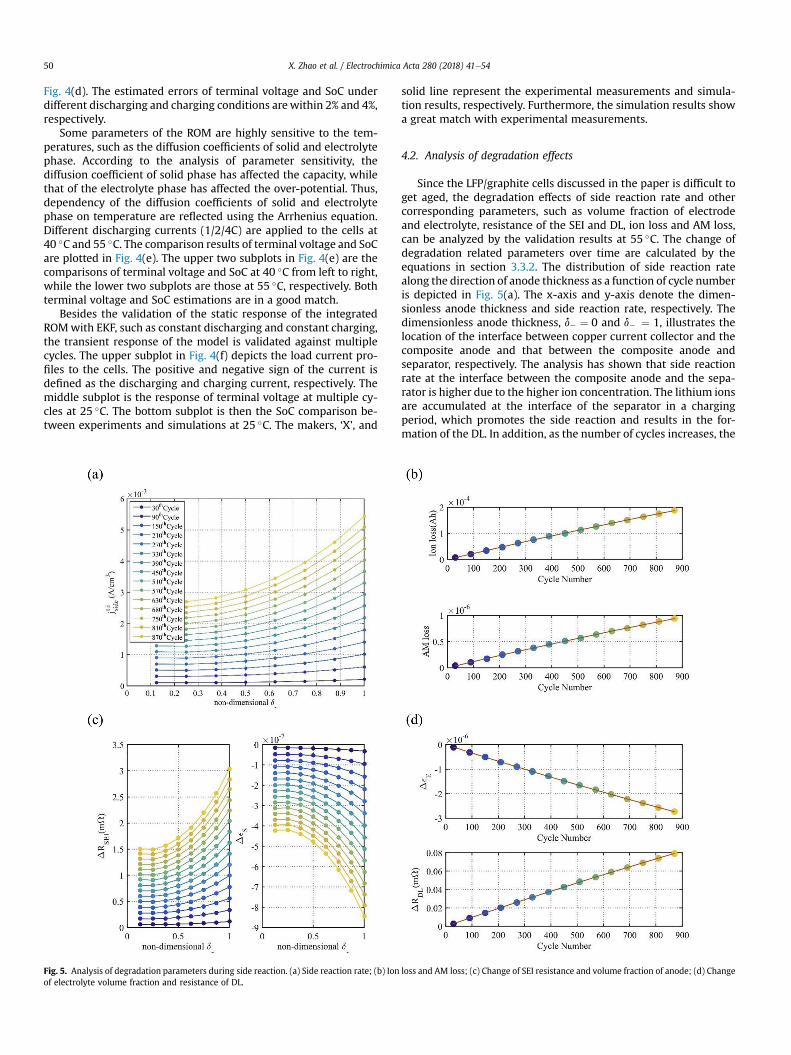
Fig. 5. Analysis of degradation parameters during side reaction. (a) Side reaction rate; (b) Ionof electrolyte volume fraction and resistance of DL.
solid line represent the experimental measurements and simula-tion results, respectively. Furthermore, the simulation results showa great match with experimental measurements.
4.2. Analysis of degradation effects
Since the LFP/graphite cells discussed in the paper is difficult toget aged, the degradation effects of side reaction rate and othercorresponding parameters, such as volume fraction of electrodeand electrolyte, resistance of the SEI and DL, ion loss and AM loss,can be analyzed by the validation results at 55 �C. The change ofdegradation related parameters over time are calculated by theequations in section 3.3.2. The distribution of side reaction ratealong the direction of anode thickness as a function of cycle numberis depicted in Fig. 5(a). The x-axis and y-axis denote the dimen-sionless anode thickness and side reaction rate, respectively. Thedimensionless anode thickness, d� ¼ 0 and d� ¼ 1, illustrates thelocation of the interface between copper current collector and thecomposite anode and that between the composite anode andseparator, respectively. The analysis has shown that side reactionrate at the interface between the composite anode and the sepa-rator is higher due to the higher ion concentration. The lithium ionsare accumulated at the interface of the separator in a chargingperiod, which promotes the side reaction and results in the for-mation of the DL. In addition, as the number of cycles increases, the
loss and AM loss; (c) Change of SEI resistance and volume fraction of anode; (d) Change
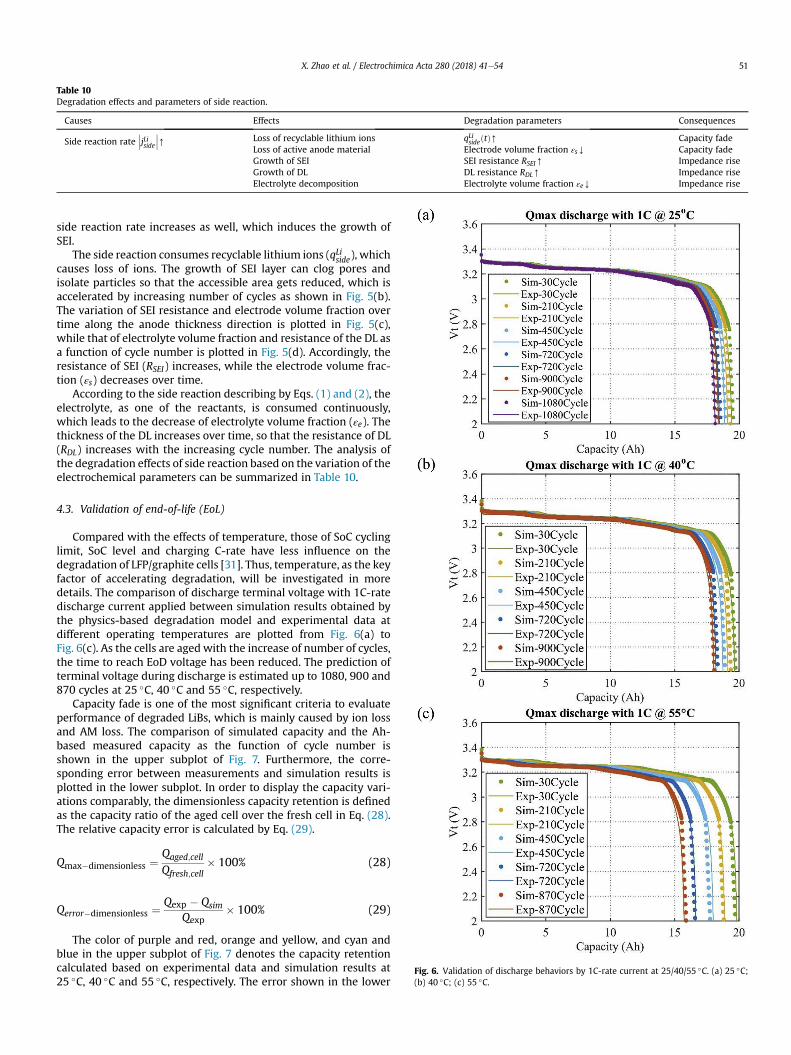
Table 10Degradation effects and parameters of side reaction.
Causes Effects Degradation parameters Consequences
Side reaction rate���jLiside���[ Loss of recyclable lithium ions qLisideðtÞ[ Capacity fade
Loss of active anode material Electrode volume fraction εsY Capacity fadeGrowth of SEI SEI resistance RSEI[ Impedance riseGrowth of DL DL resistance RDL[ Impedance riseElectrolyte decomposition Electrolyte volume fraction εeY Impedance rise
Fig. 6. Validation of discharge behaviors by 1C-rate current at 25/40/55 �C. (a) 25 �C;(b) 40 �C; (c) 55 �C.
X. Zhao et al. / Electrochimica Acta 280 (2018) 41e54 51
side reaction rate increases as well, which induces the growth ofSEI.
The side reaction consumes recyclable lithium ions (qLiside), whichcauses loss of ions. The growth of SEI layer can clog pores andisolate particles so that the accessible area gets reduced, which isaccelerated by increasing number of cycles as shown in Fig. 5(b).The variation of SEI resistance and electrode volume fraction overtime along the anode thickness direction is plotted in Fig. 5(c),while that of electrolyte volume fraction and resistance of the DL asa function of cycle number is plotted in Fig. 5(d). Accordingly, theresistance of SEI (RSEI) increases, while the electrode volume frac-tion (εs) decreases over time.
According to the side reaction describing by Eqs. (1) and (2), theelectrolyte, as one of the reactants, is consumed continuously,which leads to the decrease of electrolyte volume fraction (εe). Thethickness of the DL increases over time, so that the resistance of DL(RDL) increases with the increasing cycle number. The analysis ofthe degradation effects of side reaction based on the variation of theelectrochemical parameters can be summarized in Table 10.
4.3. Validation of end-of-life (EoL)
Compared with the effects of temperature, those of SoC cyclinglimit, SoC level and charging C-rate have less influence on thedegradation of LFP/graphite cells [31]. Thus, temperature, as the keyfactor of accelerating degradation, will be investigated in moredetails. The comparison of discharge terminal voltage with 1C-ratedischarge current applied between simulation results obtained bythe physics-based degradation model and experimental data atdifferent operating temperatures are plotted from Fig. 6(a) toFig. 6(c). As the cells are aged with the increase of number of cycles,the time to reach EoD voltage has been reduced. The prediction ofterminal voltage during discharge is estimated up to 1080, 900 and870 cycles at 25 �C, 40 �C and 55 �C, respectively.
Capacity fade is one of the most significant criteria to evaluateperformance of degraded LiBs, which is mainly caused by ion lossand AM loss. The comparison of simulated capacity and the Ah-based measured capacity as the function of cycle number isshown in the upper subplot of Fig. 7. Furthermore, the corre-sponding error between measurements and simulation results isplotted in the lower subplot. In order to display the capacity vari-ations comparably, the dimensionless capacity retention is definedas the capacity ratio of the aged cell over the fresh cell in Eq. (28).The relative capacity error is calculated by Eq. (29).
Qmax�dimensionless ¼Qaged;cell
Qfresh;cell� 100% (28)
Qerror�dimensionless ¼Qexp � Qsim
Qexp� 100% (29)
The color of purple and red, orange and yellow, and cyan andblue in the upper subplot of Fig. 7 denotes the capacity retentioncalculated based on experimental data and simulation results at25 �C, 40 �C and 55 �C, respectively. The error shown in the lower
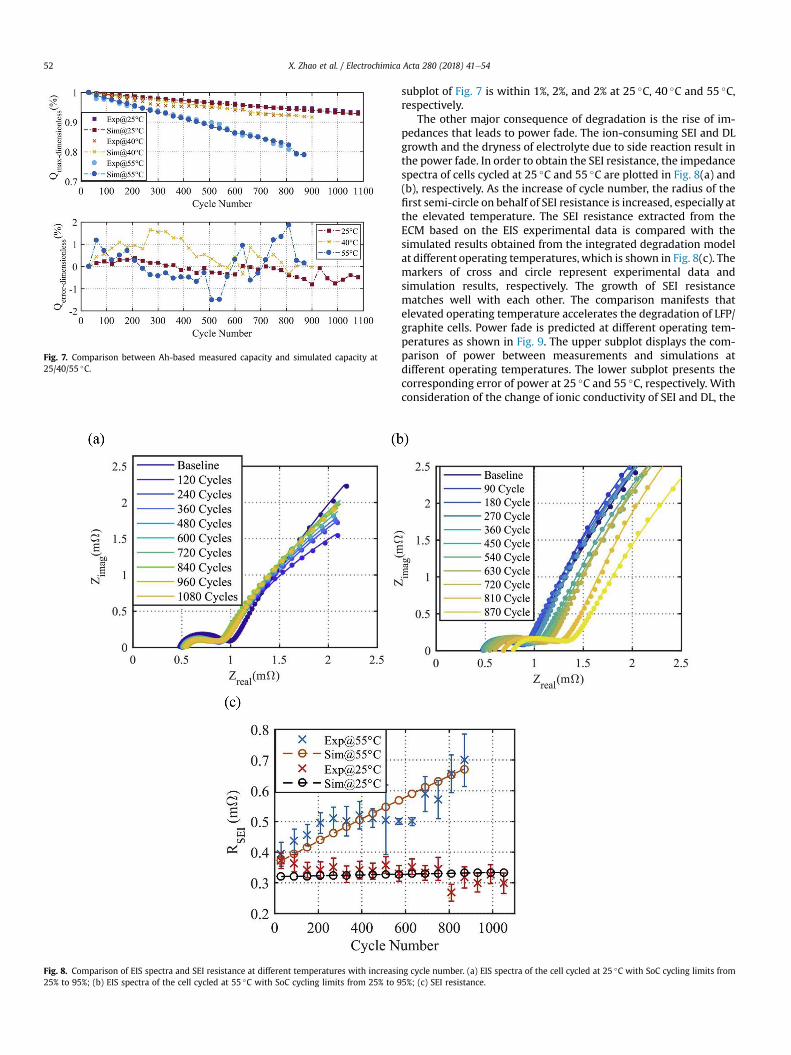
Fig. 7. Comparison between Ah-based measured capacity and simulated capacity at25/40/55 �C.
Fig. 8. Comparison of EIS spectra and SEI resistance at different temperatures with increasi25% to 95%; (b) EIS spectra of the cell cycled at 55 �C with SoC cycling limits from 25% to 9
X. Zhao et al. / Electrochimica Acta 280 (2018) 41e5452
subplot of Fig. 7 is within 1%, 2%, and 2% at 25 �C, 40 �C and 55 �C,respectively.
The other major consequence of degradation is the rise of im-pedances that leads to power fade. The ion-consuming SEI and DLgrowth and the dryness of electrolyte due to side reaction result inthe power fade. In order to obtain the SEI resistance, the impedancespectra of cells cycled at 25 �C and 55 �C are plotted in Fig. 8(a) and(b), respectively. As the increase of cycle number, the radius of thefirst semi-circle on behalf of SEI resistance is increased, especially atthe elevated temperature. The SEI resistance extracted from theECM based on the EIS experimental data is compared with thesimulated results obtained from the integrated degradation modelat different operating temperatures, which is shown in Fig. 8(c). Themarkers of cross and circle represent experimental data andsimulation results, respectively. The growth of SEI resistancematches well with each other. The comparison manifests thatelevated operating temperature accelerates the degradation of LFP/graphite cells. Power fade is predicted at different operating tem-peratures as shown in Fig. 9. The upper subplot displays the com-parison of power between measurements and simulations atdifferent operating temperatures. The lower subplot presents thecorresponding error of power at 25 �C and 55 �C, respectively. Withconsideration of the change of ionic conductivity of SEI and DL, the
ng cycle number. (a) EIS spectra of the cell cycled at 25 �C with SoC cycling limits from5%; (c) SEI resistance.

Fig. 9. Comparison power fade at different temperatures with increasing cyclenumber.
X. Zhao et al. / Electrochimica Acta 280 (2018) 41e54 53
power decreases as the increase of cycle number. The overall errorof power estimation is within 3%.
5. Conclusion
An integrated ROM that includes EKF for enhancing estimationaccuracy of terminal voltage and SoC for BoL as well as a life modelthat facilitates capacity and power fade for EoL is developed. Themodel is validated against both fresh and cycled pouch-type large-format LFP/graphite cells, whose nominal capacity is 20Ah. Theunique characteristics of ion behaviors in the cathode particlesincluding two-phase transition and path dependence are describedusing a shrinking core model. The EKF is incorporated into thedeveloped ROM to achieve a higher accuracy of terminal voltageand SoC estimation. With different discharging and charging pro-files applied to the cells, including both single cycles and multiplecycles, the electrochemical behaviors of the cells are explored atdifferent working temperatures. The temperature dependent pa-rameters, such as diffusion coefficients of solid and electrolytephase, are formulated using the Arrhenius equation. The averageerror of terminal voltage and SoC estimation is within 2% and 4%,respectively.
According to the experimental studies on degradation mecha-nism, the side reaction has been identified as the predominantcause for both calendar and cycle life, which is accelerated by theelevated operating temperatures, high SoC levels and large SoCcycling limits. These phenomena are formulated by modifying BVequation that is incorporated into the ROM with EKF. The capacityfade is caused by loss of recyclable lithium ions and loss of AM,while the power fade is the growth of SEI and DL and electrolytedecomposition. The ROM with EKF and life model is validated bythe accelerated cycling tests conducted at various operating con-ditions, includingworking temperatures, SoC cycling limits and SoClevels, which match well with experimental data with respect toterminal voltage, capacity fade and power fade. The estimationerror of capacity and power as the function of cycle number atdifferent temperatures have been remained within 2% and 3%,respectively.
Future work will include the development of a subzero tem-perature electrochemical model that considers the effects oflithium plating/stripping at different working conditions.
Acknowledgement
The authors gratefully acknowledge the financial and technicalsupport from Korea Electric Power Corporation and specially wouldalso like to express our thanks to Top Battery for providing the LFP/graphite cells.
References
[1] A.K. Padhi, K.S. Nanjundaswamy, J.B. Goodenough, Phospho-olivines aspositive-electrode materials for rechargeable lithium batteries, J. Electrochem.Soc. 144 (1997) 1188e1194, https://doi.org/10.1684/agr.2014.0700.
[2] M. Safari, C. Delacourt, Modeling of a commercial graphite/LiFePO4 cell,J. Electrochem. Soc. 158 (2011) A562eA571, https://doi.org/10.1149/1.3567007.
[3] V. Srinivasan, J. Newman, Discharge Model for the lithium iron-phosphateelectrode, J. Electrochem. Soc. 151 (2004) A1517eA1529, https://doi.org/10.1149/1.1785012.
[4] C. Wang, U.S. Kasavajjula, P.E. Arce, A discharge model for phase trans-formation electrodes: formulation, experimental validation, and analysis,J. Phys. Chem. C 111 (2007) 16656e16663, https://doi.org/10.1021/jp074490u.
[5] U.S. Kasavajjula, C. Wang, P.E. Arce, Discharge Model for LiFePO4 accountingfor the solid solution range, J. Electrochem. Soc. 155 (2008) A866eA874,https://doi.org/10.1149/1.2980420.
[6] A. Khandelwal, K.S. Hariharan, V. Senthil Kumar, P. Gambhire, S.M. Kolake,D. Oh, S. Doo, Generalized moving boundary model for charge-discharge ofLiFePO4/C cells, J. Power Sources 248 (2014) 101e114, https://doi.org/10.1016/j.jpowsour.2013.09.066.
[7] M. Safari, C. Delacourt, Mathematical modeling of lithium iron phosphateelectrode: galvanostatic charge/discharge and path dependence,J. Electrochem. Soc. 158 (2011) A63eA73, https://doi.org/10.1149/1.3515902.
[8] T.-S. Dao, C.P. Vyasarayani, J. McPhee, Simplification and order reduction oflithium-ion battery model based on porous-electrode theory, J. Power Sources198 (2012) 329e337, https://doi.org/10.1016/j.jpowsour.2011.09.034.
[9] N. Baba, H. Yoshida, M. Nagaoka, C. Okuda, S. Kawauchi, Numerical simulationof thermal behavior of lithium-ion secondary batteries using the enhancedsingle particle model, J. Power Sources. 252 (2014) 214e228, https://doi.org/10.1016/j.jpowsour.2013.11.111.
[10] K.A. Smith, C.D. Rahn, C.-Y. Wang, Model order reduction of 1D diffusionsystems via residue grouping, J. Dyn. Syst. Meas. Contr. 130 (2008), https://doi.org/10.1115/1.2807068, 11012-1-11012e8.
[11] V.R. Subramanian, V. Boovaragavan, V. Ramadesigan, M. Arabandi, Mathe-matical model reformulation for lithium-ion battery simulations: galvano-static boundary conditions, J. Electrochem. Soc. 156 (2009) A260eA271,https://doi.org/10.1149/1.3065083.
[12] L. Cai, R.E. White, Reduction of model order based on proper orthogonaldecomposition for lithium-ion battery simulations, J. Electrochem. Soc. 156(2009) A154eA161, https://doi.org/10.1149/1.3049347.
[13] V.S. Kumar, Reduced order model for a lithium ion cell with uniform reactionrate approximation, J. Power Sources 222 (2013) 426e441, https://doi.org/10.1016/jjpowsour.2012.09.013.
[14] M. Kassem, J. Bernard, R. Revel, S. P�elissier, F. Duclaud, C. Delacourt, Calendaraging of a graphite/LiFePO4 cell, J. Power Sources 208 (2012) 296e305,https://doi.org/10.1016/j.jpowsour.2012.02.068.
[15] R.P. Ramasamy, R.E. White, B.N. Popov, Calendar life performance of pouchlithium-ion cells, J. Power Sources 141 (2005) 298e306, https://doi.org/10.1016/j.jpowsour.2004.09.024.
[16] M. Dubarry, V. Svoboda, R. Hwu, B. Yann Liaw, Incremental Capacity analysisand close-to-equilibrium OCV measurements to quantify capacity fade incommercial rechargeable lithium batteries, Electrochem. Solid State Lett. 9(2006) A454eA457, https://doi.org/10.1149/1.2221767.
[17] J. Wang, P. Liu, J. Hicks-Garner, E. Sherman, S. Soukiazian, M. Verbrugge,H. Tataria, J. Musser, P. Finamore, Cycle-life model for graphite-LiFePO4 cells,J. Power Sources 196 (2011) 3942e3948, https://doi.org/10.1016/j.jpowsour.2010.11.134.
[18] H.-F. Jin, Z. Liu, Y.M. Teng, J. kui Gao, Y. Zhao, A comparison study of capacitydegradation mechanism of LiFePO4-based lithium ion cells, J. Power Sources189 (2009) 445e448, https://doi.org/10.1016/j.jpowsour.2008.12.124.
[19] J. Schmalstieg, S. K€abitz, M. Ecker, D.U. Sauer, A holistic aging model forLi(NiMnCo)O2 based 18650 lithium-ion batteries, J. Power Sources 257 (2014)325e334, https://doi.org/10.1016/j.jpowsour.2014.02.012.
[20] P. Ramadass, B. Haran, P.M. Gomadam, R.E. White, B.N. Popov, Development offirst principles capacity fade model for Li-ion cells, J. Electrochem. Soc. 151(2004) A196eA203, https://doi.org/10.1149/1.1634273.
[21] S. Santhanagopalan, Q. Zhang, K. Kumaresan, R.E. White, Parameter estima-tion and life modeling of lithium-ion cells, J. Electrochem. Soc. 155 (2008)A345eA353, https://doi.org/10.1149/1.2839630.
[22] G. Sikha, B.N. Popov, R.E. White, Effect of porosity on the capacity fade of alithium-ion battery, J. Electrochem. Soc. 151 (2004) A1104eA1114, https://doi.org/10.1149/1.1759972.
[23] H.J. Ploehn, P. Ramadass, R.E. White, Solvent diffusion model for aging of

X. Zhao et al. / Electrochimica Acta 280 (2018) 41e5454
lithium-ion battery cells, J. Electrochem. Soc. 151 (2004) A456eA462, https://doi.org/10.1149/1.1644601.
[24] Q. Zhang, R.E. White, Capacity fade analysis of a lithium ion cell, J. PowerSources 179 (2008) 793e798, https://doi.org/10.1016/j.jpowsour.2008.01.028.
[25] Y. Zhang, C.-Y. Wang, X. Tang, Cycling degradation of an automotive LiFePO4lithium-ion battery, J. Power Sources 196 (2011) 1513e1520, https://doi.org/10.1016/j.jpowsour.2010.08.070.
[26] J. Groot, M. Swierczynski, A.I. Stan, S.K. Kær, On the complex ageing charac-teristics of high-power LiFePO4/graphite battery cells cycled with high chargeand discharge currents, J. Power Sources 286 (2015) 475e487, https://doi.org/10.1016/j.jpowsour.2015.04.001.
[27] P. Verma, P. Maire, P. Nov�ak, A review of the features and analyses of the solidelectrolyte interphase in Li-ion batteries, Electrochim. Acta 55 (2010)6332e6341, https://doi.org/10.1016/j.electacta.2010.05.072.
[28] M. Safari, C. Delacourt, Aging of a commercial graphite/LiFePO4 cell,J. Electrochem. Soc. 158 (2011) A1123eA1135, https://doi.org/10.1149/1.3614529.
[29] J. Vetter, P. Nov�ak, M.R. Wagner, C. Veit, K.C. M€oller, J.O. Besenhard, M. Winter,M. Wohlfahrt-Mehrens, C. Vogler, A. Hammouche, Ageing mechanisms inlithium-ion batteries, J. Power Sources 147 (2005) 269e281, https://doi.org/10.1016/j.jpowsour.2005.01.006.
[30] A. Barr�e, B. Deguilhem, S. Grolleau, M. G�erard, F. Suard, D. Riu, A review onlithium-ion battery ageing mechanisms and estimations for automotive ap-plications, J. Power Sources 241 (2013) 680e689, https://doi.org/10.1016/j.jpowsour.2013.05.040 Review.
[31] R. Fu, S.Y. Choe, V. Agubra, J. Fergus, Development of a physics-based degra-dation model for lithium ion polymer batteries considering side reactions,J. Power Sources. 278 (2015) 506e521, https://doi.org/10.1016/j.jpowsour.2014.12.059.
[32] K. Striebel, A. Guerfi, J. Shim, M. Armand, M. Gauthier, K. Zaghib, LiFePO4/gel/natural graphite cells for the BATT program, J. Power Sources (2003) 951e954,https://doi.org/10.1016/S0378-7753(03)00295-7.
[33] K. Striebel, J. Shim, V. Srinivasan, J. Newman, Comparison of LiFePO4 fromdifferent sources, J. Electrochem. Soc. 152 (2005) A664eA670, https://doi.org/10.1149/1.1862477.
[34] K. Amine, J. Liu, I. Belharouak, High-temperature storage and cycling of C-LiFePO4/graphite Li-ion cells, Electrochem. Commun. 7 (2005) 669e673,https://doi.org/10.1016/j.elecom.2005.04.018.
[35] K. Zaghib, N. Ravet, M. Gauthier, F. Gendron, A. Mauger, J.B. Goodenough,C.M. Julien, Optimized electrochemical performance of LiFePO4 at 60�C with
purity controlled by SQUID magnetometry, J. Power Sources 163 (2006)560e566, https://doi.org/10.1016/j.jpowsour.2006.09.030.
[36] P. Liu, J. Wang, J. Hicks-Garner, E. Sherman, S. Soukiazian, M. Verbrugge,H. Tataria, J. Musser, P. Finamore, Aging mechanisms of LiFePO4 batteriesdeduced by electrochemical and structural analyses, J. Electrochem. Soc. 157(2010) A499eA507, https://doi.org/10.1149/1.3294790.
[37] H. Ekstrom, G. Lindbergh, A model for predicting capacity fade due to SEIformation in a commercial graphite/LiFePO4 cell, J. Electrochem. Soc. 162(2015) A1003eA1007, https://doi.org/10.1149/2.0641506jes.
[38] G. Ning, B. Haran, B.N. Popov, Capacity fade study of lithium-ion batteriescycled at high discharge rates 117 (2003) 160e169, https://doi.org/10.1016/S0378-7753(03)00029-6.
[39] M. Safari, M. Morcrette, A. Teyssot, C. Delacourt, Multimodal physics-basedaging model for life prediction of Li-ion batteries, J. Electrochem. Soc. 156(2009) A145eA153, https://doi.org/10.1149/1.3043429.
[40] N. Omar, M.A. Monem, Y. Firouz, J. Salminen, J. Smekens, O. Hegazy,H. Gaulous, G. Mulder, P. Van den Bossche, T. Coosemans, J. Van Mierlo,Lithium iron phosphate based battery - assessment of the aging parametersand development of cycle life model, Appl. Energy 113 (2014) 1575e1585,https://doi.org/10.1016/j.apenergy.2013.09.003.
[41] P. Gambhire, K.S. Hariharan, A. Khandelwal, S.M. Kolake, T. Yeo, S. Doo,A physics based reduced order aging model for lithium-ion cells with phasechange, J. Power Sources 270 (2014) 281e291, https://doi.org/10.1016/j.jpowsour.2014.07.127.
[42] C. Kupper, W.G. Bessler, Multi-scale thermo-electrochemical modeling ofperformance and aging of a LiFePO4/graphite lithium-ion cell, J. Electrochem.Soc. 164 (2017) A304eA320, https://doi.org/10.1149/2.0761702jes.
[43] R. Darling, J. Newmann, Modeling side reactions in composite LiyMn2O4electrodes, J. Electrochem. Soc. 145 (1998) 990e998, https://doi.org/10.1149/1.1838376.
[44] C. Delacourt, M. Safari, Life simulation of a graphite/LiFePO4 cell under cyclingand storage, J. Electrochem. Soc. 159 (2012) A1283eA1291, https://doi.org/10.1149/2.049208jes.
[45] M. Safari, C. Delacourt, Simulation-Based Analysis of aging phenomena in acommercial graphite/LiFePO4 cell, J. Electrochem. Soc. 158 (2011)A1436eA1447, https://doi.org/10.1149/2.103112jes.
[46] X. Li, M. Xiao, S.Y. Choe, W.T. Joe, Modeling and analysis of LiFePO4/carbonbattery considering two-phase transition during galvanostatic charging/dis-charging, Electrochim. Acta 155 (2015) 447e457, https://doi.org/10.1016/j.electacta.2014.12.034.