Embed Size (px)
Citation preview
Copyright @ 1979. The Institute of Management Sciences0092-2102/79/0905/0021$01 25
INTERFACESVol. 9. No.5. November 1979
AN INTEGRATED PRODUCTION, DISTRIBUTION, AI~D
INVENTORY PLANNING SYSTEM
Fred Glover
University of Colorado, Boulder, Colorado 80309
Gene Jones
Agrico Chemical Company, Tulsa, Oklahoma 74103
David Karney
The Williams Companies, Tulsa, Oklahoma 74103
Darwin Klingman
University of Texas at Austin, Austin, Texas 78712
John Mote
Analysis, Research, and Computation, Inc., Austin, Texas 78765
ABSTRACT. The critical importance of integrating production, dis-tribution, and inventory (POI) operations has long been recognized by topmanagement of many companies. Now. using the latest advances in Man-agement Science modeling and solution technology, an integratedcomputer-based POI system has saved approximately $18 million dollarsduring its first three years of implementation for a major national firm.Agrico Chemical Company. According to the Vice-President of AgricoSupply and Distribution, an additional $25 million savings is anticipatedover the next two years.
Brought about by close cooperation between company officials and anoutside staff of Management Science consultants. .the POI system has beenused extensively to evaluate the benefit/cost impact of alternative capitalinvestments in both short-term and long-term planning decisions. The de-velopment of the system underscores the value of recent Management Sci-ence innovations that have made it possible to analyze interacting influencestoo numerous and complex to be analyzed adequately only a few years ago.
Advanced network methodology incorporated into the POI system re-quired only one one-hundredth of the computer time and coSt ofmethodologies previously used. The power and flexibility of the new Man-agement Science tools have also brought about increased communicationand understanding of key company operations. This increased communica-tion and understanding stems from the inherent .'pictorial.' nature ofnetwork-based models. which facilitates interpretation of these models andpolicy recommendations based upon their solution..
IN VENTOR Y IPRODUCTION: NETWORKS/GRAPHS
INTERFACEJ N,'\'eml1er 1979 21
OverviewAgrico Chemical Company, with annual sales exceeding half a billion dollars, is
one of the nation's largest chemical fertilizer companies. A subsidiary of The
Williams Companies, Agrico mines, manufactures, and markets eight principalchemical products domestically and internationally. The company's success story,based on aggressive and forward-looking management, is typical of others in which arelatively small firm has been transformed into a leader in its field in less than a
decade.In the mid-1970's Agrico encountered unexpected difficulties. The seasonal
demand characteristic of the chemical fertilizer industry was creating a chain ofintricate and far reaching effects that could not be responded to adequately. As a
result, the company's profit margins were being seriously eroded by steeply escalat-ing distribution costs. It became apparent that a multitude of interdependent factorsmade it impossible to find a remedy through customary methods, such as studyingcost figures and charts. The web of interacting ihfluencf:s which spanned the com-pany's principal activities -production, distribution, and inventory -required an
integrated computer-based planning system to uncover the appropriate decisions.In 1976, David Wilson, Vice-President of Agrico Supply and Distribution, in
coordination with Herb Beattie, Vice-President of The Williams Companies Informa-tion Services, created a project team to develop such a planning system. The princi-
pal objective of this team, headed by the authors, was to develop a computer-basedproduction, distribution, and inventory (PDI) planning system which integrated the
three major segments of Agrico's business decisions:(1) the Supply Segment, consisting of production, purchases, and product ex-
changes with other chemical corporations (coproducers);(2) the Storage and Customer Distribution Segment, involving sizing and locat-
ing bulk distribution centers; and(3) the Demand Segment, involving customer demand throughout the eastern
two-thirds of the United States, and locations where the product must be supplied to
coproducers due to product exchange agreements.The project team designed and implemented a POI system utilizing recent ad-
vances in network modeling and solution technology [I], [2], [5-10], [12], [14-16]. The system was given the capability to provide planners with insight into thesystem-wide ramifications of their decisions. It~ integrated framework allows the
system to consider the relevant environmental impacts of all decisions simultane-
ously, thereby equipping it to provide analyses for long.. and short-range planning
and operational decisions.
Long-range planning summaryIn long-range planning, the system is used primarily for decisions associated
with the sizing and configuration of the distribution system. This helps to answer
such questions as:-Where should distribution centers be located and what should be their size?
-How much long-term inventory investment should be made?
INTERFACES November 197922

-How much transportation equipment is needed?-What supply/purchase/exchange opportunities should be exploited?
In the short time that the integrated network POI planning system has been inuse at Agrico. it has already proven to be an extremely valuable decision aid forlong-range planning and its effect in cutting the steeply rising distribution costs hasbeen dramatic. Further. the system has uncovered several entirely unanticipatedareas of cost savings. primarily through the evaluation of capital investment deci-
sions.One of Agrico's long-range studies, using this system, showed that by locating a
distribution center on the upper Ohio River, $100,000 could be saved on transporta-tion costs. Another study revealed that it was worth $175,000 to obtain the earlycompletion of a new distribution center. The PDI planning system was also used toevaluate the long-range impact of changing the distribution pattern of a particular
nitrogen chemical solution plant. Prior to the analysis using the PDI system, Agricomanagement had planned to build an additional 100,000 square foot storage facilityto accommodate the forecasted growth in demand over a five-year period. The PDI
planning system revealed that the additional storage facility was not cost effective.By not expanding the storage capacity Agrico realized a capital savings of $800,000.In addition, the distribution plan suggested by the POI system reduced the annualtransportation costs for the plant by $12,000.
Other long-range planning studies, using the PDI system, have been carried out
by Agrico management, but the financial impact of the resulting decisions is moredifficult to quantify. One such decision involved the closing of three small distribu-tion centers in the midwest. The resulting capital was reinvested in rolling transporta-tion equipment. In light of the current freight car shortage and energy cost increases,it is virtually impossible to accurately gauge the long-range affect of this decision.
The total quantifiable impact of Agrico's long-range planning studies using thePDI system is a cost savings in excess of $1 million. However, the most substantial
results have come from the usage of the PDI system for short-range planning and
operati()nal decisions.
Short-range planning summaryFor short-range operational decisions, Agrico uses the integrated network-based
PDI system to aid in answering questions dealing with the allocation of a definedsupply of product through a specific distribution center configuration. For suchdecisions, the system is used to avoid unnecessary production, distribution, andinventory costs by providing the capability to evaluate alternatives on a systemwidebasis. To illustrate, the model is used to decide what, where, and how much productshould be produced as well as when, where, and how much product should be
shipped.Since 1976, Agrico has used the POI planning system for operational decisions
to supply its products to customers at the right time and at the least possible costconsistent with good customer service. During its first year of implementation, thePOI planning system enabled management to reduce Agrico's total distribution costsby $3.7 million. But this is not the bottom line.
23INTERFACES November 1979
During the first year, Agrico was unable to adopt completely the decisionalternatives suggested by the POI planning system. This partial implementation wasanticipated, and is natural, since the task of rescheduling production and distribution
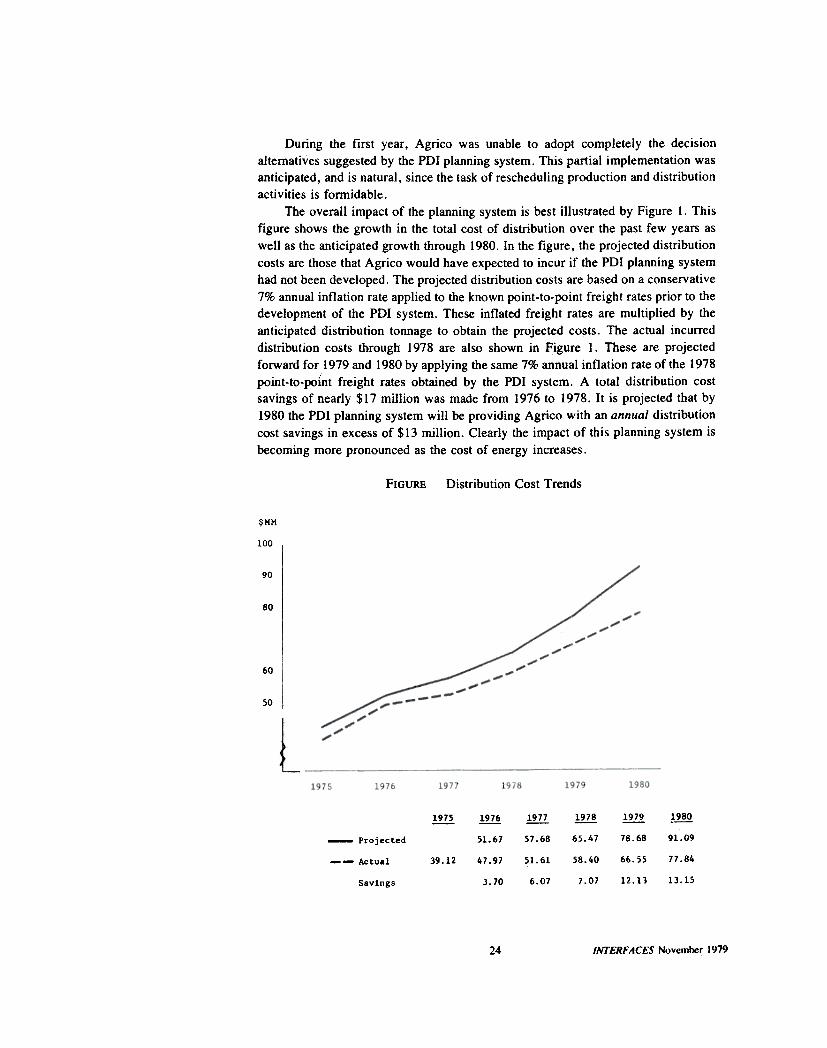
activities is formidable.The overall impact of the planning system is best illustrated by Figure 1. This
figure shows the growth in the total cost of distribution over the past few years aswell as the anticipated growth through 1980. In the figure, the projected distributioncosts are those that Agrico would have expected to incur if the POI planning systemhad not been developed. The projected distribution costs are based on a conservative7% annual inflation rate applied to the known point-to-point freight rates prior to thedevelopment of the POI system. These inflated freight rates are multiplied by theanticipated distribution tonnage to obtain the projected costs. The actual incurreddistribution costs through ..978 are also shown in Figure I. These are projectedforward for 1979 and 1980 by applying the same 7% annual inflation rate of the 1978point-to-point freight rates obtained by the POI system. A total distribution costsavings of nearly $17 million was made from 1976 to 1978. It is projected that by1980 the POI planning system will be providing Agrico with an annual distributioncost savings in excess of $13 million. Clearly the impact of this planning system is
becoming more pronounced as the cost of energy increases.
FIGURE Distribution Cost Trends
$HH
100
90
80
60
50
~91.09
77.84
13.15
~51.67
47.97
3.70
!!?:IS7.68
Sl.61
6.07
!.?l!65.47
58.40
7.07
~78.68
66.55
1975
-Projected
--Actual
Savings
39.12
12.11
INTERFACES November 197924
Agrico's commitment to use the POI planning system necessitated the develop-
ment of an on-line automated freight rate system. Although initially designed simplyto provide input data to the POI system, the automated freight rate system hasradically altered the way Agrico rates its orders from customers. The use of thefreight rate system has reduced the average billing time by approximately one day. In1978 alone, the corresponding reduction of accounts receivable produced a working
capital interest savings of $50,000.The system has also enabled Agrico to reduce the number of stockouts suffered
by its clients by more effectively prepositioning its products in the marketplace. As aresult, Agrico was able to sell nearly 50,000 more tons of product during 1978 thananticipated. This increased sales volume resulted in an additional $850,000 of work-
ing capital.Another outcome of the usage of the POI system for short-range planning is
improved coordination and information flow between key departments. Although it
is hard to quantify the impact of this improved departmental communication, in the
long run this is potentially as important as the more quantifiable cost reductions.The fundamental features of Agrico's integrated network computer-based POI
planning system and additional benefits from using this system are detailed in the
following sections.
Agrico studyBackground of company operations
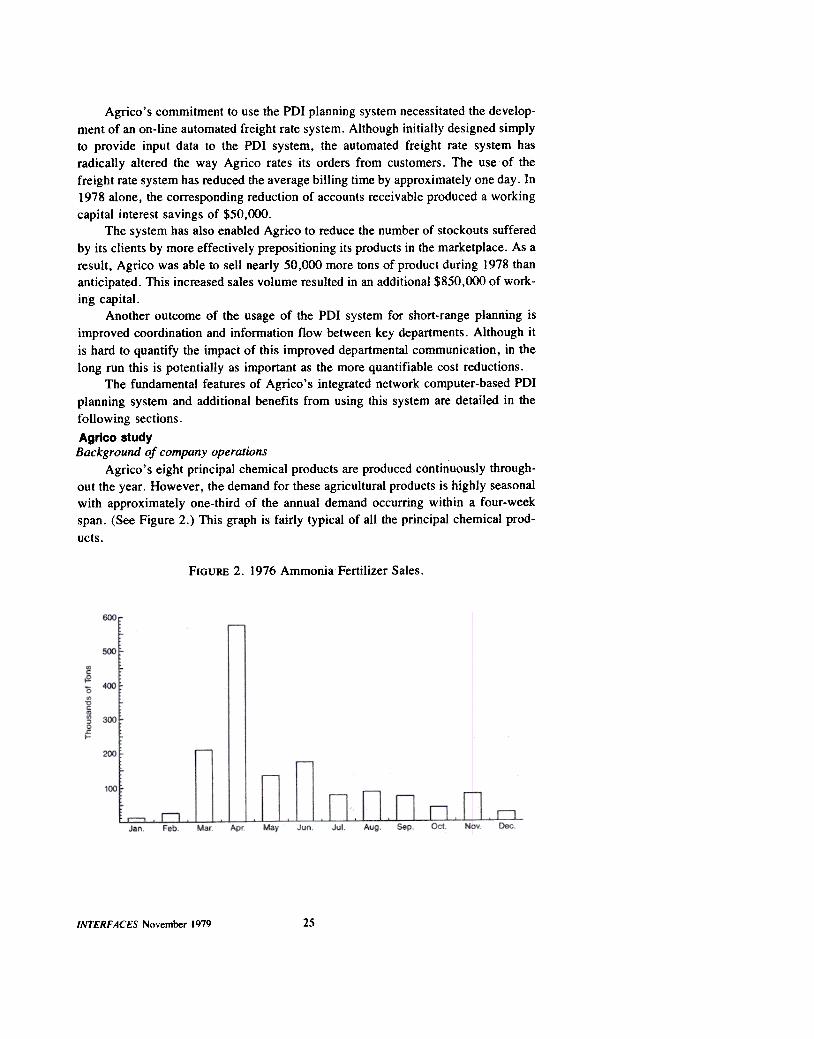
Agrico's eight principal chemical products are produced continuously through-out the year. However, the demand for these agricultural products is highly seasonalwith approximately one-third of the annual demand occurring within a four-weekspan. (See Figure 2.) This graph is fairly typical of all the principal chemical prod-
ucts.
FIGURE 2. 1976 Ammonia Fertilizer Sales.
25INTERFACES November 1979
Managerial decisions relating to the distribution and inventory functions require
evaluation of the following questions:.Where should products be shipped?.Which demand should be met?.Which company-owned distribution centers should be used?.Where should new distribution centers be leased and what should be their
size?.Where and how much product exchange should be made?.How many railroad cars should be leased and purchased?.What level of customer service provides the most cost-effective results?.Which plants or distribution centers should service which clients?As the size and complexity of the organization increased, it became apparent
that answers to these important questions required more powerful analytical toolsthan previously employed. This realization was abruptly accentuated by the crisis ofsteeply escalating distribution costs in the mid-1970's. This led management to seekan effectively designed computer-based PDI planning system. The virtues of this
decision are becoming more important due to the current energy and rail car shor-
tages.
Madej developmentThe interdisciplinary team, created by management to develop the PDI system,
was composed of high-level company personnel and an outside staff of ManagementScientists and computer specialists. It undertook as its initial effort to thoroughlyanalyze Agrico's existing facilities and on-going operations. Agrico has 4 productionplants, 78 distribution centers, and approximately 2000 clients. The bulk distributionof product from plants to distribution centers is primarily by pipeline, barge, and rail.
Shipments from distribution centers to clients also include truck and client-arrangedpickup. The total bulk storage capacity of the 78 distribution centers is about 1.6million tons, or approximately 40% of sales of the major products marketed.
A number of the distribution centers are owned and operated by Agrico and theremainder are leased on an annual basis. The centers provide a buffer between the
constant production rate at the plants and the highly seasonal demand pattern of the
clients. In addition, their storage capability allows Agrico to strategically prepositionits products in order to provide its clients with faster deliveries at a lower cost.
The project team ascertained that Agrico had available or could obtain the
following data:.The production rates, capacity limitations. and variable operating costs at
each supply point..Transportation costs from plants to distribution centers, inventory storage,
capacity by product, transportation equipment loading and unloading limitations,variable throughput and operating costs, and the cost of stocking by mode of ship-
ment for each distribution center in the system..Mode of shipment, demand to be served, and transportation costs from dis-
tribution centers for each client.
26 IN1E'RFA<"£S November 1979
Overall model strategyBased on the information obtained in the initial evaluation effort, a 12-month
planning horizon was selected, since Agrico's distribution center leases are on anannual basis and uncertainties in sales forecasts diminish the value of a longer
planning horizon. In addition, the project team decided to partition the planninghorizon into monthly time periods in order to capture the highly seasonal demand
pattern.The critical task at this stage was to identify a model that exhibited a useful
degree of realism, in view of the decision objectives, yet which was efficientlysolvable. The early history of Management Science applications contains numerousexamples of elaborate decision-making systems which were either designed to solvethe wrong problems, or designed to solve the right problems, but which utilized a
model structure that could never be solved with existing solution technology. Inaddition, the interpretations of these models and their outcomes were often com-pletely opaque to anyone other than the highly technical "experts" who designedthem.
To avoid these pitfalls, the project team devoted special consideration to the
intricate task of designing a mathematical model which could effectively incorporateall the details of Agrico's PDI problems and, at the same time, satisfy the other two
important criteria of solvability and understandability. Investigation showed that anetwork-based model was the most useful and effective for this task because:
(I) Network models are highly solvable. Advances in network modeling andsolution technology [I ]-[ 18] have occurred over the past several years wherebyproblems that previously cost $1000 to solve can now be solved for less than $10 [8],[9]. Further, it is now possible to solve network problems vastly larger than could besolved a few years ago [I].
(2) Network models facilitate communication between specialists andnonspecialists, due to their pictorial (di~grammatic) nature [8], [9].
(3) The visual aspects of network models also contribute to increased insightsinto the problem structure and enable meaningful interpretation of problem solutions.
With the decision to use a network-based model, the steps of the model de-velopment could be undertaken in a manner which allowed all members of the projectteam to actively participate, regardless of their Management Science background.Each member was encouraged to contribute to the team effort according to his own
area of expertise.The integration of the modeling effort, with the organizational levels and
branches it affected,. was an extensive and demanding task. Inputs required were the
distribution history and modes of shipment, geographical demand patterns, processcharacteristics, plant capacities, variable operating costs,. transportation costs andconstraints, and inventory configurations, costs, and constraints. These were fed into
the model and processed by an optimization routine that produced plans for topmanagement's analysis and review. On the basis of this review,. revised projectionsand "what if" questions were formulated which were again presented to the model,thereby establishing a dynamic feedback process that provided still more refined anduseful information. The overall design of the project team's strategic effort is shown
in Figure 3.
INTERFACES Novemher 1979 27
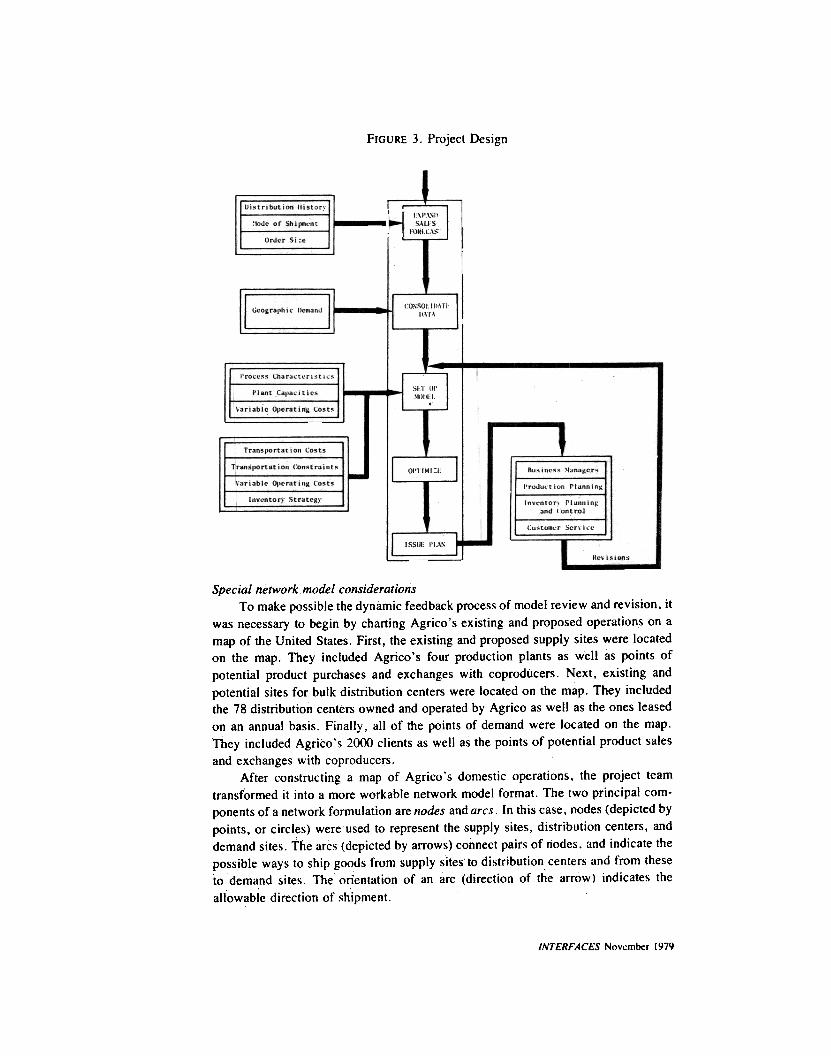
FIGURE 3. Project Design
" Ui.tribution lIiotory
~Iodc of Shipo,-nt III
Urd"r Si,.
(G~SOllll,'Ti'II,\T.\t;cograpil i" !)cm"n.!
R,'vis ions
I
"ro"".. Chara"t"r.'ti"'1,
Plant Ca"""itio,I
Variable Oporatin" Cost.
,;" III'~MIIIII,
-
Transportation Losts
I Transportation Con.traint.. ,I
Varioblc Ct'crating Co II
Inv,'ntory Str.tcgy
I 1I.."i...,.. ~1..nuM.,r""rod..., ion rlonnin"
In".,n'or~ Plon..in"ond lontrol
i
Cu"""',r 5.,r. i ""
IJPTIMI:I:
',Sllio 1'1.,\"
no,i.ions
Special netWork model considerationsTo make possible the dynamic feedback process of model review and revision. it
was necessary to begin by charting Agrico's existing and proposed operations on a
map of the United States. First, the existing and proposed supply sites were locatedon the map. They included Agrico's four production plants as well as points ofpotential product purchases and exchanges with coproducers. Next, existing and
potentIal sites for bulk distribution centers were located on the map. They includedthe 78 distribution centers owned and operated by Agrico as well as the ones leasedon an annual basis. Finally. all of the points of demand were located on the map.They included Agrico's 2000 clients as well as the points of potential product sales
and exchanges with coproducers.After constructing a map of Agrico's domestic operations. the project team
transformed it into a more workable network model format. The two principal com-ponents of a network formulation are nodes and arcs. In this case. nodes (depicted bypoints, or circles) were used to represent the supply sites, distribution centers, anddemand sites. The arcs (depicted by arrows) connect pairs of npdes. and indicate thepossible ways to ship goods from supply sites to distribution centers and from theseto demand sites. The orientation of an arc (direction of the arrow) indicates the
allowable direction of shipment.
INTERFACES Noycmber 1979
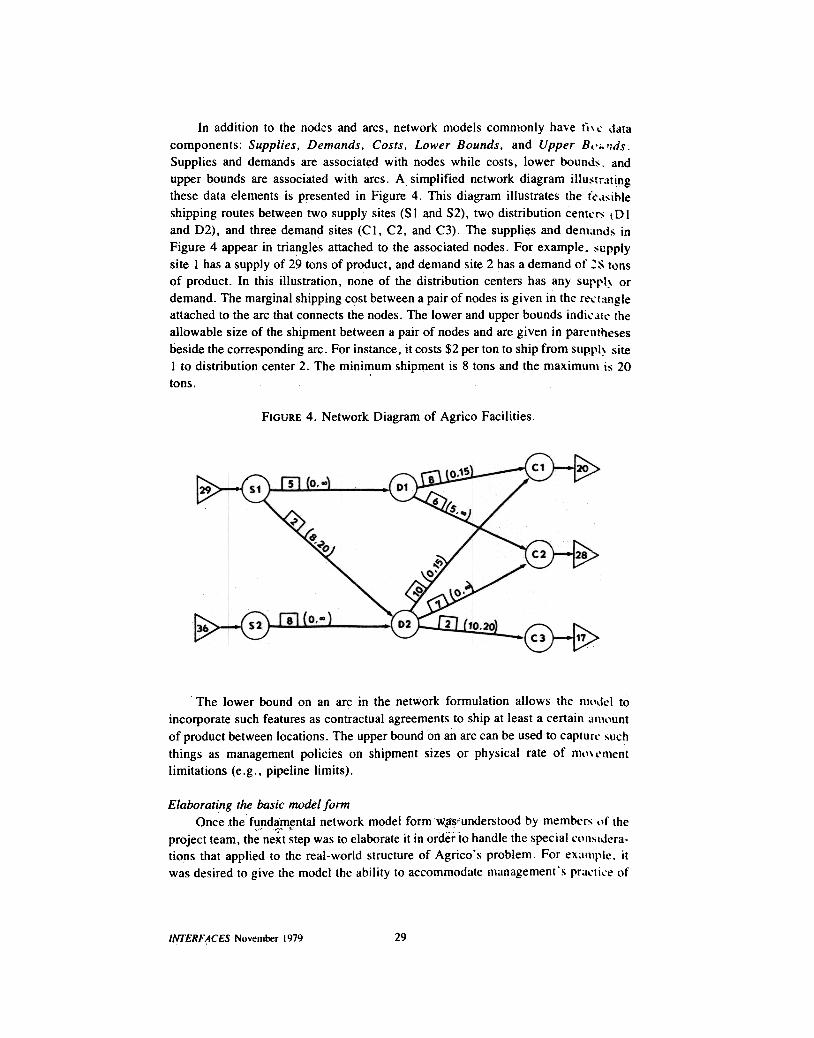
In addition to the nodcs and arcs, network models commonly have fi\ I.' data
components: Supplies, Demands, Costs, Lower Bounds.. and Upper B""'1ds.Supplies and demands are associated with nodes while costs. lower bound:,. andupper bounds are associated with arcs. A simplified network diagram illu:'lr'ltingthese data elements is presented in Figure 4. This diagram illustrates the 11.',I:,ible
shipping routes between two supply sites (Sl and S2), two distribution centl.'~ tOIand 02). and three demand sites (CI, C2, and C3). The suppliecs and dem.md:, inFigure 4 appear in triangles attached to the associated nodes. For example. :,upplysite I has a supply of 29 tons of product, and demand site 2 has a demand of .:'" tonsof product. In this illustration, none of the distribution centers has any surrl~ ordemand. The marginal shipping cost between a pair of nodes is given in the r~I.'I;mgleattached to the arc that connects the nodes. The. lower and upper bounds indil.' -III.' theallowable size of the shipment between a pair of nodes and are given in par~nthesesbeside the corresponding arc. For instance, it costs $2 per ton to ship from suprl~ siteI to distribution center 2. The mini~um shipment is 8 tons and the maximum is 20tons.
FIGURE 4. Network Diagram of Agrico Facilities
The lower bound on an arc in the network formulation allows the ml\\I~1 toincorporate such features as contractual agreements to ship at least a certain JI\\l\untof product between locations. The upper bound on an arc can be used to caplurl' ~uch
things as management policies on shipment sizes or physical rate of ml\' l'ment
limitations (e.g.. pipeline limits).
Elaborating the basic model formOnce the fundamental network model form w,~;,understood by membl.'rs "r the,..' c'" .
project team, the next step was to elaborate it in order to handle the special consIdera-tions that applied to the real-world structure of Agrico's problem. For example, it
was desired to give the model the ability to accommodate management's pral.'til.'e of
29INTERFACES November 1919
setting lower and upper limits on supply quantities. This ability allows the model,
instead of the manager, to select the exact levels of production, purchase, andexchange. The manager is required only to specify feasible ranges for these deci-sions. In the network fonnulation, this feature was implemented by adding a supply
policy node and sUPPl)' polic)' arcs to each of the supply sites.This added construction provided an increased model capability that made it
possible to handle the variable costs of production, purchase, and exchange. In an
analogous fashion, the model was extended to enable fixed levels of demand at eachdemand site to be replaced by an estimated demand range. Demand policy arcs fromeach demand site to a demand policy node can be used to capture the variable revenueassociated with selling the product or exchanging with a coproducer.
Additional problem considerations required somewhat more complex augmenta-tions to the model. Analyses conducted with the aid of Agrico's production, distribu-tion, and marketing staffs led to identifying the least cost alternatives for modes of
transportation from the supply sites to the distribution centers. These were incorpo-rated into the model by means of approporiate network constructions. Safeguards on
the quality of customer service were provided by a preliminary culling of transporta-tion links from distribution centers to demand sites and imposition of bounds onappropriate arcs.
Agrico's marketing staff raised the further consideration that many clients ex-pressed a preference for certain modes of transportation during certain times of theyear. Consequently, the project team decided to represent these clients by a set ofdemand site nodes instead of by a single node. A set of nodes made it possible to
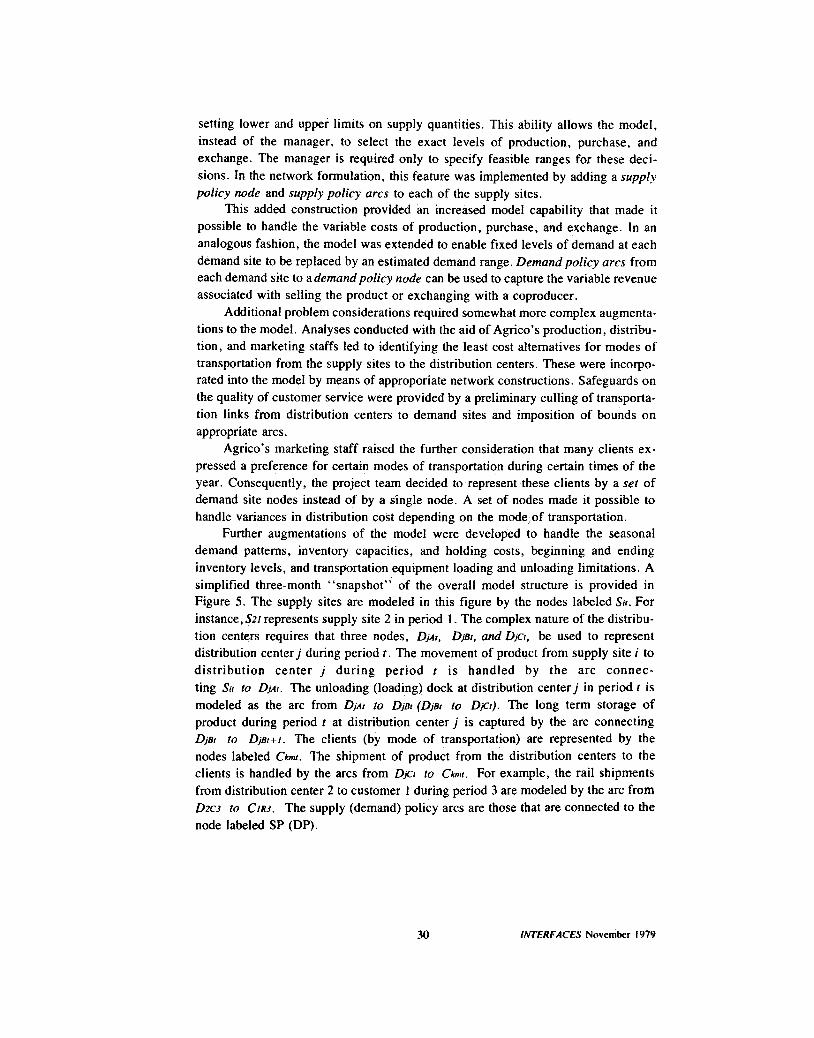
handle variances in distribution cost depending on the mode;of transportation.Further augmentations of the model were developed to handle the seasonal
demand patterns, inventory capacities, and holding costs, beginning and endinginventory levels, and transportation ~uipment loading and unloading limitations. Asimplified three-month "snapshot" of the overall model structure is provided inFigure 5. The supply sites are modeled in this figure by the node!; .labeled Sit. Forinstance, S21 represents supply site 2 in period I. The complex nature of the distribu-tion centers requires that three nodes, DjAt, DjBt, and DjCt, be used to representdistribution center j during period t. The movement of product from supply site i todistribution center j during period t is handled by the arc connec-ting Sit to DjAt. The unloading (loading) dock at distribution center j in period t is
modeled as the arc from DjAt to DjBt (DjBt to Dft:"t). The long tenn storage ofproduct during period t at distribution center j is captured by the arc connectingDjBt to DjBt+l. The clients (by mode of transportation) are represented by thenodes labeled Ckml. The shipment of product from the distribution centers to theclients is handled by the arcs from DjCr to Ckmt. For example, the rail shipmentsfrom distribution center 2 to customer I during period 3 are modeled by the arc fromD2C3 to CIR3. The supply (demand) policy arcs are those that are connected to the
node labeled SP (DP).
30 INTERFACES November 1979
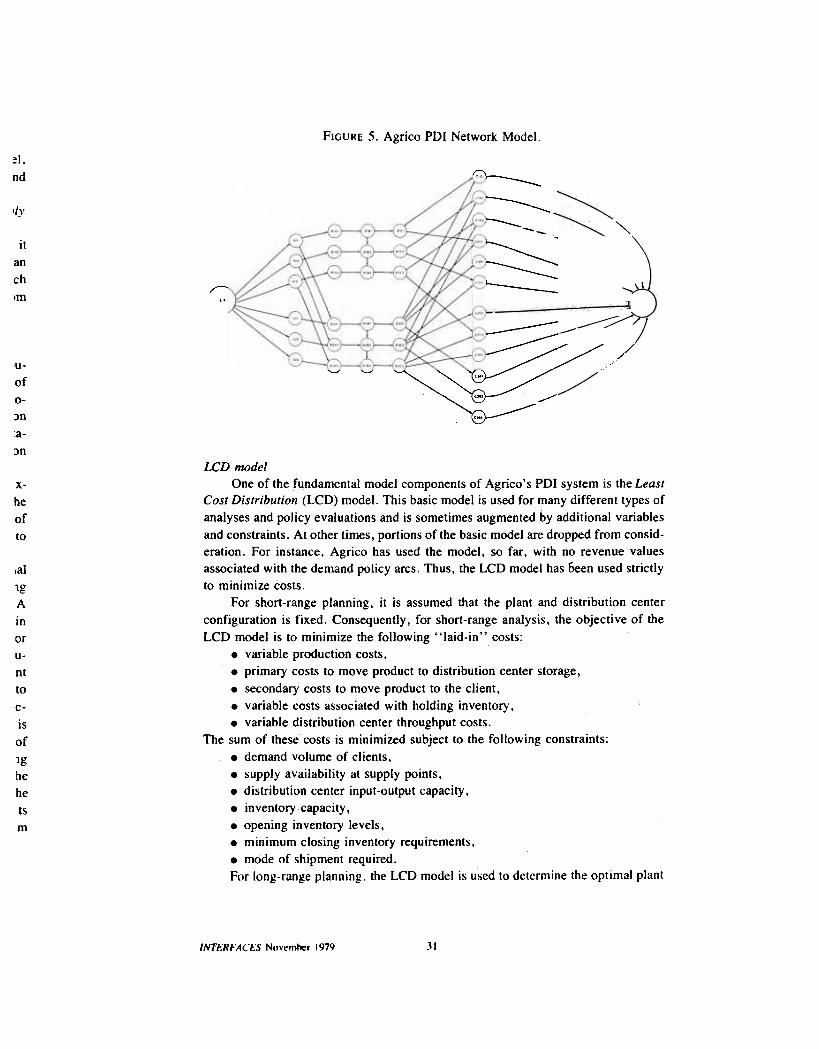
FIGURE 5. Agrico POI Network Model.
~I,
nd I~/,r...;---
~ :_~o/y
~
"'...
~~
~
,~~;~==£~.., -, :~ ,-..
.,.. ...
--
~:::~~~~:" ..~~~;_.:--~::::::::~::::-
itanch1m \
,-.,,/
/
~
/
,u-
of0-:>n
:a-
:>n
~
x-
heofto
,al10l:
AIn
oru-nttoc-IS
of
19he
he
tsm
LCD modelOne of the fundamental model components of Agrico's PDI system is the Least
Cost Distribution (LCD) model. This basic model is used for many different types of
analyses and policy evaluations and is sometimes augmented by additional variablesand constraints. At other times, portions of the basic model are dropped from consid-eration. For instance, Agrico has used the model, so far, with no revenue valuesassociated with the demand policy arcs. Thus, the LCD model has 6een used strictlyto minimize costs.
For short-range planning, it is assumed that the plant and distribution centerconfiguration is fixed. Consequently, for short-range analysis, the objective of the
LCD model is to minimize the following "laid-in" costs:.variable production costs,.primary costs to move product to distribution center storage,
.secondary costs to move product to the client,
.variable costs associated with holding inventory,
.variable distribution center throughput costs.The sum of these costs is minimized subject to the following constraints:
.demand volume of clients,.supply availability at supply points,.distribution center input-output capacity,
.inventory capacity,.opening inventory levels,.minimum closing inventory requirements,.mode of shipment required.For long-range planning. the LCD model is used to determine the optimal plant
31/NTf.'RFACf.~5 N(lve~r 1979
and distribution center configuration and size. For these types of analyses. the objec-tives are augmented to include minimization of plant expansion and fixed distributioncenter lease costs. The constraint set is expanded to include various distributioncenter location and plant expansion options.
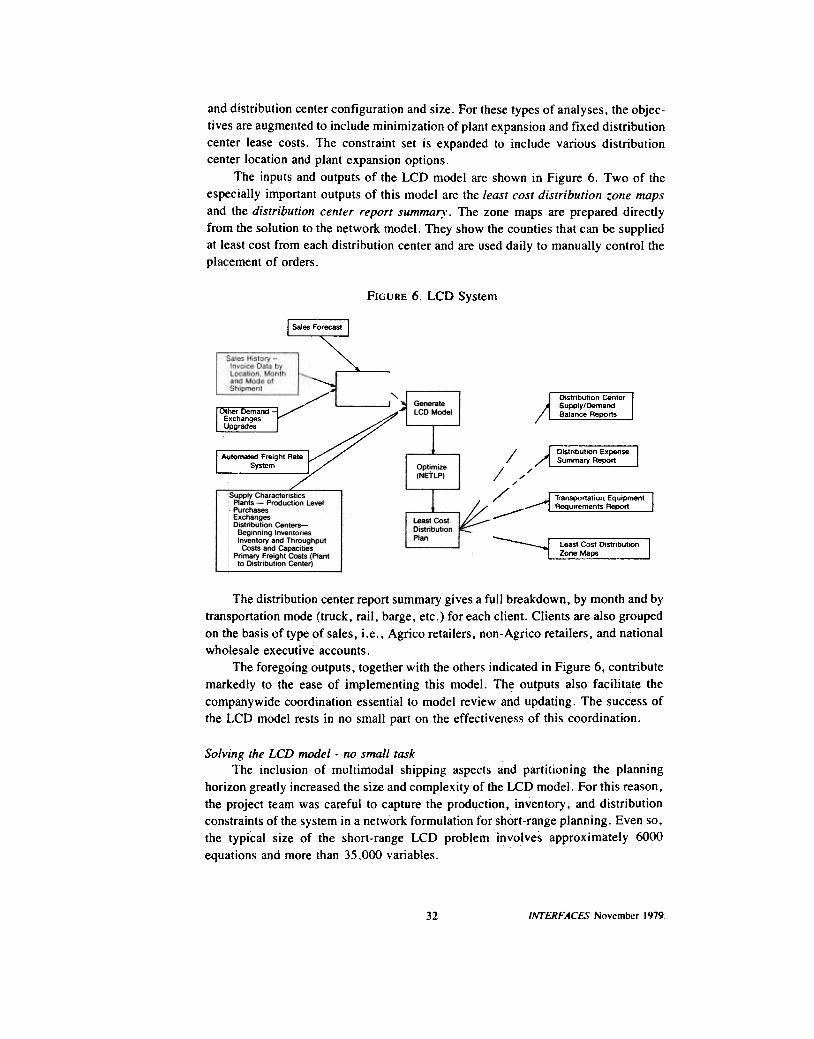
The input~ and outputs of the LCD model are shown in Figure 6. Two of the
especially important outputs of this model are the least cost distribution zone mapsand the distribution center report summary. The zone maps are prepared directlyfrom the solution to the network model. They show the counties that can be suppliedat least cost from each distribution center and are used daily to manually control the
placement of orders.
FIGURE 6. LCD System
[:~~:~}//her Demand -
ExchangesUpgrades
Sales History -Invoice Data byLocation. Monthand Mode ofShipment
/ Distribution CenterSupply/DemandBalance Reports
j Distribution Expense I/1 Summary Report 1/
// /'./
Transportation EquIpmentRequirements Report//
Least Cost DistributionZone Maps
The distribution center report summary gives a full breakdown, by month and bytransportation mode (truck, rail, barge, etc.) for each client. Clients are also groupedon the basis of type of sales, i.e., Agrico retailers, non-Agrico retailers: and nationalwholesale executive accounts.
The foregoing outputs, together with the others indicated in Figure 6, contributemarkedly to the ease of implementing this model. The outputs also facilitate the
company wide coordination essential to model review and updating. The success ofthe LCD model rests in no small part on the effectiveness of this coordination.
Solving the LCD model -no small taskThe inclusion of multimodal shipping aspects and partitioning the planning
horizon greatly increased the size and complexity of the LCD model. For this reason,the project team was careful to capture the prod~ction, inventory, and distributionconstraints of the system in a network formulation for short-range planning. Even so,the typical size of the short-range LCD problem Involves approximately 6000
equations and more than 35,000 variables.
32 INTERFACES November 1979
In fact, the apparently fonnidable task of solving"thisproblem almost caused the
study to be aborted before it began. To test the feasibility of solving the problem,Agrico obtained access to a primal simplex-based network code from its parent, The
Williams Companies. Attempts to solve a problem with this code on a large-scaleAMDAHL V -6 computer required approximately two and a half hours. This outcomewas severely negative, due to the need for reasonable turnaround time to perfonniterative solution analyses. As a result, the project was on the brink of being scrap-
ped.Fortunately, however, major recent innovations in network solution technology
[5], [9], [10] came to the rescue. The project team recommended that Agrico under-
take to solve the problem with an advanced and highly efficient code developed byAnalysis, Research, and Computation (ARC), Inc. With management's approval,ARC's network code, ARCNET, was obtained and tested. ARCNET was able toreduce the solution time from two and a half hours to only 50 seconds! Because of theneed to solve the short-range LCD model repeatedly, in order to answer "what if"
questions concerning different demand structures and production/distributionscenarios, this occurrence was a vital element in the success of the project.
The project team's network expertise was also utilized to obtain highly efficientsolution software for the long-range LCD model. This model is a large-scale, mixedinteger, linear programming problem whose linear programming (LP) portion in-volves a large embedded network structure. Members of the project team had pre-
viously played a fundamental role in developing mathematical procedures [II], [16]for solving LP problems with embedded networks efficiently. However, at that time
such procedures had never been implemented for use on a computer, Since manage-ment had faith in the project team, they authorized the team to negotiate a contractwith ARC to develop such an LP system. This was the second and most crucial
decision made by Agrico management for the solution of their models.
ARC developed a new LP solution system, called PNET/LP, which has proven
to be far superior in performance to even the team's most optimistic expectations.The system, when compared against one of the fastest state-of-the-art LP systems,APEX-III, proved to be at least 75 times faster on medium size prototypes of Ag-
rico's problems. PNET/LP normally solves Agrico's long-range LCD problems,involving 6250 equations and 23,000 variables, in less than 5 minutes, including all
input and output. The value of this solution capability, in terms of providing man-agement with a tool -the LCD model -which can be used on a. routine basis to
evaluate planning alternatives, is difficult to overstate.
Concluding remarks by Agrico managementThe following remarks regarding the success of this Management Science appli-
cation at Agrico Chemical Company are given by David Wilson, Vice-President of
Agrico Supply and Distribution:
The PDI planning !;y!;tem has had a wjde!;pread impact at Agrico. In addition to costsaving!; that exceed $8 million in 1978 alone. the !;ystem has brought about impro.ements in
nearly every phase of our production. distribution and inventory operation,
33INTERFACES Novem~r 1979
We have recently used the PDI system, for example, to evaluate the benefit/cost impactof resizing an ammonia pipeline system and to determine the effects of pipeline tariff rate
changes. Additionally, we have used the system to evaluate long-term conversion/exchange
agreements affecting operations companywide. Also, the use of the model to assist in sizingour VAN solution distribution system has provided new insights onslze and location ofstorage tanks.
A major nonquantifiable benefit has been a better and more thorough understanding ofour Supply and Distribution operations. The PDI system has been particularly valuable toAgrico in the areas of marketing (by more clearly identifying the end-point demands of ourcustomers and the transportation modes best suited to satisfy them) and supply and distribu-tion (by more effectively relating distribution center operations to the most profitable ship-
ping alternatives).The ability to investigate the impact of various decision alternatives, before they are
implemented, provides us with information to manage more intelligently. The "whys" of aparticular solution are often more valuable than the' 'what" of an optimal solution, as optimalsolutions are typically modified during implementation due to changes in real-world condi-tions. Insights into the "whys" of system behavior, gained through the investigation ofalternative scenarios with the PDI system, have enabled us to respond more effectively to ouroperating environment.
The use of the LCD system has been so successful and encouraging that we are in theprocess of incorporating revenue data into the model and are considering extensions of themodel to encompass our manufacturing and mining activities. These extensions of the modelwill enable marketing to evaluate the impact of new areas of demand and allow Agrico to gainthe benefits of the PDI planning system in additional areas of management.
RE,FERENCES
[I] Barr, R. and Turner, J.S., "A New, Linear Programming Approach to Microdata File Merging,"
1978 Compendium of Tax Research, Office of Tax Analysis, Department of the Treasury, Wash-ington, D.C.
[2] Bartholdi, J., III, and Ratliff, H.D., "A Field Guide to Identifying Network Flow and MatchingProblems,.' Research Report No. 77-12, Department of Industrial and Systems Engineering, Uni-versity of Florida, Gainesville, Florida.
[3] Bazaraa, M. and Jarvis, J., Linear Programming and NetWork Flows, John Wiley & Sons, NewYork, 1977.
[4] Brooley, G., "Survey of Deterministic Networks," AJ/E Transactions 7, 1975, pp. 222-234.[5] Bradley, G., Brown, G., and Graves, G., "Design and Implementation of Large-Scale Primal
Transshipment Algorithms," Management Science 24, 1977, pp. 1-35.{6] Cunningham, W., "A Network Simplex Method," Mathematical Programming II, 1976 pp.
105-116.[7] Dennis, J., "A High-Speed Computer Technique for the Transportation Problem," Journal of the
Associationfor Computing Machinery 8, 1958, pp. 132-153.[8] Glover, F., Hultz, J., and Klingman, D., "Improved Computer-Based Planning Techniques, Part
I," Interfaces 8, 1978, pp. 16-25.[9] Glover. F., Hultz, J., Klingman, D., and Stutz, J., "Generalized Networks: A Fundamental
Computer-Based Planning Tool," Management Science 24, 1978, pp. 1209-1220.[10] Glover, F., Karney, D., and Klingman, D., "Implementation and Computational Study on Start
Procedures and Basis Change Criteria for a Primal Network Code," NetWorks 4, 1974, pp. 191-
212.[II] Glover, F. and Klingman, D., "Models and Methods for Network-Related Problems," Proceed-
ings of NATO Advanced Study Institute on Computer Methods in Practical Applications, Sogesta,
Urbino, Italy, July 1977.[12J Helgason, R. and Kennington, J., Algorithms for NetWork Programming, to be published.[13] Jensen, P. and Bhaumik, G., "A Flow Augmentation Approach to the Network with Gains
Minimum Cost Flow Probiem," Management Science 23, 1977, pp. 631-643
34 INTERFACES November 1979
[14] Johnson, E., "Rows in Networks," in Handbook of Operations Research, ed. by J Moder and S.Elmaghraby, Van Nostrand Rineholt Co., 1978, pp. 183-205.
[15] Klingman, D. and Russell, R., "On Solving Constrained Transportation Problems."OperationsResearch 23, 1975, pp. 91-107.
[16] Maier, S., "A Compact Inverse Scheme Applied to a Multicommodity Network with ResourceConstraints," Technical Report No. 71-8, Operations Research House, Stanford Uni1.ersit). 1971.
[17] Mulvey, J., "Testing of a Large-Scale Network Optimization Program," Mathematical Program-ming 15, 1978, pp. 291--315.
[18] Srinivasan, V. and Thompson, G., "Benefit-Cost Analysis of Coding Techniques for the Primal
Transportation Algorithm," Journal of the Association for Computing Machiner:-. 20, 1973, pp.194-213.
."sh-
ingIni-
ew
4.nal
pp.
the
'art
111al
tart
1-
ed-sta,
lins
35INTERFACES November 1979
979