Embed Size (px)
Citation preview
Asia-Pacific Social Science Review | Vol. 21 No. 2 | June 2021
Copyright © 2021 by De La Salle University
RESEARCH ARTICLE
An Integrated Model to Explain How Intellectual Capital Affects Earnings Quality: Some Evidence from Asian Emerging Economies
Eugene B. MutucBulacan State University, Malolos City, [email protected]
Abstract: The importance of intellectual capital (IC) has become visible and increase recognition as a worthy issue in academic and practical investigations. Although IC drives financial performance and competitiveness in the past literature, the quality of financial reporting is one of the essential factors to analyze and examine to achieve IC’s wholistic impact on company practices. This study integrates the mediating effect of financial performance and industry competition’s moderating role to explain IC’s effect on earnings quality (EQ). This study analyzes 1,813 firm-year observations from 2011 to 2017 based on 259 non-financial listed firms from industrials, consumer services, technology, basic materials, consumer goods, utilities, health care, resources, and telecommunications services, based on Thomson Reuters Business Classification (TRBC). The Asian economies, including China, India, Malaysia, South Korea, Philippines, Taiwan, and Thailand, were examined to raise a new perspective on the phenomenon and chosen according to the availability of firms’ data at the Thomson Reuters Eikon database. The study employs multivariate regression analyses using SPSS and Baron and Kenny’s (1986) causal steps approach to test conditional hypotheses. Our main findings reveal that IC investments are essential in creating value for the company and generating better EQ. IC causes better EQ, but the impact is partially mediated by financial performance among the firms from the combined sample (from China, Philippines, Taiwan, and Thailand). Moreover, industry competition reinforces a change in the effect of IC on EQ. Specifically, the combined samples and firms from China show that industry competition positively moderates the IC-EQ relationship. In contrast, the Philippines and Thailand firms offer that industry competition negatively moderates the IC-EQ relationship. The control variables, such as financial leverage and size, show mixed findings depending on the analysis context. This study acknowledges that VAIC has limitations as a measure of IC. However, this estimate is considered an appropriate measure of IC because the data needed to calculate VAIC were gathered from audited financial statements (Komnenic & Pokrajčić, 2012). This study fills the literature gap through the developed and integrated model to explain the IC-EQ relationship. Future studies may incorporate some more robust consequences and boundary conditions in examining IC’s impacts on EQ. Lastly, the firm’s decision-makers should contemplate that IC investments have relevant importance to achieve a competitive advantage and better financial performance. These outcomes are reflected in the means of the quality of financial reports presented by companies.
Keywords: Intellectual Capital; Earnings Quality; Financial Performance; Industry Competition; Asian Economies
203Asia-Pacific Social Science Review | Vol. 21 No. 2 | June 2021
The efficient facilitation of a business firm’s knowledge is critical in its stability and success (Kianto & Andreeva, 2014). The appropriate utilization of intangible assets is evident to most successful companies (Darabi et al., 2012). It enables the firms’ efficiency and competitiveness and acquires advantages over their competitors (Surroca et al., 2010). Surroca et al. (2010) considered technology, human resources, reputation, and cultural components of intangible resources as components of intellectual capital (IC). IC is an inventory of knowledge-based resources existing in the organization, which can be used in value creation (Kianto et al., 2014).
As IC has become more and more critical for the competitiveness of companies (Kianto et al., 2013), it has appeared to be essential to find a way to measure and report on IC and allow companies to properly manage their IC (Pulic, 2004; Vishnu & Gupta, 2014). There has been intensive discussion in the academic and professional community about a suitable model for integrating IC and its elements into performance measurement that has resulted in the advancement in propounding models to estimate IC and its components (Sveiby, 2010). Most of the prior studies contemplate and explain the influence of IC and financial performance (Inkinen, 2015).
Although IC drives financial performance and competitiveness in the past literature, the quality of financial reporting is one of the essential factors to analyze and examine to achieve IC’s wholistic impact on company practices. Earnings quality (EQ) is related to the firm’s manipulation of earnings (Y.im Y.et al., 2012). Mutuc et al. (2019) noted that it is associated with managerial practices that depend on opportunistic behavior that stems from the personal agenda to present attractive financial reports. EQ is affected by the continuity of earnings and its extent in reflecting the actual economic transactions (Ramadan, 2015). Subsequently, EQ refers to reported earnings’ ability to reflect stability, persistence, and consistency by presenting the company’s actual and fair earnings and the usefulness of reported earnings to predict future earnings (Darabi et al., 2012).
Previous studies have linked IC and investigated its implications on EQ. Some of the studies provided evidence that IC has a positive and significant effect on EQ (Darabi et al., 2012; Zanjirdar & Chogha, 2012; Mojtahedi, 2013; Azizi et al., 2013; Sarea & Alansari, 2016; Ardi & Murwaningsari, 2018; Nuryaman et
al., 2019; Caruso et al., 2016; Yang, 2018). These prior findings are still vague as to the extent of its implication. The IC-EQ issue analysis is minimal due to factors such as a lack of sufficient theoretical support and the use of different estimates of EQ. Most of the literature about IC is focused on its impact on financial performance and competitiveness (Ariff et al., 2016; Tsai & Mutuc, 2020; Xu & Liu, 2020; Cenciarelli et al., 2018; Holienka & Pilková, 2014; Dženopoljac et al.. 2016; Vazifehdoust et al., 2014; Tran & Vo, 2020). However, exploring its impact on the quality of the financial reports showing this performance and industry competition is limited.
The majority of the studies about the implications of IC on firm performance and managerial practices were investigated in a Western context (Cheng et al., 2013; Cenciarelli et al., 2018; Dženopoljac et al., 2016; Sardo & Serrasqueiro, 2018; Bontis et al., 2018). There were studies in Asia and the Pacific (Vishnu & Gupta, 2014; Nimtrakoon, 2015; Smriti & Das, 2018; Tran & Vo, 2020; Xu & Li, 2019; Chowdhury et al., 2019; Bayraktaroglu et al., 2019; Xu & Liu, 2020).
Moreover, prior studies about IC-EQ contemplated on Middle East countries (Darabi et al., 2012; Zanjirdar & Chogha, 2012; Mojtahedi, 2013; Azizi et al., 2013; Sarea & Alansari, 2016), whereas research investigating the quality of financial reports in developed Western economies through accrual-based and real-activities earnings management (Y.im Y.et al., 2012; Bozzolan et al., 2015; Mutuc et al., 2019). Hence, there is a lack of cross-country study among economies to compare institutional and cultural factors in the relationship between IC and the quality of accounting information. An empirical study was developed to address the gaps in the literature and address this vital issue. This study investigates knowledge-based resources, financial performance, industry competition, and EQ, aiming to provide insight into their contribution to value creation. Specifically, this study sought answers on how IC relates to EQ among the listed firms from selected Asian countries; and how do financial performance and industry competition influence the relationship between IC and EQ?
This study draws an integrated model in which financial performance is used as a mediating factor and utilized industry competition as a moderating variable to explain IC and EQ’s relationship. These factors might be the missing links that could explain the phenomenon. The return on assets (ROA), an
204 Asia-Pacific Social Science Review | Vol. 21 No. 2 | June 2021
accounting-based measure, was utilized as a proxy of financial performance. This study conjectures that ROA mediates the relationship between IC and EQ. This notion is motivated by the evidence showing the impact of IC on financial performance (e.g., Bontis et al., 2018; Ariff et al., 2016; Xu & Liu, 2020) and the effect of better financial performance to generate more excellent EQ for a high-quality financial report (Madhumathi & Ranganatham, 2011; Saleh et al., 2013). This study argues that reflecting on the influence of financial performance provides additional insight into the relationship.
The Herfindahl–Hirschman Index (HHI) was used as a measure for industry competition. Wang et al. (2014) mentioned that the competition of the product in the market in an industry implicates managers’ decision-making, which causes profitable outcomes for companies. In addition, the management of IC creates significant outcomes on performance in terms of competitiveness and financial aspect, an indication that the management of intangibles is essential in the knowledge economy (Kianto et al., 2013). This study conjectures that industry competition can provide a thorough justification through the enhanced association of knowledge-based resources on the quality of financial reporting. This notion is motivated by Kianto et al.’s (2013) supposition that knowledge is an essential factor in achieving competitive advantage in the contemporary economy and recognizing knowledge-based aspects for value creation.
This study reflects on firms from Asia’s emerging economies, including China, India, Malaysia, Philippines, South Korea, Taiwan, and Thailand. Singh et al. (2017) explained that emerging economies are relatively under-researched and can give a new perspective on the phenomenon because they are composed of markets where there is a lag in market development and the institutional environment compared to developed markets. This study conducts a cross-country study among these economies to compare the effect of institutional and cultural factors on accounting information (Enomoto, 2018).
The present study provides finding that can cognizance the phenomenon among knowledge-based resources and managerial practices. Theoretically, it contributes to the existing body of knowledge based on the resource-based and stakeholder theories. Pioneering work was presented in this study about the empirical
investigation of IC’s impact on EQ and the integration of financial performance and industry competition to explain the phenomenon. Most of the literature about IC is focused on its impact on financial performance; however, the exploration of its impact on the quality of the financial reports showing this performance is limited. Even though very few studies discussed the IC-EQ relationship, findings are still vague regarding the extent of its implication. By integrating financial performance and industry competition, this study contributes to the wide dispersion of IC’s importance and its effect on profitability and its relevance in managerial practices.
Moreover, this study explores the relationship in the emerging economies, composed of under-researched markets with lag on market development and the institutional environment. Most of the prior studies investigate listed firms from Middle East countries. Hence, this study is the first to initiate the investigation in an Asian context.
Literature Review and Hypotheses Development
Resource-based view theory states that firm strategy formulation relies on the mechanisms to bolster its resources and capabilities, competitive advantage, and profitability (Grant, 1991). It explains the relevant significance of a knowledge-based perspective independent of an opportunism-based view (Conner & Prahalad, 1996). This study reflects the resource-based theory to explain firms’ investment in IC and its implications on managerial practices. According to resources-based theory, companies attain a competitive advantage and achieve more excellent performance through the effective and efficient utilization of strategic assets. This theory is relevant to the present study because IC is a knowledge-based resource of firms with substantial implications to strengthen competitive advantage, motivated by the recent studies of Bayraktaroglu et al. (2019) and Smriti and Das (2018).
Aside from resource-based theory, this study contemplates stakeholders’ theory to explain IC and EQ (Sarea & Alansari, 2016). Shareholders and other stakeholders shall be satisfied in implementing company policies and attaining the firm’s goal (Freeman, 1984). The compromise between the
205Asia-Pacific Social Science Review | Vol. 21 No. 2 | June 2021
managers’ goals and stakeholders’ expectations is the primary concern in the management of stakeholders (Donaldson & Preston, 1995; Freeman,1984).
The existing financial reporting framework has limitations, which cause a gap between stakeholders’ expectations of information and the scholars’ motivations to examine and explore the IC measurements and reporting of companies (Kannan & Aulbur, 2004). The economic outcome is composed of IC efficiency (Williams, 2013), which indicates a relevant and essential factor in sustainable growth and value creation (Riahi-Belkaoui, 2003).
IC’s implications on a firm’s performance generate interests from stakeholders such as shareholders, institutional investors, policymakers, scholars, and managers (Tan et al., 2007). Sarea and Alansari (2016) mentioned that the concept of stakeholder theory emphasizes the relationship between IC and EQ through the sense of corporate citizenship in presenting high-quality financial reports. This theory is relevant to the present study because managerial practices and firm decisions have implications to stakeholders, motivated by the recent studies of Sarea and Alansari (2016), Chowdhury et al. (2019), and Nimtrakoon (2015). This study shares similar conjecture with Sardo and Serrasqueiro (2018) that “IC represents the knowledge-based activities and processes that contribute to firms’ innovation, value creation, competitive advantages, and future benefits by adding value for firms’ stakeholders” (p. 749).
Intellectual CapitalAcademics, practitioners, and policymakers broadly
agree that organizational performance, value creation, and competitiveness are increasingly grounded on knowledge-based resources, that is, IC (Inkinen, 2015). IC is a bundle of intangibles (Bontis, 1998). These include organizational knowledge, skills, experience, technology, processes, and relationships with stakeholders that make an organization competitive (Edvinsson & Malone, 1997). In the fast-changing and knowledge-based economy, intangibles become predominant sources of value creation and even more important than tangible resources such as capital, plant, and machinery (Grant, 1991) because knowledge-based resources are hard to imitate by competitors. These are historically contextualized, path-dependent, socially involved, and causally ambiguous (Barney, 2001). Thus, IC is a source of sustainable competitive
advantage and strategically important intangible asset (e.g., Barney, 2001).
The VAIC model is one of the most models adopted by scholars to examine IC (e.g., Nimtrakoon, 2015; Sardo & Serrasqueiro, 2018; Smriti & Das, 2018; Chowdhury et al., 2019; Xu & Liu, 2020). This estimate measures a firm’s IC’s efficiency in creating value by utilizing economic resources (Pulic, 2004). Pulic (1998) developed this model, which allows managers, shareholders, and other interested stakeholders to observe and calculate companies’ IC performance and potential.
Earnings QualityThe relevance and essence of EQ originate from
earnings on which many parties depend when they take their decision (Dechow & Dichev, 2002). Dechow et al. (2010) defined EQ as the quality of earnings that provide relevant information regarding the features of a firm’s financial performance essential in decision making. Consistently, EQ refers to the ability of reported earnings to reflect stability, persistence, and consistency by presenting the company’s actual and fair earnings and the usefulness of reported earnings to predict future earnings (Darabi et al., 2012). Also, Ramadan (2015) explained that EQ is affected by the continuity of earnings and its extent in reflecting economic transactions’ actual outcomes. EQ is associated with managerial practices, which depend on the opportunistic behavior that stems from the personal agenda to present attractive financial reports (Mutuc et al., 2019). The low EQ is caused by the manager’s manipulation of the firm’s financial performance through accounting or operating practices to report consistent growth and better earnings (Healy & Wahlen, 1999). Mutuc et al. (2019) noted that the misstatement of financial reports of the company might lead to adverse reactions, depending on the severity of actions of responsible decision-makers of the company. The extensive utilization of EM provides erroneous firm performance, which corrodes the firm reputation (Bozzolan et al., 2015).
Financial reports present the performance of firms to help the stakeholders for financial decision-making. Dechow and Dichev (2002) estimated EQ by examining the estimation error in accruals. Prior studies contemplated the discretionary accruals to measure EQ (Darabi et al., 2012; Sarea & Alansari, 2016; Zanjirdar & Chogha, 2012; Mojtahedi, 2013;
206 Asia-Pacific Social Science Review | Vol. 21 No. 2 | June 2021
Khajavi et al., 2016; Azizi et al., 2013). In accrual-based earnings management, the usual accrual process is altered to present manipulated earnings (Enomoto et al., 2015).
IC and EQIC is an intangible asset requisite to achieve its
growth, and EQ is one of the most important criteria to measure its growth (Darabi et al., 2012). Darabi et al. (2012) investigated IC’s association with EQ among 158 firms with 948 firm-year observations from the Iran stock market. Their findings reveal that the IC and its human capital component positively affect EQ, indicating better financial practices and reporting. Zanjirdar and Chogha (2012) evaluated the relationship between IC and EQ indexes such as earnings stability and earnings predictability among the listed firms in Tehran Exchange Market for five years from 2004 to 2009. Their study found that IC has a meaningful relationship with EQ indexes, suggesting that knowledge, information, and framework development to manage knowledge are essential to achieve process excellence in financial reporting.
Mojtahedi (2013) explained the impact of IC and its components (human capital, structural capital, and relational capital) on EQ in 100 firms from Malaysia. His study demonstrated that IC has a positive and significant impact on EQ. Also, Azizi et al. (2013) investigated the relation of IC on EQ of 73 companies from 2002 to 2011. Their findings revealed that IC has a significant and positive relationship with EQ. They conjectured that internal organizational resources and capabilities generate high financial output. Sarea and Alansari (2016) examined the IC-EQ relationship among the listed firms in Bahrain Bourse. They found that the high level of IC causes a positive impact on the quality of earnings.
Moreover, IC and EQ’s explanatory roles on firm value have been discussed in the literature, wherein other studies contemplated different measures of earnings management to assess EQ. Ardi and Murwaningsari (2018) examined the implications of financial performance, EQ, and IC on Indonesian companies’ value and investigated IC’s effect on the firm’s financial performance. They found that financial performance and IC positively and significantly affect the company value, whereas EQ showed an insignificant effect. In addition, their study revealed that IC has a significant and positive effect on financial
performance. Nuryaman et al. (2019) examined the implication of IC on real-activities earnings management of Indonesian firms. Their findings reveal that IC can be used to lessen firms’ engagements in earnings manipulation through sales operation activities, which indicates higher EQ.
Ferrari and Pisano (2016) investigated whether managers’ behavior in terms of intangible resources such as goodwill induces earnings manipulation in the context of M&As of Italian firms. Their findings revealed no specific approach for earnings management practice, and every firm has consideration in dealing with financial reporting. Yang (2018) examined in Australia whether aggressive pro forma earnings-reporting firms have difficulty disclosing their IC. Their findings revealed that anti-sticky cost behavior occurs when the ability to engage in accrual-based earnings management of firms is limited, whereas IC efficiency increases the degree of cost stickiness.
The majority of the studies about the IC implications on firm performance and managerial practices were investigated in Western and Asia and the Pacific contexts. These past studies reveal that IC and its impact on companies caught the attention of scholars and practitioners worldwide. However, this evidence shows that limited studies are contemplating the knowledge-based resource implications on the quality of financial reporting. These studies reflected on the firms from the Middle East, Malaysia, Indonesia, and Australia. Researches investigating the quality of financial reports were mostly studied in developed Western economies through accrual-based and real-activities earnings manageme (Y. Kim Y.et al., 2012; Bozzolan et al., 2015; Mutuc et al., 2019). Hence, there is a lack of cross-country study among economies to compare institutional and cultural factors in the relationship between IC and the quality of accounting information. The present study contemplates the analyses of cross-country phenomenon about IC’s effect on EQ among the firms from the selected countries in Asia. It reflects on the mediating role of financial performance and industry competition’s moderating role. This study investigates knowledge-based resources, financial performance, industry competition, and EQ, aiming to provide insight into their contribution to value creation.
This study extends the literature’s prior evidence, which showed a favorable and beneficial IC on EQ. These findings were used as a conjecture of this study
207Asia-Pacific Social Science Review | Vol. 21 No. 2 | June 2021
that knowledge-based resources induce the quality of financial reporting among Asian firms.
Hence, the following hypothesis was developed:
Hypothesis 1: IC has a positive and significant relation to EQ.
IC and Financial Performance IC exists in all organizations as a stock of
knowledge-based resources that an organization can use in its value creation process (Kianto et al., 2014). Inkinen (2015) noted that the interactions between IC and performance outcomes had been studied increasingly since the early 2000s. The empirical studies on IC have also pointed out that IC influences firm performance mainly through combinations and interactions of different IC dimensio (T. Kim T.et al., 2012). Findings from prior studies show a positive and significant relationship between IC and corporate performance (Tan et al., 2007; Inkinen, 2015; Ariff et al., 2016; Tsai & Mutuc, 2020; Xu & Liu, 2020). However, some studies found that IC has an adverse implication on firm performance (Cenciarelli et al., 2018; Holienka & Pilková, 2014). Also, insignificant findings were provided in the studies of Dženopoljac et al. (2016), Vazifehdoust et al. (2014), and Tran and Vo (2020). These findings provide evidence that there is an inconclusive result between IC and firm performance. Despite the relationship between IC and firm performance, this study contemplates the beneficial impact of IC on financial performance. Moreover, following Baron and Kenny’s (1986) causal steps approach, a significant relationship should exist between the independent and mediator variables. Hence, the following hypothesis was developed:
Hypothesis 2: IC has a positive and significant relation to financial performance.
Financial Performance and EQFirms with low accounting performance are one
of the requisites in manipulating earnings (Watts & Zimmerman, 1990). These firms are typically engaged in earnings management through some strategies such as window dressing, big bath charges, revenue recognition to report financial statements that show low EQ (Madhumathi & Ranganatham, 2011). This notion is supported by the study of Mutuc et al. (2019). Their study found that firms with lower firm performance
have higher engagement on earnings management, which shows low quality of reported earnings, whers Y. Kim Y.et al. (2012) found that higher firm performance leads to lower engagement on earnings management, which shows high-quality reported earnings. However, high financial performance can positively affect real-activities earnings management, an indication of the low-quality financial report (Mutuc et al., 2019).
This study utilizes accrual-based measures of EQ. Hence, this study conjectures that firms with better financial performance report high-quality earnings. Saleh et al. (2013) explained that financial statements are reported well when managers avoided accounting transaction manipulations. Furthermore, following Baron and Kenny’s (1986) causal steps approach, a significant relationship should exist between the mediator and dependent variables.
Consequently, the following hypothesis was developed:
Hypothesis 3: High financial performance has a positive and significant relation to EQ.
IC, Financial Performance, and EQThe past literature shows a significant relationship
between IC and financial performance and financial performance and EQ. The company’s knowledge-based resources make more excellent managerial capabilities, which has a direct impact on EQ (Demerjian et al., 2013). Molodchik et al. (2014) mentioned that one of the vital components of human capital and IC is management capabilities. Companies’ earnings would reveal the actual performance when managers will not manipulate accounting transactions and financial information (Saleh et al., 2013). Madhumathi and Ranganatham (2011) explained that firms with poor financial performance have greater expectations to be engaged in earnings manipulation, which shows low EQ.
Consequently, companies’ investment in IC generates better financial performance, which lessens the incentives for managers to manipulate earnings and report higher EQ. Hence, it is expected that IC has an impact on EQ through performance improvement. The study of Khajavi et al. (2016) explored the relationship between IC and its components and EQ among non-financial firms listed on the Tehran Stock Exchange. They found that IC and its components have a significant impact on EQ. Their study also considered
208 Asia-Pacific Social Science Review | Vol. 21 No. 2 | June 2021
the mediating effect of financial performance in the IC-EQ relationship. They revealed that IC and its components affect the quality of earnings through financial performance improvement.
Hence, the following hypothesis was developed:
Hypothesis 4: Financial performance mediates the relation of IC on EQ.
Industry Competition and EQIntangible resources are challenging to acquire,
replicate, accumulate, and be imitated by competitors (Barney, 2001). For instance, knowledge has become an essential and relevant factor of competitive advantage in the modern economy (Kianto et al., 2013; Khajavi et al., 2016). Hence, IC is essential for firms to be adept and advanced in the industry competition. Prior literature explains that industry competition positively impacts firm performance (Giroud & Mueller, 2010; Beiner et al., 2011). These studies noted that competition is essential in quality monitoring and providing better incentives for managers. Managers from intensely competitive industries have a limited ability to conceal bad news and are, therefore, induced to promptly recognize economic losses (Cheng et al., 2013). The degree of conservatism in accounting practices is high among firms with greater competition (Dhaliwal et al., 2008). However, the intense competition is used by managers in their voluntary disclosure decisions and reinforcement of the motives for disclosure (Cheng et al., 2013). The competition is beneficial to generate better financial performance;
however, firms with higher industry competition caused greater engagement in earnings manipulation (Datta et al., 2013).
Despite the disagreement, this study conjectures that industry competition can reinforce the effect between knowledge-based resources and the quality of financial reporting. Accordingly, this study hypothesizes that industry competition can strengthen the effects among IC and EQ.
Hence, the following hypothesis was developed:
Hypothesis 5: Industry competition enhances the positive relationship between IC and EQ.
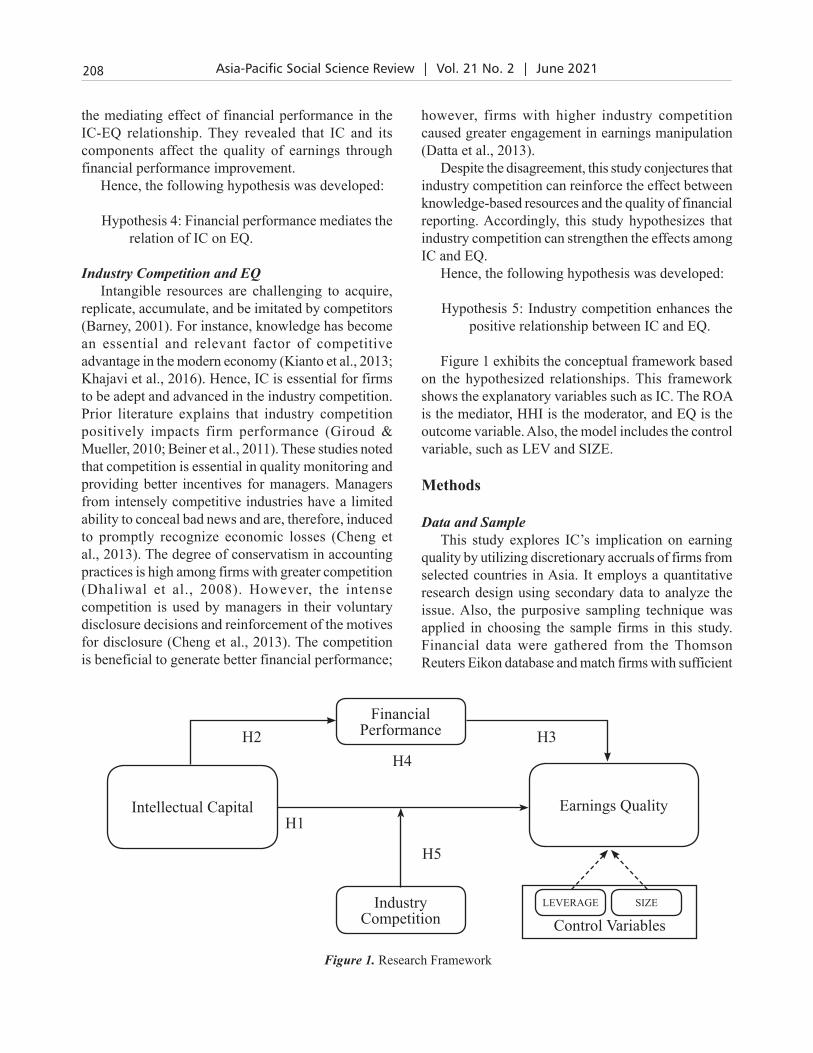
Figure 1 exhibits the conceptual framework based on the hypothesized relationships. This framework shows the explanatory variables such as IC. The ROA is the mediator, HHI is the moderator, and EQ is the outcome variable. Also, the model includes the control variable, such as LEV and SIZE.
Methods
Data and SampleThis study explores IC’s implication on earning
quality by utilizing discretionary accruals of firms from selected countries in Asia. It employs a quantitative research design using secondary data to analyze the issue. Also, the purposive sampling technique was applied in choosing the sample firms in this study. Financial data were gathered from the Thomson Reuters Eikon database and match firms with sufficient
Figure 1. Research Framework
Intellectual Capital Earnings Quality
Financial Performance
Industry Competition
LEVERAGE SIZE
Control Variables
H2
H1
H5
H3H4
209Asia-Pacific Social Science Review | Vol. 21 No. 2 | June 2021
data from firms to calculate VAIC and EQ. This study excluded 96 financial firms with 672 firm-year observations because of the accrual process’s different approach.
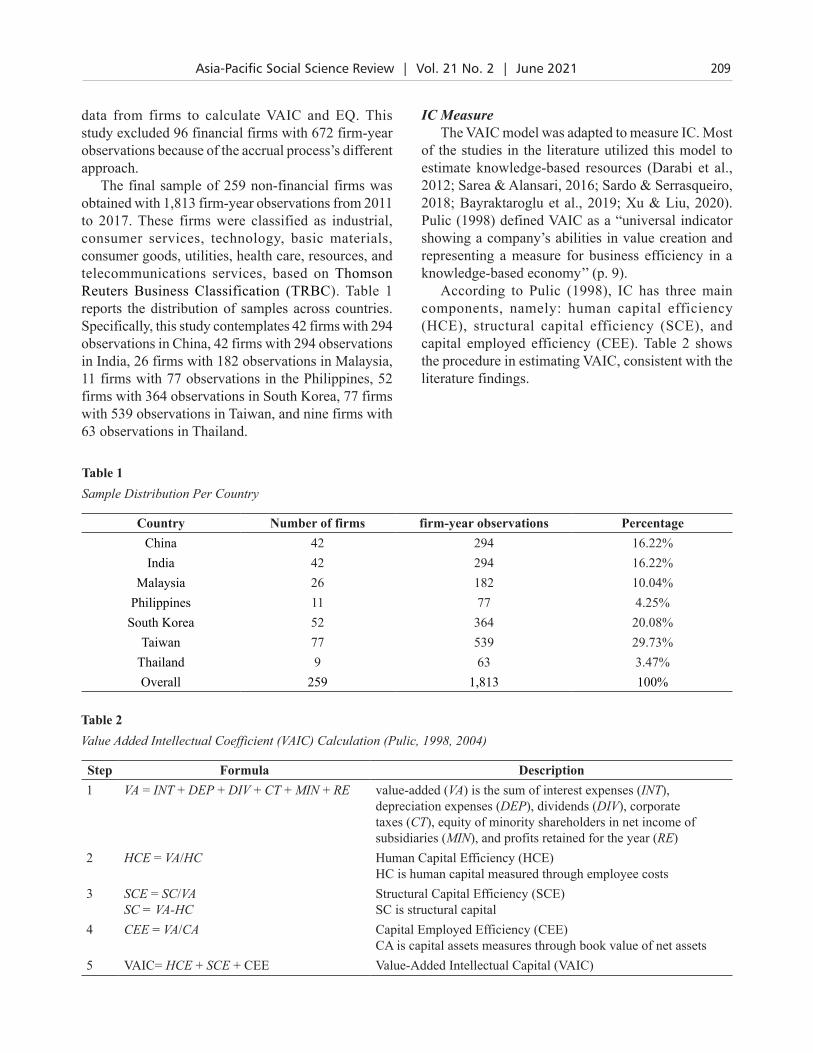
The final sample of 259 non-financial firms was obtained with 1,813 firm-year observations from 2011 to 2017. These firms were classified as industrial, consumer services, technology, basic materials, consumer goods, utilities, health care, resources, and telecommunications services, based on Thomson Reuters Business Classification (TRBC). Table 1 reports the distribution of samples across countries. Specifically, this study contemplates 42 firms with 294 observations in China, 42 firms with 294 observations in India, 26 firms with 182 observations in Malaysia, 11 firms with 77 observations in the Philippines, 52 firms with 364 observations in South Korea, 77 firms with 539 observations in Taiwan, and nine firms with 63 observations in Thailand.
IC MeasureThe VAIC model was adapted to measure IC. Most
of the studies in the literature utilized this model to estimate knowledge-based resources (Darabi et al., 2012; Sarea & Alansari, 2016; Sardo & Serrasqueiro, 2018; Bayraktaroglu et al., 2019; Xu & Liu, 2020). Pulic (1998) defined VAIC as a “universal indicator showing a company’s abilities in value creation and representing a measure for business efficiency in a knowledge-based economy’’ (p. 9).
According to Pulic (1998), IC has three main components, namely: human capital efficiency (HCE), structural capital efficiency (SCE), and capital employed efficiency (CEE). Table 2 shows the procedure in estimating VAIC, consistent with the literature findings.
Table 1Sample Distribution Per Country
Country Number of firms firm-year observations PercentageChina 42 294 16.22%India 42 294 16.22%
Malaysia 26 182 10.04%Philippines 11 77 4.25%
South Korea 52 364 20.08%Taiwan 77 539 29.73%
Thailand 9 63 3.47%Overall 259 1,813 100%
Table 2Value Added Intellectual Coefficient (VAIC) Calculation (Pulic, 1998, 2004)
Step Formula Description1 VA = INT + DEP + DIV + CT + MIN + RE value-added (VA) is the sum of interest expenses (INT),
depreciation expenses (DEP), dividends (DIV), corporate taxes (CT), equity of minority shareholders in net income of subsidiaries (MIN), and profits retained for the year (RE)
2 HCE = VA/HC Human Capital Efficiency (HCE)HC is human capital measured through employee costs
3 SCE = SC/VASC = VA-HC
Structural Capital Efficiency (SCE)SC is structural capital
4 CEE = VA/CA Capital Employed Efficiency (CEE)CA is capital assets measures through book value of net assets
5 VAIC= HCE + SCE + CEE Value-Added Intellectual Capital (VAIC)
210 Asia-Pacific Social Science Review | Vol. 21 No. 2 | June 2021
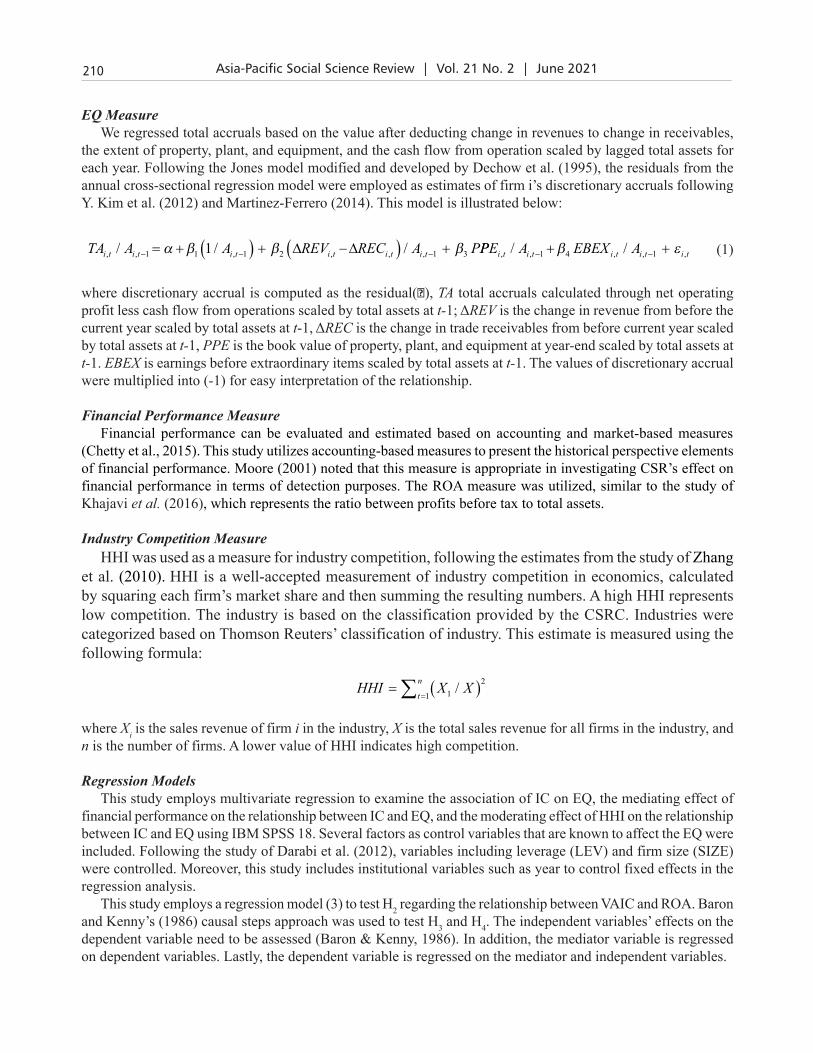
EQ MeasureWe regressed total accruals based on the value after deducting change in revenues to change in receivables,
the extent of property, plant, and equipment, and the cash flow from operation scaled by lagged total assets for each year. Following the Jones model modified and developed by Dechow et al. (1995), the residuals from the annual cross-sectional regression model were employed as estimates of firm i’s discretionary accruals following Y. Kim et al. (2012) and Martinez-Ferrero (2014). This model is illustrated below:
TA A A REV REC A Pi t i t i t i t i t i t, , , , , ,/ / /− − −= + ( ) + ∆ −∆( ) +1 1 1 2 1 31α β β β PPE A EBEX Ai t i t i t i t i t, , , , ,/ /− −+ +1 4 1β ε (1)
where discretionary accrual is computed as the residual(ɛ), TA total accruals calculated through net operating profit less cash flow from operations scaled by total assets at t-1; ΔREV is the change in revenue from before the current year scaled by total assets at t-1, ΔREC is the change in trade receivables from before current year scaled by total assets at t-1, PPE is the book value of property, plant, and equipment at year-end scaled by total assets at t-1. EBEX is earnings before extraordinary items scaled by total assets at t-1. The values of discretionary accrual were multiplied into (-1) for easy interpretation of the relationship.
Financial Performance Measure Financial performance can be evaluated and estimated based on accounting and market-based measures
(Chetty et al., 2015). This study utilizes accounting-based measures to present the historical perspective elements of financial performance. Moore (2001) noted that this measure is appropriate in investigating CSR’s effect on financial performance in terms of detection purposes. The ROA measure was utilized, similar to the study of Khajavi et al. (2016), which represents the ratio between profits before tax to total assets.
Industry Competition MeasureHHI was used as a measure for industry competition, following the estimates from the study of Zhang
et al. (2010). HHI is a well-accepted measurement of industry competition in economics, calculated by squaring each firm’s market share and then summing the resulting numbers. A high HHI represents low competition. The industry is based on the classification provided by the CSRC. Industries were categorized based on Thomson Reuters’ classification of industry. This estimate is measured using the following formula:
HHI X Xt
n= ( )=∑ 1
2
1/
where Xi is the sales revenue of firm i in the industry, X is the total sales revenue for all firms in the industry, and n is the number of firms. A lower value of HHI indicates high competition.
Regression ModelsThis study employs multivariate regression to examine the association of IC on EQ, the mediating effect of
financial performance on the relationship between IC and EQ, and the moderating effect of HHI on the relationship between IC and EQ using IBM SPSS 18. Several factors as control variables that are known to affect the EQ were included. Following the study of Darabi et al. (2012), variables including leverage (LEV) and firm size (SIZE) were controlled. Moreover, this study includes institutional variables such as year to control fixed effects in the regression analysis.
This study employs a regression model (3) to test H2 regarding the relationship between VAIC and ROA. Baron and Kenny’s (1986) causal steps approach was used to test H3 and H4. The independent variables’ effects on the dependent variable need to be assessed (Baron & Kenny, 1986). In addition, the mediator variable is regressed on dependent variables. Lastly, the dependent variable is regressed on the mediator and independent variables.
211Asia-Pacific Social Science Review | Vol. 21 No. 2 | June 2021
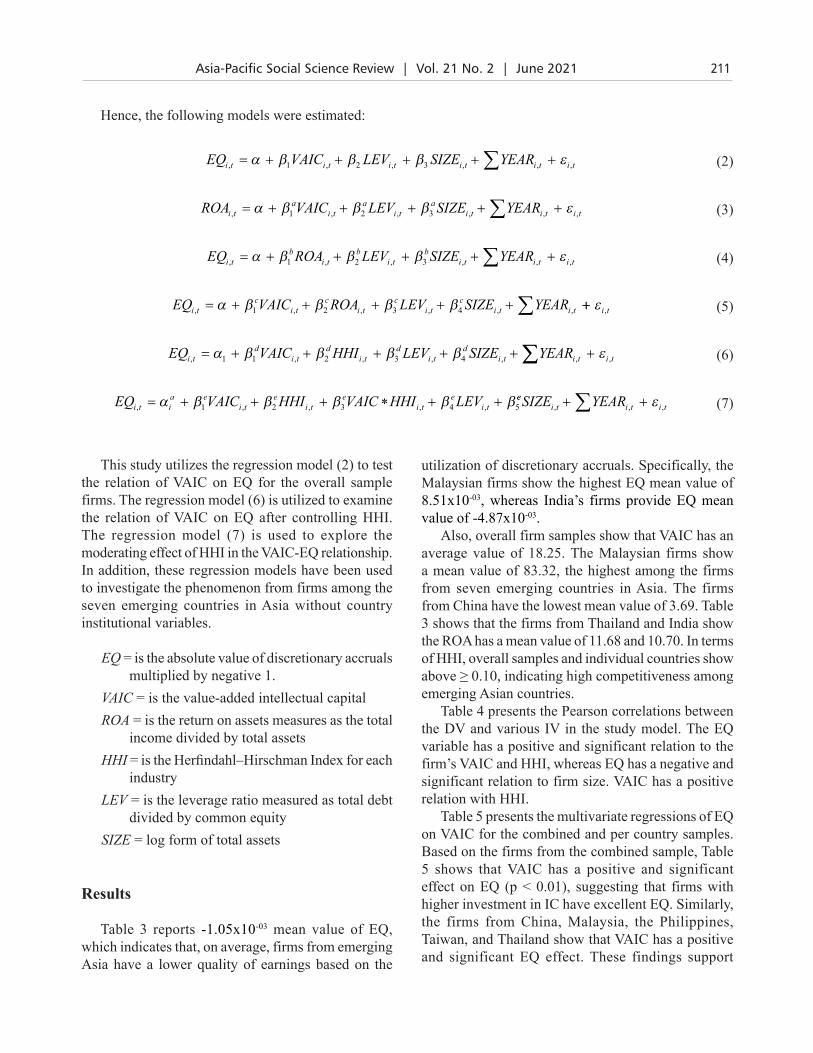
Hence, the following models were estimated:
EQ VAIC LEV SIZE YEARi t i t i t i t i t i t, , , , , ,= + + + + +∑α β β β ε1 2 3 (2)
ROA VAIC LEV SIZE YEARi ta
i ta
i ta
i t i t i t, , , , , ,= + + + + +∑α β β β ε1 2 3 (3)
EQ ROA LEV SIZE YEARi tb
i tb
i tb
i t i t i t, , , , , ,= + + + + +∑α β β β ε1 2 3 (4)
EQ VAIC ROA LEV SIZE YEARi tc
i tc
i tc
i tc
i t i t, , , , , ,= + + + + + ∑α β β β β1 2 3 4 ++ ε i t, (5)
EQ VAIC HHI LEV SIZE YEARi td
i td
i td
i td
i t i t, , , , , ,= + + + + +α β β β β1 1 2 3 4 ∑∑ + ε i t, (6)
EQ VAIC HHI VAIC HHI LEVi t ia e
i te
i te
i te
i t, , , , ,= + + + ∗ + +α β β β β β1 2 3 4 5ee
i t i t i tSIZE YEAR, , ,+ +∑ ε (7)
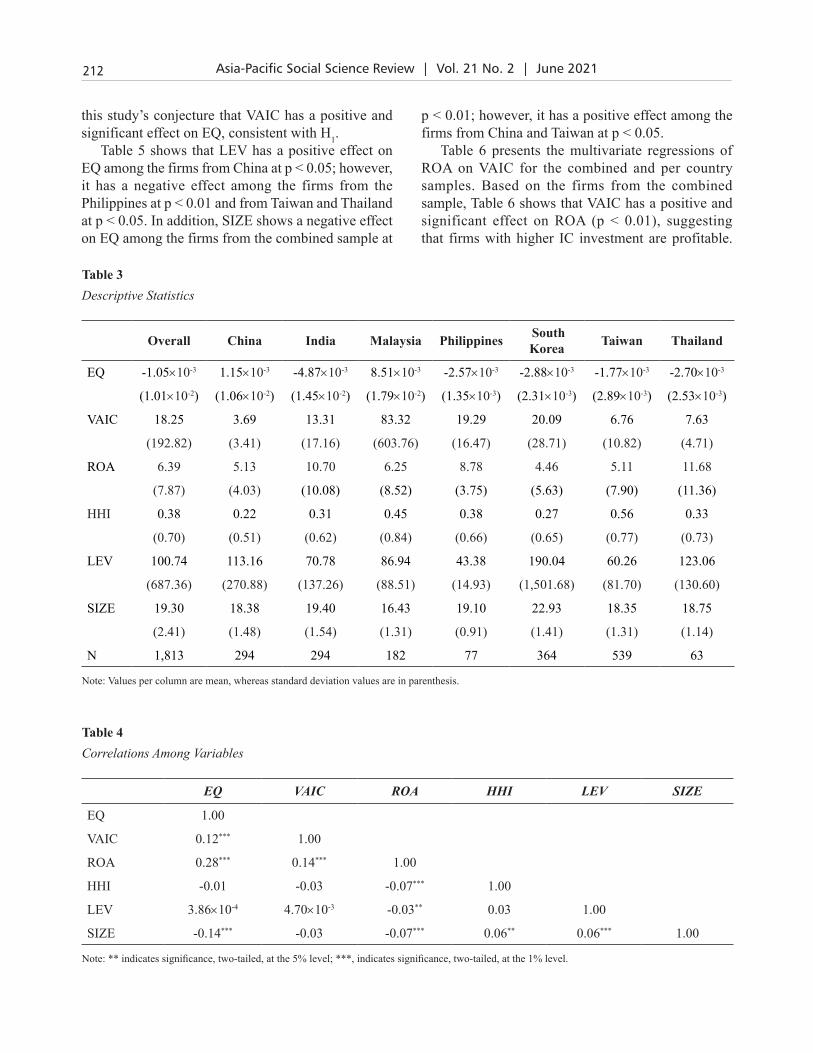
utilization of discretionary accruals. Specifically, the Malaysian firms show the highest EQ mean value of 8.51x10-03, whereas India’s firms provide EQ mean value of -4.87x10-03.
Also, overall firm samples show that VAIC has an average value of 18.25. The Malaysian firms show a mean value of 83.32, the highest among the firms from seven emerging countries in Asia. The firms from China have the lowest mean value of 3.69. Table 3 shows that the firms from Thailand and India show the ROA has a mean value of 11.68 and 10.70. In terms of HHI, overall samples and individual countries show above ≥ 0.10, indicating high competitiveness among emerging Asian countries.
Table 4 presents the Pearson correlations between the DV and various IV in the study model. The EQ variable has a positive and significant relation to the firm’s VAIC and HHI, whereas EQ has a negative and significant relation to firm size. VAIC has a positive relation with HHI.
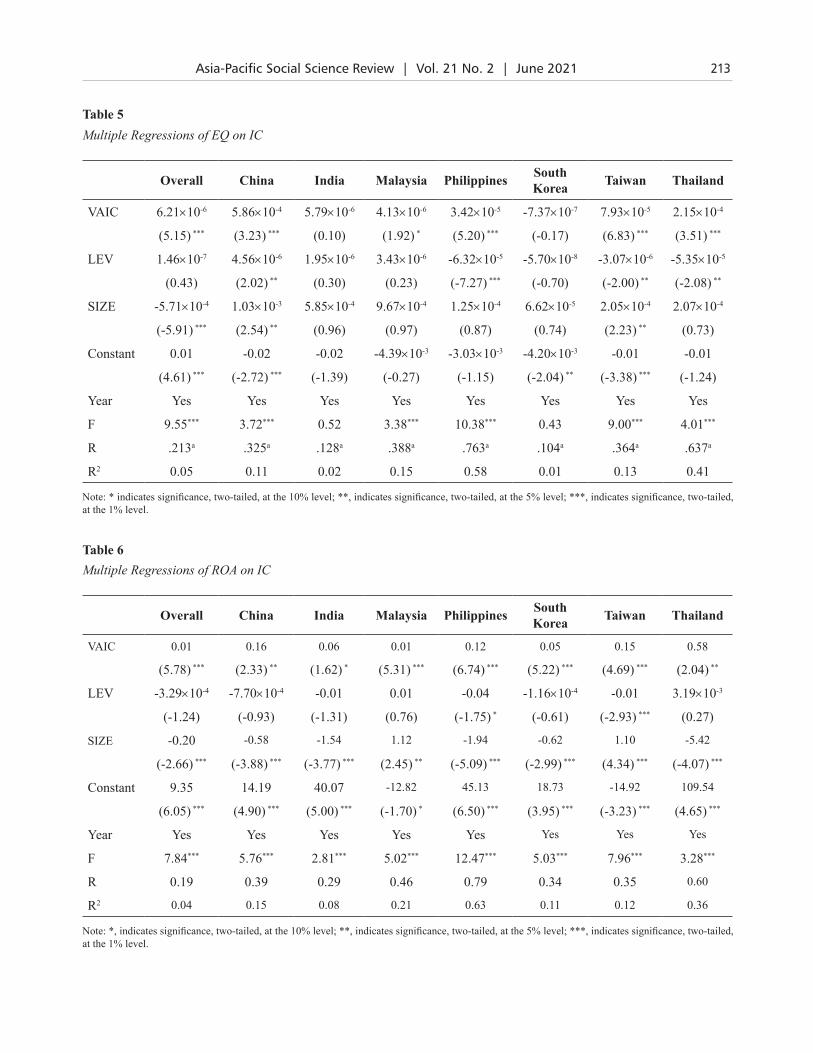
Table 5 presents the multivariate regressions of EQ on VAIC for the combined and per country samples. Based on the firms from the combined sample, Table 5 shows that VAIC has a positive and significant effect on EQ (p < 0.01), suggesting that firms with higher investment in IC have excellent EQ. Similarly, the firms from China, Malaysia, the Philippines, Taiwan, and Thailand show that VAIC has a positive and significant EQ effect. These findings support
This study utilizes the regression model (2) to test the relation of VAIC on EQ for the overall sample firms. The regression model (6) is utilized to examine the relation of VAIC on EQ after controlling HHI. The regression model (7) is used to explore the moderating effect of HHI in the VAIC-EQ relationship. In addition, these regression models have been used to investigate the phenomenon from firms among the seven emerging countries in Asia without country institutional variables.
EQ = is the absolute value of discretionary accruals multiplied by negative 1.
VAIC = is the value-added intellectual capitalROA = is the return on assets measures as the total
income divided by total assetsHHI = is the Herfindahl–Hirschman Index for each
industry LEV = is the leverage ratio measured as total debt
divided by common equity SIZE = log form of total assets
Results
Table 3 reports -1.05x10-03 mean value of EQ, which indicates that, on average, firms from emerging Asia have a lower quality of earnings based on the
212 Asia-Pacific Social Science Review | Vol. 21 No. 2 | June 2021
this study’s conjecture that VAIC has a positive and significant effect on EQ, consistent with H1.
Table 5 shows that LEV has a positive effect on EQ among the firms from China at p < 0.05; however, it has a negative effect among the firms from the Philippines at p < 0.01 and from Taiwan and Thailand at p < 0.05. In addition, SIZE shows a negative effect on EQ among the firms from the combined sample at
p < 0.01; however, it has a positive effect among the firms from China and Taiwan at p < 0.05.
Table 6 presents the multivariate regressions of ROA on VAIC for the combined and per country samples. Based on the firms from the combined sample, Table 6 shows that VAIC has a positive and significant effect on ROA (p < 0.01), suggesting that firms with higher IC investment are profitable.
Table 3Descriptive Statistics
Overall China India Malaysia Philippines South Korea Taiwan Thailand
EQ -1.05×10⁻³ 1.15×10⁻³ -4.87×10⁻³ 8.51×10⁻³ -2.57×10⁻³ -2.88×10⁻³ -1.77×10⁻³ -2.70×10⁻³
(1.01×10⁻²) (1.06×10⁻²) (1.45×10⁻²) (1.79×10⁻²) (1.35×10⁻³) (2.31×10⁻³) (2.89×10⁻³) (2.53×10⁻³)
VAIC 18.25 3.69 13.31 83.32 19.29 20.09 6.76 7.63
(192.82) (3.41) (17.16) (603.76) (16.47) (28.71) (10.82) (4.71)
ROA 6.39 5.13 10.70 6.25 8.78 4.46 5.11 11.68
(7.87) (4.03) (10.08) (8.52) (3.75) (5.63) (7.90) (11.36)
HHI 0.38 0.22 0.31 0.45 0.38 0.27 0.56 0.33
(0.70) (0.51) (0.62) (0.84) (0.66) (0.65) (0.77) (0.73)
LEV 100.74 113.16 70.78 86.94 43.38 190.04 60.26 123.06
(687.36) (270.88) (137.26) (88.51) (14.93) (1,501.68) (81.70) (130.60)
SIZE 19.30 18.38 19.40 16.43 19.10 22.93 18.35 18.75
(2.41) (1.48) (1.54) (1.31) (0.91) (1.41) (1.31) (1.14)
N 1,813 294 294 182 77 364 539 63
Note: Values per column are mean, whereas standard deviation values are in parenthesis.
Table 4Correlations Among Variables
EQ VAIC ROA HHI LEV SIZE
EQ 1.00
VAIC 0.12*** 1.00
ROA 0.28*** 0.14*** 1.00
HHI -0.01 -0.03 -0.07*** 1.00
LEV 3.86×10⁻⁴ 4.70×10⁻³ -0.03** 0.03 1.00
SIZE -0.14*** -0.03 -0.07*** 0.06** 0.06*** 1.00
Note: ** indicates significance, two-tailed, at the 5% level; ***, indicates significance, two-tailed, at the 1% level.
213Asia-Pacific Social Science Review | Vol. 21 No. 2 | June 2021
Table 5Multiple Regressions of EQ on IC
Overall China India Malaysia Philippines South Korea Taiwan Thailand
VAIC 6.21×10⁻⁶ 5.86×10⁻⁴ 5.79×10⁻⁶ 4.13×10⁻⁶ 3.42×10⁻⁵ -7.37×10⁻⁷ 7.93×10⁻⁵ 2.15×10⁻⁴
(5.15) *** (3.23) *** (0.10) (1.92) * (5.20) *** (-0.17) (6.83) *** (3.51) ***
LEV 1.46×10⁻⁷ 4.56×10⁻⁶ 1.95×10⁻⁶ 3.43×10⁻⁶ -6.32×10⁻⁵ -5.70×10⁻⁸ -3.07×10⁻⁶ -5.35×10⁻⁵
(0.43) (2.02) ** (0.30) (0.23) (-7.27) *** (-0.70) (-2.00) ** (-2.08) **
SIZE -5.71×10⁻⁴ 1.03×10⁻³ 5.85×10⁻⁴ 9.67×10⁻⁴ 1.25×10⁻⁴ 6.62×10⁻⁵ 2.05×10⁻⁴ 2.07×10⁻⁴
(-5.91) *** (2.54) ** (0.96) (0.97) (0.87) (0.74) (2.23) ** (0.73)
Constant 0.01 -0.02 -0.02 -4.39×10⁻³ -3.03×10⁻³ -4.20×10⁻³ -0.01 -0.01
(4.61) *** (-2.72) *** (-1.39) (-0.27) (-1.15) (-2.04) ** (-3.38) *** (-1.24)
Year Yes Yes Yes Yes Yes Yes Yes Yes
F 9.55*** 3.72*** 0.52 3.38*** 10.38*** 0.43 9.00*** 4.01***
R .213a .325a .128a .388a .763a .104a .364a .637a
R2 0.05 0.11 0.02 0.15 0.58 0.01 0.13 0.41
Note: * indicates significance, two-tailed, at the 10% level; **, indicates significance, two-tailed, at the 5% level; ***, indicates significance, two-tailed, at the 1% level.
Table 6Multiple Regressions of ROA on IC
Overall China India Malaysia Philippines South Korea Taiwan Thailand
VAIC 0.01 0.16 0.06 0.01 0.12 0.05 0.15 0.58
(5.78) *** (2.33) ** (1.62) * (5.31) *** (6.74) *** (5.22) *** (4.69) *** (2.04) **
LEV -3.29×10⁻⁴ -7.70×10⁻⁴ -0.01 0.01 -0.04 -1.16×10⁻⁴ -0.01 3.19×10⁻³
(-1.24) (-0.93) (-1.31) (0.76) (-1.75) * (-0.61) (-2.93) *** (0.27)
SIZE -0.20 -0.58 -1.54 1.12 -1.94 -0.62 1.10 -5.42
(-2.66) *** (-3.88) *** (-3.77) *** (2.45) ** (-5.09) *** (-2.99) *** (4.34) *** (-4.07) ***
Constant 9.35 14.19 40.07 -12.82 45.13 18.73 -14.92 109.54
(6.05) *** (4.90) *** (5.00) *** (-1.70) * (6.50) *** (3.95) *** (-3.23) *** (4.65) ***
Year Yes Yes Yes Yes Yes Yes Yes Yes
F 7.84*** 5.76*** 2.81*** 5.02*** 12.47*** 5.03*** 7.96*** 3.28***
R 0.19 0.39 0.29 0.46 0.79 0.34 0.35 0.60
R2 0.04 0.15 0.08 0.21 0.63 0.11 0.12 0.36
Note: *, indicates significance, two-tailed, at the 10% level; **, indicates significance, two-tailed, at the 5% level; ***, indicates significance, two-tailed, at the 1% level.
214 Asia-Pacific Social Science Review | Vol. 21 No. 2 | June 2021
Similarly, VAIC has a positive effect on ROA over the firms from Malaysia, the Philippines, South Korea, Taiwan at p < 0.01, China, Thailand at p < 0.05, and India at p < 0.10. These findings support this study’s conjecture that VAIC has a positive and significant effect on ROA, consistent with H2.
These findings reveal that investment in knowledge-based resources generates high financial performance. In terms of control variables, Table 6 shows that LEV has adverse effects on ROA among the firms from Taiwan at p < 0.01 and the Philippines at p < 0.10. The firms from the combined sample from China, India, the Philippines, South Korea, and Thailand show that SIZE has adverse effects on ROA (p < 0.01); however, it has a positive effect on Malaysia and Taiwan.
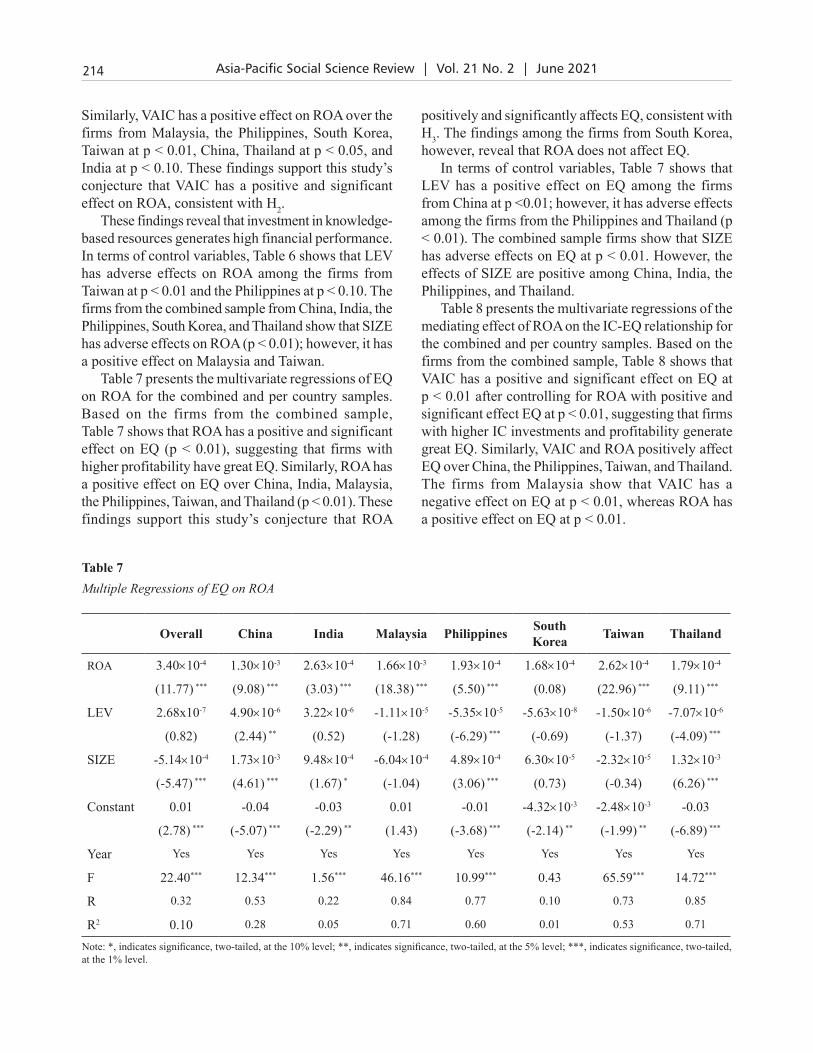
Table 7 presents the multivariate regressions of EQ on ROA for the combined and per country samples. Based on the firms from the combined sample, Table 7 shows that ROA has a positive and significant effect on EQ (p < 0.01), suggesting that firms with higher profitability have great EQ. Similarly, ROA has a positive effect on EQ over China, India, Malaysia, the Philippines, Taiwan, and Thailand (p < 0.01). These findings support this study’s conjecture that ROA
positively and significantly affects EQ, consistent with H3. The findings among the firms from South Korea, however, reveal that ROA does not affect EQ.
In terms of control variables, Table 7 shows that LEV has a positive effect on EQ among the firms from China at p <0.01; however, it has adverse effects among the firms from the Philippines and Thailand (p < 0.01). The combined sample firms show that SIZE has adverse effects on EQ at p < 0.01. However, the effects of SIZE are positive among China, India, the Philippines, and Thailand.
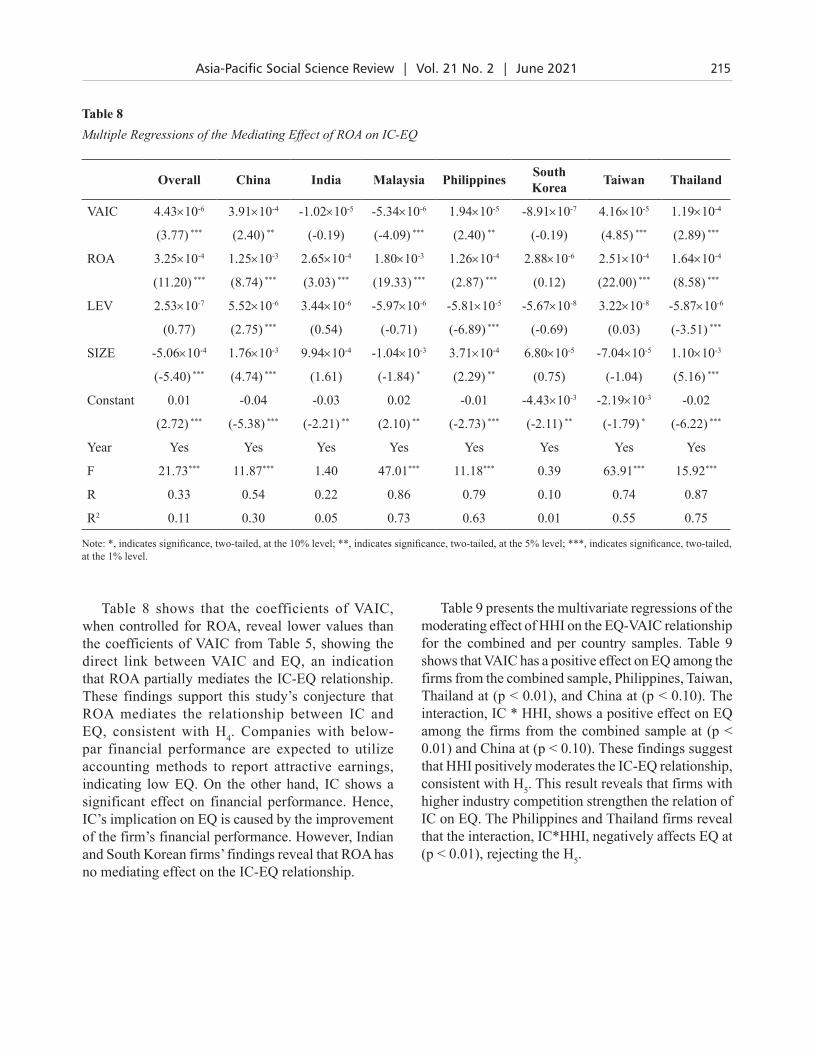
Table 8 presents the multivariate regressions of the mediating effect of ROA on the IC-EQ relationship for the combined and per country samples. Based on the firms from the combined sample, Table 8 shows that VAIC has a positive and significant effect on EQ at p < 0.01 after controlling for ROA with positive and significant effect EQ at p < 0.01, suggesting that firms with higher IC investments and profitability generate great EQ. Similarly, VAIC and ROA positively affect EQ over China, the Philippines, Taiwan, and Thailand. The firms from Malaysia show that VAIC has a negative effect on EQ at p < 0.01, whereas ROA has a positive effect on EQ at p < 0.01.
Table 7Multiple Regressions of EQ on ROA
Overall China India Malaysia Philippines South Korea Taiwan Thailand
ROA 3.40×10⁻⁴ 1.30×10⁻³ 2.63×10⁻⁴ 1.66×10⁻³ 1.93×10⁻⁴ 1.68×10⁻⁴ 2.62×10⁻⁴ 1.79×10⁻⁴
(11.77) *** (9.08) *** (3.03) *** (18.38) *** (5.50) *** (0.08) (22.96) *** (9.11) ***
LEV 2.68x10⁻⁷ 4.90×10⁻⁶ 3.22×10⁻⁶ -1.11×10⁻⁵ -5.35×10⁻⁵ -5.63×10⁻⁸ -1.50×10⁻⁶ -7.07×10⁻⁶
(0.82) (2.44) ** (0.52) (-1.28) (-6.29) *** (-0.69) (-1.37) (-4.09) ***
SIZE -5.14×10⁻⁴ 1.73×10⁻³ 9.48×10⁻⁴ -6.04×10⁻⁴ 4.89×10⁻⁴ 6.30×10⁻⁵ -2.32×10⁻⁵ 1.32×10⁻³
(-5.47) *** (4.61) *** (1.67) * (-1.04) (3.06) *** (0.73) (-0.34) (6.26) ***
Constant 0.01 -0.04 -0.03 0.01 -0.01 -4.32×10⁻³ -2.48×10⁻³ -0.03
(2.78) *** (-5.07) *** (-2.29) ** (1.43) (-3.68) *** (-2.14) ** (-1.99) ** (-6.89) ***
Year Yes Yes Yes Yes Yes Yes Yes Yes
F 22.40*** 12.34*** 1.56*** 46.16*** 10.99*** 0.43 65.59*** 14.72***
R 0.32 0.53 0.22 0.84 0.77 0.10 0.73 0.85
R2 0.10 0.28 0.05 0.71 0.60 0.01 0.53 0.71
Note: *, indicates significance, two-tailed, at the 10% level; **, indicates significance, two-tailed, at the 5% level; ***, indicates significance, two-tailed, at the 1% level.
215Asia-Pacific Social Science Review | Vol. 21 No. 2 | June 2021
Table 8 shows that the coefficients of VAIC, when controlled for ROA, reveal lower values than the coefficients of VAIC from Table 5, showing the direct link between VAIC and EQ, an indication that ROA partially mediates the IC-EQ relationship. These findings support this study’s conjecture that ROA mediates the relationship between IC and EQ, consistent with H4. Companies with below-par financial performance are expected to utilize accounting methods to report attractive earnings, indicating low EQ. On the other hand, IC shows a significant effect on financial performance. Hence, IC’s implication on EQ is caused by the improvement of the firm’s financial performance. However, Indian and South Korean firms’ findings reveal that ROA has no mediating effect on the IC-EQ relationship.
Table 8Multiple Regressions of the Mediating Effect of ROA on IC-EQ
Overall China India Malaysia Philippines South Korea Taiwan Thailand
VAIC 4.43×10⁻⁶ 3.91×10⁻⁴ -1.02×10⁻⁵ -5.34×10⁻⁶ 1.94×10⁻⁵ -8.91×10⁻⁷ 4.16×10⁻⁵ 1.19×10⁻⁴
(3.77) *** (2.40) ** (-0.19) (-4.09) *** (2.40) ** (-0.19) (4.85) *** (2.89) ***
ROA 3.25×10⁻⁴ 1.25×10⁻³ 2.65×10⁻⁴ 1.80×10⁻³ 1.26×10⁻⁴ 2.88×10⁻⁶ 2.51×10⁻⁴ 1.64×10⁻⁴
(11.20) *** (8.74) *** (3.03) *** (19.33) *** (2.87) *** (0.12) (22.00) *** (8.58) ***
LEV 2.53×10⁻⁷ 5.52×10⁻⁶ 3.44×10⁻⁶ -5.97×10⁻⁶ -5.81×10⁻⁵ -5.67×10⁻⁸ 3.22×10⁻⁸ -5.87×10⁻⁶
(0.77) (2.75) *** (0.54) (-0.71) (-6.89) *** (-0.69) (0.03) (-3.51) ***
SIZE -5.06×10⁻⁴ 1.76×10⁻³ 9.94×10⁻⁴ -1.04×10⁻³ 3.71×10⁻⁴ 6.80×10⁻⁵ -7.04×10⁻⁵ 1.10×10⁻³
(-5.40) *** (4.74) *** (1.61) (-1.84) * (2.29) ** (0.75) (-1.04) (5.16) ***
Constant 0.01 -0.04 -0.03 0.02 -0.01 -4.43×10⁻³ -2.19×10⁻³ -0.02
(2.72) *** (-5.38) *** (-2.21) ** (2.10) ** (-2.73) *** (-2.11) ** (-1.79) * (-6.22) ***
Year Yes Yes Yes Yes Yes Yes Yes Yes
F 21.73*** 11.87*** 1.40 47.01*** 11.18*** 0.39 63.91*** 15.92***
R 0.33 0.54 0.22 0.86 0.79 0.10 0.74 0.87
R2 0.11 0.30 0.05 0.73 0.63 0.01 0.55 0.75
Note: *, indicates significance, two-tailed, at the 10% level; **, indicates significance, two-tailed, at the 5% level; ***, indicates significance, two-tailed, at the 1% level.
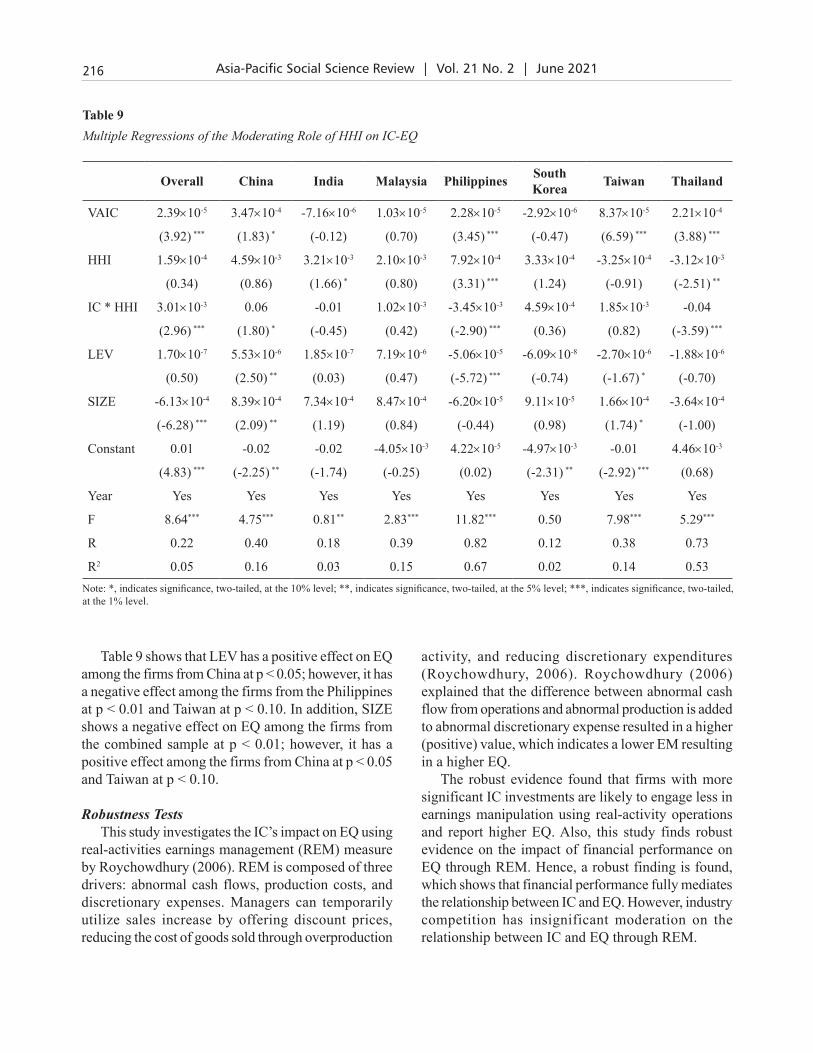
Table 9 presents the multivariate regressions of the moderating effect of HHI on the EQ-VAIC relationship for the combined and per country samples. Table 9 shows that VAIC has a positive effect on EQ among the firms from the combined sample, Philippines, Taiwan, Thailand at (p < 0.01), and China at (p < 0.10). The interaction, IC * HHI, shows a positive effect on EQ among the firms from the combined sample at (p < 0.01) and China at (p < 0.10). These findings suggest that HHI positively moderates the IC-EQ relationship, consistent with H5. This result reveals that firms with higher industry competition strengthen the relation of IC on EQ. The Philippines and Thailand firms reveal that the interaction, IC*HHI, negatively affects EQ at (p < 0.01), rejecting the H5.
216 Asia-Pacific Social Science Review | Vol. 21 No. 2 | June 2021
Table 9 shows that LEV has a positive effect on EQ among the firms from China at p < 0.05; however, it has a negative effect among the firms from the Philippines at p < 0.01 and Taiwan at p < 0.10. In addition, SIZE shows a negative effect on EQ among the firms from the combined sample at p < 0.01; however, it has a positive effect among the firms from China at p < 0.05 and Taiwan at p < 0.10.
Robustness TestsThis study investigates the IC’s impact on EQ using
real-activities earnings management (REM) measure by Roychowdhury (2006). REM is composed of three drivers: abnormal cash flows, production costs, and discretionary expenses. Managers can temporarily utilize sales increase by offering discount prices, reducing the cost of goods sold through overproduction
activity, and reducing discretionary expenditures (Roychowdhury, 2006). Roychowdhury (2006) explained that the difference between abnormal cash flow from operations and abnormal production is added to abnormal discretionary expense resulted in a higher (positive) value, which indicates a lower EM resulting in a higher EQ.
The robust evidence found that firms with more significant IC investments are likely to engage less in earnings manipulation using real-activity operations and report higher EQ. Also, this study finds robust evidence on the impact of financial performance on EQ through REM. Hence, a robust finding is found, which shows that financial performance fully mediates the relationship between IC and EQ. However, industry competition has insignificant moderation on the relationship between IC and EQ through REM.
Table 9Multiple Regressions of the Moderating Role of HHI on IC-EQ
Overall China India Malaysia Philippines South Korea Taiwan Thailand
VAIC 2.39×10⁻⁵ 3.47×10⁻⁴ -7.16×10⁻⁶ 1.03×10⁻⁵ 2.28×10⁻⁵ -2.92×10⁻⁶ 8.37×10⁻⁵ 2.21×10⁻⁴
(3.92) *** (1.83) * (-0.12) (0.70) (3.45) *** (-0.47) (6.59) *** (3.88) ***
HHI 1.59×10⁻⁴ 4.59×10⁻³ 3.21×10⁻³ 2.10×10⁻³ 7.92×10⁻⁴ 3.33×10⁻⁴ -3.25×10⁻⁴ -3.12×10⁻³
(0.34) (0.86) (1.66) * (0.80) (3.31) *** (1.24) (-0.91) (-2.51) **
IC * HHI 3.01×10⁻³ 0.06 -0.01 1.02×10⁻³ -3.45×10⁻³ 4.59×10⁻⁴ 1.85×10⁻³ -0.04
(2.96) *** (1.80) * (-0.45) (0.42) (-2.90) *** (0.36) (0.82) (-3.59) ***
LEV 1.70×10⁻⁷ 5.53×10⁻⁶ 1.85×10⁻⁷ 7.19×10⁻⁶ -5.06×10⁻⁵ -6.09×10⁻⁸ -2.70×10⁻⁶ -1.88×10⁻⁶
(0.50) (2.50) ** (0.03) (0.47) (-5.72) *** (-0.74) (-1.67) * (-0.70)
SIZE -6.13×10⁻⁴ 8.39×10⁻⁴ 7.34×10⁻⁴ 8.47×10⁻⁴ -6.20×10⁻⁵ 9.11×10⁻⁵ 1.66×10⁻⁴ -3.64×10⁻⁴
(-6.28) *** (2.09) ** (1.19) (0.84) (-0.44) (0.98) (1.74) * (-1.00)
Constant 0.01 -0.02 -0.02 -4.05×10⁻³ 4.22×10⁻⁵ -4.97×10⁻³ -0.01 4.46×10⁻³
(4.83) *** (-2.25) ** (-1.74) (-0.25) (0.02) (-2.31) ** (-2.92) *** (0.68)
Year Yes Yes Yes Yes Yes Yes Yes Yes
F 8.64*** 4.75*** 0.81** 2.83*** 11.82*** 0.50 7.98*** 5.29***
R 0.22 0.40 0.18 0.39 0.82 0.12 0.38 0.73
R2 0.05 0.16 0.03 0.15 0.67 0.02 0.14 0.53Note: *, indicates significance, two-tailed, at the 10% level; **, indicates significance, two-tailed, at the 5% level; ***, indicates significance, two-tailed, at the 1% level.
217Asia-Pacific Social Science Review | Vol. 21 No. 2 | June 2021
Discussion
This study found that IC significantly affects EQ among the firms from the combined sample from China, the Philippines, Taiwan, and Thailand. These findings indicate that knowledge-based resources cause a more excellent quality of financial reports. Hence, the study findings are consistent with accounting literature, an indication that a high level of IC is expected to induce a higher level of EQ among listed firms in Asia, including China, Malaysia, the Philippines, Taiwan, and Thailand. These results are in line with the conjecture of prior studies that IC has a favorable impact on EQ, suggesting that internal organizational resources and capabilities generate a higher quality of financial output (Sarea & Alansari, 2016; Darabi et al., 2012; Azizi et al., 2013; Zanjirdar & Chogha, 2012; Mojtahedi, 2013; Nuryaman et al., 2019). These mixed pieces of evidence show that significant and insignificant findings can be associated with heterogeneity features of developing economies. These economies have different economic, social, and cultural contexts, which explain why it is often impractical to extrapolate the findings obtained from one developing country to another (Dzhioev & Gurieva, 2020).
This study also found that the firms from China, the Philippines, Taiwan, and Thailand reveal that financial performance partially mediates the relation of IC on EQ, similar to the evidence provided in the study of Khajavi et al. (2016). Firms from these countries with below-par financial performance are expected to utilize accounting methods to report attractive earnings, indicating low EQ. On the other hand, IC shows a significant effect on financial performance. Hence, IC’s implication on EQ is caused by the improvement of the firm’s financial performance. The present study was administered to investigate this notion in selected firms from selected Asian economies empirically.
Moreover, this study revealed that industry competition reinforces a change in the relation of IC on EQ. Specifically, the combined sample and China firms show that industry competition positively moderates the IC-EQ relationship. These findings suggest that higher investment in knowledge-based resources and intense industry competition cause high financial reports. Specifically, firms with higher industry competition strengthen the relation of IC on EQ. Companies from these economies show that knowledge-based resources
with intense industry competition are conservative to engage in earnings manipulation (Dhaliwal et al., 2008; Cheng et al., 2013). Based on the findings from the combined sample, firms from developing countries must increase their competitiveness and invest in IC to achieve a greater quality of financial reports. On the other hand, the Philippines and Thailand firms show that industry competition negatively moderates the IC-EQ relationship. These findings suggest that higher investment in knowledge-based resources and intense industry competition cause lower financial reports quality. IC generates a competitive advantage among these firms; however, intense industry competition causes greater earnings manipulation engagement (Datta et al., 2013).
The present study provides finding that can cognizance the phenomenon among knowledge-based resources and managerial practices for value creation. Theoretically, this study contributes to the existing body of knowledge based on the resource-based and stakeholder theories. It is one of the various studies about IC and organizational performance in the form of EQ. This study presents a pioneering work on the empirical investigation of IC’s impact on EQ and the integration of financial performance and industry competition to explain the phenomenon. Most of the literature about IC is focused on its impact on firm performance; however, the exploration of its impact on the quality of the financial reports showing this performance is limited. By integrating financial performance and industry competition, this study contributes to the wide dispersion of IC’s importance in its effect on profitability and its relevance in managerial practices.
In addition, this study provides evidence in the context of Asian economies. The relevance and essence of IC in value creation and EQ issues were majority investigated in the Western context. There were studies in Asia and the Pacific, but only a few have contemplated cross-country study among economies to compare institutional and cultural factors in the relationship between IC and the quality of accounting information. This study reflects on the emerging Asian economies, which are composed of under-researched markets with lag on market development and the institutional environment. Moreover, it stipulates the relevance and essence of the investigation of the relation of IC on EQ of firms in emerging economies with other cultural, national, and market aspects.
218 Asia-Pacific Social Science Review | Vol. 21 No. 2 | June 2021
Practically, the findings of this study can be used in the firms’ decision-making process. The firm’s decision-makers should contemplate that IC investments have relevant importance to achieving a competitive advantage and better financial performance. These outcomes are reflected in the means of the quality of financial reports reported by companies. The evidence would set a relevant and essential factor to attract investors and create a positive image for other stakeholders, especially in emerging Asian countries. Policymakers should encourage the firms to fully disclose physical assets and IC in financial statements to determine their actual value.
This study acknowledges that VAIC, as a measure of IC, has some limitations. VAIC is not a monetary term that determines the value of the firm’s IC. Nevertheless, it is an indicator of the firm’s efficiency in employing its resources and creating value (Sarea & Alansari, 2016). Hence, VAIC is a compatible factor in determining financial performance and EQ. It is recommended that future research reflect on the modified VAIC measures, which include relational capital. This notion might lead to the inclusive social interaction from the human and structural components of VAIC. In addition, this study contemplates the accrual-based estimates of EQ. Future research may contemplate the other measures of EQ to analyze the phenomenon in different measures.
Moreover, the methodology employed to analyze the phenomenon can be extended by utilizing structural equation modeling (SEM) in testing the hypotheses. Furthermore, this study utilizes financial performance and industry competition to furtherly explain the phenomenon. Future studies may incorporate some more robust consequences of organizational performance and other boundary conditions in examining the implications of knowledge-based resources, financial performance, industry competition, and managerial practices.
Declaration of ownership:
This report is my original work.
Conflict of interest:
None.
Ethical clearance:
This study was approved by my institution.
References
Ardi, S., & Murwaningsari, E. (2018). Financial performance determination, earnings quality, intellectual capital and company value. South East Asia Journal of Contemporary Business, Economics and Law, 15(5), 1–16.
Ariff, A. H. M., Islam, A., & van Zijl, T. (2016). Intellectual capital and market performance: The case of multinational R&D firms in the US. The Journal of Developing Areas, 50(5), 487–495. https://doi.org/10.1353/jda.2016.0052
Azizi, A., Davoudi, H., & Farrahani, M. S. (2013). Investigating the relationship between intellectual capital and earnings quality in Tehran Stock Exchange (TSE). Australian Journal of Basic and Applied Sciences, 7(2), 825–837.
Barney, J. B. (2001). Resource-based theories of competitive advantage: A ten-year retrospective on the resource-based view. Journal of Management, 27(6), 643–650. https://doi.org/10.1177%2F014920630102700602
Baron, R. M., & Kenny, D. A. (1986). The moderator-mediator variable distinction in social psychological research: Conceptual, strategic, and statistical considerations. Journal of Personality and Social Psychology, 51(6), 1173–1182.
Bayraktaroglu, A. E., Calisir, F., & Baskak, M. (2019). Intellectual capital and firm performance: An extended VAIC model. Journal of Intellectual Capital, 20(3), 406–425. https://doi.org/10.1108/JIC-12-2017-0184
Beiner, S., Schmid, M. M., & Wanzenried, G. (2011). Product market competition, managerial incentives, and firm valuation. European Financial Management, 17(2), 331–366. https://doi.org/10.1111/j.1468-036X.2009.00505.x
Bontis, N. (1998). Intellectual capital: An exploratory s tudy tha t develops measures and models . Management Decision, 36(2), 63–76. https://doi.org/10.1108/00251749810204142
Bontis, N., Ciambotti, M., Palazzi, F., & Sgro, F. (2018). Intellectual capital and financial performance in social cooperative enterprises. Journal of Intellectual Capital, 19(4), 712–731. https://doi.org/10.1108/JIC-03-2017-0049
Bozzolan, S., Fabrizi, M., Mallin, C. A., & Michelon, G. (2015). Corporate social responsibility and earnings quality: International evidence. The International Journal of Accounting, 50(4), 361–396. https://doi.org/10.1016/j.intacc.2015.10.003
Caruso, G. D., Ferrari, E. R., & Pisano, V. (2016). Earnings management and goodwill impairment: An empirical
219Asia-Pacific Social Science Review | Vol. 21 No. 2 | June 2021
analysis in the Italian M & A context. Journal of Intellectual Capital, 17(1), 120–147. http://dx.doi.org/10.1108/JIC-09-2015-0081
Cenciarelli, V. G., Greco, G., & Allegrini, M. (2018). Does intellectual capital help predict bankruptcy? Journal of Intellectual Capital, 19(2), 321–337. https://doi.org/10.1108/JIC-03-2017-0047
Cheng, P., Man, P., & Yi, C. H. (2013). The impact of product market competition on earnings quality. Accounting & Finance, 53(1), 137–162. https://doi.org/10.1111/j.1467-629X.2011.00457.x
Chetty, S., Naidoo, R., & Seetharam, Y. (2015). The impact of corporate social responsibility on firms’ financial performance in South Africa. Contemporary Economics, 9(2), 193–214. http://dx.doi.org/10.5709/ce.1897-9254.167
Chowdhury, L. A. M., Rana, T., & Azim, M. I. (2019). Intellectual capital efficiency and organisational performance. Journal of Intellectual Capital, 20(6), 784–806. https://doi.org/10.1108/JIC-10-2018-0171
Conner, K. R., & Prahalad, C. K. (1996). A resource-based theory of the firm: Knowledge versus opportunism. Organization Science, 7(5), 477–501. https://doi.org/10.1287/orsc.7.5.477
Darabi, R., Rad, S. K., & Ghadiri, M. (2012). The relationship between intellectual capital and earnings quality. Research Journal of Applied Sciences, Engineering, and Technology, 4(20), 4192–4199.
Datta, S., Iskandar-Datta, M., & Singh, V. (2013). Product market power, industry structure, and corporate earnings management. Journal of Banking & Finance, 37(8), 3273–3285. https://doi.org/10.1016/j.jbankfin.2013.03.012
Dechow, P. M., & Dichev, I. D. (2002). The quality of accruals and earnings: The role of accrual estimation errors. The Accounting Review, 77(s-1), 35–59. https://doi.org/10.2308/accr.2002.77.s-1.35
Dechow, P. M., Sloan, R. G., & Sweeney, A. P. (1995). Detecting earnings management. Accounting Review, 193-225. 70(2), 193–225.
Dechow, P., Ge, W., & Schrand, C. (2010). Understanding earnings quality: A review of the proxies, their determinants, and their consequences. Journal of Accounting and Economics, 50(2-3), 344–401. https://doi.org/10.1016/j.jacceco.2010.09.001
Demerjian, P. R., Lev, B., Lewis, M. F., & McVay, S. E. (2013). Managerial ability and earnings quality. The Accounting Review, 88(2), 463–498. https://doi.org/10.2308/accr-50318
Dhaliwal, D. S., Huang, S. X., Khurana, I. K., & Pereira, R. (2008). Product market competition and accounting conservatism. Review of Accounting Studies, 19(4), 1309–1345. https://doi.org/10.1007/s11142-013-9267-2
Donaldson, T., & Preston, L. E. (1995). The stakeholder theory of the corporation: Concepts, evidence, and
implications. Academy of Management Review, 20(1), 65–91. https://doi.org/10.5465/amr.1995.9503271992
Dženopoljac, V., Janoševic, S., & Bontis, N. (2016). Intellectual capital and financial performance in the Serbian ICT industry. Journal of Intellectual Capital, 17(2), 373–396. https://doi.org/10.1108/JIC-07-2015-0068
Dzhioev, A. V., & Gurieva, L. K. (2020, January). The intellectual capital role in market growth of companies in developed and emerging markets. In First International Volga Region Conference on Economics, Humanities and Sports (FICEHS 2019) (pp. 107-111). Atlantis Press.
Edvinsson, L., & Malone, M. (1997). Intellectual capital: Realizing your company’s true value by finding its hidden brainpower. Harper Business.
Enomoto, M. (2018). Cross-country research on earnings quality: A literature review and future opportunities (Discussion Paper DP2018-06). Research Institute for Economics and Business Administration. https://www.rieb.kobe-u.ac.jp/academic/ra/dp/English/DP2018-06.pdf
Enomoto, M., Kimura, F., & Yamaguchi, T. (2015). Accrual-based and real earnings management: An international comparison for investor protection. Journal of Contemporary Accounting & Economics, 11(3), 183–198. https://doi.org/10.1016/j.jcae.2015.07.001
Freeman, R. E. (1984). Strategic management: A stakeholder perspective. Pitman.
Giroud, X., & Mueller, H. M. (2010). Does corporate governance matter in competitive industries? Journal of Financial Economics, 95(3), 312–331. https://doi.org/10.1016/j.jfineco.2009.10.008
Grant, R. M. (1991). The resource-based theory of competitive advantage: Implications for strategy formulation. California Management Review, 33(3), 114–135. https://doi.org/10.2307%2F41166664
Healy, P. M., & Wahlen, J. M. (1999). A review of the earnings management literature and its implications for standard setting. Accounting Horizons, 13(4), 365–383. https://doi.org/10.2308/acch.1999.13.4.365
Holienka, M., & Pilková, A. (2014). Impact of intellectual capital and its components on firm performance before and after crisis. Electronic Journal of Knowledge Management, 12(4), 261–272.
Inkinen, H. (2015). Review of empirical research on intellectual capital and firm performance. Journal of Intellectual Capital, 16(3), 518–565. https://doi.org/10.1108/JIC-01-2015-0002
Kannan, G., & Aulbur, W. G. (2004). Intellectual capital: Measurement effectiveness. Journal of Intellectual Capital, 5(3), 389–413. https://doi.org/10.1108/14691930410550363
Khajavi, S., Ghadirian-Arani, M. H., & Fattahi-Nafchi, H. (2016). Intellectual capital and earnings quality:
220 Asia-Pacific Social Science Review | Vol. 21 No. 2 | June 2021
A comprehensive investigation. International Journal of Learning and Intellectual Capital, 13(4), 316–337. https://doi.org/10.1504/IJLIC.2016.079353
Kianto, A., & Andreeva, T. (2014). Knowledge management practices and results in service-oriented versus product-oriented companies. Knowledge and Process Management, 21(4), 221–230. https://doi.org/10.1002/kpm.1443
Kianto, A., Andreeva, T., & Pavlov, Y. (2013). The impact of intellectual capital management on company competitiveness and financial performance. Knowledge Management Research & Practice, 11(2), 112–122. https://doi.org/10.1057/kmrp.2013.9
Kianto, A., Ritala, P., Spender, J. C., & Vanhala, M. (2014). The interaction of intellectual capital assets and knowledge management practices in organizational value creation. Journal of Intellectual Capital, 15(3), 362–375. https://doi.org/10.1108/JIC-05-2014-0059
Kim, T., Kim, W. G., Park, S. S.-S., Lee, G., & Jee, B. (2012). Intellectual capital and business performance: What structural relationships do they have in upper-upscale hotels?. International Journal of Tourism Research, 14(4), 391–408. https://doi.org/10.1002/jtr.1868
Kim, Y., Park, M. S., & Wier, B. (2012). Is earnings quality associated with corporate social responsibility? The Accounting Review, 87(3), 761–796. https://doi.org/10.2308/accr-10209
Komnenic, B., & Pokrajčić, D. (2012). Intellectual capital and corporate performance of MNCs in Serbia. Journal of Intellectual Capital, 13(1), 106–119. https://doi.org/10.1108/14691931211196231
Madhumathi, R. and Ranganatham, M., Earnings Quality, Corporate Governance and Firm Performance (2011). Society of Interdisciplinary Business Research (SIBR) 2011 Conference on Interdisciplinary Business Research, Available at SSRN: https://ssrn.com/abstract=1867869 or http://dx.doi.org/10.2139/ssrn.1867869
Martínez-Ferrero, J. (2014). Consequences of financial reporting quality on corporate performance: Evidence at the international level. Estudios de Economía, 41(1), 49–88.
Mojtahedi, P. (2013). The impact of intellectual capital on earnings quality: Evidence from Malaysian firms. Australian Journal of Basic and Applied Sciences, 7(2), 535–540.
Molodchik, M. A., Shakina, E. A., & Barajas, A. (2014). Metrics for the elements of intellectual capital in an economy driven by knowledge. Journal of Intellectual Capital, 15(2), 206–226. https://doi.org/10.1108/JIC-08-2013-0091
Moore, G. (2001). Corporate social and financial performance: An investigation in the UK supermarket industry. Journal of Business Ethics, 34(3–4), 299–315. https://doi.org/10.1023/A:1012537016969
Mutuc, E. B., Lee, J. S., & Tsai, F. S. (2019). Doing good with creative accounting? Linking corporate social responsibility to earnings management in market economy, country, and business sector contexts. Sustainability, 11(17). https://doi.org/10.3390/su11174568
Nimtrakoon, S. (2015). The relationship between intellectual capital, firms’ market value and financial performance. Journal of Intellectual Capital, 16(3), 587–618. https://doi.org/10.1108/JIC-09-2014-0104
Nuryaman, Kartadjumena, E., & Arnan, S. G. (2019). The influence of intellectual capital on earnings management through real activities manipulation in Indonesian manufacturing companies. International Journal of Economics and Business Research, 18(3), 277–291. https://doi.org/10.1504/IJEBR.2019.102724
Pulic, A. (1998). Measuring the performance of intellectual potential in the knowledge economy [Conference presentationIn 2nd McMaster Word Congress on Measuring and Managing Intellectual Capital by the Austrian Team for Intellectual Potent20).
Pulic, A. (2004). Intellectual capital–does it create or destroy value? Measuring Business Excellence, 8(1), 62–68. https://doi.org/10.1108/13683040410524757
Ramadan, I. Z. (2015). Earnings quality determinants of the Jordanian manufacturing listed companies. International Journal of Economics and Finance, 7(5), 140–146.
Riahi-Belkaoui, A. (2003). Intellectual capital and firm performance of US multinational firms: A study of the resource-based and stakeholder views. Journal of Intellectual Capital, 4(2), 215–226. https://doi.org/10.1108/14691930310472839
Roychowdhury, S. (2006). Earnings management through real activities manipulation. Journal of Accounting and Economics, 42(3), 335–370. https://doi.org/10.1016/j.jacceco.2006.01.002
Saleh, N. M., Jaffar, R., & Yatim, P. (2013). Family ownership, related-party transactions and earnings quality. Asian Academy of Management Journal of Accounting and Finance (AAMJAF), 9(1), 129–153.
Sardo, F., & Serrasqueiro, Z. (2018). Intellectual capital, growth opportunities, and financial performance in European firms: Dynamic panel data analysis. Journal of Intellectual Capital, 19(4), 747–767. https://doi.org/10.1108/JIC-07-2017-0099
Sarea, A., & Alansari, S. H. (2016). The relationship between intellectual capital and earnings quality: Evidence from listed firms in Bahrain Bourse. International Journal of Learning and Intellectual Capital, 13(4), 302–315. https://doi.org/10.1504/IJLIC.2016.079350
Singh, P. J., Sethuraman, K., & Lam, J. Y. (2017). Impact of CSR dimensions on firm value: Some evidence from Hong Kong and China. Sustainability, 9(9). https://doi.org/10.3390/su9091532
221Asia-Pacific Social Science Review | Vol. 21 No. 2 | June 2021
Smriti, N., & Das, N. (2018). The impact of intellectual capital on firm performance: A study of Indian firms listed in COSPI. Journal of Intellectual Capital, 19(5), 935–964. https://doi.org/10.1108/JIC-11-2017-0156
Surroca, J., Tribó, J. A., & Waddock, S. (2010). Corporate responsibility and financial performance: The role of intangible resources. Strategic Management Journal, 31(5), 463–490. https://doi.org/10.1002/smj.820
Sveiby, K. E. (2010). Methods for measuring intangible assets. Retrieved from https://www.sveiby.com/files/pdf/1537275071_methods-intangibleassets.pdf
Tan, P. H., Plowman, D., & Hancock, P. (2007). Intellectual capital and financial returns of companies. Journal of Intellectual Capital, 8(1), 76–95. https://doi.org/10.1108/14691930710715079
Tran, N. P., & Vo, D. H. (2020). Do banks accumulate a higher level of intellectual capital? Evidence from an emerging market. Journal of Intellectual Capital. Advance online publication. https://doi.org/10.1108/JIC-03-2020-0097
Tsai, C. H., & Mutuc, E. B. (2020). Evidence in Asian food industry: Intellectual capital, corporate financial performance, and corporate social responsibility. International Journal of Environmental Research and Public Health, 17(2). https://doi.org/10.3390/ijerph17020663
Vazifehdoust, H., Khajenasir, M., & Karami, H. (2014). A study on the effect of intellectual capital on firm performance: Evidence from Tehran Stock Exchange. Management Science Letters, 4(3), 559–566. https://doi.org/10.5267/j.msl.2014.1.008
Vishnu, S., & Gupta, V. K. (2014). Intellectual capital and performance of pharmaceutical firms in India. Journal of Intellectual Capital, 15(1), 83–99. https://doi.org/10.1108/JIC-04-2013-0049
Wang, S. F., Jou, Y. J., Chang, K. C., & Wu, K. W. (2014). Industry competition, agency problem, and firm performance. Romanian Journal of Economic Forecasting, 17(4), 76–93.
Watts, R. L., & Zimmerman, J. L. (1990). Positive accounting theory: A ten-year perspective. Accounting Review, 65(1), 131–156.
Williams, D. R. (2013). Human and financial capital as determinants of biopharmaceutical IPO de-listings. Journal of Business Research, 66(12), 2612–2618. https://doi.org/10.1016/j.jbusres.2012.05.019
Xu, J., & Li, J. (2019). The impact of intellectual capital on SMEs’ performance in China. Journal of Intellectual Capital, 20(4), 488–509. https://doi.org/10.1108/JIC-04-2018-0074
Xu, J., & Liu, F. (2020). Nexus between intellectual capital and financial performance: An investigation of Chinese manufacturing industry. Journal of Business Economics and Management, 22(1), 217-235. https://doi.org/10.3846/jbem.2020.13888
Yang, Y. (2018). Do aggressive pro forma earnings-reporting firms have difficulty disclosing intellectual capital? Australian evidence. Journal of Intellectual Capital, 19(5), 875–896. https://doi.org/10.1108/JIC-03-2017-0051
Zanjirdar, M., & Chogha, M. (2012). Evaluation of the relationship between the intellectual capital and earning quality indexes in emerging economics: A case study of Iran’s financial market. African Journal of Business Management, 6(38). https://doi.org/10.5897/AJBM11.2545
Zhang, R., Zhu, J., Yue, H., & Zhu, C. (2010). Corporate philanthropic giving, advertising intensity, and industry competition level. Journal of Business Ethics, 94(1), 39–52. https://doi.org/10.1007/s10551-009-0248-0