Embed Size (px)
Citation preview

71
International review for spatial planning and sustainable development, Vol.5 No.1 (2017), 71-85
ISSN: 2187-3666 (online)
DOI: http://dx.doi.org/10.14246/irspsd.5.1_71
Copyright@SPSD Press from 2010, SPSD Press, Kanazawa
An Integrated Model of Transportation and Land Use
for Development and Application in Beijing
Yu Zhang1*, Xiaodong Zhang1, Meng Zheng1, Ying Long2 1 Beijing Institute of City Planning and Design
2 School of Architecture, Tsinghua University
* Corresponding Author, Email: [email protected]
Received: March 02, 2016; Accepted: June 15, 2016
Key words: Beijing, Land-use and Transportation Integrated Model, Development,
Application
Abstract: Supporting the evaluation of Beijing Urban Master Planning (2004-2020), a
Beijing land-use and transportation integrated model is established on the
basis of the transportation model of Beijing. The core improvement is the
addition of a land use model and the interaction between the land use model
and a transport model. Four sub models (location choice, rent, development
and land price models) are contained in the land use model. The most
important sub model is the location choice model. Commute accessibility,
education, culture, environment and health care factors are selected to
calibrate this model. The population distribution is sourced from the location
choice model and the commute accessibility has been computed based on the
transport model and input into the land use model.
1. INTRODUCTION
Beijing Urban Master Planning (2004-2020) was compiled in 2004 and
has been implemented over nearly 15 years. The Beijing metropolitan area
has been rapidly developed under the guidance of the spatial strategy
concept called “Two Axes, Two Belts and Multiple Centers” proposed in the
Beijing Urban Master Planning. Looking back at the changes in recent
years, the comprehensive transportation system planning with a focus on the
development of a rail transit system has played a key role in the fulfilment of
the “Two Axes, Two Belts and Multiple Centers” ideology. Although the
concept of the integrated planning of land use and transportation has been
widely accepted and reflected in major projects in Beijing recently, the
degree of coordinated development between land use and transportation in
Beijing has never been evaluated in a quantitative manner.
The development purpose of this model is to find out the interaction rules
between three systems, the economic, land use and traffic systems, in order
to establish relevant integrated models with which to study the macro rules
across these three urban sub systems through quantitative analysis and the
study of micro individual behaviors under the conditions of a market
economy.

72 IRSPSD International, Vol.5 No.1 (2017), 71-85
The specific approach of this paper is to establish a simulation model to
reflect the interactive relationship between transportation and land use under
a certain economic background by exploring the patterns of several major
individual choice behaviors including residential location choice and real
estate development.
1.1 Literature review
In recent years, research reports on the interactive relationship between
transportation and land use have explored quantitative evaluations of
transportation and land-use integrated planning in major cities around the
world. For example, cities such as Charlotte, Seattle and Los Angeles in the
United States have used PECAS (Hunt & Abraham, 2009; Wegener, 1994;
Abraham, Garry, & Hunt, 2005) and other relevant software to build
transportation and land-use integration models. In addition, Paris (Waddell,
2002, 2001) uses UrbanSim to build its transportation and land-use
integration model. Mexico City applies Tranus to build its transportation and
land-use integration model (de la Barra, 1989). Shenzhen also tends to use
Tranus to build its own integration models. In addition, universities and
institutions including Tsinghua University, Peking University and the
Beijing Transportation Research Center are conducting relevant explorations
and research on transportation and land-use integration models. However,
there is currently still no matured transportation and land-use integration
model successfully developed and applied in the planning practice of
mainland China because of a lack of data.
1.2 Previous related research on Beijing
A macro transportation strategic model of Beijing (BMI model) is a
macro transportation strategic module of the Beijing metropolitan area,
which is built-up by the Beijing Municipal Institute of City Planning and
Design and MVA in 2008 (Beijing Municipal Institute of City Planning and
Design & MVA, 2008), according to relevant data obtained from a
Transportation Survey in 2005. In this model, Beijing is divided into 178
Traffic Analyse Zone (TAZ). The model dimensions include two family type
categories, ‘car available’ families (CA) and ‘no car available’ families
(NCA). Five different types of trips are considered in this model: home-
based work (HBW) trips, home-based school (HBS) trips, home-based other
(HBO) trips, non-home-based (NHB) trips and employment-based (EB)
trips. The five modes used in the model are bike, car, taxi, bus and metro.
The specific structure of the model is shown in Figure 1.

Zhang et al. 73
Figure 1. Frame Diagram of BMI Model Structure
The set-up of the BMI model has laid a transportation sub-model
foundation for the building of the transportation and land use integrated
model.
The land use sub model design and calibration of the Beijing
transportation and land use integrated model will be discussed below.
2. MODEL DESIGN
2.1 Model framework
The actual market behaviors of Beijing are analyzed according to the
available data foundation based on the above-mentioned development
purpose. The research framework of the transportation and land use
integrated model is shown in Figure 2.

74 IRSPSD International, Vol.5 No.1 (2017), 71-85
Figure 2. Flow Chart of Beijing Land Use and Transport Integration (BLUTI) Model
Framework
Figure 2 indicates that the land use model in this transportation and land
use integrated model takes the residential real estate market and resident
location choice as research objects for model establishment without putting
location choice behavior for enterprises into consideration. The main reasons
are listed as follows.
The current investigation of location choice behaviors for enterprises is
relatively insufficient and the accuracy of data available has to be checked.
The enterprise scales differ greatly and it is relatively difficult to select an
enterprise model analysis unit.
There are relatively abundant policy-dominating factors in the industrial
market of Beijing.
Therefore, the location choice for enterprises is assumed as an exogenous
variable in this transportation and land use integrated model (the current year
is mainly based on an economic census while the planning year mainly
applies the relation coefficient of planned land use and jobs as the
calculation basis) to simulate the market behaviors of the residential market.
The land model and the transportation model interact with each other
primarily according to the transportation accessibility of different zones
obtained from the transportation accessibility calculation model and the
residential distribution conditions of different types of households provided
by the location choice model for residents.
The model convergence is mainly decided by three factors:
1. The difference of traffic volume between each loop is within the
present threshold scope;

Zhang et al. 75
2. The difference of population between each loop is within the present
threshold scope;
3. The difference in terms of accessibility between each loop is within the
present threshold scope.
Under the precondition of the satisfaction of the above-mentioned three
convergence conditions, the model can be assessed as convergent and
relevant results can be obtained.
Figure 3 indicates that there are mainly four sub-models involved in the
land use model. They are the location choice model for residents, the leasing
model, development model and land price model. The relationships amongst
these four sub-models are shown in Figure 3.
Figure 3. Flow chart of calculation relations of land use sub-model
Based on the model, the accessibility calculation model should also be
clearly made to realize the interactions between the transportation model and
land use model.
2.2 Model Dimensions
Combining the relevant data of Beijing and the dimension conditions of
the existing transportation model, the dimensions of the land use model are
divided into the following three parts.
1. Family Classification
The family classification is subdivided into five types based on the
original transportation model classification and family differences in
residential location choice. The five types of family include low-income
family, medium-income family with car, medium-income family without car,
high-income family with car and high-income family without car.
2. TAZ
The division of transportation zones continues to use the method
stipulated in the existing macro transportation model. A total of 198
transportation zones are used (178 inner zones).
3. Division of Land Use Types
Since this model is only targeted at the residential real estate market and
there is a relative shortage of basic data of the residential land use, the land
use is categorized as one type, regular residential land use.

76 IRSPSD International, Vol.5 No.1 (2017), 71-85
3. SUB-MODEL DESIGN AND CALIBRATION
3.1 Residential Location Choice Model
The residential location choice model is mainly based on the behavior of
competitive lease prices in the real estate market. In other words, the leasing
or purchasing group in residential real estate is the highest bidder. The
distribution proportions of various kinds of groups in the residences in each
location and such groups’ willingness to pay (WTP) for such residences can
be worked out through the calculation of this model (Goulias, 2003).
This model is a multi-Logit model based on the dispersal of choice
behavior. The parameter calibration process is as follows.
1. Analysis of Dependent Variable House Price Distribution Samples in
Base Year
The spatial interpolation method is used to obtain the house prices of the
regular residences and apartments of each community model in the base year
(2005) according to 626 samples investigated by the research group in 2005
as indicated in Figure 4.
Figure 4. Distribution diagram of resident real estate price in Beijing in 2005
2. Selection of Independent Variables of the Model
According to the characteristics of the location choice of residents in
Beijing and through the qualitative investigation and analysis, residents will
mainly consider the following factors when selecting their locations.
The first factor is the convenience of daily commuting, and location
accessibility is used as an independent variable in the model.
The second factor is distribution of education resources around the
location. Distance from the transportation zone to any of the top-50 primary
and middle schools is taken as an independent variable.
The third factor is the living environment around the location. The
distance from the transportation zone to the nearest scaled university campus
is taken as a variable.

Zhang et al. 77
The fourth factor is the natural environment around the location. The
distance from the transportation zone to the nearest park or greenbelt is taken
as a variable.
The fifth factor is the medical environment around the location. The
distance from the transportation zone to the nearest top-grade hospital is
taken as a variable.
The independent variables of parameters selected in the residential
location choice model are summarized in Table 1:
Table 1. Six independent variables of parameters in the residential location choice model
Independent Variable Definition Unit
PriDist Nearest distance from the centroid of the transportation
zone to any of the top-50 primary schools in Beijing Km
MidDist Nearest distance from the centroid of the transportation
zone to any of the top-50 middle schools in Beijing Km
ParkDist Nearest distance from the centroid of the transportation
zone to any of the 53 city parks registered in Beijing Km
UniDist
Nearest distance from the centroid of the transportation
zone to any of the 54 universities with a campus area
exceeding 10 hectares in Beijing
Km
HospDist
Nearest distance from the centroid of the transportation
zone to any of the third-level and grade-A hospitals in
Beijing
Km
Acc
The location accessibility of the transportation zone
can be expressed by distance from the location to the
employment area in terms of convenience.
——
In addition to these six independent variables, the scale independent
variables, such as the total number of each family type, are introduced in the
residential location choice model to reflect the proportional differences of
different family types in the model. This is due to the use of lease-bidding
theory with the purpose of better revealing the influence of the change of
scales of various family types in the planning year on the residential location
choice model.
3. Parameter Calibration of the Model
Based on the Multinominal Logit Model (MNL) model, the format of the
utility equation of the residential location choice model is as follows:
B ln( ) Prhvi h h h i h i
h i h i h i h i
Asc Scl iDist MidDist
ParkDist UniDist HospDist Acc
Where,
Bhvi
represents the WTP of group h for class-v real estate type in
transportation zone I;
hAsc represents a constant of WTP function of group h. The value is to
be calibrated.
hScl represents the population scale of group h;
The independent variables of the remaining WTP functions are shown in
the above table.
\ \ \ \ \ \h h h h h h
is the parameter to be estimated while
represents a random independent variable.
According to the equation, BIOGEME (Bierlaire, 2003) has been used to
carry out model calibration after independent variables, i, are standardized.
The standardization of independent variables is shown in Table 2:
78 IRSPSD International, Vol.5 No.1 (2017), 71-85
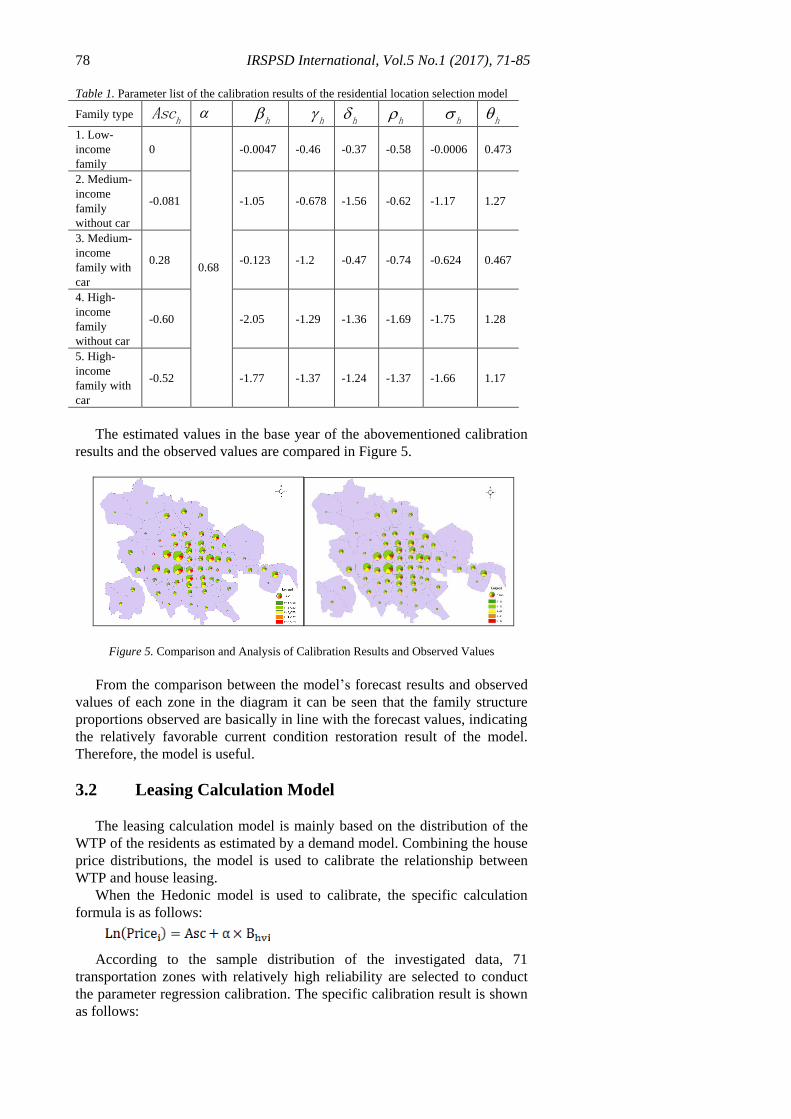
Table 1. Parameter list of the calibration results of the residential location selection model
Family type h
Asc h
h
h
h
h
h
1. Low-
income
family
0
0.68
-0.0047 -0.46 -0.37 -0.58 -0.0006 0.473
2. Medium-
income
family
without car
-0.081 -1.05 -0.678 -1.56 -0.62 -1.17 1.27
3. Medium-
income
family with
car
0.28 -0.123 -1.2 -0.47 -0.74 -0.624 0.467
4. High-
income
family
without car
-0.60 -2.05 -1.29 -1.36 -1.69 -1.75 1.28
5. High-
income
family with
car
-0.52 -1.77 -1.37 -1.24 -1.37 -1.66 1.17
The estimated values in the base year of the abovementioned calibration
results and the observed values are compared in Figure 5.
Figure 5. Comparison and Analysis of Calibration Results and Observed Values
From the comparison between the model’s forecast results and observed
values of each zone in the diagram it can be seen that the family structure
proportions observed are basically in line with the forecast values, indicating
the relatively favorable current condition restoration result of the model.
Therefore, the model is useful.
3.2 Leasing Calculation Model
The leasing calculation model is mainly based on the distribution of the
WTP of the residents as estimated by a demand model. Combining the house
price distributions, the model is used to calibrate the relationship between
WTP and house leasing.
When the Hedonic model is used to calibrate, the specific calculation
formula is as follows:
According to the sample distribution of the investigated data, 71
transportation zones with relatively high reliability are selected to conduct
the parameter regression calibration. The specific calibration result is shown
as follows:

Zhang et al. 79
R2 is 0.68, indicating the relatively good fitness of the model.
The house prices in various transportation zones in Beijing in the base
year are calculated according to the formula. Compared with the house
prices of regular residences in each area, the result of investigations and
summarizations are shown in Figure 6.
Figure 6. Differences between model data and survey data of house prices
From Figure 6 it can be seen that the distribution trend of house prices
forecast by using the model is relatively favorable and presents an obvious
center-outward spread, being higher in the north and lower in the south. The
result of the comparison between forecast value and observed value indicates
that the model forecast in the central city is slightly lower than the observed
value. The forecast value of outward regions is slightly higher than the
observed value. The accuracy of the overall forecast is relatively acceptable
and thus the model is applicable.
3.3 Land Price Model
The land price model mainly aims to provide the land cost of real estate
development for the development model and reflects the relationship
between the land price and its influencing factors.
1. Analysis on Land Price Distribution in the Base Year
The transaction data and knock down prices of 407 residences from 2002
to 2010 are equivalently converted to 2005 values to obtain the house prices
in each area in 2005. See Figure 7:

80 IRSPSD International, Vol.5 No.1 (2017), 71-85
Figure 7. Distribution of relevant land prices of residences in Beijing in 2005
2. Selection of Independent Variables
After investigation and survey, it is known that the land price is mainly
influenced by factors such as location, humanistic and social environments.
The influencing factors are finally selected after analyzing the correlation of
variables as well as land price correlation in the base year as presented in
Table 3.
Table 2. Independent variables in the land price related factor analysis model
Independent Variable Definition Unit
PriDist Nearest distance from the centroid of the transportation
zone to any of the top-50 primary schools in Beijing Km
ParkDist Nearest distance from the centroid of the transportation
zone to any of the 53 city parks registered in Beijing Km
Acc
The location accessibility of the transportation zone can
be expressed by the distance from the location to the
employment area in terms of convenience.
——
3. Model Calibration
The Hedonic model is used to conduct model calibration of the land price
and relevant influencing factors. The result of calibration is shown in the
following equation.
price dist dist
Ln(Land )=2.207-0.021 Pri -0.007 Park +0.535 Acc
R2 is 0.738, indicating the relatively good fitness of the model.
The results of model calibration are compared with the observed values
as demonstrated in Figure 8.

Zhang et al. 81
Figure 8. Comparison between estimated data and survey data
Figure 8 indicates that the estimated values produced from the model and
the real values are quite similar. It should be noted that minor differences
still exist in the forecast of individual values.
3.4 Real Estate Development Model
The establishment of a development model mainly simulates the
development behaviors of the real estate market. It is well known that
developers tend to select pieces of land available for development with the
highest profit potential. A mathematical formula maximizing developers’
profits can be expressed as below:
cost costMax(Price-Land -Con )
Where, Price represents the sales price of the house;
costLand represents the land purchase cost;
costCon represents the house construction cost.
In the model, the independent variable of land purchase cost is obtained
from the land price model. The house construction cost in the base year is
temporarily set as 800 RMB/m2.
Under the precondition that the total development volume of the
development model is already known (obtained from the exogenous total
residence demand scale of the model), the development scale of each
transportation zone can be calculated by using the development profit model
that is composed of house price, land price and construction cost. The
specific mathematical formula can be represented as follows:
( )
exp( )i
i i
iI
expS H P H
The utility equation is represented as:
cost( Con )
i ii i price ir land

82 IRSPSD International, Vol.5 No.1 (2017), 71-85
BIOGEME is used to calibrate the development model. The calibration
result of the equation is as follows:
Figure 9. Comparison between predicted data and observed data
Figure 9 indicates that the overall developments of the two curves are
relatively matched. In addition, the errors in most transportation zones are
relatively small, which proves the validity of the parameters used in the
development model.
3.5 Accessibility Calculation Model
In order to reflect the influence of transportation systems on land use in a
more objective way, an employment accessibility index of the application
area is used to mirror the impact of the real estate development behaviours
on residential location selection. Meanwhile, the location accessibility is also
used as the basis for the establishment of land price in order to
comprehensively reveal the influence of transportation systems on the land
use.
The comprehensive transportation cost calculated by using a BMI model
is used in this accessibility variable. Combining the trip mode structure of
different family groups and the regional distribution of jobs, the calculation
is carried out. The calculation formula is as follows:
ln( )j
hi
j J kij kh
k K
EmpAcc
GC Per
Where,
hiAcc represents the employment transportation accessibility of
family h in Zone i;
jEmp refers to the jobs in Zone j;
kijGC represents the generalized trip cost from Zone i to Zone j under the
trip mode k;
khPer refers to the ratio of trip mode k related to family h.
Zhang et al. 83
4. APPLICATION
In this section, the influence of decentralization of the top hospitals on
the residential distribution and land development changes is taken as an
example for model application.
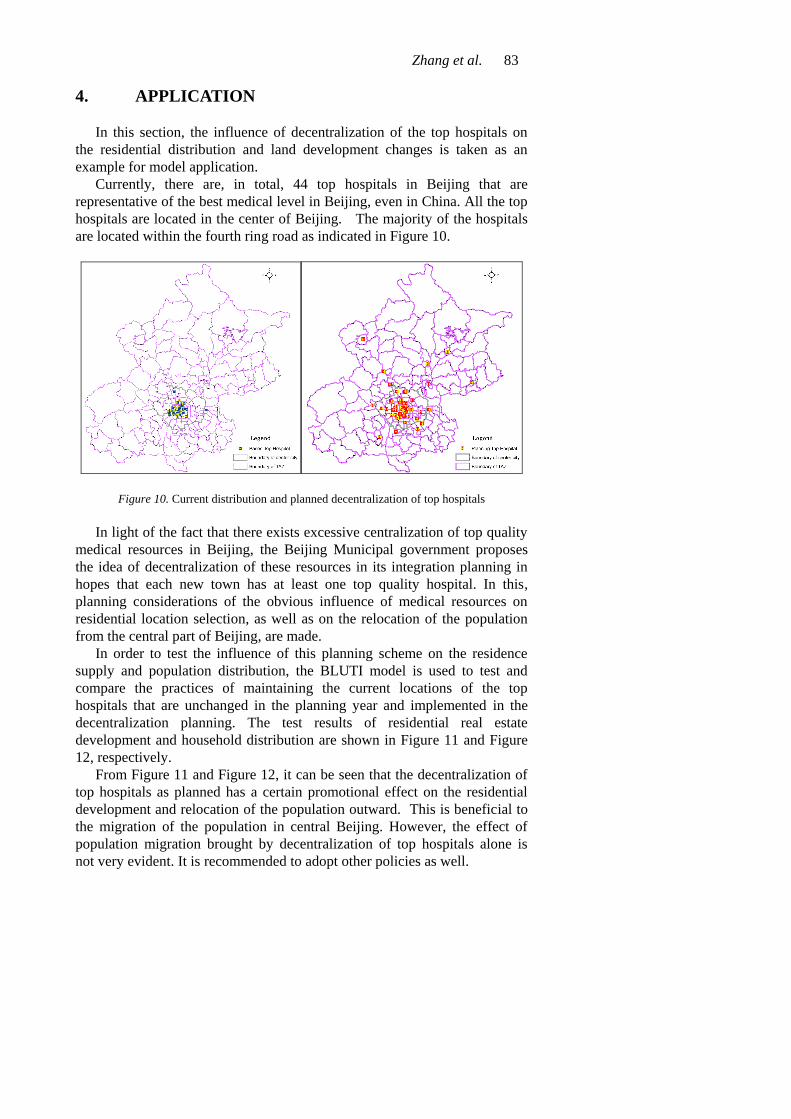
Currently, there are, in total, 44 top hospitals in Beijing that are
representative of the best medical level in Beijing, even in China. All the top
hospitals are located in the center of Beijing. The majority of the hospitals
are located within the fourth ring road as indicated in Figure 10.
Figure 10. Current distribution and planned decentralization of top hospitals
In light of the fact that there exists excessive centralization of top quality
medical resources in Beijing, the Beijing Municipal government proposes
the idea of decentralization of these resources in its integration planning in
hopes that each new town has at least one top quality hospital. In this,
planning considerations of the obvious influence of medical resources on
residential location selection, as well as on the relocation of the population
from the central part of Beijing, are made.
In order to test the influence of this planning scheme on the residence
supply and population distribution, the BLUTI model is used to test and
compare the practices of maintaining the current locations of the top
hospitals that are unchanged in the planning year and implemented in the
decentralization planning. The test results of residential real estate
development and household distribution are shown in Figure 11 and Figure
12, respectively.
From Figure 11 and Figure 12, it can be seen that the decentralization of
top hospitals as planned has a certain promotional effect on the residential
development and relocation of the population outward. This is beneficial to
the migration of the population in central Beijing. However, the effect of
population migration brought by decentralization of top hospitals alone is
not very evident. It is recommended to adopt other policies as well.

84 IRSPSD International, Vol.5 No.1 (2017), 71-85
Figure 11. Comparison of based and planned residence supply density
Figure 12. Comparison of based and planned Mid-Income No Car Available Household
Distribution
5. CONCLUSION
The main achievement of this research is, for the first time, the
completion of the calibration of a Beijing transportation and land use
integrated model based on the traditional transportation model of Beijing and
land use data. Some applications of the model, such as an exploration of the
effect of top hospital decentralization, are also made.
Furthermore, the calibrated model has provided a set of relatively feasible
and effective quantified analysis tools for the evaluation of the master
planning of Beijing in future development. In addition, the model can help
conduct scheme testing processes that are related to urban land use planning
and transportation system planning, as well as related policy analysis and
strategy research.
REFERENCES
Abraham, J. E., Garry, G. R., & Hunt, J. D. (2005). "The Sacramento Pecas Model". Paper
presented at the Transportation Research Board Annual Meeting, Washington, DC.
Beijing Municipal Institute of City Planning and Design & MVA. (2008). "Final Report of
Updating Research of Beijing Municipal Transportation Model". Retrieved from Beijing.

Zhang et al. 85
Bierlaire, M. (2003). "Biogeme: A Free Package for the Estimation of Discrete Choice
Models". Paper presented at the 3rd Swiss Transportation Research Conference, Ascona,
Switzerland.
de la Barra, T. (1989). Integrated Land Use and Transport Modelling. Decision Chains and
Hierarchies. London: Cambridge University Press.
Goulias, K. G. (Ed.) (2003). Transportation Systems Planning: Methods and Applications.
Boca Raton, FL: CRC Press.
Hunt, J. D., & Abraham, J. E. (2009). "Pecas - for Spatial Economic Modelling: Theoretical
Formulation. System Documentation Technical Memorandum 1 Working Draft".
Retrieved from Calgary, Alberta.
Waddell, P. (2001). "Towards a Behavioral Integration of Land Use and Transportation
Modeling". Paper presented at the 9th International Association for Travel Behavior
Research Conference, Queensland, Australia.
Waddell, P. (2002). "Urbansim: Modeling Urban Development for Land Use, Transportation,
and Environmental Planning". Journal of the American Planning Association, 68(3), 297-
314.
Wegener, M. (1994). "Operational Urban Models State of the Art". Journal of the American
Planning Association, 60(1), 17-29.