Embed Size (px)
Citation preview

POLITECNICO DI MILANO
Scuola di Ingegneria dei Sistemi
Corso di Laurea in Ingegneria Gestionale
An integrated framework for reputational risk
assessment: modelling reputational risk as an
indirect effect
Relatore: Chiar.mo Prof. Marco GIORGINO
Correlatore: Dott.ssa Barbara MONDA
Tesi di Laurea di:
Luca PROFESSIONE
Matr. 841275
Anno Accademico 2013/2014


Abstract
The objective of the study is to develop an integrated methodology for the assessment of
reputational risk. The concept of reputational risk is receiving increasing attention in recent
years mainly due to the unrecorded accessibility of information via the internet, the effects
of globalization and the increased regulatory pressure. Despite the efforts of the scientific
community, no existing method for the assessment of reputational risk manages
quantitatively measure reputational risk. The model presented in this thesis uses different
methods borrowed from a variety of disciplines. Its major innovation resides in the
combination of scenario analysis and judgment analysis to evaluate the potential impact of
reputation damaging events. Moreover, the use of phylogenetic analysis is proposed to
support the process of identification of reputational risks. Ultimately the method developed,
albeit with some limitations, proves to be a feasible tool for the measurement of reputational
risk.

Italian extended abstract
Il presente studio si propone di sviluppare un modello integrato per la valutazione del
rischio reputazionale. Il modello suggerito combina differenti metodologie mutuate da
discipline diverse. La sua innovatività è principalmente legata alla combinazione dell’analisi
di scenario e della judgment analisys per valutare il potenziale impatto di eventi negativi dal
punto di vista reputazionale. Viene inoltre proposta l’applicazione dell’analisi filogenetica a
supporto del processo di identificazione dei rischi reputazionali. La metodologia descritta,
seppur con alcune limitazioni, si dimostra uno strumento funzionale alla valutazione ex-ante
del rischio reputazionale.
Il lavoro si apre con una breve introduzione sui temi della reputazione aziendale e del
rischio reputazionale. Si illustrano i dati che testimoniano della crescente attenzione
dedicata da esperti, managers e ricercatori a queste tematiche. L’aumento dell’interesse è da
ricollegare ad alcuni aspetti che caratterizzano l’ambito in cui le aziende attualmente
operano e con cui devono confrontarsi: la globalizzazione dei mercati, la velocità di
diffusione delle informazioni attraverso i media convenzionali e non, l’incremento
complessivo degli intangible assets, la crescente complessità del quadro normativo e dei
controlli. La rilevanza dell’argomento è testimoniata dai numerosi eventi e scandali, nei
quali si può chiaramente evidenziare un danno reputazionale, che negli ultimi anni hanno
avuto pesanti conseguenze sulle aziende interessate fino a causarne l’uscita dal mercato.
La reputazione aziendale è un concetto che ancora non ha trovato una definizione completa
e largamente condivisa. Nel secondo capitolo, attraverso un’ampia rassegna bibliografica, si
illustrano e si confrontano le diverse definizioni di reputazione e di rischio reputazionale e si
approfondiscono i meccanismi sottostanti. Tra le definizioni più condivise si trova quella
fornita da Fombrun, secondo il quale la reputazione sarebbe una “rappresentazione basata
sulla percezione delle azioni passate e delle prospettive future di un’azienda, che descrive il
prestigio complessivo della stessa in rapporto ad altri concorrenti”. La reputazione si
distingue, anche se in maniera a volte sottile, dai concetti di identità aziendale, immagine e
marchio (o brand). La reputazione aziendale è qualcosa di relativamente stabile, che viene
costruito nel tempo attraverso l’identità interna dell’azienda e le immagini che l’azienda
proietta all’esterno. Nonostante la sua relativa stabilità, gravi eventi possono ledere in breve

tempo la reputazione. Una buona reputazione comporta numerose ricadute positive per
un’azienda: vantaggi nelle interazioni con clienti e fornitori, capacità di attrarre nuovi
investitori, possibilità di assumere e trattenere i migliori talenti.
A partire dalle definizioni che si trovano nella letteratura accademica viene presentato e
discusso il concetto di rischio reputazionale. Esso si configura come ogni evento che può
avere un impatto (negativo ma anche eventualmente positivo) sulla reputazione aziendale. Il
rischio reputazionale viene considerato da molti come rischio dei rischi in quanto emerge
come conseguenza di altri rischi (operativi, manageriali, ecc.).
I concetti di reputazione e di rischio reputazionale non possono prescindere dalla nozione di
stakeholders, in quanto esistono proprio in relazione alla presenza di portatori di interesse.
Ogni azienda ha a che fare con una molteplicità di stakeholders: i lavoratori, gli investitori, i
consumatori, i partners, i fornitori, i concorrenti, le istituzioni, i gruppi di pressione, ecc.
L’ultimo paragrafo del capitolo è dedicato agli impatti che gli eventi reputazionali possono
avere sulla reputazione stessa e sulle performances aziendali.
Il terzo capitolo illustra le principali tecniche utilizzate per la valutazione della reputazione e
del rischio reputazionale. La valutazione della reputazione aziendale e del rischio
reputazionale è un compito non facile, con il quale si stanno confrontando da anni gli esperti
dei settori dell’economia e della finanza.
La valutazione della reputazione viene spesso affrontata attraverso metodi qualitativi che si
basano sulla raccolta di giudizi tramite interviste presso gli stakeholders. Agli intervistati
viene richiesto di assegnare un punteggio alle aziende in relazione ad alcune caratteristiche
che sono considerate essenziali ai fini della reputazione tra cui: la qualità dei prodotti e dei
servizi, la leadership, la qualità dell’ambiente lavorativo, la responsabilità sociale e
ambientale, i risultati finanziari. In base a queste valutazioni vengono calcolati dei punteggi
complessivi e stilate delle classifiche.
Esistono anche alcuni metodi quantitativi per la valutazione della reputazione. Tali tecniche
sono relativamente complesse e non molto applicate. Alcuni di questi metodi si basano sulla
valutazione delle differenze tra il valore di mercato delle imprese ed il loro valore di libro.
La valutazione del rischio reputazionale è un’operazione estremamente complessa ma
essenziale per una gestione efficace dei rischi reputazionali.

Anche la valutazione del rischio reputazionale può essere effettuata attraverso l’impiego di
metodi qualitativi come la matrice probabilità-impatto e la gap analysis. Questi metodi
presentano i limiti tipici dei metodi qualitativi (bias); inoltre non permettono di
comprendere l’entità dei rischi reputazionali rispetto agli altri rischi a cui sono esposte le
imprese.
La valutazione del rischio reputazionale attraverso metodi quantitativi è un’operazione di
elevata complessità e raramente applicata dalle aziende. I metodi attualmente proposti
hanno una impronta fortemente accademica e presentano approcci di tipo ex-post ossia
analizzano quale è stato l’impatto reputazionale in eventi passati. Tra queste tecniche la più
diffusa è la valutazione dei rendimenti anormali di mercato: il danno reputazionale viene
valutato come differenza fra la perdita di valore borsistico conseguente a perdite operative
ed il valore delle perdite operative stesse.
Va segnalato che attualmente, nonostante gli sforzi della comunità scientifica, non esistono
metodi per la valutazione del rischio reputazionale che permettano alle imprese di valutare
quantitativamente ex-ante il rischio reputazionale a cui sono esposte. Una delle limitazioni
all’applicazione di metodi quantitativi è sicuramente l’assenza di database focalizzati sulla
reputazione e sul rischio reputazionale.
Nel quarto capitolo vengono presentati gli strumenti più diffusi per la gestione del rischio
del rischio reputazionale: dalla prevenzione del rischio fino alla gestione della crisi nel
momento in cui il rischio si concretizza. La prevenzione/mitigazione dei rischi reputazionali
si basa su alcune azioni tra cui il monitoraggio, il ricorso ad assicurazioni e le attività che si
inquadrano nella cosiddetta Corporate Social Responsibility. Quest’ultima può essere
definita come l’insieme delle azioni che apportano benefici alla società (e all’ambiente) al di
là degli interessi specifici dell’azienda e di ciò che è richiesto dalla legge. La Corporate
Social Responsibility comporta vantaggi in termini di reputazione e costituirebbe, secondo
molti autori, una sorta di autoassicurazione nei confronti delle crisi reputazionali. D’altra
parte la stessa reputazione viene considerata un fattore di protezione nei confronti delle
crisi.
Il quinto capitolo affronta le basi teoriche del modello integrato che si intende proporre per
valutare il rischio reputazionale e per fornire un supporto nella fase di identificazione dei
rischi. Il primo paragrafo presenta la struttura del modello e le basi logiche su cui si fonda. I

paragrafi successivi analizzano le varie parti di cui si compone il modello, affrontando sia
gli aspetti teorici che quelli applicativi. Diversamente da altri modelli il metodo proposto
non parte considera il rischio reputazionale come un unico rischio ma come una componente
di ciascun rischio a cui l’impresa è esposta. Allo scopo di valutare il danno reputazionale il
metodo scompone il danno nei suoi componenti e si focalizza sulle decisioni degli
stakeholder che sono alla base di tali effetti dannosi. Il modello integrato si compone di 4
fasi. Nella prima fase viene analizzata una lista di rischi già mappati con particolare
attenzione per la loro componente reputazionale.. Attraverso tecniche di brainstorming
applicate alle principali aree di reputazione si cercano gli eventuali rischi non mappati con
un potenziale impatto reputazionale. L'analisi filogenetica si propone come strumento per
sostenere l'identificazione di rischi potenzialmente non mappati. La seconda fase è rivolta
alla mappatura dei principali stakeholders, alla determinazione della loro influenza e del
loro comportamento con lo scopo di creare un elenco di “segnali reputazionali” che vengono
generati dalla manifestazione di rischi e che sono in grado di modificare il comportamento
degli stakeholders. Nella terza fase vengono svolte interviste per capire le reazioni degli
stakeholder a diversi set di segnali reputazionali. L'ultima fase esplora quali segnali di
reputazione sono generati da ogni rischio specifico e con quali probabilità. Successivamente
vengono prodotti molteplici scenari con diverse combinazioni di segnali. Per ogni scenario,
le intenzioni degli stakeholder (sulla base dei risultati della fase 3) vengono tradotti in
risultati previsti per determinare il potenziale impatto finanziario con l’utilizzo di un
modello DCF. Infine viene determinata la distribuzione probabilistica delle perdite derivanti
dal rischio reputazionale. L'ultimo paragrafo del capitolo presenta i principali limiti del
modello. La limitazione più importante è la mancanza di analisi dell'influenza dei media
sulle percezioni degli stakeholders riguardo ad eventi reputazionali.
Nel sesto capitolo viene presentata l’applicazione del modello proposto per verificarne la
fattibilità. Le diverse fasi del modello sono applicate in maniera semplificata; in particolare
l’attenzione viene focalizzata sulla identificazione e valutazione dei rischi di
contaminazione microbica dei prodotti nel settore latte.
Infine nell’ultimo capitolo si propongono le conclusioni sottolineando punti di forza e di
debolezza del modello proposto e suggerendo indicazioni su possibili approfondimenti di
ricerca per la messa a punto e la validazione del modello.

Executive summary
The study aims at developing an integrated methodology for the assessment of reputational
risk. The model is based on a framework that combines different methods, borrowed from
various disciplines. Its major innovation resides in the combination of scenario analysis and
judgment analysis to evaluate the potential impact of reputation damaging events.
Moreover, the use of phylogenetic analysis is proposed to support the process of
identification of reputational risks. Ultimately the method developed, albeit with some
limitations, proves to be a feasible tool for the measurement of reputational risk.
The thesis begins with an introduction which focuses on the increasing attention devoted by
media, managers and academics to the issues of corporate reputation and reputational risk.
The major reasons which explain the growing interest for these topics are related to
globalization, increasing accessibility to information and rising regulatory pressure.
The second chapter illustrates and compares current definitions of reputation, reputational
risk and their underpinning mechanisms, through a wide excursus on the academic
literature. Corporate reputation is still a debated notion. According to many authors it could
be defined as the perception of stakeholders, based on corporate past actions and future
perspectives, of a company’s overall credibility and attractiveness in comparison to its
competitors. Reputation is considered a quite stable feature but can be rapidly disrupted by
severe events. The chapter highlights attributes and benefits of positive reputation in terms
of market presence, competitiveness, ability to attract qualified human resources and share
price. The concept of reputational risk is presented starting from the definitions provided by
the literature. Reputational risk is the risk related to any event that can have an impact
(positive or negative) on corporate reputation. It is considered by many authors as a risk of
risk because it emerges as a consequence of other risks (operational, managerial, etc.).
Corporate reputation and reputational risk are strictly related to the concept of stakeholders.
Stakeholders are any group that can affect or can be influenced by the behavior of an
organization. Each corporation has relationships with multiple categories of stakeholders:
consumers, employees, investors, partners, pressure groups, etc.. In its last paragraph the
second chapter illustrates the potential impacts of reputational events.

The third chapter aims at summarizing the most popular techniques used for the estimation
of reputation and reputational risk. Assessing reputation and reputational risk are widely
acknowledged as a very complex tasks, for which a number of qualitative and quantitative
models have been proposed.
The assessment of reputation is usually implemented with qualitative methodologies which
assign a numeric score to the level of reputation of an organization. Quantitative methods on
the other hand attempt to assess the monetary value of the whole reputation capital or at
least of some of its components. The most popular qualitative methods for measuring
corporate reputation are survey-based reputation indexes. Stakeholders are requested to
assign scores to corporations on the basis of a variety of attributes that are considered to
have a reputational dimension: quality of products and services, leadership, work
environment, social, ethical and environmental responsibility, financial performances.
Quantitative methods to estimate reputation are limited and less used. Some of them are
based on the evaluation of the differences between a company’s market value and its book
value.
Likewise qualitative and quantitative methodologies for the assessment of reputational risk
have been proposed. The first ones, which are the only ones presently employed by risk
managers, are simple and intuitive, but are biased and do not allow to compare the effects of
reputational risk to the effects of other risks. The quantitative assessment on the other had is
a very complex process. A number of quantitative models attempt to estimate the
reputational damage, mainly by observing the volatility of share prices of companies around
reputation-damaging events. These models operate from an academic perspective and
provide a rigorous demonstration of the existence of reputational risk with ex-post analyses.
At the state of the art though they provide no useful tools to conduct an ex-ante valuation of
the reputational risk to which a company is exposed.
The fourth chapter summarizes the main measures that are implemented to treat reputational
risks. The most relevant ex-ante measures are represented by Corporate Social
Responsibility initiatives. CSR can be defined as actions that appear to further some social
good, beyond the interests of the firm and not required by law. Some examples of CSR
actions include ‘going beyond legal requirements in adopting progressive human resource
management programs, developing non-animal testing procedures, recycling, abating
pollution, supporting local businesses, embodying products with social attributes or

characteristics’. CSR activities have a positive impact on reputation and provide a sort of
partial self-insurance against reputational risks. Among ex-post measures, several strategies
for crisis management and the Situational Crisis Communication Theory are described.
The fifth chapter explores the theory behind the new model developed to support
reputational risk identification and perform reputational risk assessment. The first paragraph
presents the structure of the model and the rationale behind it. The following ones analyze
the various parts of the model, presenting both its theoretical and practical aspects. This
model does not attempt to assess the value of reputation as a whole, but instead focuses on
the most tangible effects of the reputational damage stemming from the occurrence of risks.
In order to estimate reputational damage the proposed method singles out its components
(eg. sales decrease, increased cost of capital, etc.) and focuses on the stakeholders’ decisions
that generate such effects. The model is structured in four steps. In the first step a list of
already mapped risks are analyzed with a focus on their reputational component.
Brainstorming teams are created for key reputational areas in order to look for unmapped
risks with a potential reputational impact. Phylogenetic analysis is proposed as a tool to
support the identification of potentially unmapped risks. The second step is aimed at
understanding who are the most relevant stakeholders’ for the company and what signals
could affect their decisions. The process includes a stakeholders analysis and the
identification of the cues through interviews and historical analysis of past risk events
within the industry considered. In the third step surveys are carried out to understand the
stakeholders’ reactions to different sets of reputational cues. Purpose made tools allow to
translate the results of the surveys into deterministic or probabilistic relationships. The last
phase explores which reputational signals are generated by each specific risk and with what
probability. Multiple scenarios with different combinations of signals are then generated.
For each scenario the expected stakeholders’ intentions (based on the results of step 3) are
translated into forecasted results in order to determine the potential financial impact with a
DCF model. Ultimately the probabilistic distribution of losses stemming from reputational
risk can be determined. The last paragraph of the chapter presents the main limitations of
the model. The most important limitation is the lack of the analysis of the influence of
media coverage on stakeholders’ perception of reputation damaging events.

The sixth chapter illustrates the implementation of the proposed model in order to verify its
suitability in supporting the reputational risk assessment. The different steps of the
methodology are applied in a simplified way, focusing on identification and evaluation of
reputational risks related to microbial contamination in the dairy sector.
The last chapter presents the conclusions of the study and illustrates suggestions for further
research.
Contents
1. Introduction................................................................................................................................ 14
1.1 - Recent reputational events .................................................................................................... 14
1.2 - Why reputation and reputational risk have become more and more important in the last
few years? ...................................................................................................................................... 16
1.3 - How do managers see reputational risk ................................................................................ 20
2. Reputation and reputational risk ............................................................................................... 21
2.1 - Definitions of corporate reputation ....................................................................................... 21
2.1.1 - Corporate reputation, identity, image and brand........................................................... 24
2.1.2 - Reputation benefits ......................................................................................................... 27
2.2 - Definition of reputational risk ................................................................................................ 30
2.3 - Stakeholders ........................................................................................................................... 32
2.4 - Impacts ................................................................................................................................... 34
2.5 - Upsides and downsides .......................................................................................................... 36
3. Reputation and reputational risk assessment ............................................................................ 37
3.1 - Measuring corporate reputation ........................................................................................... 37
3.1.1 - Qualitative methods ........................................................................................................ 37
3.1.2 - Quantitative methods ..................................................................................................... 42
3.2.1 - Qualitative methods ........................................................................................................ 45
3.2.2 - Quantitative methods ..................................................................................................... 49
4. Reputational risk treatment ....................................................................................................... 55
4.1 - Ex-ante measures ................................................................................................................... 55
4.1.1 - Corporate Social Responsibility ....................................................................................... 55
4.1.2 - Other ex-ante measures.................................................................................................. 58
4.2 – Ex-post measures .................................................................................................................. 59
4.2.1 - Crisis management .......................................................................................................... 59
4.2.2 - Crisis and reputation ....................................................................................................... 63
4.2.3 - Situational Crisis Communication Theory ....................................................................... 63
5. Model description .......................................................................................................................... 68
5.1 - General framework ................................................................................................................ 68
5.2 - Risk map integration .............................................................................................................. 72
5.2.1 - Complex systems theories and phylogenetic analysis .................................................... 73
5.3 - Mapping stakeholders and reputational cues ....................................................................... 81
5.3.1 - Stakeholder analysis ........................................................................................................ 81
5.3.2 - Cues identification........................................................................................................... 85
5.4 - Understanding stakeholders’ reactions ................................................................................. 87
5.5 - Analyzing the generation of cues and drawing the conclusions ............................................ 88
5.6 - Limitations to the model ........................................................................................................ 91
5.6.1 – Media effects .................................................................................................................. 91
5.6.2 - Judgement analysis biases .............................................................................................. 93
6. Case study ...................................................................................................................................... 94
6.1 - Risk integration with phylogenetic analysis ........................................................................... 95
6.1.2 - Data collection ................................................................................................................ 95
6.1.3 - Methodology ................................................................................................................... 97
6.1.4 - Results ............................................................................................................................. 98
6.2 – Specific risk analysis ............................................................................................................ 101
6.2.2 - Mapping stakeholders and cues ................................................................................... 103
6.2.3 - Understanding stakeholders’ reactions ........................................................................ 105
6.2.4 - Analyzing the generation of cues and drawing the conclusions ................................... 107
7. Conclusions ................................................................................................................................... 115
8. Appendices ................................................................................................................................... 117
9. References .................................................................................................................................... 124

Introduction
14
1. Introduction
Many argue that the single most valuable asset in the capitalist economy is not cash, stocks
or real estate, but trust. Although a shortage of cash can bring a company to the verge of
bankruptcy, it is more frequently a loss of reputation that deals the final blow. This is even
more so today as the speed with which reputational risks can materialize has become
extraordinary high. In a globally connected business world, a problem can emerge in a
distant part of the business, virally spread through the social media and escalate into a full
crisis in an instant.
The increased relevance of reputational risks goes hand in hand with a more intense public
scrutiny of a company general behavior. The increasing importance of corporate
sustainability has put pressure on companies to demonstrate strong ethics and changed
expectations around their behavior. In a 2008 letter to Berkshire directors, Warren Buffett
wrote: ‘we must continue to measure every act against not only what is legal, but also what
we would be happy to have written about it on the front page of a national newspaper…’.
According to a study by the World Economic Forum (2012) more than 25% of a
company’s market value is directly attributable to reputation.
1.1 - Recent reputational events
In the recent past several events involving large, well known international companies drew
public attention on the potential impacts of reputational risk. Among the most relevant
ones the following can be mentioned:
Peanut Corporation of America – contaminated products (2008-2009). By
repeatedly shipping products known to carry salmonella, the food manufacturer
was responsible for at least nine fatalities and the largest food recall in US history.
Federal investigations blamed a toxic, profit-at-all-costs culture that led to ignore
regulatory compliance requirements to the extent of falsifying food safety
certificates. In the face of public and political outrage, the company halted
operations and filed for bankruptcy soon afterwards.
Arthur Andersen – inadequate scrutiny of Enron’s accounts (2001). Enron’s
bankruptcy highlighted Arthur Andersen’s failure to fulfill its core professional

Introduction
15
responsibilities and the inherent conflict of interests between the accountancy
firm’s audit division and its consulting practice. Andersen’s conviction for
obstruction of justice (later overturned) led to the company surrendering its US
licenses to practice and the subsequent unviability of its international operations.
UBS – rogue trader (2011). The announcement of trading losses amounting to
more than $2.3 billion led to a decline in the bank’s share price, greater regulatory
scrutiny, and the resignation of several top executives.
News Corporation – phone hacking (2011). Widespread outrage following the
admission that News of the World UK newspaper had accessed the voicemails of
hundreds of celebrities and victims of crimes resulted in legal claims and
redundancies costing in excess of $340 million. Additional damages included the
closure of the newspaper, a 30%-40% reduction in sales and advertising revenues
in the replacement paper, the government block of the parent company’s attempt to
take full ownership of the broadcaster BSkyB, and increased regulatory control on
journalistic practices.
BP – oil spill (2010). The blowout on Deepwater Horizon rig had widespread
impact beyond the operational losses from containment and cleanup. In financial
terms, it brought to a 50% fall in the share price, the failure to pay dividends for
three quarters, litigation with individuals and affected US states involving more
than $42 billion of payouts and the need for $38 billion asset sales. In strategy
terms, the company abandoned the solar and wind sectors and was banned from
bidding for new government contracts in the US. The firm fell from being the
second to the fourth-largest oil company worldwide in terms of market value.
Toyota – defective accelerators and brakes (2009-2011). The need to recall more
than 14 million vehicles worldwide led to an estimated global loss of $2 billion in
repairs and missed sales, in addition to at least $1.1 billion in litigation, settlements
and fines. Toyota’s US market share tumbled from a market-leading 17% in early
2009 to a 14,4% third place in 2012, behind Ford and General Motors.
Olympus – concealment of losses (2011). Discovery of the long-term high-level
cover-up of major accounting irregularities raised major questions about corporate
governance and the quality of the company’s assets. The scandal rapidly drained
Introduction
16
investor confidence, with the share price falling nearly 80% over one month and
not recovering for 17 months.
Major banks – Libor market manipulation (2012). The discovery of secret,
longstanding attempts to interfere with the open market rate setting revealed
remarkable governance shortfalls in banks such as Barclays and UBS. The
systemic effects of such behaviors resulted in senior executives resignations,
greater regulatory scrutiny and reform of the Libor rate-setting mechanism.
1.2 - Why reputation and reputational risk have become more and more
important in the last few years?
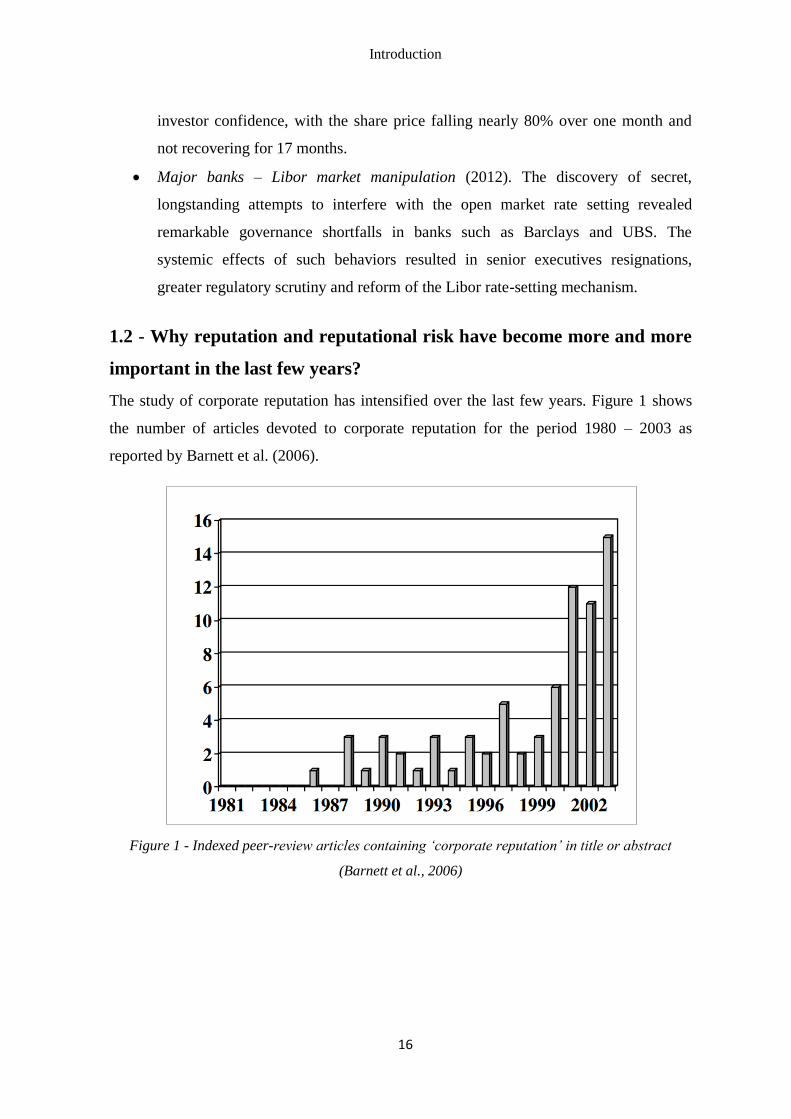
The study of corporate reputation has intensified over the last few years. Figure 1 shows
the number of articles devoted to corporate reputation for the period 1980 – 2003 as
reported by Barnett et al. (2006).
Figure 1 - Indexed peer-review articles containing ‘corporate reputation’ in title or abstract
(Barnett et al., 2006)

Introduction
17
As highlighted by the authors, the average number of scholarly articles on corporate
reputation published during the period 2001 – 2003 was nearly five times as large as was
the average for the period 1990 – 2000.
Figure 2 shows the number of papers dealing with corporate reputation for the period
1995-2015. To determine the trend, peer-reviewed articles containing “corporate
reputation” in the title or abstract or key words published in academic journals indexed by
SCOPUS were searched (Elsevier, 2015).
Figure 2 – Number of articles containing ‘corporate reputation’ in title or abstract or key words
published in the period 1995-2005 by year (Elsevier, 2015)
The trend of the last 20 years shows a dramatic increase of academic papers on reputation .
Among a total of 1814 documents, one third (27,1%) were published from 2013 until now.
Considering the nationality of the corresponding author (figure 3), western countries and
Australia published most of the articles but China is increasing its involvement in such
topic.

Introduction
18
Figure 3 – Number of articles containing ‘corporate reputation’ in title or abstract or key words
published in the period 1995-2005 by country (Elsevier, 2015)
There is a number of reasons why reputation and reputational risk have become a major
source of concern for organizations. The most notable ones are:
Globalization - Two aspects related to globalization can have a reputational relevance. The
first is represented by poor employment conditions in emerging market factories
supplying large multinationals. In recent years, there has been a steady stream of tragedies
and controversies related to employment conditions in emerging market factories that
supply large multinationals (The ACE Group, 2013).
The second aspect is related to the increased focus on fraud and corruption in foreign
subsidiaries. Dealing with fraud and corruption risks has become a major board-level
challenge for many multinationals. Investors, regulators and other stakeholders are
increasingly seeking evidence that these risks are properly controlled. Managing these
challenges across highly complex global supply chains has become a major source of
reputational risk.
Internet and media –The unpreceded accessibility of data via the Internet made stakeholders
more demanding than ever before. The ability of businesses to provide the right information
at the right time has itself become a key business competence and a driver of reputation. At
the same time, media are becoming more intrusive and sensational: when crisis hit,

Introduction
19
companies have now to operate under the pressure of invasive and often simplifying media
reports. Therefore, crisis management has become an even more delicate and complex task,
pushing organizations to develop elaborate crisis management policies.
Growth of intangible assets – Ocean Tomo (2011) reported a significant increase of
intangible assets from 1975 to 2010 (figure 4): average market value of a Standard &
Poor’s 500 company in 1975 consisted only of 17% intangible assets while it has grown up
to 80% by 2010.
Figure 4 - Components of Standard & Poor’s 500 company Market Value(Ocean Tomo, 2011)
Much of this is ‘off balance sheet’ and does not form part of the business’s quoted net
assets. Generally accepted accounting principles are under increasing criticism for their
failure to recognize and measure intangible assets. In the US the Financial Accounting
Standards Board (FASB) is working on rules that will require US companies to disclose
information regarding intangible assets such as customer lists, brands and technology.
Having so much of a business’s true value ‘off balance sheet’ implies that the current
market valuation heavily depends on investors’ confidence.
Regulation - As companies continue to globalize, and as governments seek to impose
stricter controls on corporate behaviors in the wake of the recent financial crisis, the
perception among many companies is that the regulatory environment has become more
difficult than ever to manage. Compliance has taken on a new importance for many

Introduction
20
companies and they are now more aware of its link with their reputation. From a
reputational risk perspective, compliance failures send out the message that companies
may be failing to manage the broader risks to the company.
1.3 - How do managers see reputational risk
The growing importance of reputational risk is confirmed by top executives and risk
managers insights.
The first extensive survey carried out on this topic was conducted by The Economist in
2005. Most respondents agreed that reputation was a primary asset for their organization
and acknowledged that the risk to their organization’s reputation had significantly increased
over the previous five years. They also recognized that reputational risk is harder to manage
than other sorts of risk, largely because of a lack of established tools and techniques and
confusion about who is responsible for it.
When asked to rank their concern over different risk categories respondents clearly
identified reputational risk as their top priority. Regardless of how reputational risk was
defined, it was acknowledged as the business top concern. There was however little
agreement upon how it should be treated and weather it constituted a “self-standing” risk.
The landscape has not considerably changed in the last decade. Recent surveys by Deloitte
(2014) and The Ace Group(2013) found that reputational damage was still the top concern
for organizations and that yet most of them have difficulties in managing it due to a lack of
quantitative methodologies.
It is curious to note that while tools and techniques for managing monetary risks multiplied,
so little has been achieved in the field of managing reputation.

Reputation and reputational risk
21
2. Reputation and reputational risk
The objective of this section is to introduce key definitions and mechanisms related to
reputation and reputational risk.
2.1 - Definitions of corporate reputation
The first step towards a comprehensive definition of reputational risk is certainly
understanding the concept of reputation.
An overview of academic literature and business publications on corporate reputation
reveals a lack of consistency in the terminology used by academics and risk managers.
This is probably because reputation has been analyzed from a multitude of different
perspectives and within a variety of different disciplines: economics, accountancy,
sociology, marketing, organizational behavior and strategy.
Figure 5 - Number of articles containing ‘corporate reputation’ in title or abstract or key words
published in the period 1995-2005 by discipline (Elsevier, 2015)

Reputation and reputational risk
22
Figure 5 shows the number of peer-reviewed articles on corporate reputation published in
academic journals and indexed by SCOPUS (Elsevier, 2015) in the period 1995-2015.
Most of the papers belong to the fields of economy and finance; however, there is a good
number of journals of social disciplines and a certain representation of other different
disciplines.
Some of the most remarkable definitions of corporate reputation are mentioned in Table 1.
Table 1 – Definitions of corporate reputation
Author Definition
Herbig & Milewicz
(1993)
‘reputation is an aggregate composite of all previous transactions
over the life of the entity, a historical notion, and requires
consistency of an entity’s actions over a prolonged time’
Fombrun (1996) ‘a perceptual representation of a company's past actions and future
prospects that describes the firm's overall appeal to all of its key
constituents when compared with other leading rivals’
Bromley (2000) ‘(. . .) the way key external stakeholder groups or other interested
parties conceptualise that organization’
‘reputation can be defined as a distribution of opinions (the overt
expression of a collective image) about a person or other entity, in a
stakeholder or interest group’
Schultz et al. (2001) ‘reputation combines everything that is knowable about a firm. As an
empirical representation, it is a judgement of the firm made by a set
of audiences on the basis of perceptions and assessments’
Gotsi & Wilson
(2001)
‘a corporate reputation is a stakeholder’s overall evaluation of a
company over time. This evaluation is based on the stakeholder’s
direct experience with the company, any other form of
communication and symbolism that provides information about the
firm’s actions and/or a comparison with the actions of other leading
rivals’

Reputation and reputational risk
23
Mahon (2002)
‘reputation is an asset in relation to expectations of organizational
behavior based on past actions and situations’
Schwaiger (2004) ‘we conceptualize reputation as an attitudinal construct, where
attitude denotes subjective, emotional, and cognitive mindsets’
Walsh & Beatty
(2007)
‘the customer’s overall evaluation of a firm based on his or her
reactions to the firm’s goods, services, communication activities,
interactions with the firm and/or its representatives (e.g. employees,
management) and/or known corporate activities’
A systematic review of the literature on corporate reputation was conducted by Walker
(2010) on a sample of 54 well-cited papers (and one book). Of the 43 articles in the sample
that examined corporate reputation, only 19 provided a definition and 5
referenced Fombrun's (1996) definition. According to Walker three key attributes are
emphasized in Fombrun's definition: (1) reputation is based on perceptions, (2) it is the
aggregate perception of all stakeholders and (3) it is comparative.
The first definitional attribute is that reputation is based on perceptions. This implies that
reputation is somehow out of the control of a corporation. As pointed out by Fombrun
(1996): ‘because a reputation is not directly under anyone's control, it is difficult to
manipulate’.
Second, reputation reflects the aggregate perception of all stakeholders. This highlights two
important components of reputation: (1) it is a social/collective concept, (2) it is based on
the perceptions of all stakeholders. There are two main problems with viewing corporate
reputation as an aggregate perception. The first one is that reputation is often issue specific.
A corporation might have specific and potentially different reputations in each of the
following areas: profitability, employees treatment, environmental and social responsibility,
corporate governance and product quality. The second problem is that a corporation may
have a different reputation for each stakeholder group. Different stakeholders may have
different perceptions regarding the organization. An organization may have, for instance, at
the same time, a good reputation among its stockholders and a less good one among its
employees (Fombrun, 1996; Bromley, 2000; Mahon, 2002).

Reputation and reputational risk
24
The third definitional attribute is that reputation is comparative. Fombrun's (1996) definition
specifies that this comparison is with ‘other leading rivals’. But this comparison is not
necessarily with rivals alone, it can be based on a number of different criteria. For example,
comparisons can be made with a firm’s previous reputation (longitudinal comparison) or
against an industry average (Wartick, 2002).
According to Walker (2010) two additional attributes of reputation emerge from the
literature. The first one is that a definition of corporate reputation must recognize that it can
be positive or negative (Mahon, 2002; Rhee & Haunschild, 2006). The second is that
reputation is described as stable and enduring (Rindova, 1997; Gray & Balmer,
1998; Mahon, 2002; Roberts & Dowling, 2002; Rhee & Haunschild, 2006).
2.1.1 - Corporate reputation, identity, image and brand
Part of the confusion around the definition of corporate reputation also stems from the
different perspectives regarding the relationship between corporate reputation and its
components: identity and image.
As regards corporate image there has even been a debate on whether it differs from
reputation. Gotsi & Wilson (2001) analyzed a set of different points of view on reputation
and found that there are two clearly defined schools of thought: an “analogous” school of
thought and a “differentiated” one. The analogous school considers corporate reputation as a
synonym with corporate image. For the differentiated school corporate reputation and image
are different, although interrelated (e.g., reputation influences image).
Corporate identity has been defined as one of the attributes of a company that addresses the
questions ‘What are we?’ and ‘Who are we?‘ (Balmer & Greyser, 2003) but its relationship
with reputation has been quite disputed.
Fombrun (1996) provides a cohesive and widely accepted framework that clarifies
relationships between reputation, identity and image. He suggests that identity may be
extended through names and self-presentations and projected through customers,
community and employees images, into corporate reputation. Identity serves as a mean of
differentiation on the basis of culture, history and operations (including management).
Fombrun sees corporate image as sometimes accurately reflecting a company‘s identity.
Hence, corporate reputation begins to emerge as an outcome of image, plus relationships,

Reputation and reputational risk
25
plus corporate performance. However, the image can be distorted (a) as the company tries to
manipulate its public through advertising and other forms of self-presentation, or (b) as
rumors develop from unofficial statements of employees to peers, analysts, and reporters. If
the fit is right, suggests Fombrun (1996), between image and the underpinning corporate
identity, it will have enduring value. Figure 6 illustrates the Fombrun’s construct on the
relationship between identity, image and reputation.
Figure 6 – Fombrun’s ‘From identity to reputation’ construct (Lloyd, 2007)
Warner (2010) analyzed the definitions of the three terms (organizational identity,
organizational image, and corporate reputation) in 54 papers. A major point of
differentiation between the three terms is whether the concept refers to internal or external
stakeholders, or both. There is a clear tendency for organizational identity to refer to internal

Reputation and reputational risk
26
stakeholders only, for organizational image to refer to external stakeholders only, and for
corporate reputation to refer to both categories.
The most common definition of organizational identity is the one provided by Whetten &
Mackey (2002), who define it as ‘that which is most central, enduring, and distinctive about
an organization’. Identity has been frequently considered as the ‘core’ or ‘basic character’
(Barnett et al., 2006) of the firm from the employees perspective. Fombrun (1996) described
identity as ‘the features of the company that appear to be central and enduring to
employees’. Identity takes shape inside the company, based on its organization’s culture. It
consists of current practices, history, values and behavior (Melewar et al., 2005).
Image takes shape inside the mind of external stakeholders; it refers to their impression of
the organization influenced over time by direct or indirect experiences: in other words, it
reflects how they perceive the organization’s identity at a given point in time (Balmer &
Greyser, 2002; Melewar et al., 2005). Organizational image, also defined as corporate
communications, can be described as ‘the various outbound communications channels
deployed by organizations to communicate with customers and other constituencies’
(Balmer & Greyser, 2006). Balmer summarized the concept of corporate image in the
following key question: what is the current perception and/or profile? Corporate image is in
relation to the immediate mental perception of the organisation held by an individual, group
or network.
In contrast with organizational image, definitions of corporate reputation refer
to actual stakeholders (both internal and external). Time was an important distinction
between image and reputation because building a reputation takes time (Mahon,
2002; Roberts & Dowling, 2002; Rhee & Haunschild, 2006; ). Image, on the other hand,
changes frequently and may result in quickly obtained perceptions of a firm. Reputation is
relatively stable and persisting, it is ‘distilled over time from multiple images’ (Rindova,
1997).
Corporate reputation has been defined as the accumulation of images over the years (Gotsi
& Wilson, 2001; Mahon, 2002). Gray & Balmer (1998) discuss how ‘image can be attained
relatively quickly but a good reputation takes time to build’. Therefore, unlike image,
corporate reputation takes time to build but, once built, it is relatively stable. It is also true
that even if reputation is characterized by a certain stability, serious accidents can shake it

Reputation and reputational risk
27
thoroughly. A quote attributed to Warren Buffet, a US financier, says: ‘It takes 20 years to
build a reputation and five minutes to ruin it.’
Corporate branding emerged as a key concept in the late 90s (Burt & Sparks, 2002). It has
clear links with corporate image, corporate identity and corporate reputation but may
represent a shift away from Fombrun‘s (1996) identity/image/reputation model. From an
internal point of view corporate branding is seen to signal messages about a desired culture.
Externally it can facilitate customers to look deeper into the corporation and, through
building respect and trust with the corporation's offerings, encourage consumers to accept
the corporation's promises about other offerings (de Chernatony, 1999; Balmer, 2001).
According to Balmer (2001) corporate brand is summarized by the question: what is the
promise inferred from/ communicated by the brand? Brand has to do with all the elements
of identity, symbols and promises the company develops in order to differentiate its
products and services from those of its competitors (Reputation Institute, 2008).
The corporate brand was defined by Knox & Bickerton (2003) as ‘the visual, verbal and
behavioral expression of an organization‘s unique business model‘.
2.1.2 - Reputation benefits
Fombrun (1996) describes reputations as strategic assets that ‘produce tangible benefits:
premium prices for products, lower costs for capital and labor, improved loyalty from
employees, greater latitude in decision making and a cushion of goodwill when crises hit’.
Good corporate reputations have strategic value for the firms that possess them (Robert &
Dowling, 2002). Several studies confirm the expected benefits associated with good
reputations (Fombrun & Shanley, 1990; Podolny, 1993; Landon & Smith, 1997). Firms with
good reputations benefit from lower costs and can charge higher prices (Podolny, 1993;
Deephouse, 2000; Rindova et al., 2005), are better able to sustain superior profit outcomes
over time (Roberts & Dowling, 2002), have better ability to communicate the quality of the
company’s services (Engert, 2002), enjoy protection against market entrants (Deephouse,
2000), attract better human resources (Turban & Greening, 1997; Morrison & Wilhelm Jr.,
2003), have easier access to the capital market (Fleischer, 2004; Smith et al.,2008;) and

Reputation and reputational risk
28
experience greater returns relative to actual quality (Roberts & Dowling, 2002) than firms
with poor reputations.
Neville et al. (2005) suggest a relationship between corporate reputation and corporate
performance, measured in both financial and social terms. Mukherjee & He (2008) analyze
the impact of reputation on performances, making a distinction based on stakeholders’
expectations (in particular senior managers, employees and clients). They demonstrate how
companies having higher reputation are able to reduce the gap between expectations and
results.
Feldman et al. (2014) summarized the main benefits of a strong corporate reputation as:
Improving the consumer’s perception of the quality of products or services (which
allows to charge premium prices): sale increases and positive world-of-mouth
Improving the capacity of hiring and retaining qualified personnel in corporations
Raising the morale of employees and therefore productivity
Protecting the value of the enterprise by diminishing the impact of scrutinizing,
crisis and/or competitive attacks
Preceding and helping international expansion, not only in terms of market
penetration but also in preparing the scenery in key communities and facilitating
alliances
Attracting a greater number of investors (good credibility): rise of market value
(EBITDA) and diminishing risks for the organization
Differencing the company from its competitors and establishing better market
positioning
Allowing access to cheaper capital.
Good corporate reputation is critical because of its potential for value creation, but also
because its intangible character makes replication by competing firms considerably more
difficult.
In transactions between buyers and sellers, if buyers are unable to understand the actual
quality of the product before purchasing but sellers are fully informed, a situation of
asymmetric information is present. In such situations, an organization’s reputation serves as
a signal of not observable quality, which allows an organization with a high reputation to

Reputation and reputational risk
29
obtain more benefits than low reputation organizations of the same quality (Rhee &
Haunschild, 2006). Company’s reputation provides a solution to the problem of uncertainty
in an asymmetric information system (Podolny & Hsu, 2002).
A good reputation could protect firms from the uncertainties of the market because of the
inertial properties of reputations. Several theories suggest that status orderings are inertial,
or even that success breeds success (and failure breeds failure) (Podolny, 1993). But
reputation can be also considered as a “double-edged sword”, that is it can have a significant
downside: when firms make mistakes, those with a good reputation can suffer more than
those with poor reputations (at least in situations of easy product substitutability). Rhee &
Haunschild (2006) demonstrated that a good reputation is less advantageous than a poor
reputation in absorbing the impact of product defects, and so high reputation firms are more
likely to be punished by the market. In some situations good reputation can be recognized as
an organizational liability.
Carroll (1979) was among the first researchers to offer a definition of corporate social
responsibility and to understand the need to invest on corporate reputation. Reputation
becomes therefore a measure of the sustainable value created by a company. Sacconi (2004)
provides a definition of social responsibility based on the concepts of social contract,
conformism and reputation. Harrington (2003) proposes empirical checks aimed at
highlighting such relationship; he shows in particular how companies investing in social and
environmental sustainability enjoy higher market values. Similar results were obtained by
Johnson & Greening (1999) and Cox et al. (2004).
At the opposite side some theories suggest that corporate image cannot be a relevant factor
in determining a company’s value and that it has no impact on the investment risk premium.
According to Gabbi & Patarnello (2010), some authors believe that management has no
incentive to invest on reputation, because such investment would not produce returns, at
least not in terms of market value.

Reputation and reputational risk
30
2.2 - Definition of reputational risk
Textbooks and papers which explicitly refer to the concept of reputational risk are relatively
recent.
Analyzing scientific articles containing ‘reputational risk’ in the title, abstract or key words,
a total of 227 papers were found in SCOPUS (Elsevier, 2015), most of which were
published in the last ten years (Figure 7).
Figure 7 - Number of papers on “reputational risk” published on journal indexed by SCOPUS
(Elsevier, 2015)
There is not a universally accepted definition of reputational risk (Soprano et al., 2009).
According to Fombrun et al. (2000), the fluctuating value of a company’s reputation has
been defined as reputational capital and calculated as the market value of a company in
excess of its liquidation value and intellectual capital. It constitutes the residual value of a
company’s intangible assets over and above its stock of patents and know-how. A
company’s reputational capital is therefore the portion of its value that is at risk in everyday
interaction with stakeholders. As a consequence, Fombrun et al. (2000) define reputational
risk as the range of possible gains and losses in reputational capital for a given firm.
Other definitions of reputational risk provided by other authors are listed in Table 2.

Reputation and reputational risk
31
Table 2 - Definitions of reputational risk
Author Definition
Rayner (2003) ‘reputation risk is any action, event or circumstance that could
adversely or beneficially impact an organisation’s reputation’
Board of Governors of
the Federal Reserve
System (2004)
‘reputational risk is the potential that negative publicity
regarding an institution’s business practices, whether true or
not, will cause a decline in the customer base, costly litigation,
or revenue reductions’
Perry & de Fontnouvelle
(2005)
‘in general a reputational risk is any risk that can potentially
damage the standing or estimate of an organization in the eyes
of third-parties’
Basel Committee on
Banking Supervision
(2009)
‘reputational risk can be defined as the risk arising from
negative perception on the part of customers, counterparties,
shareholders, investors, debt-holders, market analysts, other
relevant parties or regulators that can adversely affect a bank’s
ability to maintain existing, or establish new, business
relationships and continued access to sources of funding’
Young (2010) ‘reputational risk is a set of material consequences that arises
when stakeholders’ opinions influence their decision making
outcomes’
One of the disputed aspects about reputational risk is whether it should be considered as a
self-standing risk. According to the white paper of the Economist Intelligence Unit (2005),
there is a dispute over the very nature of reputational risk. Some consider it a specific risk
with clear drivers and tangible business consequences, even if these are difficult to quantify.
For others it is a “risk of risks” that does not exist on a standalone basis. A third point of
view is that reputation risk is not at all a risk, but only an outcome of other risks. All
together, these three views grasp the essence of reputation risk. There are few reputational
threats that are not interconnected with one type of business problem or another.

Reputation and reputational risk
32
Respondents to the survey of the Economist considering reputational risk as a category of
risk on its own or viewing it as stemming from a variety of other risks are virtually equally
weighted. Nevertheless, most companies participating in the survey see reputational risk as
a problem which requires its own, specific solutions. Approximately three-quarters of the
companies disagree with the statement, ‘a well-run business doesn’t need to invest extra
resources into guarding against reputational risk’.
2.3 - Stakeholders
As previously seen, definitions of reputation and reputational risk cannot ignore the concept
of stakeholders: they have meaning only when considered in relation to stakeholders.
Stakeholders are any group that can affect or be affected by the behavior of an organization
(Bryson, 2004).
An organization’s reputation resides with a wide range of interested parties. The most
important ones are customers and investors. At a second level, regulators play a key role,
setting and enforcing standards. Employees’ motivation directly influences productivity and
service quality, and they represent the human face of the organization.
The general public may be affected by the organization’s actions, directly or indirectly, and
may respond unfavorably if they feel their interests are endangered. These groups are
neither mutually exclusive nor independent from each other. Indeed, the mechanisms of
feed-back between them require special attention.
A global study by the World Business Council for Sustainable Development (Holme &
Watts, 2000) identified nine categories of stakeholders:
Company owners/shareholders/investors
Employees
Customers
Business partners
Suppliers
Competitors
Governments/regulators
NGOs, pressure groups/influencers
Communities.

Reputation and reputational risk
33
The list includes those groups that have a clear, direct and legitimate financial or other
‘stake’ in the business (such as its employees and investors), as well as groups that have an
indirect interest (such as NGOs, pressure groups and other influencers). These latter groups
often see themselves as representing voiceless or disenfranchised communities, the general
public, animals or the natural environment.
According to Rayner (2003):
employees have expectations from the organisations they work for. Research has
shown that a good reputation for responsible behavior is a significant factor in
recruitment, particularly of graduates. If reputation is poor, the company is likely to
have difficulty both recruiting and retaining high-quality staff. If it is good, the
company can enter into a virtuous circle attracting high-quality recruits who, through
their presence, further enhance reputation.
consumers, moved by ethical awareness and an abundance of supporting data
(provided by the media, pressure groups and the internet) are faced with a wide
choice of products and services (Rayner, 2003). They are in an ideal position to
switch brands or boycott products if they have concerns about the reputation of the
supplier. However, it would be unwise to assume that consumers always do as they
say. Previous studies have identified a so called ‘Ethical Purchasing Gap’ (Nicholls
& Lee, 2006), or 30:3 syndrome, whereby approximately a ‘third of consumers
declare to care about companies’ policies and records on social responsibility, but
ethical products rarely exceed a 3% market share’ (Cowe & Williams, 2000). This
evidence suggests that while ethical awareness and commitment might be
widespread, most of the time this is not translated into purchasing action.
pressure groups and NGOs have an increasing power. These organisations have
learned how to mobilise public opinion by skilful and timely use of the media, and
how to work, when necessary, with other stakeholder groups to maximise impact.
The growing influence of NGOs is recognised by businesses and major investor
groups. Working in collaboration with an NGO could convert your most violent
critic into your best fan. Of course, real life is not always as straightforward. The
ethos and approach of some pressure groups may preclude any form of discussion or
collaboration with the ‘enemy’.

Reputation and reputational risk
34
The various stakeholders are often not discrete, mutually exclusive groups; they frequently
have overlapping interests. An individual may wear a number of stakeholder ‘hats’ in
relation to a single organisation. An individual may be an employee, customer, supplier or
shareholder of a specific business as well as a member of the local community in which the
business operates (Rayner, 2003).
The different groups of stakeholders have a specific relation with companies. These
relationships were classified in the Report of the Conference Board (Tonello, 2007) as:
Enabling relations - Shareholders, bondholders, banks, institutional investors, suppliers, and
employees are key stakeholders because they provide and control resources enabling the
organization to exist and operate.
Customer relations - Customers are key stakeholders because they provide demand for
business output.
Normative relations - Professional associations, trade unions, legislatures, governmental
agencies, financial analysts, rating agencies, and other self-regulatory organizations may be
key stakeholders as they function as standard-setters and determine the boundaries of the
company’s business activities.
Peer relations - Other business organizations (including competitors) may be key
stakeholders if they participate in a joint venture, a non-compete agreement, or other
strategic relationships with the company.
Special interest relations - Local communities and a number of activist groups (such as
social and environmental organizations) may be key stakeholders as they have widespread
interest in and claims on the company.
2.4 - Impacts
Enjoying a good reputation has several rewards, among which the continuing trust and
confidence of customers, investors, regulators, employees, suppliers and other stakeholders,
the ability to differentiate the business and to create competitive advantage. On the contrary,
a bad reputation can result in a loss of customers, low employees’ motivation, shareholders’
dissatisfaction and ultimately the fall of the business itself (Gaultier-Gaillard et al., 2009).

Reputation and reputational risk
35
According to Gaultier-Gaillard et al. (2009) reputation may impact the relationships of the
company with its stakeholders:
Stockholders’ decisions to hold onto their shares
Customers’ desire to buy products and services
Suppliers’ desire to establish partnerships
Competitors’ eagerness to enter the market
Media coverage
Pressure groups/NGO activity
Control and regulatory authority attitudes
Cost of capital
Recruitment of high potential individuals
Motivation of current workforce
Inclination of stakeholders to grant the benefit of the doubt when a crisis emerges.
As a consequence there are several paths by which reputational risk can induce losses for a
firm (Perry & de Fontnouvelle, 2005; Soprano et al., 2009):
Loss of current or future customers
Loss of employees or managers within the organization, an increase in hiring costs,
or staff downtime
Reduction in current or future business partners
Increased costs of financial funding via credit or equity markets
Increased costs due to government regulations, fines, or other penalties”
Fall in the company’s share prices
Increased costs to recover image and branding (advertising strategy, market
communication policy).
According to a recent survey by Deloitte (2014), when a reputation risk spirals out of
control, there can be a wide range of negative impacts. However, revenue and brand value
are key. In the survey, 41% of respondents (C-Level executives, board members or
specialized risk executives) who experienced a reputational risk event say loss of revenues
was the biggest impact. This was particularly true for consumer goods and energy
companies. The same number of respondents (41%) say loss of brand value was the key
impact. This was especially true in the life sciences and technology sectors.

Reputation and reputational risk
36
Regarding organizational aspects, Desai et al. (2006) analyze sanctions for top managers
who infringed accounting and financial standards. Their research shows how such situations
have a negative impact on career development opportunities and bring to higher
management turnover. Chalmers & Godfrey (2004) show how news related to improper
behaviors in the field of derivatives have a positive correlation with reputational impact, for
both corporations and managers.
Thies (2002) shows how a meaningful sample of companied audited by Arthur Andersen in
the period following the Enron fraud significantly underperformed their reference index and
comparable companies audited by other firms (Price Waterhouse, Ernst & Young, Deloitte
& Touche, KPMG, Coopers & Lybrand). Such conclusion suggests that in sectors
characterized by a significant fiduciary component reputational damage has systemic
implications and can transfer to the stakeholders of the company involved.
2.5 - Upsides and downsides
Reputational risk should be viewed as a generic term encompassing the risks, from any
source, that can have an impact on reputation, and not as an independent category of risk.
Non compliance to regulations, unethical employee behavior, loss of customer data or an
unexpected profit warning can all damage reputation and stakeholders’ confidence.
Reputational risk not only regards downside threats, but also upside opportunities. Climate
change, for example, is a potential business threat. However, many firms have spotted and
exploited the opportunity for gaining a competitive advantage by developing green
technologies and promoting themselves as environmentally friendly, enhancing in this way
their reputation. Reputation risk can therefore be defined as follows: anything that
could impact reputation, either negatively (threats) or positively (opportunities) (Rayner,
2008).
Rayner (2003) highlighted that there is a rising expectation for business behavior which
presents new opportunities to enhance corporate reputation by being reliable, trustworthy,
accountable and transparent. Organizations that actively rise to the emergent challenges
presented by the new demands and expectations have a unique opportunity to enhance their
reputation.

Reputation and reputational risk assessment
37
3. Reputation and reputational risk assessment
The objective of this chapter is to present the most significant techniques proposed and
implemented for the estimation of reputation and reputational risk.
Assessing reputation and reputational risk is widely acknowledged as a very complicated
task. Both for reputation and for its risk numerous qualitative and quantitative models have
been proposed.
3.1 - Measuring corporate reputation
Empirical efforts aimed at measuring reputation value have for long time been very limited
(Fombrun & van Riel, 1997; Barnett et al., 2006) showed the exponential increase from the
beginning of the 80s of articles having the words “corporate reputation” in their title or
abstract. Such trend intensified after a few cases of reputational damage which produced
significant losses for the investors and had a devastating impact on the reputation of the
companies involved.
The theory is simple: an organization enjoys a good reputation when it consistently meets or
exceeds the expectations of its stakeholders. A bad reputation results when the
organization’s words or deeds fall short of stakeholder expectations. However, effectively
assessing its monetary value or even its qualitative level is definitely a complex procedure.
As previously mentioned there are both qualitative and quantitative methods to measure
reputation. While the qualitative methodologies purpose is to assign a numeric score to the
level of reputation of an organization, quantitative methodologies attempt to assess the
monetary value of the whole reputation capital or at least of some of its components.
3.1.1 - Qualitative methods
The most common qualitative method for assessing the level of reputation is represented by
reputation indexes.
In the past twenty years, several qualitative-index methodologies to measure reputation have
been suggested and implemented. The common feature of these models is that they are all
Reputation and reputational risk assessment
38
survey-based methods: they ask to a pool of respondents to express their opinion of a
company with reference to a specific set of reputational dimensions and subsequently
translate such views into a synthetic score.
Some of the numerous reputation indexes are:
Fortune’ Overall reputation quotient (AMAC and GMAC)
The reputation Institute’s Reputation Quotient (from 2006 RepTrak System)
Merco’s rating (Business Monitor of Corporate Reputation).
The main difference between these ratings are the different classifications of the
determinants of reputation.
This phenomena can be observed in literature as well: a wide array of reputation taxonomies
has been proposed by a number of researchers (Fombrun & Gardberg, 2000; Schwaiger,
2004; Honey, 2009).
The most notable reputation indexes are the Reputation Institute’s “Reputation Quotient”
and Fortune’s “Overall Reputation Score” (ORS).
Fortune magazine compiles an annual survey America's Most Admired Companies
(AMAC) via a poll among executives, managers and financial analysts. The rating is based
on evaluation of 500 largest U.S. companies. From 1997 Fortune extended the rating to the
rest of the world publishing yearly a survey named GMAC (Global Most Admired
Companies).
Table 3 – ORS dimensions
1. Quality of management
2. Financial soundness
3. Quality of products or services
4. Ability to attract, develop, and keep talented people
5. Innovativeness
6. Responsibility for the community and the environment
7. Long-term investment value
8. Wise use of corporate assets

Reputation and reputational risk assessment
39
The Fortune magazine annual surveys provide an index based on scores obtained by the
companies in eight dimensions each with an 11-point scale (table 3).
The Reputation Quotient (CR) was developed by the Reputation Institute jointly with Harris
Interactive in 1998. The questionnaire they use to measure reputation consists of 20 items
divided into 6 pillars (Table 4).
Table 4 - Pillars and Items of the RQ scale
Pillars Items
1. Emotional appeal Have a good feeling about the company
Admire and res pect the company
Trust the company a gread deal
2. Products and services Stands behinf its products and services
Develops innovative products and services
Offers high quality products and services
Offers products and services that are a good value
for the money
3. Financial performance Has a strong record of profitability
Looks like a low risk investment
Tends to outperform its competitors
Looks like a company with strong prospects
4. Vision and leadership Has excellent leadership
Has clear vision for its future
Recognizes and takes advantage of market
opportunities
5. Workplace enviroment Is well managed
Looks like a company to work for
Looks like a company that would have good
employees
6. Social and enviromental
responsibility
Supports good causes
Is an enviromentally friendly company
Mantains high standards in the way it treats people

Reputation and reputational risk assessment
40
The Reputation Quotient (RQ) is a measure for comparing the reputations of firms in
different fields of operation (Fombrun et al., 2000), but among customers only and not
across various stakeholder groups. Companies were given an overall rating on a set of
attributes, than those ratings are used to calculate a ratio between the rating of a selected
company and the rating of the average company.
The RQ has been successively substituted by a new index to assess reputation: the RepTrak
Index. The RepTrak System has been developed by the Reputation Institute in 2006. This
index shares most of the RQ dimensions; the main difference relies on the different weights
assigned to different stakeholders. In fact since each stakeholders considers the drivers
differently (e.g. for customers product quality is more important than other financial
performances), different weights are assigned to the dimensions.
Alternative index methodologies
According to Bromley (2002) some of the main corporate reputation indexes that currently
exist present a biased nature. The source of the bias can usually be tracked to the selection
of respondents and selection of the evaluation criteria (Feldman et al., 2014). Most rankings
lack a representative sample of stakeholders as respondents; they focus only on the
perceptions of managers and business consultants, or only on the perception of consumers.
Also the items chosen and the weights assigned reflect the nature of respondents. He
therefore proposes some alternative methods that should produce more robust results.
One approach is to assess corporate reputation with a benchmarking method (Bromley,
2002). A benchmark is defined as a surveyor’s mark indicating a point of reference for
levelling. The concept of a reputational benchmark implies setting up a standard (ideal or
average) reputation against which other reputations are compared. A benchmarking system
would involve a representative sample of comparable companies in a particular business
sector. Well-informed respondents would rate those companies on a set of operationally
defined scores. The scores would have to be normalized, that is, made to fit a normal
distribution.
An alternative approach to constructing a table of reputation based on a standard rating scale
would be to use a free description method (Bromley, 2002). This enables respondents to list
various attributions, based on their personal interests and experiences. Respondents would

Reputation and reputational risk assessment
41
be drawn from selected stakeholders, depending on the purpose of the research. The more
frequently mentioned attributions could then be used to construct a league table of merit
using a methodology similar to that associated with the Fortune surveys. Differences in the
frequency of occurrence of attributions in a free-description exercise could indicate their
relative importance, or at least their familiarity or salience at the time.
The case comparison method (Bromley, 2002) tries to assess which combination of
qualitative factors determines how cases (companies) can be classified into types, and which
combination of factors determines a particular outcome, such as the success or failure of a
business enterprise, a substantial change in corporate reputation, or a relatively high or low
level of public esteem. The method is made more rigorous by applying Boolean procedures.
The case comparison method allows to take into account the difference between the average
score and the score profile. Two or more companies may achieve the same average rating
even if they differ, possibly substantially, on some or all of the attributes. They would
therefore have rather different reputations. The mean scores do not reveal differences in the
score profiles, which may be important in classifying cases or in identifying causal
processes. The mean can be derived from a profile, but not vice versa.
The Quasi-Judicial case method is modelled on judicial procedures for dealing with
individual cases. The pattern of argument revealed by substantive logic may permit findings
to be generalized to a class of similar cases. Applying the QJ method to a set of recorded
(completed) business cases may enable one to collect cases that seem to show a common
logical/causal pattern, and to categorize them as cases of a certain type. This is analogous to
the way case law is established in jurisprudence.

Reputation and reputational risk assessment
42
3.1.2 - Quantitative methods
None of the previously mentioned approaches provides a monetary measure of reputation.
Gabbi & Patarnello (2010) describes three different approaches to quantitatively assess the
value of reputation: the organizational approach, the accounting approach and the marketing
approach.
The organizational approach
Reputation is an immaterial asset, strictly connected as such to the most important among
intangible assets: intellectual capital. This explains the increasing efforts aimed at its
measurement.
The value of intellectual capital can be split between its internal and external components.
The internal component includes human and structural (or organizational) capital, while the
external one encompasses relational capital.
A reliable measurement of intellectual capital requires a full understanding of a company’s
value creation mechanisms. These can in be in their turn influenced by the company’s
sector, market, business model, organizational culture and strategic objectives. Once value
creation mechanisms have been understood, variables explaining their effectiveness and
efficiency need to be identified. This allows to select proper indicators of intellectual
capital, which can be classified into three categories: growth, efficiency and stability.
One major problem in measuring intellectual capital relies in the partial and subjective
nature of its valuation process. This is especially true in comparison to the rigorous criteria
applied to the preparation of a company’s balance sheet.
The diffusion of intellectual capital measurement reports has been in particular thwarted by
difficulties related to the complex measurement of intangible assets, the identification of
standard indicators and calculation methods, their consistency and comparability, the
assessment of the economic return and the uncertain relation between theory and practical
applications (Gabbi & Patarnello, 2010)

Reputation and reputational risk assessment
43
The accounting approach
According to Gaultier-Gaillard and Louisot (2006) when considering how to assign a value
to reputation, the most sensible approach is probably to compute it as the difference between
the market value of the stock and the total of tangible assets and those intangible assets
already assessable (e.g. lease, licenses).
Immaterial resources represent a relevant portion of a company’s net worth. Their definition
and measurement is therefore required for their proper posting in the balance sheet. IAS 38
defines immaterial assets as “non-monetary, identifiable, non-physical assets”. A resource
can be classified as an immaterial asset if the following conditions are met: i) its use will
generate future economic benefits, that is higher revenues or lower costs, ii) the company
controls it; this implies that the company can benefit from a resource and prevent others
from taking advantage from it (i.e. personnel skills cannot be considered as immaterial
assets), iii) it can be clearly distinguished from goodwill: this happens when, based on
existing legal rights or contractual agreements, the resource can be sold, transferred,
licensed, rented or swapped; among clearly distinguishable resources are for instance
brands, patents, non-competition agreements, licenses, copyrights.
IAS/IFRS international accounting standards do not give a full representation of a
company’s net worth immaterial components. As a matter of facts they exclude intangible
resources like personnel loyalty and motivation (and in general human capital), image and
client relationships. For all these categories of resources only acquired goodwill can be
posted in the accounts, while internally generated one cannot be quantified. The same
applies to immaterial assets like internally developed brands.
It should also be underlined that the impact of reputational damage goes far beyond
accounting profits or losses. The need therefore exists for a reporting system providing a
comprehensive view of a company’s reputational value and supporting the distinction
between its book value and market value (Gabbi & Patarnello, 2010).

Reputation and reputational risk assessment
44
The marketing approach
A peculiar representation of reputation is the one provided by the so called marketing
approach. This is mainly focused on brand value measurement, which is seen as strictly
related to a specific reputational level.
Brand value can be for instance measured by assessing the investments a company has made
to increase its intangible assets. The royalty rates method is among the most interesting
ones for the assessment of brand value. It is based on the assumption that the benefits a
company gets from its intangible assets cannot be lower than the price the company should
pay to obtain the right to use them.
According to Larkin (2003) “...one estimate of the value of a company’s reputation is the
present value of all expected royalty payments over a given period”. Alternatively a DCF
model can be applied to the cash-flows expected from the future exploitation of the
immaterial asset.
Practical problems related to the use of this method include the identification of meaningful
and homogeneous royalty rates in the reference markets. The reliability of the approach is
also influenced by i) the volatility of brand value when based on market criteria and ii) the
fact that the concept of reputation goes far beyond the concept of brand, as the former is
shaped by the judgements and perceptions of all the stakeholders regarding various aspects
and levels of a company’s activity (Gabbi & Patarnello, 2010).
3.2 - Reputational risk measurement
As previously mentioned there are two main classes of methods proposed to assess
reputational risk:
Qualitative methods: the aim is to order risks relying on a qualitative measure of
their severity. Within this class we find the Likelihood-Impact matrix and the gap
analysis.
Quantitative methods: their aim is to find ways to measure “scientifically” the
severity of reputational risk. Within this class we find the abnormal returns methods,
the scenario analysis and the analysis of share price volatility.

Reputation and reputational risk assessment
45
While there have been numerous proposals for quantitative assessment methods, qualitative
approaches are much more used. Most companies admit they find it very difficult to
quantify the financial impact of reputational risk (The Ace Group, 2013).
Qualitative methods are more intuitive and easy to implement without the need of elaborate
tools and vast databases. However, they have some important downsides. The first, and
more intuitive one, is that by relying on a purely qualitative analysis they allow for
valuation biases. Secondly they only allow the comparison between reputational risks while
they convey little information on the value of such risks in comparison with other kinds of
risk the organization is faced with.
3.2.1 - Qualitative methods
Qualitative methods of risk assessment are very common for risks that are difficult to
quantify.
As far as reputational risk assessment is concerned there are two qualitative methods found
in literature: the likelihood-impact matrix and the gap analysis method.
The first method consists of a qualitative assessment of two dimension for each risk and the
consequent charting of all the risks on a two dimensional matrix.
The gap analysis method, rather than focusing on singular risks, focuses on the relationships
between the organization and relevant stakeholders, trying to understand whether there is a
gap between stakeholders’ perceptions and reality.
The Likelihood-Impact Matrix
This method’s core is the definition of two scores for each risk identified: a probability
score and an impact score. Such rankings are assigned with the support of specifically
designed qualitative scales.
The complexity of this model depends on the detail with which these scales are described.
The result can in fact range from a simple three-by-three matrix, ranking each risk by High,
Medium or Low for both the likelihood of its occurrence and its impact if it does, to more
sophisticated models which rate impact and likelihood on a 10-or 12-point scale.

Reputation and reputational risk assessment
46
Table 5 – Example of qualitative impact metric (Rayner, 2008)
Reputational impact News diffusion
1. Insignificant Minor local diffusion
2. Minor Local media coverage
3. Moderate National media coverage
4. Major International short term media coverage
5. Catastrophic International adverse media coverage over more than
one year
As far as the likelihood is concerned the measures are the same as the ones of any other risk.
Meanwhile for the impact one can device specific scales for reputation. For instance
according to Ryaner (2008) the impact could be linked to the level of diffusion of the
harmful news (figure 5).
Soprano et al. (2009) suggest that the best instrument to support this kind of qualitative
analysis are scoring-cards. In the author’s opinion “weighted lists of questions, to be filled
in by managers, process owners, customers, or business specialists, could prove particularly
useful and indicate the value of the multidimensional impacts of reputational type events”.
Gap analysis
The other most common qualitative approach to assess reputational risk is the one that
focuses on the analysis of gaps. Honey (2009) suggests that the best way to measure
reputational risk is to assess the gap between stakeholders’ expectations and the actual
company behavior.
The starting point is to conduct a stakeholders’ analysis (see chapter 5) which should result
in a classification of the most relevant stakeholders (fig. 8).

Reputation and reputational risk assessment
47
Figure 8 – Stakeholders’ prioritization
Once the most relevant stakeholders have been identified, one should consider their
expectations along a series of reputational drivers.
Within this grid one can start to mark up those aspects which are of critical importance to
each stakeholder group and which are of less importance to them (tab. 6). It soon becomes
clear that failure to ‘perform’ in key categories represents a higher risk to reputation among
certain stakeholder groups compared to others.
Table 6 – Example of stakeholders’ priorities
Drivers of reputation Investors Customers Suppliers Employees
Financial performance
Delivery of product and
services
Vision and leadership
Corporate responsibility
Workplace environment
Knowledge skills
Emotional appeal

Reputation and reputational risk assessment
48
This analysis helps designing surveys to probe for expectation in specific business critical
areas for each relevant stakeholder group.
The next step is to compare these expectation surveys among stakeholders with known
current and future performance data: this, according to Honey (2009) represents a consistent
measure of reputational risk (fig. 9).
Figure 9 – Reputational risk as gap
It is interesting to notice that considering this definition of reputational risk there are only
two options to reduce it. The first one is to improve the organization’s performances in the
business areas with the greatest gaps. Alternatively the relationship owners will have to
gently manage the stakeholders expectations downward.

Reputation and reputational risk assessment
49
3.2.2 - Quantitative methods
As previously mentioned quantitative methods are rarely implemented by organizations due
to their complexity and unproven reliability. However there have been numerous proposals
for quantitative models. The aim of this paragraph is to analyze the most relevant ones
found in literature.
The methods presented are the share price volatility analysis, the abnormal returns models
and the policy-capturing survey method. While the first two models involve an ex-post
valuation of past reputational events the latter proposes an interesting approach for an ex-
ante assessment of reputational risk.
Abnormal returns models
In this approach reputational losses are evaluated by examining a firm’s stock price reaction
to the announcement of a major operational loss event. Loss percentages are computed as
losses divided by the firm’s market capitalization, and a market model is used to determine
abnormal returns for each organization. The abnormal return for a firm is defined as the
difference between the firm’s actual return and the expected return based on a one-factor
market model. Any decline in a firm’s market value that exceeds the announced loss amount
is interpreted as a reputational loss (Perry & de Fontnouvelle, 2005).
In order to demonstrate such thesis the first step is to calculate the abnormal returns for each
event i for each day within the time period considered [τ0, τ1]. The abnormal returns can be
computed with a simple market model:
where and have been previously estimated in order to account for the behavior of each
individual stock.
The following step is to calculate the cumulative average abnormal return for each event i
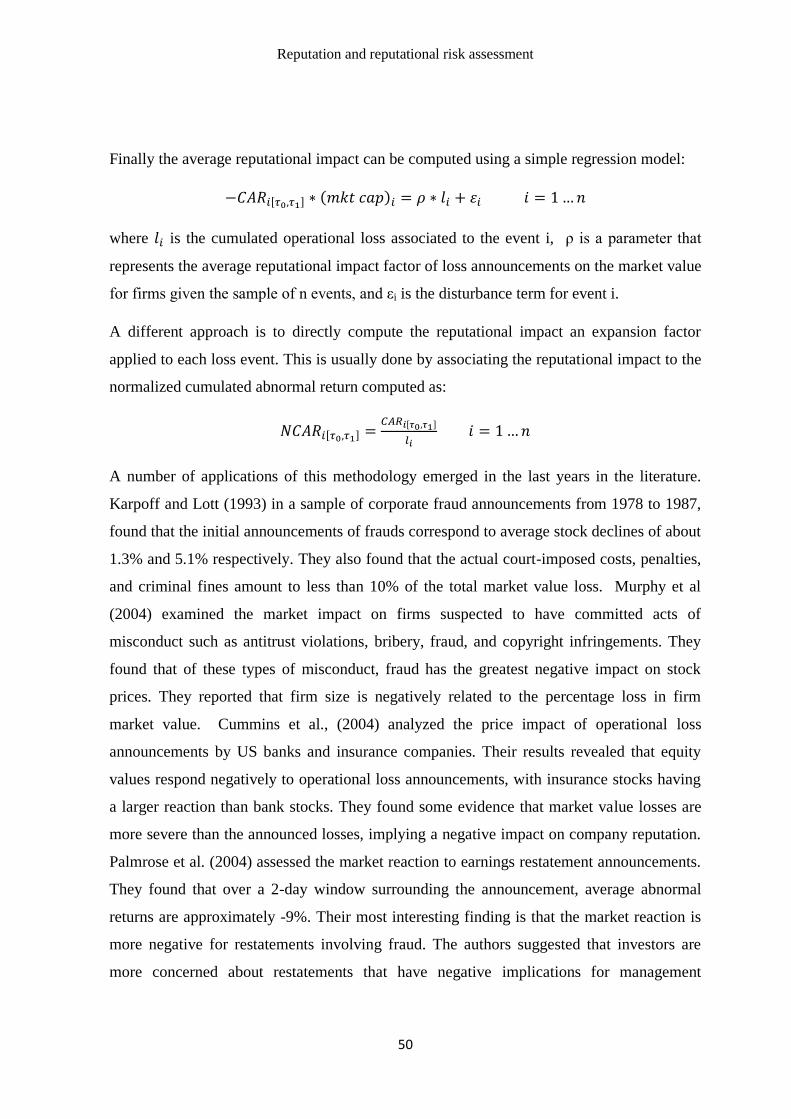
Reputation and reputational risk assessment
50
Finally the average reputational impact can be computed using a simple regression model:
where is the cumulated operational loss associated to the event i, ρ is a parameter that
represents the average reputational impact factor of loss announcements on the market value
for firms given the sample of n events, and εi is the disturbance term for event i.
A different approach is to directly compute the reputational impact an expansion factor
applied to each loss event. This is usually done by associating the reputational impact to the
normalized cumulated abnormal return computed as:
A number of applications of this methodology emerged in the last years in the literature.
Karpoff and Lott (1993) in a sample of corporate fraud announcements from 1978 to 1987,
found that the initial announcements of frauds correspond to average stock declines of about
1.3% and 5.1% respectively. They also found that the actual court-imposed costs, penalties,
and criminal fines amount to less than 10% of the total market value loss. Murphy et al
(2004) examined the market impact on firms suspected to have committed acts of
misconduct such as antitrust violations, bribery, fraud, and copyright infringements. They
found that of these types of misconduct, fraud has the greatest negative impact on stock
prices. They reported that firm size is negatively related to the percentage loss in firm
market value. Cummins et al., (2004) analyzed the price impact of operational loss
announcements by US banks and insurance companies. Their results revealed that equity
values respond negatively to operational loss announcements, with insurance stocks having
a larger reaction than bank stocks. They found some evidence that market value losses are
more severe than the announced losses, implying a negative impact on company reputation.
Palmrose et al. (2004) assessed the market reaction to earnings restatement announcements.
They found that over a 2-day window surrounding the announcement, average abnormal
returns are approximately -9%. Their most interesting finding is that the market reaction is
more negative for restatements involving fraud. The authors suggested that investors are
more concerned about restatements that have negative implications for management
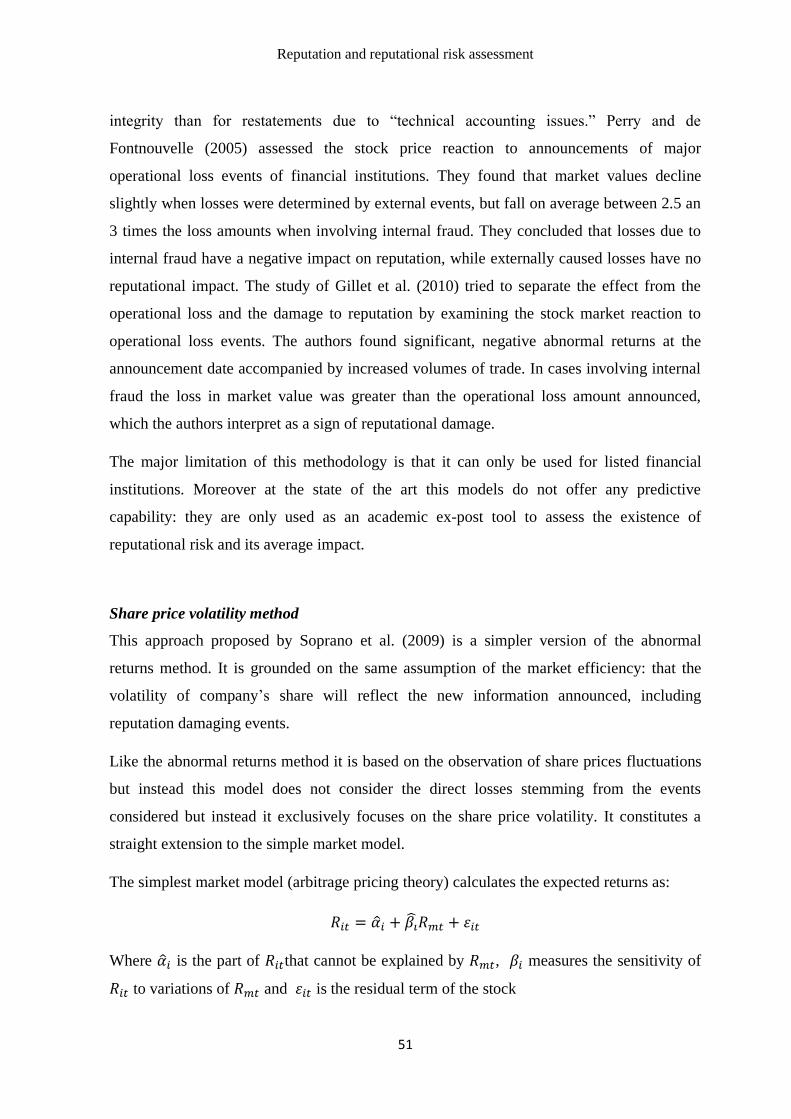
Reputation and reputational risk assessment
51
integrity than for restatements due to “technical accounting issues.” Perry and de
Fontnouvelle (2005) assessed the stock price reaction to announcements of major
operational loss events of financial institutions. They found that market values decline
slightly when losses were determined by external events, but fall on average between 2.5 an
3 times the loss amounts when involving internal fraud. They concluded that losses due to
internal fraud have a negative impact on reputation, while externally caused losses have no
reputational impact. The study of Gillet et al. (2010) tried to separate the effect from the
operational loss and the damage to reputation by examining the stock market reaction to
operational loss events. The authors found significant, negative abnormal returns at the
announcement date accompanied by increased volumes of trade. In cases involving internal
fraud the loss in market value was greater than the operational loss amount announced,
which the authors interpret as a sign of reputational damage.
The major limitation of this methodology is that it can only be used for listed financial
institutions. Moreover at the state of the art this models do not offer any predictive
capability: they are only used as an academic ex-post tool to assess the existence of
reputational risk and its average impact.
Share price volatility method
This approach proposed by Soprano et al. (2009) is a simpler version of the abnormal
returns method. It is grounded on the same assumption of the market efficiency: that the
volatility of company’s share will reflect the new information announced, including
reputation damaging events.
Like the abnormal returns method it is based on the observation of share prices fluctuations
but instead this model does not consider the direct losses stemming from the events
considered but instead it exclusively focuses on the share price volatility. It constitutes a
straight extension to the simple market model.
The simplest market model (arbitrage pricing theory) calculates the expected returns as:
Where is the part of that cannot be explained by , measures the sensitivity of
to variations of and is the residual term of the stock

Reputation and reputational risk assessment
52
This model instead embeds two other variables: representing the institutions industry
sector and mirroring the hypothetical reputational events that are then included.
is a dicotomic variable. The return is then described by the equation
Where each element of the vector explains the sensitivity of to variations in the
corresponding factor.
The probability distribution function can be estimated with a probit model:
Where z is a generic dicotomic variable, are a vector dependent variables and is the
vector of unknown coefficients.
Once the model has been statistically verified the reputational value at risk can be
computed.
Where
is the market value of the company
The quantity is computed considering as the dependent value in the first model. The
primary limitation to this model is that it can only be applied to listed institutions.
While being obviously easier to implement the decision not to consider the actual
operational losses of the events constitutes a major simplification that drastically reduces the
explanatory potential of the model. As a matter of fact Soprano et al. (2009) presents a case
study employing this methodology which produces “unsatisfactory statistical results”.

Reputation and reputational risk assessment
53
Policy-capturing survey methodology
This method, presented by Young (2010), applies a policy-capturing survey to generate
insight into reputational risk from the perspective of a variety of stakeholders.
Even though this methodology does not provide an actual quantitative assessment of
reputational risk it provides an interesting perspective as to how to analyze this risk. While
the other methods presented in this chapter involve inference from market data this
approach is grounded on the direct engagement of the stakeholders.
Young considered an insurance company and built a model aimed at understanding how the
company’s stakeholders would react to different scenarios. Hi constructed 60 different
scenarios combining 12 cues about the companies reputation. Such cues were defined with
the support of industry experts.
The study engaged over 500 respondents to express their intentions about three different
purchase decisions (New Policy, Renewal, and Investment) in several scenarios. The survey
was structured with multiple choice questions (fig. 10).
Figure 10 – Example of survey question
The results of the survey were then analyzed using a multinomial logit model to estimate
coefficients corresponding to the influence of the Reputational Cues on each decision
category.
The output of this methodology is therefore a relationship between a particular reputational
scenario and the stakeholders’ behavior. While it does not represent an actual assessment of
the reputational risk, it definitely constitutes a very innovative and stimulating approach to
the matter.

Reputation and reputational risk assessment
54
This methodology will be revised and expanded in the framework presented in the chapters
5 and 6.

Reputational risk treatment
55
4. Reputational risk treatment
Reputational risk treatment is a component of risk management. Treatment actions can be
distinguished between ex-ante measures and ex-post measures.
4.1 - Ex-ante measures
Among the ex-ante measures an increasing importance is attributed to Corporate Social
Responsibility.
Ex-ante measures can include also actions to avoid the risks, to reduce the risks in terms of
likelihood or impact, to transfer the risks by sharing them with a partner or by insuring the
risk or to accept the risks.
4.1.1 - Corporate Social Responsibility
Definitions of Corporate Social Responsibility (CSR) proposed by the academic literature
and by a variety of institutions, underline the characteristic of voluntary involvement in the
solution of a variety of social issues (McWilliams & Siegel, 2001).
The European Commission in its communication of 25 October 2011 (no. 681), ten years
after the Green Paper of 2001, reviewed the notion and provided a new definition of CSR:
“The responsibility of enterprises for their impacts on society”.
According to McWilliams & Siegel (2001) CSR can be defined as ‘actions that appear to
further some social good, beyond the interests of the firm and that which is required by
law’. Some examples of CSR actions include ‘going beyond legal requirements in adopting
progressive human resource management programs, developing non-animal testing
procedures, recycling, abating pollution, supporting local businesses, embodying products
with social attributes or characteristics’.
The definition of CSR offered by Aguinis & Glavas (2012) stated: ‘context-specific
organizational actions and policies that take into account stakeholders’ expectations and the
triple bottom line of economic, social, and environmental performance’.

Reputational risk treatment
56
The 2014 Global CSR RepTrak study’s findings highlighted the growing importance of
CSR and sustainability issues for consumers. It should be underlined that some of the
dimensions that drive reputation (citizenship, governance, and workplace) are included into
the CSR categories.
The core of CSR is ensuring that social, ethical and environmental impacts and risks are
identified and managed so that organisations focus not just on the generation of profits and
on meeting targets but also on how such results are achieved (Rayner, 2003).
Many agencies attribute ethical ratings or create indexes on Corporate Responsibility. The
first case of a sustainability rating agency was the London based Standard Ethics agency.
‘Business in the Community’ publishes yearly a ranking of the best companies on the basis
of an index on Corporate Responsibility, that considers four key areas: community,
environment, marketplace and workplace (tab. 7).
About the benefits of implementing CSR actions, Aguinis & Glavas (2012) reviewed the
CSR literature based on 588 journal articles and 102 books and book chapters. A consistent
finding regarding the outcomes of CSR initiatives is an improvement in a firm’s reputation
(Fombrun & Shanley, 1990; Turban & Greening, 1997; Brammer & Pavelin, 2006). Such a
positive effect has been found on the part of consumers, who respond to CSR through
favorable evaluations of the company and its products (Ellen et al., 2000; Sen &
Bhattacharya, 2001) as well as through increased loyalty (Maignan, Ferrell, & Hult, 1999).
In a meta-analysis of CSR–outcomes relationships, CSR was found to improve a firm’s
reputation and goodwill with external stakeholders, which resulted in increased financial
performance (Orlitzky et al.,2003).
Minor & Morgan (2011) argued that a firm’s Corporate Social Responsibility activities have
the effect of providing a partial self-insurance against reputation risk.
An essential aspect for the success of CSR initiatives is the communication with
stakeholders. It is necessary that stakeholders are informed in the right way and the right
time of the initiatives of companies. Businesses need to demonstrate that they understand
the issues, have policies in place to deal with them, monitoring systems to track
performance, evidence of consultation with key stakeholders (to inform the debate and
avoid surprises) and robust reporting and communications (Rayner, 2003)
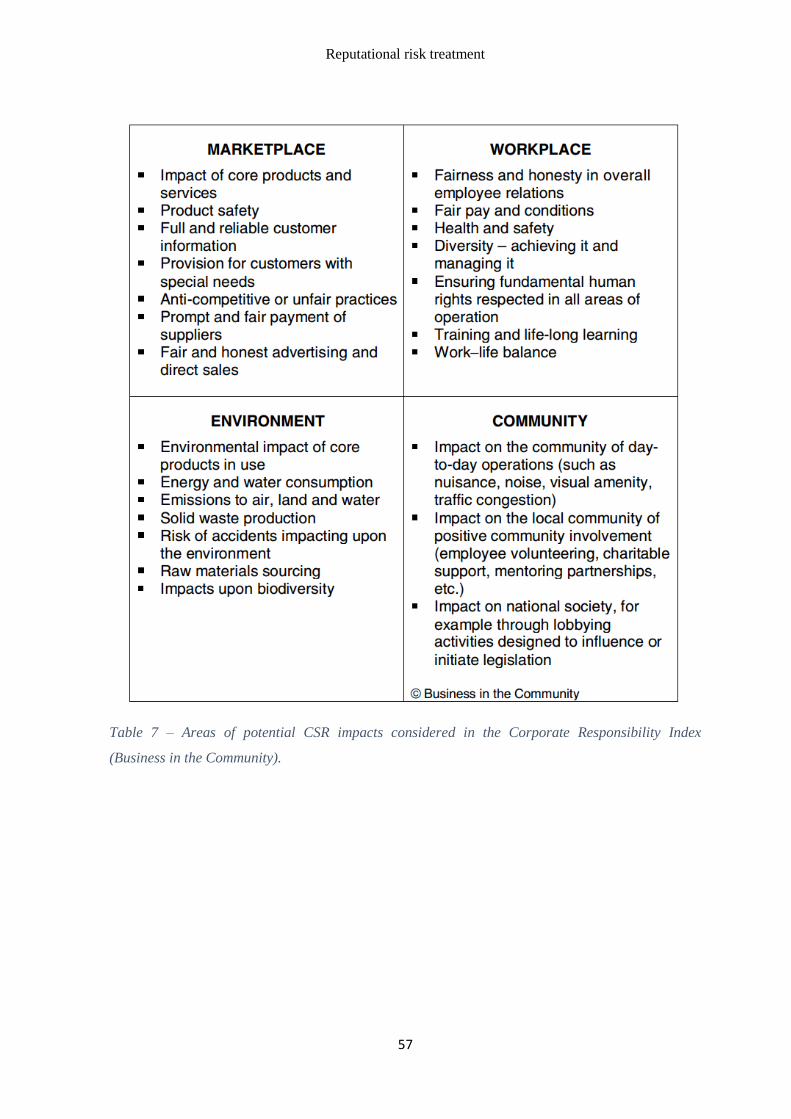
Reputational risk treatment
57
Table 7 – Areas of potential CSR impacts considered in the Corporate Responsibility Index
(Business in the Community).

Reputational risk treatment
58
4.1.2 - Other ex-ante measures
Risk avoidance is one of the ex-ante measures (fig. 11) and represents the more drastic
solution. It consists in not performing an activity that could carry risk but avoiding risks also
means losing the possibility of earning profits.
Risk reduction consists of decreasing the exposure by reducing the impact and/or likelihood
of the threat (Rayner, 2003). The likelihood of the threat could be reduced by improving
training, implementing new policies and procedures, tightening up contract terms or by
checking that controls are working though self-assessment or audit. The risk’s impact could
be reduced by contingency planning (such as disaster recovery and crisis management
plans) and by promoting strong relationships with the relevant stakeholders. For threats or
opportunities the cost of any actions taken must be justifiable.
Figure 11– Ex-ante risk treatment strategies
Risk transfer consists in sharing the risk in whole or in part with another party (e.g. with a
subcontractor, joint venture partner or by outsourcing the activity) or by insuring all or part
of the risk. Transferring the risk to another party does not necessarily avoid from being
blamed when things go wrong (Rayner, 2003). Insurance is considered a way of risk transfer
but the buyer of the contract generally retains legal responsibility for the losses.

Reputational risk treatment
59
The concept of risk transfer can apply both to threats and opportunities.
Risk retention involves accepting the loss, or benefit of gain, from a risk when it occurs.
Risk retention is a suitable strategy for small risks where the cost of insuring would be
greater than the total losses sustained. All risks that are not avoided or transferred are
retained by default.
4.2 – Ex-post measures
Ex-post measures are represented mainly by methods and theories of Crisis Management.
4.2.1 - Crisis management
A crisis is an incident that has the potential to disrupt organizational operations and to
destroy the organization (Coombs & Holladay, 2006). Many define crises as threats to
reputation (Barton, 2001; Davies et al., 2003).
According to Pearson & Mitroff (1993) crises have five dimensions, which are that they are
highly visible, require immediate attention, contain an element of surprise, have a need for
action, and are outside the organization’s complete control. Adams & Roebuck (1997)
pointed out similar characteristics most crises seem to share. The first is surprise, which
may be surprise at the timing as much as at the event itself. Next is a trigger: an unexpected
event, action or incident that alters the public’s view of the organization. Third is a threat,
which could include human lives, property, or the environment. A crisis also includes an
uncontrolled event that brings turbulent circumstances placing the situation out of
management’s control. Lack of control can be for a brief or extended period of time. Last is
a quick response. If the first three elements of surprise, trigger, and threat are present, the
organization must respond immediately to protect itself and others, as well as to regain
control.
Crises can harm stakeholders physically, emotionally and/or financially. The news media
and the internet play a critical role. Most stakeholders will learn about a crisis from news
reports. In a smaller number of crises, stakeholders learn about crises through online social
media. The exceptions would be victims or potential victims who are more likely to

Reputational risk treatment
60
experience the crisis or to be informed directly by the organization about the crisis
(Coombs, 2007).
A basic model of crisis management (Mitroff et al., 1987) identifies four phases:
Detection consists in the organization's early warning systems (including
computerized process control systems, plant/equipment monitoring systems,
management information systems, etc.) that scan the external and the internal
environments for signals of imminent crises. Detection is fundamental to prevent or
prepare for crises. Most crises are preceded by early warning signals. To prevent
some major crisis, organizations need only to learn to read these warning signals and
respond to them effectively.
Crises is the second point because no organization can prevent every crisis from
occurring. Indeed, prevention of all crises is not the basic purpose of planning and
crisis management.
Repair represents the major structures and mechanisms an organization has in place
for guiding recovery. These include emergency plans, public relations plans, crisis
management teams, etc.
Assessment corresponds to the evaluation of lessons learned from the past crises and
the application of the new knowledge to improve crisis management for the future.
Mitroff et al. (1987) distinguished between crises that arise within the organization and
those that arise outside it (Figure 12). This differentiation is critical because the warning
signals will be different for different types of origin. The authors also differentiated
between crises caused by technical/economic breakdowns and those caused by
people/organizational/social breakdowns.

Reputational risk treatment
61
Figure 12 – Types of corporate crises (Mitroff et al., 1987)
Starting from an analysis of reputation damage to corporations over recent years, CIMA
(2007), proposed a categorisation of causes under three groups: cultural, managerial and
external. Cultural risks include legal and ethics risks; both can be avoided and should be
identified. Managerial risks consist of executive risk and operational risk; these are risks
that cannot be avoided or transferred and must be managed. External risks include
association risk and environment Risk; both origin from outside the organization. The
common thread is that these risks can neither be controlled nor avoided, so they must be
mitigated.
Damage to reputation will differ depending on the nature of the business and the basis for
stakeholder trust, in the financial services sector reputation damage would result from a

Reputational risk treatment
62
financial irregularity. For manufacturers of consumer and retail brands the greatest risk to
reputation is customer safety.
Figure 13 shows the variety of actions organizations can take to prepare for, cope with,
reduce the effects of, and recover from the various kinds of crises.
Mitroff et al. (1987) suggested that organization should select a minimum of one crisis from
each of the cells to prepare for. This is important to avoid the tendency to prepare mainly for
one typology of crises and to form a comprehensive portfolio of coping and recovery
mechanisms.
Figure 13 – Preventing actions for corporate crises (Mitroff et al., 1987)

Reputational risk treatment
63
4.2.2 - Crisis and reputation
Prior reputation is assumed to be a factor in protecting the reputational assets during a crisis
and helping to facilitate their repair. An organization with a more favourable prior
reputation will still have a stronger post-crisis reputation because it has more reputation
capital to spend than an organization with an unfavourable or neutral prior reputation
(Coombs, 2007). As a result, a favourable prior reputation means an organization suffers
less and rebounds more quickly after a crisis. The prior reputation can create a “halo effect”
that protects an organization during a crisis (Coombs & Holladay, 2006). A favorable prior
reputation might shape how stakeholders make attributions about an accident when a cause
is not given (Klein & Dawar, 2004); it might encourage stakeholders to give the
organization the benefit of the doubt in the crisis (reduce attributions of crisis
responsibility). As previously reported, Rhee & Haunschild (2006) demonstrated that in
some situations good reputation can be recognized as an organizational liability.
Conversely, a series of minor bad news stories can have a cumulative effect whereby a
‘tipping point’ is reached, after which stakeholders suddenly lose confidence, the business’s
share price plummets and current and all past misdemeanours are raked over in the ensuing
media frenzy making it very difficult to recover (Louisot & Rayner, 2011).
4.2.3 - Situational Crisis Communication Theory
The Situational Crisis Communication Theory (SCCT) was developed recently to
investigate which crisis response strategy could be applied in specific crisis situations to
protect an organization’s reputation during a crisis and restore reputation thereafter
(Coombs, 2006 and 2007). But, as highlighted by Coombs (2007) the first priority in any
crisis is to protect stakeholders from harm, not to protect the reputation.
The SCCT divides crisis types into three crisis clusters (Coombs, 2007) showed in table 8.
The more responsibility that is attributed to the organization with respect to the crisis, the
more negative is the impact on the organizational reputation
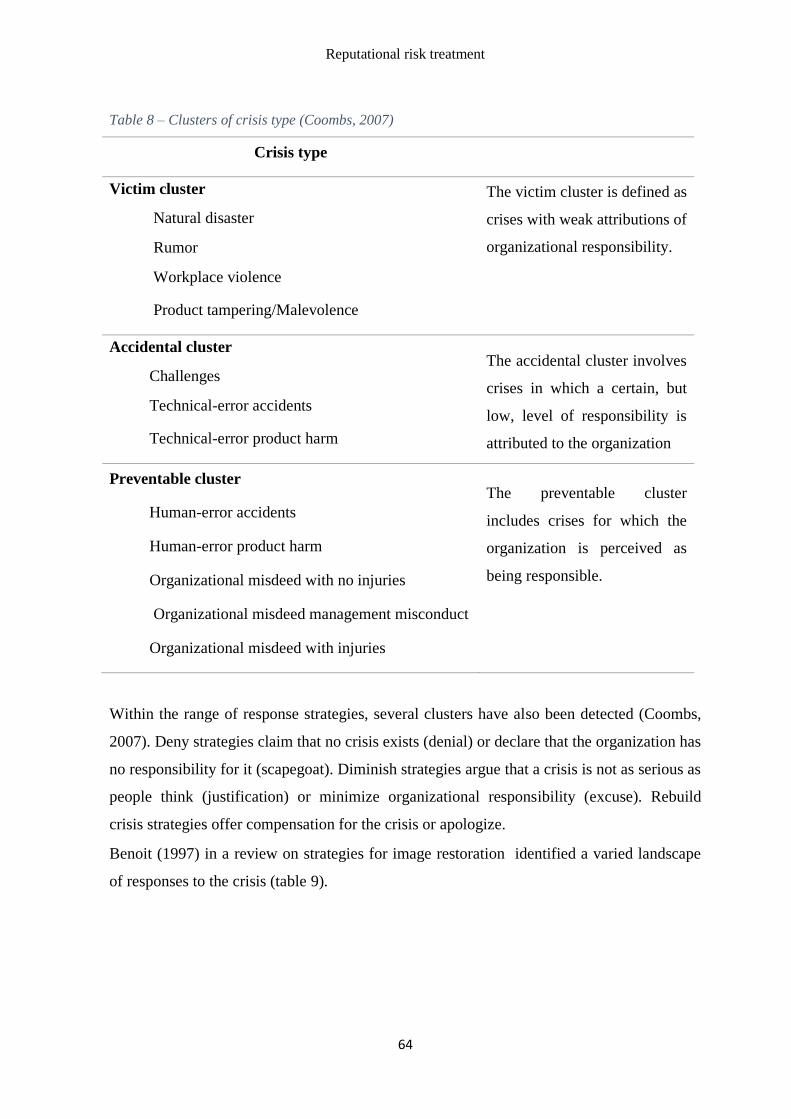
Reputational risk treatment
64
Table 8 – Clusters of crisis type (Coombs, 2007)
Crisis type
Victim cluster
Natural disaster
Rumor
Workplace violence
Product tampering/Malevolence
The victim cluster is defined as
crises with weak attributions of
organizational responsibility.
Accidental cluster
Challenges
Technical-error accidents
Technical-error product harm
The accidental cluster involves
crises in which a certain, but
low, level of responsibility is
attributed to the organization
Preventable cluster
Human-error accidents
Human-error product harm
Organizational misdeed with no injuries
Organizational misdeed management misconduct
Organizational misdeed with injuries
The preventable cluster
includes crises for which the
organization is perceived as
being responsible.
Within the range of response strategies, several clusters have also been detected (Coombs,
2007). Deny strategies claim that no crisis exists (denial) or declare that the organization has
no responsibility for it (scapegoat). Diminish strategies argue that a crisis is not as serious as
people think (justification) or minimize organizational responsibility (excuse). Rebuild
crisis strategies offer compensation for the crisis or apologize.
Benoit (1997) in a review on strategies for image restoration identified a varied landscape
of responses to the crisis (table 9).

Reputational risk treatment
65
Table 9 – Typologies of image restoration strategies (Benoit, 1997)
Strategy and sub-
strategies
Explanation
Denial (simple denial
and shifting the blame)
In both cases the responsibility for the act is avoided, either
because the subject is not responsible or because someone else
has been specifically identified as being responsible. Silence with
regard to impacts may also be seen as a variation of denial
Evading responsibility:
Provocation
Defeasibility
Accident
Good intentions
Offensive act has been undertaken in response to another
offensive act. As a result, the provocateur should be held
accountable not the subject
Responsibility cannot be assigned because of lack of information,
volition or ability on behalf of the subject means that it would be
unfair for them to be held to account
Responsibility is reduced due to lack of control over the offensive
act
While the outcome of the act is negative it may be that the
motives of the subject were good and the outcome could not have
been anticipated
Reducing
offensiveness of event:
Bolstering
Minimization
Differentiation
Transcendence
Subject may provide information about other aspects of their
behaviour or character which are positive and thus are in contrast
to the negative event
The impact of the negative event may be downplayed, although
responsibility is acknowledged
The particular offensive act is distinguished from other acts of
this type. So while there may be, for example, a pollution incident
is not of the type of incidents which would be seen as serious
The context in which the offensive act emerges is redefined or a
rationale for the action is offered so that its offensiveness is
transcended. For example, providing a financial return in a
competitive business context may be used to explain laying off

Reputational risk treatment
66
Attack accuser
Compensation
Corrective action
Mortification
employees
The offensiveness of the act can be reduced if an impression can
be created that the accuser is somehow responsible for or deserves
what has befallen them
While the offensiveness of the act is not challenged, the subject
reduces its impact by offering compensation to those affected. For
example, investment in community programmes in areas affected
by corporate activities may be used to boost reputation
Corrective action is promised either to make good the impact of
the offensive act or actions are taken to ensure that it cannot
happen again. This strategy may or may not include accepting
responsibility of the act
Responsibility is acknowledged as is the offensiveness of the act
and the subject asks for forgiveness
Research has shown that apology leads to more effective reputation restoration than deny or
diminish response strategies (Coombs & Holladay, 2008). Results of Claeys et al. (2010)
showed that the reputations of organizations using rebuild crisis response strategies are
more positive than the reputations of organizations using diminish strategies.
The appropriate response to a risk affecting reputation will depend on its source (safety,
project management, acquisition, IT security, and supply chain labour practices), its
expected impact, whether the risk is treatable and the cost of treatment (Gaultier-Gaillard et
al., 2009).
Coombs & Holladay (1996) found that when crisis communication responses match the
crisis type in terms of responsibility attribution, this leads to a more positive reputation
perception than either no response or a mismatched response. Their research found that
organizational reputation benefits when diminish strategies are used in response to
accidental crises and when rebuild strategies are matched with preventable crises. Deny
strategies are advisable only in case of victim crises.
However, Benoit (1997) suggests that the use of a combination of strategies can increase the
effectiveness of image restoration. The SCCT advises crisis managers to combine crisis
response strategies from the same cluster (Coombs, 2007).

Reputational risk treatment
67
Lyon & Cameron (2004) studied the conditioning effect of reputation on message strategies.
Corporations with a bad reputation prior to the news story in the experiment were more
damaged by the apologetic response messages than the defensive message style.
Stephen et al. (2005) explored message strategies that are used by organizations during 154
crises. The findings suggest that in this sample representing six types of crisis situations, the
top strategy category was mortification because it accounted for 40% of the total data.
Within the mortification category, the subcategories of rectification, remediation, and
repentance accounted for 61%, 26%, and 13%, respectively. The second most frequent
strategy category was ingratiation, because it accounted for 23% of the total data. Within the
ingratiation category, the subcategories of bolstering, transcendence, and endorsement of an
outside expert accounted for 43%, 29%, and 23%, respectively. The third most frequent
strategy category was distance because it accounted for 21% of the total data.

Model description
68
5. Model description
The model presented in this chapter is intended as a practical tool for the quantitative
assessment of reputational risk. The model consists in an integrated framework that
combines different methods, borrowed from various disciplines, to assess the impact of
reputational risks. In particular, the model includes aspects from the complex systems,
scenario analysis and judgment analysis. The ultimate objective of the model is to measure
the Value at Risk determined by reputational risk.
The main features of the framework are an exclusive focus on the effects of reputation-
damaging events and a decomposition of the singular elements that determine such effects.
This model does not attempt to assess the value of reputation as a whole, but instead focuses
on the most tangible effects of the reputational damage stemming from the occurrence of
risks.
In order to estimate such reputational damage this method singles out its components (eg.
sales decrease, increased cost of capital) and focuses on the stakeholder decisions that
generate such effects.
This chapter explores the theory behind the model. The first paragraph presents the structure
of the model and the rationale behind. The following paragraphs instead analyze each part
of the model presenting both theoretical and practical aspects. The last paragraph presents
the main limitations of the model.
5.1 - General framework
As previously reported (see chap. 1), according to the white paper of the Economist
Intelligence Unit (2005) there is still a dispute over whether to consider reputational risk a
self-standing risk or a “risk of risks”. This model is grounded on a definition of reputational
risk as a “risk of risks”, or as an indirect risk generated by other risks. Therefore the
objective of the model is to assess the reputational impact of other risks rather than
assessing the reputational risk as a risk of its own. In other words the model does not

Model description
69
estimate reputational risk as a whole but separately assesses the reputational component of
each individual risk to which the company is exposed.
In order to assess the reputational component of each risk the reputational damage is
modeled as an indirect effect (fig. 14). Each risk will have some direct and tangible
consequences (e.g. direct losses, product recalls, prosecutions, fines, sanctions etc.).
Figure 14 – Reputational damage as indirect effect
Such direct effects are understood as signals or cues that are then acknowledged by the
company’s stakeholders’. The stakeholders’ reactions to these signals are what ultimately
determines the reputational loss. The reputational impact is therefore modeled as the
combination of the reactions of the stakeholders to the signals stemming from a materialized
risk (fig. 15).
Figure 15 – General framework

Model description
70
The core of model is thus comprised of two analyses:
an historical analysis of which signals are generated by each risk upon manifestation
a survey based analysis to understand what are the reactions of the stakeholders to
such signals
Moreover the model embeds a preliminary analysis to integrate the risk identification
process and a final simulation to determine the probabilistic distribution of losses. More
precisely model is structured in four steps:
1. Risk map integration: the aim of this first step is to understand which risks that have
a major reputational component and should therefore be the focus of the rest of the
analysis. This is mainly achieved through a qualitative analysis of the already
mapped risks. However specific tools are proposed to support the identification of
potentially unmapped risks with a major reputational component. The output of this
process is the list of risks that can impact reputation (fig. 16).
2. Mapping stakeholders and reputational cues: this step is aimed at understanding
who are the most relevant stakeholders’ for the company and what signals could
affect their decisions. The process includes a stakeholders analysis and the
identification of the cues through interviews and historical analysis of past risk
events within the industry considered. The output of this process are a list of the
most relevant stakeholders and a list of the most relevant reputational cues (fig. 16).
3. Understanding stakeholders’ reactions: in this step surveys are built to understand
the stakeholders’ reactions to different sets of reputational signals. Purpose made
tools allow to translate the results of the surveys into deterministic or probabilistic
relationships (fig. 16) between the cues and the stakeholders’ reactions (e.g. reduced
purchase intention, increased cost of capital etc.).

Model description
71
Figure 16 - Outputs of the first three steps of the framework
4. Analyzing the generation of cues and drawing the conclusions: this final phase
initially explores which reputational signals are generated by each specific risk and
with what probability. Afterwards multiple scenarios with different combinations of
signals are generated in a Monte Carlo simulation. For each scenario the expected
stakeholders’ intentions (according to the results of step 3) are translated into
forecasted results with a DCF model in order to determine the financial impact.
Ultimately the probabilistic distribution of losses stemming from reputational risk
can be determined (fig. 17). From this distribution synthetic measures, such as the
Value at Risk, can be derived. This final step of the framework has to be repeated for
each risk that has a potential reputational impact.
Figure 17 - Outputs of step four of the framework

Model description
72
5.2 - Risk map integration
This first step of the model has two goals:
1. To consider the list of already identified risks and assess which ones might have a
reputational impact and therefore require a more detailed analysis.
2. To identify unmapped risks with a potential reputational impact. As a matter of fact
reputational risk can sometimes stem from marginal risks that the organization had
not adequately mapped
As far as the first goal is concerned, the job comes down to a simple qualitative analysis. It
is sufficient to build a probability-impact matrix as described in the previous chapter.
The second objective requires a definitely more complex work, which should be carried out
by focus groups with the backing of structured tools.
One specific set of tools which is proposed to support this process are the techniques
currently employed to identify emerging risks.
According to a report presented by the International Actuarial Association (2008), emerging
risks are ‘developing or already known risks which are subject to uncertainty and ambiguity
and are therefore difficult to quantify using traditional risk assessment techniques. They are
problematic because they are not well addressed and tend to come as a surprise.
Some of the defining characteristics of an emerging risk are (Allan et al., 2011):
● Uncertain definition
● Uncertain frequency and severity
● Difficulty in quantification especially in monetary terms
● Uncertain causality between risk source and resultant losses
● Absence of available insurances for the risk
● Absence of clear regulation concerning the risk

Model description
73
Reputational risks clearly share most of these characteristics, it seems therefore appropriate
to employ similar techniques for their identification.
The following paragraphs will present three techniques currently employed for the
identification of emerging risks. It will provide an in depth description of the phylogenetic
analysis: a complex systems’ technique which will ultimately be implemented within the
case study in the next chapter. Moreover, two other alternative methodologies (scenario
planning and disaster causation theory) will be shortly described.
5.2.1 - Complex systems theories and phylogenetic analysis
Complex systems theories make use of an integrative approach to explain phenomena that
defy explanation through more traditional mechanistic and linear theories.
Allan (2011) suggests the use of complex systems techniques to identify emerging risks.
The author considers the applicability of: Concept Mapping, Systems Dynamic Modelling,
Chaos Theory, Fuzzy Theory, Neural networks, Genetic Algorithms, Phylogenetic Analysis,
Bayesian Networks, Cellular Automata, Agent Based Modelling and Network Theory. He
assigns scores to each method based on eight different dimensions: rigor, expert interaction,
adaptation, computability, data requirement, operability and application availability. On the
basis of such scores he comes to the conclusion that the technique which best applies to
emerging risks assessment is the Phylogenetic Analysis.
What is Phylogenetic Analysis
In biology, phylogenetics is the study of evolutionary relationships among groups of
organisms. Phylogenetic analysis utilizes molecular information, i.e. DNA, to meet the data
requirements, and assigns equal weights to characters (Mishler, 2005).
The outputs from phylogenetic analysis are tree-like shapes, often called ‘evolution trees’,
‘phylogenetic trees’ or ‘cladograms’. A phylogenetic tree is essentially a connected graph
that is composed of nodes and branches and does not contain any closed structures. The
nodes symbolize the organisms under investigation, whereas the branches that connect all
the nodes represent the relationships among different organisms, in terms of their ancestry

Model description
74
and descent relationships. The application of the phylogenetic trees, which is composed of
nodes and branches that link nodes, is not restricted to organisms. Indeed all individual
entities with taxonomic characters, such as species, populations, individuals, genes, or even
organizations (McCarthy et al., 2000), can be analyzed with this method.
All phylogenetic trees can provide the same basic information, including a historical pattern
of ancestry, divergence, and descent, all of which can be interpreted from their structure
(Lecointre & Le Guyader, 2007). The links between the nodes are called the branches and
the lengths of these are proportional either to the evolutionary time or the number of
mutations occurring along that branch (Li et al., 2000).
The three most common methods to construct phylogenetic trees are: the distance matrix
method, the maximum likelihood and the maximum parsimony method. After considering
the advantages and drawbacks of each algorithm and their experience of applying and
interpreting the resulting trees in a risk context, Allan (2011) concluded that the parsimony
method is the most suitable for risk analysis.
The principle behind the parsimony approach is that ‘a tree is more preferable if it involves
fewer evolutionary changes’. In other words, the one with the fewest evolution changes is
termed a parsimonious tree, as the term ‘parsimony’ implies as few changes as possible.
Why should this analysis be applied to risks
According to Allan (2011) risks bear considerable similarities to organisms: they exist in a
particular environment, change over time and have uncertain outcomes. The evolution of a
risk is partly determined by its uncertain nature and partly by the environment and human
intervention. A phylogenetic tree can reflect the evolutionary relationship between risks,
why they are similar or not, how these risks might adapt, mutate and evolve in the future. It
also provides a powerful classification system of the risks and the connections between
them. Risks can change and evolve in many ways but this does appear to happen in some
predictable ways. Predicting the most likely future evolution of a risk will not only allow
better risk mitigation but also help to prevent new risks from emerging. The methodology
identifies small groups of highly related risks which share a common root. The evolutionary
history of each of the groups can then be accurately traced. By understanding the phylogeny

Model description
75
of the risks it is possible to determine where evolution is most prolific and create focused
scenarios for emerging risks modelling.
In the same manner, this method can be applied to the risks that determined reputation-
damaging events. This kind of analysis should therefore allow to understand what kind of
risks could most likely have a reputational impact in the future and should point out on
which themes to focus the brainstorming groups.
What inferences can be made from phylogenetic trees
A risk tree is studied from left to right. As we move to the right, the tree branches to indicate
points where the risk characteristics are separating in evolutionary terms. The evolution risk
trees show the origin on the left hand side with the branches separating at bifurcation points
caused by a change of common risk characteristics.
Figure 18 below shows a section of a tree with two legs representing risks A & B ‘lost
intellectual property rights’ and ‘claims infringement of intellectual property rights’,
respectively. The risk characteristics are indicated by the numbers on the branches: 22 –
‘inadequate legal framework; 7 – ‘crime’ and 25 – ‘human error or incompetence’. This tree
shows there was an earlier risk with hazard 22 from which emerged the two new risks, A &
B, with additional characteristics, 7 and 25 respectively.
Figure 18 – Example of tree section (Allan, 2013)

Model description
76
There are many patterns formed within the trees which indicate where evolution is most
likely, thus helping with the monitoring and prioritization of risk mitigations. These
common patterns are captured in Table 10 below:
Table 10 – Common patterns observable in evolution trees (Allan, 2013)
Characteristic Example evolution tree
Low Bifurcation:
Low numbers of bifurcations, shown by long straight
branches, indicate areas of limited emergence. These areas
are stable and independent from other risks. They possess
few characteristics and can be more easily tracked.
High Bifurcation:
High numbers of bifurcations indicate areas of high
complexity where risks are more likely to evolve from. This
is shown by many branches on the evolutionary tree.
Character patterns in these highly active regions can often be
identified, creating a warning system.
Lost and Gained Characteristics:
Where Characteristics are lost and later regained indicates an
interesting evolutionary path. This case may be because of a
change in the environment and is worthy of further
investigation.
Characteristics
lost at this
bifurcation point
(lose shown by
red numbers)

Model description
77
Patterns:
Pattern spotting between sets. As an example, pairs of
common characteristics appearing in multiple locations can
be used to identify potential locations for emerging risks.
The emerging risks occur where one of the pair of
characteristics exist. It is possible that these single
characteristic locations may evolve into the common
pair.Pair spotting (and other character pattern spotting) can
be used to make predictions or scenarios about future risks.
Key character Change:
Key characters can indicate a change to the stability of the
system and their presence can warn of sudden changes and
further emerging risks.
Sudden Character Emergence:
The same character in multiple risk locations indicates
something is changing fast. If character ‘14’ was
‘government’, for example, why is it suddenly affecting so
many risks and what will the consequences of this be?
5.2.2 – Alternative techniques
Two other techniques that can be considered to support the process of risk map integration
are the Scenario Planning and Disaster Causation methodologies. While Scenario Planning
is a structured process to build hypothetical scenarios, the Disaster Causation methods help
to analyze past events in a structured manner.

Model description
78
Scenario planning
Miller (2003) defines scenario planning as “a process for structured thinking in which
stories are created that bring together factual data and human insight to create scenario
‘plots’ exploring possible futures”. According to Rayner (2003) scenario planning is a tool
that facilitates structured appraisal of possible future scenarios and their associated risks.
Miller analyzed the literature on scenario planning and identified eight steps within the
process:
1. Frame the issues. Scenarios must have a clear purpose and focus. Thus, it is
important to determine what a scenario planning process is intended to achieve: what
are the issues to be explored, what should the time horizon be and what business
areas should the focus be on.
2. Identify participants and solicit input. Assemble those individuals who can
provide keen insights and fresh perspectives. This group of participants should
include individuals within the organization who have roles directly connected issues
being explored. In certain situations, input from external stakeholders can be helpful.
3. Draw a picture of what is known. Working from a figurative blank sheet,
participants in the scenario planning process identify what they perceive to be the
current trends and key elements that define the environment. Implicit understandings
of relations among the various elements in the environment should be made as
explicit as possible.
4. Add uncertainties to the picture. Building upon what is known, participants should
identify uncertain environmental factors. Once managers identify uncertain
contingencies, they should explore their significance and logical implications.
5. Sketch out possible paths. Given the trends and uncertainties identified,
participants should strive to identify best case and worst case scenarios. Once
consensus is reached, these extremes serve as bounds within which a variety of
possible, but not necessarily plausible, future paths can be raised.

Model description
79
6. Test for plausibility. At this point, the multiple possible scenarios should be
checked for internal consistency. The goal is to identify three or four scenarios that
are the most relevant to formulating strategy.
7. Anticipate interactive dynamics. Using the selected scenarios, managers should
anticipate the actions of the various actors in the scenarios. It is not enough for
managers to determine how their own company will respond to the various
scenarios. They must anticipate the responses of competitors and other stakeholders.
8. Formulate strategies. With clearly developed scenarios that span multiple future
states of the world, managers can formulate strategic initiatives that exploit future
opportunities and keep risk within an acceptable limit.
According to Fahey and Randall (1998) the scenario planning technique is commonly
attributed to Herman Kahn during his tenure in the 1950s at RAND Corporation (a non-
profit research and development organisation) for the US Government, and his formation of
the Hudson Foundation in the 1960s. These techniques were also gaining credence in the
corporate world and in the 1970s both Royal Dutch Shell and the Consulting Firm SRI
International contributed to the creation of a more formalised approach to scenario planning
(or thinking) that could be more readily linked with strategic planning.
Scenario planning can be a useful tool in exploring uncertainty and teasing out those
difficult to-get-at risks. Building and analyzing scenarios can help the individuation of risks
that can affect corporate reputation. It can be particularly helpful in considering the sets of
circumstances that could spark a reputational crisis.
Disaster causation theories
Accident models provide a conceptualization of the characteristics of the accident, which
typically show the relation between causes and effects. They explain why accidents occur
and are used as techniques for i) risk assessment during system development and ii) post
accident analysis to study the causes of the occurrence of an accident. One of the earliest
accident causation models is the Domino theory proposed by Heinrich in the 40s which
describes an accident as a chain of discrete events which occur in a particular temporal
Model description
80
order. This theory belongs to the class of sequential accident models or event-based accident
models, which underlie most accident models such as Failure Modes and Effects Analysis
(FMEA), Fault Tree Analysis (FTA), Event Tree Analysis, and Cause-Consequence
Analysis (Leveson 1995). Sequential accident models explain accident causation as the
result of a chain of discrete events that occur in a particular temporal order.
In the 80s, a new class of epidemiological accident models endeavoured to explain accident
causation in complex systems. The accident is considered as the outcome of a combination
of factors, some manifest and some latent, that happen to exist together in space and time.
Reason’s (1997) Swiss cheese model of defenses is a major contribution to this class of
models, and has greatly influenced the understanding of accidents by highlighting the
relationship between latent and immediate causes of accidents.
New accident models, based on systems theory and classified as systemic accident models,
endeavour to describe the characteristic performance on the level of the system as a whole,
rather than on the level of specific cause-effect “mechanisms” or even epidemiological
factors (Hollnagel 2004). A major difference between systemic accident models and
sequential/epidemiological accident models is that systemic accident models describe an
accident process as a complex and interconnected network of events while the latter
describes it as a simple cause-effect chain of events. Two notable systemic modelling
approaches, Rasmussen’s (1997) hierarchical socio-technical framework and Leveson’s
(2004) STAMP (Systems-Theoretic Accident Model and Processes) model, endeavour to
model the dynamics of complex socio-technical systems.
These models can be applied to past reputational crises, perhaps focusing on the events that
involved a specific industry or a specific company. This should allow to better understand
the dynamics of such events and to identify what have been the latent causes. Ultimately
such analysis should help detecting potentially underestimated risks.

Model description
81
5.3 - Mapping stakeholders and reputational cues
This second step of the framework aims at determining which are the main stakeholders and
which are the reputational cues that could affect their decisions.
5.3.1 - Stakeholder analysis
The stakeholder analysis aims at evaluating and understanding stakeholders from the
perspective of an organization and to determine their relevance to a project or policy
(Brugha & Varvasovszky, 2000). The stakeholder analysis is the process of identifying the
individuals or groups that are likely to affect or be affected by an organization or an action,
and sorting them according to their impact on the organization/action and the impact the
organization/action will have on them.
According to Preston (1990) stakeholders theories for managing an organization originated
in the early 30s in the US, where General Electric identified four major interest groups it
had to consider: customers, employees, the general public and shareholders. A stakeholder
approach reflects the realization that the interests and influence of these individuals or
groups, both within and outside the organization, need to be taken into consideration in
strategic planning.
The stakeholder analysis is usually based on three steps:
1. Identifying: listing relevant groups, organizations, and people
2. Analyzing: understanding stakeholders’ perspectives and interests
3. Mapping: visualizing relationships with objectives and other stakeholders
The first step in building any stakeholder analysis is to develop a list of the members of the
stakeholders community. Various processes are suggested in the literature for building a
stakeholders list but, generally, a multistep method is applied. This usually involves a series
of interviews: the interviews include at first internal people and later other stakeholders. The
potential list of stakeholders will always exceed the capability of the mapping tool to

Model description
82
sensibly display the results; the challenge is to focus on the ‘right stakeholders’ who are
currently important.
The second step in the stakeholder analysis is to understand stakeholders’ attributes such as
interest and power. Freeman (1984) suggests the following review questions to facilitate
stakeholders mapping within an organization:
1. Who are our current and potential stakeholders?
2. What are their interests/rights?
3. How does each stakeholder affect us (challenges and opportunities)?
4. How do we affect each stakeholder?
5. What assumptions does our current strategy make about each important stakeholder?
6. What are the current ‘environmental variables’ that affect us and our stakeholders?
7. How do we measure each of these variables and their impact on us and our
stakeholders?
8. How do we keep score with our stakeholders?
The third steps aims at representing and prioritizing the relationships between the
organization and its stakeholders. A number of methods were suggested for stakeholders
mapping, among which the simplest and best known are the following.
The method developed by Savage et al. (1991) offers a way to classify stakeholders
according to potential for threat and potential for cooperation (fig. 18). The power of threat
is determined by resource dependence, the stakeholder’s ability to form coalitions, and
relevance of the threat to a particular issue. The potential to cooperate is partially
determined by the stakeholder’s capacity to expand its interdependence with the
organization: the greater the dependence, the greater the willingness to cooperate (Friedman
& Miles, 2006).

Model description
83
Figure 18 – Savage’s model (1991)
Mitchell et al. (1997) proposed a classification of stakeholders based on their power to
influence the firm, the legitimacy of each stakeholder’s relationship with the organization
and the urgency of the stakeholder’s claim on the organization (fig. 19). The concepts of
legitimacy, power, urgency and permutations of these attributes are used to create seven
stakeholder categories and one non-stakeholder category. Power alone is insufficient for
classifying a stakeholder as high priority. Legitimacy is required to provide authority.
Urgency is necessary for execution, hence the stakeholder must be aware of its power and
be willing to exercise it. They accept Suchman’s definition (1995) of legitimacy as ‘a
generalized perception or assumption that the actions of an entity are desirable, proper, or
appropriate within some socially constructed system of norms, values, beliefs and
definitions’. Urgency is based on: i) time sensitivity, that is the degree to which managerial
delay in attending to the claim or relationship is unacceptable to the stakeholder and ii)
criticality, that is the importance of the claim or the relationship to the stakeholder.
Figure 19 – Mitchell’s model (1997)

Model description
84
Figure 19 shows how a mixture of attributes can create different types of stakeholders with
different expected behavioral patterns with respect to the firm.
Power versus interest grids are described in detail by Eden & Ackermann (1998; see Figure
20). These grids array stakeholders on a two-by-two matrix where the dimensions are the
stakeholder’s interest in the organization or issue at hand and the stakeholder’s power to
affect the organization’s or issue’s future. Four categories of stakeholders result: i) players
who have both an interest and significant power, ii) subjects who have an interest but little
power, iii) context setters who have power but little direct interest and iv) the crowd which
consists of stakeholders with little interest or power (Bryson, 2003).
Figure 20 – Power vs interest grid (Bryson, 2003)
Stakeholder-issue interrelationship diagrams help show which stakeholders have an interest
in different issues, and how the stakeholders might be related to other stakeholders through
their relationships with the issues (Bryson, 2003). The resulting diagrams (see Figure 21)
help provide some important structuring to the problem area, in which a number of actual or
potential areas for cooperation – or conflict – among stakeholder interests may become
apparent.

Model description
85
Figure 21 – Stakeholder-issue relationships (Bryson, 2003)
Other more complex methods for stakeholder analysis were proposed but they seem to fit
better in project or policy proposal evaluation.
5.3.2 - Cues identification
Cues are defined in this model as the direct effects generated by the occurrence of the risks.
They represent the signals that ultimately influence the stakeholders’ decisions.
Such effects are definitely industry specific and should be identified with the support of
industry experts. To support this process two sources of information are suggested. On the
one hand the outputs of the stakeholders’ analysis should provide insights over what are the
key stakeholders’ interests and what are their drivers. On the other hand an historical
analysis of past risk events within the industry should offer an image of which are the direct
effects of risks’ occurrence.
Table 11 provides an example of what a list of reputational cues could look like. Clearly, the
list will be different for each sector and for each company.

Model description
86
Table 11 – Cues examples
Category Sub category Cue
Economic impact
Sanctions
Major sanction (€)
Average sanction (€)
Minor sanction (€)
Direct economic loss/
repair costs
Major loss (€)
Average loss (€)
Minor loss (€)
Regulatory
consequences Regulatory consequences
Prosecution
Sentence
Product recall
Company’s reaction
Voluntary product recall Voluntary product recall
Earnings restatement Earnings restatement
Resignations Top management resignation
CEO resignation
Public statements Public apology
Denial of responsibility
Negative news
media coverage
Product/Service
Negative depiction of
product/service quality
Negative depiction of
product/service safety
Negative depiction of
customers care
Governance
Negative depiction of the
company’s transparency in
it’s practices
Negative depiction of the
company’s ethical behavior

Model description
87
Citizenship Negative depiction of the
company’s environmental
policies
Other signals
Rating agencies Rating downgrade
Previous events
Recent similar events by the
same organization
Recent similar events by the
other organizations
5.4 - Understanding stakeholders’ reactions
This step of the model has the objective of assessing the how the stakeholders would react
to different combinations of cues.
Young (2010) suggests the use of the policy-capturing methodology in order to gain insight
into the stakeholders’ reaction to reputational risk.
Policy-capturing methods (or conjoint analysis methods as they are called by marketing
researchers) are a specific kind of Experimental Vignette Methodology study. EVM studies
generally consist of presenting participants with carefully constructed and realistic scenarios
to assess dependent variables including intentions, attitudes, and behaviors (Aguinis &
Bradley, 2014).
In particular policy capturing uses statistical methods to quantitatively describe relations
between a person’s judgment and the information used to make that judgment (Cooksey,
1996). Participants are asked to make decisions in response to a series of decision or
problem solving scenarios presented by the researcher. The decision outcomes are then
regressed against the values of one or more cues embedded in the scenarios. The resulting
regression weights are then used to represent the respondents’ judgment policies.
Policy-capturing evolved from Egon Brunswik’s probabilistic “lens” model, where
respondents use proximal cues from the environment and interpret them to develop
judgements about physical or social reality (Cooksey, 1996).
Some of the most important aspects in designing the research are the representativeness, that
is the selection of important elements of real-life judgment situations, and the design of

Model description
88
appropriate scenarios. The experimental design is another key point: it is important to
involve a proper sample of respondents, a right number of cue variables and a sufficient
number of scenarios that respondents will be asked to consider.
The independent variables in a policy-capturing analysis may be categorical or numeric.
There are a number of multiple regression techniques (e.g., OLS, generalized least squares
[GLS], logistic regression) that might be used in policy-capturing research, and it is
important to choose the one that is appropriate for the specific study.
Before designing the research it is necessary to understand which are the decisions that will
be investigated. According to Dowling (2006) among the determinants of the company’s
value (in a dcf framework) mostly affected by the reputation are: the cash in (sales) and the
weighted average cost of capital. These effects can be investigated by surveying customers,
clients, investors and banks. As far as the investors are concerned if the company is listed
equity analysts that cover the company should be able to provide a comprehensive outlook
of what the investors’ reactions could be.
In specific circumstances other minor effects can be embedded in the model such as
increased costs stemming from the reactions of suppliers and employees.
5.5 - Analyzing the generation of cues and drawing the conclusions
This step final step of the process analyzes what signals and with what probability are
generated by each specific risk upon its manifestation and successively feeds these
probabilities into a Monte Carlo simulation. The output of this simulation is the probabilistic
distribution of losses stemming from the reputation-damaging event. This step of the
process has to be repeated individually for each risk under examination.
In order to analyze the generation of cues there is the need for a systematic historical
analysis. The process simply takes into consideration past manifestation of the same risk
either within the company or within the industry. For each risk event an analysis of which
cues (of the ones listed in step 2) have actually been generated. After a sufficient number of
risk events has been analyzed, the probability that a specific risk will generate a specific cue
can be computed (table 10).

Model description
89
Table 12 – Example of cue probability analysis
Finally the whole framework described in the previous paragraphs is built into a Montecarlo
simulation that ultimately allows the calculation of the reputational VaR (see appendix 1)
for each specific risk.
For each specific risk the inputs to the model are:
● = the frequency of the original risk
● = the probabilities of generation of each cue
The measure of frequency should be already available to the risk managers or can otherwise
be assessed with an historical analysis. The frequency can reasonably be modelled as a
Poisson distribution. Rachev and Fabozzi (2007) specifically consider the Poisson
distribution as the best solution for modelling operational risk frequency.
Where is the average number of events that take place within the time horizon and is
the number of events which probability is being estimated.
The probabilities of generation of each cue by each risk have been estimated in the first
part of the process described in this paragraphs. At this point each cue can be modeled
Category Sub category Cue Probabilty
Economical impact
Sanctions
Major sanction (> xx € mil) 12%
Average sanction (...) 25%
Minor sanction (< xx € mil) 43%
Direct economic loss/ repair costs
Major loss (> xx € mil) 5%
Average loss (xx - xx € mil) 2%
Minor loss (< xx - xx € mil) 10%
Regulatory consequences
Prosecution 0%
Sentence 0%
Product recall 2%
Company’s reaction
Volontary product recall 20%
Earnings restatement 56%
Resignations
Top management resignation 4%
Ceo resignation 40%
Public statements
Public apology 0%
Denial of resoponsibility 8%

Model description
90
as a Bernoulli variable which probability is the combination of the probabilities of
materialization of the risk and of generation of the cues:
assuming therefore the value 1 with a probability and 0 with a probability .
The reaction of each stakeholder to each risk is a function of the cues determined by
each risk. This function has been estimated through the regression in third step of the
process.
The overall impact (loss of value) is a function of all the stakeholders’ reactions and can
be computed by building a DCF valuation in each scenario and comparing the result with a
base case valuation of the company.
All these relationship are built into a Monte Carlo simulation where the inputs are the
number of events and the manifestation of cues , modelled as previously described,
and the output is the loss of value . One important aspect to consider at this point is
whether the cues are correlated (and that is frequently the case). If the cues are not
independent the correlation has to be embedded in the sampling process.
The final result of the Monte Carlo simulation is the probabilistic distribution of the
reputational losses. In order to compute the reputational VaRα it is sufficient to consider the
(1-α) percentile of such distribution).

Model description
91
5.6 - Limitations to the model
This model presents two major limitations: the first risks one is that it does not take directly
into consideration the effect of the media; the second is that as any model that relies on
surveys is exposed to major biases and simulation.
5.6.1 – Media effects
Media coverage constitutes a key factor for reputational risk. According to Fombrun and
van Riel (2004) reputation develops through the information stakeholders receive about the
organization. Most of the information stakeholders, and in particular consumers, collect
about organizations is derived from the news media. Extensive media coverage of an event
can contribute to heightened perception of risk and amplified impacts (Bums et al., 1990).
That is why media coverage is an important feature of reputation management (Carroll &
McCombs, 2003; Carroll, 2004).
Communication involves the way (words, phrases, images, etc) that information is presented
in a message (Coombs, 2007). The way a message is framed shapes how people define
problems, causes of problems, attributions of responsibility and solutions to problems
(Cooper, 2002). Frames stress certain facts or values making them salient when individuals
make decisions (Joslyn, 2003). Kasperson et al. (1988) identified mass media as one of
various “amplifications stations” that receive, interpret and pass on risk signals,
transforming the original risk signal. The notion that media frames the way people think
about certain issues and influences the public’s attitudes about said issues is referred to as
the “agenda-setting” effect (Carroll & McCombs, 2003).
New media based on the Internet seems to being playing an increasingly essential role in
information (Peng et al., 2014). Compared with the traditional media, new media has several
advantages including rapid dissemination, a relatively free flow of information, online
interaction and no limits on time or location. Studies have reported and confirmed that
social media, such as review sites, individual weblogs, Facebook accounts and twitter
messages, significantly influence consumer decisions (Kaplan & Haenlein, 2010; Kozinets
et al., 2010).

Model description
92
However not all the information that are disseminated by the media are received in the same
way, influencing awareness and behavior. Communication researchers have long been
interested in what audiences learn from the media (Jensen, 2011). Kjaer and Morsing (2010)
in a study on the relationship between media coverage and firm reputation in Denmark,
found a statistically significant (p < 0.001) positive correlation (Spearman’s rho 0.79)
between the amount of media coverage and the respondents’ awareness of that firm.
Media coverage is particularly important when considering consumers. While the other key
stakeholders (e.g. investors, employees, suppliers) are likely to be almost perfectly informed
on events that involve the company consumers are only partially aware of such events.
Since the model presented considered the influence that “reputational signals” have on
stakeholders it should be of crucial importance to understand with likelihood which
stakeholders and especially consumers are aware of such signals.
The awareness probability could be linked to the average level media coverage for a specific
kind of event and constitute a filter, perhaps only for consumers (fig. 22).
Fig. 22 – Media as filter
In order to embed this aspect in the framework an extensive research was conducted on the
techniques of media analysis.
Media analysis can be conducted through both quantitative and qualitative methods.
Quantitative content analysis collects data about media content such as topics or issues,
volume of mentions, ‘messages’ determined by key words, circulation of the media
(audience reach) and frequency (Macnamara, 2011). Qualitative content analysis examines

Model description
93
the relationship between the text and its likely audience meaning and tries to determine the
likely meaning of texts to audiences. Qualitative content analysis can be incorporated within
or conducted simultaneously with quantitative content analysis. For instance, positive and
negative words and phrases can be analyzed to identify the tone of text.
Ultimately the effects of media on information acquisition are contingent on a variety of
factors and conditions such as country, issue, individual attitudes and values. It was then
concluded that it was a too difficult task to estimate the probability that a certain
information offered by the media is acquired by the consumers.
Another option which was considered but ultimately not embedded either was to directly
assess the level of awareness of risk events of the stakeholders directly within the surveys.
This clearly represents an area of potential improvement for the framework.
5.6.2 - Judgement analysis biases
The method presented relies on the stakeholders’ opinions expressed in surveys rather than
on historical data. This exposes the source data to errors determined by biases of the
respondents. The decisions declared in the surveys may not represent accurately the real
response that can be observed in historical data. According to Young (2010), “a survey-
based technique captures what people say they do, as compared to observing what they
actually do”.

Case study
94
6. Case study
This chapter illustrates a simplified application of the model presented in the previous
chapter. As described in chapter 5 the model is comprised of four steps:
1. Risk map integration
2. Mapping stakeholders and reputational cues
3. Understanding stakeholders’ reactions
4. Analyzing the generation of cues and drawing the conclusions
While an exemplification a potential outputs of step two is be provided, the ultimate focus
of the chapter are the most technical aspects of the framework, mainly contained in steps
one, three and four.
The case will generally focus on the food&beverage sector. While the first step of the
framework can be generalized for the whole sector the following steps have to be applied to
a specific company and to a specific risk. Therefore, the chapter is divided in two parts.
In the first part a phylogenetic analysis will be used to understand which are the “key risk
areas” for reputational risk in the food industry. The second part will consider an
hypothetical diary company. First, an example of what the outputs of steps two and three
could look like will be presented. Secondly, a simulation of step four will be conducted to
assess the reputational impact of the food contamination risk (more specifically of the
bacterial contamination risk).

Case study
95
6.1 - Risk integration with phylogenetic analysis
For this first step of the framework a phylogenetic analysis model is implemented. As it was
mentioned in the previous chapter the objective of this analysis is to gain a better
understanding of which among the risk categories are more likely to generate reputational
risk.
The next paragraph will present the most operative aspects of the implementation. First the
data collection process is presented, next the general methodology is described and finally
the results of the analysis are displayed and commented.
6.1.2 - Data collection
The objective of this data collection was to identify a sample of major reputation-damaging
events involving food&beverage companies in the last 15 years. Since there are no
extensive public databases on this kind of events, the data collection was conducted through
internet research with the support of the Lexis-Nexis academic database. The research was
carried both by using general keywords and by directly searching for the world’s largest
food&beverage companies and assessing if they were involved in major reputation
damaging events. The search resulted in a sample of 62 reputation-damaging events (tab.
13) that took place in the last 15 years.
Table 13 – Reputation damaging events sample
Year Company Year Company
2013 ABP Foodgroup 2009 Land O'Lakes
2013 Barilla 2008 Maple Leaf Foods
2010 Binbo Bakeries 2007 Mars Inc
2013 Birds Eye 2009 Mars Inc
2008 Bright dairy 2013 Mc Donalds
2011 Brown-Forman 2014 Mc Donalds
2009 Campbell soup 2008 Mengniu
2003 Cargill 2010 Mondelēz International
2005 Cargill 2010 Mondelēz International
2007 Cargill 2011 Mondelēz International
2011 Cargill 2007 Nestlé
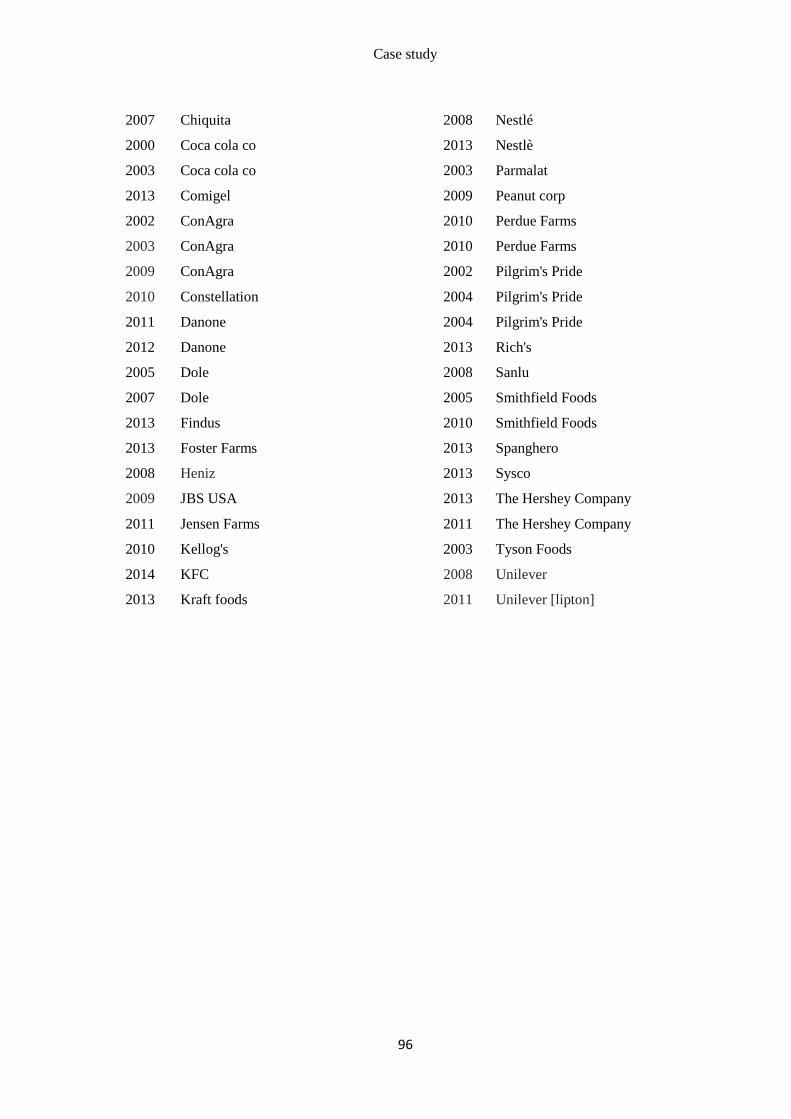
Case study
96
2007 Chiquita 2008 Nestlé
2000 Coca cola co 2013 Nestlè
2003 Coca cola co 2003 Parmalat
2013 Comigel 2009 Peanut corp
2002 ConAgra 2010 Perdue Farms
2003 ConAgra 2010 Perdue Farms
2009 ConAgra 2002 Pilgrim's Pride
2010 Constellation 2004 Pilgrim's Pride
2011 Danone 2004 Pilgrim's Pride
2012 Danone 2013 Rich's
2005 Dole 2008 Sanlu
2007 Dole 2005 Smithfield Foods
2013 Findus 2010 Smithfield Foods
2013 Foster Farms 2013 Spanghero
2008 Heniz 2013 Sysco
2009 JBS USA 2013 The Hershey Company
2011 Jensen Farms 2011 The Hershey Company
2010 Kellog's 2003 Tyson Foods
2014 KFC 2008 Unilever
2013 Kraft foods 2011 Unilever [lipton]

Case study
97
6.1.3 - Methodology
The reputational events were analyzed and mapped against a list of risk characteristics. This
list of characteristics was obtained by analyzing the risk registers of some companies within
the food industry that were available online. A company that was to implement this model
could consider the classification of risks of its own risk register.
The characteristics were initially 54 and were narrowed down to the characteristics actually
observed throughout the previously mentioned sample of events. The remaining
characteristics employed in the analysis are 30 (tab. 13).
Table 13 – Risk characteristics
Characteristic Code Characteristic Code
Operational risk issue 1 Labor issue 16
Industrial investment issue 2 Underpaid labor 17
Sourcing issue 3 Unsafe working condition 18
Product safety and quality issue 4 Racial discrimination 19
Unhealthy product ingredients 5 Child labor 20
Unsafe production policies 6 Governance and integrity issue 21
Undeclared ingredients 7 Ethical issue 22
Inadequate raw materials 8 Animal cruelty 23
Contamination of the product 9 Unethical marketing practices 24
Foreign objects in the product 10 Homophobia 25
Bacterial contamination of the
product
11 Internal fraud/illegal acts 26
Chemical contamination of the
product
12 Compliance with laws 27
Environmental issues 13 Bribery 28
Production causing deforestation 14 License infringement 29
Production causing pollution 15 Tax evasion 30
The data collected was transformed into matrix format with the reputation-damaging events
as rows and the characteristics as columns. A ‘1’ represented the presence of a characteristic
and a space or ‘0’ represents a lack of that characteristic (fig. 23).

Case study
98
Figure 23 – Extract from the data matrix
These binary data were then analyzed using two softwares for phylogenetic analysis:
PHYLIP and Mesquite. While the first one was employed for the actual analysis of the data
the second served as an instrument both to input the data and to represent the output tree. A
more detailed explanation of the procedure can be found in appendix 2.
6.1.4 - Results
Figure 24 shows the phylogenetic tree resulting from the analysis. Each branch in the
Cladogram below ends in a specific event. Each branching point is defined by a split in the
characteristics. The length of the branch represents the number of characteristics that
“evolved” to define that branch, with more characteristics leading the longer branches.
These diagrams are very useful in helping to visually identify patterns of interest. The first
thing that is noticeable in this cladogram is the division into three major clades or groups:
• Operational risks (A)
• Governance and integrity risks (B)
• Compliance risks (C)
EventsOperational
risk
Operations /
Industrial
Investments
Sourcing
Product
Safety &
Quality
Unhealthy
ingredients
Unsafe
policiesUndiclared ingredients
Raw
materials
qualityABP Foodgroup (2013) 1 0 0 1 0 0 1 0
Spanghero (2013) 1 0 0 1 0 0 1 0
Comigel (2013) 1 0 0 1 0 0 1 0
Findus (2013) 1 0 1 1 0 0 1 0
Nestlè (2013) 1 0 1 1 0 0 1 0
Birds Eye (2013) 1 0 1 1 0 0 1 0
Sanlu (2008) 1 0 0 1 0 0 1 0
Mengniu (2008) 1 0 0 1 0 0 1 0
Bright dairy (2008) 1 0 0 1 0 0 1 0
Mc Donalds (2013)
[employment practices] 1 0 0 0 0 0 0 0
Mc Donalds (2014) 1 0 0 1 0 0 0 1
KFC (2014) 1 0 0 1 0 0 0 1
ConAgra (2002) 1 0 0 1 0 0 0 0
Jensen Farms (2011) 1 0 0 1 0 0 0 0
Nestlé (2007) 1 1 0 0 0 0 0 0
Nestlé (2008) 0 0 0 0 0 0 0 0
Tyson Foods (2003) 1 0 0 0 0 0 0 0
JBS USA (2009) 1 0 0 1 0 0 0 0
Coca cola co (2003) 1 0 0 0 0 0 0 0
Coca cola co (2000) 1 0 0 0 0 0 0 0
Kraft foods (2013) 1 0 0 1 0 0 1 0
Parmalat (2003) 0 0 0 0 0 0 0 0

Case study
99
Figure 24 – Output tree

Case study
100
These can be considered the fundamental categories risks that can generate a reputational
impact (at least as far as the food industry is concerned). We can then analyze which event
types are more evolved than others by analyzing the branch length.
The bottom highlighted groups (B and C), the governance and compliance clades, shows
very little evolutionary process. These events can be considered to be relatively stable and
unchanging in nature.
In contrast to these events, the operational risks clade (A) shows significant evolution
through a large number of bifurcations in characteristics. These can be considered to be
highly evolved risk events. These types of risks should be studied in detail, as they are likely
to give us greater insight into the types of events that are more likely to be subject to
evolutionary forces in the future. While other studies are needed it is presumable that this
prevalence of reputational risk is common to numerous sectors.
It is then interesting to observe that within the operational risk clade the largest “sub-clade”
is represented by the food-safety risks. The food safety risk clade presents itself a large
number of bifurcations meaning in order to identify potential reputational risks this is
probably the area that should be more thoroughly investigated. This aspect is certainly
peculiar to the food industry.
Finally, another interesting insight that can be drawn from the observation of the results
involves the companies’ supplying process. As it can be seen the characteristic 3 (“sourcing
issues”) is present in various branches in different clades. This means that it can be
associated with different kind of risks. The implication for companies is that the reputational
risk identification process should take in deep consideration the activities of the suppliers
and how such activities could represent a threat to the organization’s reputation.

Case study
101
6.2 – Specific risk analysis
As highlighted by the phylogenetic analysis the food safety risk is definitely one of the risks
that are most likely to generate a reputational damage to companies in the food industry.
This paragraph presents the process of assessment of the reputational VaR of the bacterial
contamination risk for a dairy company. First the base case scenario for the hypothetical
company will be presented and the specific risk will be described. Then the hypothetical
outputs of steps two and three of the framework will be displayed. Finally step four of the
framework will be implemented with the use of actual empirical data on real cases of
bacterial contamination in the dairy sector.
6.2.1 - Problem setting
This section will present both the base case economics of the hypothetical dairy company
and a synthetic description of the risk that will be analyzed in the case study.
Base case DCF
The case will consider a hypothetical Italian diary company. Out of simplicity, we will
suppose it produces only one product, which is milk. The company’s forecasted results are
shown in table 14. Table 15 instead shows the free cash flows’ calculations:
Table 14 – Forecasted results
EUR M 2014A 2015E 2016E 2017E 2018E 2019E
Sales 95,7 100,0 104,5 109,2 114,1 119,3
Ebitda 6,6 7,0 7,9 8,8 9,5 9,9
Ebitda margin (%) 6,9 7 7,6 8,1 8,3 8,3
D&A 4,4 4,4 4,3 4,1 4,5 4,4
Ebit 2,5 2,6 3,3 4 3,8 4,0
Taxes 1,0 1,0 1,3 1,6 1,5 1,6
Net income 1,5 1,6 2,0 2,4 2,3 2,4

Case study
102
Table 15 – Cash flow calculation
EUR M 2015 2016 2017 2018 2019
EBIT 2.6 3.3 4.0 3.8 4.0
Taxes 1.0 1.3 1.6 1.5 1.6
NOPAT 1.6 2.0 2.4 2.3 2.4
Delta WC 0.0 0.0 0.0 0.0 0.0
Capex 2.7 2.7 2.7 2.7 2.7
D&A 4.4 4.3 4.1 4.5 4.4
Net cash flow 3.3 3.6 3.8 4.1 4.0
The base case DCF is computed under the following assumptions:
The company is financed exclusively with equity
The cost of capital is 7%
The terminal growth is 2%
The resulting enterprise value, which in this case is the same as the equity value, amounts to
57.3 €M.
The bacterial contamination risk
Worldwide, food safety is frequently at the center of media attention. Outbreaks of
foodborne illnesses happen in developed as well as in emerging countries and affect entire
food supply chains. Many smaller outbreaks go unnoticed. Bacteria are the leading cause of
foodborne diseases and appear to be the causative agents of about half of the recorded
outbreaks (CDC, 2014). Larger outbreaks trigger public attention, since they impact on
public health and impose high costs on society. Media influence the perception of foodborne
illnesses and can contribute to increased risk perception of consumers.
Among the food safety risks, the bacterial contamination risk is certainly one of the most
interesting to study, especially in the dairy sector. Bacterial illnesses are frequently
associated to the consumption of milk and dairy products. In particular one of the most
dangerous bacteria in the dairy chain is represented by Listeria monocytogenes.
Human listeriosis is a relatively rare but serious zoonotic disease; it is considered an
emerging disease as the number of cases in western countries are increasing (EFSA, 2014).
Of all the zoonotic diseases under EU surveillance, listeriosis causes the most severe human

Case study
103
disease: in 2012 in EU, 91.6 % of the cases were hospitalized and the fatality rate was 17.8
%. The bacterium can be found in raw foods and in processed foods that are contaminated
during and/or after processing. Good manufacturing practices, appropriate cleaning,
sanitation and hygiene programs and effective temperature control throughout the food
production, distribution and storage chain are required for prevention of contamination or
inhibition of growth of L. monocytogenes (EFSA, 2013).
Other bacterial illnesses that can be occasionally linked to dairy products are salmonellosis
and E.coli infections.
6.2.2 - Mapping stakeholders and cues
This step of the framework is obviously company specific. A possible list of the
stakeholders of a dairy company could include:
Customers
Stockholders
Employees
Clients
Product suppliers
Service suppliers
Banks
Subsidiaries
Regulatory agencies
Public administration
Competitors
Workers’ unions
Mass media
Local community
Scientific community
This list was obtained by analyzing the stakeholders presented in the sustainability reports
of some food companies. As it was presented in the previous chapter the stakeholders’
analysis should be conducted through structured interviews and brainstorming groups.

Case study
104
Moreover the analysis should include the prioritization of the stakeholders and the
assessment of their main interests. These in depth studies are not embedded in this
hypothetical case study for obvious reasons.
The case developed in the following paragraphs will actually consider only two
stakeholders: customers and investors. This is clearly a simplification of the model yet these
two stakeholders are usually the most relevant when considering reputational risk. The
aspects that will be examined are the customers’ purchase probability and the investors’
expected rate of return.
As far as the cues are concerned, the case will only consider the ones which have been
found to be the most relevant with reference to the bacterial contamination risk (Table 16).
Table 16 – Cues considered
Cues
Reported illnesses
Reported deaths
Investigation
Lawsuit
Imposed product recall
Temporarily ceased production
Voluntary product recall
Media headlines
Multiple contamination events in
short time
Once again the actual application of the model to a real life situation would require a more
complex analysis and the identification of all the possible cues with reference to all the risks
under examination, yet that is not the focus of this hypothetical case study.

Case study
105
6.2.3 - Understanding stakeholders’ reactions
As presented in the previous chapter the analysis of the stakeholders’ reactions has to be
explored with the use of extensive surveys. Such surveys should investigate precise
stakeholders’ decisions in response to simulated scenarios (fig. 25). The scenarios have to
be constructed by randomly combining the reputational cues in order to ultimately assess the
effect of each cue. The number of scenarios created has to be sufficient for the subsequent
regression to be statistically significant.
Figure 25 – Example of survey question
The respondents do not necessarily have to analyze all the scenarios created but can each be
provided with a smaller subset of cases. Once all the answers have been collected, the
average reaction for each scenario and for each stakeholder can be computed.
Finally in order to assess the effect of each cue a multiple regression models (one for each
stakeholder) have to be implemented. The cues are modelled as dummy variables while the
average reaction is the dependent variable.
In the case study, being an hypothetical case, reactions of customers and investors have
been simulated. A sample of 100 scenarios was generated: each scenario consisted of a
random combination of the previously described cues. The average response of customers
and investors was simulated for each scenario. Subsequently two regression models were
implemented to assess the deterministic relationships between cues and reactions (tab. 17).

Case study
106
Table 17 – Regression results
Cues
Customers’
reaction
coefficients
P-value Investors’
reactions
coefficients
P-value
Reported illnesses -0.23 0.000 0.0016 0.010
Reported deaths -0.32 0.000 0.0045 0.000
Investigation -0.09 0.000 0.0045 0.000
Lawsuit -0.12 0.002 0.0053 0.000
Imposed product recall -0.18 0.000 0.0045 0.000
Temporarily ceased production -0.02 0.159 0.0098 0.000
Voluntary product recall -0.02 0.098 0.0014 0.000
Media headlines -0.12 0.000 0.0029 0.006
Multiple contamination events in
short time -0.09 0.000 0.0042 0.000
At this point it is important to check that the terms of the regression are statistically
significant. As a matter of fact some cues could prove not to affect the reaction of specific
stakeholders. In this case the customer reaction to the “temporarily ceased production”
coefficient had a p-value of 0,16 and was therefore excluded with a 15% confidence level.
The customers’ regression was therefore repeated without the “temporarily ceased
production” variable (tab. 18).
Table 18 – Regression results with seven variables
Cues Customers’ reaction
coefficients P-Value
Reported illnesses -0.23316 0.000
Reported deaths -0.3125 0.000
Investigation -0.09518 0.000
Lawsuit -0.11638 0.000
Imposed product recall -0.18689 0.002
Temporarily ceased production - -
Voluntary product recall -0.02454 0.000
Media headlines -0.12269 0.000
Multiple contamination events in
short time -0.08842
0.000

Case study
107
6.2.4 - Analyzing the generation of cues and drawing the conclusions
This paragraph will present the final step of the framework. As it was presented in the
previous chapter this final passage ultimately consists in a scenario analysis:
Real cases of the event considered (bacterial contamination) are analyzed
The historical probability of generation of each cue is assessed
Scenarios are created as combinations of cues
The probability of each scenario is computed according to the historical probabilities
The consequences of each scenario are computed using the results of the judgement
analysis (last passage)
The overall distribution of the effects is assessed
The following paragraphs will first present the data collection process, next the detailed
methodology employed will be described and finally the results will be considered.
6.2.4.1 - Data collection
The objective of this data collection was to identify a sample of events of bacterial
contamination in the dairy industry. The choice has been to consider exclusively cases of
recalled products since that is the only case in which there is certainly a reputational
damage. The research mainly considered events found in the FDA’s (Food and Drugs
Administration) database of recalls and safety alerts. The EFSA (European Food Safety
Authority) has an analogous database but does not publicly disclose the names of the
companies and the brands involved in the events. The search resulted in a sample of 58
bacterial contamination events (tab. 19) that took place in the last 5 years.
Table 19 – Bacterial contamination events
Date Brand Company Issue
01/23/2015 Queseria Bendita Queseria Bendita LLC Listeria monocytogenes
01/02/2015 Full Tilt Ice Cream Full Tilt Ice Cream Listeria monocytogenes
12/30/2014 Buff Ewe Blue, Buff Blue,
Double Down Blue and
Bleating Heart Cheese
(BHC) Listeria monocytogenes

Case study
108
more
12/24/2014 Farm Country Cheese
House
Farm Country Cheese
House Listeria monocytogenes
12/11/2014 Flat Creek Lodge Flat Creek Farm & Dairy Salmonella
11/21/2014 Flying Cow Creamery Flying Cow Creamery May not have been
adequately pasteurized
11/04/2014 Lacteos Santa Martha Oasis Brands, Inc. Listeria monocytogenes
07/28/2014 Mt Sterling Coop
Creamery
SW Wisc Dairy Goat
Products Coop
Escherichia coli
(STEC) O111:H8
06/11/2014 Smith's Farmstead,
Mountain Gouda Smith's Country Cheese Listeria monocytogenes
05/17/2014
Knudsen, Breakstone’s,
Simply Kraft, and Daily
Chef.
Kraft Foods Group
Potential for spoilage
and/or food borne
illness
03/26/2014 Oscars Smokehouse Inc. Oscars Smokehouse Inc. Listeria monocytogenes
03/01/2014 Mexicana, Amigo, Santa
Rosa De Lima, and Anita Roos Foods Listeria monocytogenes
11/26/2013 Heavenly Flat Creek Farm and Dairy Salmonella enteritidis
09/05/2013 Chobani Chobani, Inc. Reports of bloated,
swelled product
07/29/2013 Trois Comtois Trois Comtois Listeria monocytogenes
07/05/2013 Cave Brothers, Les Freres Crave Brothers Farmstead
Cheese Company Listeria monocytogenes
06/03/2013 Finger Lakes Finger Lakes Farmstead
Cheese Company, LLC Listeria monocytogenes
01/15/2013 Homestead Creamery Homestead Creamery
Contaminated with
Shiga-Toxin
producing E.coli
11/05/2012 Kenny's Farmhouse
Cheese Kenny's Farmhouse Cheese Listeria monocytogenes
09/26/2012 Marte, frescolina Forever Cheese Inc. Listeria monocytogenes
08/08/2012
Tomales Bay Foods,
Shepherd's Way Farms,
Tumalo Farms
Tomales Bay Foods, Inc. Listeria monocytogenes

Case study
109
07/19/2012 Tita Productos Tita Corp.
Improper pasteurization
of ther milk used to
make the cheese.
07/03/2012 Andante Dairy Andante Dairy Insufficient
Pasteurization
07/02/2012 Mexicali Cheese Corp. Mexicali Cheese Corp. Listeria monocytogenes
03/16/2012 El Ranchero Del Sur, Los
Corrales El Ranchero Del Sur, LLC. Listeria monocytogenes
01/19/2012 Cedar Tree Kradjian Imp Co Listeria monocytogenes
01/03/2012 HEB, El Viajero, BMF Alpine Slicing and Cheese
Conversion Listeria monocytogenes
01/03/2012 Nordic Creamery Bekkum Family Farms LLC Listeria monocytogenes
12/31/2011 Edelweiss Creamery Alpine Slicing and Cheese
Conversion Listeria monocytogenes
12/29/2011 Fromagerie Marie Kadè Cedar Market Listeria monocytogenes
12/27/2011 Green Cedar Dairy Green Cedar Dairy Listeria monocytogenes
12/23/2011 Cedar Kradjian Imp Co Listeria monocytogenes
11/08/2011 Golden Glen Creamery Golden Glen Creamery Listeria monocytogenes
10/17/2011 Fair Oaks Royal Blue Fair Oaks Dairy Products
LLC
Listeria
Monocytogenes
10/07/2011 KALONA SUPER
NATURAL
Farmers All Natural
Creamery Residual Phosphatase
9/16/2011 Del Bueno Casero Del Bueno Listeria monocytogenes
08/11/2011 Miss Bonnie's Miss Bonnie's Gourmet,
LLC Salmonella
06/15/2011 Queso Fresco Quesos CentroAmericano
Corp. Staphylococcus Aureus
06/14/2011 Royal Blue Stilton ,
natzhert Atalanta Corporation Listeria monocytogenes
05/18/2011 Quenby Hall Blue Stilton Schratter Foods,
Incorporated Listeria monocytogenes
01/10/2011 La Original Surtex Foods
Contaminated with
Listeria monocytogenes
and Staphylococcus

Case study
110
aureus
12/17/2010 Sally jackson cheese Sally Jackson Cheese E. coli O157:H7
11/23/2010 Bravo Farms Bravo Farms E. coli O157:H7,
Listeria monocytogenes
11/17/2010 Del Bueno Del Bueno Listeria monocytogenes
11/11/2010 Mauri DPI Specialty Foods E. coli O157:H7
10/06/2010 La Nuestra Montalvan's Sales Salmonella
08/30/2010 Morningland Dairy, Ozark
Hills Farm
Morningland Dairy of the
Ozarks, LLC
Listeria monocytogenes
and Staphylococcus
aureus
08/26/2010 Queseria Chipilo, Chipilo,
Aztlan, more Queseria Chipilo, Inc. Listeria monocytogenes
08/06/2010 Queso Cotija Mexicali Cheese Corp. Staphylococcus aureus
07/01/2010 Queso El Azteca Azteca Linda Corp. Listeria monocytogenes
05/06/2010 Mt. Vikos Mt. Vikos, Inc. Listeria monocytogenes
04/06/2010 Del Bueno Del Bueno Listeria monocytogenes
03/12/2010 Spreadables Emmi-Roth Kase USA Salmonella
03/05/2010 Estrella Family Creamery Estrella Family Creamery Listeria monocytogenes
02/19/2010 Queseria Bendita Queseria Bendita Listeria monocytogenes
01/11/2010 Heluva Good HP Hood Listeria monocytogenes
01/10/2010 The Wisconsin
Cheeseman The Wisconsin Cheeseman Listeria monocytogenes
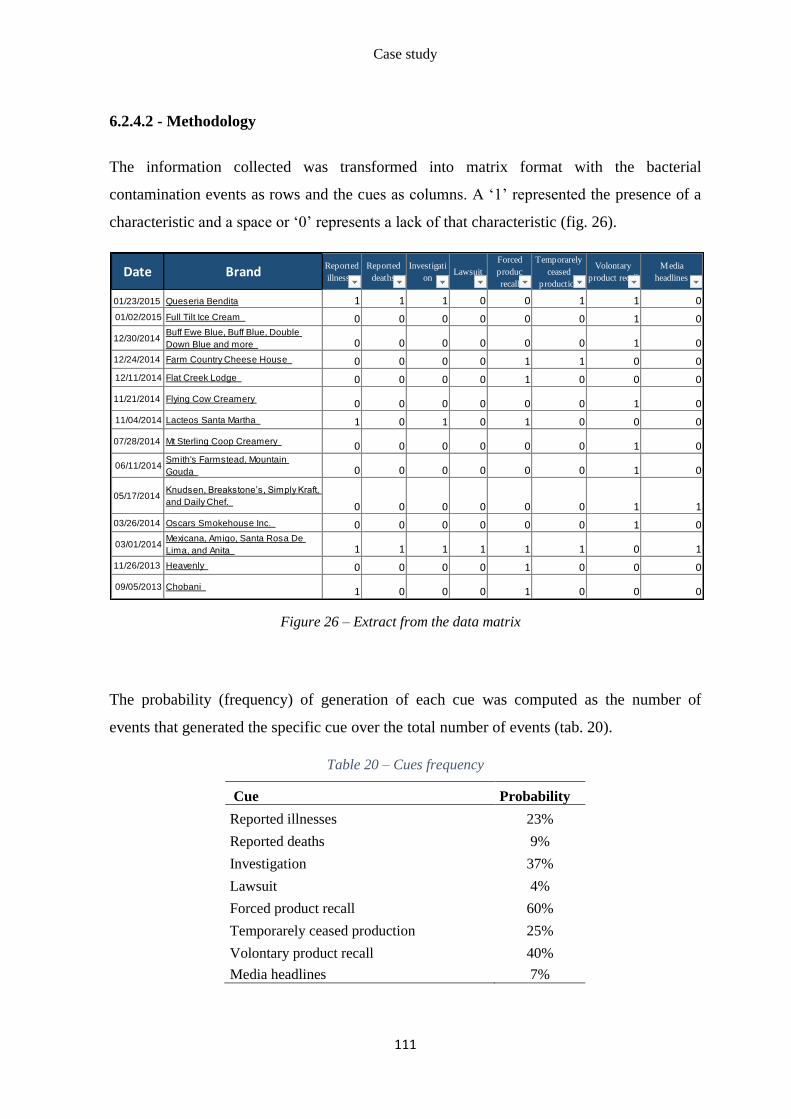
Case study
111
6.2.4.2 - Methodology
The information collected was transformed into matrix format with the bacterial
contamination events as rows and the cues as columns. A ‘1’ represented the presence of a
characteristic and a space or ‘0’ represents a lack of that characteristic (fig. 26).
Figure 26 – Extract from the data matrix
The probability (frequency) of generation of each cue was computed as the number of
events that generated the specific cue over the total number of events (tab. 20).
Table 20 – Cues frequency
Cue Probability
Reported illnesses 23%
Reported deaths 9%
Investigation 37%
Lawsuit 4%
Forced product recall 60%
Temporarely ceased production 25%
Volontary product recall 40%
Media headlines 7%
Date BrandReported
illnesses
Reported
deaths
Investigati
onLawsuit
Forced
produc
recall
Temporarely
ceased
production
Volontary
product recall
Media
headlines
01/23/2015 Queseria Bendita 1 1 1 0 0 1 1 0
01/02/2015 Full Tilt Ice Cream 0 0 0 0 0 0 1 0
12/30/2014Buff Ewe Blue, Buff Blue, Double
Down Blue and more 0 0 0 0 0 0 1 0
12/24/2014 Farm Country Cheese House 0 0 0 0 1 1 0 0
12/11/2014 Flat Creek Lodge 0 0 0 0 1 0 0 0
11/21/2014 Flying Cow Creamery 0 0 0 0 0 0 1 0
11/04/2014 Lacteos Santa Martha 1 0 1 0 1 0 0 0
07/28/2014 Mt Sterling Coop Creamery 0 0 0 0 0 0 1 0
06/11/2014Smith's Farmstead, Mountain
Gouda 0 0 0 0 0 0 1 0
05/17/2014Knudsen, Breakstone’s, Simply Kraft,
and Daily Chef. 0 0 0 0 0 0 1 1
03/26/2014 Oscars Smokehouse Inc. 0 0 0 0 0 0 1 0
03/01/2014Mexicana, Amigo, Santa Rosa De
Lima, and Anita 1 1 1 1 1 1 0 1
11/26/2013 Heavenly 0 0 0 0 1 0 0 0
09/05/2013 Chobani 1 0 0 0 1 0 0 0

Case study
112
Next, before generating the scenarios, the correlation between the variables was controlled
(tab. 21).
Table 21 – Correlation matrix between cues
Reporte
d
illnesses
Reporte
d deaths
Investigatio
n
Lawsui
t
Forced
produc
t recall
Temporarel
y ceased
production
Voluntar
y product
recall
Media
Headines
Reported
illnesses 1.000
Reported deaths 0.570 1.000
Investigation 0.538 0.406 1.000
Lawsuit 0.351 0.615 0.250 1.000
Product recall 0.191 0.129 0.406 0.157 1.000
Temporarely
ceased
production
0.273 0.399 0.494 0.334 0.220 1.000
Voluntary
product recall -0.191 -0.129 -0.406 -0.157 -1.000 -0.220 1.000
Media headlines 0.014 0.158 -0.067 0.321 -0.054 0.003 0.054 1.000
As it can be observed from table 21 the correlations between variables are consistently
different from 0. For instance the correlation between the variable “Voluntary product
recall” and the variable “Forced product recall” was “-1”. This implies that without
indulging in formal testing the variables can reasonably be considered not independent.
Assessing the joint distribution of multiple correlated variables (in this case a multivariate
correlated Bernoulli distribution) represents a complex problem. This issue is likely to
frequently arise using this framework.
For the scenario analysis therefore a specific excel tool was used (DiscoverSim). This excel
extension allows to build simulations with correlated input variables: it employs the copula
model (see appendix 3) to sample from correlated joint distributions.
Before running the simulation, another variable was added to the model: the number of
contamination events. The number of events variable was modelled as a Poisson distribution
with mean 0.1. Which, considering that the time horizon of the model is one year, means
that the hypothetical company is subject to one contamination event on average every 10
years. As it was mentioned in the last chapter, the Poisson distribution is particularly
suggested for modelling the frequency of operational risks.

Case study
113
6.2.4.3 - Results
Finally the simulation was run. The input variables were the eight cues and the number of
events with specified probabilities and correlation. The output variable was the loss which
was computed as the difference between the EV in each scenario and the EV in the base
case. The simulation is based on 10000 iterations. The distribution of losses can be observed
in figure 27.
Figure 27 – Loss distribution (€M)
The resulting VaR95% amounts to 6.4 €M. The distribution is obviously affected by the fact
that in 90% of the scenarios there is no contamination. It is interesting to observe the
distribution of losses in case of a contamination event Figure 28.
The resulting conditional VaR95% amounts to 16.4 €M. As it can be observed, the
distribution of losses is extremely irregular: that is due to the correlations between the input
variables. Had the variables been considered independent the resulting distribution would
have been the one represented in figure 29.
0
1000
2000
3000
4000
5000
6000
7000
8000
9000
00
0
1
01
0
2
02
0
3
04
0
4
05
0
6
06
0
7
07
0
8
09
0
9
10
1
1
11
1
2
12
1
3
14
1
4
15
1
6
16
1
7
17
1
8
19
1
9
20
2
1
21
2
2
22
2
3
24
2
4
25
2
6
26
2
7
27
2
8
29
2
9
30
3
1
Fre
qu
en
cy
Loss

Case study
114
Figure 28 - Conditional loss distribution (€M)
Figure 29 – Conditional loss distribution with independent variables (€M)
0
500
1000
1500
2000
00
0
0
01
0
1
02
0
2
03
0
3
04
0
4
05
0
5
06
0
6
07
0
7
08
0
8
09
0
9
10
1
0
11
1
1
12
1
2
13
1
3
13
1
4
14
1
5
15
1
6
16
1
7
17
1
8
18
1
9
19
2
0
20
2
1
21
2
2
22
2
3
23
2
4
Fre
qu
ency
Loss
0
200
400
600
800
1000
1200
1400
00
0
1
01
0
2
02
0
3
03
0
4
04
0
5
06
0
6
07
0
7
08
0
8
09
0
9
10
1
0
11
1
2
12
1
3
13
1
4
14
1
5
15
1
6
17
1
7
18
1
8
19
1
9
20
2
0
21
2
2
22
2
3
23
2
4
24
2
5
25
2
6
26
2
7
Fre
qu
ency
Loss

Conclusions
115
7. Conclusions
An increasing attention is growing for the concepts of reputation and reputational risk as a
consequence of market globalization, increasing accessibility to information, rising
regulatory pressure. In recent year several crisis characterized by a clear reputational
dimension have severely damaged some well-known companies.
There is an urgent need among managers, practitioners and researchers for simple and
reliable methodologies to assess reputation and reputational risk. But the still existing lack
of a worldwide accepted definition of reputation does not facilitate the development of such
methods.
Measuring reputation and reputational risk are widely acknowledged as very complex tasks,
for which a number of qualitative and quantitative models have been proposed.
As far as reputation is concerned, qualitative methodologies assign a numeric score to the
level of reputation of an organization, generally on the basis of surveys carried out among
stakeholders, whereas quantitative methodologies are mostly based on the evaluation of the
differences between a company’s market value and its book value. Quantitative methods
though are limited and rarely used.
Likewise qualitative and quantitative methodologies for the assessment of reputational risk
have been proposed. The first ones, which are the only ones presently employed by risk
managers, are simple and intuitive, but are biased and do not allow to compare the effects of
reputational risk to the effects of other risks. The quantitative assessment on the other had is
a very complex process. A number of quantitative models attempt to estimate the
reputational damage, mainly by observing the volatility of share prices of companies around
reputation-damaging events. These models operate from an academic perspective and
provide a rigorous demonstration of the existence of reputational risk with ex-post analyses.
At the state of the art though they provide no useful tools to conduct an ex-ante valuation of
the reputational risk to which a company is exposed.
The aim of the thesis was to develop an integrated methodology for the quantitative ex-ante
assessment of reputational risk. The framework presented in the previous chapters represent
an interesting step forward in the study of reputational risk. Its major innovation resides in
the combination of scenario analysis and judgment analysis, which allow for a quantitative

Conclusions
116
ex-ante valuation of the risk. As it was shown, the model allows the estimation of the
reputational losses distribution and consequently the calculation of the reputational VaR.
Moreover, the use of phylogenetic analysis in the process of identification of reputational
risk represents a useful tool that can easily be employed by risk managers.
In this thesis the different steps of the methodology were applied in a simplified way to test
its feasibility, focusing on identification and evaluation of reputational risks related to
microbial contamination in the dairy sector. The framework has demonstrated to function
properly and to produce sensible results. The test has not required excessively complex
mathematical modelling, and is therefore of easy application for practitioners. One of its few
drawbacks in the perspective of a practical use is a certain level of complexity originated by
the multistep structure.
Both the model and its implementation have some limitations. Regarding the model itself,
the main limitation is that its current framework does not consider directly embed the
filtering effect of media coverage on the stakeholders’ perceptions. This limitation can
represent the starting point for further researches aimed at refining this model. In addition,
further investigations and testing should be performed to study the validity of the model in
different contexts.
The model implementation on the other had was mainly limited by the lack of extensive
public databases on events that can have reputational effects. As a consequence only a small
number of events could be analyzed and data sets of different origin were used in different
steps of the procedure.
Overall the model, even with its limitations, presents a practical approach that can be
applied to real life cases. It seems likely that in the long term, once extensive databases on
the matter have been built, the models based on the market values will be refined and will
allow for more rigorous inferences over the ex-ante value of reputational risk. Still, at the
state of art, the kind of approach presented in this thesis seems to be the best choice to
quantitatively assess reputational risk.

Appendices
117
8. Appendices
Appendix 1: The VaR and the reputational VaR
The Var (Value at Risk) is risk measure usually employed for financial risks: it expresses
the maximum loss that can be expected with a defined confidence level (α) over a specified
time horizon (t).
There are three main methodologies to calculate the Var: the Parametric methods, the
historical simulation (non-parametric) and the Montecarlo simulation (semi-parametric)
(Abad 2013).
Parametric method - Parametric approaches measure risk by fitting probability curves to the
data and then inferring the VaR from the fitted curve. The most common method is the
variance-covariance method which assumes that returns/losses are normally distributed.
Once mean and variance of the returns over the time horizon t are estimated the VaR is
calculated as the (1-α) percentile of a normal distribution with said mean and variance (fig.
30).
Figure 30 – Parametric VaR
Historical simulation - The historical simulation is the most widely implemented Non-
parametric approach. This method uses the empirical distribution of financial returns as an
approximation for F(r), thus VaR(α) is the (1-α) percentile of empirical distribution.

Appendices
118
Montecarlo simulation – The Montecarlo simulation involves developing a model for future
losses/returns and running multiple hypothetical trials through the model. The VaR is then
computed as the (1-α) percentile of the simulated distribution of outcomes (fig. 31).
Figure 31 – Montecarlo VaR
The reputational VaR of a specific risk refers to the component of loss stemming
exclusively from the reputational damage and is computed using the Montecarlo simulation
methodology.
The model presented in the previous chapters employs a Montecarlo VaR. All the
relationship analyzed are built into a Montecarlo simulation that ultimately allows the
calculation of the reputational VaR for each specific risk.

Appendices
119
Appendix 2: How to build a phylogenetic analysis of risks
As it was mentioned the two softwares that were employed in the analysis are PHYLIP and
Mesquite. While PHYLIP is used for the actual phylogenetic analysis Mesquite is employed
to enter the data and to represent the results.
The first step of the process is to transform the observation into a matrix where the rows are
the events and the columns are the risk characteristics. In each cell ‘1’ represented the
presence of a characteristic in the observation and a space or ‘0’ represents a lack of that
characteristic in the observation (fig. 32).
Figure 32 – Extract from data matrix
This matrix can either be created directly in Mesquite or can otherwise be created in Excel
and later copied in a Mesquite file. In both cases to create a file in Mesquite select New
from the File menu, select the number of taxa (events) and character (characteristics) and
specify that the matrix will contain categorical data.
At this point the data can be exported to PHILYP. To export the data from Mesquite to
PHYLIP choose Export from the File menu. Choose the PHYLIP (categorical data) option
and accept the default values in the save window1 (taxon names = 10 characters, end of line
current system default).
EventsOperational
risk
Operations /
Industrial
Investments
Sourcing
Product
Safety &
Quality
Unhealthy
ingredients
Unsafe
policiesUndiclared ingredients
Raw
materials
qualityABP Foodgroup (2013) 1 0 0 1 0 0 1 0
Spanghero (2013) 1 0 0 1 0 0 1 0
Comigel (2013) 1 0 0 1 0 0 1 0
Findus (2013) 1 0 1 1 0 0 1 0
Nestlè (2013) 1 0 1 1 0 0 1 0
Birds Eye (2013) 1 0 1 1 0 0 1 0
Sanlu (2008) 1 0 0 1 0 0 1 0
Mengniu (2008) 1 0 0 1 0 0 1 0
Bright dairy (2008) 1 0 0 1 0 0 1 0
Mc Donalds (2013)
[employment practices] 1 0 0 0 0 0 0 0
Mc Donalds (2014) 1 0 0 1 0 0 0 1
KFC (2014) 1 0 0 1 0 0 0 1
ConAgra (2002) 1 0 0 1 0 0 0 0
Jensen Farms (2011) 1 0 0 1 0 0 0 0
Nestlé (2007) 1 1 0 0 0 0 0 0
Nestlé (2008) 0 0 0 0 0 0 0 0
Tyson Foods (2003) 1 0 0 0 0 0 0 0
JBS USA (2009) 1 0 0 1 0 0 0 0
Coca cola co (2003) 1 0 0 0 0 0 0 0
Coca cola co (2000) 1 0 0 0 0 0 0 0
Kraft foods (2013) 1 0 0 1 0 0 1 0
Parmalat (2003) 0 0 0 0 0 0 0 0

Appendices
120
PHYLIP is a simple program and always reads data from a file named “infile” that is
located in the PHYLIP folder. Copy the file you exported from Mesquite to the PHYLIP
folder named “exe”. If there is currently a file named “infile” then delete it. Rename your
file as “infile” (remove the extension .phy).
Figure 33 - The user interface of Penny in the PHYLIP package
The Penny module does a parsimony analysis (fig 33). Double click on the Penny icon to
start the program. It should read your data file automatically if you have performed the
above steps correctly. PHYLIP is a simple program and you change settings by typing the
letter or number in the left column (you can use the defaults).
PHYLIP is a simple program and it sends its results to text files that are automatically saved
in the exe folder. The main results are in a text file named “outfile” and the most
parsimonious tree(s) is in the file named “outtree”. Both of these are text files and you can
open them in Word or a text-editing program.
The “outfile” and “outtree” files will contain numerous equally parsimonious trees. Change
the names of these two files to “infile” and “intree” (first delete the initial infile). Use the
program Consense.exe (in the same folder) to produce one consensus tree from all the
equally parsimonious trees. The outputs will be two new “outfile” and “outtree” files.
Appendices
121
To plot the results in Mesquite copy the “outtree” file to another folder and rename it
appropriately. Add the extension “.tre”. Using the Taxa&Tree menu, choose “Import file
with trees” with the “Include contents” option. Select your file and open, choosing the
“Phylip (trees)” option when prompted2. You can view the tree by clicking on “View Trees”
in the Imported tree pane at the left of the main window.
The tree can now be edited with the numerous editing functions of Mesquite. In order to
assess what the character evolution has been go in the Tree Window and select Trace
Character History from the Analysis menu. Select Stored characters and Parsimony
Ancestral States.
Troubleshooting
(1) Note that the names of taxa have to be maximum 10 characters long and contain no
symbols. This would create issues later on. The correct names of the taxa can be
reinserted once the tree has been constructed and represented.
(2) Before opening the file in Mesquite it is important to remove the “carriage returns”.
Open the file in the text editor, leave the first row empty, eliminate the carriage returns
so that the tree is represented by a continuous string of text (it might still occupy more
than one rows but there must not be carriage returns).

Appendices
122
Appendix 3: The copula model
In probability theory and statistics, a copula is a multivariate probability distribution for
which the marginal probability distribution of each variable is uniform. Copulas are
functions that describe dependencies among variables, and provide a way to create
distributions to model correlated multivariate data. Using a copula, a data analyst can
construct a multivariate distribution by specifying marginal univariate distributions, and
choosing a particular copula to provide a correlation structure between variables. Copulas
are popular in high-dimensional statistical applications as they allow one to easily model
and estimate the distribution of random vectors by estimating marginals and copulae
separately. In risk/portfolio management, copulas are used to perform stress-tests and
robustness checks.
The software employed uses specifically uses Gaussian copulas. The first step in the process
is to construct a multivariate correlated normal distribution with a corresponding correlation
matrix (fig. 34).
Figure 34 – Example of bivariate correlated normal distribution
Next multivariate samples are drawn from the normal distribution. Using the probability
integral transformation, the copula is then generated simply by taking the CDF (Cumulated
distribution finction) of each of the vectors of the multivariate draws, so that each is

Appendices
123
uniformly distributed U(0,1). Finally, applying the inverse CDF of any distribution (in our
case the Bernoulli distribution) to a U(0,1) random variable results in a random variate
whose distribution is exactly the one selected, with the specified correlation structure. This

References
124
9. References
Abad P., Benito S., López C. (2013) - Evaluating the performance of the skewed
distributions to forecast Value at Risk in the global financial crisis - Working paper of the
Department of Quantitative Economics of Complutense University of Madrid
http://weimarques.es/soniabenito/workingpaper/EVALUATING%20THE%20PERFORMA
NCE%20OF%20THE%20SKEWED%20DISTRIBUTION.pdf
Accessed February 2015
Aguinis H. & Glavas A. (2012) - What we know and don’t know about corporate social
responsibility: a review and research agenda - Journal of Management, 38 (4), 932-968
Aguinis H. & Bradley K. J. (2014) - Best practice recommendations for designing and
implementing experimental vignette methodology studies - Organizational Research
Methods, 17 (4), 351-371
Albert V. (2005) - Parsimony and phylogenetics in the genomic age. In: Albert, V., ed.
Parsimony, phylogeny and genomics - Oxford University Press, Oxford (UK)
Allan N., Cantle N., Godfrey P. & Yin Y.(2013) - A review of the use of complex systems
applied to risk appetite and emerging risks in ERM practice - British Actuarial Journal, 1-
72
Balmer J.M.T. (2001) - Corporate identity, corporate branding and corporate marketing:
seeing through the fog - European Journal of Marketing, 35(3/4), 248-91
Balmer J.M.T. & Greyser S.A. (2002) - Managing the multiple identities of the corporation -
California Management Review, 44 (3), 72-86
Balmer J.M.T. & Greyser, S.A. (2003) - Revealing the corporation: perspectives on identity,
image, reputation, corporate branding and corporate-level marketing - Routledge, London
(UK)
Balmer J.M.T. & Greyser S.A. (2006) - Corporate marketing: integrating corporate identity,
corporate branding, corporate communications, corporate image and corporate reputation -
European Journal of Marketing, 40 (7/8), 730-41
Bank for International Settlements (2009) - Basel committee on banking supervision
enhancements to the Basel II framework – Bank for International Settlements Press &
Communications, Basel (CH)
Barnett M., Jermier J. & Lafferty B. (2006) - Corporate reputation: the definitional
landscape - Corporate Reputation Review, 9(1), 26-38
Bebbington J., Larrinaga C. & Moneva J.M. (2008) - Corporate social reporting and
reputation risk management - Accounting, Auditing & Accountability Journal, 21(3), 337-61
References
125
Benoit, W. L. (1997). Image repair discourse and crisis communications. Public Relations
Review, 23(2), 177-186
Board of Governors of the Federal Reserve System - Division of banking supervision and
regulation (2004) - Commercial bank examination manual
Brammer S. & Pavelin S. (2006) - Corporate reputation and social performance: the
importance of fit - Journal of Management Studies, 43, 435-455
Bromley D. B. (2000) - Psychological aspects of corporate identity, image and reputation -
Corporate Reputation Review, 3(3), 240-252
Bromley D. B. (2002) - Comparing corporate reputations: league tables, quotients,
benchmarks, or case studies? - Corporate Reputation Review, 5(1), 35-50
Bryson J.M. (2004) - What to do when stakeholders matter: stakeholder identification
analysis techniques - Public Management Review, 6, 21-53
Brugha R. & Varvasovsky Z. (2000) - Stakeholder analysis: a review - Health Policy and
Planning, 15, 239-246
Burt S. L. & Sparks L. (2002) - Corporate branding, retailing and retail internationalization -
Corporate Reputation Review, 5, 194-212
Carroll A. B. (1979) - A three-dimensional conceptual model of corporate social
performance - Academy of Management Review, 4, 497-505
Carroll C.E. & McCombs M. (2003) - Agenda-setting effects of business news on the
public's images and opinions about major corporations - Corporate Reputation Review, 16,
36–46
Carroll C.E. (2004) - How the mass media influence perceptions of corporate reputation:
exploring agenda-setting effects within business news coverage - The University of Texas at
Austin, Austin TX (US)
CDC (Centers for Disease Control and Prevention) (2014) - Surveillance for Foodborne
Disease Outbreaks, United States, 2012, Annual Report - Atlanta, Georgia: US Department
of Health and Human Services,
Chalmers K. & Godfrey J.M. (2004) - Reputation costs: the impetus for voluntary derivative
financial instrument reporting - Accounting, Organizations and Society, 29 (2), 95-125
Claeys A., Cauberghe V. & Vyncke P. (2010) - Restoring reputations in times of crisis: an
experimental study of the situational crisis communication theory and the moderating
effects of locus of control - Public Relations Review, 36, 256-262

References
126
Coombs W. T. & Holladay S. J. (2006) - Unpacking the halo effect: reputation and crisis
management - Journal of Communication Management, 10(2), 123-137
Coombs W.T. (2006) - The protective powers of crisis response strategies: managing
reputational assets during a crisis - Journal of Promotion Management, 12(3/4), 241-260
Coombs W.T. (2007) - Protecting organization reputations during a crisis: the development
and application of situational crisis communication theory - Corporate Reputation Review,
10(3), 163-176
Coombs W. T. & Holladay S. J. (2008) - Comparing apology to equivalent crisis response
strategies: clarifying apology’s role and value in crisis communication - Public Relations
Review, 34, 252-257
Cooksey R. W. (1996) - Judgment analysis: theory, methods and applications - Academic
Press, San Diego CA (US)
Cox P., S. Brammer & A. Millington (2004) - An empirical examination of institutional
investor preferences for corporate social performance - Journal of Business Ethics, 52, 27-
43
Cowe R. & Williams S. (2000) - Who are the ethical consumers? - Ethical Consumerism
Report, Cooperative Bank
http://www.cooperativebank.co.uk/servlet/Satellite?c=Pageandcid=1139903089615andpage
name=CoopBank%2FPage%2FtplPageStandard
Accessed February 2015
de Chernatony L. (1999) – Brand management through narrowing the gap between brand
identity and brand reputation - Journal of Marketing Management, 15 (1/3), 57-179
Deephouse D. L. (2000) - Media reputation as a strategic resource: an integration of mass
communication and resource-based theories - Journal of Management, 26 (6), 1091-1112
Deloitte (2014) - 2014 global survey on reputation risk
Desai H., Hogan C. E. & Wilkins M. S. (2006) - The reputational penalty for aggressive
accounting: earnings restatements and management turnover - Accounting Review, 81 (1),
83-112
Eden C. & Ackermann F. (1998) - Making strategy: the journey of strategic management -
Sage, London (UK)
EFSA - European Food Safety Authority (2013) - Analysis of the baseline survey on the
prevalence of Listeria monocytogenes in certain ready-to-eat (RTE) foods in the EU, 2010-
2011 Part A: Listeria monocytogenes prevalence estimates. EFSA Journal, 11(6):3241, 75
pp.

References
127
EFSA - European Food Safety Authority (2014) - The European Union Summary Report on
Trends and Sources of Zoonoses, Zoonotic Agents and Food-borne Outbreaks in 2012.
EFSA Journal, 12(2):3547, 312 pp.
Ellen P. Scholder, L., Mohr A., & Webb D. J. (2000) - Charitable programs and the retailer:
do they mix? - Journal of Retailing, 76 (3), 393-406
Elsevier (2015) - Scopus
http://www.scopus.com - Accessed February 2015
Feldman P.M., Bahamonde R.A. & Velasquez Bellido I. (2014) - A new approach for
measuring corporate reputation - Revista de Administracao de Empresas, 54(1)
Fleischer V. (2004) - Fickle investors, reputation and the clientele effect in venture capital
funds, Willamette L. Rev
Fombrun C.J. & Shanley M. (1990) - What’s in a name? Reputation-building and corporate
strategy - Academy of Management Journal, 33, 233-258
Fombrun C.J. (1996) - Reputation: realizing value from the corporate image - Harvard
Business School Press, Cambridge MA (US)
Fombrun C. & van Riel C. (1997) - The reputational landscape - Corporate Reputation
Review, 1 (1/2), 5-13
Fombrun C. J., Gardberg N.A. & Barnett M.L. (2000) - Opportunity platforms and safety
nets: corporate citizenship and reputational risk - Business and Society Review, 105 (1), 85-
106
Fombrun C. J. & Gardberg N.A (2000) - Who's Tops in Corporate Reputation? - Corporate
Reputation Review, 3(1), 13-17
Fombrun C.J. & van Riel C.B.M. (2004) - Fame & fortune: how successful companies build
winning reputations - Prentice-Hall Financial Times, New York NY (US)
Friedman A. & Miles S. (2006) - Stakeholders: theory and practice. Oxford University
Press, Oxford (UK)
Gabbi G. & Patarnello A. (2010) - Il valore della reputazione bancaria tra "risk
management" e scelte strategiche - Banca Impresa Società, 8, 335-358
Gaultier-Gaillard S. & Louisot
J.P. (2006) - Risks to reputation: a global approach - The
Geneva Papers, 31, 425-445
Gaultier-Gaillard S., Louisot J.P. & Rayner J. (2009) - Managing reputational risk: from
theory to practice - Reputation capital, 161-178

References
128
Gillet R., Hübner G. & Plunus S. (2010) - Operational risk and reputation in the financial
industry - Journal of Banking & Finance, 34, 224-235
Gotsi M. & Wilson A. M. (2001) - Corporate reputation: seeking a definition - Corporate
Communications: An International Journal, 6 (1), 24-30
Gray E. R. & Balmer J.M.T. (1998) - Managing corporate image and corporate reputation -
Long Range Planning, 31 (5), 695-702
Harpur O. M. (2002) - Corporate social responsibility monitor - Gee Publishing, London
(UK)
Harrington C. (2003) - Socially responsible investing - Journal of Accountancy, 1, 52-61
Herbig P. & Milewicz J. (1993) - The relationship of reputation and credibility to brand
success - Journal of consumer marketing, 10 (3), 18-24
Holme R. & Watts P. (2000) - Corporate social responsibility: making good business sense -
World Business Council for Sustainable Development, Geneva (CH)
Honey G. (2009) - A short guide to reputation risk - Gower Publishing Limited, Farnham
(UK)
Kaplan A. & Haenlein M. (2010) - Users of the world, unite! The challenges and
opportunities of social media - Business Horizons, 53(1), 59-68
Karpoff J. M. & Lott J. R. (1993) - The reputational penalty firms bear from committing
criminal fraud - Journal of Law and Economics, 36, 757-802
Kjaer P. & Morsing M. (2010) – Corporate reputation and the news media in Denmark - In:
Carroll, C.E. (Ed.). Corporate reputation and the news media: Agenda-setting within
business news coverage in developed, emerging, and frontier markets - Routledge, London
(UK)
Klein J. & Dawar N. (2004) - Corporate social responsibility, consumers’ attributions and
brand evaluations in a product-harm crisis - International Journal of Research in Marketing,
21 (3), 203- 217
Knox S. & Bickerton D. (2003) - The six conventions of corporate branding - European
Journal of Marketing, 37(7/8), 998-1016
Kishino H., Miyata T. & Hasegawa M. (1990) - Maximum likelihood inference of protein
phylogeny and the origin of chloroplasts - Journal of Molecular Evolution, 31, 151-160
Kozinets R.V., de Valck K., Wojnicki A.C. & Wilner S.J.S. (2010) - Networked narratives:
understanding word-of-mouth marketing in online communities - Journal of Marketing, 74
(2), 71-89

References
129
International Actuarial Association (IAA) (2008) - Practice note on enterprise risk
management for capital and solvency purposes in the insurance industry.
http://www.actuaries.org.uk/research-andresources/documents/practice-note-enterprise-risk-
management-erm-capital-and-solvency-p
Accessed February 2015
Jensen J.D. (2011) - Knowledge acquisition following exposure to cancer news articles: a
test of the cognitive mediation model - Journal of Communication, 61(3), 514–534
Johnson R. A. & Greening D. W. (1999) - The effects of corporate governance and
institutional ownership types on corporate social performance - Academy of Management
Journal, 42, 564-576
Landon S. & Smith C.E. (1997) - The use of quality and reputation indicators by consumers:
the case of Bordeaux wine - Journal of Consumer Policy, 20 (3), 289-323
Larkin J.( 2003) - Strategic reputation risk management - Palgrave MacMillan, New York
NY (US)
Lecointre G. & Le Guyader H. (2007) - The tree of life: a phylogenetic classification -
Belknap
Leveson N. G. (2004) - A new accident model for engineering safer systems - Safety
Science, 42(4), 237–270
Li S., Pearl D. & Doss H. (2000) - Phylogenetic tree construction using Markov Chain
Monte Carlo - Journal of American Statistical Association, 95, 493-508
Lin Y., Fang S. & Throne J. (2007) - A tabu search algorithm for maximum parsimony
phylogeny inference - European Journal of Operational Research, 176, 1908-1917
Lyon L. & Cameron G. T. (2004) - A relational approach examining the interplay of prior
reputation and immediate response to a crisis - Journal of Public Relations Research, 16(3),
213–241
Mahon J. F. (2002) - Corporate reputation: research agenda using strategy and stakeholder
literature - Business & Society, 41, 415-445
Mccarthy I., Ridgway K., Leseure M. & Fieller, N. (2000) - Organisational diversity,
evolution and cladistic classifications - Omega: The International Journal of Management
Science, 28, 77-95
McWilliams A. & Siegel D. (2001) - Corporate social responsibility: a theory of the firm
perspective - Academy of Management Review, 26, 117–127
Melewar T. C., Karaosmanoglu E. & Patterson D. (2005) - Corporate identity: concept,
components and contribution - Journal of General Management, 31(1), 59-81

References
130
Minor D. & Morgan J. (2011) - CSR as reputation insurance: primum non nocere -
California Management Review 53(3), 40 –59
Mishler B. (2005) - The logic of the data matrix in phylogenetic analysis. In: Albert, V., ed.
Parsimony, phylogeny and genomics - Oxford University Press, Oxford (UK)
Mitchell R.K., Agle B.R. & Wood D.J. (1997) - Toward a theory of stakeholder
identification and salience: defining the principle of who and what really counts - Academy
of Management Review, 22, 853–886
Mitroff, I., Shrivastava P. & Udwadia F. E. (1987) – Effective crisis management - The
Academy of Management Executive, l (3), 283-292
Morrison A. & William J. W. Jr. (2004) - Partnership firms, reputation and human capital -
American Economic Review, 94, 1682-1692
Mukherjee A. and He H. (2008) - Company identity and marketing: an integrative
framework - Journal of Marketing Theory and Practice, 16(2), 111-25
Neville B.A., Bell S.J. & Mengüç B. (2005) - Corporate reputation, stakeholders and the
social performance-financial performance relationship - European Journal of Marketing,
39(9/10), 1184- 1198
Nicholls A. & Lee N. (2006) - Purchase decision-making in fair trade and the ethical
purchase ‘gap’: is there a fair trade ‘twix’?’ - Journal of Strategic Marketing,14(4), 369-386
Ocean Tomo, LLC (2011) – Annual study of intangible asset market value 2010
Orlitzky M., Schmidt F., Rynes & S. (2003) - Corporate social and financial performance: a
meta-analysis - Organization Studies, 24, 403-441
Palmrose Z., Richardson V.J. & Scholzb S. (2004) - Determinants of market reactions to
restatement announcements - Journal of Accounting and Economics, 37, 59-89
Pearson C. M. & Mitroff I. I. (1993) - From crisis prone to crisis prepared: a framework for
crisis management - Academy of Management Executive, 7 (1), 48-59
Peng Y., Li J., Xia H., Qi S. & Li J. (2014) - The effects of food safety issues released by
media on consumers’ awareness and purchasing behavior: a case study in China - Food
Policy, 51, 44–52
Perry J. & de Fontnouvelle P. (2005) - Measuring reputational risk: the market reaction to
operational loss announcements
http://ssrn.com/abstract=861364
Accessed February 2015

References
131
Podonly J. M. (1993) - A status-based model of marketing competition - American Journal
of Sociology, 98 (4), 829-872
Podonly J. M. & Hsu G. (2002) - Quality, exchange, and knightian uncertainty - Graduate
School of Business Stanford University, Stanford CA (US)
http://citeseerx.ist.psu.edu/viewdoc/download?doi=10.1.1.202.1704&rep=rep1&type=pdf
Accessed February 2015
Rasmussen J. (1997) - Risk management in a dynamic society: a modelling problem - Safety
Science, 27, 183-213
Rayner J. (2003) - Managing reputational risk: curbing threats, leveraging opportunities –
Wiley, Hoboken NJ (US)
Rayner J. (2008) - Understanding reputation risk and its importance - Qfinance
http://www.qfinance.com/business-strategy-best-practice/understanding-reputation-risk-
and-its-importance?full - Accessed February 2015
Reason J. (1997) - Managing the risks of organizational accidents - Aldershot: Ashgate
Reputation Institute (2008) - Corporate reputation management
http://www.reputationinstitute.com/events/10Apr08_Reputation_Management_Munich.pdf
Accessed February 2015
Rhee M. & Haunschild P. (2006) - The liability of good reputation: a study of product
recalls in the U.S. automobile industry - Organization Science
http://citeseerx.ist.psu.edu/viewdoc/download?doi=10.1.1.195.7969&rep=rep1&type=pdf
Accessed February 2015
Rindova A. (1997) - The image cascade and the formation of corporate reputations -
Corporate Reputation Review, 1, 189-194
Rindova V. P., Williamson I. O., Petkova A. P. & Sever J. M. (2005) - Being good or being
known: an empirical examination of the dimensions, antecedents, and consequences of
organizational reputation - Academy of Management Journal, 48, 1033-49
Roberts P.W. & Dowling G.R. (2002) - Corporate reputation and sustained superior
financial performance - Strategic Management Journal, 23(12), 1077-1093
Sacconi L. (2004) - Corporate social responsibility (CSR) as a model of ‘extended’
corporate governance: an explanation based on the economic theories of social contract,
reputation and reciprocal conformism - LIUC, Ethics, Law and Economics Paper, 142
Savage G.T., Nix T.H., Whitehead C.J., Blair J.D. (1991) - Strategies for assessing and
managing organizational stakeholders. Academy of Management Executive, 5, 61-75
References
132
Scandizzo S. (2011) - A framework for the analysis of reputational risk - The Journal of
Operational Risk - 6 (3), 41-63
Schultz M., Mouritsen J. & Gabrielsen G. (2001) - Sticky reputation: analyzing a ranking
system - Corporate Reputation Review, 4 (1), 24-41
Schwaiger M. (2004) - Components and parameters of corporate reputation: an empirical
study - Business Review, 56, 46-71
Sen S. & Bhattacharya C.B. (2001) - Does doing good always lead to doing better?
Consumer reactions to corporate social responsibility - Journal of Marketing Research, 38,
225-244
Sneath P. & Sokal R. (1973) - Numerical taxonomy: the principles and practices of
numerical classification - Freeman
Smith A. (2008) - Resource based view of the firm: measures of reputation among health
service-sector businesses - Health Marketing Quarterly, 25(4), 361-82
Soprano A., Crielaard B., Piacenza F. & Ruspantini D. (2009) - Measuring operational and
reputational risk – Wiley, Hoboken NJ (US)
Stephens K. K., Malone P. C. & Bailey C. M. (2005) - Communicating with stakeholders
during a crisis: evaluating message strategies - Journal of Business Communication, 42,
390–419
Suchman M. (1995) - Managing legitimacy: strategic and institutional approaches -
Academy of Management Review, 20, 571-611
Thies C. (2002) - The demise of Arthur Andersen
http://www.gold-eagle.com/editorials_02/thies041502.html
Accessed February 2015
Tonello M. (2000) - Corporate governance handbook: legal standards and board practices
(third edition) - The Conference Board, Inc.
The ACE Group (2013) - Reputation at risk - ACE European risk briefing 2013
The Chartered Institute of Management Accountants (CIMA) (2007) - Corporate reputation:
perspectives of measuring and managing a principal risk
http://www.cimaglobal.com/Documents/Thought_leadership_docs/cid_exrep_corporate_rep
utation_june07.pdf
Accessed February 2015
The Conference Board, Inc. (2007) - Reputation risk: a corporate governance perspective -
Research report
The Economist Intelligence Unit (2005) - Reputation: risk of risks - White paper

References
133
Turban D.B. & Greening D.W. (1997) - Corporate social performance and organizational
attractiveness to prospective employees - Academy of Management Journal, 40, 658-672
Young G. (2010) - Exploration of reputational risk from the perspective of a variety of
stakeholders - Society of Actuaries
https://www.soa.org/.../research-rep-risk-young.pdf
Accessed February 2015
Young G. & Hasler D.S. (2010) - Managing reputational risk - Strategic Finance, 11, 37–46
Walker K. (2010) - A systematic review of the corporate reputation literature: definition,
measurement, and theory - Corporate Reputation Review, 12, 357-387
Walsh G. & Beatty S.E. (2007) - Customer-based corporate reputation of a service firm:
scale development and validation - Journal of the Academy of Marketing Science, 35 (1),
127-143
Wartick S. L. (2002) - Measuring corporate reputation: definition and data - Business &
Society, 41 (4), 371-393
Whetten D.A. & Mackey A. (2002) - A social actor conception of organizational identity
and its implications for the study of organizational reputation - Business and Society, 41 (4),
393-414