Embed Size (px)
Citation preview

An integrated design approach for low noise exposing high-lift devices
Jochen Wild* and Michael Pott-Pollenske† DLR Institute of Aerodynamics and Flow Technology, Braunschweig, 38108, Germany
and
Björn Nagel‡ DLR Institute of Composite Structures and Adaptive Systems, Braunschweig, 38108, Germany
The DLR project LEISA combines and focuses activities in the research areas of high lift system design, flow control and aero-acoustic design methods, which have been carried out rather independently up to now. Furthermore, the competence in the fields of aerodynamics, aero-acoustics, structures and flight systems will be integrated to provide an interdisciplinary assessment of high lift system design for transport aircraft configurations. The project LEISA started at the beginning of 2005, so up to now only few results are available. This paper addresses the integrated design approach and first results for a noise reduced slat device and combined wind tunnel testing results for aerodynamics and aero-acoustics.
Nomenclature b = wing span
DC = drag coefficient
LC = lift coefficient
,maxLC = maximum lift coefficient c = local wing chord
locc = local chord length of the wing element
pc = local pressure coefficient D = drag
idleF = idle thrust
maxF = maximum thrust
reqF = required thrust
mf = 1/3-octave band g = gravity constant
H = vertical speed L D = lift to drag ratio
,maxAL = overall A-weighted maximum noise level
normL = normalized sound pressure level
measL = measured sound pressure level l = reference length
* Research Engineer, Transport Aircraft Department, [email protected], non-AIAA Member. † Research Engineer, Technical Acoustics Department, [email protected], AIAA Member. ‡ Research Engineer, Adaptronics Department, [email protected], non-AIAA Member.
American Institute of Aeronautics and Astronautics
1
M = Mach number MLW = maximum landing weight MTOW = maximum take-off weight p = pressure Re = Reynolds number Sr = Strouhal number V = true airspeed V = acceleration
APV = approach speed
TOV = take-off speed
refV = arbitrary reference velocity W = aircraft weight
, ,x y z = Cartesian coordinates (2D: x – chordwise, y – upwards; 3D: x – chorwise, y – spanwise, z – upwards) α = angle of attack η = dimensionless wing span η = 2y/b
0ϕ = leading edge sweep angle γ = flight path angle
I. Introduction
T HE noise impact of arriving and departing air traffic in the vicinity of large airports is assuming an increasingly important role, clearly visible in noise dependent landing fees and flight restrictions like nighttime curfews. As
a consequence, the development of future airliners will have to provide solutions to this problem in order to maintain 24h operation in highly populated areas. Basically two ways of reducing the noise impact are conceivable: a) Reduction of the acoustic intensity of the noise source or b) increase of the distance of the noise source from the exposed region. The first approach addresses the aero-acoustic design of the aircraft and of its components, the second one the aerodynamic performance of the aircraft and the engines. It is quite obvious that if means for aero-acoustic improvements degrade the aerodynamic performance, increase the aircraft weight, or system complexity, the overall benefits may be quite limited or even completely cancelled. Thus, noise reduction represents a strongly multidisciplinary problem field. Only through a global consideration of all different influences an identification of the minimum noise exposure is feasible.
In the last few years a growing number of projects dealing with aircraft noise have been started. Most of them are either dedicated to the identification of new aircraft concepts for silent aircraft configurations, like the European project ROSAS2 or the British-American Silent Aircraft Initiative17. Other projects focus on more global issues beyond single aircraft including air traffic management and human reception on noise like the DLR project LFVK18,19. In contrast the DLR project LEISA (Low noise exposing integrated design for start and approach) addresses directly the design process of the high lift system for a conventional aircraft with the objective of minimizing the noise observed on the ground. Well established research activities in the field of the aerodynamic design of high lift systems are supplemented by the increasingly important consideration the aircraft’s airframe noise generated by the high lift system. In particular, the focus is laid on an integrated assessment of high lift configurations concerning exterior noise and flight performance. The project combines and focuses recent DLR activities in the research areas of high lift system design, flow control and aero-acoustic design methods, which have been carried out independently up to now. Furthermore, the competence in the fields of aerodynamics, aero-acoustics, structures and flight systems will be integrated to provide an interdisciplinary assessment of high lift system design for transport aircraft configurations. The project is further sustained by a common DLR-ONERA research activity on noise source prediction methods.
Former investigations at DLR have identified the slat of the high-lift system to be a major source of airframe noise4. Only by varying the slat position a noise source reduction of 10dB can be achieved13. The shortcoming of this type of modification had been that also the aerodynamic performance in terms of maximum lift was decreased by about 10%. With the integrated design philosophy that will be established within the project it is targeted to achieve this noise reduction without loss in aerodynamic performance.
In the project LEISA three different types of high-lift configurations are addressed. First it is investigated how the noise of a conventional slat can be reduced without loss of aerodynamic performance. First preliminary results
American Institute of Aeronautics and Astronautics
2

show that an increased slat together with an increased overlap of the device is able to improve aerodynamic performance while slightly reducing the flow velocity at the upper slat trailing edge. Since slat noise is dominated by trailing edge noise scaling with the velocity according to a power law a noise reduction is achieved. Second, a slat-less high-lift design is investigated with respect to maximum aerodynamic performance in order to reduce the losses due to the omitted leading edge device as much as possible. Concepts like smart droop noses or other unslotted devices will be evaluated. Finally new unconventional types of high-lift devices will be evaluated, which may have an influence also on the structural design of the wingbox.
II. Reference Aircraft and Design Wing Section The aircraft type targeted in LEISA is a typical short
to medium range twin engine configuration (F ). Since LEISA focuses on reduction of noise exposure this aircraft size is the most appropriate, since it is expected to have a relatively high frequency of take-offs and landings. The design mission of the aircraft is to transport 180 passengers over a range of 2000NM. The high-lift system is defined for four different settings covering the envelope of the aerodynamic performance as shown in
.
igure 1
Figure 2
or this w
The wing of the aircraft is derived from the generic aircraft investigated in the german joint project ProHMS3. Within this project, DLR has designed a high-lift system. The wing has a classical double trapezoidal type planform with an overall span of 40mb = . F ing a 3D half model for wind tunnel testing exists and has already been investigated in different wind tunnels, also under cryogenic conditions at high Reynolds numbers21.
Figure 1. Generic reference aircraft used in the LEISA project
The reference wing section for the two-dimensional design investigations is located at 0.511η = , where the 3D half model is equipped with a row of pressure probes. In order to assess the effects of the wing sweep the corresponding wing section is normalized applying the leading edge sweep of 0 30ϕ = ° . For the reference wing section a 2D wall to wall wind tunnel model (F ) with a chord of c = 600mm has been built for usage in the DNW-NWB low speed wind tunnel in Braunschweig as well as the DNW-KKK cryogenic wind tunnel in Cologne. The achievable Reynolds number ranges from Re = 1.2x10
igure 3
6 to 13.4x10⁶. The model is equipped with adjustable brackets for the high-lift devices and is continuously adjustable in gap, overlap and deflection angle. It is equipped
with one full row of pressure probes in the mid section and two additional rows with half the number of probes close to the tunnel walls and close to the brackets for assessment of three-dimensional effects. For aero-acoustic investigations a half sized 2D model for the DLR-AWB acoustic wind tunnel is under construction.
LEISA reference aircraftenvelope
-0,5
0,0
0,5
1,0
1,5
2,0
2,5
3,0
0,00 0,10 0,20 0,30 0,40CD
C L
CleanClimbTake-OffApproachLanding
Figure 3. Side view of the modular 2D wind tunnel model of the design wing section with continuously movable brackets for 3-element (above) and 2-element (below) configuration
Figure 2. Envelope of the trimmed aerodynamic performance of the LEISA reference aircraft
American Institute of Aeronautics and Astronautics
3

III. The Integrated Design Approach Since the aircraft noise observed at the ground is a result of the combination of all the different disciplines
involved in the aircraft design process, it is necessary also to approach the design target of noise reduction in a multidisciplinary way. In the project LEISA the three major disciplines involved in the airframe design are included: aerodynamics, structures, and flight mechanics. Together with the aero-acoustic evaluation the effects on airframe noise generation and noise exposure around airports can be assessed. It has been decided very early not to take into account the engines and to keep them as is. One major reason for this is the lack of an adequate noise model for the engine and the effects of changes on the noise source level.
The design process chain starts with the aerodynamic design of a high-lift system for a reference aircraft by means of wing section design. The aero-acoustic evaluation is based on simplified noise source models. The predictions of both disciplines are verified by wind tunnel experiments. Based on the aerodynamic loads the structure and system weight increase or decrease is evaluated. Flight path calculations based on mass point motion is performed to assess fly-over altitudes. In a last step the noise sources and the altitudes are introduced into a farfield noise model to evaluate the noise footprints on the ground during the take-off and approach procedures. In the following we describe the contributions of the different disciplines to the integrated design process.
A. Aerodynamic Design of High-Lift Systems At DLR a lot of experience is available on
designing high-lift systems based on computational fluid dynamics (CFD)22. The design is performed as 2D wing section design. The flow is simulated using the structured finite volume method FLOWer10 developed at DLR. It solves the compressible Navier-Stokes equations with artificial dissipation using an explicit time stepping scheme. Turbulence is modeled with a Spalart-Allmaras model including Edwards modification. The flow domain is discretized by a block structured mesh with about 80.000 points shown in Fi
. The applied parametric grid generator MegaCadsgure
4
igure 5
1 together with a well tested grid generation porocedure guarantees grids of constant quality in terms of boundary layer resolution and surface discretization.
Figure 4. 2D grid around the design wing section of the LEISA referencewing
For the application to transonic transport aircraft the infinite swept wing analogy (F ) is used together with a systematic scaling based on the 3D planform to transfer the 2D section data to 3D wing performance. The infinite swept wing analogy divides the flow into two parts, the first governing the flow in a plane normal to the sweep direction and the second into the direction of the sweep. Since in the second part all geometry is parallel to the direction of sweep, no gradients of the flow quantities in this direction occur. The applied transformation results in a scaling of the wing section geometry
2 3 cosD Dy z ϕ= (1) and the nominal flow conditions
2 3 cosD DM M ϕ= (2) 2
2 3 cosD DRe Re ϕ= (3)
1 32
tantan
cosD
Dα
αϕ
− =
(4)
For the reverse transformation first the computed pressure distribution has to be scaled according to the reduction of the reference Mach number
3 2
2cosD Dp pc c ϕ= (5)
Figure 5. Transformation of the design section (red line) into the leading edge coordinate system (blue line) by use of the infinite swept wing (yellow) anology
This pressure distribution is then matched to data of the
3D wing by varying the angle of attack. This is necessary since the local effective angle of attack at the design section is unknown because it is a function of the circulation distribution and the angle of attack of the 3D wing. 6 shows a comparison of 2D scaled calculated pressure
Figure
American Institute of Aeronautics and Astronautics
4
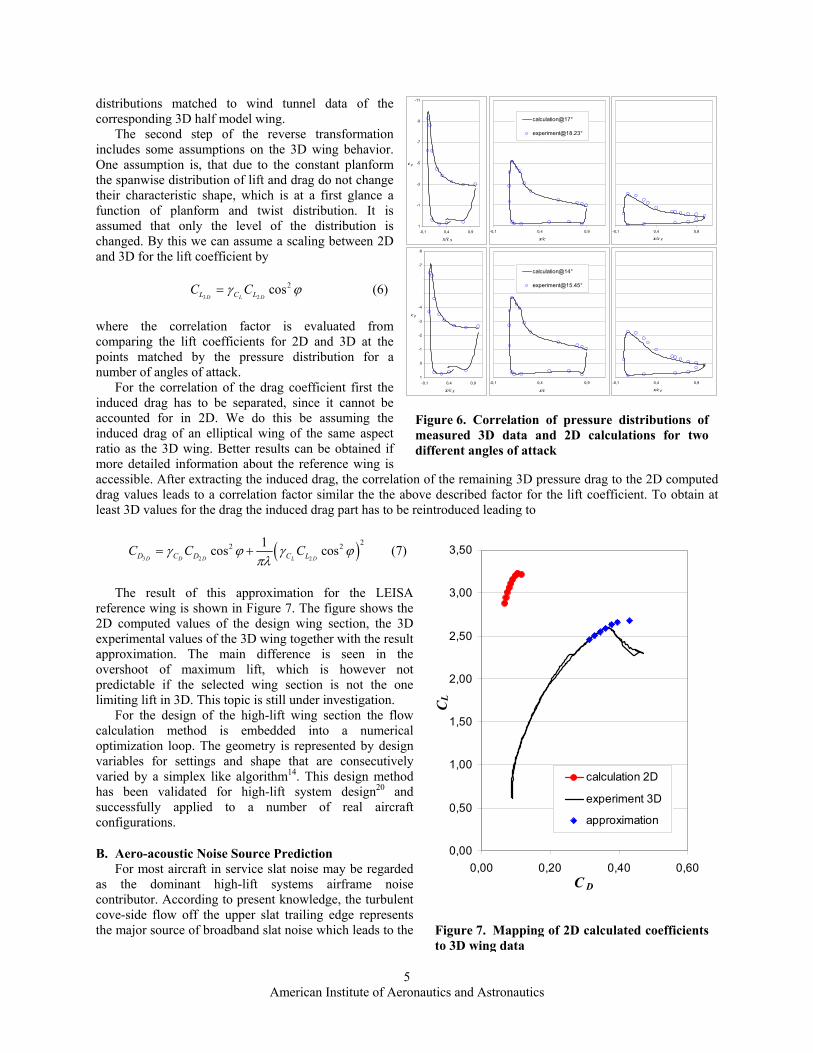
distributions matched to wind tunnel data of the corresponding 3D half model wing.
The second step of the reverse transformation includes some assumptions on the 3D wing behavior. One assumption is, that due to the constant planform the spanwise distribution of lift and drag do not change their characteristic shape, which is at a first glance a function of planform and twist distribution. It is assumed that only the level of the distribution is changed. By this we can assume a scaling between 2D and 3D for the lift coefficient by
3 2
2cosD L DL C LC Cγ ϕ= (6)
-6
-5
where the correlation factor is evaluated from comparing the lift coefficients for 2D and 3D at the points matched by the pressure distribution for a number of angles of attack.
For the correlation of the drag coefficient first the induced drag has to be separated, since it cannot be accounted for in 2D. We do this be assuming the induced drag of an elliptical wing of the same aspect ratio as the 3D wing. Better results can be obtained if more detailed information about the reference wing is accessible. After extracting the induced drag, the correlation of the remaining 3D pressure drag to the 2D computed drag values leads to a correlation factor similar the the above described factor for the lift coefficient. To obtain at least 3D values for the drag the induced drag part has to be reintroduced leading to
-8
-7
-4
-3
-2
-1
0
1-0,1 0,4 0,9
x/c S
c p
-0,1 0,4 0,9
x/c
calculation@14°
-0,1 0,4 0,9
x/c F
-11
-9
-7
-5
-3
-1
1-0,1 0,4 0,9
x/c S
c p
-0,1 0,4 0,9
x/c
calculation@17°
-0,1 0,4 0,9
x/c F
Figure 6. Correlation of pressure distributions of measured 3D data and 2D calculations for two different angles of attack
( )3 2 2
22 21cos cosD D D L DD C D C LC C Cγ ϕ γ ϕ
πλ= + (7)
The result of this approximation for the LEISA
reference wing is shown in F . The figure shows the 2D computed values of the design wing section, the 3D experimental values of the 3D wing together with the result approximation. The main difference is seen in the overshoot of maximum lift, which is however not predictable if the selected wing section is not the one limiting lift in 3D. This topic is still under investigation.
igure 7
For the design of the high-lift wing section the flow calculation method is embedded into a numerical optimization loop. The geometry is represented by design variables for settings and shape that are consecutively varied by a simplex like algorithm14. This design method has been validated for high-lift system design20 and successfully applied to a number of real aircraft configurations.
B. Aero-acoustic Noise Source Prediction For most aircraft in service slat noise may be regarded
as the dominant high-lift systems airframe noise contributor. According to present knowledge, the turbulent cove-side flow off the upper slat trailing edge represents the major source of broadband slat noise which leads to the
0,00
0,50
1,00
1,50
2,00
2,50
3,00
3,50
0,00 0,20 0,40 0,60CD
C L
calculation 2D
experiment 3D
approximation
Figure 7. Mapping of 2D calculated coefficients to 3D wing data
American Institute of Aeronautics and Astronautics
5

conclusion that slat noise can be regarded as trailing edge noise. As pointed out the project LEISA aims at the development of an integrated design which allows optimizing the
aero-acoustic and the aerodynamic performance during the design process of future aircraft. Since the aerodynamic performance usually will be optimized by means of RANS based flow solvers the noise source prediction is based on the turbulence data provided by such calculations in order to provide a fast and low-cost aero-acoustic assessment of different aerodynamic configurations. In a first study the concept of a very fast aero-acoustic design tool is developed and validated for airfoil trailing edge noise, which is a very relevant source mechanism in airframe noise and yet simple as far as the geometry and the experimental setup is concerned.
Experimental studies on trailing edge noise were carried out in DLR’s Aero-acoustic Wind-tunnel Braunschweig (AWB). Since trailing edge noise is governed by turbulence passing the trailing edge of an airfoil, the effect of different turbulence levels at the trailing edge on the noise generation was examined by means of two 2D-airfoils (Figure 8) with substantially different boundary layers which incorporate the turbulence passing over the trailing edge. In order to prevent the occurrence of tones or narrow banded peaks due to bluntness noise the 400 mm chord length airfoils both are equipped with a trailing edge of less than 0.2 mm thickness.
In addition the boundary layer conditions of each airfoil were changed by means of transition tripping at different chord positions upstream of the position of free transition of the airfoil according to Table 1.
Noise data were acquired by means of an elliptical mirror that was traversed in a mid-span position along the airfoil’s chord line. To determine the effect of boundary layer tripping on the fluctuating velocities in the vicinity of the trailing edge hot-wire measurements were performed (Figure 9). In order to compare the experimental data to numerical data from RANS calculations the static pressure distribution was measured with a PSI8400 system. All tests were carried out for wind speeds of 40 m/s, 50 m/s and 60 m/s and an effective angle-of-attack of α = 0°.
NACA0012
NACA66-006
10.2 0.4 0.6 0.8
Position of free transitionapp. 43 % – 45 %
Position of free transition: app. 85%
Tripping positions
Tripping positions
x/c
NACA0012
NACA66-006
10.2 0.4 0.6 0.8
Position of free transitionapp. 43 % – 45 %
Position of free transition: app. 85%
Tripping positions
Tripping positions
x/c
Figure 8. Airfoil geometries tested in AWB. The NACA0012 was selected to provide a turbulent boundary layer while in contrast the NACA66-006 is asumed to provide a laminar boundary layer along a substantial length.
Flow
Acoustic mirror
Flow
Acoustic mirror
TE-PositionTE-Position
Wake measurement10 mm downstreamof trailing edge.
Single hot-wire on traversing system.
Wake measurement10 mm downstreamof trailing edge.
Single hot-wire on traversing system.
Figure 9. Test set-up for noise and hot-wire measurements
American Institute of Aeronautics and Astronautics
6

Table 1: Turbulent boundary layer tripping on test airfoils
-006 NACA0012 NACA66Free transition (x/c) 0.45 0.85 First tripping position (x/c) 0.40 0.60 Second tripping position (x/c) 0.30 0.70 Third tripping position (x/c) 0.20 0.80
ince the noise source analysis focuses on trailing edge noise, first the presence of broadband trailing edge noise
wa
dence of noise levels on free stream velocity the measured broadband levels were normalized on
Ss proven for both airfoils in a free transition configuration without tripping. The chordwise source distribution
depicted in Figure 10 for the 5 kHz 1/3-octave band clearly shows a small peak at the leading edge of each airfoil (depicted only for the 60 m/s test case) and a significant peak located at the trailing edge with up to 5 – 7 dB higher sound pressure levels.
To check the depenthe basis of a velocity law corresponding to p2 ~ V5 as 1050 log ( / )norm meas refL L V V= − (8)
nd plotted versus a Strouhal number defined as a
mf lSr V∞= (9)
with the reference length l defined as l = 1 m. As
depe stream
for thr
icted in Figure 11 the normalized spectra for three different fre velocities collapse well for a wide Strouhal number range. Since the above stated results are in principle also valid for the NACA66-006 airfoil, the first objective - to generate pure trailing edge noise - was considered met and therefore the change of trailing edge noise due to different turbulent boundary layers was examined further.
As given in Table 1 the tests were conductedee different transition locations on each airfoil. As
the tripping device a 0.2 mm thick zig-zag tape was used. The presence of a transition zone right downstream of the tripping location was checked by means of a stethoscope as well as especially for the NACA66-006 airfoil the existence of a laminar
Figure 10. Chordwise noise source distribution of NACA0012 (left) and NACA66-006 airfoil (right) for the 5 kHz 1/3-octave band and three different free stream velocities.
X-Pos[mm]
1/3-
Oct
ave
Ban
dLe
vel[
dB]
-500 -400 -300 -200 -100 0 10060
65
70
75
80
85
V = 60 m/s - alpha = 0.0 deg - 5 kHz - 5.00[kHz]V = 50 m/s - alpha = 0.0 deg - 5 kHz - 5.00[kHz]V = 40 m/s - alpha = 0.0 deg - 5 kHz - 5.00[kHz]
X-Pos[mm]
1/3-
Oct
ave
Ban
dLe
vel[
dB]
-500 -400 -300 -200 -100 0 10060
65
70
75
80
85V = 60 m/s - alpha = 0.0 deg - 5.00[kHz]V = 50 m/s - alpha = 0.0 deg - 5.00[kHz]V = 40 m/s - alpha = 0.0 deg - 5.00[kHz]
Figure 11. Normalized 1/3-octave band spectra for NACA0012 airfoil
Sr = fm * 1 m / V∞
L norm
=L m
ess-5
0*lo
g 10*(
V∞/V
ref)
101 10270
75
80
85
90
V = 60 m/s - alpha = 0.0 degV = 50 m/s - alpha = 0.0 degV = 40 m/s - alpha = 0.0 deg
American Institute of Aeronautics and Astronautics
7
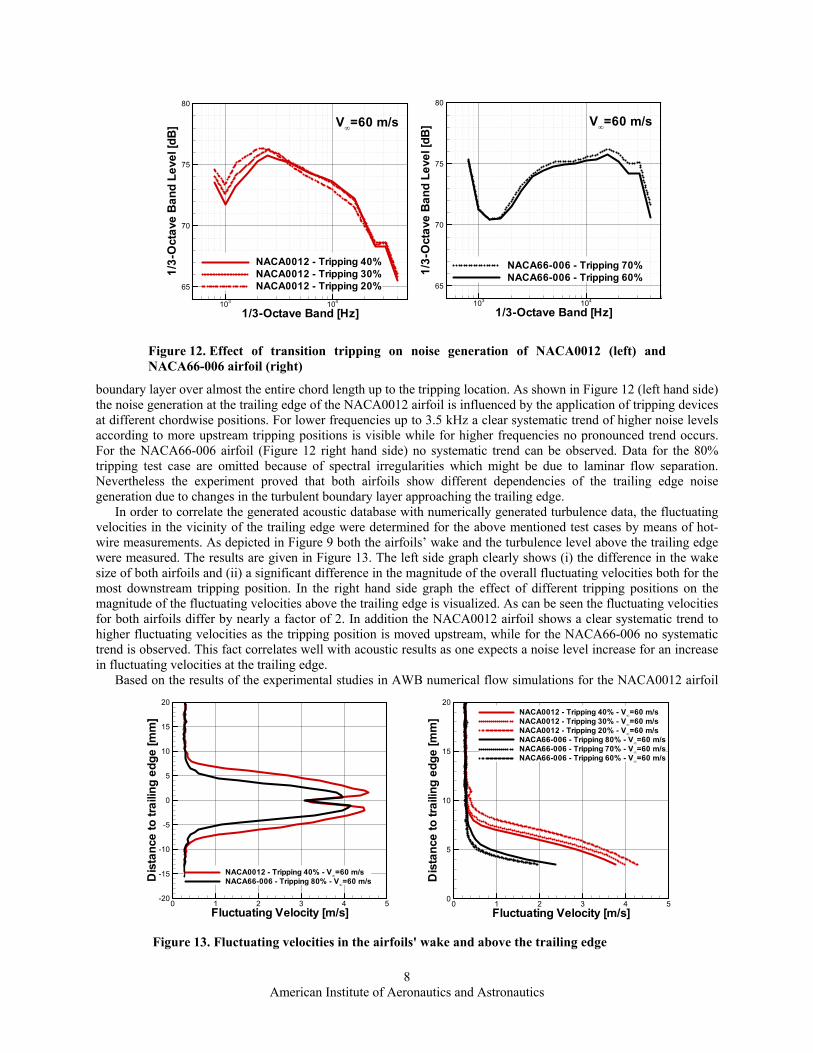
boundary layer over almost the entire chord length up to the tripping location. As shown in Figure 12 (left hand side) the noise generation at ng edge of the NACA0012 airfoil is influenced by the application of tripping devices at different chordwise positions. For lower frequencies up to 3.5 kHz a clear systematic trend of higher noise levels according to more upstream tripping positions is visible while for higher frequencies no pronounced trend occurs. For the NACA66-006 airfoil (Figure 12 right hand side) no systematic trend can ed. Data for the 80% tripping test case are omitted because of spectral irregularities which might be due to laminar flow separation. Nevertheless the experiment proved that both airfoils show different dependencies of the trailing edge noise generation due to changes in the turbulent boundary layer approaching the trailing edge.
In order to
the traili
be observ
correlate the generated acoustic database with numerically generated turbulence data, the fluctuating vel
n in Fig
tudies in AWB numerical flow simulations for the NACA0012 airfoil
ocities in the vicinity of the trailing edge were determined for the above mentioned test cases by means of hot-wire measurements. As depicted in Figure 9 both the airfoils’ wake and the turbulence level above the trailing edge were measured. The results are give ure 13. The left side graph clearly shows (i) the difference in the wake size of both airfoils and (ii) a significant difference in the magnitude of the overall fluctuating velocities both for the most downstream tripping position. In the right hand side graph the effect of different tripping positions on the magnitude of the fluctuating velocities above the trailing edge is visualized. As can be seen the fluctuating velocities for both airfoils differ by nearly a factor of 2. In addition the NACA0012 airfoil shows a clear systematic trend to higher fluctuating velocities as the tripping position is moved upstream, while for the NACA66-006 no systematic trend is observed. This fact correlates well with acoustic results as one expects a noise level increase for an increase in fluctuating velocities at the trailing edge.
Based on the results of the experimental s
Figure 12. Effect of transition tripping on noise generation of NACA0012 (left) and NACA66-006 airfoil (right)
1/3-Octave Band [Hz]
1/3-
Oct
ave
Ban
dLe
vel[
dB]
103 104
65
70
75
80
NACA0012 - Tripping 40%NACA0012 - Tripping 30%NACA0012 - Tripping 20%
V∞=60 m/s
1/3-Octave Band [Hz]
1/3-
Oct
ave
Ban
dLe
vel[
dB]
103 104
65
70
75
80
NACA66-006 - Tripping 70%NACA66-006 - Tripping 60%
V∞=60 m/s
Fluctuating Velocity [m/s]
Dis
tanc
eto
traili
nged
ge[m
m]
0 1 2 3 4 50
5
10
15
20NACA0012 - Tripping 40% - V∞=60 m/sNACA0012 - Tripping 30% - V∞=60 m/sNACA0012 - Tripping 20% - V∞=60 m/sNACA66-006 - Tripping 80% - V∞=60 m/sNACA66-006 - Tripping 70% - V∞=60 m/sNACA66-006 - Tripping 60% - V∞=60 m/s
Fluctuating Velocity [m/s]
Dis
tanc
eto
traili
nged
ge[m
m]
0 1 2 3 4 5-20
-15
-10
-5
0
5
10
15
20
NACA0012 - Tripping 40% - V∞=60 m/sNACA66-006 - Tripping 80% - V∞=60 m/s
Figure 13. Fluctuating velocities in the airfoils' wake and above the trailing edge
American Institute of Aeronautics and Astronautics
8
Mean Velocitiy [m/s]Y
[mm
]
0 0.05 0.1 0.15 0.2
0 0.05 0.1 0.15 0.2
-20
-15
-10
-5
0
5
10
15
20
ComputationMeasurementComputationMeasurement
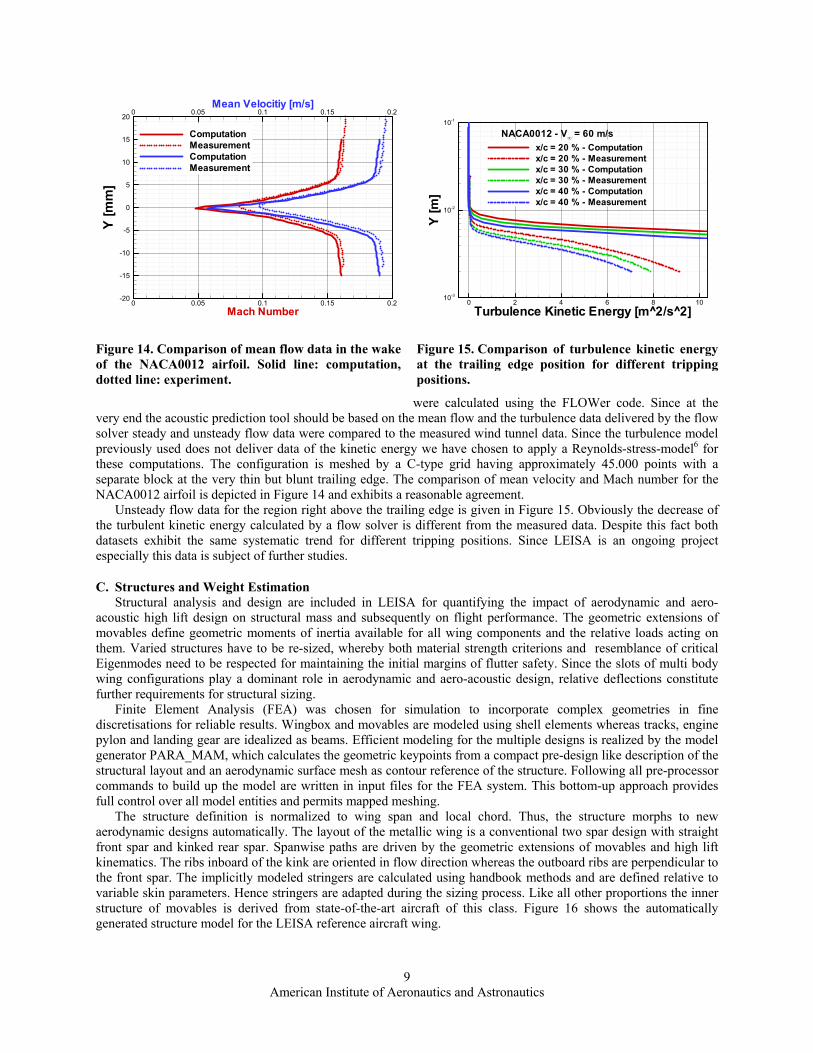
were calculated usi
at the trailing edge position for different tripping positions.
ng the FLOWer code. Since at the
re 15. Obviously the decrease of easured
Figure 15. Comparison of turbulence kinetic energy
Turbulence Kinetic Energy [m^2/s^2]0 2 4 6 8 1
10-3
Y[m
]
0
10-2
10-1
x/c = 20 % - Computationx/c = 20 % - Measurementx/c = 30 % - Computationx/c = 30 % - Measurementx/c = 40 % - Computationx/c = 40 % - Measurement
NACA0012 - V∞ = 60 m/s
Mach Number
Figure 14. Comparison of mean flow data in the wake of the NACA0012 airfoil. Solid line: computation, dotted line: experiment.
very end the acoustic prediction tool should be based on the mean flow and the turbulence data delivered by the flow solver steady and unsteady flow data were compared to the measured wind tunnel data. Since the turbulence model previously used does not deliver data of the kinetic energy we have chosen to apply a Reynolds-stress-model6 for these computations. The configuration is meshed by a C-type grid having approximately 45.000 points with a separate block at the very thin but blunt trailing edge. The comparison of mean velocity and Mach number for the NACA0012 airfoil is depicted in Figure 14 and exhibits a reasonable agreement.
Unsteady flow data for the regio t above the trailing edge is given in Figun righthe
C. Structures and Weight Estimation cluded in LEISA for quantifying the impact of aerodynamic and aero-
aco
chosen for simulation to incorporate complex geometries in fine dis
ocal chord. Thus, the structure morphs to new aer
turbulent kinetic energy calculated by a flow solver is different from the m data. Despite this fact both datasets exhibit the same systematic trend for different tripping positions. Since LEISA is an ongoing project especially this data is subject of further studies.
Structural analysis and design are inustic high lift design on structural mass and subsequently on flight performance. The geometric extensions of
movables define geometric moments of inertia available for all wing components and the relative loads acting on them. Varied structures have to be re-sized, whereby both material strength criterions and resemblance of critical Eigenmodes need to be respected for maintaining the initial margins of flutter safety. Since the slots of multi body wing configurations play a dominant role in aerodynamic and aero-acoustic design, relative deflections constitute further requirements for structural sizing.
Finite Element Analysis (FEA) wascretisations for reliable results. Wingbox and movables are modeled using shell elements whereas tracks, engine
pylon and landing gear are idealized as beams. Efficient modeling for the multiple designs is realized by the model generator PARA_MAM, which calculates the geometric keypoints from a compact pre-design like description of the structural layout and an aerodynamic surface mesh as contour reference of the structure. Following all pre-processor commands to build up the model are written in input files for the FEA system. This bottom-up approach provides full control over all model entities and permits mapped meshing.
The structure definition is normalized to wing span and lodynamic designs automatically. The layout of the metallic wing is a conventional two spar design with straight
front spar and kinked rear spar. Spanwise paths are driven by the geometric extensions of movables and high lift kinematics. The ribs inboard of the kink are oriented in flow direction whereas the outboard ribs are perpendicular to the front spar. The implicitly modeled stringers are calculated using handbook methods and are defined relative to variable skin parameters. Hence stringers are adapted during the sizing process. Like all other proportions the inner structure of movables is derived from state-of-the-art aircraft of this class. Figure 16 shows the automatically generated structure model for the LEISA reference aircraft wing.
American Institute of Aeronautics and Astronautics
9

An automated sizing process for PARA_MAM models is realized in the S_BOT macro11 for the commercial FEA software ANSYS. The model is analyzed for multiple loads, which remain constant during sizing, and is modified based on analyses results. Since elastic properties and subsequently load paths are varied, the procedure has to be of an iterative nature. Besides strength-critical conditions performance-relevant states and Eigenmodes are evaluated. The layered results of all elements and for all load cases are stored in matrices, which constitute the basis for the structural modification. Various strategies ranging from fully stressed design to structural tailoring are available, which are all based on comparison of stress/strain results with target values. Targets can be either fixed material limits or desired deflections. Frequencies of designated Eigenmodes are influenced by stiffness modification at places of maximum relative strain of the corresponding mode-shapes.
Calculating
Figure 16. Parametric FE Model with simplified nose and rear section for wingbox sizing
the best isotropic or anisotropic material properties is an over-determined problem which is solved usi
mass and high lift design, initial sizing in LEISA is limited to con
D. Flight Path and Fly-Over Altitude Calculation ISA project is based on the mass point motion equations.
Th
ng a weighted least-error-square approach. The weighting factors shift the resulting design between light weight and deformation targets and are well suited to be used as variables in superordinate mathematical optimization. The equations are solved for each element's individual layers, hence boundary conditions are necessary to meet requirements of manufacturability. This is realized by distribution functions for sizing variables over designated regions. The formulation of trial functions permits to filter the individual results and to limit the design space. An additional benefit from element independent distribution functions is the capability to map calculated physical properties to any discretisations and thus enables mesh refinement during the sizing process. Sizing and optimization strategies are objectives of present research at DLR.
To enable well interpretable sensivities between ventional strategies. In the first step the wingbox properties are determined. Leading and trailing section of the
wing are modeled simplified in these analyses to permit realistic loading based on CFD calculations, whereas in the second step the explicitly modeled complete high lift configuration is subjected to sizing. For the final aerodynamic designs advanced strategies will be used to assess the potential for limiting mass penalty of the new high lift devices using innovative structural technologies like tailored fiber placement or smart structures. In this stage the sizing process can be coupled with the DLR CFD solvers enabling very precise evaluation of static aero-elastic interactions.
The flight path calculation method used within the LEis method only needs trimmed polars as aerodynamic input. The flight path itself is calculated by the lift and drag
equations for take-off
( ) maxsinF D V
W gγ
−= − ( )sinH V γ= (10)
nd landing
a
sin( ) idle D
L
F CVg W C
γ + = − sin( )req D
L
F C VW C
γg
= + + (11)
order to account for the possibilities of reducing the noise exposure on the ground by appropriate climb and
approcedure
ges and
Inroach profiles different procedures are evaluated. Figure 17 shows a comparison of different departure
procedures and Figure 18 shows different approach p s in terms of flight path quantities, aircraft configuration chan the resulting differences in observed average noise levels. They include noise optimized
American Institute of Aeronautics and Astronautics
10

flight procedures reported by Koenig and Huemer9. These figures show that the choice of the flight procedure affects the observed noise level in a range of about 5dB(A) For the processing of the optimal flight path the aerodynamic perfomances evaluated in the aerodynmics work part are included into the flight simulation aircraft database for the LEISA reference aircraft. The different procedures are then evaluated based on fast time simulations. The obtained flight path data is directly fed into the noise exposure evaluation module described below.
Figure 17. Comparison of IATA / ICAO-A (black), Modified-ATA (blue) and Conventional-ATA (red) Departure Procedures
Figure 18. Comparison of Low-Drag-Low-Power Approach (red) and Continuous Descent / Steep Approach (blue) procedure
E. Noise Exposure Analysis grated design approach is the evaluation of the aircraft noise observed on the ground.
For
to the noise source database to account for
IV. Combined Aerodynamic and Aero-acoustic Wind Tunnel Testing At the beg g have been made
in
btained o
The last step within the inte this topic we use the SIMUL code developed by Isermann8. It is capable of calculating the level-time history of
the noise observed at a reference location based on a database for a specific aircraft containing airframe and engine noise levels and the flight path altitudes obtained from the above described flight path calculation module. From this baseline it computes complete noise footprints of single flights (Figure 19).
The changes due to the designs made in the LEISA project will be fed in the aero-acoustic behavior of the new configurations. With this methodology we will be able to investigate the
differences of footprints for the different configurations.
receiver location
simulated leve ry
Figure 19. Schematics of the output of the simulated time history at a receiver location and the computed noise footprint of an aircraft
l-time-histo
innin of this year initial combined aerodynamic and aero-acoustic wind tunnel testDNW’s low speed wind tunnel Braunschweig (DNW-NWB) with the 2D model in reference configuration
(Figure 20). The measurement took place in the closed 2.8m x 3.2m test section. The aerodynamic coefficients are o nly by integrating the pressure distribution measured in the mid section of the model. Rake measurements
American Institute of Aeronautics and Astronautics
11

for evaluating the drag have only been applied in a few cases, since the traverse mechanism of the rake has produced too much noise itself. The aero-acoustic noise source localization was carried out by means of an acoustic wall array equipped with 96 flush mounted microphones (Figure 20, left tunnel wall). By using the array measurement technique the significant acoustical drawback of a reve environment could be reduced but nevertheless it must be emphasized that this data is of more qualitative nature. A detailed description of the measurement and analysis technique described in 5,7,12,15,16.
In LEISA one objective is to conduct aerodynamic and aero-acoustic wind tunnel studies in a large Rey
rberating
ber regi
es of slat and flap setting modifications have been conducted. In the fra
is still an ongoing topic. Similar to t
same ang
nolds numme. The acoustic database gathered in AWB at Reynolds
numbers of about 0.8x10⁶ to 1.0x10⁶ will be enlarged by qualitative data acquired in DNW-NWB at higher Reynolds numbers of 1.2x10⁶ to 3x10⁶. Later in the project the aerodynamic data will also be acquired at even higher Reynolds
numbers up to 13x106 in DNW. Within the test campaign a large seri
Figure 20. 2D wind tunnel model of design wing section in DNW-NWB with acoustic wall array mounted on the left side
mework of this paper we put the focus on two configurations out of a large number of tested configurations that illustrate well the major objectives targeted within the LEISA project. This is (i) an aerodynamically optimized slat configuration (in the latter named “Optimized”) compared to the reference configuration (“3E-Reference”) and (ii) a comparison between a 3-element airfoil and a 2-element airfoil (“2E-Reference”).
The post-processing of the aerodynamic data and comparison to computed datahe correlation that has been applied for the matching of 2D and 3D data for the reference wing, it was found that
also for the nominally two-dimensional model at least the angle of attack has to be correlated between measurements and computations. Figure 21 illustrates this in a comparison of the computed pressure distribution with the measurements at the le of attack (left) and at different angles attack (right) correlated for a good match of the distributions. The reason for this effect can both be expected in the remaining three-dimensional effects of the flow around the wall-to-wall model and in the effect of the wind tunnel walls. Further investigations on this topic are in progress.
Figure 21. Comparison of computed and measured pressure distributions for the 2D reference wing section
x/cloc
c p
0 0.2 0.4 0.6 0.8 1
-10
-5
0
computation, α = 19 °experiiment, α = 19°
LEISA reference wing sectionM = 0.15
Re = 1.79x10⁶
slat
wing
flap
x/cloc
c p
0 0.2 0.4 0.6 0.8 1
-10
-5
0
computation, α = 19 °experiment, α = 23°
LEISA reference wing sectionM = 0.15
Re = 1.79x10⁶
slat
wing
flap
American Institute of Aeronautics and Astronautics
12
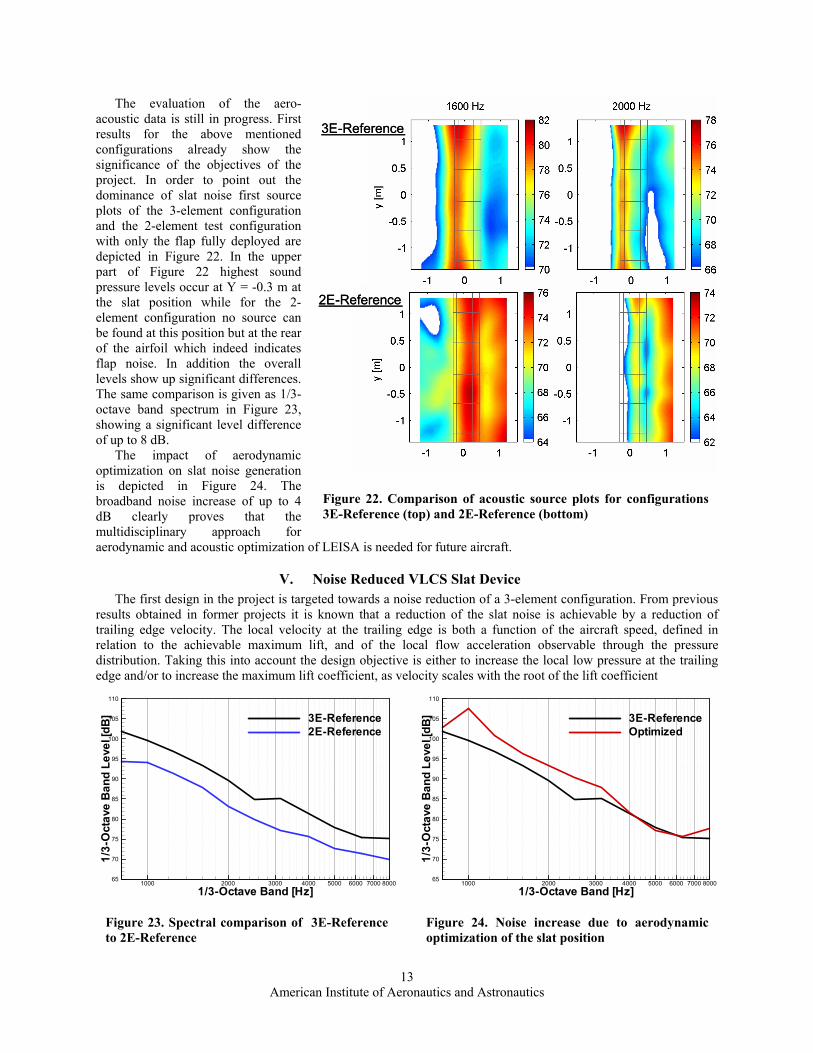
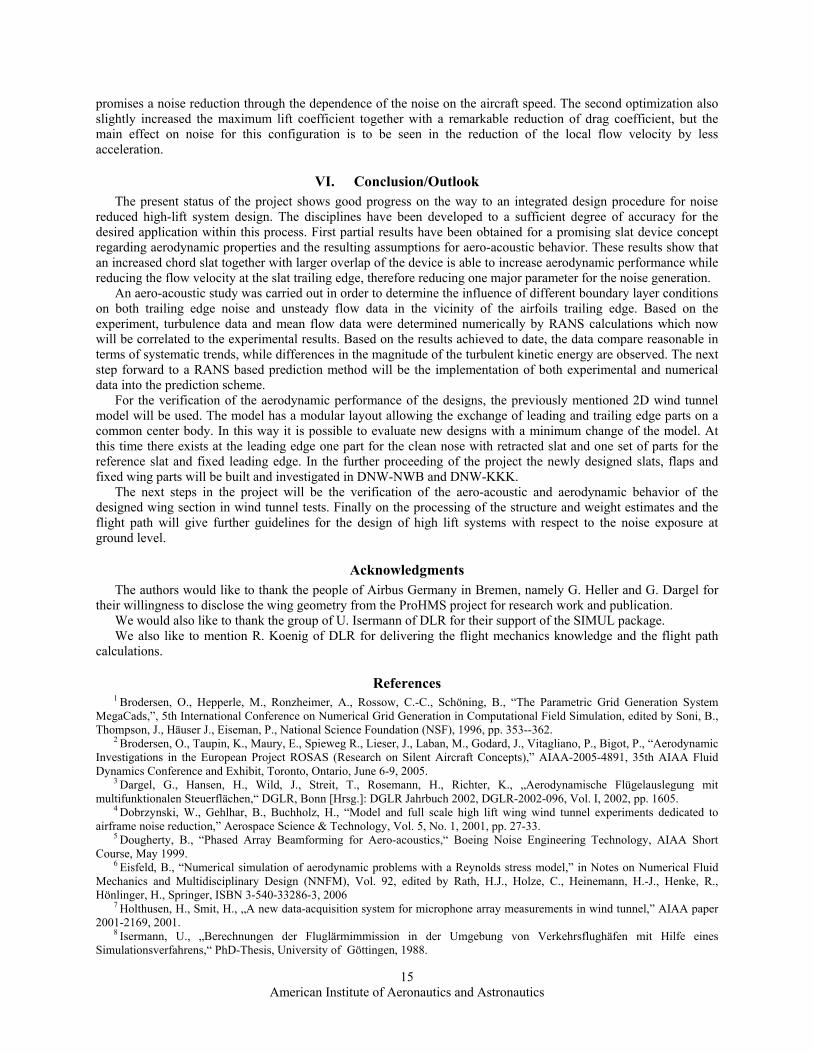
The evaluation of the aero-acoustic data is still in progress. First results for the above mentioned configurations already show the significance of the objectives of the project. In order to point out the dominance of slat noise first source plots of the 3-element configuration and the 2-element test configuration with only the flap fully deployed are depicted in . In the upper part of F highest sound pressure levels occur at Y = -0.3 m at the slat position while for the 2-element configuration no source can be found at this position but at the rear of the airfoil which indeed indicates flap noise. In addition the overall levels show up significant differences. The same comparison is given as 1/3-octave band spectrum in Figure 23,
a significant level difference of up to 8 dB.
Figure 22igure 22
showing
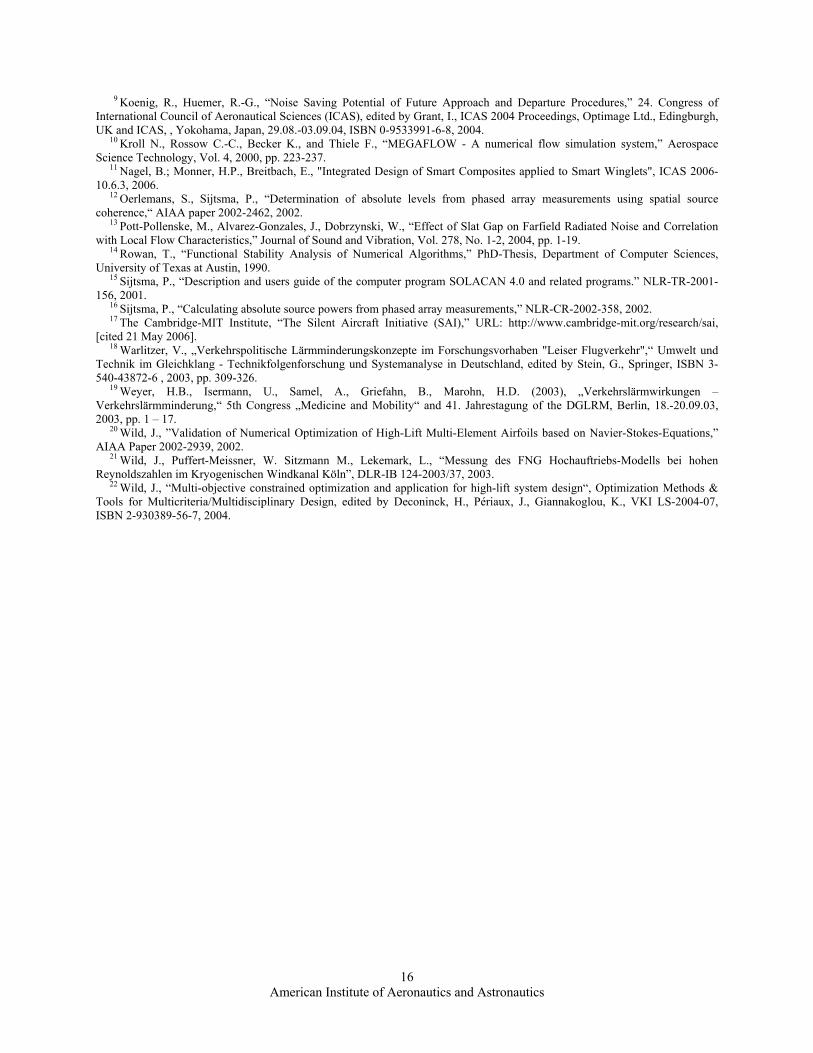
Figure 2
The impact of aerodynamic optimization on slat noise generation is depicted in 4. The broadband noise increase of up to 4 dB clearly proves that the multidisciplinary approach for aerodynamic and acoustic optimization of LEISA is needed for future aircraft.
V. Noise Reduced VLCS Slat Device The first design in the project is targeted towards a noise reduction of a 3-element configuration. From previous
results obtained in former projects it is known that a reduction of the slat noise is achievable by a reduction of trailing edge velocity. The local velocity at the trailing edge is both a function of the aircraft speed, defined in relation to the achievable maximum lift, and of the local flow acceleration observable through the pressure distribution. Taking this into account the design objective is either to increase the local low pressure at the trailing edge and/or to increase the maximum lift coefficient, as velocity scales with the root of the lift coefficient
Figure 22. Comparison of acoustic source plots for configurations 3E-Reference (top) and 2E-Reference (bottom)
2E2E--ReferenceReference
1/3-Octave Band [Hz]
1/3-
Oct
ave
Ban
dLe
vel[
dB]
1000 2000 3000 4000 5000 6000 7000 800065
70
75
80
85
90
95
100
105
110
3E-ReferenceOptimized
1/3-Octave Band [Hz]
1/3-
Oct
ave
Ban
dLe
vel[
dB]
1000 2000 3000 4000 5000 6000 7000 800065
70
75
80
85
90
95
100
105
110
3E-Reference2E-Reference
Figure 23. Spectral comparison of 3E-Reference to 2E-Reference
Figure 24. Noise increase due to aerodynamic optimization of the slat position
3E3E--ReferenceReference
American Institute of Aeronautics and Astronautics
13

,max1.23 /AP LV MLW C⋅∼ (12)
,max1.13 /TO LV MTOW C⋅∼ (13)
From the beginning it was obvious that the desired objective can only be reached by an increase of the slat chord length on the one hand and a positive overlap on the other. For this reason the slat was increased in advance to the maximum extent of 26.5% local wing chord, and called a very long chord slat (VLCS) device. The design parameters for the optimization were chosen to be the position and deflection angle of the slat, with the constraint on a positive overlap of at least 3% wing chord, and the shape of the fixed leading edge.
In a first optimization step the objective was to increase the lift coefficient over a wide range of angles of attack. In order to achieve this two design points were used. The first was the point for maximum lift coefficient and the second point was chosen at an angle of attack of 10α = ° . In a second optimization the design objective was changed to increase the lift to drag ratio at VTO of the initial configuration (corresponding to a ) while not reducing the maximum lift coefficient. F shows a comparison of the reference configuration and the results of these two optimization runs. On the left hand side the pressure distributions at maximum lift coefficient are shown. The result from the first optimization shows the main differences in the front suction region of the main wing, where the pressure is increased. A reduction of local flow acceleration at the slat trailing edge was not achieved, as the trailing edge pressures are nearly equal for the reference and the lift optimized VLCS device. The second design for maximum lift to drag ratio shows a clear pressure increase on the complete upper side of the high lift wing section. On the right hand side of F the aerodynamic coefficients are plotted for the complete calculated range of angles of attack of the reference configuration and for the design points of the optimized
3.227LC =igure 25
igure 25
configuration. From this it can be seen that the first optimization increases maximum lift by about 10%. This
CD
CL
0 0.02 0.04 0.06 0.08 0.1 0.1
2.5
3
3.5
4
4.5
conventional conf.optimized VLCS conf. (max. CL,max)optimized VLCS conf. (max. L/D)
x/c
cp
-0.2 0 0.2 0.4 0.6 0.8 1 1.2
-20
-15
-10
-5
0
5
10
conventional conf.optimized VLCS conf. (max. CL,max)optimized VLCS conf. (max. L/D)
FNG wing section η=0.42M3D,∞ = 0.18
Re3D,∞ = 6 Mio.CL = CL,max
Figure 25. Comparison of reference and optimized configurations for maximum lift coefficient and for maximum lift to drag ratio at take-off speed: (left) pressure distributions and geometries; (right) aerodynamic coefficients at the design points
American Institute of Aeronautics and Astronautics
14
promises a noise reduction through the dependence of the noise on the aircraft speed. The second optimization also slightly increased the maximum lift coefficient together with a remarkable reduction of drag coefficient, but the main effect on noise for this configuration is to be seen in the reduction of the local flow velocity by less acceleration.
VI. Conclusion/Outlook The present status of the project shows goo o an integrated design procedure for noise
red
on
dynamic performance of the designs, the previously mentioned 2D wind tunnel mo
and aerodynamic behavior of the des
Acknowledgments The authors would like to thank the people Bremen, namely G. Heller and G. Dargel for
the
ght path cal
References 1 Brodersen, O., Hepperle, M., Ronzheimer, A., Rossow, C.-C., Schöning, B., “The Parametric Grid Generation System
Me
., Bigot, P., “Aerodynamic Inv
., Richter, K., „Aerodynamische Flügelauslegung mit mu
ated to airf
ineering Technology, AIAA Short Co
merical simulation of aerodynamic problems with a Reynolds stress model,” in Notes on Numerical Fluid Me
system for microphone array measurements in wind tunnel,” AIAA paper 200
, „Berechnungen der Fluglärmimmission in der Umgebung von Verkehrsflughäfen mit Hilfe eines Simulationsverfahrens,“ PhD-Thesis, University of Göttingen, 1988.
d progress on the way tuced high-lift system design. The disciplines have been developed to a sufficient degree of accuracy for the
desired application within this process. First partial results have been obtained for a promising slat device concept regarding aerodynamic properties and the resulting assumptions for aero-acoustic behavior. These results show that an increased chord slat together with larger overlap of the device is able to increase aerodynamic performance while reducing the flow velocity at the slat trailing edge, therefore reducing one major parameter for the noise generation.
An aero-acoustic study was carried out in order to determine the influence of different boundary layer conditionsboth trailing edge noise and unsteady flow data in the vicinity of the airfoils trailing edge. Based on the
experiment, turbulence data and mean flow data were determined numerically by RANS calculations which now will be correlated to the experimental results. Based on the results achieved to date, the data compare reasonable in terms of systematic trends, while differences in the magnitude of the turbulent kinetic energy are observed. The next step forward to a RANS based prediction method will be the implementation of both experimental and numerical data into the prediction scheme.
For the verification of the aerodel will be used. The model has a modular layout allowing the exchange of leading and trailing edge parts on a
common center body. In this way it is possible to evaluate new designs with a minimum change of the model. At this time there exists at the leading edge one part for the clean nose with retracted slat and one set of parts for the reference slat and fixed leading edge. In the further proceeding of the project the newly designed slats, flaps and fixed wing parts will be built and investigated in DNW-NWB and DNW-KKK.
The next steps in the project will be the verification of the aero-acousticigned wing section in wind tunnel tests. Finally on the processing of the structure and weight estimates and the
flight path will give further guidelines for the design of high lift systems with respect to the noise exposure at ground level.
of Airbus Germany inir willingness to disclose the wing geometry from the ProHMS project for research work and publication. We would also like to thank the group of U. Isermann of DLR for their support of the SIMUL package. We also like to mention R. Koenig of DLR for delivering the flight mechanics knowledge and the fli
culations.
gaCads,”, 5th International Conference on Numerical Grid Generation in Computational Field Simulation, edited by Soni, B., Thompson, J., Häuser J., Eiseman, P., National Science Foundation (NSF), 1996, pp. 353--362.
2 Brodersen, O., Taupin, K., Maury, E., Spieweg R., Lieser, J., Laban, M., Godard, J., Vitagliano, Pestigations in the European Project ROSAS (Research on Silent Aircraft Concepts),” AIAA-2005-4891, 35th AIAA Fluid
Dynamics Conference and Exhibit, Toronto, Ontario, June 6-9, 2005. 3 Dargel, G., Hansen, H., Wild, J., Streit, T., Rosemann, Hltifunktionalen Steuerflächen,“ DGLR, Bonn [Hrsg.]: DGLR Jahrbuch 2002, DGLR-2002-096, Vol. I, 2002, pp. 1605. 4 Dobrzynski, W., Gehlhar, B., Buchholz, H., “Model and full scale high lift wing wind tunnel experiments dedicrame noise reduction,” Aerospace Science & Technology, Vol. 5, No. 1, 2001, pp. 27-33. 5 Dougherty, B., “Phased Array Beamforming for Aero-acoustics,“ Boeing Noise Eng
urse, May 1999. 6 Eisfeld, B., “Nuchanics and Multidisciplinary Design (NNFM), Vol. 92, edited by Rath, H.J., Holze, C., Heinemann, H.-J., Henke, R.,
Hönlinger, H., Springer, ISBN 3-540-33286-3, 2006 7 Holthusen, H., Smit, H., „A new data-acquisition1-2169, 2001. 8 Isermann, U.
American Institute of Aeronautics and Astronautics
15
9 Koenig, R., Huemer, R.-G., “Noise Saving Potential of Future Approach and Departure Procedures,” 24. Congress of International Council of Aeronautical Sciences (ICAS), edited by Grant, I., ICAS 2004 Proceedings, Optimage Ltd., Edingburgh, UK
IAA paper 2002-2462, 2002.
Sound and Vibration, Vol. 278, No. 1-2, 2004, pp. 1-19.
ambridge-MIT Institute, “The Silent Aircraft Initiative (SAI),” URL: http://www.cambridge-mit.org/research/sai, [c
ng - Technikfolgenforschung und Systemanalyse in Deutschland, edited by Stein, G., Springer, ISBN 3-54
gress „Medicine and Mobility“ and 41. Jahrestagung of the DGLRM, Berlin, 18.-20.09.03, 20
-2939, 2002.
en Windkanal Köln”, DLR-IB 124-2003/37, 2003.
x, J., Giannakoglou, K., VKI LS-2004-07, IS
and ICAS, , Yokohama, Japan, 29.08.-03.09.04, ISBN 0-9533991-6-8, 2004. 10 Kroll N., Rossow C.-C., Becker K., and Thiele F., “MEGAFLOW - A numerical flow simulation system,” Aerospace
Science Technology, Vol. 4, 2000, pp. 223-237. 11 Nagel, B.; Monner, H.P., Breitbach, E., "Integrated Design of Smart Composites applied to Smart Winglets", ICAS 2006-
10.6.3, 2006. 12 Oerlemans, S., Sijtsma, P., “Determination of absolute levels from phased array measurements using spatial source
coherence,“ A13 Pott-Pollenske, M., Alvarez-Gonzales, J., Dobrzynski, W., “Effect of Slat Gap on Farfield Radiated Noise and Correlation
with Local Flow Characteristics,” Journal of14 Rowan, T., “Functional Stability Analysis of Numerical Algorithms,” PhD-Thesis, Department of Computer Sciences,
University of Texas at Austin, 1990. 15 Sijtsma, P., “Description and users guide of the computer program SOLACAN 4.0 and related programs.” NLR-TR-2001-
156, 2001. 16 Sijtsma, P., “Calculating absolute source powers from phased array measurements,” NLR-CR-2002-358, 2002. 17 The C
ited 21 May 2006]. 18 Warlitzer, V., „Verkehrspolitische Lärmminderungskonzepte im Forschungsvorhaben "Leiser Flugverkehr",“ Umwelt und
Technik im Gleichkla0-43872-6 , 2003, pp. 309-326. 19 Weyer, H.B., Isermann, U., Samel, A., Griefahn, B., Marohn, H.D. (2003), „Verkehrslärmwirkungen –
Verkehrslärmminderung,“ 5th Con03, pp. 1 – 17. 20 Wild, J., ”Validation of Numerical Optimization of High-Lift Multi-Element Airfoils based on Navier-Stokes-Equations,”
AIAA Paper 200221 Wild, J., Puffert-Meissner, W. Sitzmann M., Lekemark, L., “Messung des FNG Hochauftriebs-Modells bei hohen
Reynoldszahlen im Kryogenisch22 Wild, J., “Multi-objective constrained optimization and application for high-lift system design“, Optimization Methods &
Tools for Multicriteria/Multidisciplinary Design, edited by Deconinck, H., PériauBN 2-930389-56-7, 2004.
American Institute of Aeronautics and Astronautics
16