Embed Size (px)
Citation preview

Helsingin seudun liikenne -kuntayhtymä
An integrated approach to develop the transport system of Metropolitan Helsinki
Suvi Rihtniemi 22.5.2013
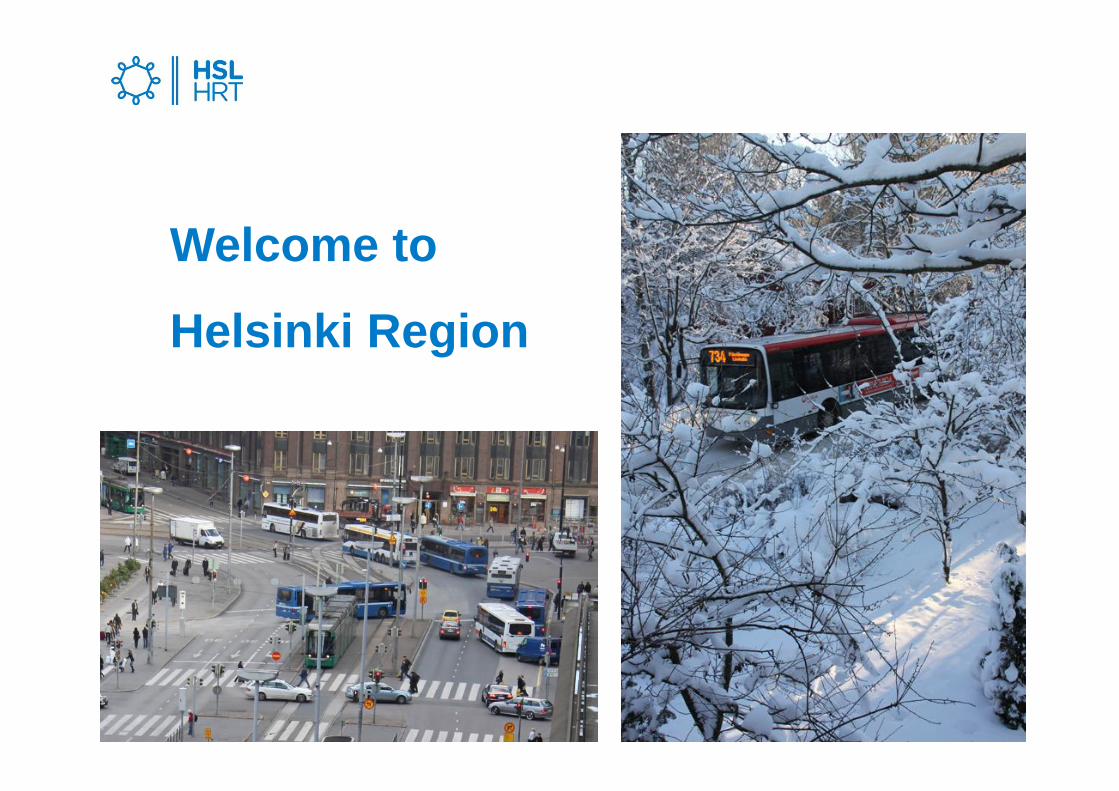
Welcome to
Helsinki Region

Contents of the presentation
1. On HSL in general2. Transport System
Planning in the Helsinki Region (HLJ 2011)
3. PT and HSL´s environmental goals
4. Journey Planner

1. On HSL in general

The location of the Helsinki Region in Europe
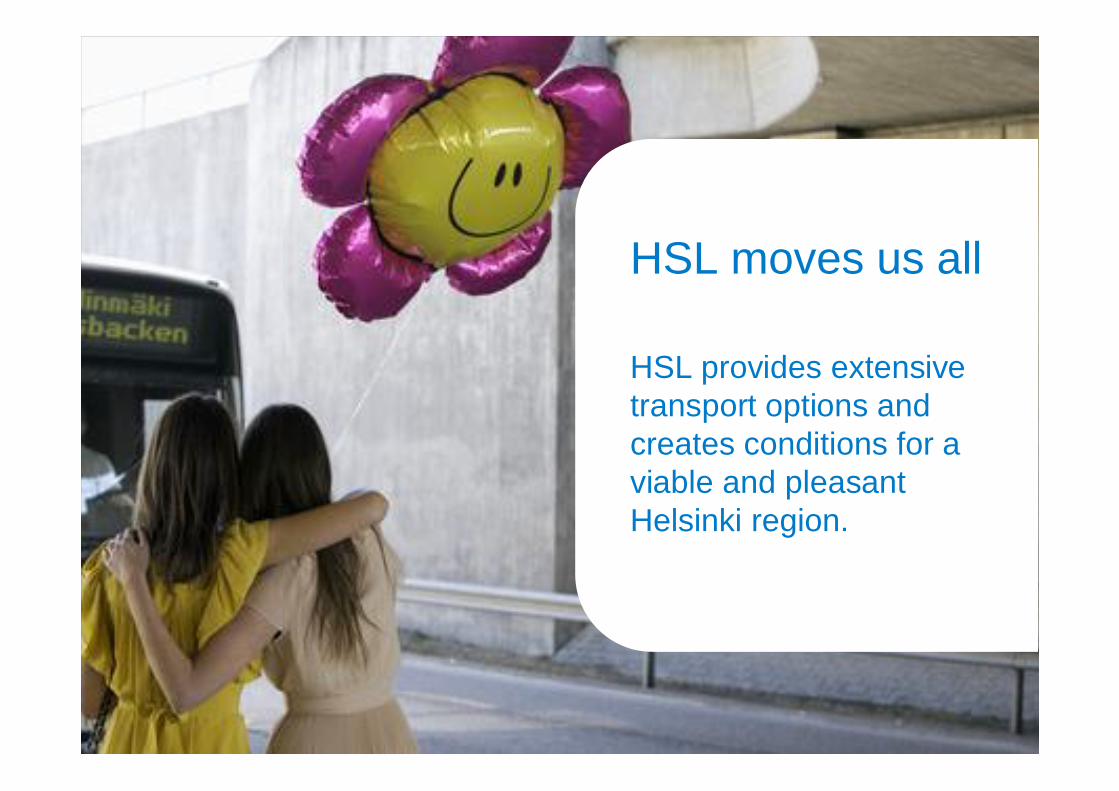
HSL provides extensive transport options and creates conditions for a viable and pleasant Helsinki region.
HSL moves us all

What does HSL do?
• Is responsible for the preparation of the Helsinki Region Transport System Plan (HLJ).
• Plans and organizes public transport in the region and works to improve its operating conditions.
• Procures bus, tram, Metro, ferry and commuter train services.
• Approves the public transport fare and ticketing system as well as public transport fares.
• Is responsible for public transport marketing and passenger information.
• Organizes ticket sales and is responsible for ticket inspection.

6 founding municipalities:Helsinki, Espoo, Kauniainen,Vantaa, Kerava andKirkkonummi.
Sipoo from the beginning of 2012.
According to its charter, HSL may expand to cover all 14 municipalities in the Helsinki region.
Cooperation area and expansion of HSL

HSL’s operating income 2013Ticket
revenue
Helsinki internal 23.2 %
Regional tickets17.8 %
Espoo internal 2.5 %Vantaa internal 1.8 %
Extended regional tickets 1.8 %Kirkkonummi internal 0.1 %Kerava-Sipoo internal 0.1 %Kauniainen internal 0.02 %
Municipal contributions
49.6 %
Ticket revenue47.4 %
Government subsidies for public transport 1.0 %Other income 2.0 %
Total EUR 588,0 million
Metropol 0.1 %

HSL’s operating expenses 2013
Operating costs79.5 %
Infra services 11.8 %
Other purchases of services 4.4 %
Personnel expenses 2.9 %
Rents 0.7 %
Bus services53.8 %
Train services11.9 %
Metro services 4.2 %
Ferry services 0.7 %
Other expenses 0.7 %
Tram services8.5 %
Total EUR 586,5 million
Operating costs
Metropol 0.3 %
2. Transport System Planning in the Helsinki Region

HSL:s strategy
1. Helsinki region has a well-functioning transport system
2. HSL provides its customers with high-quality, cost-efficient and reasonable priced public transport services
3. HSL promotes low-emission transport choices
4. HSL in an player on the field of transport policy
5. HSL’s operations support its owner munisipalities’ and region’s development targets
6. HSL has motivated and competent staff
Helsinki region has the most efficient transport system and the most satisfied users of public transport in Europe
Target 2018 Strategic goals
HSL provides extensive transport options and createsconditions for a viable and pleasant Helsinki region.
Basic task
Stakeholder expectations
Customers
Business and industry
Operators
Civic organizations
State administration
Owner municipalities
22.5.2013Suvi Rihtniemi

The role of the Helsinki Region Transport System Plan (HLJ)
• A long-term strategic plan that considers the transport system as a whole.
• Aligns regional transport policy and guidelines primary measures for the development of the transport system.
• An important part of the land use, housing and transport (MAL) co-operation of the 14 municipalities of the Helsinki region and an important part of the letter of intent on land use, housing and transport.
• The next transport system plan (HLJ 2015) is prepared in close cooperation with the common regional land use plan.

HSL area and HLJ planning area
Municipalities of the Keski-Uusimaa Region (KUUMA)
Cities of the Helsinki Metropolitan Area
HSL Region 1.1.2012
Helsinki metropolitan area municipalities:Surface area: 770 km2 (21%)Population: 1,034 milj. (77%)
Land area approximately 3 700 km2
Population 1.3 million

Points of emphasis in Helsinki Region Transport System Plan (HLJ 2011)
• Performance of the transport system• Integration of land use and transport• Combating climate change

The transport system is developed by implementing a diverse range of measures set out at different development levels through cooperation between the parties.
Operation and maintenance of the transport system
Sustainable urban structure and land use
Public transport, walking and cycling connections and services
Mobility management, pricing and regulations
Transport infrastructure

Infrastructural development projects to be launched in the first period (2011-2020), in the order of priority (HLJ 2011)
1. Small and cost efficient infrastructural projects in the metropolitan area (KUHA)
• Infrastructure for walking and cycling
• Infrastructure for intelligent transport systems
• Park and ride connections• Securing the functionality of public
transport and freight transport on radial roads
• Improving traffic safety of the arterial network
• Noise abatement projects• Freight transport service areas• Road projects that support the
development of land use• Improving crosstown connections
of the road and street network• Small development projects of the
rail traffic
8. Klaukkala bypass6. Increasing the capacity of the
Pasila Riihimäki rail connection
9. Hyrylä eastern bypass
5. Improving Ring Road III (E18), phase 2
2. Arrangements needed for Jokeri 2 bus route
3. Removing the bottlenecks on Ring Road I
10. Pisara Rail Loop
7. City rail linkLeppävaara Espoo
4. Feeder servicesfor the West Metro and the Ring Railway Line
12. Jokeri light rail link
11. Extension of the metro to the west and east- Metro Matinkylä Kivenlahti- Metro Mellunmäki Majvik
13. Rail connection to Laajasalo
The KUHA projects necessitate closer programming and prioritization through regional cooperation

Rail traffic development projectsOngoing project Launch in 2011-2020Launch in 2021-2035
Ring Railway Line
Raising the capacity of thePasila Riihimäki rail connection
Airport Rail Link
City Rail LinkLeppävaara Espoo
Kerava-Nikkilä Rail Link
Espoo-Hista Rail Link Metro Mellunmäki Majvik
Jokeri light rail link
Pisara Rail LoopScience tram lineMetro Ruoholahti Matinkylä
Metro Matinkylä KivenlahtiRail connection to Laajasalo

HLJ-development-strategy
HLJ 2015 -draft
Helsinki Region
Transport Plan
HLJ 2015
Clarification of sidestrategies
THLJ-strategical-study
Preliminary estimations for land use for HLJ-process
Helsinki Region
Land usePlan
Knowledge baseand results forHLJ-draft preparations
Active co-operationand interaction
Land use planning -process
HLJ 2015 -process
Evaluation of the impacts SOVA
MAL-intention2016-2019
Vision forHelsinkiRegion
MAL 2050-strategy
MAL 2020Implemantationprogram
Limitedless Metropol
Vision for KUUMA-municipalities
Land use StructurePlan
InhabitantsHousing
IndustriesServices
Nature and Green Areas
MAL-co-operationSustainable mobility
Mobility guidance and controlOperational work and
MaintananceRoad traffic solutions
Draft of the plan
Further studies
and regional consolidation
MAL-HLJ-interaction
HLJ 2011+ continuation,MAL-work and otherstartingpoints

3. PT and HSL´s environmental goals

HSL:s strategy
1. Helsinki region has a well-functioning transport system
2. HSL provides its customers with high-quality, cost-efficient and reasonable priced public transport services
3. HSL promotes low-emission transport choices
4. HSL in an player on the field of transport policy
5. HSL’s operations support its owner munisipalities’ and region’s development targets
6. HSL has motivated and competent staff
Helsinki region has the most efficient transport system and the most satisfied users of public transport in Europe
Target 2018 Strategic goals
HSL provides extensive transport options and createsconditions for a viable and pleasant Helsinki region.
Basic task
Stakeholder expectations
Customers
Business and industry
Operators
Civic organizations
State administration
Owner municipalities
22.5.2013Suvi Rihtniemi

Public transport as part of the transport systemThe high market share of public transport is important• Train service• Metro• Tram
locally emission-free
• Bus serviceWorks mainly with diesel fuelAbout 1400 buses, 50 CNG
• Half of public transport trips are made by bus
22.5.2013Suvi Rihtniemi

Development of PTJourneys made by the metropolitan area residents by car and public transport in the metropolitan area.

Development of PTThe share of public transport of the motor vehicle journeys made by the metropolitan area residents within the metropolitan area.

Change in the number of boardings 2011-2012
FS 2012
Buses
Metro
Trams
Commuter trains
Ferry
Total
2011
172.5
61.5
53.7
46.6
1.7
335.9
176.7
62.2
57.2
47.2
1.6
344.9
Change
4.2
0.7
3.5
0.6
-0.1
8.9
Change%
2.4 %
1.2 %
6.6 %
1.3 %
-2.1 %
2.7 %
Million boardings

Number of vehicles 2012
Buses
Metro trains units
Trams
Commuter train units
Ferries
1.345
54
132
106
4
Total 1 641

Overall grade to HSL’s public transport services by mode of transport 2011-2012
A total of 81.7 % of passengers gave public transport services either a good or a very good overall grade (4 and 5).
Only less than 2.0 % of passengers gave a poor or very poor overall grade (1 and 2).

HSL:s strategy
1. Helsinki region has a well-functioning transport system
2. HSL provides its customers with high-quality, cost-efficient and reasonable priced public transport services
3. HSL promotes low-emission transport choices
4. HSL in an player on the field of transport policy
5. HSL’s operations support its owner munisipalities’ and region’s development targets
6. HSL has motivated and competent staff
Helsinki region has the most efficient transport system and the most satisfied users of public transport in Europe
Target 2018 Strategic goals
HSL provides extensive transport options and createsconditions for a viable and pleasant Helsinki region.
Basic task
Stakeholder expectations
Customers
Business and industry
Operators
Civic organizations
State administration
Owner municipalities
22.5.2013Suvi Rihtniemi

22.5.2013
HSL's strategy for 2018 - a low-emission transport
• The environmentally-friendly transport system is promoted in accordance with the HLJ (2011)
• Public transport frame is built upon railWest metro (Länsimetro) and Circle line (Kehärata) havebeen introducedPisara Rail Loop, Jokeri light rail linkRegional lines are changed to feeder
• Public transport emissions have decreased NOx -emissions - 80%particle emissions - 80%CO2 -emissions -50%
Suvi Rihtniemi

Ten years co-operation with VTT
• RAKEBUS
• RASTU
• TRANSECOHDENIQ
• TRANSSMART
22.5.2013Suvi Rihtniemi
22.5.2013
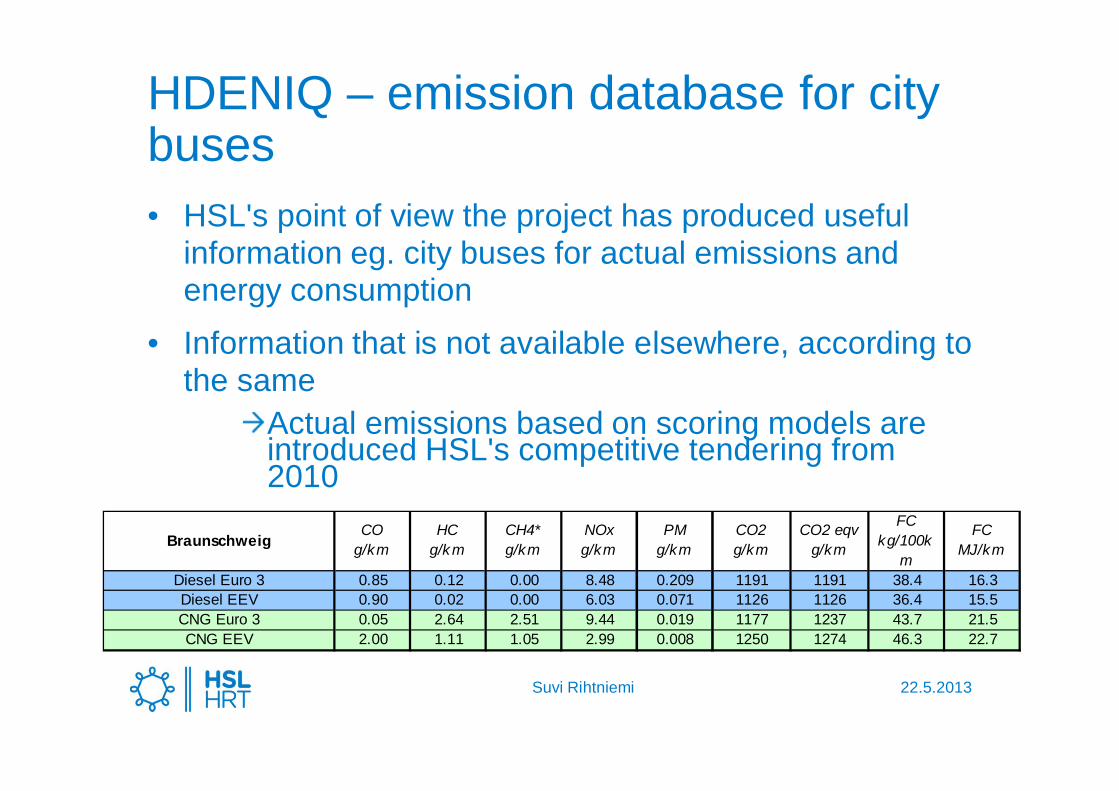
HDENIQ – emission database for city buses • HSL's point of view the project has produced useful
information eg. city buses for actual emissions and energy consumption
• Information that is not available elsewhere, according to the same
Actual emissions based on scoring models are introduced HSL's competitive tendering from 2010
BraunschweigCO
g/kmHC
g/kmCH4*g/km
NOxg/km
PMg/km
CO2g/km
CO2 eqvg/km
FCkg/100k
m
FCMJ/km
Diesel Euro 3 0.85 0.12 0.00 8.48 0.209 1191 1191 38.4 16.3Diesel EEV 0.90 0.02 0.00 6.03 0.071 1126 1126 36.4 15.5CNG Euro 3 0.05 2.64 2.51 9.44 0.019 1177 1237 43.7 21.5CNG EEV 2.00 1.11 1.05 2.99 0.008 1250 1274 46.3 22.7
Suvi Rihtniemi

HSL follows new technology options
Biogas
Hybrid technology
Etanol
Paraffinic renewable diesel
22.5.2013Suvi Rihtniemi

New projects with VTT
• eBus4 years projectTesting 5-6 full electric busesWhat winter cause electric buses
• eChargeHow and where to chargeHow often chargeWhat kind of infrastructure
22.5.2013Suvi Rihtniemi

4. Journey Planner,emission calculator

Reittiopas.fi

Journey Planner functions
• Route search• My stops• Timetables (by stop and transport mode) • Line map• Disruption info• Cycling and walking guide
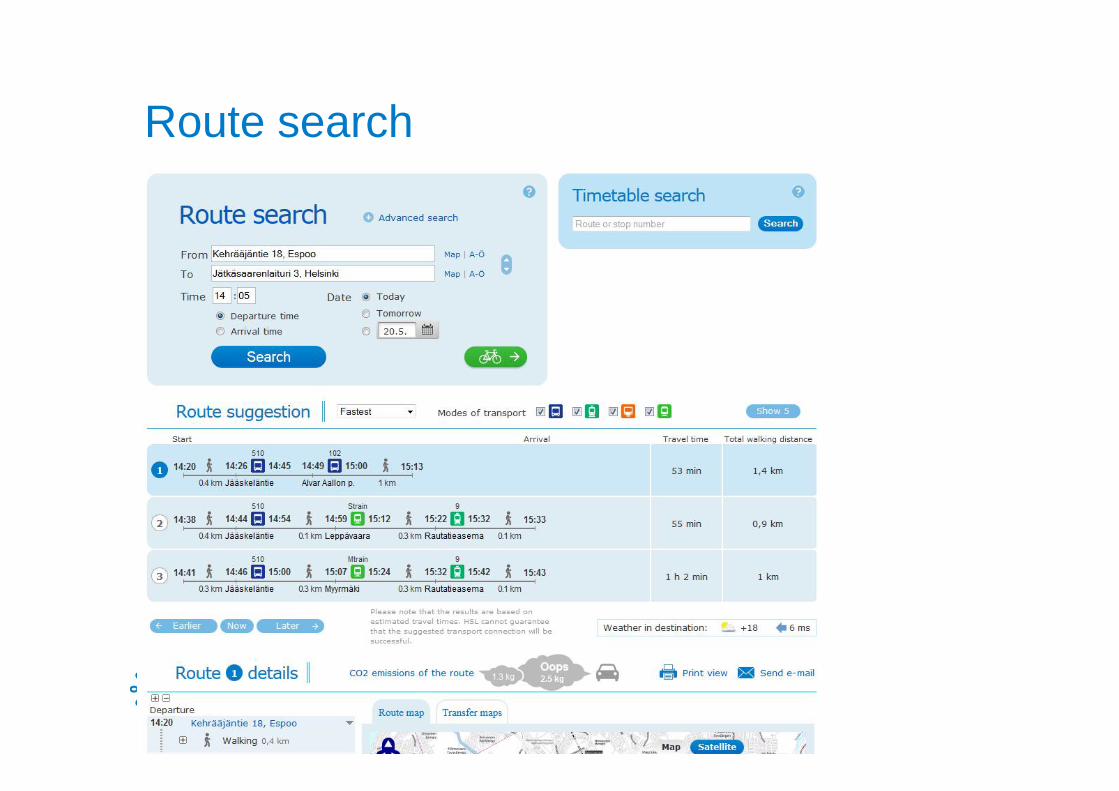
Route search

Emissions

Pyöräily- ja kävelyreitit pk.hsl.fi

Thank youfor your
attention!
www.hsl.fi