Embed Size (px)
Citation preview
Journal of Emerging Trends in Engineering and Applied Sciences (JETEAS) 4(1):38-45 (ISSN: 2141-7016)
38
An Innovative Mass Haul Diagram
Development for HighwayEarthwork
I. Akiije
Department of Civil and Environmental Engineering, University of Lagos, Lagos, Nigeria.
___________________________________________________________________________ Abstract This paper is on an innovative mass haul diagram development for highway earthwork in an electronics office via a general purpose application program approach as compared to tedious conventional hand methodology or using costly specific purpose application programs. The methodology makes use of Microsoft Excel spreadsheet as a tool to develop a graphical representation of mass haul diagram of a portion of road accurately. It showcased an efficient and effective interactive user friendly methodology via Information and Communication Technology. There by providing the most needed convenient means of studying haul, overhaul and for computing payment of a highway earthwork project. Iterations involving the computation of earthwork volume by average end-area method were done speedily and at easy in spite of a large number of design alternatives carried out at regular interval along the alignment. With consideration for shrinkage factor, stations mass ordinates were computed and its diagram generated easily and successfully while using the spreadsheet. Validation of the new methodology established in this study was justified by comparing the newly developed mass haul diagram with an existing one of conventional hand approach and specific purpose application programs. The mass haul diagram generated using Microsoft Excel showed similarly and in very good agreement with the static conventional hand diagram but with higher dynamism and incomparable flexibility. The new methodological procedure established in this paper significantly gave way to substantial saving in times of cost, time together with personnel in the course of the analysis and design of mass haul diagram for a highway or railway earthwork project. This study is justified for the methodology introduced here would increase the productivity of the highway engineers and scholars of the third world in particular and on the internet in general. __________________________________________________________________________________________ Keywords: technology, iteration, computation, speedily, excel-spreadsheet. _________________________________________________________________________________________ INTRODUCTION Mass haul diagram refers to a graphical representation of the cumulative amount of earthwork moved along the centreline with distances by cut and embankment that involved in a road project and the manner in which the earth and materials are to be moved (Wright, 2003 and NDDOT, 2011). A mass haul diagram is of great value both in earthwork planning, design and construction of railways and arterial roads. The movement of the excavated soil material from its original position to its final location in the roadwork or other disposal area is known as haul. Mass haul diagram is usually used to calculate the average haul, free haul between two given balance points and also the average or free haul for the entire project area. Mass haul diagram is also useful as a source of information to the contractor about which way the earthwork is to be moved. Earthwork for railway and highway involves excavation and movement of a portion of the earth's surface from one location to another. Earthwork in a new position is an embankment being formed and created into a desired shape and physical grade formation or disposed of as spoil. Excavation of earth
material is the removal of the layer of soil immediately under the topsoil and on top of rock for grade formation. Earth material is usually used to construct embankments and foundations and can be easily moved with scrapers or other types of earthmoving equipment for grade formation. Excavation of topsoil is the removal of the exposed layer of the earth's surface, including vegetation. Rock excavation is the removal of a formation that cannot be excavated without drilling and blasting. Muck excavation is the removal of material that contains an excessive amount of water and undesirable soil. Unclassified excavation is the removal of any combination of topsoil, earth, rock, and muck. Embankment of earth material is the addition of the layer of soil immediately under the topsoil or on top of rock for grade formation. Earthwork involving excavation movement and embankment of soil occurs within the cross sections of an existing or proposed road thereby defining the amount of cut and fill at each station. Each point along the existing or proposed road horizontally is usually identified by
Journal of Emerging Trends in Engineering and Applied Sciences (JETEAS) 4(1): 38-45 © Scholarlink Research Institute Journals, 2013 (ISSN: 2141-7016) jeteas.scholarlinkresearch.org
Journal of Emerging Trends in Engineering and Applied Sciences (JETEAS) 4(1):38-45 (ISSN: 2141-7016)
39
station having the distance in metres at regular interval from a reference point usually the beginning of the road project. The location of each station point in the vertical plane is given as the elevation above mean sea level or datum and it is usually called reduced level. The description of a roadway cross section is its dimension at right angle to the dimension at right angle to the direction of the horizontal alignment including the road width and other abutments. Excavation and embankment are usually calculated with cross section using the average end area method in mass haul diagram development. Planimeter and slide rule were usually used in the past with hand methodology during the calculation of mass haul diagram along with using Simpson's rule or Trapezoidal rule. Presently, haul diagram can be performed with a computer and specialised software within the area of Information and Communication Technology (ICT) for development. This study investigated the development of a mass Haul Diagram using spreadsheet with consideration to earthwork calculation based on a right prism whose volume is equal to the average end area multiplied by the length that is equal to the distance between end sections. Heeks (2006) claimed that governments, enterprises and civil actors around the world are attempting to realize the benefits of information and communication technology for economic, social, and political development while scholars are still struggling to come up with a coherent conceptual framework that embraces all relevant aspects of this multidisciplinary endeavour. The use of ICT for development in the world has increased drastically over the decades for the replacement of conventional hand approach but conceptual model at cheaper rate for use concretely is still wanting on the international, national or local level and (Akiije, 2007). Hilbert (2011) however, challenged the academic communities in search for ever more coherent and useful models that assist in designing meaningful and effective ICT for development strategies. This paper is considering an innovative mass haul diagram development that is meaningful and effective for a cheaper planning and design methodology for highway earthwork calculation via ICT for development (Adedimila and Akiije, 2007; Akiije, 2011). The aim of this study is to develop a mass haul diagram while employing Microsoft Excel to analysis, design and develop a mass haul diagram for an effective road earthwork project execution. Akinnuli et.al, (2012) and Hilbert et.al, (2010) claimed that the analysis and optimization phases of a design are easily and accurately performed by the computer where the designer will formally find these
tasks time consuming and tedious without the use of same. The Mass Haul Diagram is useful for a highway engineer to determine direction of haul and the quantity of earth taken from or hauled to any location along the alignment together with due economy. It is a valuable practice for the determination of the balance points of an alignment for locations where the volume of excavation after adjustment for shrinkage and embankment are equal. Estimation of soil with similar density and strength brims the desire of the highway engineer to ensure that same volumes in the cuts match those of the fills and as well as to minimise the distance of earthwork moved. It worthy of note that the final point on a mass haul diagram for a given road project gives the overall net amount of earthwork for the entire project. Where the value is positive the surplus excavated material becomes waste and when it is a negative amount there is a net shortage of earthwork for the project and a need to borrow the same quantity of earthwork material is required. The significance of this study is that mass haul diagram development for highway earthwork methodology that used to be very tedious for highway engineers while employing conventional hand approach or costly when using specific purpose application programs are now performed much more quickly, speedily and effectively in an electronics office by using a readily available general purpose application program economically as presented in this study.
MATERIALS AND METHODOLOGY A mass-haul diagram is a curve drawn subsequent to the calculation of earthwork volumes more especially for long works such as railways and roads. Garber (2010) claimed that a common method of determining the volume is that of average end areas based on the assumption that the volume between two consecutive sections is the average of their areas multiplied by the distance between them. Equation 1 is a useful model in use during the computation of volume of earthworks in railway or highway projects.
)1()21(2
AALV
Where V= volume (m³)
areaendAandA 21
L = distances between cross sections Soil materials are found to increase (swell) in volume after excavation which is known as bulking. However, it is peculiar for these soil materials that after being re-compacted by roller or other means in situ they are found to occupy less volume than formerly and the phenomenon is known as shrinkage.
Journal of Emerging Trends in Engineering and Applied Sciences (JETEAS) 4(1):38-45 (ISSN: 2141-7016)
40
Where the shrinkage factor of such soils is known it may be used in the computation of fill and cut volumes to amend the required net soil materials while calculating mass haul ordinate. Bannister and Raymond (1998) gave typical swell or shrinkage factors for certain materials as shown in Table 1. However, Garber (2010) claimed that shrinkage factors used are generally between 1.10 and 1.25 for high fills and between 1.20 and 1.25 for low fills in order to determine the required quantity of fill material. Mass-haul diagram shows ordinates as aggregate volumes in cubic metres of both excavation and embankment up to any desired station from the position of zero chainage. Also, mass-haul diagram has horizontal base line as the profile that gives the stationing points in chainages at which these volumes are obtained. The mass diagram ordinates show the values of aggregate volumes of cuttings as uphill positive and fill as downhill negative during computation. Also, in plotting the mass-haul curve total positive volumes are plotted above the base line and total negatives below it. In addition, balance point is where the curve intersects the baseline and thus indicates where the cut and fill balancing occurred. The two values needed for the calculation of the average haul and free haul are the area under the curve and the volume obtained from the mass haul diagram. The volume for use is the sum of the peaks and valleys on the diagram.
Table 1: Swell or Shrinkage Factors For Certain Materials
Source: Bannister and Raymond, 1998
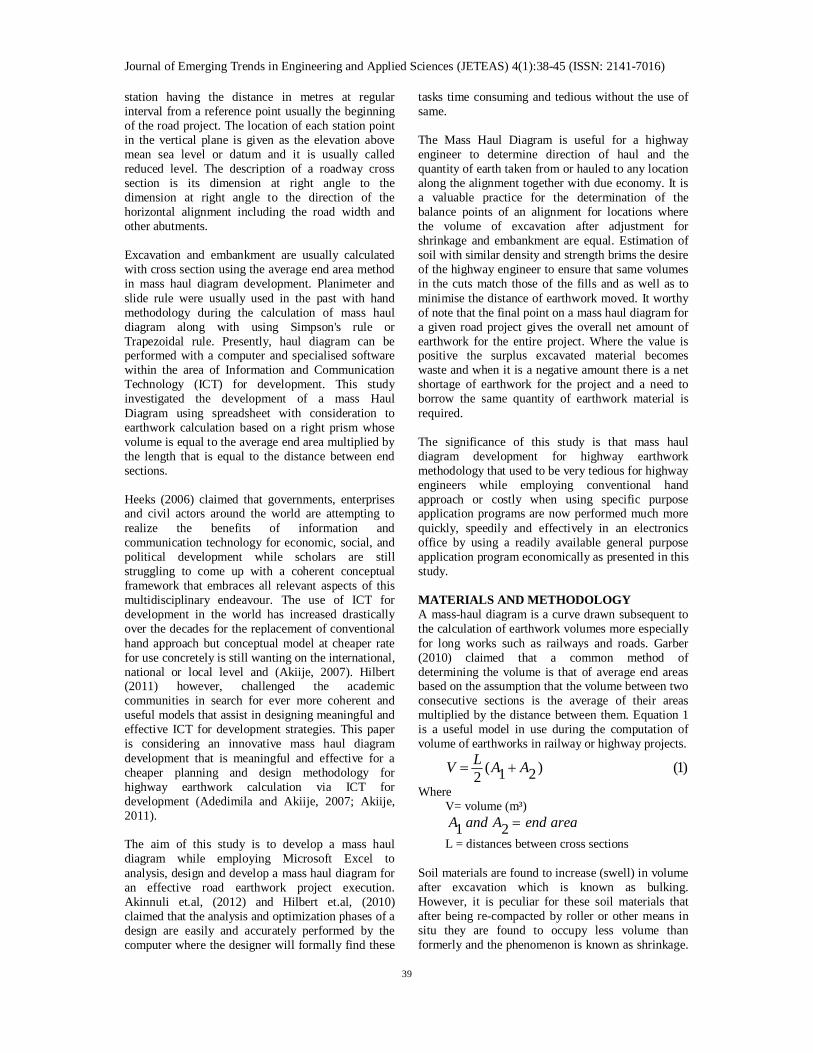
Garber (2010) considered the computation of a mass haul diagram after the determination of fill and cut volumes of a roadway section that is 600 m long with 20 stations at regular interval of 30 m with known end area values ( 2m ) as shown in Table 2 columns 2 and 3. Determination of the volume of total cut or that of fill required between adjacent stations was determined by using Equation 1. Column 4 is showing the total cut volume determined while column 5 is showing the computed fill volume. Total fill volume as in column 7 was obtained by the addition of computed fill volume of column 5 and its 10 percent shrinkage
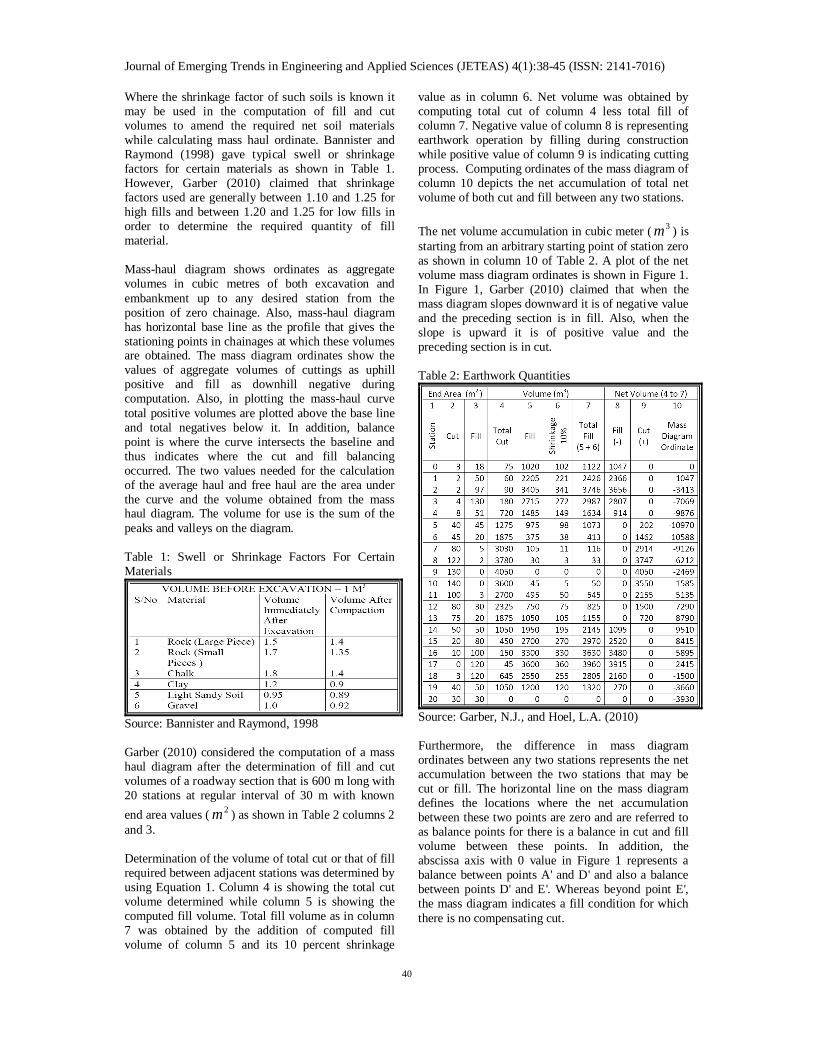
value as in column 6. Net volume was obtained by computing total cut of column 4 less total fill of column 7. Negative value of column 8 is representing earthwork operation by filling during construction while positive value of column 9 is indicating cutting process. Computing ordinates of the mass diagram of column 10 depicts the net accumulation of total net volume of both cut and fill between any two stations. The net volume accumulation in cubic meter ( 3m ) is starting from an arbitrary starting point of station zero as shown in column 10 of Table 2. A plot of the net volume mass diagram ordinates is shown in Figure 1. In Figure 1, Garber (2010) claimed that when the mass diagram slopes downward it is of negative value and the preceding section is in fill. Also, when the slope is upward it is of positive value and the preceding section is in cut.
Table 2: Earthwork Quantities
Source: Garber, N.J., and Hoel, L.A. (2010) Furthermore, the difference in mass diagram ordinates between any two stations represents the net accumulation between the two stations that may be cut or fill. The horizontal line on the mass diagram defines the locations where the net accumulation between these two points are zero and are referred to as balance points for there is a balance in cut and fill volume between these points. In addition, the abscissa axis with 0 value in Figure 1 represents a balance between points A' and D' and also a balance between points D' and E'. Whereas beyond point E', the mass diagram indicates a fill condition for which there is no compensating cut.
Journal of Emerging Trends in Engineering and Applied Sciences (JETEAS) 4(1):38-45 (ISSN: 2141-7016)
41
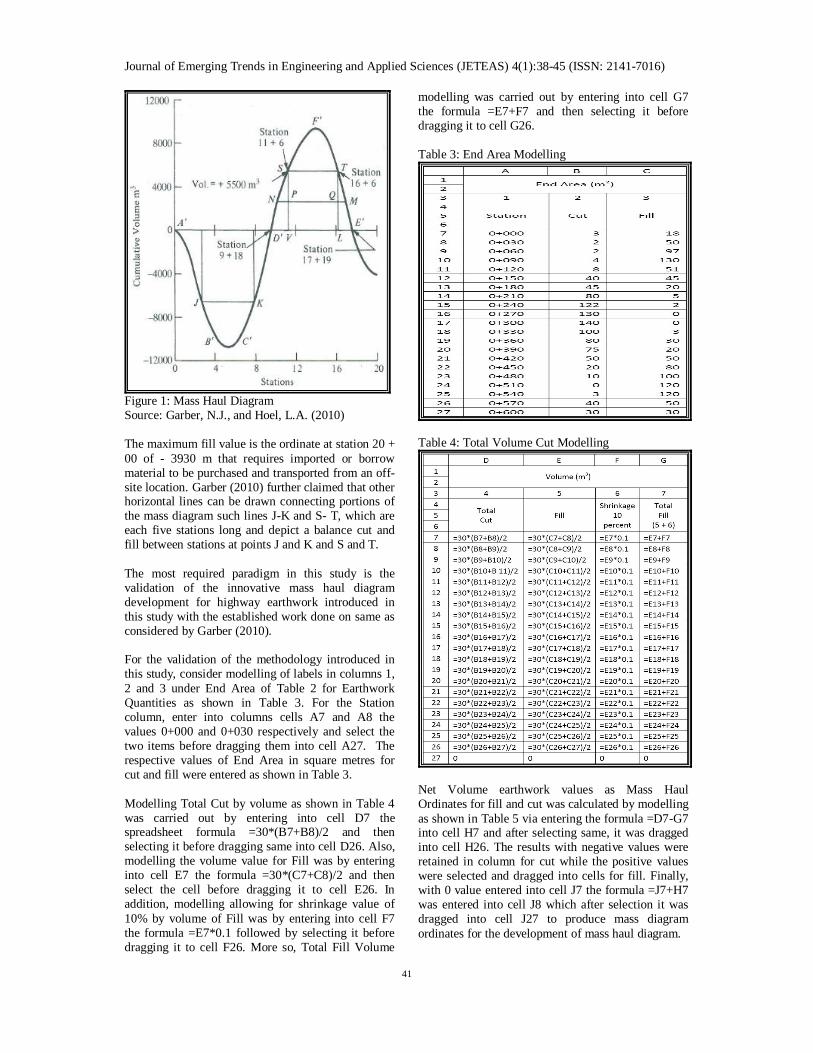
Figure 1: Mass Haul Diagram Source: Garber, N.J., and Hoel, L.A. (2010) The maximum fill value is the ordinate at station 20 + 00 of - 3930 m that requires imported or borrow material to be purchased and transported from an off-site location. Garber (2010) further claimed that other horizontal lines can be drawn connecting portions of the mass diagram such lines J-K and S- T, which are each five stations long and depict a balance cut and fill between stations at points J and K and S and T. The most required paradigm in this study is the validation of the innovative mass haul diagram development for highway earthwork introduced in this study with the established work done on same as considered by Garber (2010). For the validation of the methodology introduced in this study, consider modelling of labels in columns 1, 2 and 3 under End Area of Table 2 for Earthwork Quantities as shown in Table 3. For the Station column, enter into columns cells A7 and A8 the values 0+000 and 0+030 respectively and select the two items before dragging them into cell A27. The respective values of End Area in square metres for cut and fill were entered as shown in Table 3. Modelling Total Cut by volume as shown in Table 4 was carried out by entering into cell D7 the spreadsheet formula =30*(B7+B8)/2 and then selecting it before dragging same into cell D26. Also, modelling the volume value for Fill was by entering into cell E7 the formula =30*(C7+C8)/2 and then select the cell before dragging it to cell E26. In addition, modelling allowing for shrinkage value of 10% by volume of Fill was by entering into cell F7 the formula =E7*0.1 followed by selecting it before dragging it to cell F26. More so, Total Fill Volume
modelling was carried out by entering into cell G7 the formula =E7+F7 and then selecting it before dragging it to cell G26.
Table 3: End Area Modelling
Table 4: Total Volume Cut Modelling
Net Volume earthwork values as Mass Haul Ordinates for fill and cut was calculated by modelling as shown in Table 5 via entering the formula =D7-G7 into cell H7 and after selecting same, it was dragged into cell H26. The results with negative values were retained in column for cut while the positive values were selected and dragged into cells for fill. Finally, with 0 value entered into cell J7 the formula =J7+H7 was entered into cell J8 which after selection it was dragged into cell J27 to produce mass diagram ordinates for the development of mass haul diagram.
Journal of Emerging Trends in Engineering and Applied Sciences (JETEAS) 4(1):38-45 (ISSN: 2141-7016)
42
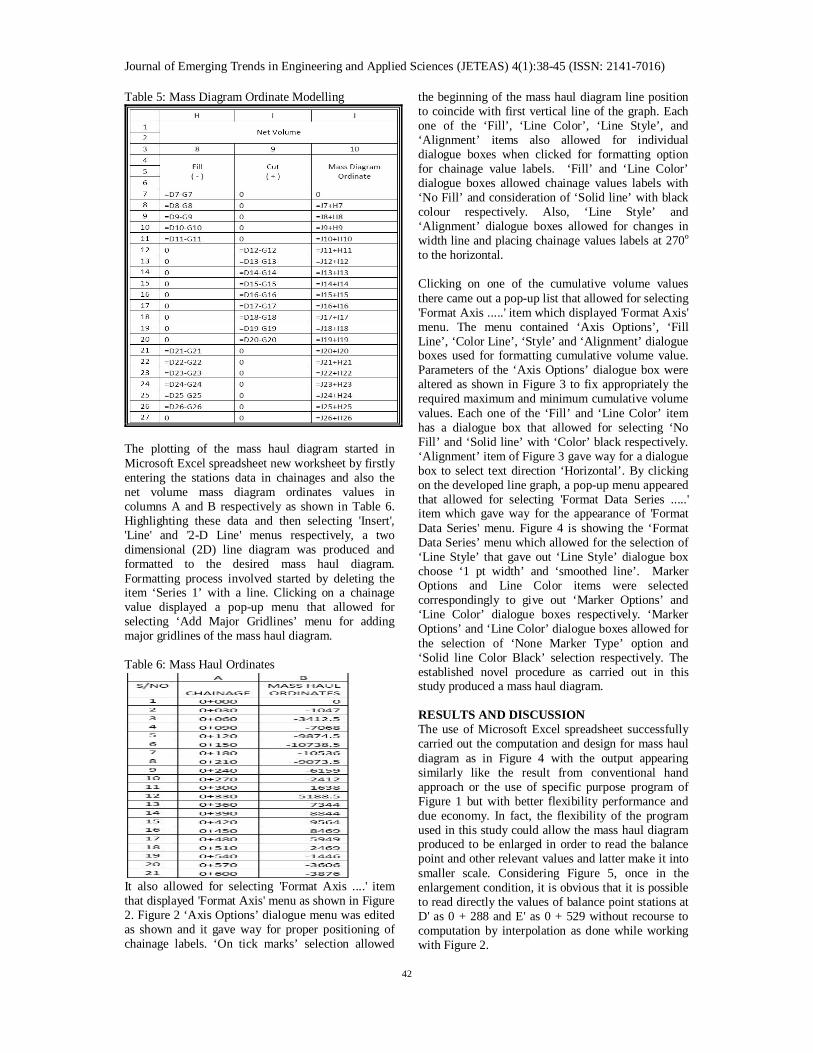
Table 5: Mass Diagram Ordinate Modelling
The plotting of the mass haul diagram started in Microsoft Excel spreadsheet new worksheet by firstly entering the stations data in chainages and also the net volume mass diagram ordinates values in columns A and B respectively as shown in Table 6. Highlighting these data and then selecting 'Insert', 'Line' and '2-D Line' menus respectively, a two dimensional (2D) line diagram was produced and formatted to the desired mass haul diagram. Formatting process involved started by deleting the item ‘Series 1’ with a line. Clicking on a chainage value displayed a pop-up menu that allowed for selecting ‘Add Major Gridlines’ menu for adding major gridlines of the mass haul diagram. Table 6: Mass Haul Ordinates
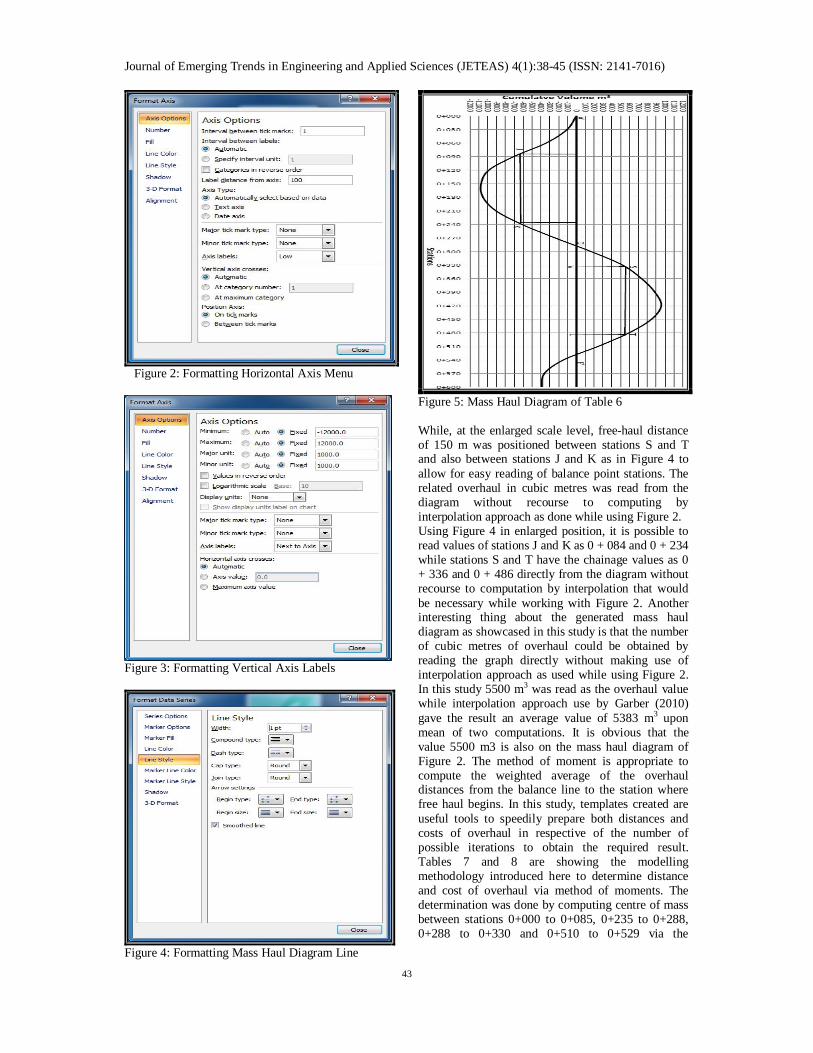
It also allowed for selecting 'Format Axis ....' item that displayed 'Format Axis' menu as shown in Figure 2. Figure 2 ‘Axis Options’ dialogue menu was edited as shown and it gave way for proper positioning of chainage labels. ‘On tick marks’ selection allowed
the beginning of the mass haul diagram line position to coincide with first vertical line of the graph. Each one of the ‘Fill’, ‘Line Color’, ‘Line Style’, and ‘Alignment’ items also allowed for individual dialogue boxes when clicked for formatting option for chainage value labels. ‘Fill’ and ‘Line Color’ dialogue boxes allowed chainage values labels with ‘No Fill’ and consideration of ‘Solid line’ with black colour respectively. Also, ‘Line Style’ and ‘Alignment’ dialogue boxes allowed for changes in width line and placing chainage values labels at 270o to the horizontal. Clicking on one of the cumulative volume values there came out a pop-up list that allowed for selecting 'Format Axis .....' item which displayed 'Format Axis' menu. The menu contained ‘Axis Options’, ‘Fill Line’, ‘Color Line’, ‘Style’ and ‘Alignment’ dialogue boxes used for formatting cumulative volume value. Parameters of the ‘Axis Options’ dialogue box were altered as shown in Figure 3 to fix appropriately the required maximum and minimum cumulative volume values. Each one of the ‘Fill’ and ‘Line Color’ item has a dialogue box that allowed for selecting ‘No Fill’ and ‘Solid line’ with ‘Color’ black respectively. ‘Alignment’ item of Figure 3 gave way for a dialogue box to select text direction ‘Horizontal’. By clicking on the developed line graph, a pop-up menu appeared that allowed for selecting 'Format Data Series .....' item which gave way for the appearance of 'Format Data Series' menu. Figure 4 is showing the ‘Format Data Series’ menu which allowed for the selection of ‘Line Style’ that gave out ‘Line Style’ dialogue box choose ‘1 pt width’ and ‘smoothed line’. Marker Options and Line Color items were selected correspondingly to give out ‘Marker Options’ and ‘Line Color’ dialogue boxes respectively. ‘Marker Options’ and ‘Line Color’ dialogue boxes allowed for the selection of ‘None Marker Type’ option and ‘Solid line Color Black’ selection respectively. The established novel procedure as carried out in this study produced a mass haul diagram.
RESULTS AND DISCUSSION The use of Microsoft Excel spreadsheet successfully carried out the computation and design for mass haul diagram as in Figure 4 with the output appearing similarly like the result from conventional hand approach or the use of specific purpose program of Figure 1 but with better flexibility performance and due economy. In fact, the flexibility of the program used in this study could allow the mass haul diagram produced to be enlarged in order to read the balance point and other relevant values and latter make it into smaller scale. Considering Figure 5, once in the enlargement condition, it is obvious that it is possible to read directly the values of balance point stations at D' as 0 + 288 and E' as 0 + 529 without recourse to computation by interpolation as done while working with Figure 2.
Journal of Emerging Trends in Engineering and Applied Sciences (JETEAS) 4(1):38-45 (ISSN: 2141-7016)
43
Figure 2: Formatting Horizontal Axis Menu
Figure 3: Formatting Vertical Axis Labels
Figure 4: Formatting Mass Haul Diagram Line
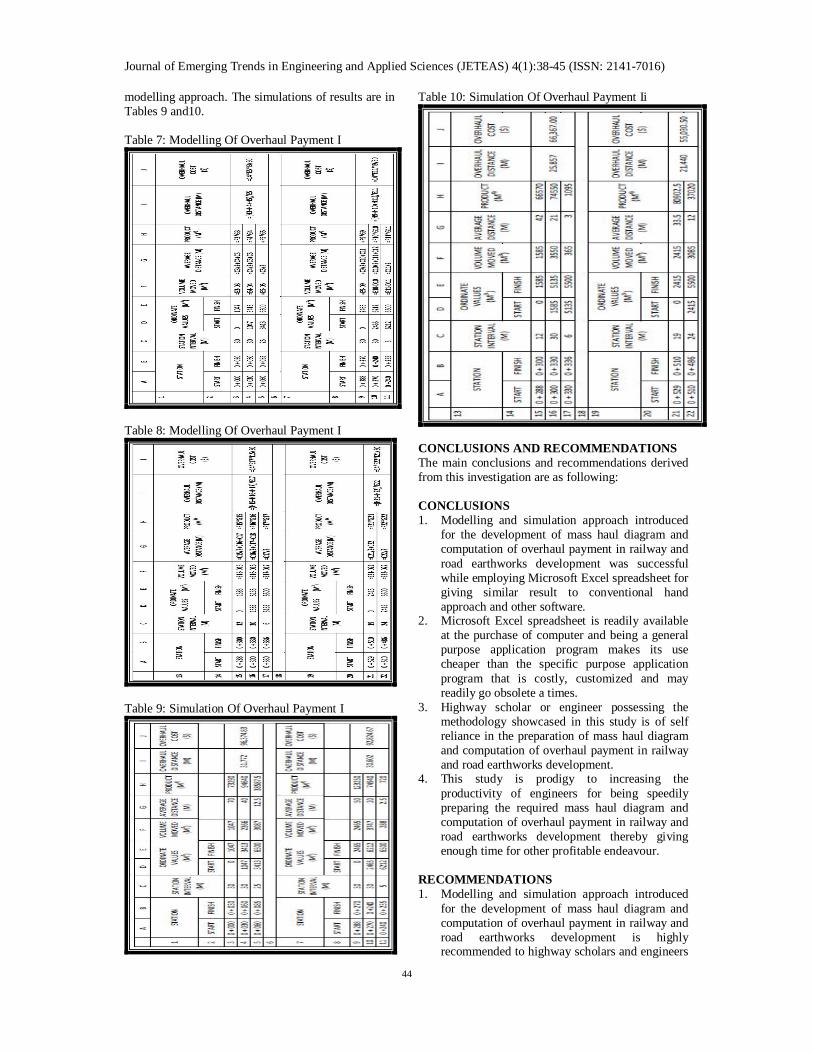
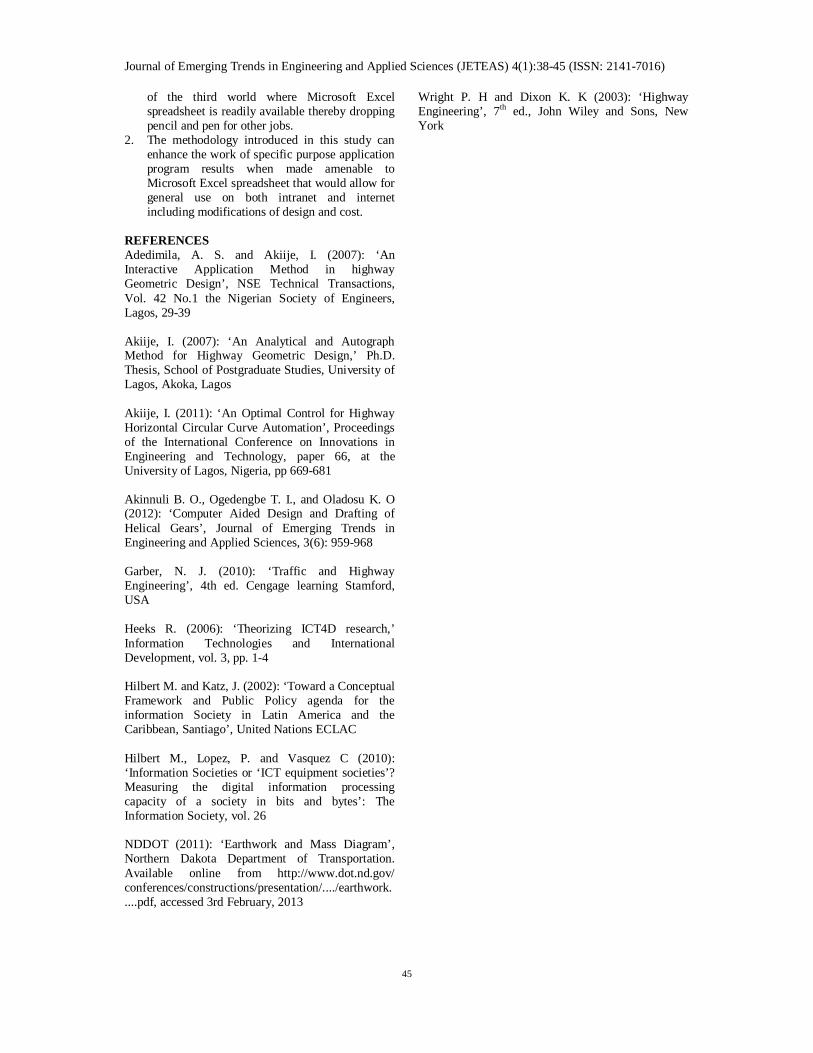
Figure 5: Mass Haul Diagram of Table 6 While, at the enlarged scale level, free-haul distance of 150 m was positioned between stations S and T and also between stations J and K as in Figure 4 to allow for easy reading of balance point stations. The related overhaul in cubic metres was read from the diagram without recourse to computing by interpolation approach as done while using Figure 2. Using Figure 4 in enlarged position, it is possible to read values of stations J and K as 0 + 084 and 0 + 234 while stations S and T have the chainage values as 0 + 336 and 0 + 486 directly from the diagram without recourse to computation by interpolation that would be necessary while working with Figure 2. Another interesting thing about the generated mass haul diagram as showcased in this study is that the number of cubic metres of overhaul could be obtained by reading the graph directly without making use of interpolation approach as used while using Figure 2. In this study 5500 m3 was read as the overhaul value while interpolation approach use by Garber (2010) gave the result an average value of 5383 m3 upon mean of two computations. It is obvious that the value 5500 m3 is also on the mass haul diagram of Figure 2. The method of moment is appropriate to compute the weighted average of the overhaul distances from the balance line to the station where free haul begins. In this study, templates created are useful tools to speedily prepare both distances and costs of overhaul in respective of the number of possible iterations to obtain the required result. Tables 7 and 8 are showing the modelling methodology introduced here to determine distance and cost of overhaul via method of moments. The determination was done by computing centre of mass between stations 0+000 to 0+085, 0+235 to 0+288, 0+288 to 0+330 and 0+510 to 0+529 via the
Journal of Emerging Trends in Engineering and Applied Sciences (JETEAS) 4(1):38-45 (ISSN: 2141-7016)
44
modelling approach. The simulations of results are in Tables 9 and10.
Table 7: Modelling Of Overhaul Payment I
Table 8: Modelling Of Overhaul Payment I
Table 9: Simulation Of Overhaul Payment I
Table 10: Simulation Of Overhaul Payment Ii
CONCLUSIONS AND RECOMMENDATIONS The main conclusions and recommendations derived from this investigation are as following: CONCLUSIONS 1. Modelling and simulation approach introduced
for the development of mass haul diagram and computation of overhaul payment in railway and road earthworks development was successful while employing Microsoft Excel spreadsheet for giving similar result to conventional hand approach and other software.
2. Microsoft Excel spreadsheet is readily available at the purchase of computer and being a general purpose application program makes its use cheaper than the specific purpose application program that is costly, customized and may readily go obsolete a times.
3. Highway scholar or engineer possessing the methodology showcased in this study is of self reliance in the preparation of mass haul diagram and computation of overhaul payment in railway and road earthworks development.
4. This study is prodigy to increasing the productivity of engineers for being speedily preparing the required mass haul diagram and computation of overhaul payment in railway and road earthworks development thereby giving enough time for other profitable endeavour.
RECOMMENDATIONS 1. Modelling and simulation approach introduced
for the development of mass haul diagram and computation of overhaul payment in railway and road earthworks development is highly recommended to highway scholars and engineers
Journal of Emerging Trends in Engineering and Applied Sciences (JETEAS) 4(1):38-45 (ISSN: 2141-7016)
45
of the third world where Microsoft Excel spreadsheet is readily available thereby dropping pencil and pen for other jobs.
2. The methodology introduced in this study can enhance the work of specific purpose application program results when made amenable to Microsoft Excel spreadsheet that would allow for general use on both intranet and internet including modifications of design and cost.
REFERENCES Adedimila, A. S. and Akiije, I. (2007): ‘An Interactive Application Method in highway Geometric Design’, NSE Technical Transactions, Vol. 42 No.1 the Nigerian Society of Engineers, Lagos, 29-39 Akiije, I. (2007): ‘An Analytical and Autograph Method for Highway Geometric Design,’ Ph.D. Thesis, School of Postgraduate Studies, University of Lagos, Akoka, Lagos Akiije, I. (2011): ‘An Optimal Control for Highway Horizontal Circular Curve Automation’, Proceedings of the International Conference on Innovations in Engineering and Technology, paper 66, at the University of Lagos, Nigeria, pp 669-681 Akinnuli B. O., Ogedengbe T. I., and Oladosu K. O (2012): ‘Computer Aided Design and Drafting of Helical Gears’, Journal of Emerging Trends in Engineering and Applied Sciences, 3(6): 959-968 Garber, N. J. (2010): ‘Traffic and Highway Engineering’, 4th ed. Cengage learning Stamford, USA Heeks R. (2006): ‘Theorizing ICT4D research,’ Information Technologies and International Development, vol. 3, pp. 1-4 Hilbert M. and Katz, J. (2002): ‘Toward a Conceptual Framework and Public Policy agenda for the information Society in Latin America and the Caribbean, Santiago’, United Nations ECLAC Hilbert M., Lopez, P. and Vasquez C (2010): ‘Information Societies or ‘ICT equipment societies’? Measuring the digital information processing capacity of a society in bits and bytes’: The Information Society, vol. 26 NDDOT (2011): ‘Earthwork and Mass Diagram’, Northern Dakota Department of Transportation. Available online from http://www.dot.nd.gov/ conferences/constructions/presentation/..../earthwork.....pdf, accessed 3rd February, 2013
Wright P. H and Dixon K. K (2003): ‘Highway Engineering’, 7th ed., John Wiley and Sons, New York