Embed Size (px)
Citation preview
Anales Acad. Nac. de Cs. Ex., Fís. y Nat., tomo 65 (2013): 59-79.
~ 59 ~
AN INNOVATIVE DISCRETE EVENT SIMULATION TOOL TO IMPROVE THE
EFFICIENCY OF A COMPLEX BEER PACKAGING LINE
Natalia Basán, Mariana Cóccola y Carlos Méndez
INTEC (UNL - CONICET), Güemes 3450, 3000 Santa Fe, Argentina
E-mail: [email protected]
Abstract
Discrete event simulation (DES) techniques cover a broad collection of methods and
applications that allow imitating, assessing, predicting and enhancing the behavior
of large and complex real-world processes. This work introduces a modern DES
framework, developed with SIMIO simulation software, to optimize both the design
and operation of a complex beer packaging system. The proposed simulation model
provides a 3D user-friendly graphical interface which allows evaluating the
dynamic operation of the system over time. In turn, the simulation model has been
used to perform a comprehensive sensitive analysis over the main process
variables. In this way, several alternative scenarios have been assessed in order to
achieve remarkable performance improvements. Numerical results generated by
the DES model clearly show that production and efficiency can be significantly
enhanced when the packaging line is properly set up.
Key words: optimization; simulation; packaging line
Resumen
Una herramienta innovadora de simulación de eventos discretos para
mejorar la eficiencia de una línea compleja de envasado de cerveza. Las
técnicas de simulación de eventos discretos (DES) abarcan una amplia colección de
métodos y aplicaciones que permiten imitar, evaluar, predecir y mejorar el
comportamiento de procesos complejos del mundo real. Este trabajo presenta un
ambiente moderno de DES, desarrollado con el software de simulación SIMIO, para
optimizar tanto el diseño y funcionamiento de un complejo sistema de envasado de
cerveza. El modelo propuesto proporciona una interfaz tridimensional gráfica que
resulta fácil de usar y permite la evaluación de la operación del sistema a través del
tiempo. A su vez, el modelo de simulación se ha utilizado para llevar a cabo un
análisis de sensibilidad sobre las principales variables del proceso. De esta forma,
se han evaluado diferentes escenarios alternativos con el fin de conseguir notables
mejoras en el rendimiento. Los resultados numéricos generados por el modelo DES
muestran claramente que la producción y la eficiencia se pueden mejorar de
manera significativa cuando la línea de envasado presenta una adecuada
configuración.
Palabras clave: optimización; simulación; línea de envasado

Anales Acad. Nac. de Cs. Ex., Fís. y Nat., tomo 65 (2013): 59-79.
~ 60 ~
1. Introduction
In the current context of increasingly competitive markets, production activities
must be properly accomplished in order to ensure high quality products. This often translates
into a better product presentation, which needs to fit today’s market requirements. In this
way, the demand growth and the trend to specialize the presentation of products are putting
pressure on companies to perform more diversified tasks on their packaging lines, which have
become more complex in the last years.
This paper aims to analyze the operation of the main packaging line of an
international beer company located in Argentina. The simulation study is mainly motivated by
the low efficiency of the line, according to the level desired by the managers. This implies a
reduction on the current production level due to the packaging process is an essential stage in
the whole production process.
The main objective of this work is to identify, analyze and reduce the causes
affecting the productivity of the packaging line. Modern simulation techniques has recently
emerged as proper tools to cope with complex decision making problems [1, 2]. Therefore, a
comprehensive simulation-based model has been developed in order to determine the potential
changes to improve the performance of the facility. The modern SIMIO modeling software was
used for developing the simulation model. After being created and validated, different
alternative scenarios (current, suggested and theoretical) were assessed in order to determine
the more suitable line design and operation that allows increasing economical benefits [3].
The manuscript is organized as follows. Section 2 describes the main features of
the bottling beer process. Afterwards, in Section 3, an explanation of how the simulation
model was developed is given. Section 4 shows how simulation results are used to validate the
performance of the current operation of the line and highlights its potential improvements.
Finally, the article concludes with some discussion and remarks in Section 5.
2. Features of the beer production process
The beer production process involves eight manufacturing stages: (i) Malting, (ii)
Malt Milling, (iii) Mashing, (iv) Cooking, (v) Wort Cooling and Clarification, (vi) Fermentation,
(vii) Maturation, and (viii) Packaging. The amount and type of raw material to be processed in
each stage depend on the beer type to be produced [4].
2.1. Packaging line
This work is focused on the packaging step. In a packaging line, the beer drawn
from a holding tank is filled into bottles, which are then capped and labeled. A flowchart of a
generic beer packaging process is depicted in Fig. 1.
The first operation in a packaging line is the depalletizing stage, where the empty
bottles are removed from the original pallet packaging. Then, an inspection operation named
100% control is performed manually by an operator so that defective items or bottles that
could harm machines on the line are removed. After that, bottles and drawers are separated
and then sent to washer machines in different lines. The bottles must be rinsed with filtered
water or air before being refilled. This physical and biological cleaning is performed to remove
dirt, labels, adhesive, and foil from the glass bottles. The bottle enters then to a container
inspector which controls that all cleaning agents that were used in the previous stage have

Anales Acad. Nac. de Cs. Ex., Fís. y Nat., tomo 65 (2013): 59-79.
~ 61 ~
been removed. Next, a filling machine is used so that the beer drawn from a holding tank be
filled into the clean bottles. After that, a cap is applied to each bottle to seal it. To ensure the
quality of product, the filled and capped bottles are then sent to a pasteurization stage, where
they are kept until “minimum durability date”. Once the bottles reach this date, they enter to
a labeling machine where a label is applied to each one. Then, a level-cap inspection is
performed to reject bottles that do not satisfy required characteristics as filling level, internal
pressure, and missing labels and caps. Finally, the product is located into drawers, which are
packed into pallets and warehoused, ready for sale.
Fig. 1. Beer bottling process- 63 - C. Méndez. Premio Alberto S.C. Fava en Cs. de la Ingeniería
3. Simulation model of the beer packaging process
Process simulation and modeling tools have become an issue of increasing
importance to the industry in process design and operation [5, 6]. The operation of a real-
world process evolving over time can be studied in detailed by developing a discrete event
simulation model [7].
To build a model, it is first necessary to understand how the real process is
operated. In this way, all the necessary data from the brewing company under study was
collected by using several alternative techniques [8]: (i) staff interviews, (ii) in-situ
observation, and (iii) historical data collection, among others. The information gathered was
then analyzed, filtered and documented [9]. Such procedure allows to identify critical points
and potential problems to be solved in the current and desired operation of the packaging
process [10,11].
Once data collection was completed, statistical analysis of data was performed to
determine the probability distributions that best fit the data collected [12,13]. For this task,
the Input Analyzer Arena simulation software was used [14]. The computational model was
developed by using the SIMIO modeling environment. In order to represent the operation of
the bottling line, the following components are to be considered within the model:
• Bottles, Drawers, and Pallets running on the line.
• Machines performing filling, labeling, and cleaning operations.
• Belt conveyors locating between machines.
• Operators working on the line.

Anales Acad. Nac. de Cs. Ex., Fís. y Nat., tomo 65 (2013): 59-79.
~ 62 ~
3.1. SIMIO Simulation Software
SIMIO is a novel and innovative object-oriented modeling framework for flow
simulation of complex discrete event systems and procedures. This computational tool allows
building graphical animation models in both 2D and 3D, which simplify the viewing and
validation of simulation results [15].
In SIMIO, each physical component of the real process, such as bottles or
machines, is represented by an object with a predefined behavior, which can be extended by
adding additional user procedures in the model. Three animation views of the simulation
model are given in Fig. 2.
Fig. 2. 3D graphical views of packaging line
3.2. Packaging line model
Standard SIMIO objects as source, server, and sink, connected by paths, have been
used to build the simulation model. A detailed description of how the bottling line has been
modeled computationally is given below.
Pallets, Drawers, and Bottles: They are the dynamic entities processed on the line, as shown in
Fig. 3.
The arrivals of pallets full of empty bottles are generated by a “Source Object”. Il-
lustrated by Fig. 3, the bottles enter to the line once they are removed from their original
pallet packaging by the depalletizer machine.
Fig. 3. Dynamic entities (bottles, drawers, and pallets) and pallets entity arrivals
Anales Acad. Nac. de Cs. Ex., Fís. y Nat., tomo 65 (2013): 59-79.
~ 63 ~
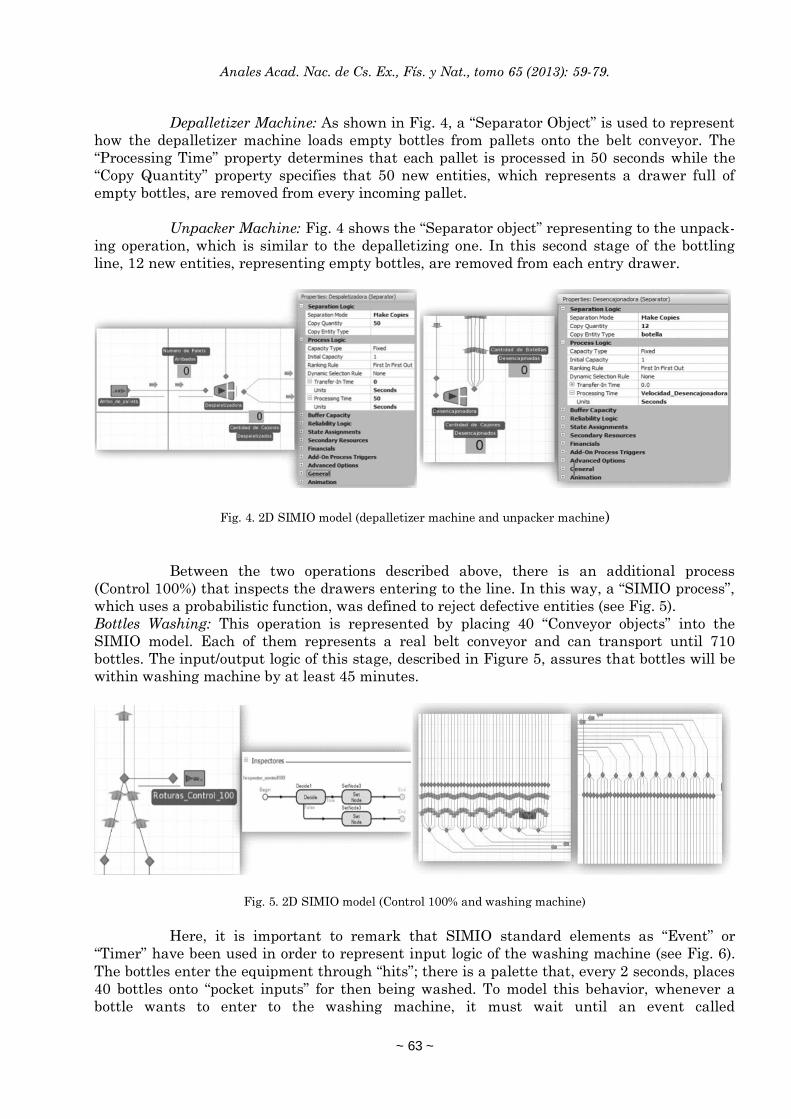
Depalletizer Machine: As shown in Fig. 4, a “Separator Object” is used to represent
how the depalletizer machine loads empty bottles from pallets onto the belt conveyor. The
“Processing Time” property determines that each pallet is processed in 50 seconds while the
“Copy Quantity” property specifies that 50 new entities, which represents a drawer full of
empty bottles, are removed from every incoming pallet.
Unpacker Machine: Fig. 4 shows the “Separator object” representing to the unpack-
ing operation, which is similar to the depalletizing one. In this second stage of the bottling
line, 12 new entities, representing empty bottles, are removed from each entry drawer.
Fig. 4. 2D SIMIO model (depalletizer machine and unpacker machine)
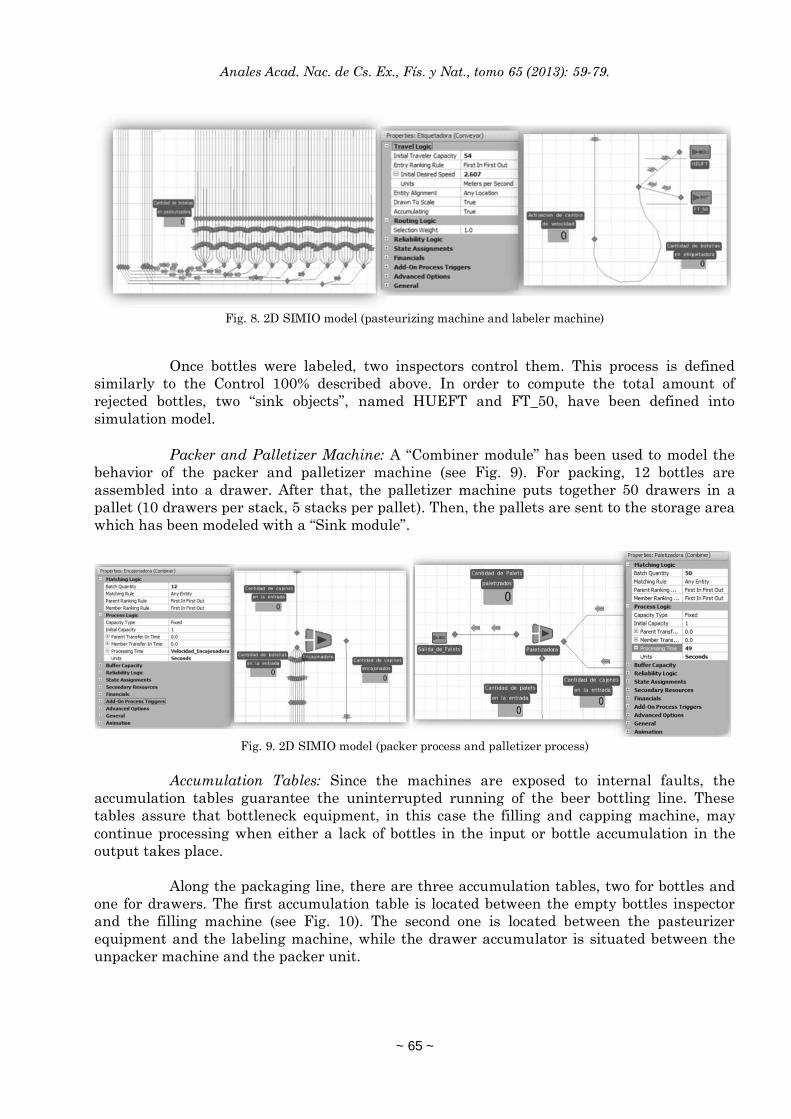
Between the two operations described above, there is an additional process
(Control 100%) that inspects the drawers entering to the line. In this way, a “SIMIO process”,
which uses a probabilistic function, was defined to reject defective entities (see Fig. 5).
Bottles Washing: This operation is represented by placing 40 “Conveyor objects” into the
SIMIO model. Each of them represents a real belt conveyor and can transport until 710
bottles. The input/output logic of this stage, described in Figure 5, assures that bottles will be
within washing machine by at least 45 minutes.
Fig. 5. 2D SIMIO model (Control 100% and washing machine)
Here, it is important to remark that SIMIO standard elements as “Event” or
“Timer” have been used in order to represent input logic of the washing machine (see Fig. 6).
The bottles enter the equipment through “hits”; there is a palette that, every 2 seconds, places
40 bottles onto “pocket inputs” for then being washed. To model this behavior, whenever a
bottle wants to enter to the washing machine, it must wait until an event called

Anales Acad. Nac. de Cs. Ex., Fís. y Nat., tomo 65 (2013): 59-79.
~ 64 ~
“Active_Washing” is activated. A “Timer element” is used so that such event can be triggered
every 2 seconds. Thus, we ensure that each group of bottles will enter to the machine at the
same time and consequently the input speed of the equipment is fulfilled.
Empty Bottles Inspector (MIHO): This process stage aims to verify the bottles that
have been previously processed in the washing machine. As shown in Fig. 6, a “SIMIO basic
node” is used to represent this operation. Such node has one input path and three output
paths. The first output path receives the bottles that have a physical defect. The bottles that
have some dirt are sent to the second one. Finally, the accepted bottles continue their normal
processing to the third output path.
Fig. 6. 2D SIMIO model (input logic to washing machine and bottles inspector)- 65 - C. Méndez. Premio Alberto S.C.
Fava en Cs. de la Ingeniería
Filling Machine: This operation has been modeled with a “Conveyor object”. As
shown in Fig. 7, the “Initial Traveler Capacity” object property indicates that 154 bottles can
be transported at the same time. Such carrying capacity is equal to the amount of filling
valves. Next operation, capping, it is modeled with the same processing capacity of filling
machine.
Fig. 7. 2D SIMIO model (filling machine and pasteurizing machine)
Pasteurizer Machine: This equipment has two floors which have been represented
in SIMIO by 60 conveyors working in parallel (processing capacity). In this stage, bottles cross
through “rainfall areas” that provide water at different temperatures (see Fig. 7 and 8).
Labeler Machine: This equipment unit has an operation similar to the filling machine (see Fig.
8).
Anales Acad. Nac. de Cs. Ex., Fís. y Nat., tomo 65 (2013): 59-79.
~ 65 ~
Fig. 8. 2D SIMIO model (pasteurizing machine and labeler machine)
Once bottles were labeled, two inspectors control them. This process is defined
similarly to the Control 100% described above. In order to compute the total amount of
rejected bottles, two “sink objects”, named HUEFT and FT_50, have been defined into
simulation model.
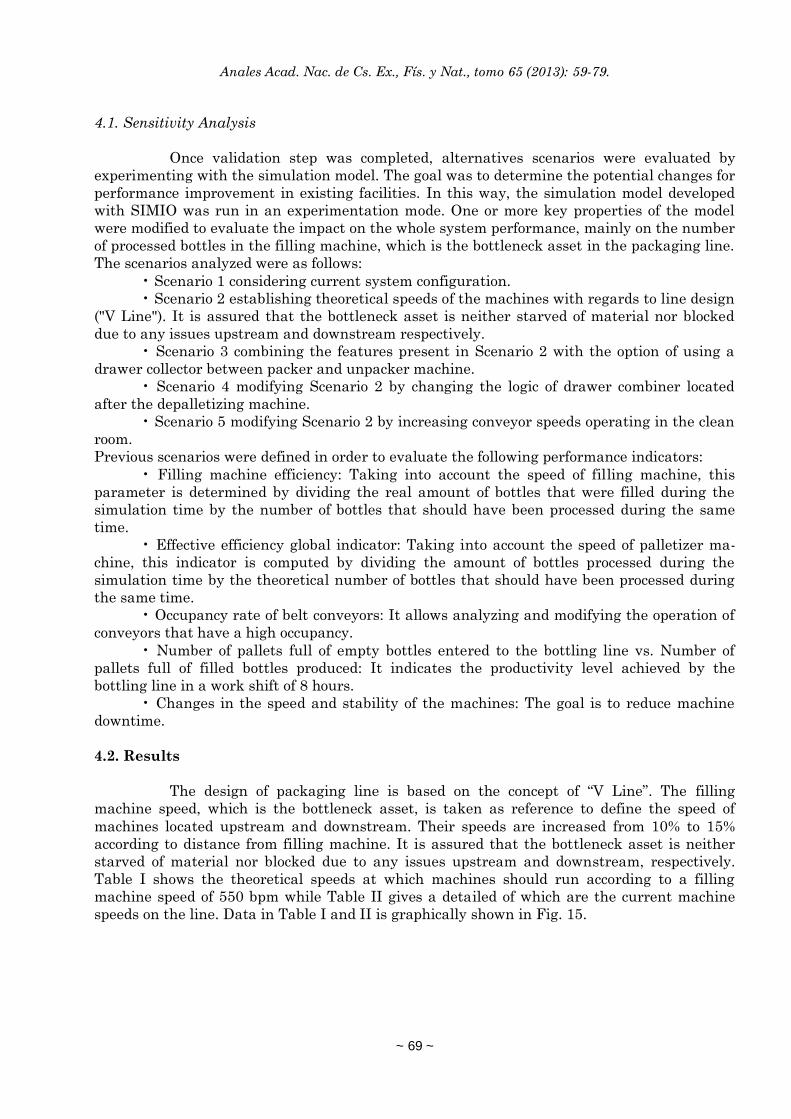
Packer and Palletizer Machine: A “Combiner module” has been used to model the
behavior of the packer and palletizer machine (see Fig. 9). For packing, 12 bottles are
assembled into a drawer. After that, the palletizer machine puts together 50 drawers in a
pallet (10 drawers per stack, 5 stacks per pallet). Then, the pallets are sent to the storage area
which has been modeled with a “Sink module”.
Fig. 9. 2D SIMIO model (packer process and palletizer process)
Accumulation Tables: Since the machines are exposed to internal faults, the
accumulation tables guarantee the uninterrupted running of the beer bottling line. These
tables assure that bottleneck equipment, in this case the filling and capping machine, may
continue processing when either a lack of bottles in the input or bottle accumulation in the
output takes place.
Along the packaging line, there are three accumulation tables, two for bottles and
one for drawers. The first accumulation table is located between the empty bottles inspector
and the filling machine (see Fig. 10). The second one is located between the pasteurizer
equipment and the labeling machine, while the drawer accumulator is situated between the
unpacker machine and the packer unit.

Anales Acad. Nac. de Cs. Ex., Fís. y Nat., tomo 65 (2013): 59-79.
~ 66 ~
Fig. 10. 2D SIMIO model (accumulation table for bottles and monitor element)
Fig. 10 shows a “Monitor element” which has been used to control the capacity of
the conveyor located above the accumulation tables for bottles. If this capacity changes, a
process called “Activar_Mesa” is triggered by the monitor. This process verifies that the
conveyor capacity does not exceed 90% of its maximum capacity. If this happens, the
accumulation table is activated.
In addition, a binary variable named Activar_Mesa_N determines the current state
of accumulation table N. If such table is activated, Activar_Mesa_N values 1; otherwise, it is
set to zero.
Transports: There are two transport lines, one for bottles and other for drawers.
“Basic Node elements” and “Conveyor objects” have been used to model such lines. From Fig.
11, it follows that conveyor objects have important properties to be set by the user such as
speed, traveler capacity, and the option for accumulating or non-accumulating paths.
The drawer line has single conveyors while the bottling line has variable width conveyors,
which allow carrying from one to ten bottles in parallel (see Fig. 11).
Fig. 11. SIMIO simulation software (conveyor properties and bottle conveying line)
Several SIMIO procedures, whose logic is embedded within “Basic Nodes
elements”, were defined into the simulation model to integrate conveyors with variable carry
capacities (see Fig. 12). Each defined procedure uses a discrete distribution so that the bottles

Anales Acad. Nac. de Cs. Ex., Fís. y Nat., tomo 65 (2013): 59-79.
~ 67 ~
can be distributed on conveyors with available capacity. If one of them is above the limit of its
capacity, other one in parallel must be chosen.
Fig. 12. 2D SIMIO model (distribution processes and bottles distribution)
Drawers Combiner: On the belt conveyor of drawers, there are two combiners
which aim to join two lines into a single or reversely (see Fig. 13). The first combiner is located
after the depalletizer machine, more precisely where Control 100% is performed. The second
combiner is situated before palletizer machine and its function is to divide the belt conveyor
from the packer machine in two lines.
A set of SIMIO procedures has been defined to explicitly represent the behavior of
the two drawer combiners, as represented in Fig. 13. Since the capacities of the two conveyors
involved in the combiners are different, more drawers are taken from the largest one in order
to maintain a balance in the accumulation of the conveyors. It is worth to remark that when
one conveyor is moving, the other stops running.
Fig. 13. 2D SIMIO model (Drawers combiner) and SIMIO processes
Sensors: Under normal operating conditions, machines on the packaging line work
independently. It avoids that compatibility problems can appear when different equipments
are put together on the same packaging line. However, some issues can emerge when

Anales Acad. Nac. de Cs. Ex., Fís. y Nat., tomo 65 (2013): 59-79.
~ 68 ~
operations are not properly coordinated. As a result, equipment should be monitored
individually and a considerable time is spent in starting up and shutting down operations.
Several sensors control the number of bottles or drawers on the line. Such devices,
located on strategic points of the belt conveyors, emit signals so that conveyors or machines
can start or stop their activities. Sensors are switches that are activated or deactivated
according to whether they are in contact with the object. To represent the above behavior,
three monitors have been defined for incoming and outgoing conveyors of each machine (see
Fig. 14). If a capacity change is detected in them, the monitors trigger a process determining
the speed at which the equipment should operate. For example, if there is no accumulation in
incoming conveyors and there are drawers on the outgoing line, the unpacker machine
operates at low speed. Otherwise, if there is accumulation in the incoming conveyor, the
machine is capable of running at a higher rate. In this way, three states are defined for each
equipment: (i) stopped, (ii) low speed and (iii) high speed. A variable is used to determine the
machine state at a given time. The alternative values of this variable are: 0 (if the machine is
stopped), 1 (if the equipment is operated at low speed) or 2 (if the machine is running at high
speed).
For filling and capping machines, sensors are used to monitor their incoming
conveyors (see Fig. 14). If such lines are not full of bottles, both machines stop working. In
turn, if the accumulation table, located after the bottle inspector machine, is activated, the
filling equipment will run at a greater rate. The normal filling speed is of 550 bottles per
minute while 600 bottles per minute are filled when the machine operates at high speed.
Fig. 14. 2D SIMIO model (Unpacker machine properties and Accumulation monitor features)
and speed changes for filling and capping machine
4. Model Verification and Validation
One of the most important stages of a simulation project is the verification and
validation of the model. In this work, the verification process was carefully performed first in
order to assure that the computational model was adequately codified. Then, the validation
process was accomplished. According to [7], the goal of validation is twofold: (i) to produce a
model that represents true system behavior and (ii) to increase to an acceptable level the
credibility of the model, so that the model will be used by managers and others decision
markers. The results obtained from the validation procedure allowed to determine that the
model behavior and the simulated output data resemble the real system.
Anales Acad. Nac. de Cs. Ex., Fís. y Nat., tomo 65 (2013): 59-79.
~ 69 ~
4.1. Sensitivity Analysis
Once validation step was completed, alternatives scenarios were evaluated by
experimenting with the simulation model. The goal was to determine the potential changes for
performance improvement in existing facilities. In this way, the simulation model developed
with SIMIO was run in an experimentation mode. One or more key properties of the model
were modified to evaluate the impact on the whole system performance, mainly on the number
of processed bottles in the filling machine, which is the bottleneck asset in the packaging line.
The scenarios analyzed were as follows:
• Scenario 1 considering current system configuration.
• Scenario 2 establishing theoretical speeds of the machines with regards to line design
("V Line"). It is assured that the bottleneck asset is neither starved of material nor blocked
due to any issues upstream and downstream respectively.
• Scenario 3 combining the features present in Scenario 2 with the option of using a
drawer collector between packer and unpacker machine.
• Scenario 4 modifying Scenario 2 by changing the logic of drawer combiner located
after the depalletizing machine.
• Scenario 5 modifying Scenario 2 by increasing conveyor speeds operating in the clean
room.
Previous scenarios were defined in order to evaluate the following performance indicators:
• Filling machine efficiency: Taking into account the speed of filling machine, this
parameter is determined by dividing the real amount of bottles that were filled during the
simulation time by the number of bottles that should have been processed during the same
time.
• Effective efficiency global indicator: Taking into account the speed of palletizer ma-
chine, this indicator is computed by dividing the amount of bottles processed during the
simulation time by the theoretical number of bottles that should have been processed during
the same time.
• Occupancy rate of belt conveyors: It allows analyzing and modifying the operation of
conveyors that have a high occupancy.
• Number of pallets full of empty bottles entered to the bottling line vs. Number of
pallets full of filled bottles produced: It indicates the productivity level achieved by the
bottling line in a work shift of 8 hours.
• Changes in the speed and stability of the machines: The goal is to reduce machine
downtime.
4.2. Results
The design of packaging line is based on the concept of “V Line”. The filling
machine speed, which is the bottleneck asset, is taken as reference to define the speed of
machines located upstream and downstream. Their speeds are increased from 10% to 15%
according to distance from filling machine. It is assured that the bottleneck asset is neither
starved of material nor blocked due to any issues upstream and downstream, respectively.
Table I shows the theoretical speeds at which machines should run according to a filling
machine speed of 550 bpm while Table II gives a detailed of which are the current machine
speeds on the line. Data in Table I and II is graphically shown in Fig. 15.

Anales Acad. Nac. de Cs. Ex., Fís. y Nat., tomo 65 (2013): 59-79.
~ 70 ~
Fig. 15. “V” line with ideal and actual speeds
In addition, the productivity of packaging line is determined taking into account
the equipment efficiency. This performance indicator is calculated as shown in Eq. (1). The
theoretical number of bottles produced is derived from the filling machine speed, which is the
bottleneck stage of the packaging line.
Taking into account the production data of 3 consecutive months, Eq. (1) has been
used in order to determine of productivity efficiency of each month analyzed. The results are
presented in Table III. From this table, it follows that the packaging line has an average
efficiency of 66.77%.
It is worth to remark that when the computational model was run to quantify the
performance of packaging line, the simulation output reported a line efficiency of 66.8%. Other
performance indicators, such as the number of pallet produced by work shift and the
production rate in each machine, were considered to validate the model too. A comparison
between the historical company data and the performance measures quantified by simulation
is given in Table IV.
The inherent advantages of the simulation study are highlighted by evaluating the
alternative scenarios specified above [8]. The results obtained in each of them are described
below.

Anales Acad. Nac. de Cs. Ex., Fís. y Nat., tomo 65 (2013): 59-79.
~ 71 ~
Table I. Analysis of theoretical speeds
Machine Speeds % Capacity of
(bph) bottleneck asset
Depalletizer 43260 40
Unpacker 40170 30
Washer 35535 15
Filling 30900 0
Labeler 35535 15
Packer 40170 30
Palletizer 43260 40
Table II. Analysis of current speeds
Machines Speeds % Capacity of % Capacity of
(bph) previous machine bottleneck asset
Depalletizer 40440 -9.7 30.9
Unpacker 41820 8.9 35.3
Washer 38400 24.3 24.3
Filling 30900 0.0 0.0
Labeler 36000 16.5 16.5
Packer 38160 6.0 23.5
Palletizer 40740 6.8 31.8
Table III. Productivity Data
Amount of Bottles Produced
Month Week Current Theoretical Average Efficiency (%)
1 1 3187638 4752000 67.58
2 3079862 4752000
3 3269809 4752000
4 2985746 4752000
2 1 3082036 4752000 66.55
2 3041290 4752000
3 3424400 4752000
4 3054792 4752000
3 1 3155279 4752000 66.17
2 3069707 4752000
3 3245196 4752000
4 3108242 4752000

Anales Acad. Nac. de Cs. Ex., Fís. y Nat., tomo 65 (2013): 59-79.
~ 72 ~
Table IV. A comparison between the performance of the real system
and the simulation model
Pallets produced per shift
Real System Simulation Model
Despalletizer 283 282
Empty bottle inspector 280 278
Filling 277 275
Labeler 272 268
Packer 278 274
Palletizer 271 270
4.2.1. Results for Scenario 1
The use of simulation modeling to evaluate the current system configuration has
returned as major result that the filling machine do not maintain a continuous operation and
its speed changes over time. This is because downstream and upstream machines stops
several times during production process. Fig. 16 shows the sequence of filling machine
shutdown.
Fig. 16. Filling machine speed for Scenario 1
Besides, the use of simulation allowed to determine the level of accumulation of
drawers and bottles between each machine. For scenario 1, results show an imbalance in two
sectors of packaging line. On the one hand, there is an accumulation of bottles in the feeding-
area, more precisely in one of conveyors located between the palletizer machine and the
drawer combiner. On the other hand, a high accumulation of bottles takes place in the belt
conveyor of the clean room, located between the bottle washing machine and the empty bottle
inspector (see Fig. 17).

Anales Acad. Nac. de Cs. Ex., Fís. y Nat., tomo 65 (2013): 59-79.
~ 73 ~
Fig. 17. Bottles accumulation in clean room conveyor for Scenario 1
It is important to remark that the conveyors located between the washing
equipment and the inspector machinery should maintain a correct profile of accumulation so
that the number of shutdowns of washing machine can be reduced. However, the operation of
packaging line shows that there is a high level of accumulation of bottles in those conveyors
actually.
Besides, a high accumulation in conveyors situated before depalletizing machine
may cause that this equipment stops. Consequently, all operations upstream will be affected
too. The sequences of shutdowns for depalletizer and unpacker machines are given in Fig. 18.
Fig. 18. Stoppages of depalletizer and unpacker machines for Scenario 1

Anales Acad. Nac. de Cs. Ex., Fís. y Nat., tomo 65 (2013): 59-79.
~ 74 ~
4.2.2. Results for Scenario 2
The sequence of gearshifts in filling machine is shown in Fig. 19. From the
comparison between the original and proposed speed variations, a higher number of
shutdowns were observed in the bottleneck equipment. Hence, scenario 2 results in a lower
stability of the line, a lower efficiency level of the filling machine (61.1%) and a lower global
effective efficiency (58.4%). In turn, results show an imbalance accumulation in the conveyors
of both the clean room and the feeding area, similar to previous scenario.
In order to increase throughput and efficiency of the packaging line without having
to modify machine speeds, new alternatives from scenario 2 were proposed and their results
are detailed below.
Fig. 19. Gearshifts in filling machine
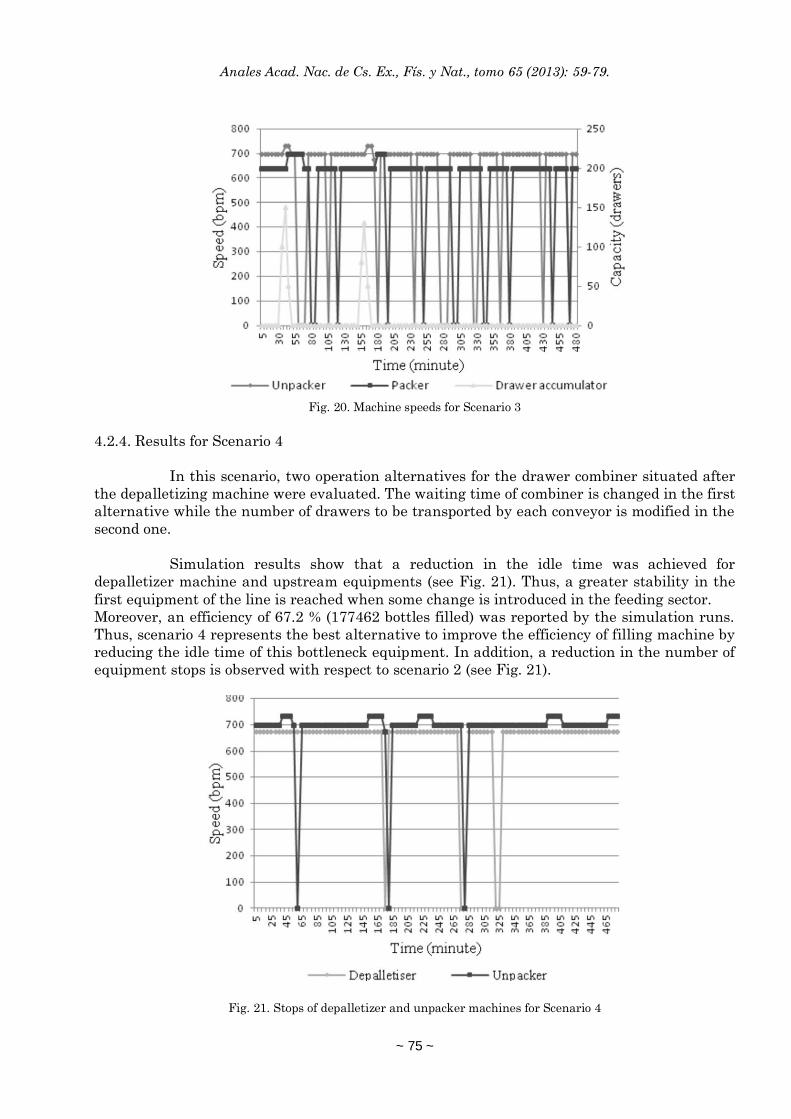
4.2.3. Results for Scenario 3
In this case, the options of incorporating a drawer accumulator and an operator
were considered in order to improvement the results of previous scenario. Three alternatives
were proposed: (i) it includes a drawer accumulator, (ii) it includes an operator, and (iii) it
considers both a drawer accumulator and an operator. For each of proposed alternatives,
simulation results were analyzed in order to determine performance improvements. If a
drawer accumulator is used, an efficiency of 61.2 is achieved. However, no significant changes
were detected in the other cases with respect to the Global Effective Efficiency Indicator.
For a work shift, the operation speeds of unpacker and packer machines are shown
in Fig. 20. From this picture, it follows that a significant reduction in the number of machine
stops is achieved by using the drawer accumulator. However, the usage of critical equipment,
the filling machine, was not upset and the amount of product palletized is maintained in
115400 bottles. This is so because the stoppage of machine is minimized by the design of
packaging line, in which there are conveyors that acts as buffer between machines.
Consequently, an investment from company is not justified because there is no impact on the
performance of the line.
Anales Acad. Nac. de Cs. Ex., Fís. y Nat., tomo 65 (2013): 59-79.
~ 75 ~
Fig. 20. Machine speeds for Scenario 3
4.2.4. Results for Scenario 4
In this scenario, two operation alternatives for the drawer combiner situated after
the depalletizing machine were evaluated. The waiting time of combiner is changed in the first
alternative while the number of drawers to be transported by each conveyor is modified in the
second one.
Simulation results show that a reduction in the idle time was achieved for
depalletizer machine and upstream equipments (see Fig. 21). Thus, a greater stability in the
first equipment of the line is reached when some change is introduced in the feeding sector.
Moreover, an efficiency of 67.2 % (177462 bottles filled) was reported by the simulation runs.
Thus, scenario 4 represents the best alternative to improve the efficiency of filling machine by
reducing the idle time of this bottleneck equipment. In addition, a reduction in the number of
equipment stops is observed with respect to scenario 2 (see Fig. 21).
Fig. 21. Stops of depalletizer and unpacker machines for Scenario 4

Anales Acad. Nac. de Cs. Ex., Fís. y Nat., tomo 65 (2013): 59-79.
~ 76 ~
4.2.5. Results for Scenario 5
This scenario evaluates the efficiency of the packaging line when the speed of
conveyors located in the clean room is increased from 5% to 50%. Simulation results show that
an important improvement in production level can be achieved when the conveyor speeds are
increased by 25%. The performance of the bottleneck machine is shown in Fig. 22. From this
picture, it follows that a growth in the stability of filling machines is achieved with regards to
scenario 2 because the number of stops of this equipment is reduced. In addition, a high
balance of bottles accumulated on the conveyor is observed (see Fig. 23). Consequently, the
utilization rate of conveyors located between the inspector and filling machine is increased.
Fig. 22. Filling machine speeds for Scenario 5
Fig. 23. Bottles accumulation on conveyors located in the clean room
4.2.6. Evaluation of Results

Anales Acad. Nac. de Cs. Ex., Fís. y Nat., tomo 65 (2013): 59-79.
~ 77 ~
Having analyzed the most relevant scenarios, the major performance indicators
reported in each of them are summarized in Table V and Table VI. Therefore, it is possible
concluding that scenario 5 achieves the highest level of efficiency in terms of the bottleneck
resource and also the highest level of overall effective efficiency. This results in a remarkable
increase in the production of a rolling line and the use of machines and transports.
From Table VI, it follows that the efficiency can be increased at least 11.3% by
introducing the proposed changes in scenario 5 to the actual configuration of the packaging
line. Such changes can be realized with minimum cost and the improvements in the operation
of the line will provide the required return on investment.
Table V. Summary of scenario results
Scenario Processed in filling Processed in bottles Processed in bottles
bottles depalletizer Palletizer
1 165059 157200 151800
2 161375 160200 154200
3 161512 162000 155400
4 177462 178800 175200
5 206200 211200 204000
Table VI. Summary of efficiency indicators
Scenario % % Effective Global
Efficiency Efficiency
1 66,8 61,4
2 61,1 58,4
3 61,2 58,9
4 67,2 66,4
5 78,1 77,3
5. Conclusions
In this paper, an innovative discrete event simulation modeling tool has been used
to quantify the performance of the main packaging line of an international beer company
located in Argentina. The work aims to evaluate alternative scenarios in order to determine
potential changes in the line configuration to maximize production and efficiency.
As main results, it has been possible to determine that the efficiency of bottleneck
asset, in this case the filling machine, and the holistic performance of the line can be improved
by optimizing machine speeds and the use of accumulators. In addition, short stops primarily
derived from simple causes can be reduced drastically by avoiding complex operations on the
machines, although there are also small stalls that can only be removed using sophisticated
methods of analysis and operations with high technical content.
According to simulation results, the productivity of the packaging line is affected
mainly by modifying the logic of conveyors belts located in the feeding area and clean room.

Anales Acad. Nac. de Cs. Ex., Fís. y Nat., tomo 65 (2013): 59-79.
~ 78 ~
Moreover, the line is sensitive to changes in machine speeds, which are operating at a speed
below the nominal speed.
It is worth to remark that for fixed values of speed and transport machines, no
investment is needed by the company, because they have the materials and labor necessary
for the modification of the same drivers. Moreover, the study remarks that not always
increasing the efficiency ratio on a particular machine line, from the reduction of a kind of
loss, produces an increased rate of holistic efficiency of the line. This is because the
relationships and interactions in the real system are complex or some degree of uncertainty is
present. The proposed model can be easily utilized and adapted to evaluate future changes in
the operation and design of the main beer packaging line of the company. This work can also
be modified to evaluate and improve the performance of beer packaging lines of other
companies.
Acknowledments
Financial support received from ANPCyT under grant PICT-2010-1073, from
CONICET under Grant PIP-940 and from UNL under Grant PI-81-481 is fully appreciated.
References
[1] A. Aguirre, V. Cafaro, C. Méndez & P. Castro, A simulation-based framework for
industrial automated wet-etch station scheduling problem in the semiconductor
industry. Proceedings of the 23th. European Modeling & Simulation Symposium
(EMSS2011) 384-393 (2011).
[2] A. Aguirre, E. Müller, S. Seffino & C. Méndez, Applying a simulation-based tool to
productivity management in an automotive-parts industry. Proceedings of the 2008
Winter Simulation Conference 1838-1846 (2008).
[3] R. E. Shannon, Simulación de Sistemas. Diseño, desarrollo e implantación, Trillas,
México, 1988.
[4] B. Kuo, Automatic Control Systems, 3rd Edit., Prentice-Hall, U.S.A., 1975.
[5] J. Banks & K. Musselman, Handbook of Simulation: Principles, Methodology,
Advances, Applications and Practice, John Wiley & Sons Edit., Inc. U.S.A., 1998.
[6] T. Naylor, J. Balintfy, D. Burdick & K. Chu, Técnicas de Simulación en Computadoras,
Editorial Limusa, México, 1991.
[7] J. Banks, J.S. Carson, B.L. Nelson & D.M. Nicol, Discrete-Event System Simulation,
4th. Edit., Prentice-Hall U.S.A., 2004.
[8] A. Law & W. D. Kelton, Simulation Modeling and Analysis, 2nd. Edit., McGrawHill,
Inc., U.S.A., 1991.
[9] M. Ross Sheldon, Introduction to Probability Models, 5th. Edit., Academic Press, N. Y.,
1993.
[10] N. Basán, L. Ramos, M. Cóccola & C. A. Méndez, Modeling, simulation and
optimization of the main packaging line of a brewing company. Proceedings of the 25th.
European Modeling and Simulation Symposium (EMSS2013) 551-560 (2013).
[11] M.F. Gleizes, G. Herrero, D.C. Cafaro, C. A. Méndez & J. Cerdá, Computer-Aided
Chemical Engineering 8, 1697 (2010).
[12] W. W. Hines & D. C. Montogomery, Probability and Statistics in Engineering and
Management Science, 3rd. Edit., Wiley, New York, 1990.
[13] R. Walpole & R. Myers, Probability and Statistics for Engineers and Scientists, 4th.
Edit., Macmillan, N.Y., 1989.

Anales Acad. Nac. de Cs. Ex., Fís. y Nat., tomo 65 (2013): 59-79.
~ 79 ~
[14] D. Kelton, R.P. Sadowski & D.T. Sturrok, Simulation With Arena, 4th Edit., McGraw-
Hill Series in Industrial Engineering and Management Science, 2006.
[15] R. Thiesing, C. Watson, J. Kirby & D. Sturrock, SIMIO Reference Guide, Version 6.0,
1990.
Manuscrito recibido el 31 de marzo de 2014.
Aceptado el 25 de abril de 2014.


![Defense-related Applications of Discrete Event Simulation · Defense-related Applications of Discrete Event Simulation. ... [Banks, 2010] Defense-related ... • Randomness in discrete](https://img.pdfslide.us/doc/110x75/5ae74c3d7f8b9a6d4f8dde4b/defense-related-applications-of-discrete-event-simulation-applications-of-discrete.jpg)