Embed Size (px)
Citation preview
An Initial Exploration of Colorado-Trained Teachers:
Providing Context for Outcomes-Based Teacher Preparation Program Evaluation
PROJECT REPORT
University of Colorado, Boulder
Jessica Alzen
Derek Briggs
Jennifer Whitcomb
University of Colorado, Denver
Carolyn Haug
Will Paterson
University of Northern Colorado
Kristin Klopfenstein
June 1, 2012

2
Acknowledgments
This project was funded by a grant from the Colorado Department of Higher Education. The
authors listed on the cover page all contributed equally to the production of this report. Special
thanks to Kimberly A. Kaufeld and Prerna Varna for their contributions to this project.
3
Contents
Overview ....................................................................................................................................................... 5
Description of Data Employed in This Study ............................................................................................... 7
Demographic Characteristics of Recently Licensed Teachers ...................................................................... 9
Placement Trends of Recently Licensed Teachers ...................................................................................... 13
School Districts Employing Recently Prepared Teachers ...................................................................... 16
Geographic Proximity of Employment and IHE Preparation Program ................................................... 21
Demographic and Achievement Characteristics of Schools Where Recently Prepared Teachers Work 30
Metro Region IHEs ............................................................................................................................. 31
IHEs Outside the Metro Region .......................................................................................................... 32
Summary ..................................................................................................................................................... 32
Recommendations ....................................................................................................................................... 33
References ................................................................................................................................................... 35
4
Tables and Figures
Table1. Colorado Institutes of Higher Education that Grant Teacher Initial Licensure 2004-2010 ............. 8
Table 2a. Demographics of Teachers with Initial Licenses Only ............................................................... 11
Table 2b. Demographics of Teachers with Added Endorsements .............................................................. 12
Table 3a. Race/Ethnicity of Teachers with Initial Licenses Only (percentages) ........................................ 14
Table 3b. Race/Ethnicity of Teachers with Initial Licenses and Added Endorsements (percentages) ....... 15
Table 4. Teacher Placement Rates (Percent of Total) ................................................................................. 17
Table 5. Top 5 Districts where IHE Candidates are Placed ........................................................................ 18
Table 6a. Percent of Teachers with Initial Licenses at Top Five Districts where Teachers are Placed ...... 19
Table 6b. Percent of Teachers with Initial Licenses and Added Endorsements at Top Five Districts where
all Teachers are Placed ................................................................................................................................ 20
Figure 1. School Districts, Regions, and IHEs……………………………...…………………………….24
Figure 2. Metro Region…………………...……………………………………………………………….25
Table 7a. 2010-2011 Student Demographics for Schools in which Recent Completers with Only an Initial
License Taught ............................................................................................................................................ 26
Table 7b. 2010-2011 Student Demographics for Schools in Which Recent Completers with Added
Endorsements Taught .................................................................................................................................. 27
Table 8a. 2010-2011 Student Achievement Indicators for Schools in Which Completers with Initial
Licenses Taught .......................................................................................................................................... 27
Table 8b. 2010-2011 Student Achievement Indicators for Schools in Which Initial Licensure Completers
with Added Endorsements Taught .............................................................................................................. 29
5
Overview
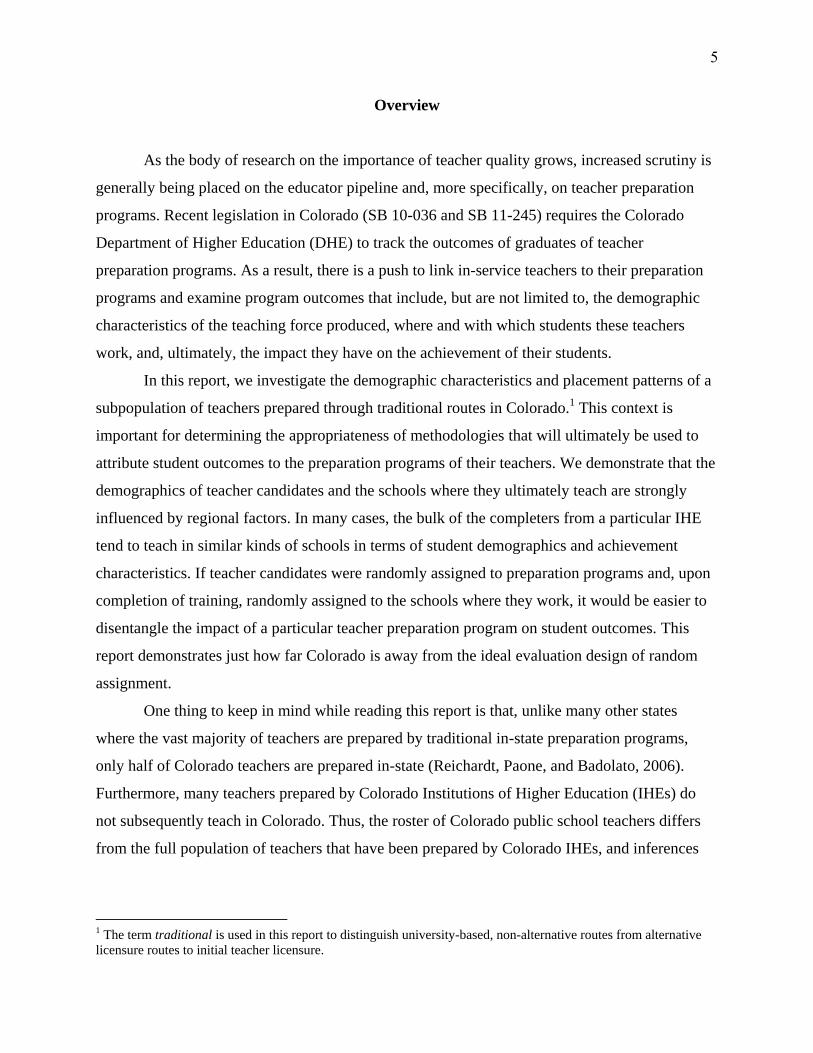
As the body of research on the importance of teacher quality grows, increased scrutiny is
generally being placed on the educator pipeline and, more specifically, on teacher preparation
programs. Recent legislation in Colorado (SB 10-036 and SB 11-245) requires the Colorado
Department of Higher Education (DHE) to track the outcomes of graduates of teacher
preparation programs. As a result, there is a push to link in-service teachers to their preparation
programs and examine program outcomes that include, but are not limited to, the demographic
characteristics of the teaching force produced, where and with which students these teachers
work, and, ultimately, the impact they have on the achievement of their students.
In this report, we investigate the demographic characteristics and placement patterns of a
subpopulation of teachers prepared through traditional routes in Colorado.1 This context is
important for determining the appropriateness of methodologies that will ultimately be used to
attribute student outcomes to the preparation programs of their teachers. We demonstrate that the
demographics of teacher candidates and the schools where they ultimately teach are strongly
influenced by regional factors. In many cases, the bulk of the completers from a particular IHE
tend to teach in similar kinds of schools in terms of student demographics and achievement
characteristics. If teacher candidates were randomly assigned to preparation programs and, upon
completion of training, randomly assigned to the schools where they work, it would be easier to
disentangle the impact of a particular teacher preparation program on student outcomes. This
report demonstrates just how far Colorado is away from the ideal evaluation design of random
assignment.
One thing to keep in mind while reading this report is that, unlike many other states
where the vast majority of teachers are prepared by traditional in-state preparation programs,
only half of Colorado teachers are prepared in-state (Reichardt, Paone, and Badolato, 2006).
Furthermore, many teachers prepared by Colorado Institutions of Higher Education (IHEs) do
not subsequently teach in Colorado. Thus, the roster of Colorado public school teachers differs
from the full population of teachers that have been prepared by Colorado IHEs, and inferences
1 The term traditional is used in this report to distinguish university-based, non-alternative routes from alternative
licensure routes to initial teacher licensure.
6
made about preparation program quality based only on the subset of teachers practicing in
Colorado may not be generalizable.
This project was taken on collaboratively by researchers from University of Colorado
Boulder, University of Colorado Denver, and University of Northern Colorado and uses data
from the Colorado Department of Education (CDE) and DHE to address the following research
questions:
1) What are the demographic characteristics of Colorado teachers who recently
received their initial teacher preparation at Colorado IHEs? How do these
demographics vary by IHE?
2) How do recent completers’ placement rates in Colorado school districts compare
across IHEs?
3) How do the K-12 schools where recent completers from Colorado IHEs are placed
differ in terms of demographic and achievement characteristics?
4) How do the answers to the prior three questions differ for recent completers who
earned initial licenses only versus those who earned an initial license with an
additional endorsement in Culturally and Linguistically Diverse (CLD) or Special
Education Generalist (SPED)?
Throughout this report, we refer to teacher preparation program “completers.” Colorado
preparation programs do not license teachers; rather, when students seek state licensure, the
programs recommend students who have completed all the necessary program requirements to be
licensed by the state. Some students who complete program requirements do not seek state
licensure for a variety of reasons, and this decision is beyond the control of the preparation
program. Because of this, we adopt the definition of “completer” employed by DHE: a
“completer” is anyone who completed an approved teacher preparation program and was eligible
to be recommended for initial teacher licensure by the state, whether they were in fact
recommended or not. This study examines a specific subset of completers--those who completed
their initial teacher licensure program between 2004 and 2010 and were active teachers in
Colorado public schools as of December 2010. Further, we also tracked recently prepared
teachers who, in addition to their initial license, completed an added endorsement in two high-
need areas, CLD and SPED, during this same time frame.
7
Description of Data Employed in This Study
In Colorado there are 18 unique IHEs where a teacher candidate can follow a traditional
teacher preparation path to become certified to teach in a K-12 public school. This report only
investigates teachers prepared through traditional teacher preparation programs and excludes
alternative preparation routes that may be affiliated with these 18 IHEs. Of these 18 IHEs, 11
offer an additional specialized endorsement as a Special Education Generalist (SPED) and 11
offer an additional endorsement in Culturally and Linguistically Diverse education (CLD).2
However, during the period examined in this study, only eight IHEs were able to verify
completers of SPED and CLD added endorsements and all discussions of endorsement
completers in this report pertain to those eight IHEs. Table 1 lists these 18 institutions and their
abbreviations for the purposes of this report. The data we analyze here were provided by the
DHE and contain human resources (HR) information from the CDE for all Colorado public
school teachers employed during the 2010-11 school year, as well as preparation information for
all teachers trained at Colorado IHEs between 2004 and 2010. The latter is collected annually by
DHE as part of the statewide Student Unit Record Data System (SURDS). We also had SURDS
degree completion reports which we referenced when teachers had affiliations with multiple
preparation programs.
There were a total of 47,594 unique licensed teachers in the HR data for 2010-11
provided to us by DHE. Of these, 6,704 (14%) teachers were also listed in the SURDS data as
enrolled in a teacher preparation program with one of the 18 IHEs in Colorado between 2004 and
2010. The Colorado-prepared subset of all Colorado teachers serves as the focal sample for this
report. We exclude from our analysis any Colorado teachers who received their teacher
preparation before 2004, received it from an alternative route, or received it in a different state.
No preparation information is available for this larger subset of Colorado teachers.
2 In the past, “Culturally and Linguistically Diverse” has been described simply as “Linguistically Diverse.” Eight
IHEs offer both special education generalist and culturally and linguistically diverse education added endorsements
and six IHEs offer one or the other, but not both.
8
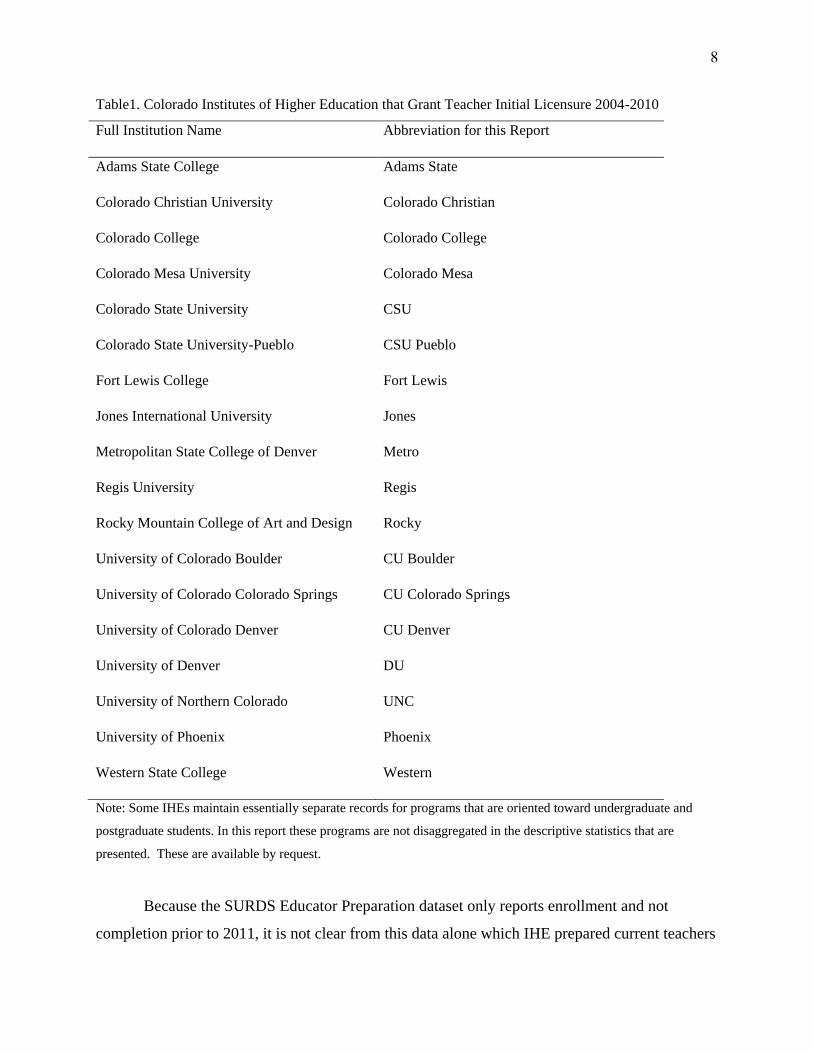
Table1. Colorado Institutes of Higher Education that Grant Teacher Initial Licensure 2004-2010
Full Institution Name Abbreviation for this Report
Adams State College Adams State
Colorado Christian University Colorado Christian
Colorado College Colorado College
Colorado Mesa University Colorado Mesa
Colorado State University CSU
Colorado State University-Pueblo CSU Pueblo
Fort Lewis College Fort Lewis
Jones International University Jones
Metropolitan State College of Denver Metro
Regis University Regis
Rocky Mountain College of Art and Design Rocky
University of Colorado Boulder CU Boulder
University of Colorado Colorado Springs CU Colorado Springs
University of Colorado Denver CU Denver
University of Denver DU
University of Northern Colorado UNC
University of Phoenix Phoenix
Western State College Western
Note: Some IHEs maintain essentially separate records for programs that are oriented toward undergraduate and
postgraduate students. In this report these programs are not disaggregated in the descriptive statistics that are
presented. These are available by request.
Because the SURDS Educator Preparation dataset only reports enrollment and not
completion prior to 2011, it is not clear from this data alone which IHE prepared current teachers
9
for initial licensure and, where applicable, additional SPED or CLD endorsements. To
investigate this more carefully, we generated rosters linking teachers with every IHE to which
they had any listed affiliation between 2004 and 2010. Representatives from each IHE then
verified initial program completers from this list of former program enrollees. Similarly,
completers of added endorsements were only attributed to an IHE if they were identified as both
an initial licensure completer and an added endorsement completer by the program. It is
important to point out that this study omits additional endorsements of individuals who
completed initial licensure at one IHE and an additional endorsement at another, as well as
individuals who received their initial licensure prior to 2004 and only an additional endorsement
since. We then used this data file to investigate the research questions previously listed on the
sample of practicing teachers who completed their training between 2004 and 2010. The
companion report, Enhancing Colorado Data Systems: Linking Teachers to Preparation
Programs, contains more detailed information about how the sample of Colorado program
completers was determined and verified.
Demographic Characteristics of Recently Licensed Teachers
Before presenting the characteristics of the subset of current Colorado public school
teachers who received their teacher preparation at a Colorado IHE from 2004-2010, we provide
summary statistics for a few key demographic variables associated with the population of
practicing teachers in the State of Colorado as a whole. According to the full CDE HR data file
from 2010-11, regardless of when and where they were prepared, Colorado teachers are on
average 43 years old with 11 years of experience and make an average base salary of $44,000 per
year. The Colorado school districts with the largest numbers of students are Jefferson County,
Denver County, Cherry Creek, Douglas County, and Adams Five Star Schools.
We underscore a limitation of this report by the variable “available years of data”
displayed in the second column of Tables 2a and 2b. As can be seen, the value of this variable
for each IHE is never higher than seven and in some cases is lower than seven. Institutions differ
in the years of verifiable data due to differences in reporting practices and internal data systems.
One institutional reporting practice that limited the study was missing social security numbers in
some years. For CDE to link human resources data to SURDS educator preparation program
10
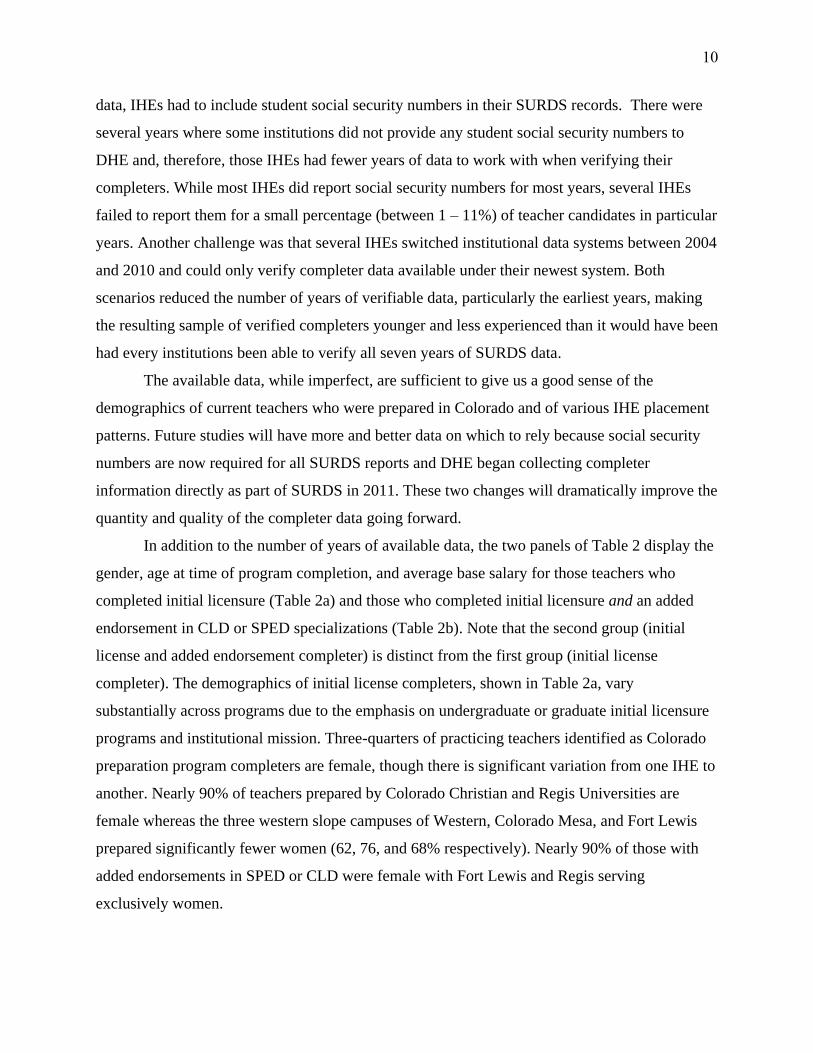
data, IHEs had to include student social security numbers in their SURDS records. There were
several years where some institutions did not provide any student social security numbers to
DHE and, therefore, those IHEs had fewer years of data to work with when verifying their
completers. While most IHEs did report social security numbers for most years, several IHEs
failed to report them for a small percentage (between 1 – 11%) of teacher candidates in particular
years. Another challenge was that several IHEs switched institutional data systems between 2004
and 2010 and could only verify completer data available under their newest system. Both
scenarios reduced the number of years of verifiable data, particularly the earliest years, making
the resulting sample of verified completers younger and less experienced than it would have been
had every institutions been able to verify all seven years of SURDS data.
The available data, while imperfect, are sufficient to give us a good sense of the
demographics of current teachers who were prepared in Colorado and of various IHE placement
patterns. Future studies will have more and better data on which to rely because social security
numbers are now required for all SURDS reports and DHE began collecting completer
information directly as part of SURDS in 2011. These two changes will dramatically improve the
quantity and quality of the completer data going forward.
In addition to the number of years of available data, the two panels of Table 2 display the
gender, age at time of program completion, and average base salary for those teachers who
completed initial licensure (Table 2a) and those who completed initial licensure and an added
endorsement in CLD or SPED specializations (Table 2b). Note that the second group (initial
license and added endorsement completer) is distinct from the first group (initial license
completer). The demographics of initial license completers, shown in Table 2a, vary
substantially across programs due to the emphasis on undergraduate or graduate initial licensure
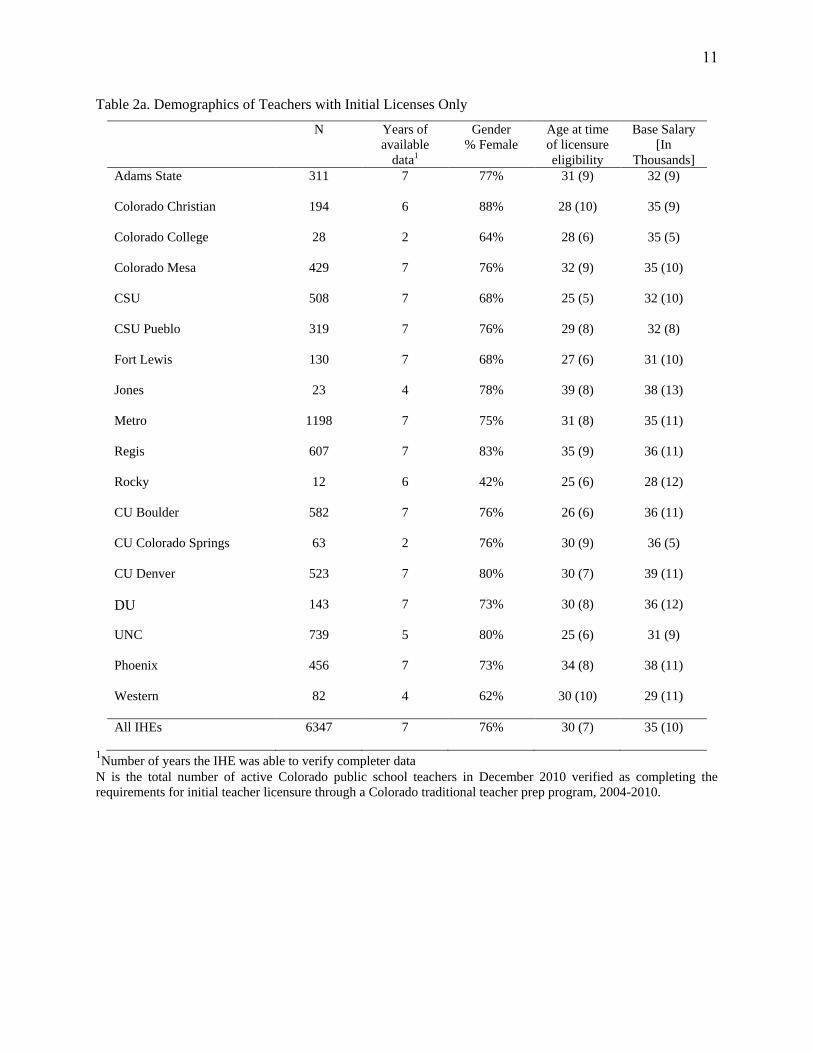
programs and institutional mission. Three-quarters of practicing teachers identified as Colorado
preparation program completers are female, though there is significant variation from one IHE to
another. Nearly 90% of teachers prepared by Colorado Christian and Regis Universities are
female whereas the three western slope campuses of Western, Colorado Mesa, and Fort Lewis
prepared significantly fewer women (62, 76, and 68% respectively). Nearly 90% of those with
added endorsements in SPED or CLD were female with Fort Lewis and Regis serving
exclusively women.
11
Table 2a. Demographics of Teachers with Initial Licenses Only
N Years of
available
data1
Gender
% Female
Age at time
of licensure
eligibility
Base Salary
[In
Thousands]
Adams State 311 7 77% 31 (9) 32 (9)
Colorado Christian 194 6 88% 28 (10) 35 (9)
Colorado College 28 2 64% 28 (6) 35 (5)
Colorado Mesa 429 7 76% 32 (9) 35 (10)
CSU 508 7 68% 25 (5) 32 (10)
CSU Pueblo 319 7 76% 29 (8) 32 (8)
Fort Lewis 130 7 68% 27 (6) 31 (10)
Jones 23 4 78% 39 (8) 38 (13)
Metro 1198 7 75% 31 (8) 35 (11)
Regis 607 7 83% 35 (9) 36 (11)
Rocky 12 6 42% 25 (6) 28 (12)
CU Boulder 582 7 76% 26 (6) 36 (11)
CU Colorado Springs 63 2 76% 30 (9) 36 (5)
CU Denver 523 7 80% 30 (7) 39 (11)
DU 143 7 73% 30 (8) 36 (12)
UNC 739 5 80% 25 (6) 31 (9)
Phoenix 456 7 73% 34 (8) 38 (11)
Western 82 4 62% 30 (10) 29 (11)
All IHEs 6347 7 76% 30 (7) 35 (10)
1Number of years the IHE was able to verify completer data
N is the total number of active Colorado public school teachers in December 2010 verified as completing the
requirements for initial teacher licensure through a Colorado traditional teacher prep program, 2004-2010.
12
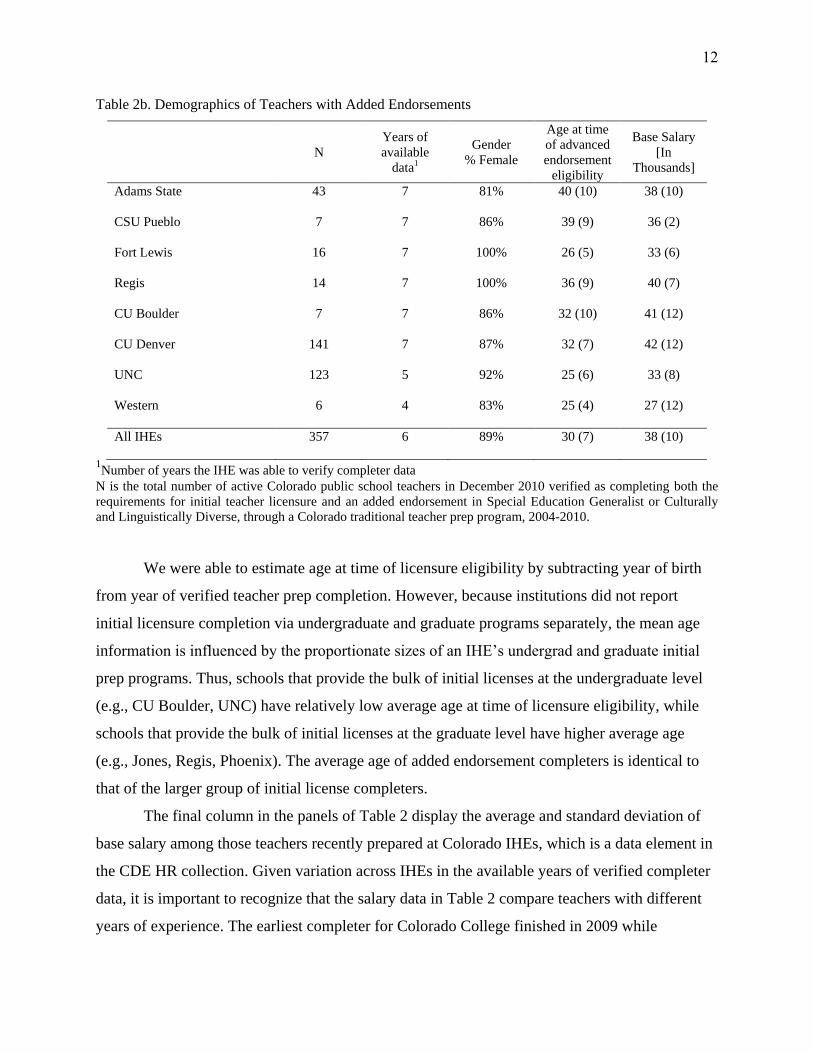
Table 2b. Demographics of Teachers with Added Endorsements
N
Years of
available
data1
Gender
% Female
Age at time
of advanced
endorsement
eligibility
Base Salary
[In
Thousands]
Adams State 43 7 81% 40 (10) 38 (10)
CSU Pueblo 7 7 86% 39 (9) 36 (2)
Fort Lewis 16 7 100% 26 (5) 33 (6)
Regis 14 7 100% 36 (9) 40 (7)
CU Boulder 7 7 86% 32 (10) 41 (12)
CU Denver 141 7 87% 32 (7) 42 (12)
UNC 123 5 92% 25 (6) 33 (8)
Western 6 4 83% 25 (4) 27 (12)
All IHEs 357 6 89% 30 (7) 38 (10)
1Number of years the IHE was able to verify completer data
N is the total number of active Colorado public school teachers in December 2010 verified as completing both the
requirements for initial teacher licensure and an added endorsement in Special Education Generalist or Culturally
and Linguistically Diverse, through a Colorado traditional teacher prep program, 2004-2010.
We were able to estimate age at time of licensure eligibility by subtracting year of birth
from year of verified teacher prep completion. However, because institutions did not report
initial licensure completion via undergraduate and graduate programs separately, the mean age
information is influenced by the proportionate sizes of an IHE’s undergrad and graduate initial
prep programs. Thus, schools that provide the bulk of initial licenses at the undergraduate level
(e.g., CU Boulder, UNC) have relatively low average age at time of licensure eligibility, while
schools that provide the bulk of initial licenses at the graduate level have higher average age
(e.g., Jones, Regis, Phoenix). The average age of added endorsement completers is identical to
that of the larger group of initial license completers.
The final column in the panels of Table 2 display the average and standard deviation of
base salary among those teachers recently prepared at Colorado IHEs, which is a data element in
the CDE HR collection. Given variation across IHEs in the available years of verified completer
data, it is important to recognize that the salary data in Table 2 compare teachers with different
years of experience. The earliest completer for Colorado College finished in 2009 while
13
completers from other institutions finished as early as 2004. This is an important consideration
given that most school districts have traditionally followed lockstep salary schedules driven by
education level and years of service.
There are a couple of notable exceptions to the lockstep salary schedule, however, that
may influence our interpretation of the average base salary information (Paone, Whitcomb, Rose
& Reichardt, 2008). Denver Public Schools and Douglas County Schools both have significant
pay-for-performance compensation systems. Thus, without more research, it is unclear whether
base salary numbers reported for teachers working in these two districts are comparable to base
salaries from districts with traditional salary schedules. Moreover, the base starting salaries vary
widely depending on regional labor markets. Those with added endorsements enjoy a relatively
higher average salary reflecting the perpetual shortage of SPED- and CLD-endorsed teachers and
the fact that a number of SPED and CLD preparation programs are embedded within master’s
degree programs, but the standard deviation ($10,000) is the same for both initial licensure and
added endorsement completers.
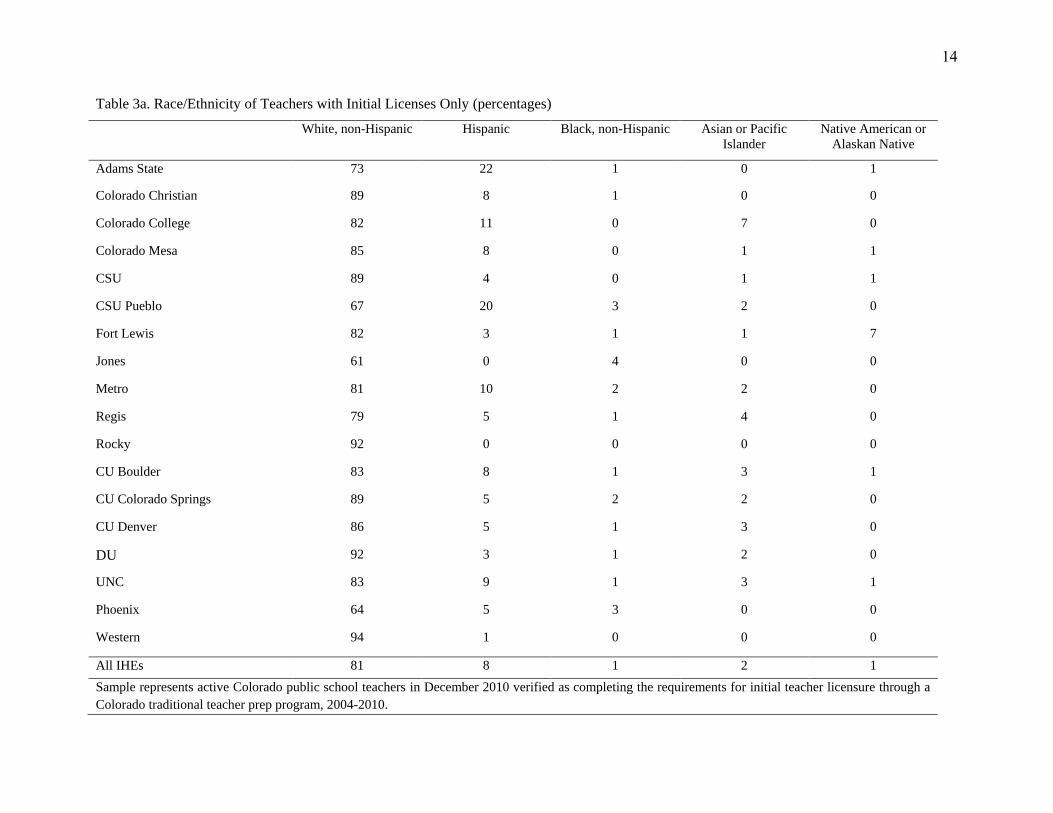
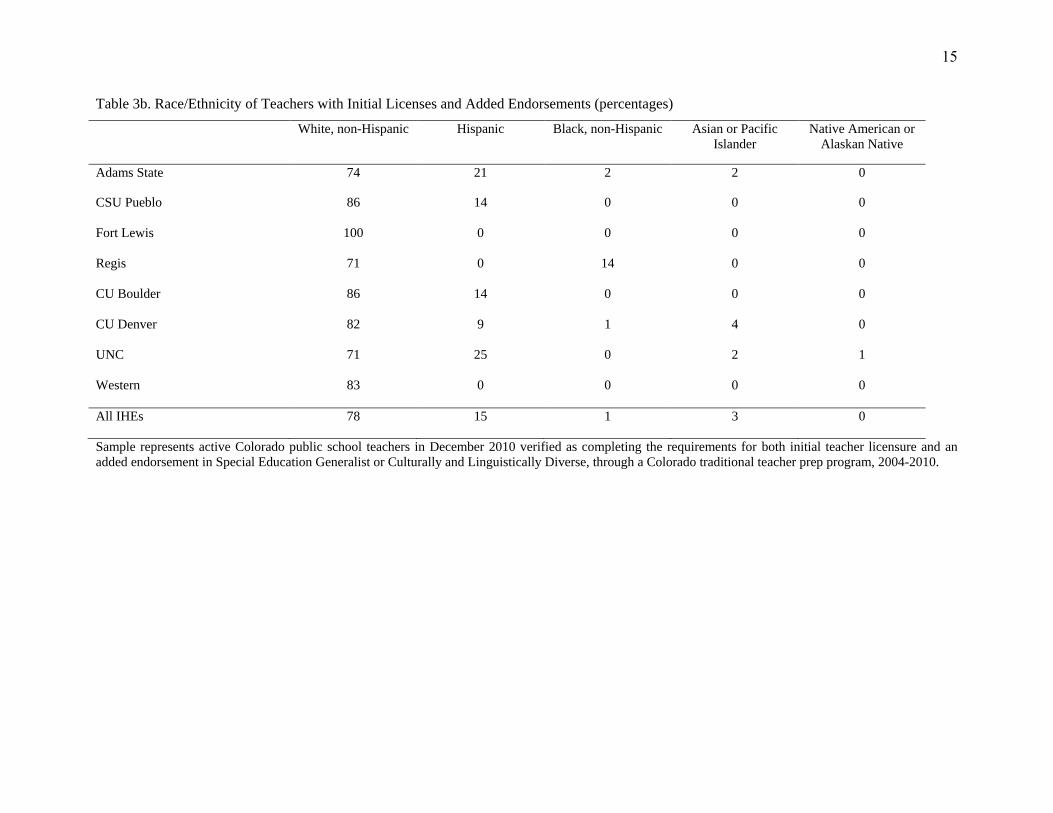
Tables 3a and 3b display the race/ethnicity distribution of teachers by prep program.
Mirroring national trends, new teachers prepared in Colorado tend to be predominantly white.
CSU Pueblo, Phoenix, Jones, and Adams State have the lowest proportion of white, non-
Hispanic completers currently teaching in Colorado public schools. There are few black, non-
Hispanic completers in our sample, and though Phoenix, Jones and CSU Pueblo show larger
proportions of black completers, the number of black students is quite small. The distribution of
IHEs preparing Hispanic teachers is nearly bimodal, with Adams State and CSU Pueblo serving
the bulk of this demographic. A similar bimodal pattern appears in Table 3b for new teachers
with added endorsements, this time with Adams State and UNC serving a disproportionate
percentage of Hispanic and Regis serving a greater number of black pre-service teachers.
Placement Trends of Recently Licensed Teachers
Teacher placement in Colorado school districts is an important outcome associated with
teacher preparation programs, an outcome that will vary not only by location of the school
district but by the demographic and achievement characteristics of the students in a given school.
14
Table 3a. Race/Ethnicity of Teachers with Initial Licenses Only (percentages)
White, non-Hispanic Hispanic Black, non-Hispanic Asian or Pacific
Islander
Native American or
Alaskan Native
Adams State 73 22 1 0 1
Colorado Christian 89 8 1 0 0
Colorado College 82 11 0 7 0
Colorado Mesa 85 8 0 1 1
CSU 89 4 0 1 1
CSU Pueblo 67 20 3 2 0
Fort Lewis 82 3 1 1 7
Jones 61 0 4 0 0
Metro 81 10 2 2 0
Regis 79 5 1 4 0
Rocky 92 0 0 0 0
CU Boulder 83 8 1 3 1
CU Colorado Springs 89 5 2 2 0
CU Denver 86 5 1 3 0
DU 92 3 1 2 0
UNC 83 9 1 3 1
Phoenix 64 5 3 0 0
Western 94 1 0 0 0
All IHEs 81 8 1 2 1
Sample represents active Colorado public school teachers in December 2010 verified as completing the requirements for initial teacher licensure through a
Colorado traditional teacher prep program, 2004-2010.
15
Table 3b. Race/Ethnicity of Teachers with Initial Licenses and Added Endorsements (percentages)
White, non-Hispanic Hispanic Black, non-Hispanic Asian or Pacific
Islander
Native American or
Alaskan Native
Adams State 74 21 2 2 0
CSU Pueblo 86 14 0 0 0
Fort Lewis 100 0 0 0 0
Regis 71 0 14 0 0
CU Boulder 86 14 0 0 0
CU Denver 82 9 1 4 0
UNC 71 25 0 2 1
Western 83 0 0 0 0
All IHEs 78 15 1 3 0
Sample represents active Colorado public school teachers in December 2010 verified as completing the requirements for both initial teacher licensure and an
added endorsement in Special Education Generalist or Culturally and Linguistically Diverse, through a Colorado traditional teacher prep program, 2004-2010.
16
School Districts Employing Recently Prepared Teachers
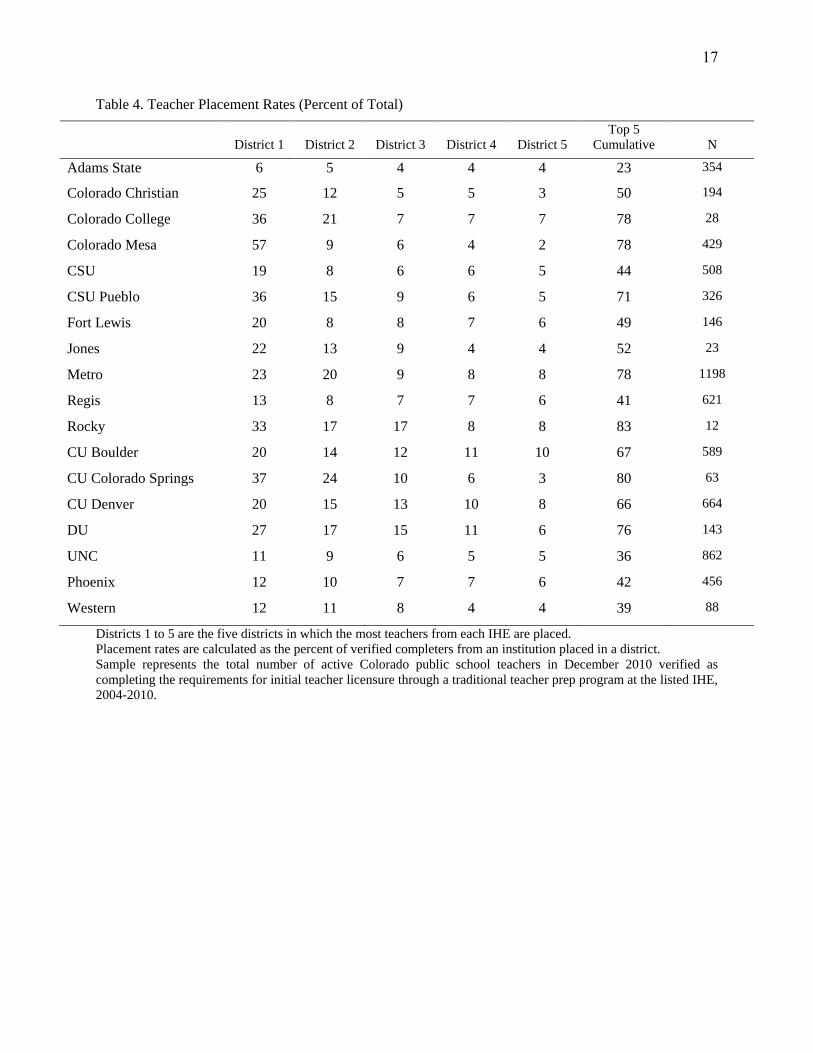
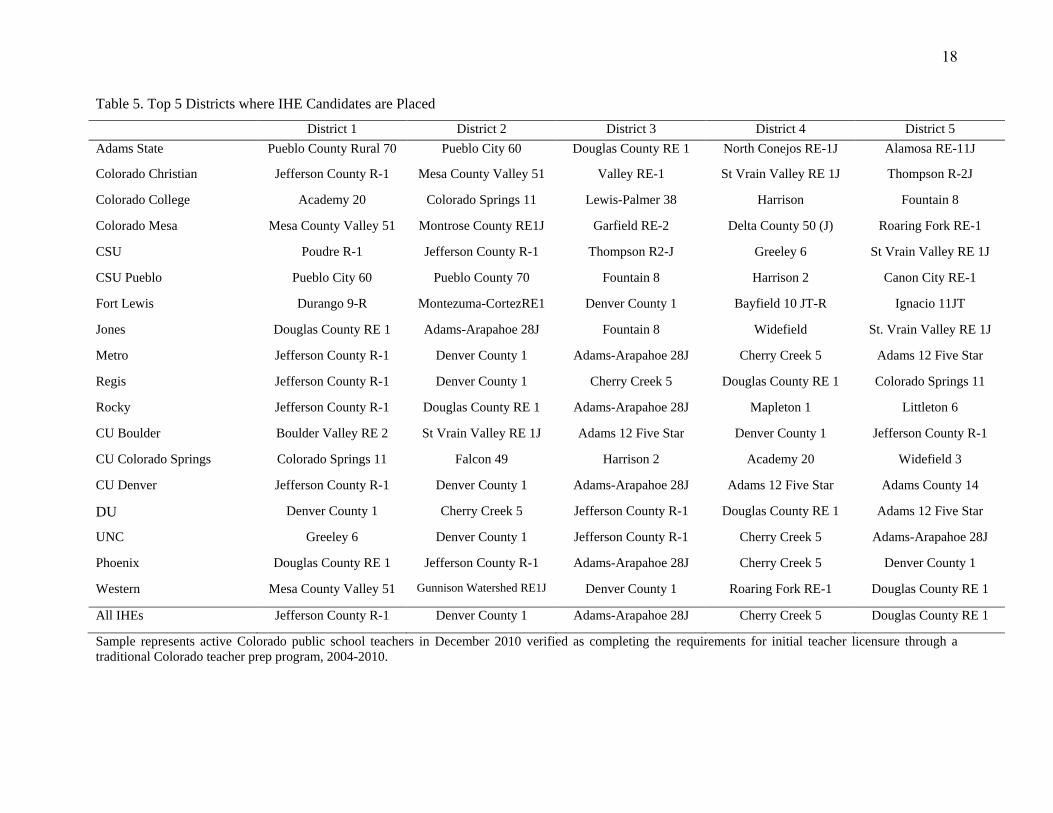
For many IHEs, completers teach in a concentrated set of school districts. Tables 4 and 5
describe the placement patterns for each IHE. Table 4 indicates, for each IHE, the proportions of
completers between 2004 and 2010 that have been placed into the top five feeder school districts
in Colorado. Table 5 serves as a key to indicate the identity of these top five districts unique to
each IHE. For example, the information in these two tables demonstrates how Metro and UNC,
the two IHEs that prepare the largest number of teachers in the state, have very different
employment patterns. For example, Table 5 indicates that the top five placement districts for
Metro employ 78% of Metro’s 1,198 verified initial licensure completers who stay in Colorado.
Table 6 indicates that the district attracting the largest proportion of Metro completers is
Jefferson County with 23%. In contrast, Table 5 indicates that UNC’s 862 verified completers
tend to be dispersed across many more school districts. The top five school districts employing
UNC completers represent only 36% of the total, and the district employing that largest
proportion of these completers is Greeley (where UNC is located) with 11%.
Statewide, it is not surprising that the top five most common placement areas across all
IHEs are where demand for new teachers is greatest: the state’s largest school districts.
Specifically, these top employers are Jefferson County, Denver County, Adams-Arapahoe 28J
(Aurora Public Schools), Cherry Creek, and Douglas County. When focusing only on IHEs that
placed at least 300 teachers in Colorado schools between 2004 and 2010 (i.e., the top 10
producers of new teachers), the most frequent placement areas are the same, though in a slightly
different order, and include Jefferson County, Denver County, Douglas County, Adams-
Arapahoe 28J (Aurora Public Schools), and Cherry Creek.
17
Table 4. Teacher Placement Rates (Percent of Total)
District 1
District 2
District 3
District 4
District 5
Top 5
Cumulative
N
Adams State 6 5 4 4 4 23 354
Colorado Christian 25 12 5 5 3 50 194
Colorado College 36 21 7 7 7 78 28
Colorado Mesa 57 9 6 4 2 78 429
CSU 19 8 6 6 5 44 508
CSU Pueblo 36 15 9 6 5 71 326
Fort Lewis 20 8 8 7 6 49 146
Jones 22 13 9 4 4 52 23
Metro 23 20 9 8 8 78 1198
Regis 13 8 7 7 6 41 621
Rocky 33 17 17 8 8 83 12
CU Boulder 20 14 12 11 10 67 589
CU Colorado Springs 37 24 10 6 3 80 63
CU Denver 20 15 13 10 8 66 664
DU 27 17 15 11 6 76 143
UNC 11 9 6 5 5 36 862
Phoenix 12 10 7 7 6 42 456
Western 12 11 8 4 4 39 88
Districts 1 to 5 are the five districts in which the most teachers from each IHE are placed.
Placement rates are calculated as the percent of verified completers from an institution placed in a district.
Sample represents the total number of active Colorado public school teachers in December 2010 verified as
completing the requirements for initial teacher licensure through a traditional teacher prep program at the listed IHE,
2004-2010.
18
Table 5. Top 5 Districts where IHE Candidates are Placed
District 1 District 2 District 3 District 4 District 5
Adams State Pueblo County Rural 70 Pueblo City 60 Douglas County RE 1 North Conejos RE-1J Alamosa RE-11J
Colorado Christian Jefferson County R-1 Mesa County Valley 51 Valley RE-1 St Vrain Valley RE 1J Thompson R-2J
Colorado College Academy 20 Colorado Springs 11 Lewis-Palmer 38 Harrison Fountain 8
Colorado Mesa Mesa County Valley 51 Montrose County RE1J Garfield RE-2 Delta County 50 (J) Roaring Fork RE-1
CSU Poudre R-1 Jefferson County R-1 Thompson R2-J Greeley 6 St Vrain Valley RE 1J
CSU Pueblo Pueblo City 60 Pueblo County 70 Fountain 8 Harrison 2 Canon City RE-1
Fort Lewis Durango 9-R Montezuma-CortezRE1 Denver County 1 Bayfield 10 JT-R Ignacio 11JT
Jones Douglas County RE 1 Adams-Arapahoe 28J Fountain 8 Widefield St. Vrain Valley RE 1J
Metro Jefferson County R-1 Denver County 1 Adams-Arapahoe 28J Cherry Creek 5 Adams 12 Five Star
Regis Jefferson County R-1 Denver County 1 Cherry Creek 5 Douglas County RE 1 Colorado Springs 11
Rocky Jefferson County R-1 Douglas County RE 1 Adams-Arapahoe 28J Mapleton 1 Littleton 6
CU Boulder Boulder Valley RE 2 St Vrain Valley RE 1J Adams 12 Five Star Denver County 1 Jefferson County R-1
CU Colorado Springs Colorado Springs 11 Falcon 49 Harrison 2 Academy 20 Widefield 3
CU Denver Jefferson County R-1 Denver County 1 Adams-Arapahoe 28J Adams 12 Five Star Adams County 14
DU Denver County 1 Cherry Creek 5 Jefferson County R-1 Douglas County RE 1 Adams 12 Five Star
UNC Greeley 6 Denver County 1 Jefferson County R-1 Cherry Creek 5 Adams-Arapahoe 28J
Phoenix Douglas County RE 1 Jefferson County R-1 Adams-Arapahoe 28J Cherry Creek 5 Denver County 1
Western Mesa County Valley 51 Gunnison Watershed RE1J Denver County 1 Roaring Fork RE-1 Douglas County RE 1
All IHEs Jefferson County R-1 Denver County 1 Adams-Arapahoe 28J Cherry Creek 5 Douglas County RE 1
Sample represents active Colorado public school teachers in December 2010 verified as completing the requirements for initial teacher licensure through a
traditional Colorado teacher prep program, 2004-2010.
19
Table 6a. Percent of Teachers with Initial Licenses at Top Five Districts where Teachers are Placed
District 1 District 2 District 3 District 4 District 5 Top 5 Cumulative
Adams State 5 5 5 5 4 24
Colorado Christian 25 12 5 5 3 50
Colorado College 36 21 7 7 7 78
Colorado Mesa 57 9 6 4 2 78
CSU 19 8 6 6 5 44
CSU Pueblo 36 14 9 6 5 70
Fort Lewis 19 8 8 7 7 49
Jones 22 13 9 4 4 52
Metro 23 20 9 8 8 68
Regis 13 8 7 7 6 41
Rocky 33 17 17 8 8 93
CU Boulder 20 14 11 11 10 66
CU Colorado Springs 37 24 10 6 3 80
CU Denver 19 14 13 12 9 67
DU 27 17 15 11 6 76
UNC 12 9 6 4 4 35
Phoenix 12 10 7 7 6 42
Western 12 12 7 5 5 41
All IHEs 12 10 5 5 5 37
Districts 1 to 5 are the five districts in which the most teachers from each IHE are placed as reported in Table 5.
Sample represents active Colorado public school teachers in December 2010 verified as completing the requirements for initial teacher licensure through a
traditional Colorado teacher prep program, 2004-2010.
20
Table 6b. Percent of Teachers with Initial Licenses and Added Endorsements at Top Five Districts where all Teachers are Placed
District 1 District 2
District 3 District 4 District 5 Top 5 Cumulative
Adams State 16 12 12 9 7 56
CSU Pueblo 43 14 14 14 0 85
Fort Lewis 25 12 6 6 6 55
Regis 21 7 21 0 0 49
CU Boulder 29 29 29 14 0 100
CU Denver 26 18 11 7 5 67
UNC 11 11 9 6 5 42
Western 17 17 17 17 17 85
All IHEs 13 12 7 6 3 41
Districts 1 to 5 are the five districts in which the most teachers from each IHE are placed as reported in Table 5.
Sample represents active Colorado public school teachers in December 2010 verified as completing the requirements for both initial teacher licensure and an
added endorsement in Special Education Generalist or Culturally and Linguistically Diverse, through a Colorado traditional teacher prep program, 2004-2010.
21
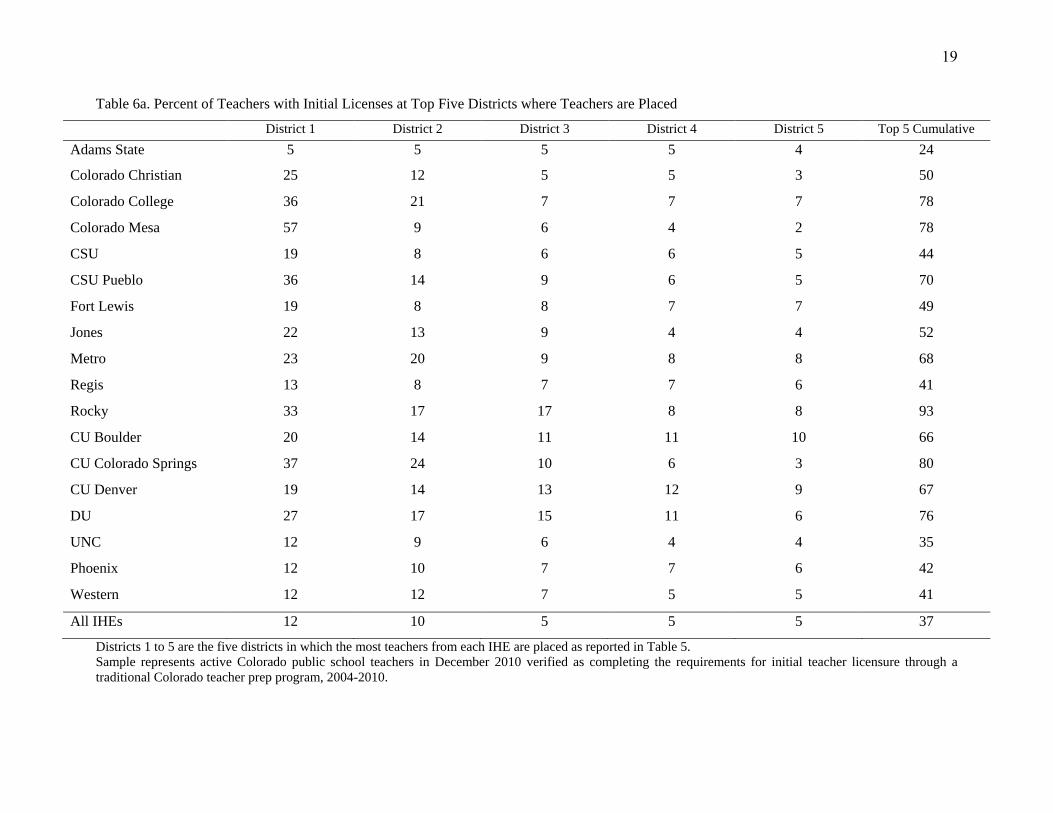
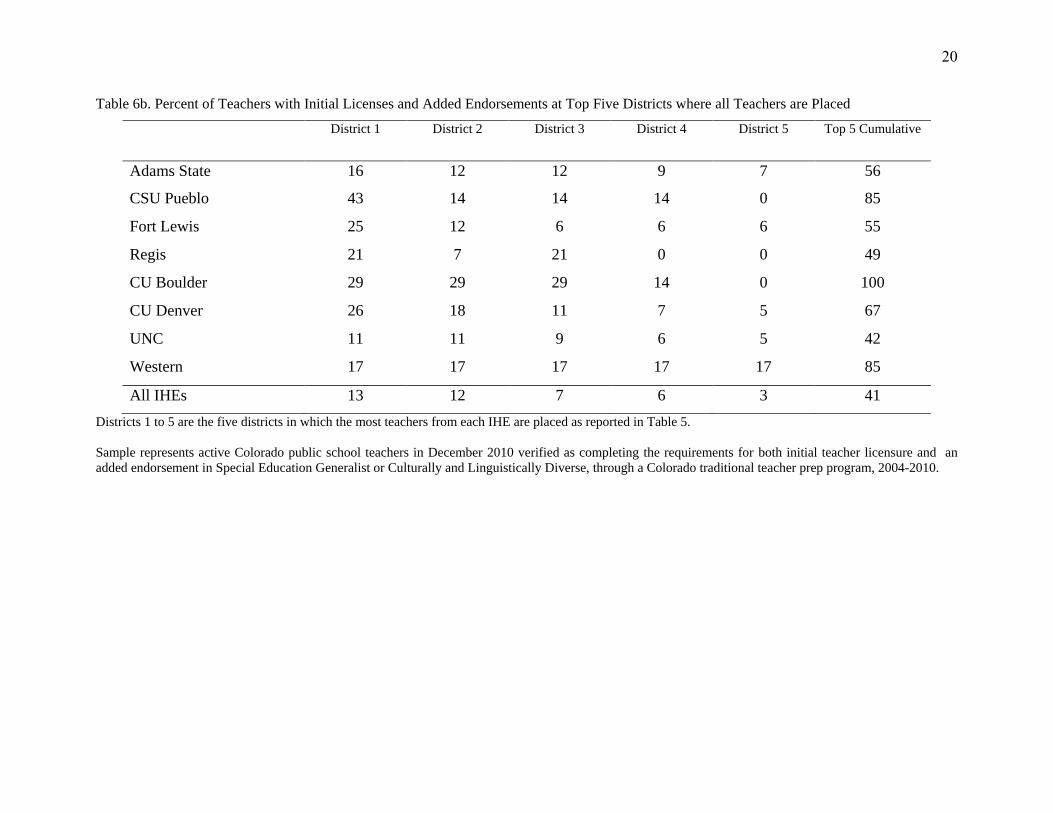
Table 6a and 6b report the percentage of each IHE’s verified completers employed at the
top five districts listed in Table 5. Table 6a focuses on placement patterns for completers with
initial licenses only and Table 6b on teachers earning both an initial license and an added
endorsement in CLD or SPED. Comparing these two tables reveals that the placement patterns
for teachers with added endorsements is not the same as it is for newly prepared teachers. For
example, 5% of initial-only endorsements from Adams State teach at Pueblo County Rural, but
16% of Adams State’s initial plus added endorsements teach there. The extent of this difference
varies across IHEs, however: 15% of completers with initial plus additional endorsements from
CSU Pueblo work in districts other than the five listed in Table 5, while 51% of such completers
from Regis do so.
An emergent pattern is that half of the IHEs place a majority of their new teachers in a
few school districts. Nine IHEs supply 2/3 or more of their new teachers to a concentrated set of
five districts, though not necessarily the same five districts. For example, 80% of teachers
finishing their licensure program at CU Colorado Springs take teaching positions in Colorado
Springs District 11, Falcon, Harrison, Academy, or Widefield school districts. The pattern holds
true for those who prepare small and large numbers of new teachers each year, public and private
IHEs. Of the nine IHEs with the pattern of producing teachers for a concentrated set of school
districts, three are private (33%), which is roughly proportionate to the number of private IHEs
in the state (39%).
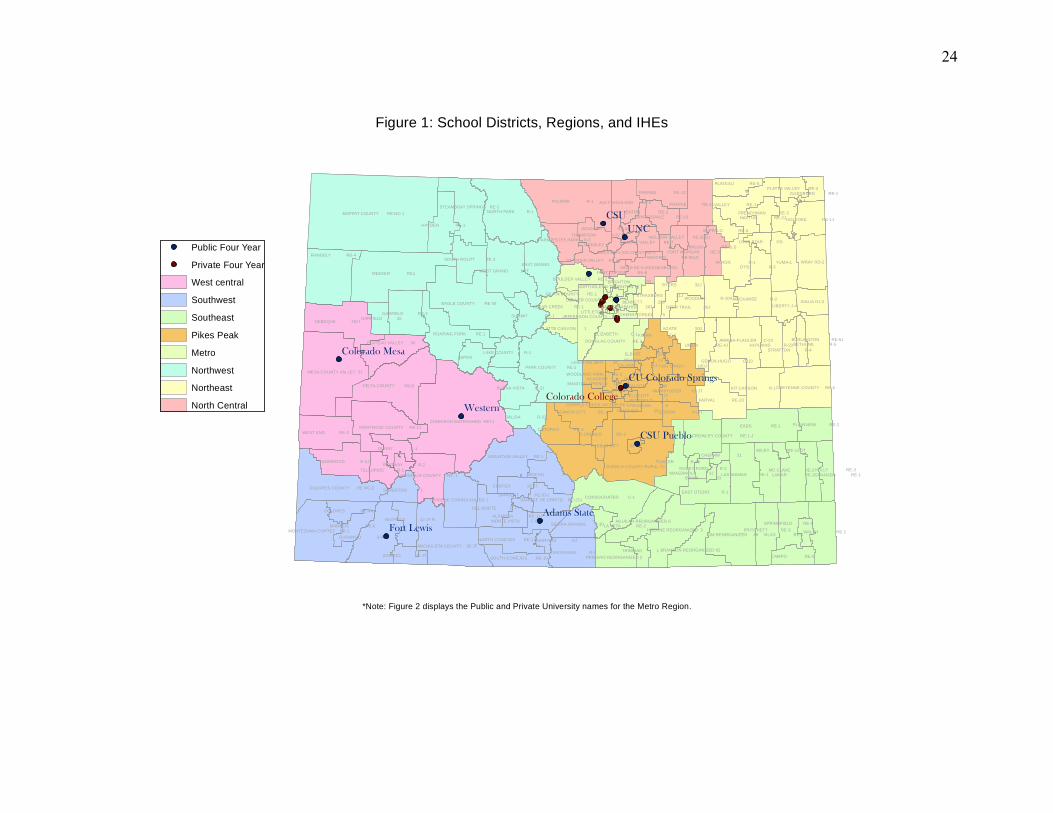
Geographic Proximity of Employment and IHE Preparation Program
Many of the differences in observed placement patterns across IHEs may be due to
differences in population density and district size in the communities surrounding the
institutions. Using CDE’s assignment of each school district in the state to one of eight official
regions, it is possible to analyze the extent to which licensure completers take teaching positions
in the region in which they were prepared. The maps in Figures 1-2 display the location of each
IHE in relation to each region and its school districts.
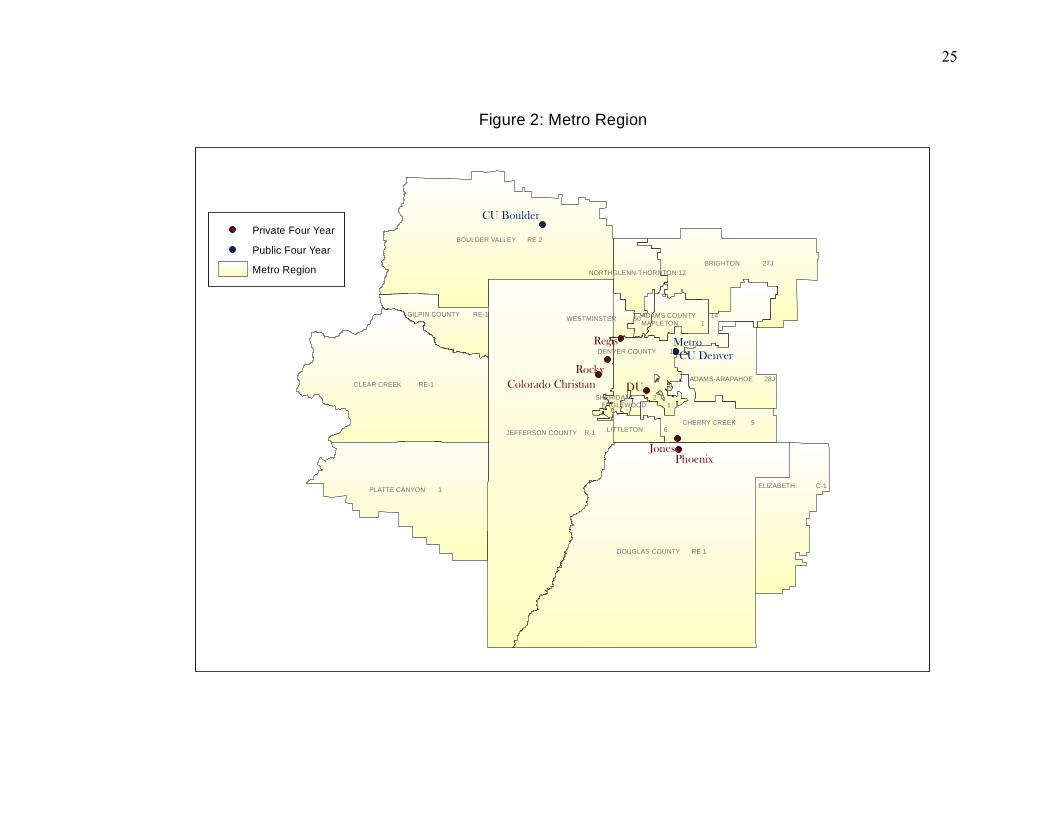
IHEs in the Metro Region, magnified in Figure 2, prepare teachers who most commonly
take positions in the Metro Region as opposed to teaching in other parts of Colorado. An
exception to this is Colorado Christian. However, Colorado Christian has several campuses and
22
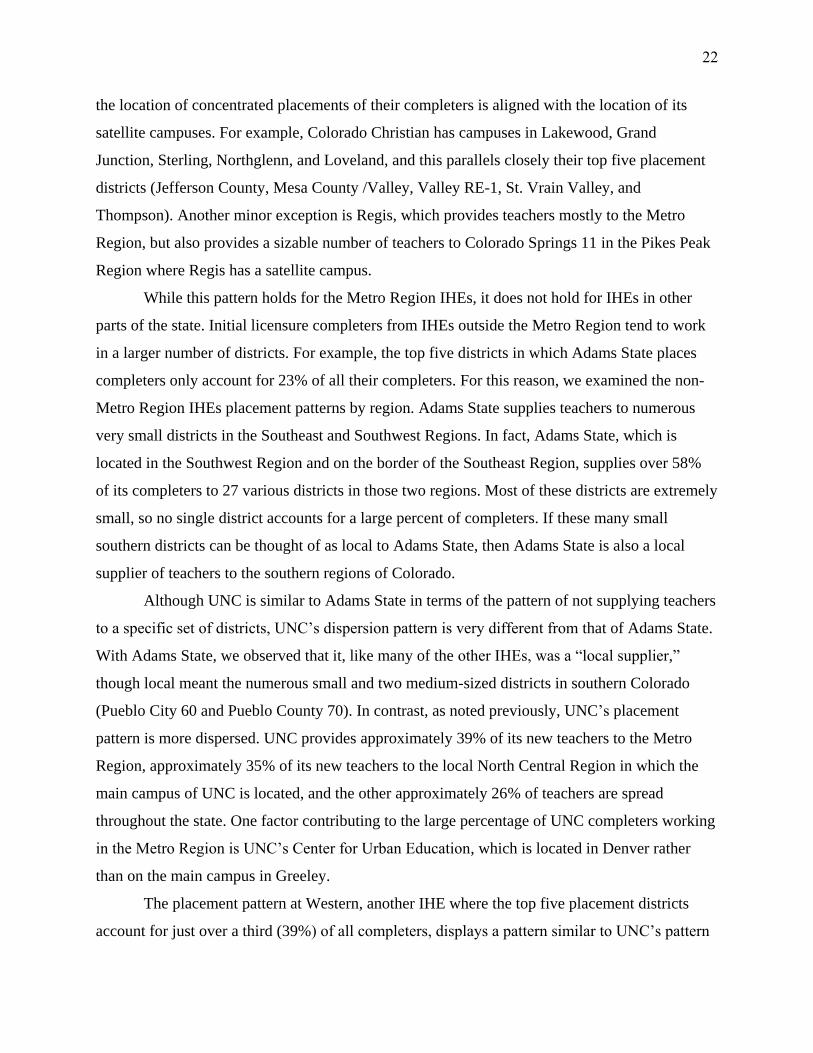
the location of concentrated placements of their completers is aligned with the location of its
satellite campuses. For example, Colorado Christian has campuses in Lakewood, Grand
Junction, Sterling, Northglenn, and Loveland, and this parallels closely their top five placement
districts (Jefferson County, Mesa County /Valley, Valley RE-1, St. Vrain Valley, and
Thompson). Another minor exception is Regis, which provides teachers mostly to the Metro
Region, but also provides a sizable number of teachers to Colorado Springs 11 in the Pikes Peak
Region where Regis has a satellite campus.
While this pattern holds for the Metro Region IHEs, it does not hold for IHEs in other
parts of the state. Initial licensure completers from IHEs outside the Metro Region tend to work
in a larger number of districts. For example, the top five districts in which Adams State places
completers only account for 23% of all their completers. For this reason, we examined the non-
Metro Region IHEs placement patterns by region. Adams State supplies teachers to numerous
very small districts in the Southeast and Southwest Regions. In fact, Adams State, which is
located in the Southwest Region and on the border of the Southeast Region, supplies over 58%
of its completers to 27 various districts in those two regions. Most of these districts are extremely
small, so no single district accounts for a large percent of completers. If these many small
southern districts can be thought of as local to Adams State, then Adams State is also a local
supplier of teachers to the southern regions of Colorado.
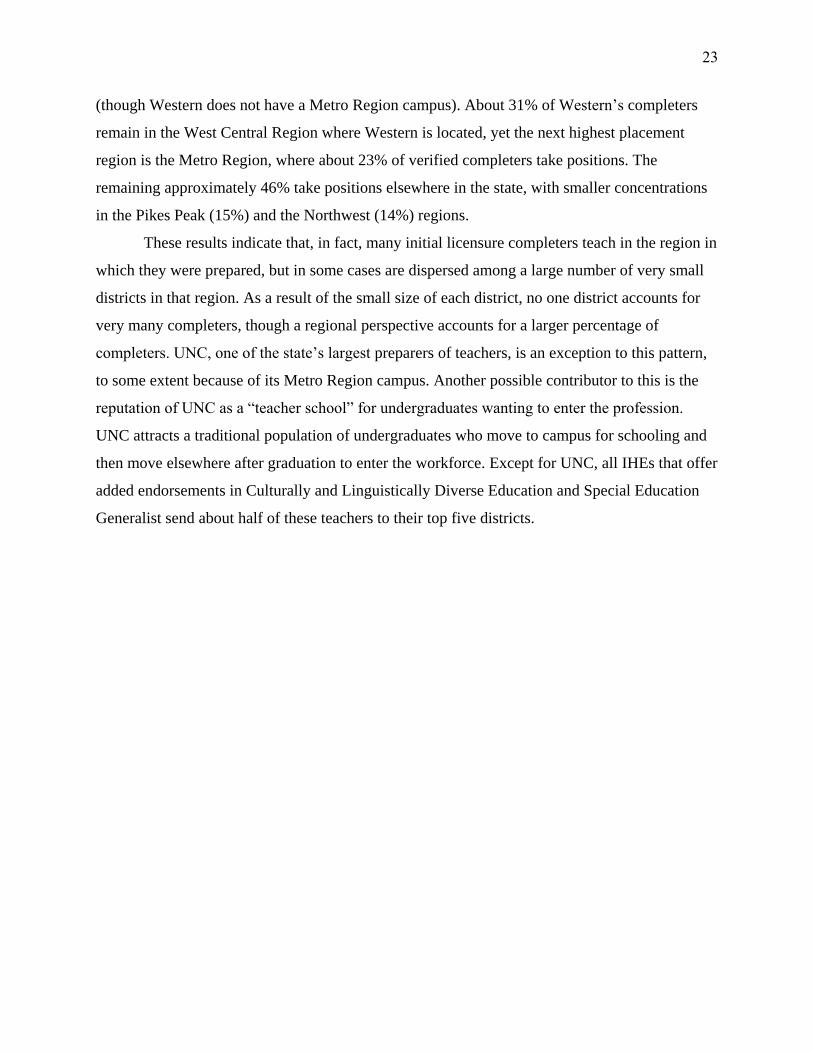
Although UNC is similar to Adams State in terms of the pattern of not supplying teachers
to a specific set of districts, UNC’s dispersion pattern is very different from that of Adams State.
With Adams State, we observed that it, like many of the other IHEs, was a “local supplier,”
though local meant the numerous small and two medium-sized districts in southern Colorado
(Pueblo City 60 and Pueblo County 70). In contrast, as noted previously, UNC’s placement
pattern is more dispersed. UNC provides approximately 39% of its new teachers to the Metro
Region, approximately 35% of its new teachers to the local North Central Region in which the
main campus of UNC is located, and the other approximately 26% of teachers are spread
throughout the state. One factor contributing to the large percentage of UNC completers working
in the Metro Region is UNC’s Center for Urban Education, which is located in Denver rather
than on the main campus in Greeley.
The placement pattern at Western, another IHE where the top five placement districts
account for just over a third (39%) of all completers, displays a pattern similar to UNC’s pattern
23
(though Western does not have a Metro Region campus). About 31% of Western’s completers
remain in the West Central Region where Western is located, yet the next highest placement
region is the Metro Region, where about 23% of verified completers take positions. The
remaining approximately 46% take positions elsewhere in the state, with smaller concentrations
in the Pikes Peak (15%) and the Northwest (14%) regions.
These results indicate that, in fact, many initial licensure completers teach in the region in
which they were prepared, but in some cases are dispersed among a large number of very small
districts in that region. As a result of the small size of each district, no one district accounts for
very many completers, though a regional perspective accounts for a larger percentage of
completers. UNC, one of the state’s largest preparers of teachers, is an exception to this pattern,
to some extent because of its Metro Region campus. Another possible contributor to this is the
reputation of UNC as a “teacher school” for undergraduates wanting to enter the profession.
UNC attracts a traditional population of undergraduates who move to campus for schooling and
then move elsewhere after graduation to enter the workforce. Except for UNC, all IHEs that offer
added endorsements in Culturally and Linguistically Diverse Education and Special Education
Generalist send about half of these teachers to their top five districts.
24
Colorado College
UNC
CSU
Western
Fort Lewis
CSU Pueblo
Adams State
Colorado Mesa
CU Colorado Springs
MOFFAT COUNTY RE:NO 1
GUNNISON WATERSHED RE1J
YUMA-1
MEEKER RE1
POUDRE R-1
MESA COUNTY VALLEY 51PARK COUNTY RE-2
EAGLE COUNTY RE 50
NORTH PARK R-1
DELTA COUNTY 50(J)
WRAY RD-2
PUEBLO COUNTY RURAL 70
EADS RE-1
RANGELY RE-4
CONSOLIDATED C-1
ARCHULETA COUNTY 50 JT
MOUNTAIN VALLEY RE 1
DEBEQUE 49JT
ROARING FORK RE-1
DOLORES COUNTY RE NO.2
VALLEY RE-1
WEST END RE-2
MONTROSE COUNTY RE-1J
KARVAL RE-23
IDALIA RJ-3
NORWOOD R-2J
EAST OTERO R-1
LIBERTY J-4
CANON CITY RE-1
PAWNEE RE-12
AGATE 300
SOUTH CONEJOS RE-10
PLATEAU RE-5
KIM REORGANIZED 88DURANGO 9-R
WEST GRAND 1-JT.
MONTEZUMA-CORTEZ RE-1 HOEHNE REORGANIZED 3
EAST GRAND 2
LAS ANIMAS RE-1
CHEYENNE COUNTY RE-5
WALSH RE-1
GARFIELD RE-2
STEAMBOAT SPRINGS RE-2
PLATEAU VALLEY 50
GENOA-HUGO C113
AKRON R-1
LAMAR RE-2MOFFAT 2
KIT CARSON R-1
CREEDE CONSOLIDATED 1
HAYDEN RE-1
DOUGLAS COUNTY RE 1
FOWLER R-4J
PRAIRIE RE-11
CENTENNIAL R-1
HINSDALE COUNTY RE. 1
ARICKAREE R-2
BUENA VISTA R-31
MC CLAVE RE-2
PRITCHETT RE-3
JEFFERSON COUNTY R-1
ARRIBA-FLAGLER C-20
DEL NORTE C-7
WOODLIN R-104
AGUILAR REORGANIZED 6
HI-PLAINS R-23
PLAINVIEW RE-2
ASPEN 1
CROWLEY COUNTY RE-1-J
SUMMIT RE-1
BRANSON REORGANIZED 82
BYERS 32J
BIG SANDY 100J
BURLINGTON RE-6J
SPRINGFIELD RE-4
SOUTH ROUTT RE 3
SALIDA R-32
NORTH CONEJOS RE-1J
COTOPAXI RE-3
HOLYOKE RE-1J
HOLLY RE-3
SIERRA GRANDE R-30
AULT-HIGHLAND RE-9
GRANADA RE-1
SILVERTON 1
PARK (ESTES PARK) R-3
FORT MORGAN RE-3
LIMON RE-4J
BRUSH RE-2(J)
PRIMERO REORGANIZED 2
BOULDER VALLEY RE 2
CAMPO RE-6
OTIS R-3
OURAY R-1
KIOWA C-2
BAYFIELD 10 JT-R
WELD RE-3 (KEENESBURG)
MIAMI/YODER 60 JT
DEER TRAIL 26J
HAXTUN RE-2J
THOMPSON R-2J
LAKE COUNTY R-1
TELLURIDE R-1
MANCOS RE-6
FLORENCE RE-2
CLEAR CREEK RE-1
STRATTON R-4
DOLORES RE-4A
GARFIELD 16
EDISON 54 JT
BRIGGSDALE RE-10
SANGRE DE CRISTO RE-22J
ST. VRAIN VALLEY RE 1J
CENTER 26 JT.
WIGGINS RE-50(J)
BENNETT 29J
PLATTE CANYON 1
TRINIDAD 1
ALAMOSA RE-11J
FRENCHMAN RE-3
HANOVER 28
IGNACIO 11 JT
BUFFALO RE-4
ELLICOTT 22
BETHUNE R-5
PLATTE VALLEY RE-7
PLATTE VALLEY RE-3
EATON RE-2
WOODLAND PARK RE-2
LA VETA RE-2
CALHAN RJ-1
JULESBURG RE-1
STRASBURG 31J
BRIGHTON 27J
MONTE VISTA C-8
VILAS RE-5
LONE STAR 101
CRIPPLE CREEK-VICTOR RE-1FOUNTAIN 8
ELIZABETH C-1
RIDGWAY R-2
SANFORD 6J
FALCON 49
ELBERT 200
CHERAW 31
DENVER COUNTY 1
WELDON VALLEY RE-20(J)
ACADEMY 20
WELD RE-1 (GILCREST)RE-1
ROCKY FORD R-2
PEYTON 23 JTLEWIS-PALMER 38
CHERRY CREEK 5
SARGENT RE-33J
WINDSOR RE-4
PUEBLO CITY 60
MANZANOLA 3J
ADAMS-ARAPAHOE 28J
FORT LUPTON RE-8
GREELEY 6
WILEY RE-13 JT
SWINK 33
MANITOU SPRINGS 14
GILPIN COUNTY RE-1
WIDEFIELD 3
NORTHGLENN-THORNTON 12
LITTLETON 6
Public Four Year
Private Four Year
West central
Southwest
Southeast
Pikes Peak
Metro
Northwest
Northeast
North Central
Figure 1: School Districts, Regions, and IHEs
*Note: Figure 2 displays the Public and Private University names for the Metro Region.
25
DOUGLAS COUNTY RE 1
JEFFERSON COUNTY R-1
BOULDER VALLEY RE 2
CLEAR CREEK RE-1
PLATTE CANYON 1
BRIGHTON 27J
ELIZABETH C-1
CHERRY CREEK 5
ADAMS-ARAPAHOE 28J
GILPIN COUNTY RE-1
DENVER COUNTY 1
NORTHGLENN-THORNTON 12
ADAMS COUNTY 14
LITTLETON 6
WESTMINSTER 50MAPLETON 1
ENGLEWOOD 1SHERIDAN 2
Metro
CU Denver
CU Boulder
DU
Rocky
Jones
Regis
Phoenix
Colorado Christian
Private Four Year
Public Four Year
Metro Region
Figure 2: Metro Region
26
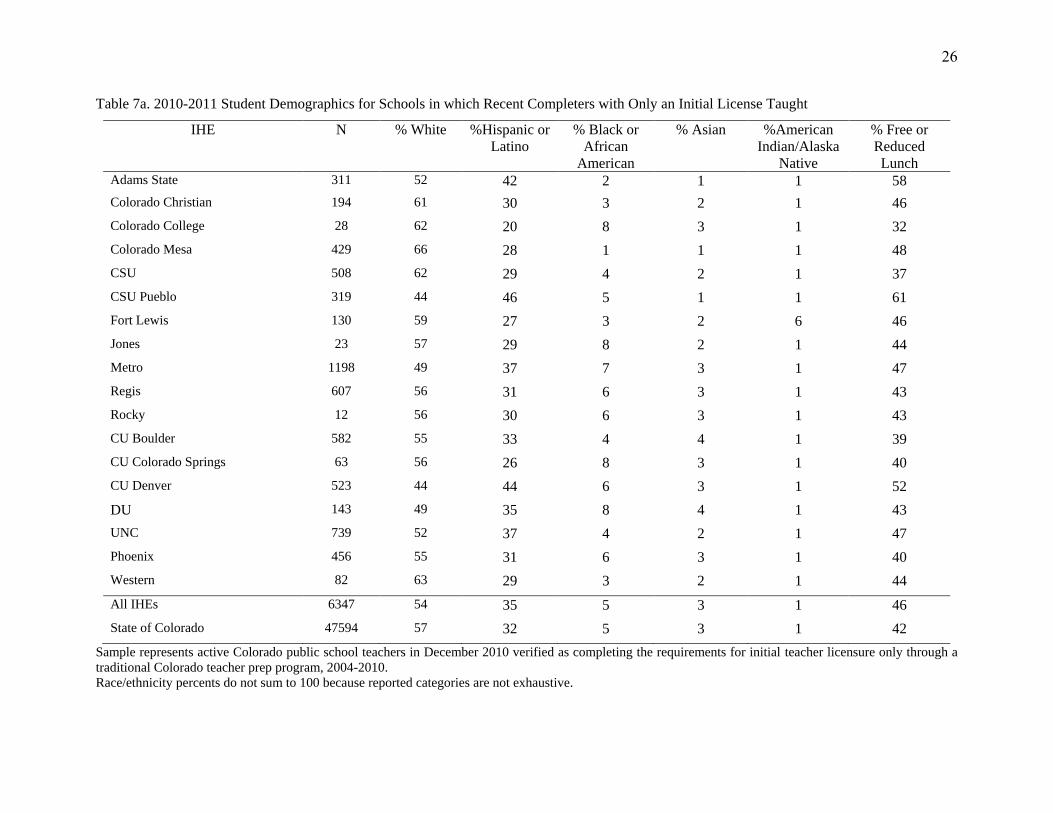
Table 7a. 2010-2011 Student Demographics for Schools in which Recent Completers with Only an Initial License Taught
IHE N % White %Hispanic or
Latino
% Black or
African
American
% Asian %American
Indian/Alaska
Native
% Free or
Reduced
Lunch Adams State 311 52 42 2 1 1 58
Colorado Christian 194 61 30 3 2 1 46
Colorado College 28 62 20 8 3 1 32
Colorado Mesa 429 66 28 1 1 1 48
CSU 508 62 29 4 2 1 37
CSU Pueblo 319 44 46 5 1 1 61
Fort Lewis 130 59 27 3 2 6 46
Jones 23 57 29 8 2 1 44
Metro 1198 49 37 7 3 1 47
Regis 607 56 31 6 3 1 43
Rocky 12 56 30 6 3 1 43
CU Boulder 582 55 33 4 4 1 39
CU Colorado Springs 63 56 26 8 3 1 40
CU Denver 523 44 44 6 3 1 52
DU 143 49 35 8 4 1 43
UNC 739 52 37 4 2 1 47
Phoenix 456 55 31 6 3 1 40
Western 82 63 29 3 2 1 44
All IHEs 6347 54 35 5 3 1 46
State of Colorado 47594 57 32 5 3 1 42
Sample represents active Colorado public school teachers in December 2010 verified as completing the requirements for initial teacher licensure only through a
traditional Colorado teacher prep program, 2004-2010.
Race/ethnicity percents do not sum to 100 because reported categories are not exhaustive.
27
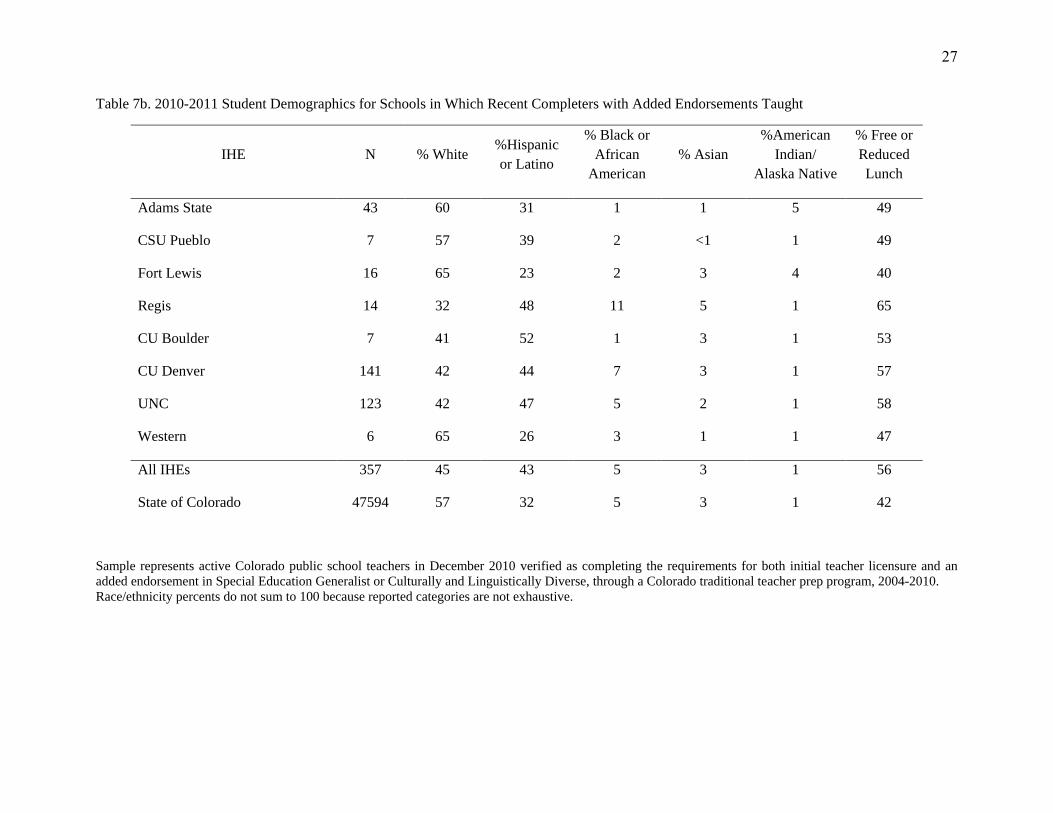
Table 7b. 2010-2011 Student Demographics for Schools in Which Recent Completers with Added Endorsements Taught
Sample represents active Colorado public school teachers in December 2010 verified as completing the requirements for both initial teacher licensure and an
added endorsement in Special Education Generalist or Culturally and Linguistically Diverse, through a Colorado traditional teacher prep program, 2004-2010.
Race/ethnicity percents do not sum to 100 because reported categories are not exhaustive.
IHE N % White %Hispanic
or Latino
% Black or
African
American
% Asian
%American
Indian/
Alaska Native
% Free or
Reduced
Lunch
Adams State 43 60 31 1 1 5 49
CSU Pueblo 7 57 39 2 <1 1 49
Fort Lewis 16 65 23 2 3 4 40
Regis 14 32 48 11 5 1 65
CU Boulder 7 41 52 1 3 1 53
CU Denver 141 42 44 7 3 1 57
UNC 123 42 47 5 2 1 58
Western 6 65 26 3 1 1 47
All IHEs 357 45 43 5 3 1 56
State of Colorado 47594 57 32 5 3 1 42
28
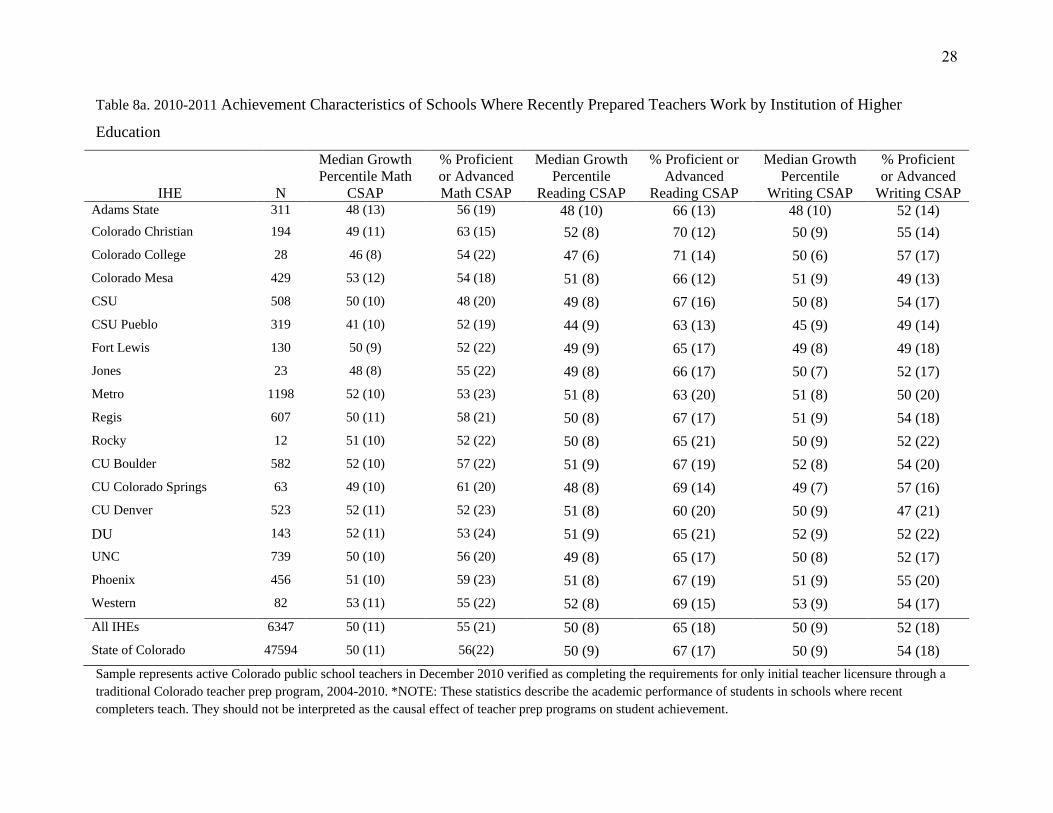
Table 8a. 2010-2011 Achievement Characteristics of Schools Where Recently Prepared Teachers Work by Institution of Higher
Education
IHE
N
Median Growth
Percentile Math
CSAP
% Proficient
or Advanced
Math CSAP
Median Growth
Percentile
Reading CSAP
% Proficient or
Advanced
Reading CSAP
Median Growth
Percentile
Writing CSAP
% Proficient
or Advanced
Writing CSAP Adams State 311 48 (13) 56 (19) 48 (10) 66 (13) 48 (10) 52 (14)
Colorado Christian 194 49 (11) 63 (15) 52 (8) 70 (12) 50 (9) 55 (14)
Colorado College 28 46 (8) 54 (22) 47 (6) 71 (14) 50 (6) 57 (17)
Colorado Mesa 429 53 (12) 54 (18) 51 (8) 66 (12) 51 (9) 49 (13)
CSU 508 50 (10) 48 (20) 49 (8) 67 (16) 50 (8) 54 (17)
CSU Pueblo 319 41 (10) 52 (19) 44 (9) 63 (13) 45 (9) 49 (14)
Fort Lewis 130 50 (9) 52 (22) 49 (9) 65 (17) 49 (8) 49 (18)
Jones 23 48 (8) 55 (22) 49 (8) 66 (17) 50 (7) 52 (17)
Metro 1198 52 (10) 53 (23) 51 (8) 63 (20) 51 (8) 50 (20)
Regis 607 50 (11) 58 (21) 50 (8) 67 (17) 51 (9) 54 (18)
Rocky 12 51 (10) 52 (22) 50 (8) 65 (21) 50 (9) 52 (22)
CU Boulder 582 52 (10) 57 (22) 51 (9) 67 (19) 52 (8) 54 (20)
CU Colorado Springs 63 49 (10) 61 (20) 48 (8) 69 (14) 49 (7) 57 (16)
CU Denver 523 52 (11) 52 (23) 51 (8) 60 (20) 50 (9) 47 (21)
DU 143 52 (11) 53 (24) 51 (9) 65 (21) 52 (9) 52 (22)
UNC 739 50 (10) 56 (20) 49 (8) 65 (17) 50 (8) 52 (17)
Phoenix 456 51 (10) 59 (23) 51 (8) 67 (19) 51 (9) 55 (20)
Western 82 53 (11) 55 (22) 52 (8) 69 (15) 53 (9) 54 (17)
All IHEs 6347 50 (11) 55 (21) 50 (8) 65 (18) 50 (9) 52 (18)
State of Colorado 47594 50 (11) 56(22) 50 (9) 67 (17) 50 (9) 54 (18)
Sample represents active Colorado public school teachers in December 2010 verified as completing the requirements for only initial teacher licensure through a
traditional Colorado teacher prep program, 2004-2010. *NOTE: These statistics describe the academic performance of students in schools where recent
completers teach. They should not be interpreted as the causal effect of teacher prep programs on student achievement.
29
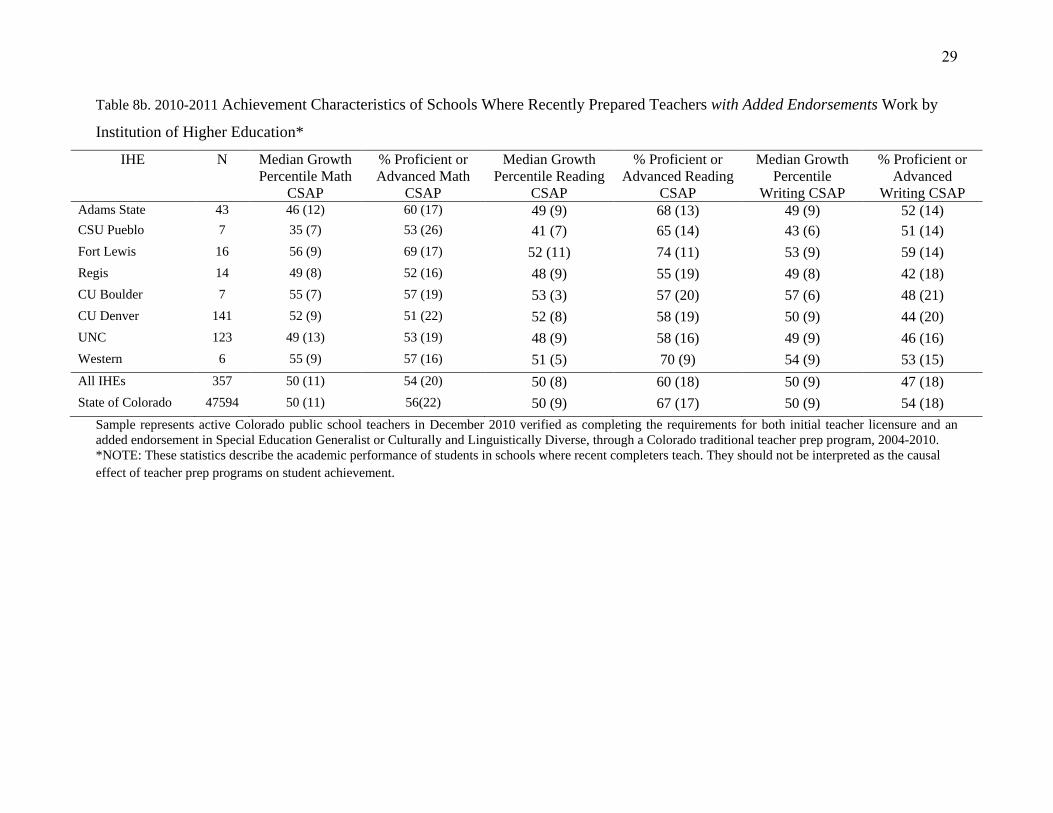
Table 8b. 2010-2011 Achievement Characteristics of Schools Where Recently Prepared Teachers with Added Endorsements Work by
Institution of Higher Education*
IHE N Median Growth
Percentile Math
CSAP
% Proficient or
Advanced Math
CSAP
Median Growth
Percentile Reading
CSAP
% Proficient or
Advanced Reading
CSAP
Median Growth
Percentile
Writing CSAP
% Proficient or
Advanced
Writing CSAP Adams State 43 46 (12) 60 (17) 49 (9) 68 (13) 49 (9) 52 (14)
CSU Pueblo 7 35 (7) 53 (26) 41 (7) 65 (14) 43 (6) 51 (14)
Fort Lewis 16 56 (9) 69 (17) 52 (11) 74 (11) 53 (9) 59 (14)
Regis 14 49 (8) 52 (16) 48 (9) 55 (19) 49 (8) 42 (18)
CU Boulder 7 55 (7) 57 (19) 53 (3) 57 (20) 57 (6) 48 (21)
CU Denver 141 52 (9) 51 (22) 52 (8) 58 (19) 50 (9) 44 (20)
UNC 123 49 (13) 53 (19) 48 (9) 58 (16) 49 (9) 46 (16)
Western 6 55 (9) 57 (16) 51 (5) 70 (9) 54 (9) 53 (15)
All IHEs 357 50 (11) 54 (20) 50 (8) 60 (18) 50 (9) 47 (18)
State of Colorado 47594 50 (11) 56(22) 50 (9) 67 (17) 50 (9) 54 (18)
Sample represents active Colorado public school teachers in December 2010 verified as completing the requirements for both initial teacher licensure and an
added endorsement in Special Education Generalist or Culturally and Linguistically Diverse, through a Colorado traditional teacher prep program, 2004-2010.
*NOTE: These statistics describe the academic performance of students in schools where recent completers teach. They should not be interpreted as the causal
effect of teacher prep programs on student achievement.
30
Demographic and Achievement Characteristics of Schools Where Recently Prepared
Teachers Work
The two panels in Table 7 provide student demographic characteristics for the schools
where teachers from various IHEs work. Differences in the demographics of the K-12 students
served by recent completers of Colorado IHEs mirror differences in the demographics of the
teachers trained by those IHEs. For example, the western slope IHEs of Colorado Mesa, Fort
Lewis, and Western prepare more white teachers than average who are then placed in
predominantly white schools. Similarly, Adams State and CSU Pueblo prepare the most Hispanic
teachers and staff schools with more Hispanic students than the average. Adams State and CSU
Pueblo, along with CU Denver, place teachers in schools where the majority of students are
eligible for free or reduced-price lunch (FRL), a measure of socio-economic status. Completers
with added endorsements in CLD or SPED tend to be placed in schools that are more heavily
Hispanic and low income as evidenced by the increase in the All IHE averages in these
categories in Table 7a and 7b (from 35 to 43% for Hispanic and 46 to 56% for FRL).
The uneven distribution of completers from Colorado IHEs by school demographic
characteristics is also evident in the school-level achievement data in Table 8, which includes
median student growth percentiles and the percentage of students classified as proficient or
advanced on the basis of their test performances in math, reading, and writing. Table 8a contains
average student proficiency levels and median student growth percentiles at Colorado public
schools employing recent completers. Status based achievement statistics such as the percent of
students classified as proficient or advanced will be strongly associated with a school’s
demographic characteristics; median student growth percentiles also have some association with
demographic characteristics, but the association tends to be much weaker because growth
statistics take into account each student’s prior test score history. For example, Colorado College
places their completers in schools with substantially white student populations with low rates of
FRL eligibility. Not surprisingly, students in these schools have above-average percent proficient
or advanced classifications based on their test performance. However, the median student growth
percentiles are quite close to the state average (50). In contrast, CSU Pueblo sends teachers to
schools with the largest Hispanic population and highest FRL rates; the students at these schools
have below average percent proficient or advanced classifications in math, reading, and writing.
31
Of greater concern, in Pueblo City 60, where the largest number of CSU Pueblo completers are
placed, the median student growth percentiles are lower than the state average. Interestingly, CU
Denver also tends to place completers in schools with below average percentages of students
classified as proficient or advanced on the basis of test performance, but these schools tend to
have median student growth percentiles close to the state average.
As mentioned above, recent completers with CLD or SPED added endorsements
generally find themselves in higher-need schools, but the achievement characteristics of these
schools vary widely. For example, completers with added endorsements from Adams State, CSU
Pueblo, and Fort Lewis, on average, find themselves in schools with higher proficiency levels
than completers from the same IHE with only an initial endorsement. Completers with added
endorsements from Regis, CU Boulder, and UNC found themselves, on average, in high need
schools with lower than average achievement characteristics.
Metro Region IHEs
As previously discussed, completers from Metro Region IHEs typically teach in the
Metro Region, so the demographic and achievement characteristics of students taught by
completers from Metro Region IHEs can be discussed together. Using a weighted average based
on the number of completers from each Metro Region IHE, schools in which completers work
contain about half (49%) minority students with a range of 37 to 58%. Hispanic students make
up the largest minority group for each IHE. These schools contain just over 1/3 (36%) Hispanic
students, with a range of 29 to 45%. Slightly under half (45%) of the students in completers’
schools are FRL eligible, with a range of 39 to 53%.
Turning to performance on Colorado large-scale assessments, completers from Metro
Region IHEs teach in schools where, on average, students perform at about the state average in
math and slightly below the state average in reading and writing. In math, students in these
completers’ schools are at the state average with respect to proficient or advanced classifications
(56%). This ranges from 47 to 63%, with most IHEs falling within 3 percentage points of the
mean. In reading, on average about 2/3 (65%) of students were classified as proficient or
advanced, which is two percentage points lower than the state. The averages for each individual
IHE range from 58 to 72%, with most falling within two percentage points of the mean. In
writing, about half (51%) of students were classified as proficient or advanced, which is three
32
percentage points lower than the state. The averages for each individual IHE range from 46 to
59%, again, with most IHEs falling within a few percentage points of the mean.
IHEs Outside the Metro Region
As discussed above, IHEs outside the Metro Region produce teachers who work
throughout Colorado. The average demographic and achievement characteristics of the students
these teachers teach are virtually the same as the average characteristics described for completers
from Metro Region IHEs. IHEs outside the Metro Region produce teachers who teach in schools
with 44% minority students (where Hispanic comprise the largest subgroup with 35%) and 48%
poor students. These schools are slightly below the state percentages in terms of math
achievement (53%), reading achievement (65%), and writing achievement (51%).
Summary
In general, teachers in Colorado public schools who were prepared at Colorado IHEs are
predominantly White, non-Hispanic females who complete their initial teacher preparation
around age 30, and their current average base salary was approximately $35,000. Schools that
provide the bulk of initial licenses at the undergraduate level have relatively low average age at
time of licensure eligibility, while schools that provide the bulk of initial licenses at the graduate
level have higher average age. The average age of added license completers is identical to that of
the larger group of initial license completers. Those with added endorsements enjoy a relatively
higher average salary reflecting the perpetual shortage of SPED- and CLD-endorsed teachers and
the fact that a number of SPED and CLD preparation programs are embedded within master’s
degree programs.
Placement patterns for many IHEs reveal that completers teach in a concentrated set of
school districts, though this is not true for all IHEs. In fact, half of Colorado’s IHEs supply over
2/3 of their new teachers to a concentrated set of five districts (though not the same districts for
each IHE). Viewing placements through the lens of Colorado’s eight regions explains dispersion
patterns for most IHEs. IHEs in the Metro Region produce teachers who work most commonly in
the Metro Region and IHEs in rural areas of the state most commonly supply teachers to the
numerous small districts in and near the outlying region in which the IHE is located. However,
33
the rural IHEs also produce teachers working in the Metro Region, presumably an effect of the
more active job market there. Overall, most initial licensure completers teach in the region in
which they were prepared, but in some cases are dispersed among a large number of very small
districts in that region. In rural areas of the state this heavily influences the demographic
characteristics and achievement levels of the students they teach. In the Metro Region,
completers have more latitude for choice, though job market constraints exist.
Recommendations
The data and analytic strategies presented in this report hold potential for informing
program improvement at Colorado IHE-based teacher preparation programs. Completer
demographic characteristics and placement patterns have potential implications for course
curriculum and program design, recruitment, and achieving an IHE’s institutional mission. Close
examination of institutional dispersion patterns has implications for how programs organize their
curriculum. For example, the curriculum and achievement benchmarks in the districts where the
IHE’s completers are most likely to teach can be useful preparation materials in pre-service
programs. Also, the high-placement districts’ teacher evaluation tools should play an important
role in the IHE’s preparation program as districts implement Colorado’s new educator
effectiveness system under SB 10-191. Institutional placement patterns that indicate completers
teach near their preparation program and near their home towns also suggest that IHEs recruit
teacher candidates from high-need areas near the IHE, anticipating that they return to those
communities to teach.
Given that newly prepared teachers have a choice in where they apply to work, IHEs may
be interested in analyzing whether program completers choose schools where student
demographics are aligned with the prep program’s stated mission and goals. For example, CU
Denver has an explicit mission related to social justice in teacher candidate preparation. For CU
Denver, then, the choices that completers make about which populations to work with are
extremely important to whether or not the IHE is fulfilling its mission. Analyzing the
relationships between IHE mission and placement is beyond the scope of the current report but it
is important to point out that the available data could be meaningfully applied by each IHE as
evidence related to their missions.
34
This report also has implications for those interested in outcomes-based evaluations of
teacher preparation programs. From an evaluation design perspective, the ideal setting for
evaluating the efficacy of a state’s teacher preparation programs would be for teacher candidates
to be randomly assigned to programs and, upon completion of training, randomly assigned to the
schools where they work. As elsewhere in the country, Colorado is far from that ideal evaluation
setting and has a strong regional relationship between where teacher candidates are prepared and
where they eventually work (Boyd, Lankford, Loeb, and Wyckoff, 2005; Reininger, 2012). This
leads some preparation programs to operate in a relatively closed system where candidates enter
the IHE from the nearby community and return to that community to work in local schools.
Given the need for strong teachers in all schools, particularly struggling schools, it is
critical that any outcomes-based evaluation of teacher preparation programs avoid penalizing a
program for sending students into challenging settings. Student achievement characteristics of
schools employing recent completers are strongly influenced by prior achievement, but newly-
hired completers cannot affect prior achievement; they can only affect subsequent student
growth. Moreover, the extent to which new teachers can influence growth can be constrained by
contextual factors in the district, including the extent of teacher autonomy in making content
delivery decisions and the quality of building leadership. It is also critically important that any
teacher preparation program evaluation take into account contextual factors that prevail among
the primary districts where an IHE’s completers are placed. Teasing out the impact of a
preparation program on a teacher’s efficacy becomes extremely difficult in complex school
settings, and any methodology employed to evaluate teacher preparation programs based on
outcomes should take these contextual factors into account.
35
References
Boyd, D., Lankford, H., Loeb, S., & Wyckoff, J. 2005. The draw of home: How teachers’
preferences for proximity disadvantage urban schools. Journal of Policy Analysis and
Management, 24 (1), 113-32.
Paone, J.J., Whitcomb, J.A., Rose, T., & Reichardt, R. 2008. Shining the Light II: State of
Teacher Quality, Attrition and Diversity in Colorado. Denver CO: Alliance for Quality
Teaching.
Reichardt, R., Paone, J.J., & Badolato, V. 2006. Shining the Light: The State of Teaching in
Colorado. Denver CO: Alliance for Quality Teaching.
Reininger, M. 2012. Hometown disadvantage? It depends on where you’re from: Teachers’
location preferences and the implications for staffing schools. Educational Evaluation &
Policy Analysis, 34(2), 127-145.