Embed Size (px)
Citation preview
An Initial Evaluation of the NAEDI Regional Awareness Pilots
NB. SLIDES CONTAIN UNVALIDATED DATA NOT YET IN PUBLIC DOMAIN SO MUST NOT BE QUOTED OR PUBLISHED ELSEWHERE
Intr
od
uct
ion
Background (1): Late diagnosis is a major problem
• 10,000 deaths could be avoided each year in England if our cancer survival rates matched those in the best countries (e.g. Australia, Canada and Sweden)
• Bowel cancer accounts for 1700 of these avoidable deaths
• Late diagnosis is thought to be the single most important factor underlying poor survival
• The Government has set a goal that an additional 5000 lives p.a. should be saved by 2014/15. This would bring survival in England up to the average for Europe
NB. SLIDES CONTAIN UNVALIDATED DATA NOT YET IN PUBLIC DOMAIN SO MUST NOT BE QUOTED OR PUBLISHED ELSEWHERE
Be
Cle
ar o
n C
ance
r E
valu
atio
n
Background (2): Bowel cancer
• 5 year survival in England around 50%, compared with over 60% elsewhere
• Major opportunities for improving outcomes – prevention, screening, earlier diagnosis of symptomatic cases, better treatment
• But .... low public awareness and late diagnosis (25% present as emergencies)
• Hence ... Regional awareness pilots run in 2 Regions (EoE and SW) over 7 weeks in late January – March 2011
• Emphasis on 2 key symptoms: loose poo and blood in poo continuing for 3 weeks or more
NB. SLIDES CONTAIN UNVALIDATED DATA NOT YET IN PUBLIC DOMAIN SO MUST NOT BE QUOTED OR PUBLISHED ELSEWHERE
Def
inin
g a
n A
rea
for
An
alys
is
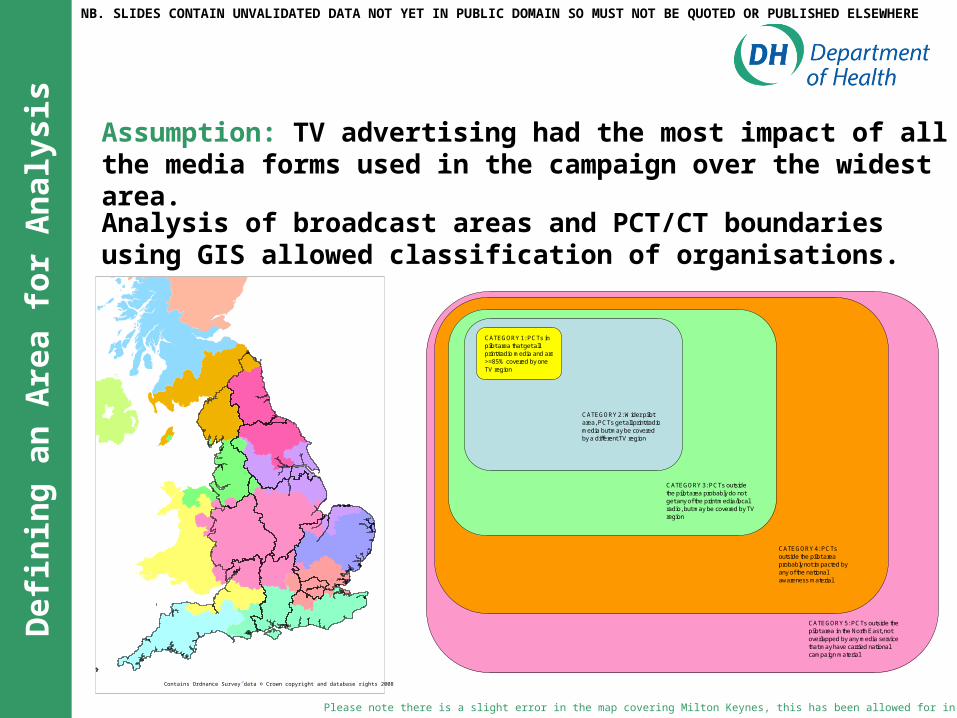
Assumption: TV advertising had the most impact of all the media forms used in the campaign over the widest area.
Analysis of broadcast areas and PCT/CT boundaries using GIS allowed classification of organisations.
CATEGORY 1: PCTs in pilot area that get all print/radio media and are >=85% covered by one TV region
CATEGORY 2: Wider pilot area, PCTs get all print/radio media but may be covered by a different TV region
CATEGORY 3: PCTs outside the pilot area probably do not get any of the print media/local radio, but may be covered by TV region
CATEGORY 4: PCTs outside the pilot area probably not impacted by any of the national awareness material
CATEGORY 5: PCTs outside the pilot area in the North East, not overlapped by any media service that may have carried national campaign material
Please note there is a slight error in the map covering Milton Keynes, this has been allowed for in all analysis
Contains Ordnance Survey data © Crown copyright and database rights 2008
NB. SLIDES CONTAIN UNVALIDATED DATA NOT YET IN PUBLIC DOMAIN SO MUST NOT BE QUOTED OR PUBLISHED ELSEWHERE
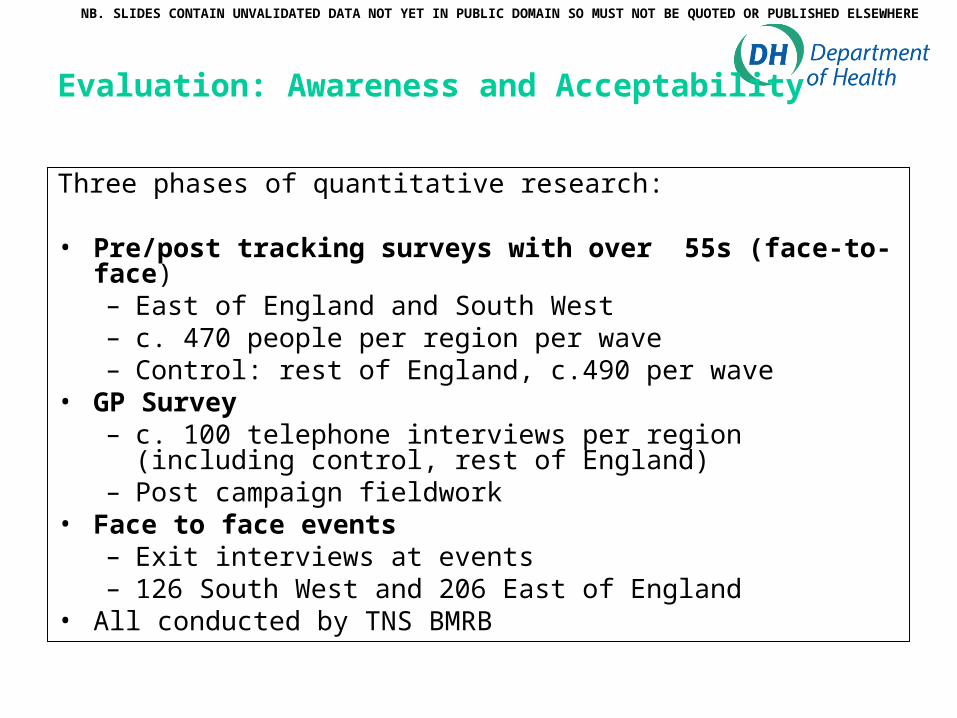
Evaluation: Awareness and Acceptability
Three phases of quantitative research:
• Pre/post tracking surveys with over 55s (face-to-face)– East of England and South West– c. 470 people per region per wave– Control: rest of England, c.490 per wave
• GP Survey– c. 100 telephone interviews per region (including control, rest of
England)– Post campaign fieldwork
• Face to face events– Exit interviews at events– 126 South West and 206 East of England
• All conducted by TNS BMRB
NB. SLIDES CONTAIN UNVALIDATED DATA NOT YET IN PUBLIC DOMAIN SO MUST NOT BE QUOTED OR PUBLISHED ELSEWHERE
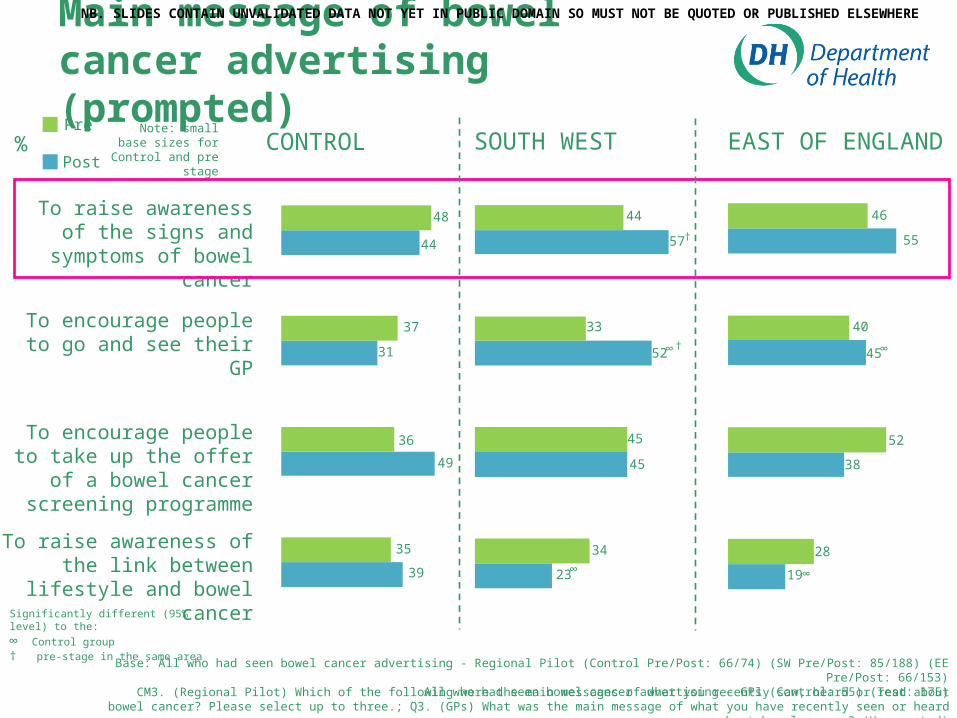
Base: All who had seen bowel cancer advertising - Regional Pilot (Control Pre/Post: 66/74) (SW Pre/Post: 85/188) (EE Pre/Post: 66/153)All who had seen bowel cancer advertising – GPs (Control: 55) (Test: 175)
To raise awareness of the link between lifestyle and
bowel cancer
To raise awareness of the signs and
symptoms of bowel cancer
To encourage people to take up the offer of a
bowel cancer screening programme
To encourage people to go and see their GP
CM3. (Regional Pilot) Which of the following were the main messages of what you recently saw, heard or read about bowel cancer? Please select up to three.; Q3. (GPs) What was the main message of what you have recently seen or heard about bowel cancer? (Unprompted)
Note: small base sizes for Control and
pre stageCONTROL SOUTH WEST EAST OF ENGLAND%
Pre
Post
Main message of bowel cancer advertising (prompted)
Significantly different (95% level) to the:
∞ Control group† pre-stage in the same area
48
44
37
31
36
49
35
39
52
33
57
44
45
45
34
23
46
40
45
52
38
28
19
55
∞
∞
∞
∞†
†
NB. SLIDES CONTAIN UNVALIDATED DATA NOT YET IN PUBLIC DOMAIN SO MUST NOT BE QUOTED OR PUBLISHED ELSEWHERE
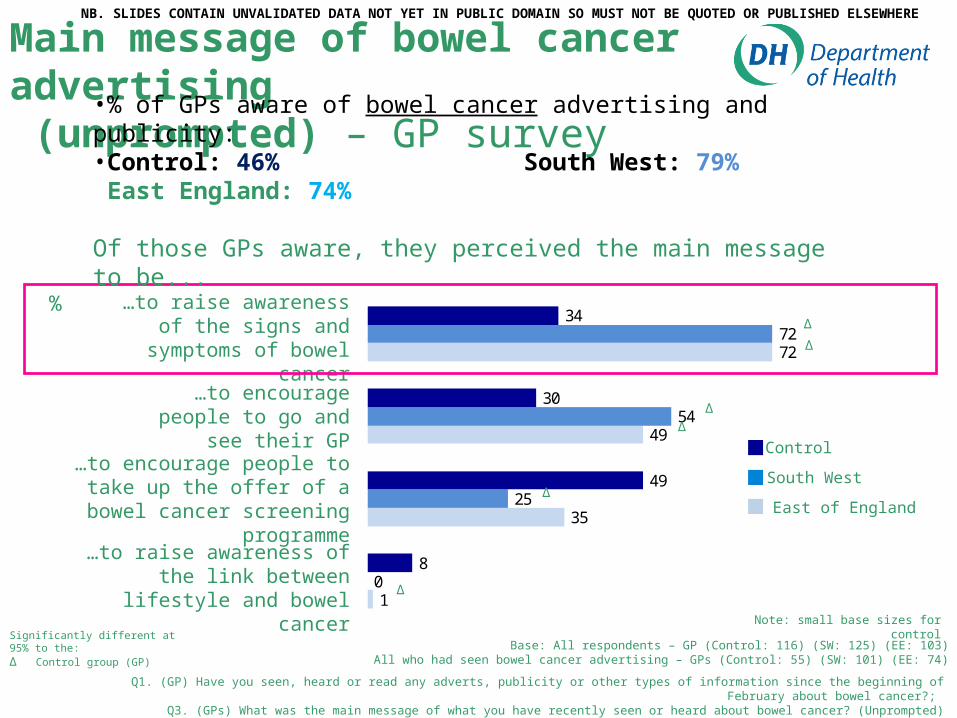
Base: All respondents – GP (Control: 116) (SW: 125) (EE: 103)All who had seen bowel cancer advertising – GPs (Control: 55) (SW: 101) (EE: 74)
…to raise awareness of the link between lifestyle
and bowel cancer
…to raise awareness of the signs and
symptoms of bowel cancer
…to encourage people to take up the offer of a bowel
cancer screening programme
…to encourage people to go and see their GP
Q1. (GP) Have you seen, heard or read any adverts, publicity or other types of information since the beginning of February about bowel cancer?; Q3. (GPs) What was the main message of what you have recently seen or heard about bowel cancer? (Unprompted)
Note: small base sizes for control
Main message of bowel cancer advertising (unprompted) – GP survey
•% of GPs aware of bowel cancer advertising and publicity:•Control: 46% South West: 79% East England: 74%
Of those GPs aware, they perceived the main message to be...
1
35
49
72
0
25
54
72
8
49
30
34 ∆
∆
∆∆
∆
∆
Control
South West
East of England
%
Significantly different at 95% to the:∆ Control group (GP)
NB. SLIDES CONTAIN UNVALIDATED DATA NOT YET IN PUBLIC DOMAIN SO MUST NOT BE QUOTED OR PUBLISHED ELSEWHERE
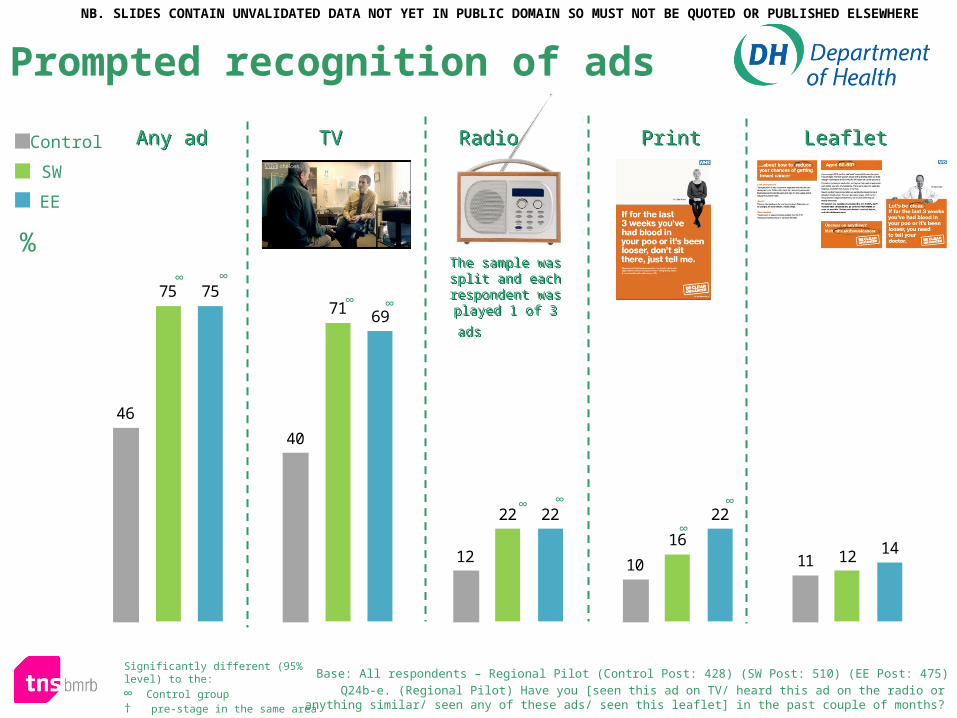
46
40
12 10 11
7571
22
1612
75
69
22 22
14
%
TVTV RadioRadio LeafletLeafletPrintPrintAny adAny ad
Q24b-e. (Regional Pilot) Have you [seen this ad on TV/ heard this ad on the radio or anything similar/ seen any of these ads/ seen this leaflet] in the past couple of months?
Base: All respondents – Regional Pilot (Control Post: 428) (SW Post: 510) (EE Post: 475)
∞ ∞
∞ ∞
∞ ∞
∞
∞
The sample was split and each respondent was played 1 of 3 ads
The sample was split and each respondent was played 1 of 3 ads
Control
SW
EE
Prompted recognition of ads
Significantly different (95% level) to the:
∞ Control group† pre-stage in the same area
NB. SLIDES CONTAIN UNVALIDATED DATA NOT YET IN PUBLIC DOMAIN SO MUST NOT BE QUOTED OR PUBLISHED ELSEWHERE
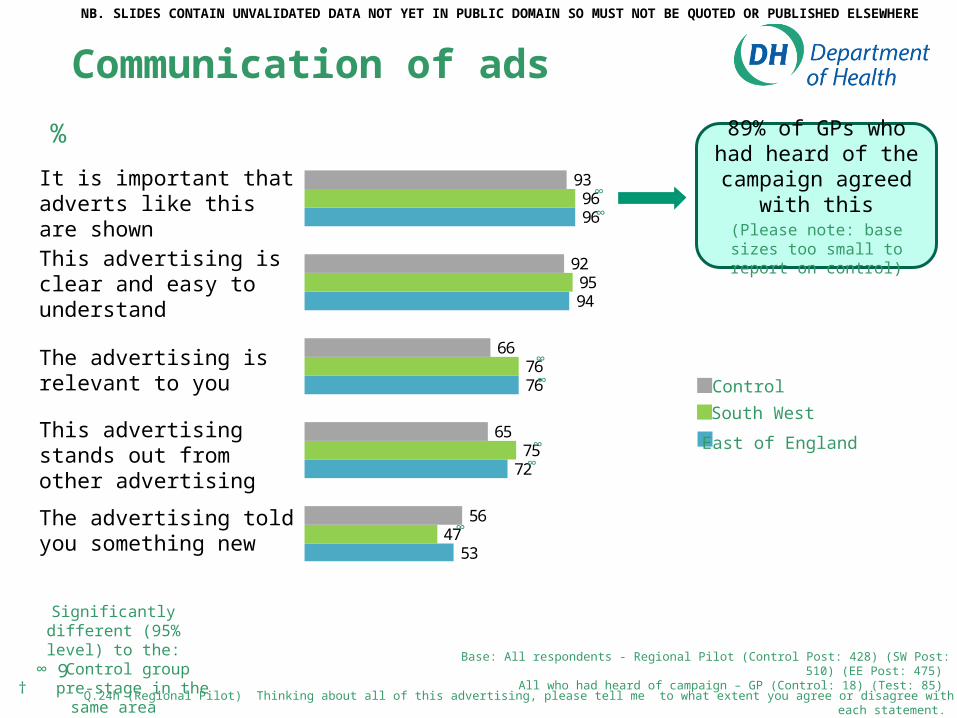
53
72
76
94
96
47
75
76
95
96
56
65
66
92
93
%
Control
South West
East of England
Communication of ads
It is important that adverts like this are shown
This advertising is clear and easy to understand
The advertising is relevant to you
This advertising stands out from other advertising
The advertising told you something new
89% of GPs who had heard of the campaign
agreed with this(Please note: base sizes too small
to report on control)
Q.24h (Regional Pilot) Thinking about all of this advertising, please tell me to what extent you agree or disagree with each statement. Q9 (GP). Thinking back to this advertising, please tell me to what extent you agree or disagree with each statement – It is important that adverts like this are shown.
Base: All respondents - Regional Pilot (Control Post: 428) (SW Post: 510) (EE Post: 475) All who had heard of campaign – GP (Control: 18) (Test: 85)
∞
∞
∞
∞
∞∞
∞
9
Significantly different (95% level) to the:
∞ Control group† pre-stage in the same area
NB. SLIDES CONTAIN UNVALIDATED DATA NOT YET IN PUBLIC DOMAIN SO MUST NOT BE QUOTED OR PUBLISHED ELSEWHERE
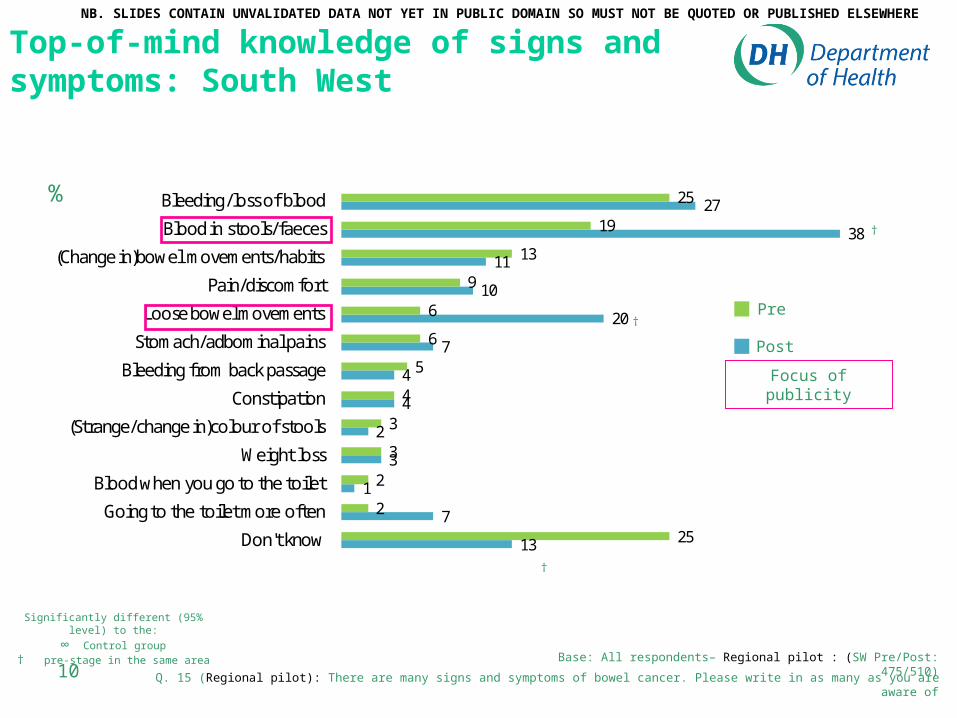
%
13
7
1
3
2
4
4
7
20
10
11
38
27
25
2
2
3
3
4
5
6
6
9
13
19
25
Don't know
Going to the toilet more often
Blood when you go to the toilet
Weight loss
(Strange/change in)colour of stools
Constipation
Bleeding from back passage
Stomach/adbominal pains
Loose bowel movements
Pain/discomfort
(Change in)bowel movements/habits
Blood in stools/faeces
Bleeding/loss of blood
Pre
Post
Base: All respondents– Regional pilot : (SW Pre/Post: 475/510)
†
†
†
Q. 15 (Regional pilot): There are many signs and symptoms of bowel cancer. Please write in as many as you are aware of
Focus of publicity
10
Significantly different (95% level) to the:∞ Control group
† pre-stage in the same area
Top-of-mind knowledge of signs and symptoms: South West
NB. SLIDES CONTAIN UNVALIDATED DATA NOT YET IN PUBLIC DOMAIN SO MUST NOT BE QUOTED OR PUBLISHED ELSEWHERE
Focus of publicity
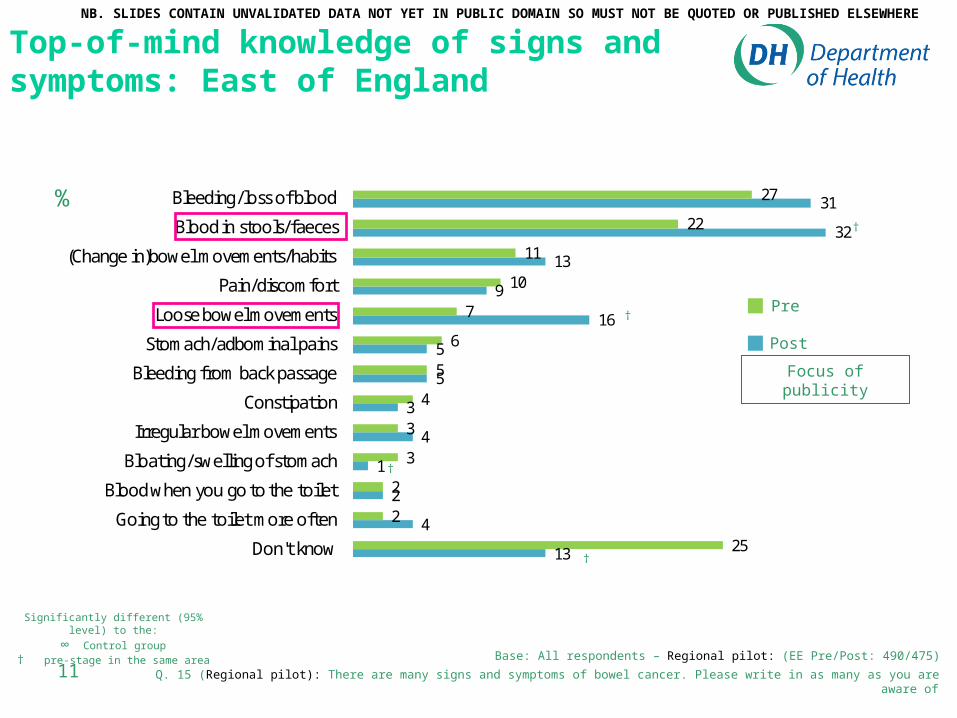
%
13
4
2
1
4
3
5
5
16
9
13
32
31
25
2
2
3
3
4
5
6
7
10
11
22
27
Don't know
Going to the toilet more often
Blood when you go to the toilet
Bloating/swelling of stomach
Irregular bowel movements
Constipation
Bleeding from back passage
Stomach/adbominal pains
Loose bowel movements
Pain/discomfort
(Change in)bowel movements/habits
Blood in stools/faeces
Bleeding/loss of blood
Pre
Post
Base: All respondents – Regional pilot: (EE Pre/Post: 490/475)
†
†
†
†
Q. 15 (Regional pilot): There are many signs and symptoms of bowel cancer. Please write in as many as you are aware of11
Significantly different (95% level) to the:∞ Control group
† pre-stage in the same area
Top-of-mind knowledge of signs and symptoms: East of England
NB. SLIDES CONTAIN UNVALIDATED DATA NOT YET IN PUBLIC DOMAIN SO MUST NOT BE QUOTED OR PUBLISHED ELSEWHERE
Bowel cancer awareness campaign evaluationImpact on patients attending
GP appointments
23rd June 2011
NB. SLIDES CONTAIN UNVALIDATED DATA NOT YET IN PUBLIC DOMAIN SO MUST NOT BE QUOTED OR PUBLISHED ELSEWHERE
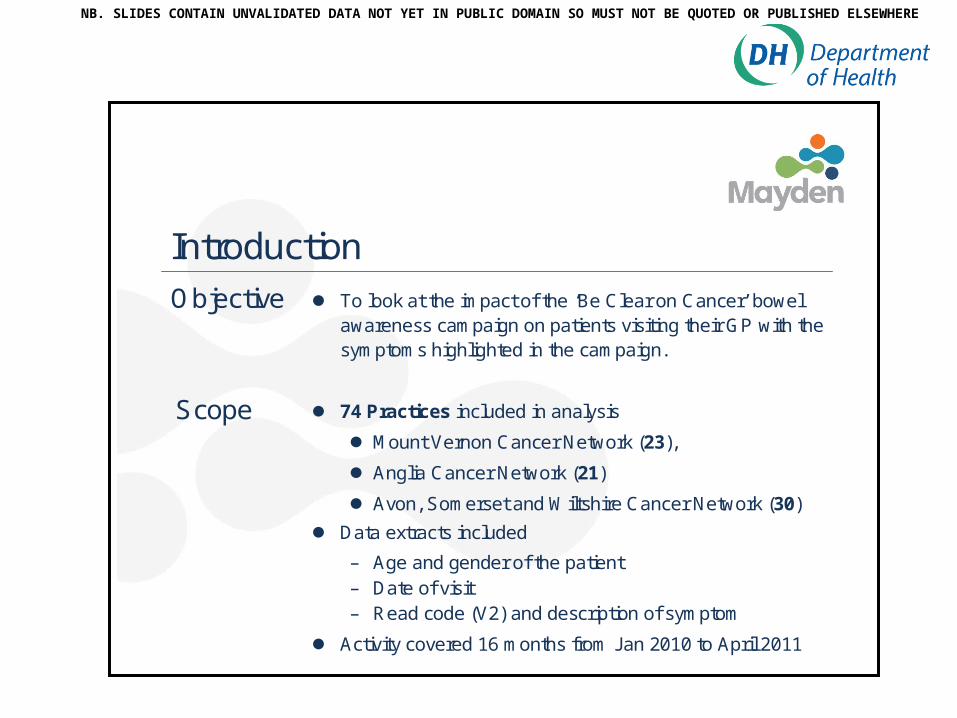
To look at the impact of the ‘Be Clear on Cancer’ bowel awareness campaign on patients visiting their GP with the symptoms highlighted in the campaign.
74 Practices included in analysis
Mount Vernon Cancer Network (23),
Anglia Cancer Network (21)
Avon, Somerset and Wiltshire Cancer Network (30)
Data extracts included
– Age and gender of the patient– Date of visit– Read code (V2) and description of symptom
Activity covered 16 months from Jan 2010 to April 2011
Introduction
Scope
Objective
NB. SLIDES CONTAIN UNVALIDATED DATA NOT YET IN PUBLIC DOMAIN SO MUST NOT BE QUOTED OR PUBLISHED ELSEWHERE
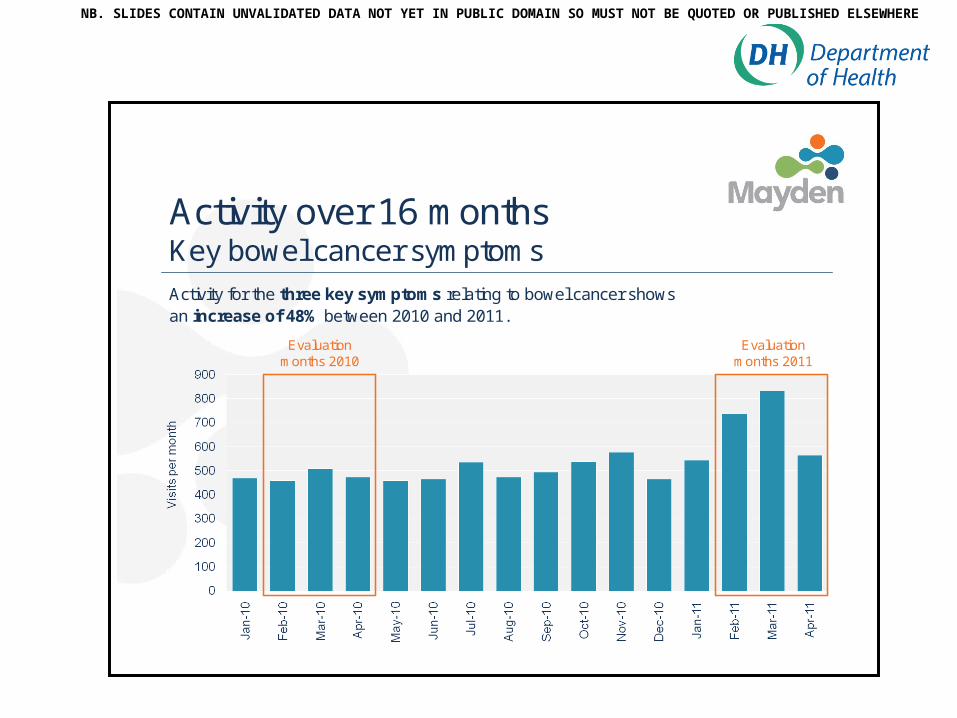
Activity over 16 months Key bowel cancer symptomsActivity for the three key symptoms relating to bowel cancer shows an increase of 48% between 2010 and 2011.
Evaluation months 2010
Evaluation months 2011
NB. SLIDES CONTAIN UNVALIDATED DATA NOT YET IN PUBLIC DOMAIN SO MUST NOT BE QUOTED OR PUBLISHED ELSEWHERE
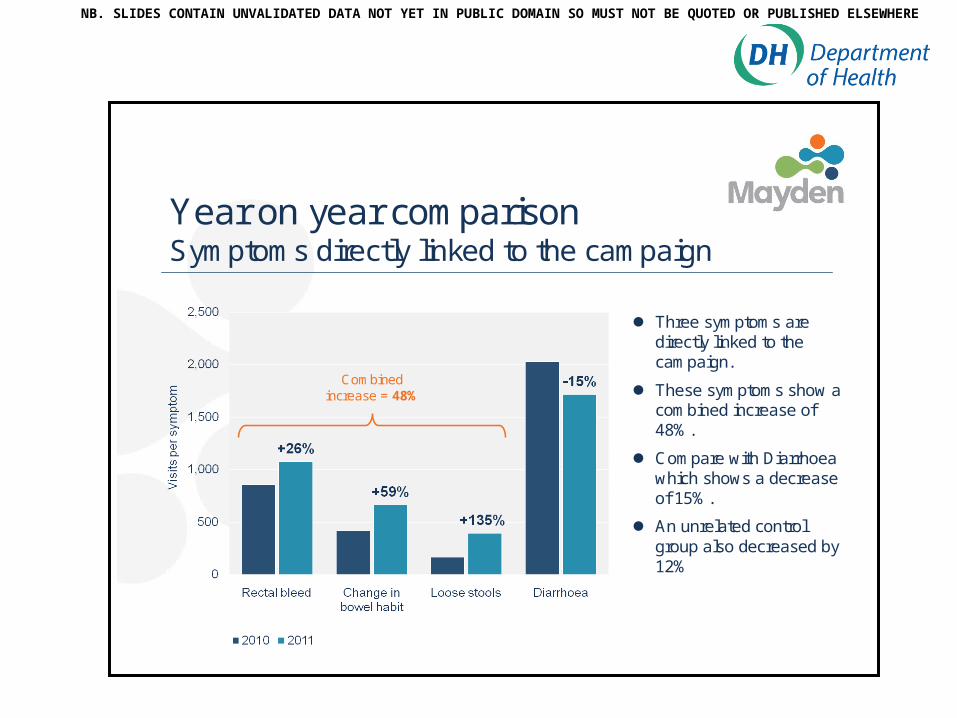
Three symptoms are directly linked to the campaign.
These symptoms show a combined increase of 48%.
Compare with Diarrhoea which shows a decrease of 15%.
An unrelated control group also decreased by 12%
Year on year comparisonSymptoms directly linked to the campaign
Combined increase = 48%
NB. SLIDES CONTAIN UNVALIDATED DATA NOT YET IN PUBLIC DOMAIN SO MUST NOT BE QUOTED OR PUBLISHED ELSEWHERE
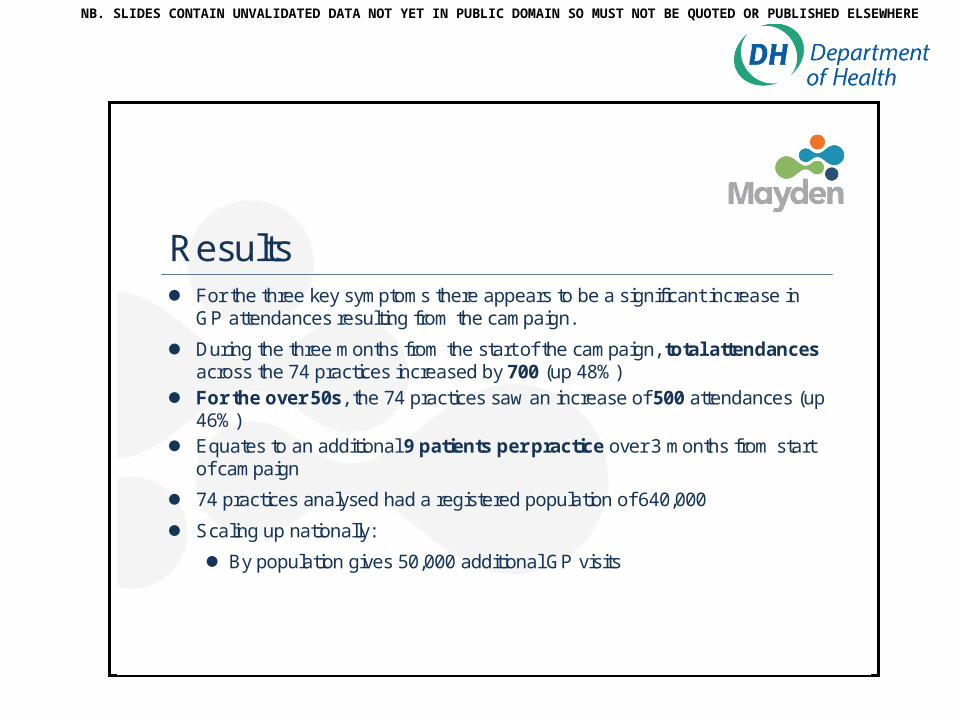
For the three key symptoms there appears to be a significant increase in GP attendances resulting from the campaign.
During the three months from the start of the campaign, total attendances across the 74 practices increased by 700 (up 48%)
For the over 50s, the 74 practices saw an increase of 500 attendances (up 46%)
Equates to an additional 9 patients per practice over 3 months from start of campaign
74 practices analysed had a registered population of 640,000
Scaling up nationally:
By population gives 50,000 additional GP visits
Results
NB. SLIDES CONTAIN UNVALIDATED DATA NOT YET IN PUBLIC DOMAIN SO MUST NOT BE QUOTED OR PUBLISHED ELSEWHERE

Def
inin
g a
n A
rea
for
An
alys
is
Assumption: TV advertising had the most impact of all the media forms used in the campaign over the widest area.
Analysis of broadcast areas and PCT/CT boundaries using GIS allowed classification of organisations.
CATEGORY 1: PCTs in pilot area that get all print/radio media and are >=85% covered by one TV region
CATEGORY 2: Wider pilot area, PCTs get all print/radio media but may be covered by a different TV region
CATEGORY 3: PCTs outside the pilot area probably do not get any of the print media/local radio, but may be covered by TV region
CATEGORY 4: PCTs outside the pilot area probably not impacted by any of the national awareness material
CATEGORY 5: PCTs outside the pilot area in the North East, not overlapped by any media service that may have carried national campaign material
Please note there is a slight error in the map covering Milton Keynes, this has been allowed for in all analysis
Contains Ordnance Survey data © Crown copyright and database rights 2008
NB. SLIDES CONTAIN UNVALIDATED DATA NOT YET IN PUBLIC DOMAIN SO MUST NOT BE QUOTED OR PUBLISHED ELSEWHERE
Cat
ego
ries
Use
d i
n T
hes
e S
lid
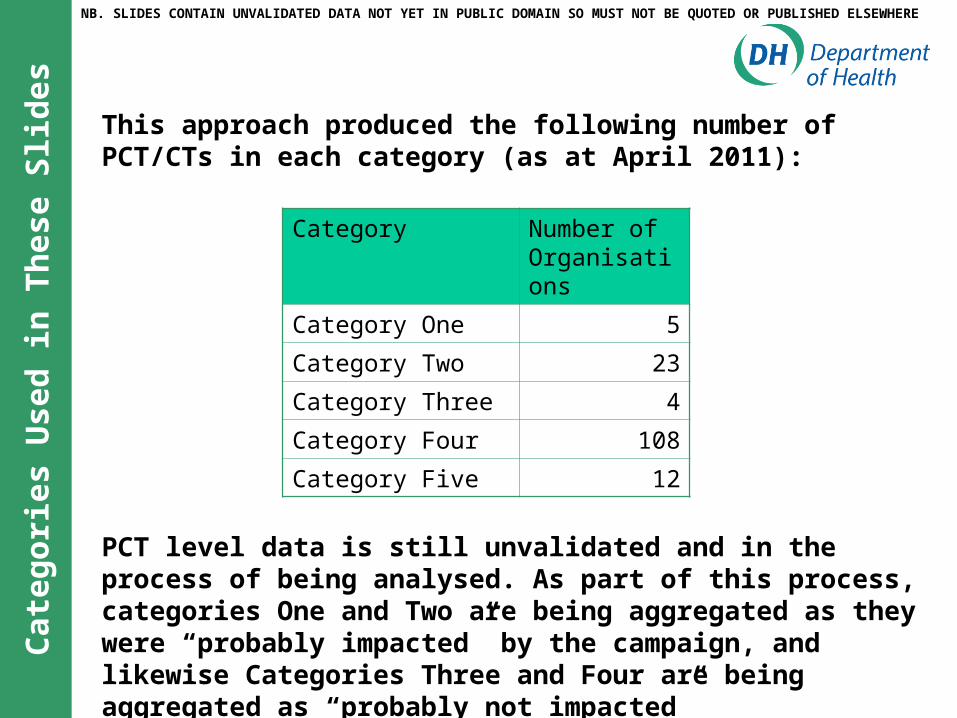
es This approach produced the following number of PCT/CTs in each category (as at April 2011):
Category Number of Organisations
Category One 5
Category Two 23
Category Three 4
Category Four 108
Category Five 12
PCT level data is still unvalidated and in the process of being analysed. As part of this process, categories One and Two are being aggregated as they were “probably impacted” by the campaign, and likewise Categories Three and Four are being aggregated as “probably not impacted”
NB. SLIDES CONTAIN UNVALIDATED DATA NOT YET IN PUBLIC DOMAIN SO MUST NOT BE QUOTED OR PUBLISHED ELSEWHERE
Impact on 2ww lower GI referrals
– Comparing urgent GP referrals for suspected lower GI cancers in Q4 2009/10 and Q4 2010/11 there was a 34.4% increase in the number of patients seen. Although some trusts saw at least a doubling of referrals during the campaign period.
– The data we have so far does not show a change in number of cancers diagnosed or change in stage of diagnosis. We expect to have more complete staging data at the end of September, by which time we would expect that the majority of new patients diagnosed to be reported to the cancer registries.
PLEASE NOTE: No attempt has been made to adjust for any impact from local awareness campaigns within these data, so any changes in activity levels may be due to local pressures rather than the regional pilot campaigns
NB. SLIDES CONTAIN UNVALIDATED DATA NOT YET IN PUBLIC DOMAIN SO MUST NOT BE QUOTED OR PUBLISHED ELSEWHERE
Summary
1. The regional campaigns raised awareness of the signs and symptoms of bowel cancer
2. TV advertising (as expected) had the greatest impact
3. Attendances in primary care with relevant symptoms increased, but numbers were manageable
4. 2ww colorectal referrals appear to have increased markedly during the campaign
NB. SLIDES CONTAIN UNVALIDATED DATA NOT YET IN PUBLIC DOMAIN SO MUST NOT BE QUOTED OR PUBLISHED ELSEWHERE
Summary (2)
5. Colonoscopy rates increased markedly, but these are still being quantified
6. Impact on bowel screening uptake is still being evaluated
7. We do not yet have reliable data on numbers of patients diagnosed or stage at diagnosis
8. The increase in endoscopy will almost certainly have led to polyp detection and hence to cancers being prevented
NB. SLIDES CONTAIN UNVALIDATED DATA NOT YET IN PUBLIC DOMAIN SO MUST NOT BE QUOTED OR PUBLISHED ELSEWHERE